


Abstract
The global ‘Blue Transition’ presents a critical policy dilemma for marine fisheries: how to achieve ecological sustainability and carbon neutrality while maintaining socio-economic vitality. This study addresses this challenge by analyzing the complex interplay between the ecological, social, and economic systems within China’s marine fisheries. Our research purpose is to identify effective governance pathways for a coordinated and sustainable transition. We developed a system dynamics model, informed by panel data from 2010–2022, to simulate the long-term outcomes of different policy scenarios. This approach allows us to move beyond static analysis and understand the dynamic feedback mechanisms that shape the fishery sector. Our analysis of historical data reveals that the overall system coordination improved initially but has since stagnated at a basic level. The most significant outcome of our simulations is the identification of the social system—encompassing technological innovation, governance, and human capital—as the central lever for progress. Our findings demonstrate that policies focused narrowly on either economic growth or ecological restoration are suboptimal. The optimal path to high-quality, sustainable development is an integrated strategy that prioritizes investment in the social system to mediate the conflict between economic and ecological goals. This provides a crucial insight for marine policy, suggesting that effective governance frameworks are the key enablers of a successful Blue Transition.
Keywords:
carbon accounting; carbon neutrality; scenario analysis; ecological governance; resource management; blue economy Key Contribution:
This study constructs a dynamic simulation model for the ecological–social–economic system of marine fisheries. The findings indicate that investment in the social system—including technological innovation, governance, and human capital—is the central lever for reconciling economic–ecological conflicts and supporting a sustainable Blue Transition.
1. Introduction
Marine fisheries are a central component of the blue economy and are closely connected to food security, coastal livelihoods, and climate-related policy in China. Their transition from scale-oriented growth toward lower-emission and ecologically responsible development therefore requires the joint consideration of production, environmental pressure, and governance capacity [1,2,3].
As a key component of the ocean economy, marine fisheries serve as a significant economic pillar. In China, for instance, the total output value of marine fisheries reached $476.45 billion in 2022, contributing substantially to food security and coastal economic development. However, the traditional development model, oriented towards scale expansion, has placed immense pressure on marine ecosystems. This has not only led to the depletion of coastal fishery resources and ecological degradation but has also indirectly weakened the self-regulation and sink-enhancement functions of these ecosystems [4,5,6]. At the same time, capture fisheries have dual carbon-accounting implications. Fishing-vessel fuel use and associated production activities generate carbon emissions; globally, the fishing fleet emitted approximately 200 million tons of CO2 between 1950 and 2016 [7]. Meanwhile, marine organisms involved in fisheries absorb and fix carbon during growth, and harvesting may transfer part of this biological carbon from the water within the adopted accounting boundary [8,9].
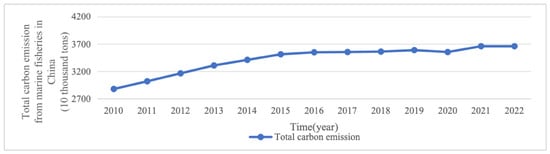
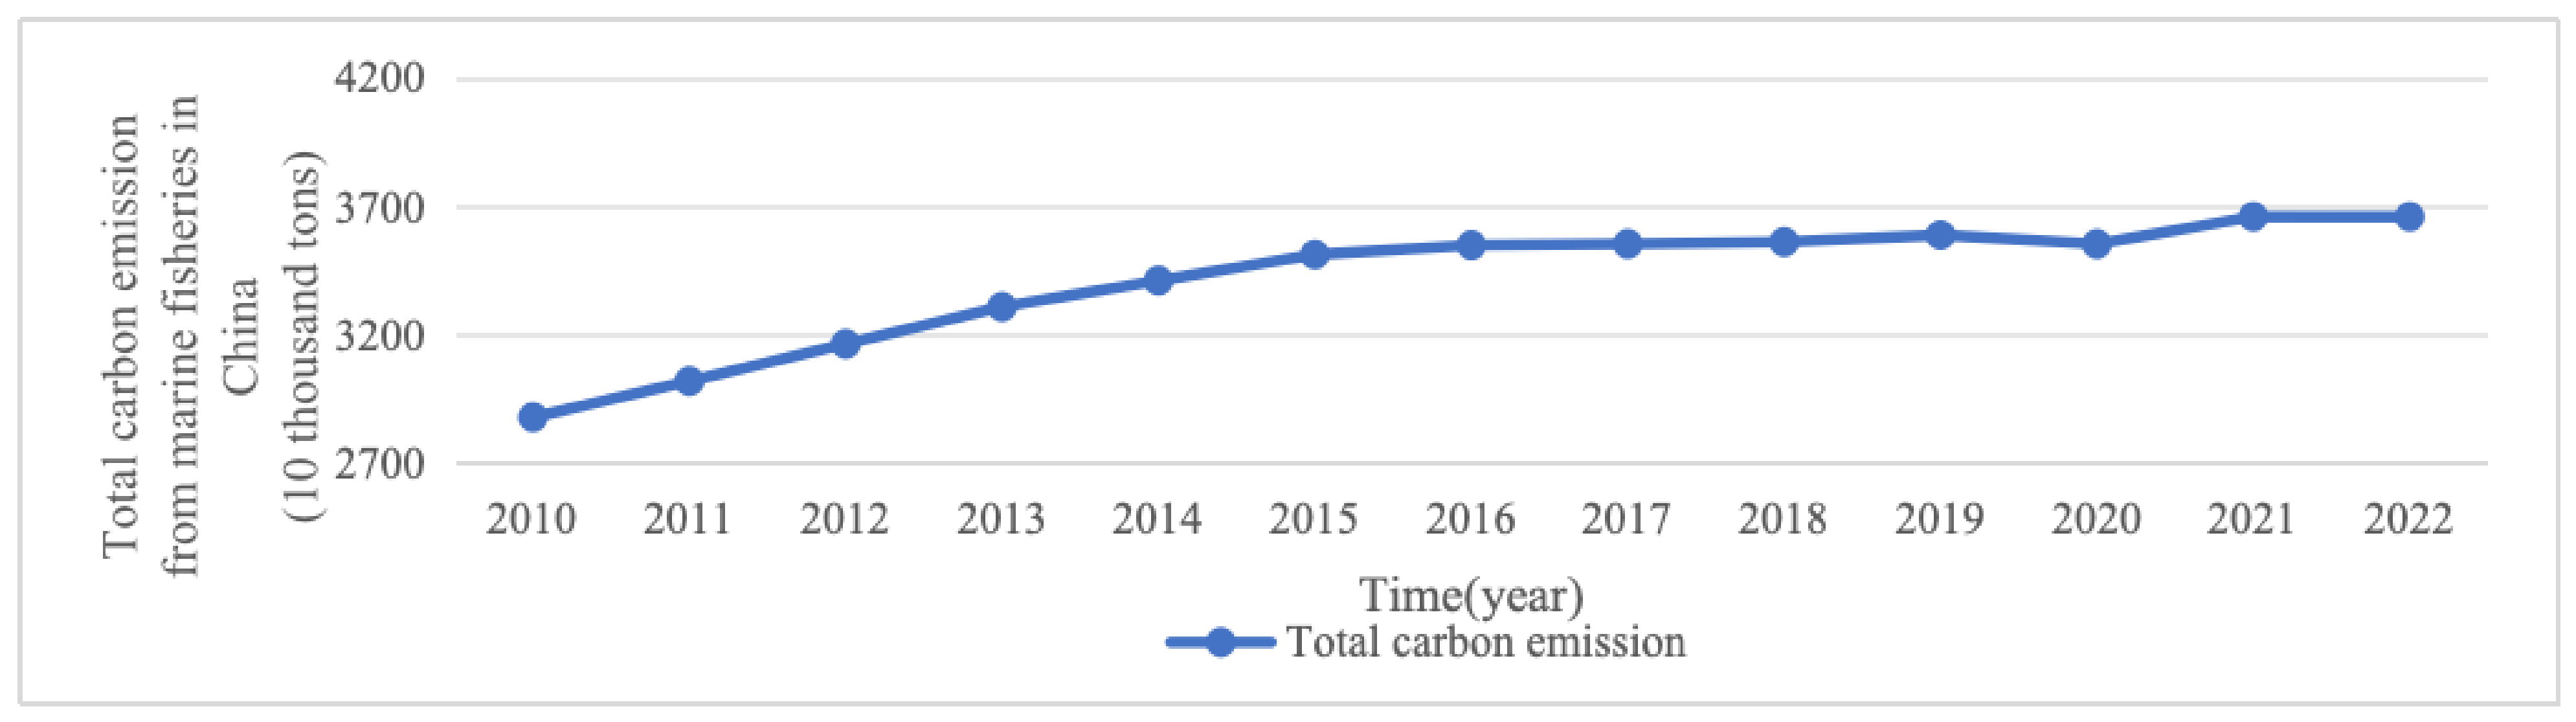
These effects should be assessed jointly; the harvest-mediated component is an accounting indicator rather than evidence that capture expansion enhances ecosystem health. In China, total carbon emissions from marine fisheries are also rising annually, reaching approximately 37 million tons of CO2 in 2022, which indicates that the sector holds substantial potential for emission reduction in the pursuit of global carbon-neutrality goals (as shown in Figure 1).
Figure 1.
Total carbon emissions of China’s marine fisheries.
Existing studies examine low-carbon marine-fishery development through complementary lenses. Work on green productivity and marine environmental performance emphasizes the tension between scale expansion and ecological quality [10,11,12]. Research on shellfish and algae documents biological carbon fixation and explores aquaculture pathways for enhancing carbon-related benefits [13,14,15]. Other studies link energy efficiency, digital technologies, and industrial restructuring to emission reduction in fisheries [16,17,18]. Together, these studies establish important accounting, technological, and governance foundations, but they do not, by themselves, provide a joint ecological–social–economic comparison of alternative development scenarios.
Nevertheless, the existing literature exhibits certain limitations. First, many studies address emission reduction, sink-related accounting, and socio-economic performance separately, leaving their joint assessment insufficiently developed [2,8,19,20]. Second, static assessments describe coordination at a given time but cannot show how selected state variables propagate across periods under alternative policy assumptions. To address these limitations, this study uses a scenario-driven system-dynamics model to trace the temporal trajectories of selected economic, social, and ecologically related variables. The model includes selected stock–flow relationships and feedback pathways; it does not attempt to represent all biophysical, institutional, or adaptive-policy feedback in marine fisheries.
To address these gaps, this study links a coupling-coordination evaluation model with a scenario-driven system-dynamics framework for China’ s marine fisheries. The framework combines ecological accounting indicators, social indicators, and economic indicators and traces selected variables under alternative scenario assumptions. It is used to compare conditional development trajectories within the stated model boundary rather than to provide a complete endogenous representation of the marine fishery system.
The contributions are twofold. First, we construct an ecological–social–economic indicator framework in which emissions, biological-carbon removal, social, and economic indicators enter the coupling-coordination assessment together. This is an integration of measurement and evaluation rather than a claim that all subsystem interactions are endogenously represented. Second, we link the coupling-coordination model with a scenario-driven system-dynamics framework to compare how selected variables evolve over time under alternative assumptions. The model focuses on empirically estimated relationships and selected feedback pathways relevant to policy comparison rather than claiming to reproduce the full endogenous, nonlinear dynamics of the marine fishery system.
The remainder of this study is organized as follows. Section 2 presents the conceptual framework for ecological–social–economic coupling in marine fisheries. Section 3 describes the indicator system, data sources, carbon-accounting procedures, coupling-coordination evaluation, scenario-driven system-dynamics model, scenario settings, and calibration-period historical-behavior check. Section 4 reports the historical and scenario results. Section 5 discusses the findings, policy implications, limitations, and future research.
2. Conceptual Framework
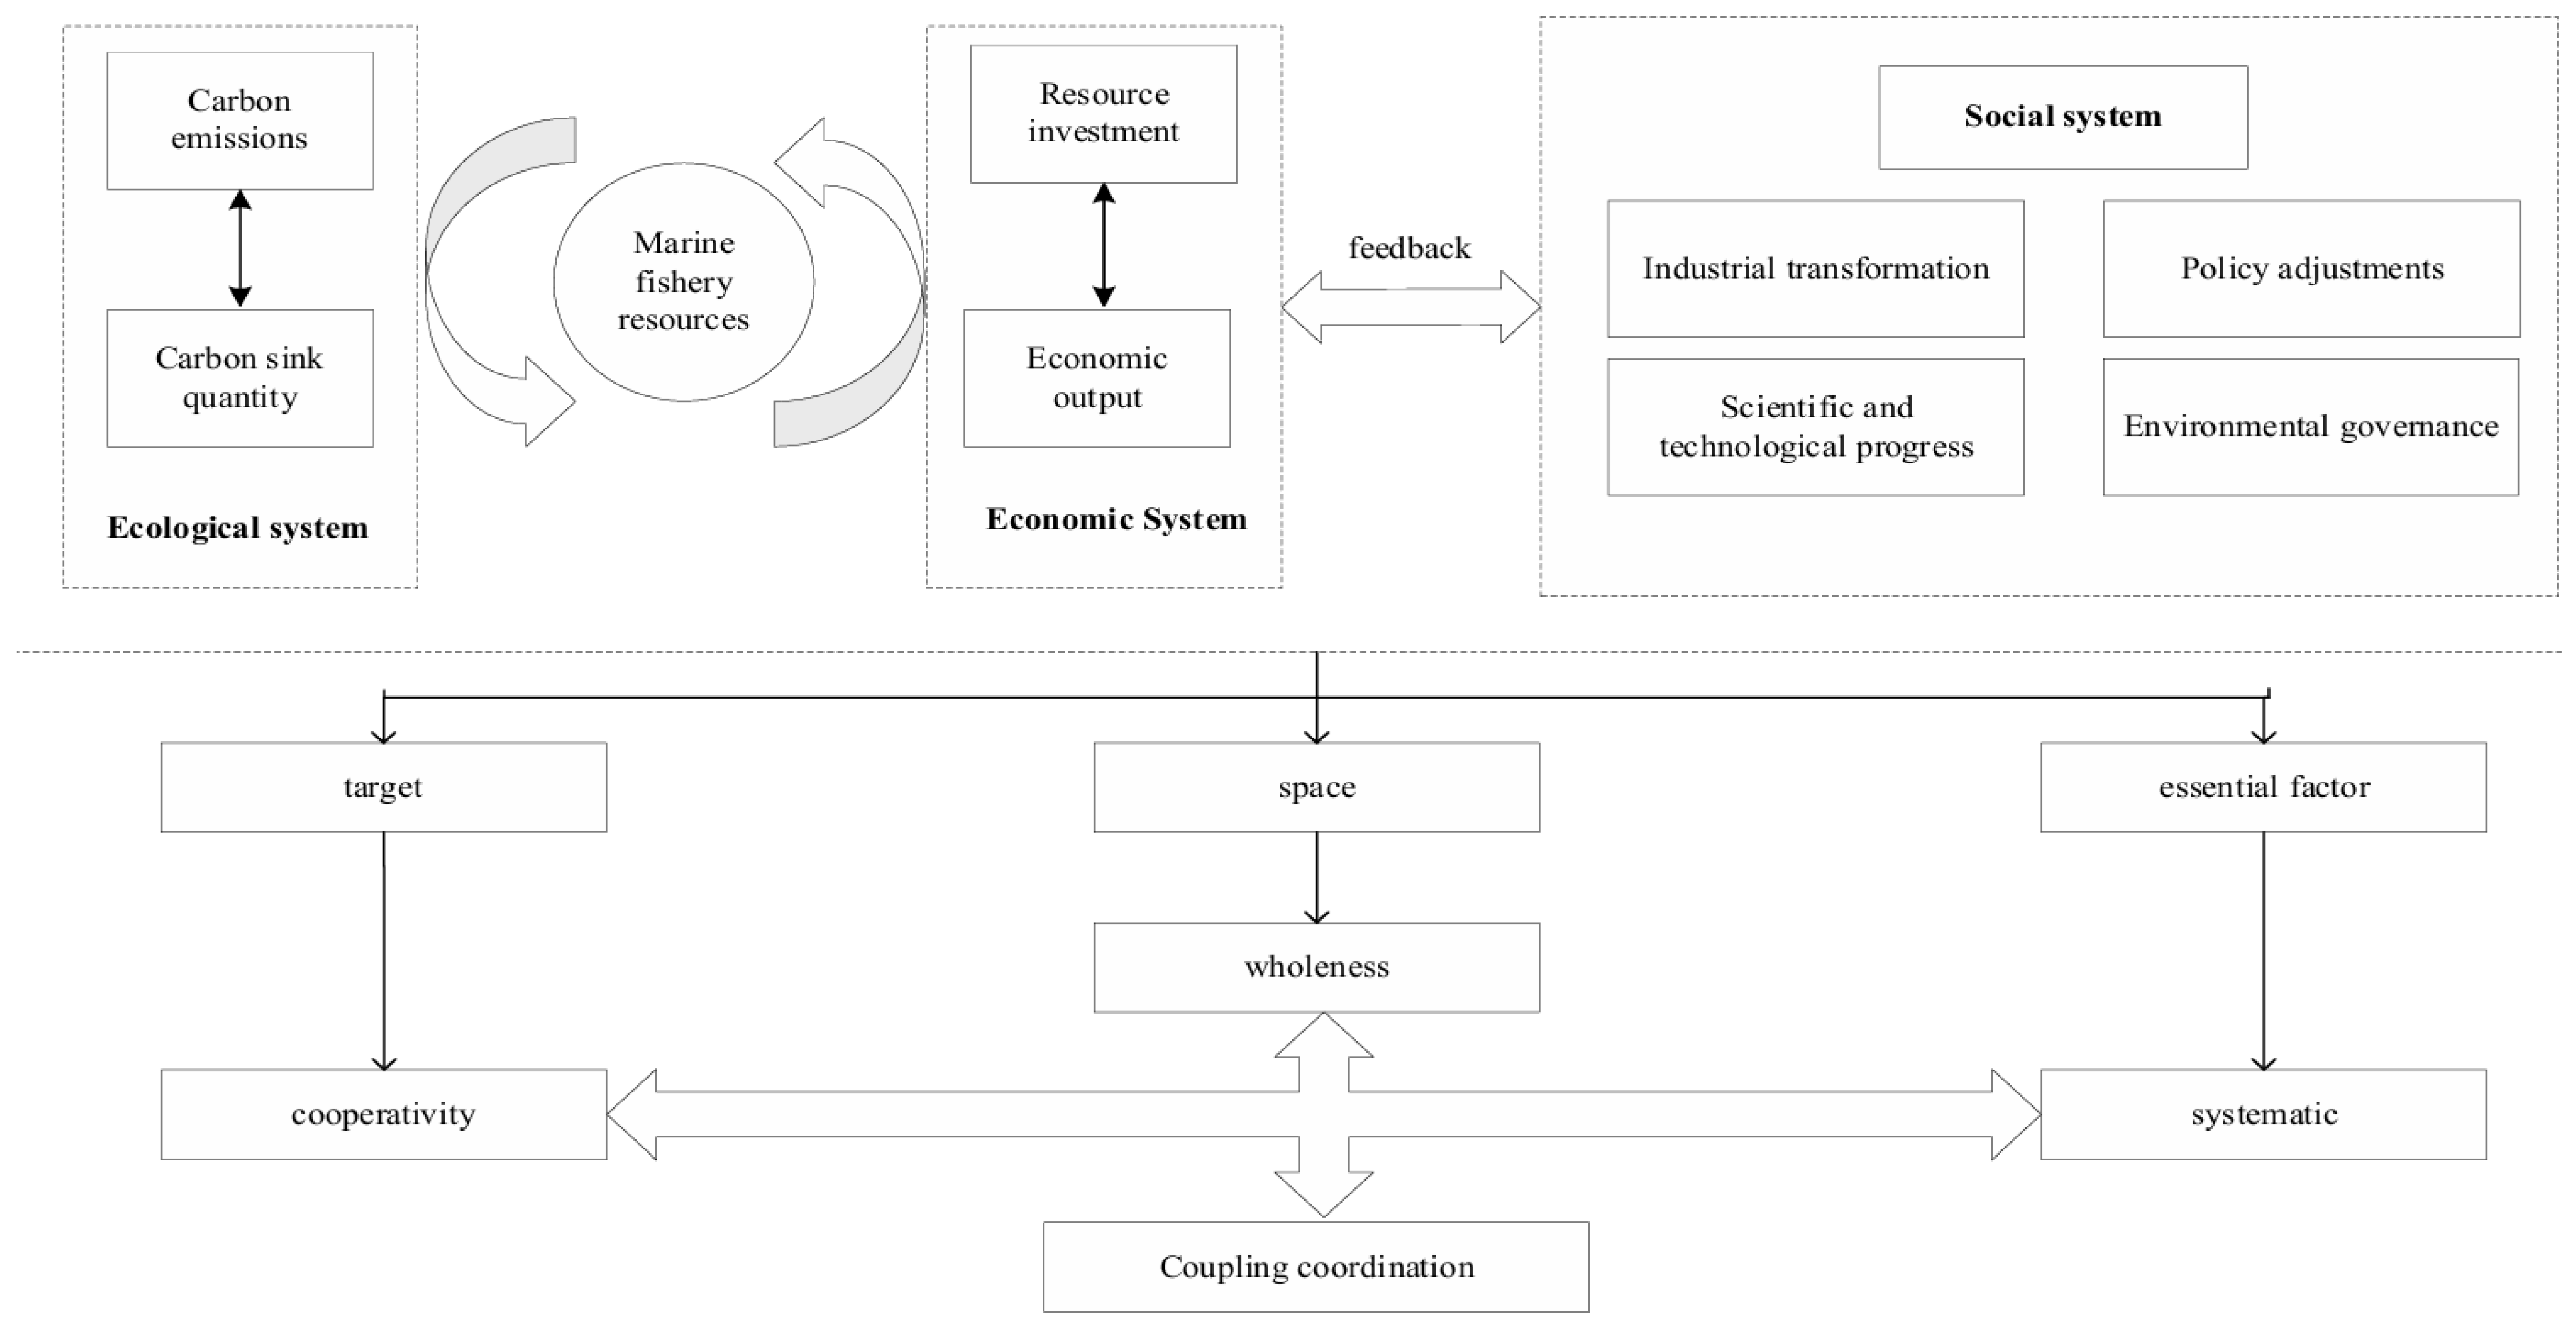
A well-functioning economy and a stable ecosystem are mutually supportive and require institutional arrangements for coordination [21,22]. In the ecological–social–economic system considered here, marine biological resources link ecological functions and fishery production, while the social subsystem functions as a governance, coordination, and mediation subsystem. It allocates resources, establishes regulatory rules, supports technological innovation, and mediates trade-offs between ecological protection and economic development. These processes can facilitate coordination, but they may also involve competing demands, adjustment costs, implementation lags, and institutional frictions. The selected social indicators represent measurable governance and support capacity; they do not imply that all governance processes are frictionless or fully simulated.
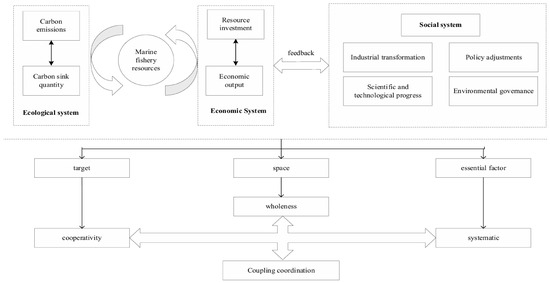
Specifically, within this composite system, the ecological subsystem includes carbon-source and ecological-accounting components. Carbon sources mainly comprise emissions from fishing vessels and electricity consumption in aquaculture [2,23]. The ecological-accounting component also includes aquaculture-related carbon sinks and a harvest-mediated biological-carbon removal indicator for capture fisheries [19,23]. The core biological resources encompass marine flora, fauna, and microorganisms. As an integral part of the ocean, marine fisheries depend on biological and physical structures; abiotic factors such as salinity, temperature, depth, and regional climate influence fishery activities. This subsystem provides support, absorption, mitigation, and purification functions, while the economic subsystem uses these resources through capture fisheries, mariculture, aquatic-product processing, and recreational fisheries [2,13]. The human-centered social subsystem provides the intellectual and regulatory framework that supports coordination between ecological and economic activities (see Figure 2).
Figure 2.
The coupling-coordination mechanism of the composite system.
2.1. Coupling Mechanism of the Economic–Social System
The economic system in marine fisheries operates through its industrial value chain. The primary sector (capture fisheries and aquaculture) provides raw materials for the secondary sector (processing). Extending this value chain adds value to products and stimulates the tertiary sector, thereby enhancing overall economic benefits [23,24,25].
The efficient operation of this industrial system relies on empowerment from the social system in three primary areas. First is technology empowerment. Concepts like the “Digital Ocean” and “Smart Ocean” highlight technology’s critical role [17,26]. Technology and big data optimize production, increase efficiency, and lower costs. Internet technologies also improve information flow and deepen consumer market understanding, enabling personalized services and adding value to products [17]. Second is policy empowerment. A supportive policy environment is essential for industrial upgrading and the efficient allocation of resources. Government intervention can also help overcome market failures [27,28]. Third are shifts in growth models. Sustainable development requires a transition from extensive to intensive growth. A key strategy is “industrial integration”, where different sectors merge to form new industries [29]. Marine ranching is a prime example, emphasizing the integration of primary, secondary, and tertiary sectors. This involves using new technologies to expand into emerging areas like renewable energy and cultural tourism, creating a mutually reinforcing dynamic [30,31].
Public investment, technological promotion, conservation regulation, and industrial development may compete for limited resources and have different effects across stakeholders and time periods. The current indicators capture these inputs and capacities, not the associated bargaining, compliance, or enforcement processes.
Therefore, the efficient functioning of the economic system of the marine fishery is inseparable from the support of the social system. Key social elements include technological advancement, a favorable policy environment, and adaptive industrial development strategies.
2.2. Coupling Mechanism of the Ecological–Social System
The core element of the ecological system is marine biological resources. Organisms naturally sequester carbon through processes like photosynthesis and metabolic growth [13,15], but this is a slow process. A systemic approach aims to enhance this function. Therefore, the operational goal of this system is to maximize the carbon-reduction and sink-enhancement capabilities of marine life. This is pursued through two primary means: (1) carbon-emission reduction by minimizing emissions from sources like fishing vessels, which indirectly degrade habitat quality and threaten species survival [19], and (2) sink expansion by increasing the capacity of marine organisms to absorb CO2 through their protection and proliferation [13,15].
Achieving this goal efficiently depends on empowerment from the social system in three main areas. First is technological empowerment. From a reduction perspective, beyond improving vessel energy efficiency, this includes leveraging renewable energy like wind and tidal power [32]. From a sink-expansion perspective, beyond traditional methods like the building of artificial reefs and stock enhancement, it includes emerging technologies such as coastal wetland restoration, microbial sink enhancement, and artificial upwelling [33,34]. Second is policy empowerment. In China, over-exploitation has led to the depletion of coastal fisheries and ecological degradation [34]. In response, fishery management policy has centered on the principle of “increasing aquaculture while limiting capture”. Government macro-intervention is vital for the protection of biological resources and om ensuring the system’s proper functioning [35,36]. Third is the improvement of aquatic habitat quality. Human impacts, such as pollution and species invasion, have pushed coastal ecosystems beyond their environmental carrying capacity, necessitating active intervention to promote recovery [35]. This includes large-scale projects like ecological marine ranches, shoreline restoration, and mangrove conservation [36].
Thus, the efficient operation of the ecological system is also inseparable from the support of elements within the social system.
2.3. Coupling Mechanism of the Ecological–Economic System
The coupling-coordination mechanism between the ecological and economic systems can be analyzed in two parts.
The first part is the influence of the ecological system on the economic system. First, the ecological system provides high-quality factors of production. A healthy system yields more productive and higher-quality biological resources, which are processed into high-value aquatic products. This promotes the extension of the industrial value chain and stimulates the secondary and tertiary sectors [2,37]. Second, the ecological system provides a carrier for ecological wealth. A healthy marine environment supports eco-industries like ecological aquaculture and recreational fisheries, allowing ecological resources to function as a factor of production that converts ecological value into economic benefits [38]. Conversely, a degraded environment has a negative impact, reducing seafood yields and compromising product safety, which can lower consumer trust and disrupt the economic system [39].
These relationships provide the conceptual basis for the coupling framework. In the current simulation, however, fish-stock depletion, ecosystem carrying capacity, resource-quality change, and ecological degradation are not implemented as endogenous state variables that automatically constrain output, investment, or policy settings. The ecological–economic link is therefore partly represented through the common indicator and coordination-evaluation structure rather than through a complete bidirectional dynamic feedback mechanism.
The second part is the influence of the economic system on the ecological system. First, the economic system can provide source control for ecological protection. By optimizing industrial structures and production models, the fishery industry can reduce the discharge of wastewater and solid waste, thereby mitigating environmental damage and lessening ecological pressure [32]. Second, the economic system provides the financial basis for the ecological system. High-quality economic development generates the wealth needed to fund environmental governance projects, creating a virtuous cycle [23]. However, an overheated economy can also have negative consequences. Excessive pollution and over-extraction of natural resources can degrade habitat quality and disrupt the functioning of the ecological system [2,37].
The central hub of the ecological–economic coupling is marine biological resources. High-quality, productive biological resources are the foundation for the ecological system’ s ability to reduce emissions and enhance sinks, and they are also the cornerstone of the economic system’s proper functioning.
3. Materials and Methods
3.1. Indicator System and Data Sources
This study evaluates the coupling-coordination effect within China’ s marine fishery ecological–social–economic system. To accurately calculate the coupling-coordination degree, we first subdivide the composite system and select a set of indicators for a comprehensive evaluation. Referencing the relevant literature, we selected the following indicators (see Table 1 for details).
Table 1.
Comprehensive evaluation index system.
(1) Ecological System: This subsystem includes indicators for carbon sources and ecological-accounting components. Carbon sources are represented by carbon emissions from aquaculture electricity, fishing vessels, and seafood processing. The ecological-accounting components comprise the aquaculture-related carbon-sink indicators and the harvest-mediated biological-carbon removal indicator for capture fisheries; the latter is not interpreted as permanent sequestration or as a direct measure of ecosystem health.
(2) Social System: This subsystem includes indicators reflecting scientific innovation, technology promotion, environmental governance, protected-area development, and labor-force conditions. The indicators capture measurable governance and support capacity: research institutions, personnel, and projects proxy research support; aquatic technology funding and personnel proxy extension capacity; and pollution-control investment and marine nature reserves proxy environmental-governance inputs. They do not directly measure stakeholder conflicts, regulatory compliance, enforcement effectiveness, institutional friction, or implementation delays. The resulting social-system score should therefore be interpreted as a scenario-conditioned index of governance and support capacity rather than a comprehensive measure of governance quality or an independently identified social feedback mechanism.
(3) Economic System: This subsystem includes indicators for both economic inputs and outputs. Inputs are represented by indicators such as mariculture area, year-end number of motorized fishing vessels, number of employees in marine fisheries, and investment in fixed assets. These reflect the intensity of human, material, and financial investment. Outputs are represented by indicators such as the per capita output value of marine fisheries and the output value of seafood processing, which reflect the system’s economic production capacity.
The data for this study are primarily sourced from the China Statistical Yearbook, the China Marine Economic Statistical Yearbook, the China Fishery Statistical Yearbook, and the China Environmental Statistics Yearbook, as well as relevant statistical bulletins and provincial statistical yearbooks.
3.2. Carbon-Emission and Biological-Carbon Accounting Procedures
Drawing on the calculation methods of previous studies [2,19,20], the formula for calculating carbon emissions from marine fisheries is expressed as follows:
Here, C1 represents the carbon emissions from aquaculture electricity, C2 represents the carbon emissions from fishing vessels (which primarily use diesel fuel), and C3 represents the carbon emissions from seafood processing.
In Formula (1), Qi is the output of the i-th aquaculture method, A is the electricity-consumption coefficient, and B is the carbon-emission factor for electricity. The electricity-consumption coefficient for seawater pond culture is 370 kWh/t, and for factory farming, it is 8660 kWh/t. In Formula (2), Pi denotes the total installed engine power of vessels operating in category i (kW), and Fi denotes the annual fuel-consumption coefficient for that category, expressed as t/(kW·year). Thus, PiFi represents annual fuel consumption for category i. Because the empirical observations are annual and the simulation time step is one year, C2 is reported as annual carbon emissions from fishing vessels. NCV is the net calorific value (kJ/kg), CEC is the carbon-emission factor (tC/TJ), COF is the carbon-oxidation fraction, and 44/12 converts carbon mass to CO2 mass. In Formula (3), Y is the output of seafood products, and is the conversion coefficient.
The annual fuel-consumption coefficients applied to the vessel-emission calculation are reported in Table 2.
Table 2.
Annual fuel-consumption coefficients by fishing operation type (t/(kW·year)).
Following the methodology of Wang et al. (2025) [20], the formula for calculating the carbon sink from marine shellfish and algae aquaculture is expressed as follows:
In the aquaculture calculation, C4 is the combined shellfish-and-algae biological-carbon component, Ca is the shellfish component, and Cb is the algae component. Qa and Qb are the respective outputs of shellfish and algae, and Ia = 0.0888 and Ib = 0.2955 are their category-specific conversion coefficients (tC/t). For the system-dynamics implementation, the combined output SAO is paired with a fixed composition-weighted coefficient, i.e., , which is calculated from the average production composition during the study period. This aggregation does not assume equal conversion efficiencies; it is a compact approximation ofthe category-specific calculation within the observed production structure.
Referencing Guan et al. (2022) [8], the formula for calculating the harvest-mediated biological-carbon removal component from offshore fishing is expressed as follows:
In Formulas (7) and (8), C5 denotes the total biological-carbon component calculated from offshore catch, and C6 denotes the harvest-mediated biological-carbon removal component after the 0.35 adjustment. Qc is the output of the c-th type of offshore marine species, and Cc is the carbon-content rate of the cth species The carbon-content rates for fish, cephalopods, and crustaceans are 0.14, 0.10, and 0.08, respectively. For transparency, the composite coefficient for category c is , where . The resulting coefficients are approximately 2.18 for fish, 1.25 for crustaceans, and 1.56 for cephalopods. These coefficients combine species-specific carbon content, the 0.35 adjustment, and the adopted transfer efficiencies; they are not carbon-content percentages. In this study, C6 is used as a harvest-mediated biological-carbon removal indicator. It represents biological carbon transferred from the water through harvesting within the adopted accounting boundary and is not interpreted as permanent carbon sequestration or as a direct measure of ecosystem health.
3.3. Coupling-Coordination Degree Evaluation Model
The coupling-coordination degree model is frequently used in research on the interactions between different systems and is widely adopted by scholars. The calculation process can be summarized as follows: first, the comprehensive score of each subsystem is calculated using the entropy weight method; second, the coupling-coordination degree is calculated based on these comprehensive scores. Additionally, the obstacle degree model is often used to measure the degree to which different indicators hinder the system’s development.
The entropy weight method can objectively calculate indicator weights, thereby avoiding the influence of subjective factors. The formula for data standardization is expressed as follows:
In the Formula (9), Yij is the standardized value, Xij is the value of the j-th indicator in the i-th year, MIN{Xj} is the minimum value of the j-th indicator across all years, and MAX{Xj} is the maximum value of the j-th indicator across all years.
The weight calculation process is expressed as follows:
In Formulas (11) and (12), m is the sample size (number of years), and n is the number of indicators.
The comprehensive score is calculated as follows:
The formulas for calculating the coupling-coordination degree are expressed as follows:
In Formula (14), Pa, Pb, and Pc are the comprehensive scores for the ecological, social, and economic systems, respectively. As the three systems are considered equally important, their coefficients are set as ===1/3. C is the coupling degree, and D is the coupling-coordination degree.
Currently, there is no unified standard for classifying the levels of coupling coordination. Drawing on previous research and the objectives of this study, the coupling-coordination degree is divided into five types [2] (see Table 3).
Table 3.
Classification of coupling-coordination degree levels.
3.4. System-Dynamics Model
System dynamics (SD) is a modeling approach that traces the behavior of complex systems by specifying stock–flow, algebraic, and feedback relationships. It can represent dynamic relationships and long-term system trajectories when the relevant relationships and assumptions are specified. System dynamics has been widely applied in the study of multi-system interactions. This study employs a scenario-driven SD model to explore conditional coupling-coordination trajectories in China’ s marine fisheries from 2023 to 2035; it does not claim independent predictive validation beyond the stated calibration and scenario assumptions.
3.4.1. System Boundaries and Assumptions
This study uses a scenario-driven system-dynamics model to trace the coupled system from 2010 to 2035 with a one-year time step. The 2010–2022 period provides the calibration window, and 2023–2035 is used for conditional scenario exploration. Endogenous variables include regional GDP, capture output, aquaculture output, seafood-processing output, total fishery economic output, and marine fishery value added; they are updated annually through the stock–flow and algebraic relationships in Table 4. Policy factors and several input indicators, including the number of marine research institutions (NRIs), are specified exogenously for each scenario in Table 5. The model is therefore a dynamic, scenario-driven simulation with selected endogenous feedback pathways rather than a fully adaptive representation in which policy settings respond automatically to ecological conditions.
Table 4.
Core variable equations.
Table 5.
Parameter settings for scenarios.
3.4.2. Causal-Loop Diagram of the System
Improvements in the economic system can drive regional economic development. A strong regional economy can attract more talent, introduce advanced technology and equipment, and increase R&D and promotion funding for fisheries. With more human, material, and financial resources, the scale and efficiency of aquaculture and fishing can be effectively promoted. The feedback loops specified here primarily represent the socioeconomic and production-related mechanisms included in the current model. They do not exhaustively represent ecological, institutional, or adaptive-policy feedback. In particular, fish-stock depletion, ecosystem carrying capacity, and state-dependent policy adjustment are not implemented as endogenous constraints on output, investment, or policy parameters.
Specifically, the main feedback loops between the variables include the following:
Feedback Loop 1: Regional GDP → (+) Investment in Fixed Assets → (+) Marine Capture and Aquaculture Output → (+) Total Fishery Economic Output → (+) Regional GDP. This is a positive feedback loop, indicating that regional economic development positively drives the marine-capture and aquaculture industries, which, in turn, further promote regional economic growth.
Feedback Loop 2: Regional GDP → (+) Investment in Fixed Assets → (+) Aquaculture and Capture Output → (+) Seafood Processing Output → (+) Total Fishery Economic Output → (+) Regional GDP. This is a positive feedback loop showing that through the extension of the industrial value chain, regional economic development not only drives the primary fishery sector but also promotes the secondary (processing) sector, thereby further stimulating the fishery economy.
Feedback Loop 3: Regional GDP → (+) Investment in Fixed Assets and Environmental Pollution Control → (+) Recreational Fishery Output → (+) Total Fishery Economic Output → (+) Regional GDP. This is a positive feedback loop, demonstrating that regional economic development underpins investment in environmental governance. An improved marine ecosystem is conducive to the growth of the tertiary sector (recreational fisheries), which, in turn, empowers the overall fishery economy.
Feedback Loop 4: Regional GDP → (+) Population → (+) Aquaculture Output → (+) Total Fishery Economic Output → (+) Regional GDP. This is a positive feedback loop, suggesting that regional economic development leads to an increase in population size, which, in turn, promotes the aquaculture industry.
3.4.3. Model Construction, Historical-Behavior Check, and Scenario Setting
The relationships between variables are represented by a combination of stock–flow, algebraic, regression, and table-function relationships (Table 4). NRI is specified exogenously in each scenario. Equations (12)–(15) map NRI to research-related proxy indicators through deterministic relationships; the resulting social-system score should be interpreted as a scenario-conditioned composite index rather than emergent feedback from social outcomes.
Based on the development trends of the indicators within the ecological–social–economic system from 2010 to 2022, five simulation scenarios were established:
Scenario 1—Status Quo: This scenario assumes the current state is maintained. The existing capacity for emission reduction and sink enhancement, as well as the input levels for fishery technology, population, and fixed assets, remain unchanged. Policy encouragement is held constant, and no new measures are taken. All relevant indicators are set to their historical average values.
Scenario 2—Restrictive Development: Building on the status quo, this scenario involves reducing the input levels of technology, population, and fixed assets. The intensity of marine capture and aquaculture is lowered to slow the pace of industrial development. At the policy level, capture fisheries and aquaculture are restricted, while the proportion of investment in environmental pollution control is appropriately increased.
Scenario 3—Economic Development: Compared to the status quo, this scenario features higher input levels for population and fixed assets, which are set to their historical maximum values. The intensity of marine capture and aquaculture is increased to accelerate the development of the primary and secondary fishery sectors. As the focus is on economic growth, the proportion of investment in environmental pollution control is set to its historical minimum. Citing the 14th Five-Year National Fisheries Development Plan, which emphasizes increasing the contribution of scientific progress, key technology-related indicators are also set to their historical maximums.
Scenario 4—Environmental Protection: This scenario prioritizes environmental conservation. Drawing on policies like the Action Plan for the Conservation of Living Aquatic Resources in China and the 14th Five-Year National Fisheries Development Plan, which call for strict control of capture intensity, marine capture is restricted, and the number of motorized fishing vessels is set to its historical minimum. Conversely, aquaculture is encouraged. To reduce ecological pressure, the fishery population is set to its historical minimum, while investment in environmental pollution control is maximized. As the focus is on a high-quality workforce and environmental investment, technology funding is set lower than in the economic development scenario.
Scenario 5—Integrated Coordination: This scenario represents a balanced approach that seeks sustainable and coordinated development of both the fishery economy and the environment. In line with the 14th Five-Year Plan for National Economic and Social Development and the Long-Range Objectives Through the Year 2035, investment in environmental pollution control is set to its historical maximum. At the policy level, capture fisheries are restricted, while aquaculture is encouraged. Other economic and technological input indicators are set at intermediate levels between those of the economic development and environmental protection scenarios.
Building on the analysis of the five simulation scenarios and in accordance with the Outline of the 14th Five-Year Plan (2021–2025) for National Economic and Social Development and the Long-Range Objectives Through the Year 2035 and the 14th Five-Year National Fisheries Development Plan, the relevant parameters for the five simulation scenarios were established, taking into account the current development status of China’ s marine fisheries (see Table 5). The complete stock-and-flow diagram of the ecological–social–economic system is provided in Appendix A (Figure A1). There is no unified standard for parameter setting in system dynamics [2,37]. In the context of this study, the capture policy factor and the aquaculture policy factor were set as follows: a value of 1 represents the default (status quo), 0.5 represents policy discouragement, 2 represents policy encouragement, and 1.5 represents an intermediate degree of encouragement between the two. These scenarios are counterfactual policy experiments used to compare system responses under alternative assumptions. In particular, the higher capture intensity in the economic development scenario is not a policy recommendation for unrestricted fishing expansion; it is used to examine the modeled consequences of a production-oriented assumption within the specified accounting framework.
The model was checked against historical observations during the calibration period (2010–2022). Marine capture output, aquaculture output, and seafood processing output value were selected as representative variables. The comparison in Table 6 is an in-sample calibration-period historical-behavior reproduction check, not an independent out-of-sample validation. Errors within ±10% describe the extent to which the model reproduces the observed values of the three selected variables under the calibration conditions; they do not establish predictive accuracy beyond 2010–2022.
Table 6.
Calibration-period historical-behavior reproduction check for selected variables (2010–2022).
4. Results
4.1. Historical Coupling-Coordination Patterns
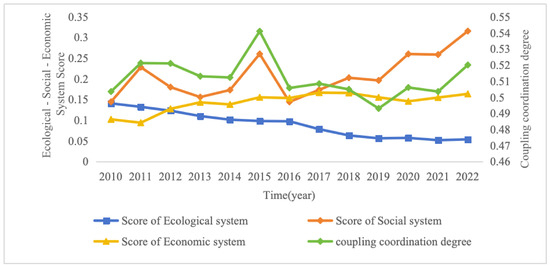
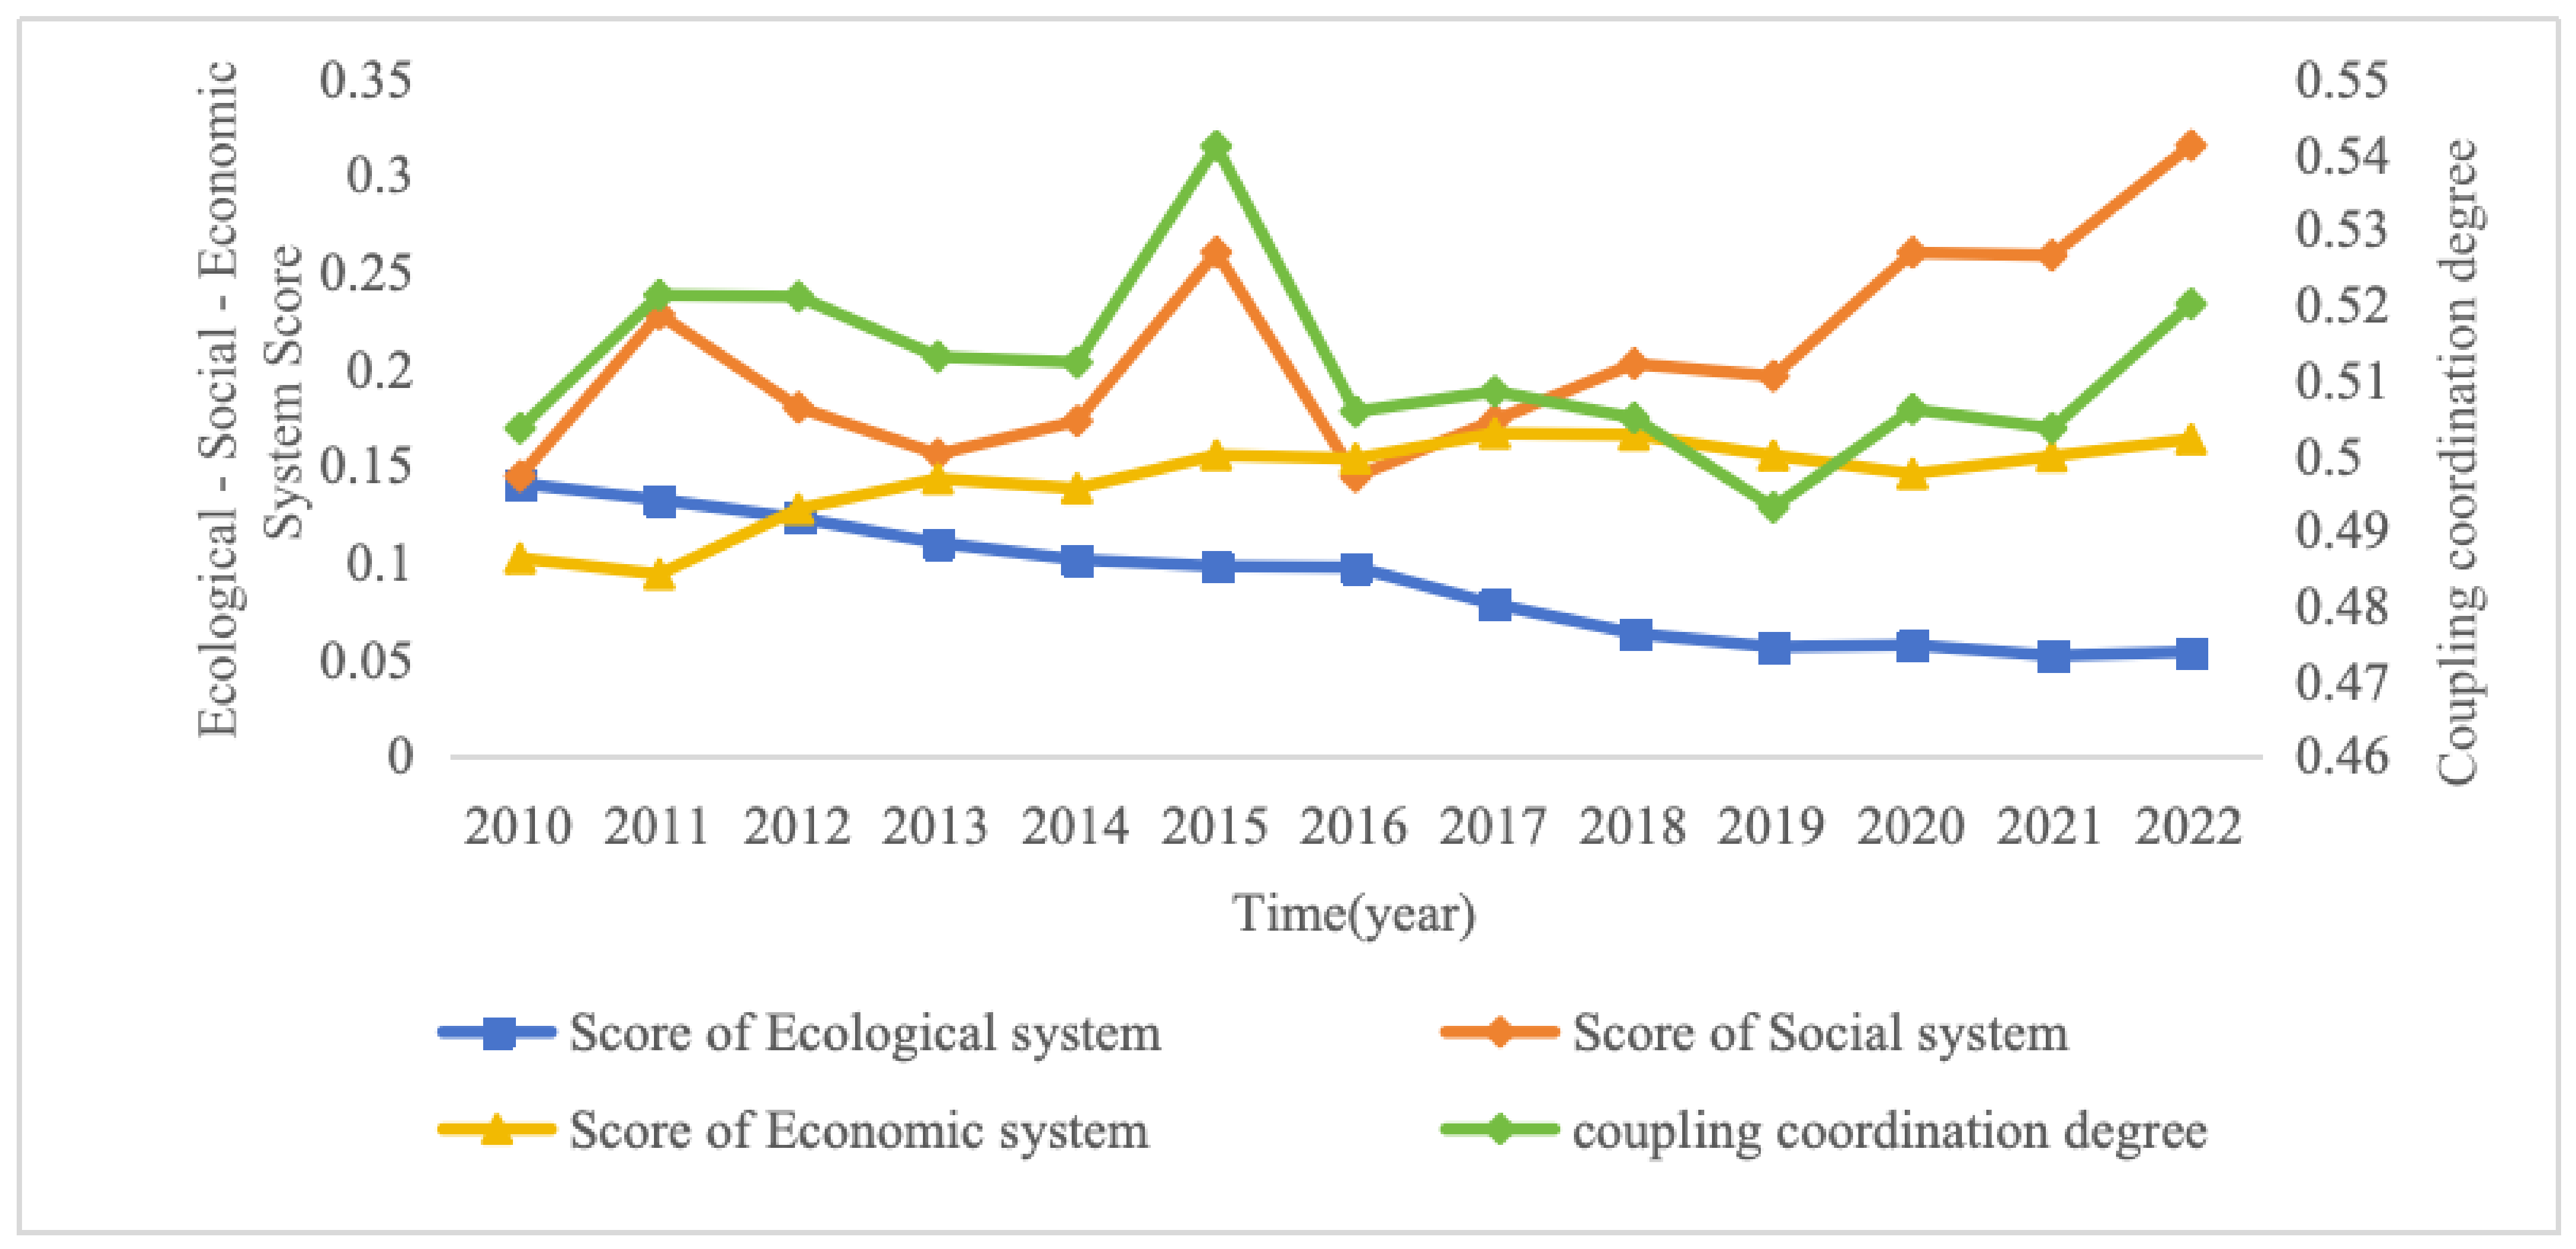
As shown in Figure 3, the scores of the three subsystems and the overall coupling-coordination degree exhibit distinct trends from 2010 to 2022.
Figure 3.
System scores and coupling-coordination degree of China’s marine fisheries (2010–2022).
On the ecological-system front, the score for the ecological system in China’s marine fisheries showed a fluctuating downward trend between 2010 and 2022, decreasing from 0.140 to 0.053. Although China’s implementation of measures such as vessel reduction and conversion programs, restrictions on overfishing, and the promotion of aquaculture has effectively controlled carbon emissions from fishing vessels, the overall carbon emissions from marine fisheries have not changed substantially due to emissions from the growing aquaculture and seafood processing industries. Concurrently, the harvest-mediated biological-carbon removal indicator declined as marine capture volumes decreased. The aquaculture-related carbon-sink component, while trending upward, was smaller in scale and did not offset the decline in this indicator. Therefore, with total carbon emissions remaining relatively stable while the ecological-accounting components decreased, the ecological-system score continuously declined. This historical score pattern reflects the adopted accounting and index-construction framework; it is not interpreted as evidence that lower capture limits worsen ecosystem health.
On the social-system front, the comprehensive score for the marine fishery social system demonstrated a fluctuating upward trend during the observation period, with peaks in 2011 and 2015. Benefiting from the implementation of the “Marine Power” strategy, investment in marine scientific research and aquatic technology promotion has increased annually, leading to an overall improvement in these areas. The fluctuations in the social system’s score are mainly due to three factors. First, as the state prioritized the marine ecological environment, investment in environmental governance increased in the early years and achieved notable results; as governance matured, this investment level subsequently decreased. Second, in 2019, the state issued the “Guiding Opinions on Establishing a Natural Protected Area System with National Parks as the Main Body”, which led to an adjustment and optimization of marine protected areas, resulting in a decrease in their total area. Third, recent adjustments to the national strategy for sustainable marine fishery development have caused shifts in the labor supply, with some fishery personnel transitioning to other industries, leading to negative growth in the fishery population and workforce. These factors caused fluctuations in the social system’s upward trend.
On the economic-system front, the economic system reflects the inputs and outputs of China’s marine fishery resources. The system’s score generally rose from 2010 to 2017 (from 0.102 to 0.166), declined from 2018 to 2020 (from 0.165 to 0.145), and began to rise again after 2021 (from 0.154 to 0.163). This instability is related to the transition of China’s marine fishery from an extensive to an intensive growth model. The extensive model relied on massive inputs of production factors to rapidly expand scale, leading to a swift increase in the economic system’s score. However, as the focus shifted to sustainable development, the ongoing push for industrial and value-chain optimization led to a short-term slowdown or decline in human, material, and financial inputs. This reduction in production factors, compounded by the overall economic downturn caused by the COVID-19 pandemic, temporarily affected economic output, causing the score to fall between 2018 and 2020. With post-pandemic economic recovery and the progressive optimization of the industrial structure, new economic growth drivers are emerging, allowing the score to rebound, as seen in 2021–2022.
The coupling-coordination degree is a composite reflection of the performance of the different subsystems. The overall coupling-coordination degree for China’s marine fishery system has fluctuated within the basic coordination range. During the observation period, it never fell into slight dissonance or rose into slight coordination. The highest point was 0.541 in 2015, and the lowest was approximately 0.493 in 2019. This fluctuation is linked to the unstable trends of the ecological, social, and economic subsystems. This indicates that to synergistically advance the sustainable development of China’ s marine fishery and achieve high-quality growth, a concerted, multi-dimensional effort is required.
4.2. Scenario Results
The coupling-coordination degree used in the following scenario analysis is a dimensionless composite index derived through the normalization, entropy-weighting, and aggregation procedure stated in Section 3.4. It should be distinguished from the raw state variables checked in Table 6. The comparability of index values depends on the stated index-construction procedure. Accordingly, the following scenario results are interpreted as conditional within-study comparisons under that procedure rather than as independently calibrated forecasts of absolute coordination levels.
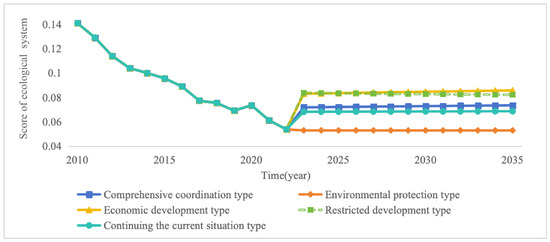
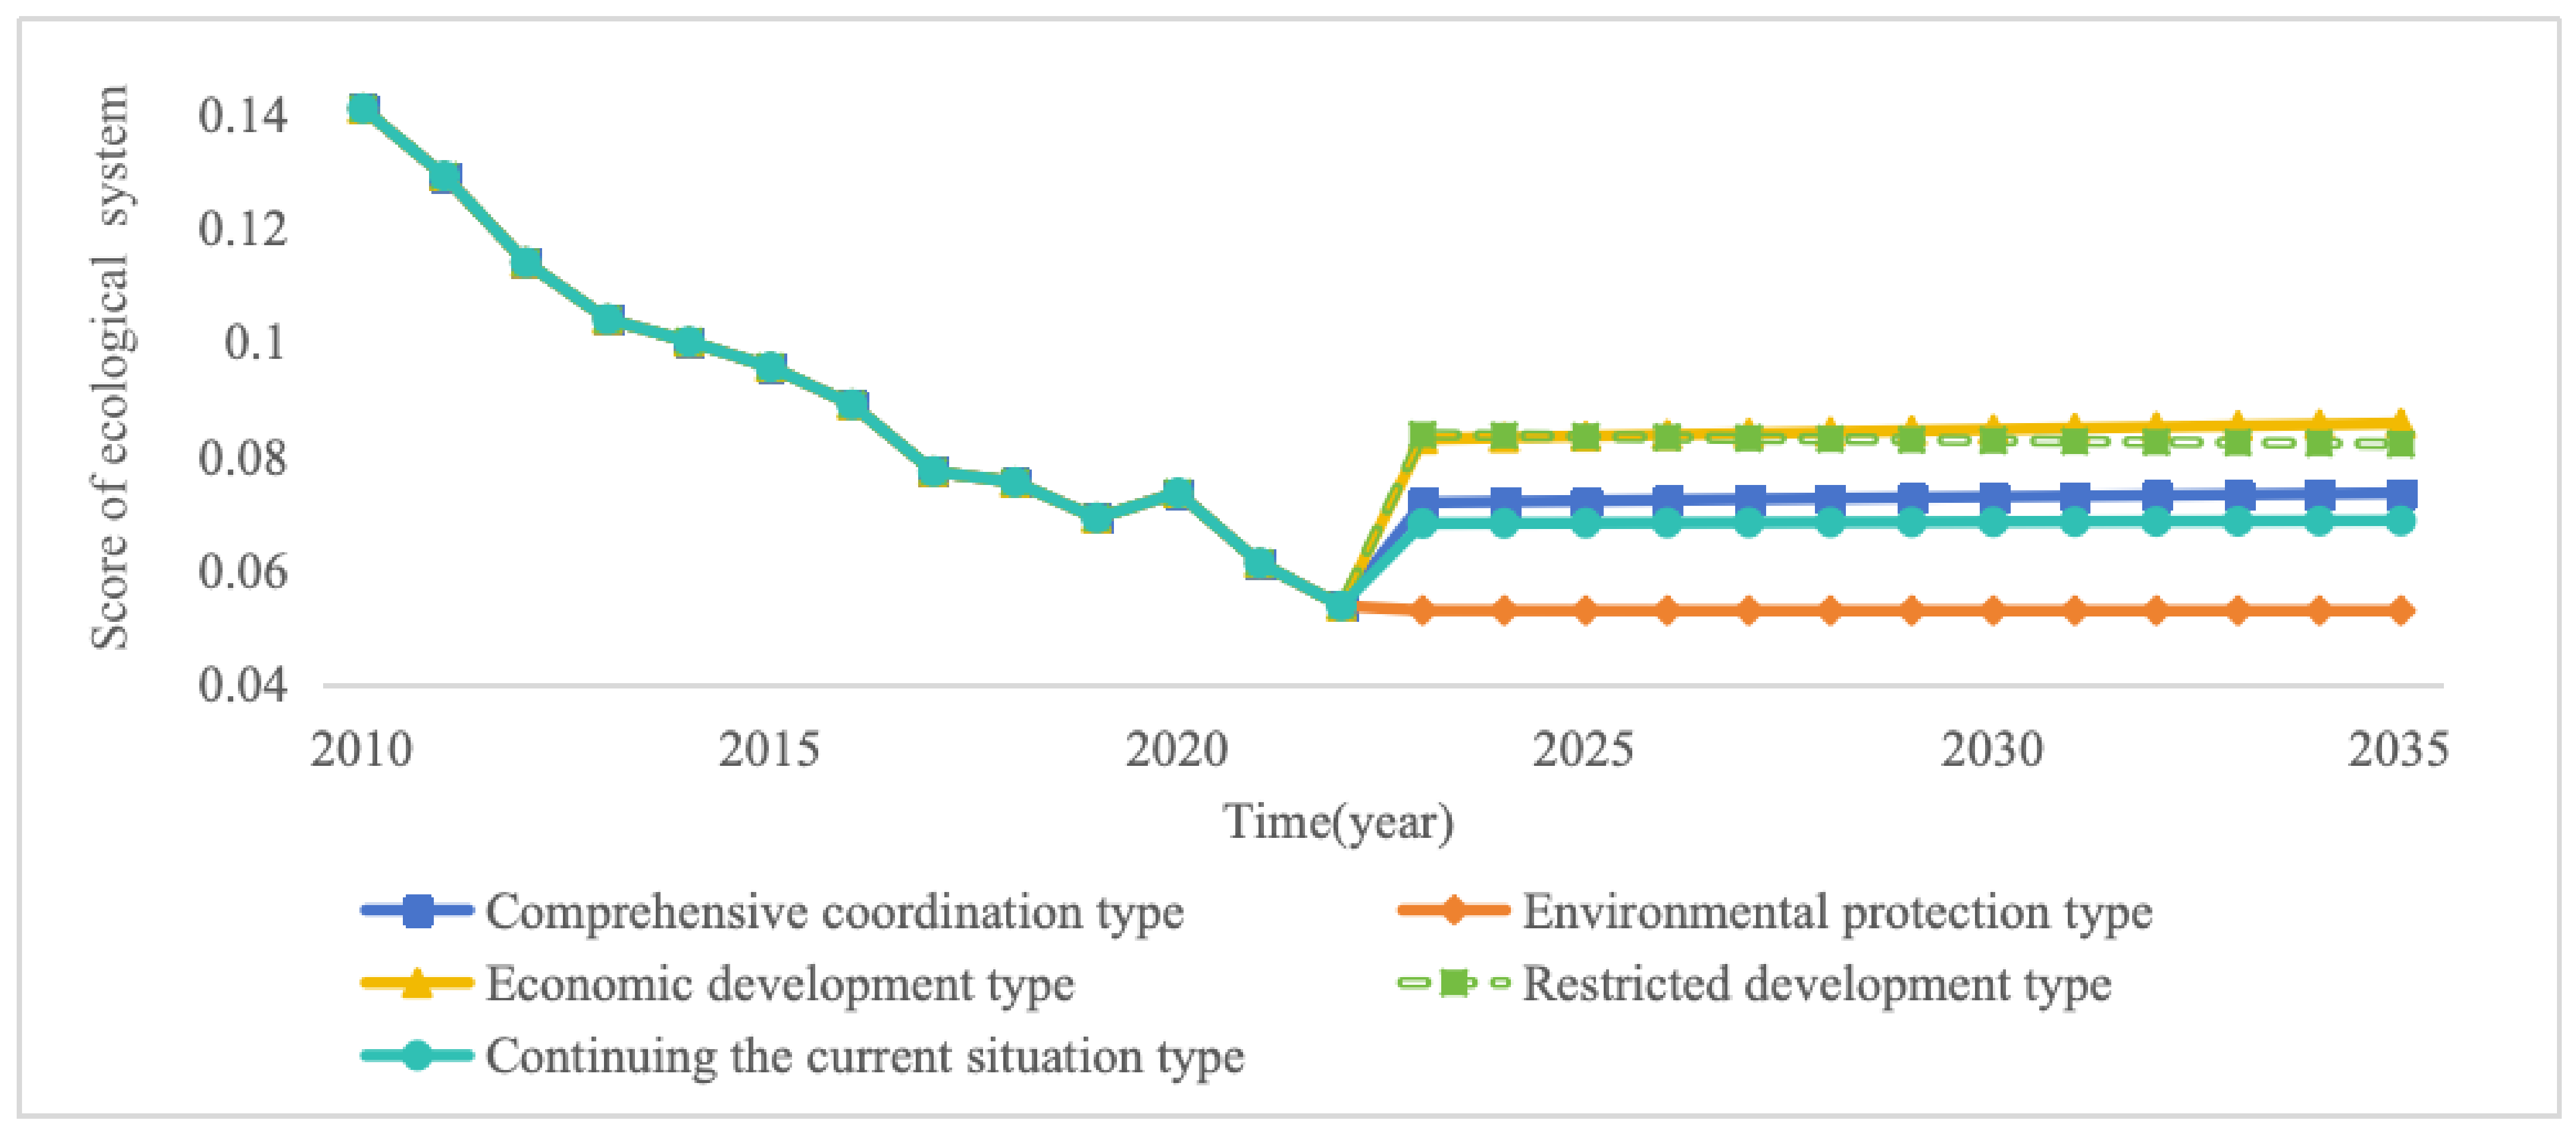
The figure legends use “Comprehensive coordination type”, “Continuing the current situation type”m and “Restricted development type” for the integrated coordination, status quo, and restrictive development scenarios, respectively. Regarding the ecological-system score, the Integrated coordination, economic development, and status quo scenarios show gradual increases, the environmental protection scenario remains comparatively stable, and the restrictive development scenario drops at the scenario transition before recovering slightly. Within the adopted accounting boundary, the lower score of the environmental protection scenario relative to the status quo scenario partly reflects a reduction in the harvest-mediated removal indicator when capture is restricted. Although aquaculture is encouraged, the shellfish-and-algae component is not sufficiently large in the current accounting structure to offset this reduction immediately. This result does not indicate ecological deterioration, nor does it imply that relaxing capture constraints would improve ecosystem health. The relatively high ecological-system score of the economic development scenario reflects the weight of this indicator in the composite index; it should not be interpreted as evidence that capture expansion improves ecosystem health.
The corresponding ecological-system trajectories are shown in Figure 4.
Figure 4.
Score trends for the ecological system (2010–2035).
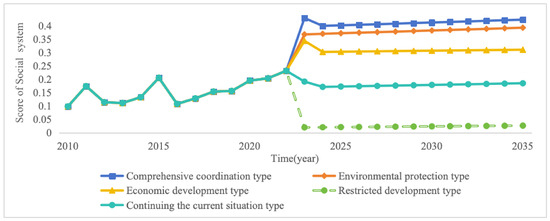
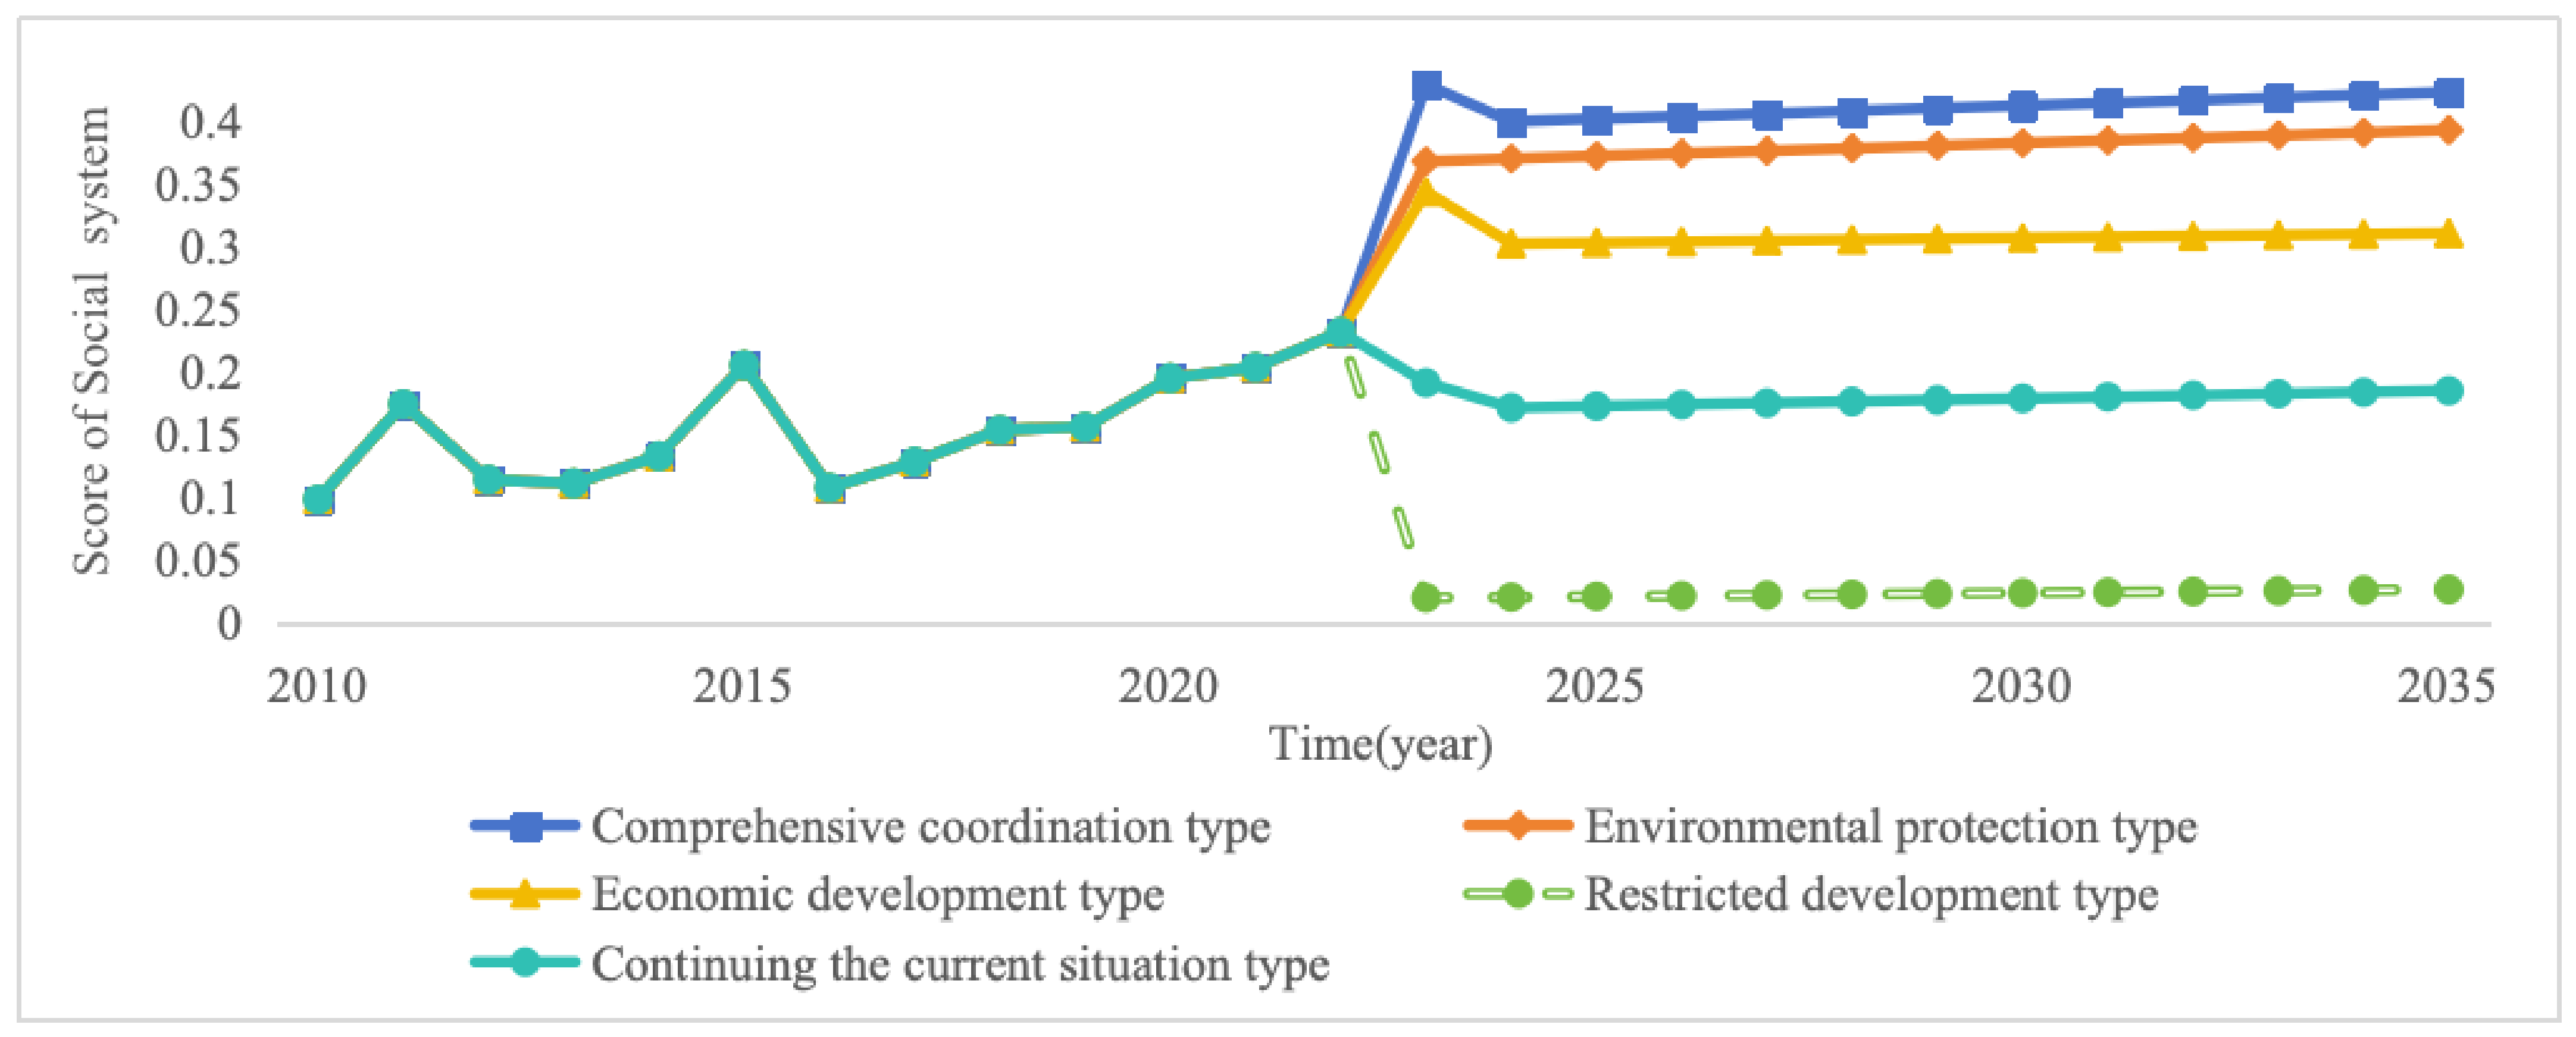
Regarding the social-system score, the scenario trajectories diverge after the transition from historical behavior: integrated coordination, environmental protection, and economic development increase, and status quo declines initially and then recovers slightly, whereas restrictive development drops sharply and exhibits only a limited recovery. The ranking at the end of the simulation—integrated coordination, environmental protection, economic development, status quo, and restrictive development—primarily reflects scenario differences in research support, aquatic-technology promotion, and pollution-control inputs. We interpret this pattern as a scenario-conditioned composite-index result, not as a fully endogenous or emergent social trajectory. Governance quality, allocation conflicts, regulatory lags, and institutional friction are not represented as feedback equations in the current model.
The corresponding social-system trajectories are shown in Figure 5.
Figure 5.
Score trends for the social system (2010–2035).
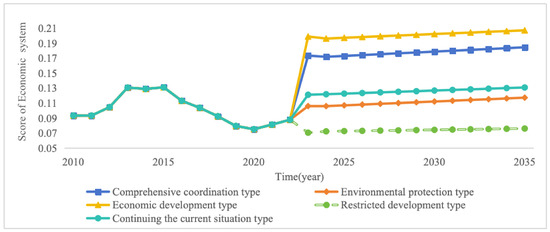
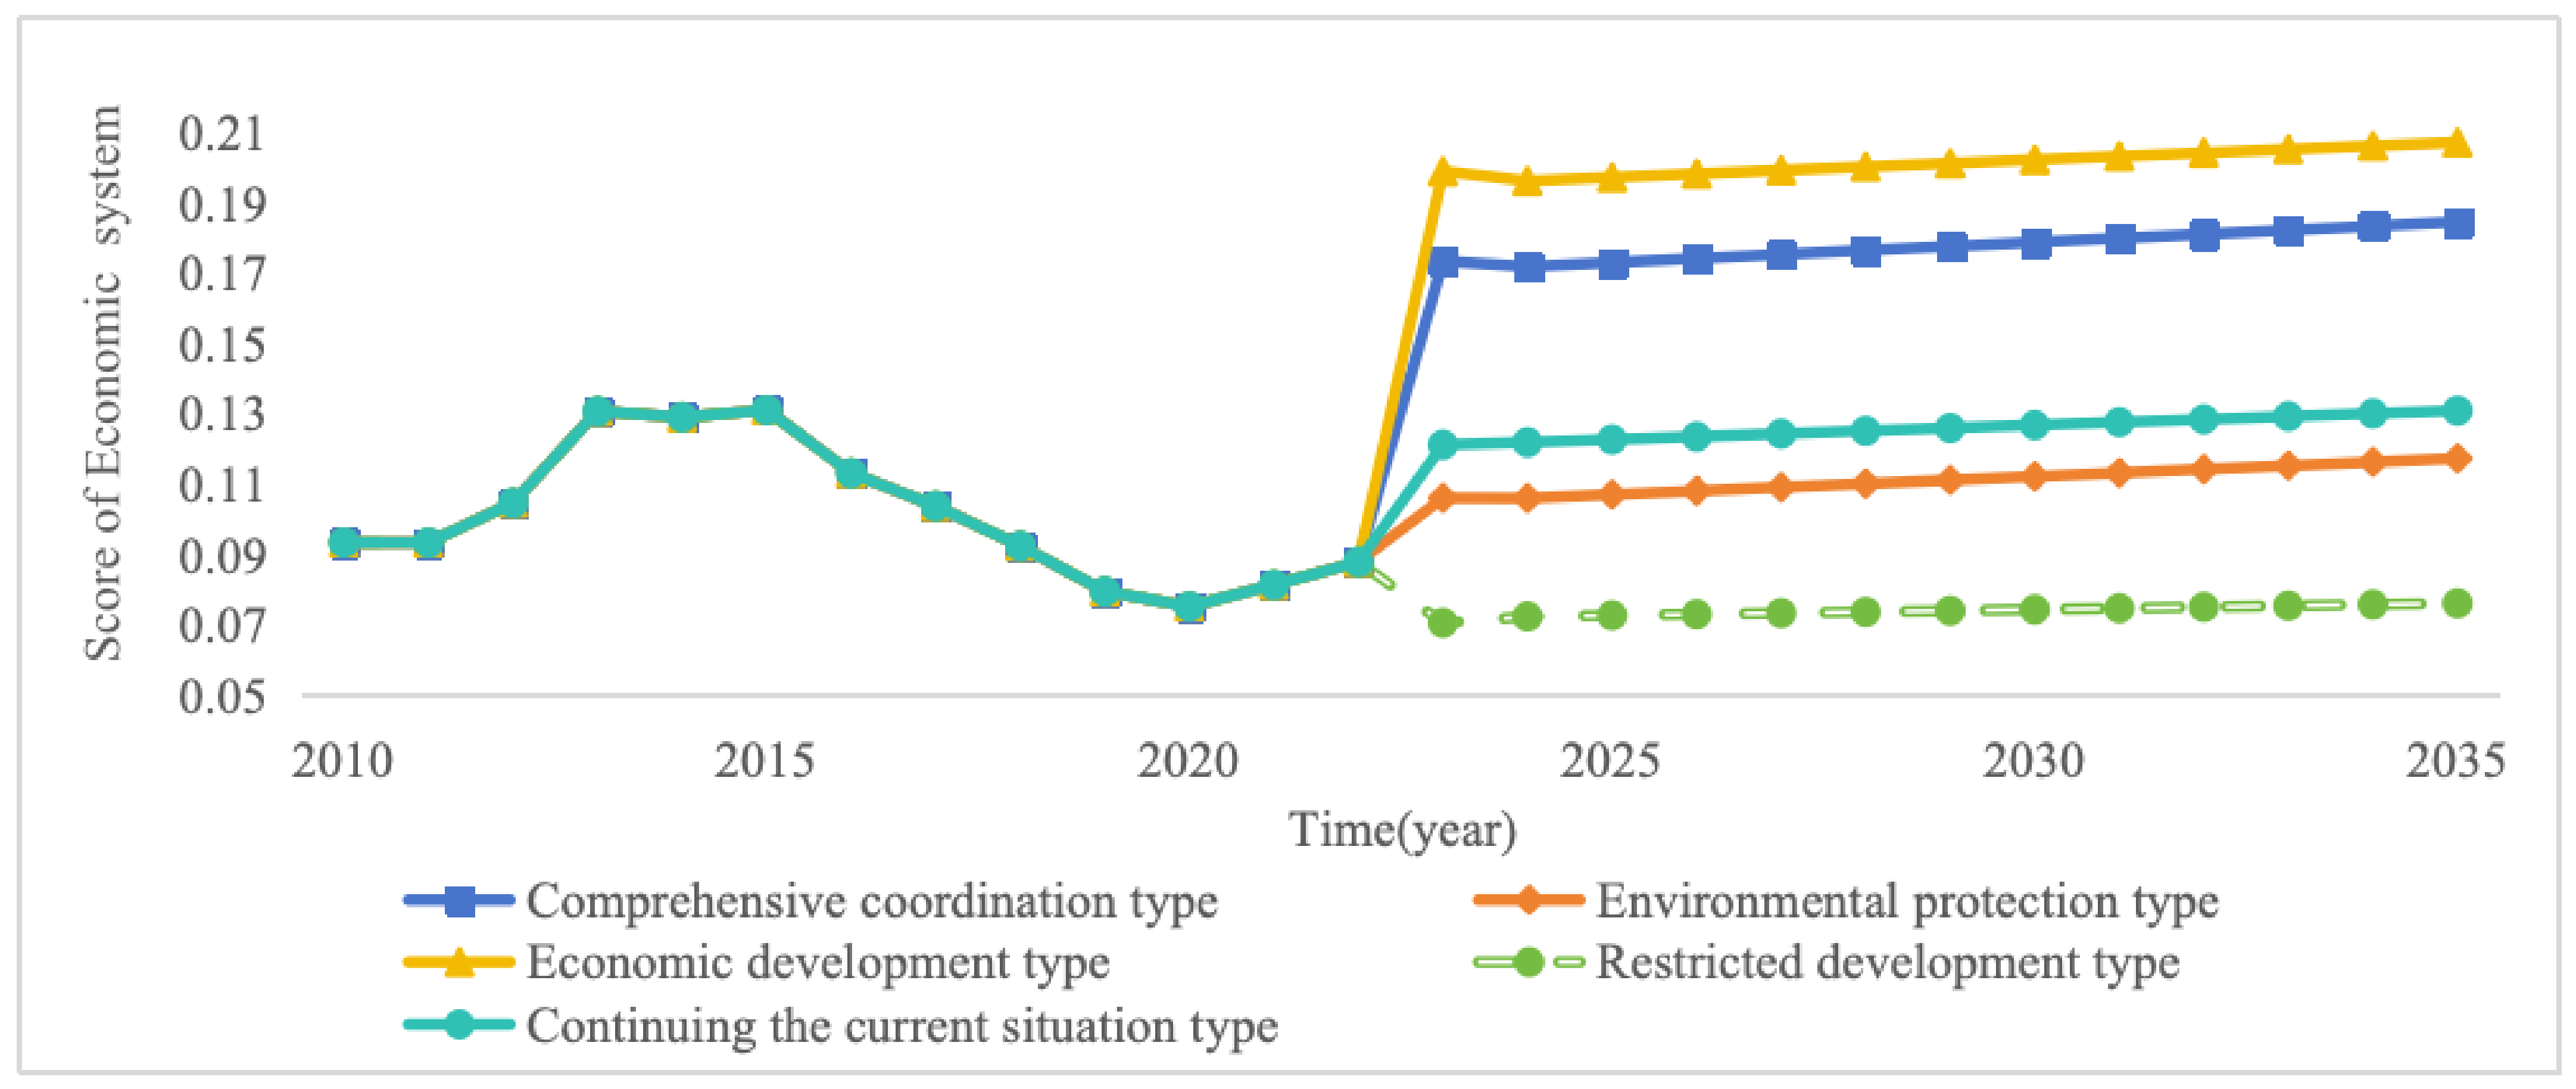
Regarding the economic-system score, the non-restrictive scenarios generally increase after the scenario transition, whereas restrictive Development shows an initial decline followed by a slow recovery. The economic development scenario ranks the highest, followed by integrated coordination, status quo, environmental protection, and restrictive development. The score of the economic system is correlated with the level of resource input and economic output. The economic development scenario, which, policy-wise, encourages the growth of capture fisheries and aquaculture, has a higher proportion of production-factor inputs. Consequently, it yields more marine aquatic products and processed goods and also achieves a higher per capita fishery output value and a greater growth rate in fishery output value. At the same time, because this scenario places less emphasis on investment in environmental pollution control, its recreational fishery output value is lower compared to the integrated coordination and environmental protection scenarios. However, since the overall scale of the recreational fishery is relatively small, the differences among the scenarios in this regard are minor and have a limited impact on the total economic-system score. Therefore, the economic development scenario still achieves the highest overall score (Figure 6).
Figure 6.
Score trends for the economic system (2010–2035).
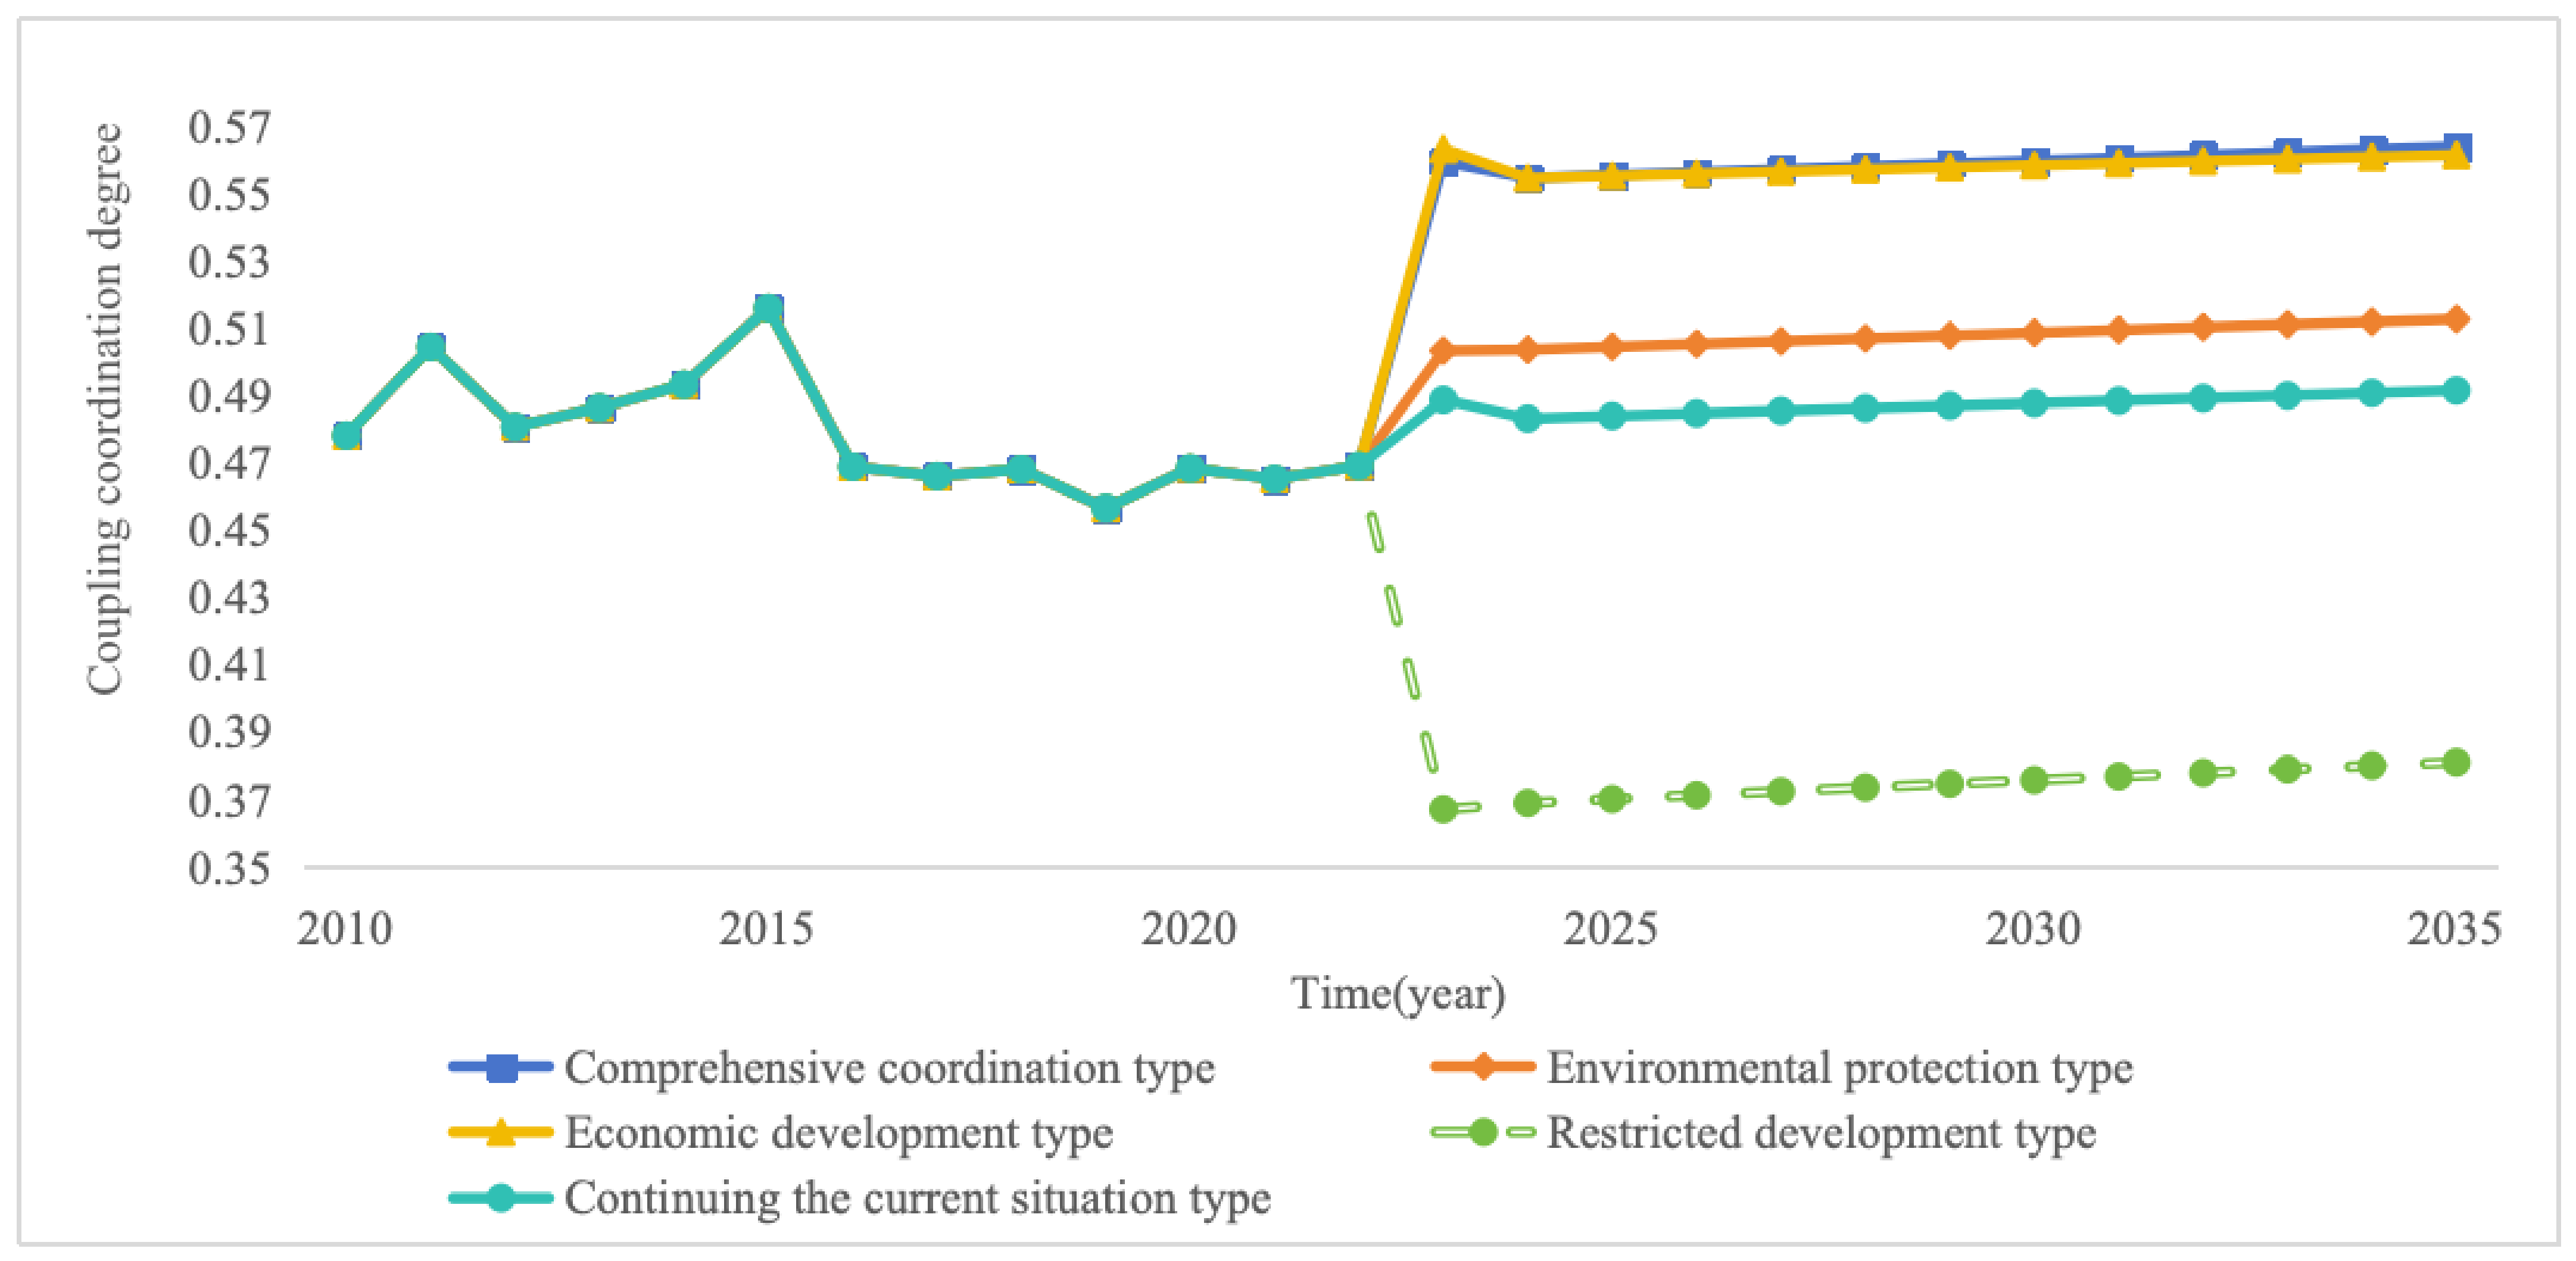
Within the adopted index-construction procedure, the Integrated coordination scenario has the highest modeled coupling-coordination value, closely followed by the economic development scenario. The environmental protection and status quo scenarios rank next, with the restrictive development scenario being the lowest. These differences reflect the performance of the three subsystems under the specified scenario assumptions and should not be interpreted as independently calibrated absolute coordination levels.
Under the index-construction procedure adopted in this study, the 2023–2035 mean coupling-coordination values are 0.559, 0.558, and 0.507 for the integrated coordination, economic development, and environmental protection scenarios, respectively. The corresponding values are 0.487 for the status quo scenario and 0.374 for the restrictive development scenario (Figure 7). These values provide conditional within-study comparisons and should not be read as precise forecasts of absolute coordination levels.
Figure 7.
Trend changes in the coupling-coordination degree of the system (2010–2035).
Within the simulated scenarios, the integrated coordination setting yields the highest average annual increase in the modeled index at 0.761 (Table 7). This comparison should not be extrapolated beyond the stated assumptions.
Table 7.
Average annual increase in coupling-coordination degree under different scenarios.
5. General Discussion
5.1. Summary of Findings
Marine fisheries play a crucial role in regulating climate, maintaining social stability, and driving the high-quality development of the fishery economy. The coupling coordination of the three systems—ecological, social, and economic—embodies the concept of high-quality blue-economy development. Based on the analysis of the coupling-coordination mechanism and degree of the ecological–social–economic system in China’s marine fisheries, this study draws the following main conclusions:
Our findings also speak to several themes discussed in international fisheries research. International evidence has linked sustainable-development efforts with green productivity in national marine fisheries [12]; global governance research emphasizes institutional coordination and governance capacity in fisheries management [27]; and U.S. case studies have examined renewable-energy and energy-efficiency pathways in fisheries and aquaculture [32]. These studies provide contextual comparison rather than direct validation of our indicators or scenario rankings because their accounting boundaries and research designs differ.
First, from the perspective of the Ecological System, the modeled ecological-system score is currently more sensitive to the capture-related component than to the aquaculture-related component. Under the adopted accounting boundary, the lower score of the environmental protection scenario partly reflects the reduction in the harvest-mediated removal indicator when capture is restricted, while fishing-vessel and processing emissions are also included in the ecological subsystem. This accounting result should not be interpreted as evidence that relaxing capture restrictions improves ecosystem health. These score differences describe trade-offs within the adopted accounting framework rather than a recommendation to expand capture. Accordingly, management should promote lower-emission aquaculture, improve the efficiency and structure of capture fisheries, and strengthen ecological conservation while considering stock sustainability and other ecological constraints.
Second, from the perspective of the social and economic systems, with relatively small changes in indicators like population and output-value growth rates, the overall scores of the socio-economic systems can be improved. This is achieved by increasing investment in scientific research and aquatic technology promotion, raising inputs of production factors such as fixed assets and mariculture area to boost the scale and efficiency of seafood output, and emphasizing investment in environmental pollution control.
Third, regarding the trend and average annual increase in the overall system coupling-coordination degree, within the stated scenario and index-construction assumptions, the five scenarios illustrate the trade-off represented in the model. The integrated coordination scenario has the highest average annual increase, followed by economic development, environmental protection, status quo, and restrictive development. This pattern should be interpreted as a conditional comparison within the model rather than as a general prescription or a validated forecast.
5.2. Policy Implications
Based on the conclusions above, the following policy recommendations are proposed:
First, from the emission-reduction perspective, the optimization, transformation, and upgrading of the marine capture fishery industry should be prioritized. This can effectively shift China’s marine fishery from an extensive to an intensive growth model. Key aspects include the following: (1) Upgrading capture vessel equipment. China has a large number of fishing vessels with outdated equipment, which creates greater pressure for emission reduction. Relevant fishery departments should plan for equipment upgrades and encourage fishing entities to replace obsolete vessels. (2) Strengthening the R&D and promotion of energy-saving equipment for fishing vessels. This involves improving standards for fuel-saving products and enhancing market-access supervision and certification to ensure their effectiveness. R&D costs should be shared between stakeholders and the government. From the ecological-accounting perspective, lower-emission aquaculture development and the construction of a carbon-accounting system should be encouraged. Under the guiding principle of ‘prioritizing aquaculture over capture’, promoting shellfish and algae farming can support lower-emission aquaculture development within the adopted accounting framework; this statement does not treat capture-related biological-carbon removal as permanent sequestration or as a substitute for ecological conservation. At the same time, modern aquaculture models centered on marine ranching should be emphasized. Driven by informatization and intelligent systems, the construction of a comprehensive ecological system for marine fisheries should be explored and improved.
Second, a balance between ecological protection and economic development in marine fisheries must be maintained. The new development philosophy emphasizes that ‘lucid waters and lush mountains are invaluable assets’. The coupling coordination of the system requires a comprehensive balance among biological resources, ecological pressure, and the pace of human development. Increases in resource inputs should be predicated on the achievement of ‘low energy consumption and high output’. This can be approached from several angles: (1) focus on the source of production; (2) reduce the discharge of waste and pollutants and promote the circular use of marine biological resources; or (3) establish large-scale, standardized mariculture systems to simultaneously promote economies of scale and increase the benefits of aquaculture carbon sinks.
Third, it is essential to cultivate a high-quality, professional workforce and prioritize investment in scientific research and technology promotion. Building a strong talent pool is the foundation for strengthening the nation’s marine capabilities (“thriving through the sea”). Universities, government, and enterprises should be encouraged to actively participate in the reforming of talent cultivation models and establish a talent reserve for marine technology. Investment in scientific research is vital in motivating researchers and advancing fishery technology, while technology promotion is a critical prerequisite for the implementation of these innovations. This includes the development of novel aquaculture techniques to improve product quality and reduce environmental pressure, with a focus on the establishment of demonstration zones to promote the dissemination of advanced technologies.
5.3. Limitations and Future Research
This study has limitations. First, the ecological subsystem uses a harvest-mediated biological-carbon removal indicator within the adopted accounting boundary. It excludes fish-stock depletion, trophic interactions, food-web effects, ecosystem carrying capacity, post-harvest pathways, and storage permanence. Biological carbon fixation or removal alone does not demonstrate long-term sequestration [41]; the indicator is neither permanent climate sequestration nor evidence that higher capture benefits ecosystem health.
Second, policy factors and selected inputs are specified exogenously. Although selected production feedback is included, the model does not simulate adaptive policy responses to ecological conditions. The social subsystem uses proxies and scenario paths; governance quality, conflicts, regulatory delays, enforcement heterogeneity, and institutional friction are not modeled as feedback. Future work should integrate stock dynamics, delays, state-dependent policy rules, and governance data.
Third, the fixed composition-weighted coefficient for shellfish and algae may not capture annual conversion changes when production shares shift substantially. Future work should use annual category-specific outputs and time-varying aggregation where data permit.
Fourth, Table 6 provides an in-sample check over 2010–2022, not independent out-of-sample validation. The index’s absolute level depends on the horizon’s normalization extrema and stated construction procedure. This revision conducts no hold-out, fixed-baseline, or time-window sensitivity analysis; scenario results are conditional comparisons, not validated forecasts or invariant absolute coordination levels.
Author Contributions
Conceptualization, J.D., B.Y., W.L. and X.D.; methodology, J.D., B.Y., W.L. and X.D.; writing—original draft preparation, J.D., B.Y., W.L. and X.D.; writing—review and editing, B.Y., W.L. and X.D.; supervision, J.D. and B.Y. All authors have read and agreed to the published version of the manuscript.
Funding
This work was supported by the National Social Science Foundation of China (Grant Nos. 22&ZD126 and 20&ZD100) and the Guangdong Provincial Education Science Planning Project (Grant No. 2022WTSCX035).
Data Availability Statement
The datasets generated during and/or analyzed during the current study are available from the corresponding author upon reasonable request.
Conflicts of Interest
The authors declare no conflicts of interest.
Appendix A. Stock-and-Flow Diagram
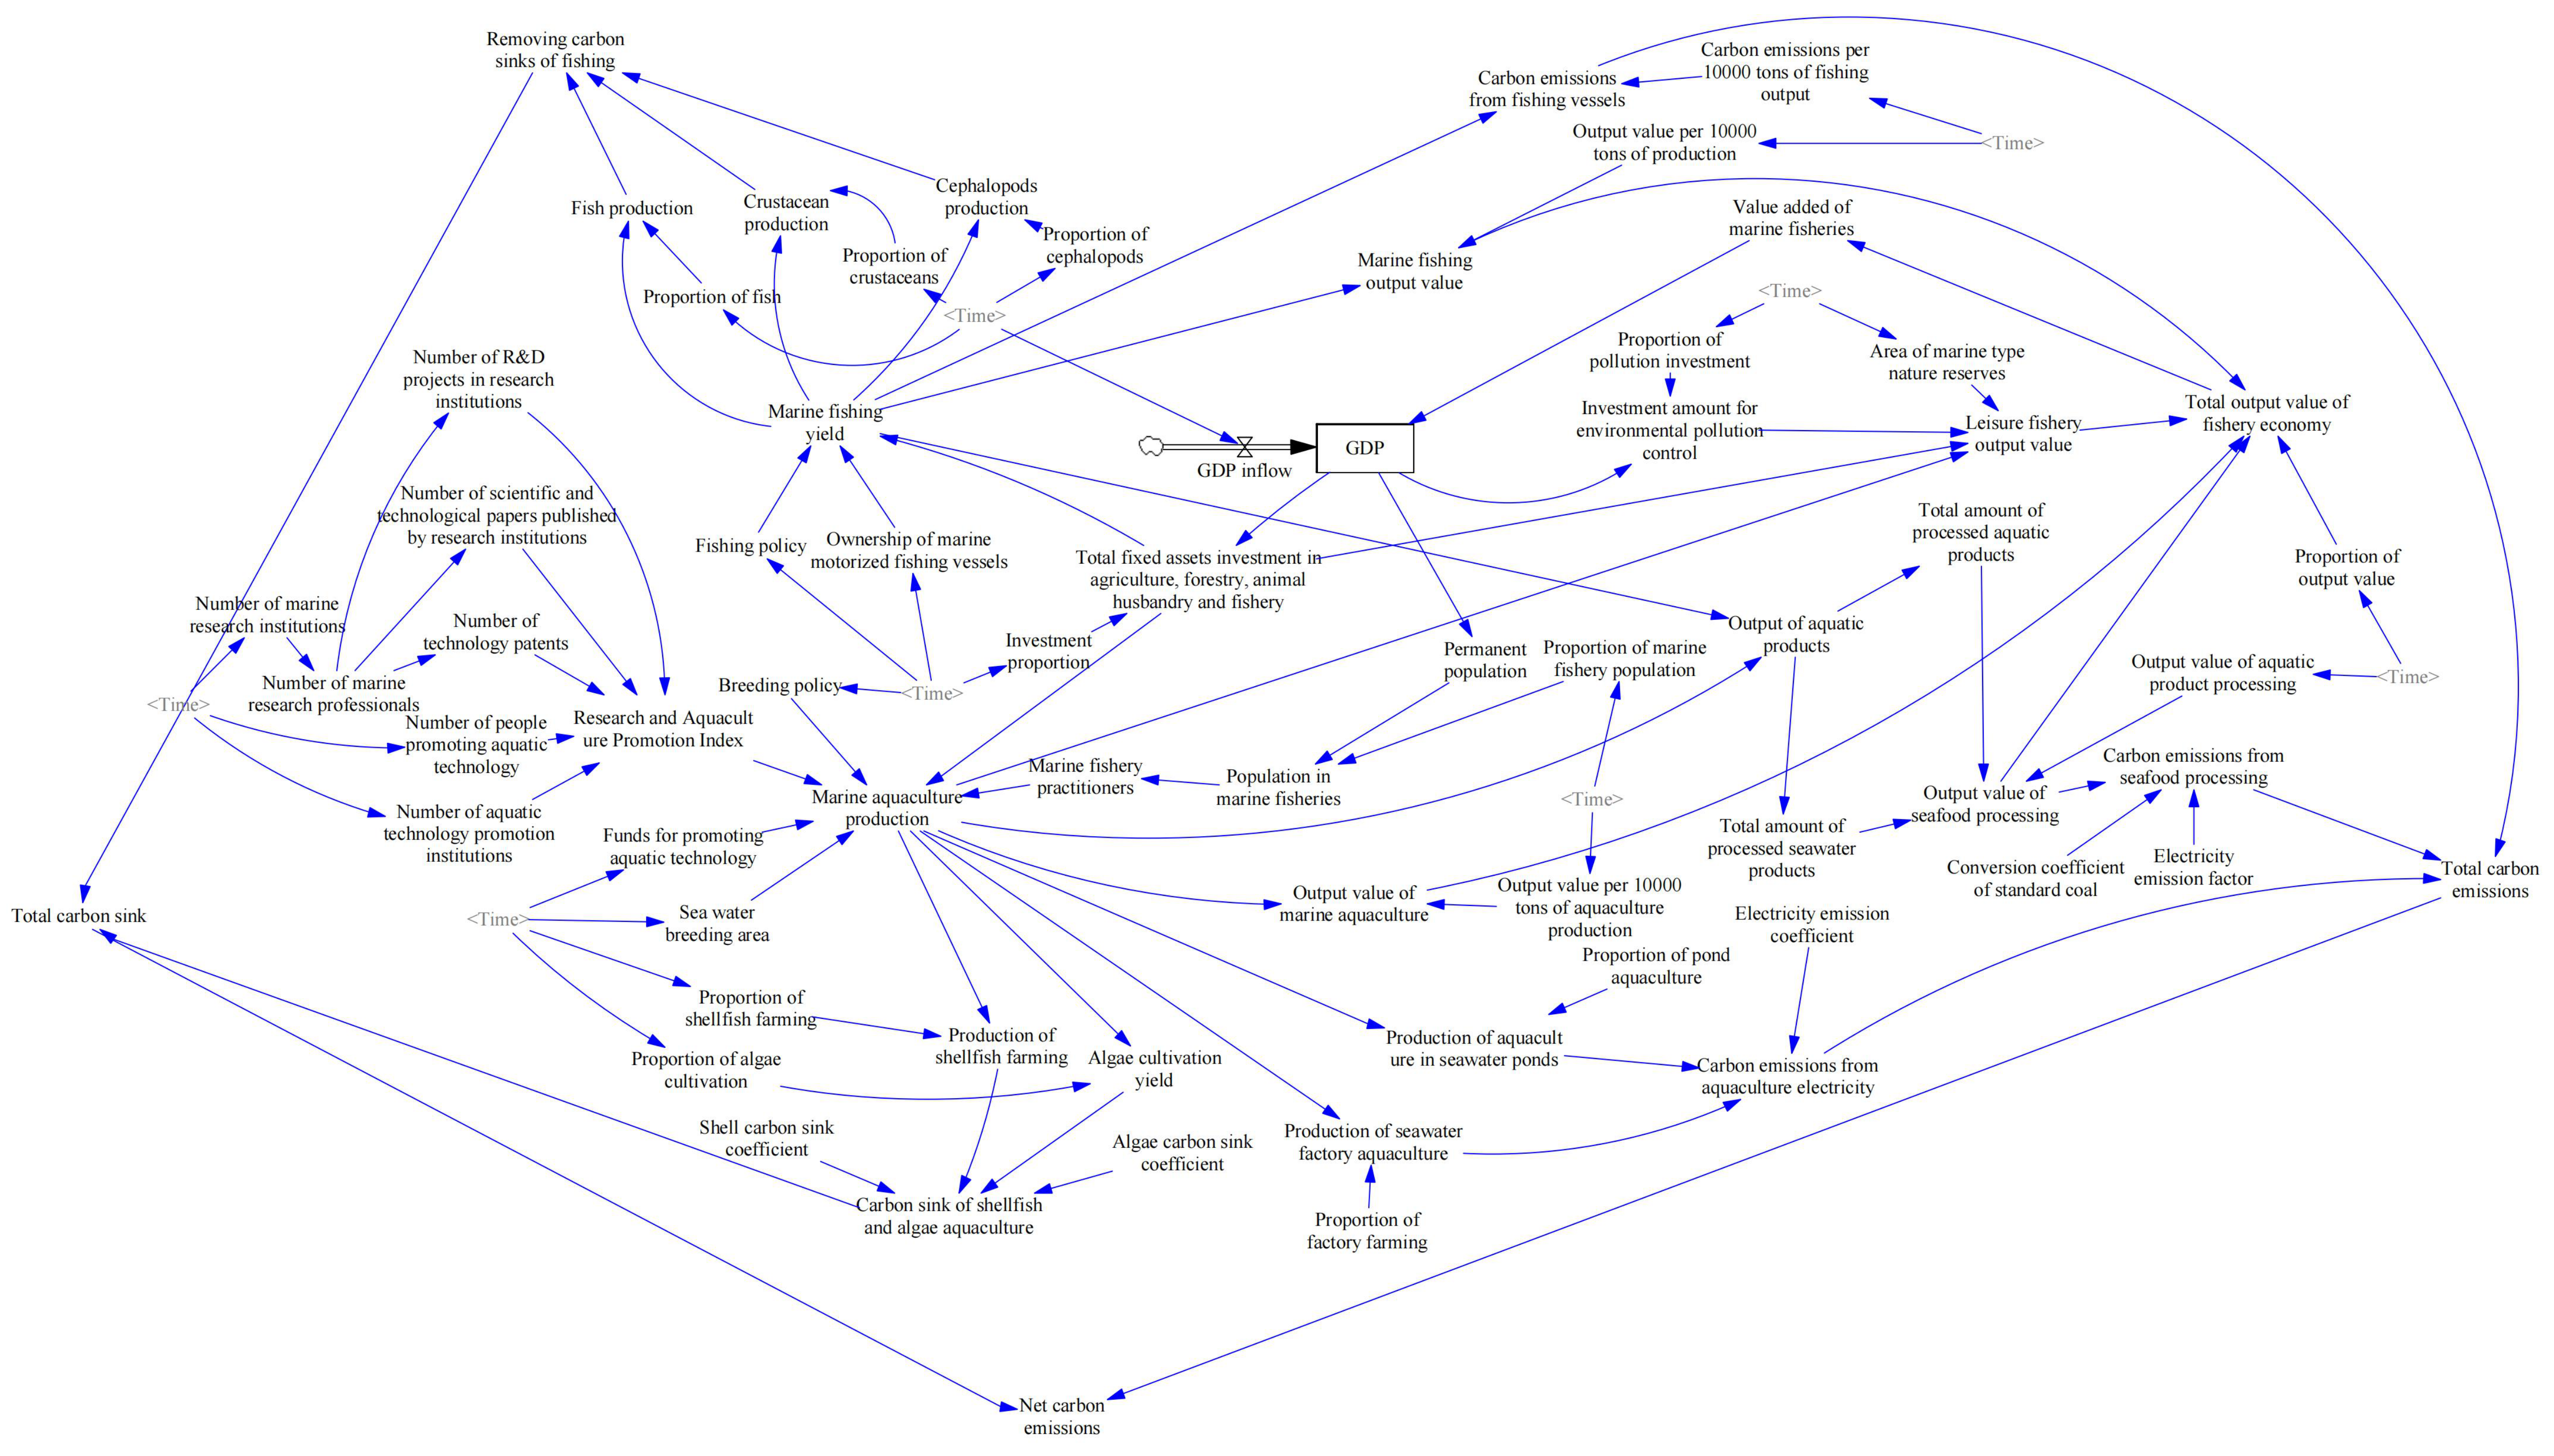
Figure A1.
Stock-and-flow diagram of the ecological–social–economic system for China’s marine fisheries. The diagram presents the variables, information links, and feedback relationships implemented in the system-dynamics model; detailed equations are reported in Table 4.
References
- Gao, Y.; Fu, Z.; Yang, J.; Yu, M.; Wang, W. Spatial–Temporal Differentiation and Influencing Factors of Marine Fishery Carbon Emission Efficiency in China. Environ. Dev. Sustain. 2024, 26, 453–478. [Google Scholar] [CrossRef] [Scilit]
- Wang, Y.; Khan, S.U.; Kong, D.; Xu, R.; Zhang, Y. Navigating the Dual Currents: Advanced Insights into Carbon Emissions and Economic Growth in China’s Coastal Marine Fisheries. Mar. Pol. 2025, 177, 106671. [Google Scholar] [CrossRef] [Scilit]
- Kong, F.; Cui, W. Ecological Sustainability of Marine Fishery in Coastal Countries of the “Belt and Road”: Spatial–Temporal Features and Future Predictions. Environ. Dev. Sustain. 2026, 28, 12845–12871. [Google Scholar] [CrossRef] [Scilit]
- Thrush, S.F.; Hewitt, J.E.; Gladstone-Gallagher, R.V.; Savage, C.; Lundquist, C.; O’Meara, T.; Vieillard, A.; Hillman, J.R.; Mangan, S.; Douglas, E.J.; et al. Cumulative Stressors Reduce the Self-regulating Capacity of Coastal Ecosystems. Ecol. Appl. 2021, 31, e02223. [Google Scholar] [CrossRef] [Scilit] [PubMed]
- Alsaleh, M.; Abdul-Rahim, A.S. What Are the Influence of Fishery Activities and Their Implication on Marine Water Pollution? An Empirical Analysis. Environ. Dev. Sustain. 2026, 28, 15063–15094. [Google Scholar] [CrossRef] [Scilit]
- Song, M.; Fatima, S.; Ullah, E.; Haseeb, M.; Hossain, M.E. Environmental Impacts of Aquaculture, Marine Shipping, and Blue R&D in Nordic Countries. Environ. Dev. Sustain. 2025; early access. [CrossRef] [Scilit]
- Greer, K.; Zeller, D.; Woroniak, J.; Coulter, A.; Winchester, M.; Palomares, M.L.D.; Pauly, D. Global Trends in Carbon Dioxide (CO2) Emissions from Fuel Combustion in Marine Fisheries from 1950 to 2016. Mar. Policy 2019, 107, 103382. [Google Scholar] [CrossRef] [Scilit]
- Guan, H.; Chen, Y.; Zhao, A. Carbon Neutrality Assessment and Driving Factor Analysis of China’s Offshore Fishing Industry. Water 2022, 14, 4112. [Google Scholar] [CrossRef] [Scilit]
- Jia, D.; Liu, X.; Guan, X.; Guo, J.; Zhang, S.; Li, H.; Jin, Y.; Sun, J. Spatio-temporal Differences and Simulation Studies of the Carbon Budget from Fisheries in the Northern Marine Economic Circle of China. Front. Mar. Sci. 2024, 11, 1393659. [Google Scholar] [CrossRef] [Scilit]
- Feng, C.; Ye, G.; Jiang, Q.; Zheng, Y.; Chen, G.; Wu, J.; Feng, X.; Si, Y.; Zeng, J.; Li, P.; et al. The Contribution of Ocean-Based Solutions to Carbon Reduction in China. Sci. Total Environ. 2021, 797, 149168. [Google Scholar] [CrossRef] [Scilit] [PubMed]
- Liu, F.; Huang, Y.; Zhang, L.; Li, G. Marine Environmental Pollution, Aquatic Products Trade and Marine Fishery Economy—An Empirical Analysis Based on Simultaneous Equation Model. Ocean Coast. Manag. 2022, 222, 106096. [Google Scholar] [CrossRef] [Scilit]
- Phan, K.-T.; Hsu, Y.-L.; Chen, S.-H. Do Sustainable Development Goals (SDGs) Boost Green Productivity in National Marine Fisheries? International Evidence. Mar. Coast. Fish. 2024, 16, e10322. [Google Scholar] [CrossRef] [Scilit]
- Ren, W. Study on the Removable Carbon Sink Estimation and Decomposition of Influencing Factors of Mariculture Shellfish and Algae in China—A Two-Dimensional Perspective Based on Scale and Structure. Environ. Sci. Pollut. Res. 2021, 28, 21528–21539. [Google Scholar] [CrossRef] [Scilit] [PubMed]
- Williams, C.; Rees, S.; Sheehan, E.V.; Ashley, M.; Davies, W. Rewilding the Sea? A Rapid, Low Cost Model for Valuing the Ecosystem Service Benefits of Kelp Forest Recovery Based on Existing Valuations and Benefit Transfers. Front. Ecol. Evol. 2022, 10, 642775. [Google Scholar] [CrossRef] [Scilit]
- Le, J.; Wei, Y. Green Efficiency Measurement of Seaweed Culture in China under the Double Carbon Target. Sustainability 2023, 15, 7683. [Google Scholar] [CrossRef] [Scilit]
- Li, G.; Tan, C.; Zhang, W.; Zheng, W.; Liu, Y. Carbon Emission Efficiency, Technological Progress, and Fishery Scale Expansion: Evidence from Marine Fishery in China. Sustainability 2023, 15, 6331. [Google Scholar] [CrossRef] [Scilit]
- Zhang, Y.; Khan, S.U.; Wang, Y. The Future Is Digital: Can the Digital Economy Drive Marine Sustainability? Exploring Regional Impacts on Fisheries’ Carbon Emissions in Coastal China. J. Clean. Prod. 2025, 506, 145518. [Google Scholar] [CrossRef] [Scilit]
- Aranda-Garrido, N.; Martínez-Martínez, P.; Antón-Linares, I.; Abel-Abellán, I.; Encabo-Lucena, S.; Arroyo-Martínez, E.; Trives-Escudero, M.; Barberá-Cebrián, C.; Giménez-Casalduero, F. Profile of Marine Sport Fishers and Interannual Variation in Coastal Catches in Southeastern Spain. Fishes 2026, 11, 402. [Google Scholar] [CrossRef] [Scilit]
- Chen, X.; Di, Q.; Hou, Z.; Yu, Z. Measurement of Carbon Emissions from Marine Fisheries and System Dynamics Simulation Analysis: China’s Northern Marine Economic Zone Case. Mar. Policy 2022, 145, 105279. [Google Scholar] [CrossRef] [Scilit]
- Wang, Y.; Yang, Y.; Ren, Q. Comprehensive Estimation and Spatiotemporal Differentiation of Marine Fishery Carbon Sinks in China’s Coastal Provinces. Ocean Coast. Manag. 2025, 269, 107846. [Google Scholar] [CrossRef] [Scilit]
- He, L.; Du, X.; Zhao, J.; Chen, H. Exploring the Coupling Coordination Relationship of Water Resources, Socio-Economy and Eco-Environment in China. Sci. Total Environ. 2024, 918, 170705. [Google Scholar] [CrossRef] [Scilit] [PubMed]
- Wang, N.; Li, J.-M.; Zhou, Y.-F. Mechanism of Action of Marine Ecological Restoration on Ecological, Economic, and Social Benefits—An Empirical Analysis Based on a Structural Equation Model. Ocean Coast. Manag. 2024, 248, 106950. [Google Scholar] [CrossRef] [Scilit]
- Zhang, J.; Chen, J.; Gao, G.; Lv, M. Decoding Carbon Emissions in China’s Marine Fisheries: Trends, Drivers, and Pathways to Sustainability. J. Clean. Prod. 2025, 520, 146101. [Google Scholar] [CrossRef] [Scilit]
- Wang, B.; Han, L.; Zhang, H. The Impact of Regional Industrial Structure Upgrading on the Economic Growth of Marine Fisheries in China—The Perspective of Industrial Structure Advancement and Rationalization. Front. Mar. Sci. 2021, 8, 693804. [Google Scholar] [CrossRef] [Scilit]
- Liu, G.; Xu, Y.; Ge, W.; Yang, X.; Su, X.; Shen, B.; Ran, Q. How Can Marine Fishery Enable Low Carbon Development in China? Based on System Dynamics Simulation Analysis. Ocean Coast. Manag. 2023, 231, 106382. [Google Scholar] [CrossRef] [Scilit]
- Alsaleh, M.; Yang, Z. The Evolution of Information and Communications Technology in the Fishery Industry: The Pathway for Marine Sustainability. Mar. Pollut. Bull. 2023, 193, 115231. [Google Scholar] [CrossRef] [Scilit] [PubMed]
- González Laxe, F.; Bermúdez, F.M.; Palmero, F.M.; Novo-Corti, I. Governance of the Fishery Industry: A New Global Context. Ocean Coast. Manag. 2018, 153, 33–45. [Google Scholar] [CrossRef] [Scilit]
- Nguyen, T.V.; Hoang, N.K. How Economic Policies and Development Impact Marine Fisheries: Lessons Learned from a Transitional Economy. Ecol. Econ. 2024, 225, 108314. [Google Scholar] [CrossRef] [Scilit]
- Morosini, P. Industrial Clusters, Knowledge Integration and Performance. World Dev. 2004, 32, 305–326. [Google Scholar] [CrossRef] [Scilit]
- Yu, J.; Zhang, L. Evolution of Marine Ranching Policies in China: Review, Performance and Prospects. Sci. Total Environ. 2020, 737, 139782. [Google Scholar] [CrossRef] [Scilit] [PubMed]
- Yu, J.; Yan, T.; Ma, X. Evolution of Support Policies for the Development of Distant-Water Fishing Bases in China: Review, Performance, Challenges and Prospects. Mar. Policy 2025, 171, 106489. [Google Scholar] [CrossRef] [Scilit]
- Scroggins, R.E.; Fry, J.P.; Brown, M.T.; Neff, R.A.; Asche, F.; Anderson, J.L.; Love, D.C. Renewable Energy in Fisheries and Aquaculture: Case Studies from the United States. J. Clean. Prod. 2022, 376, 134153. [Google Scholar] [CrossRef] [Scilit]
- Feng, J.-C.; Sun, L.; Yan, J. Carbon Sequestration via Shellfish Farming: A Potential Negative Emissions Technology. Renew. Sustain. Energy Rev. 2023, 171, 113018. [Google Scholar] [CrossRef] [Scilit]
- Li, W.; Li, X.; Song, C.; Gao, G. Carbon Removal, Sequestration and Release by Mariculture in an Important Aquaculture Area, China. Sci. Total Environ. 2024, 927, 172272. [Google Scholar] [CrossRef] [Scilit] [PubMed]
- Zheng, S.; Yu, L. The Government’s Subsidy Strategy of Carbon-Sink Fishery Based on Evolutionary Game. Energy 2022, 254, 124282. [Google Scholar] [CrossRef] [Scilit]
- Wang, Y.; Yang, Y.; Hu, X. The Evolution and Effectiveness of China’s Marine Carbon Sink Fishery Policies. Ocean Coast. Manag. 2024, 259, 107470. [Google Scholar] [CrossRef] [Scilit]
- Thébaud, O.; Nielsen, J.R.; Motova, A.; Curtis, H.; Bastardie, F.; Blomqvist, G.E.; Daurès, F.; Goti, L.; Holzer, J.; Innes, J.; et al. Integrating Economics into Fisheries Science and Advice: Progress, Needs, and Future Opportunities. ICES J. Mar. Sci. 2023, 80, 647–663. [Google Scholar] [CrossRef] [Scilit]
- Wang, S.; Li, W.; Xing, L. A Review on Marine Economics and Management: How to Exploit the Ocean Well. Water 2022, 14, 2626. [Google Scholar] [CrossRef] [Scilit]
- Yan, A.; Guo, R.; Wang, Q.; Liu, Y.; Fu, X.; Yin, Q. The Development of Chinese Land-Raised Seafood Industry under Japanese Nuclear Wastewater Discharge into the Sea: Considering the Effects of Government Subsidy, Consumer Preference and Product Safety. Ocean Coast. Manag. 2025, 266, 107687. [Google Scholar] [CrossRef] [Scilit]
- Zhao, Y.; Li, Y. Blue Transition for Sustainable Marine Fisheries: Critical Drivers and Evidence from China. J. Clean. Prod. 2023, 421, 138535. [Google Scholar] [CrossRef] [Scilit]
- Hurd, C.L.; Law, C.S.; Bach, L.T.; Britton, D.; Hovenden, M.; Paine, E.R.; Raven, J.A.; Tamsitt, V.; Boyd, P.W. Forensic Carbon Accounting: Assessing the Role of Seaweeds for Carbon Sequestration. J. Phycol. 2022, 58, 347–363. [Google Scholar] [CrossRef] [Scilit] [PubMed]

Disclaimer/Publisher’s Note: The statements, opinions and data contained in all publications are solely those of the individual author(s) and contributor(s) and not of MDPI and/or the editor(s). MDPI and/or the editor(s) disclaim responsibility for any injury to people or property resulting from any ideas, methods, instructions or products referred to in the content. |
© 2026 by the authors. Licensee MDPI, Basel, Switzerland. This article is an open access article distributed under the terms and conditions of the Creative Commons Attribution (CC BY) license.