


Abstract
Reliable developmental benchmarks are essential for synchronizing incubation and first-feeding decisions in striped bass (Morone saxatilis) hatcheries, yet existing references are incomplete, outdated, or difficult to apply across variable temperature regimes. We developed contemporary embryo and larval developmental staging guides for striped bass using digital imaging and degree day standardization and paired these guides with measurements of early larval mortality and endogenous energy depletion to provide practical context for hatchery management. Larvae were photographed from hatch through metamorphosis to document key morphological transitions, including yolk absorption, mouth formation, swim bladder inflation, fin differentiation, pigmentation, and diet-related developmental milestones. To place these stages in physiological and survival context, aquarium trials showed there was no clear density-dependent mortality across rearing densities of 1.1–6.8 larvae/mL within the first 72 h post-hatch. Yolk reserves were typically depleted by approximately 4–6 days post-hatch (dph), while lipid droplets persisted longer as secondary endogenous energy stores in unfed larvae through 15 dph. Together, these staging guides provide a transferable developmental framework from fertilization to metamorphosis that links external morphology to endogenous reserve depletion and first feeding, thus supporting standardized hatchery monitoring, improved feeding synchronization, and more consistent assessment of embryo and larval quality.
Key Contribution:
This work integrates morphological staging, endogenous energy utilization, and mortality analyses to create a comprehensive developmental framework for striped bass from fertilization through metamorphosis. Degree-day normalization enhances cross-hatchery applicability, while identification of the 48-h post-hatch vulnerability window strengthens the link between developmental timing and larval survival.
1. Introduction
The early life history of striped bass (Morone saxatilis) includes a series of stages that are sensitive to both internal physiological processes and external environmental conditions. Understanding these developmental stages is integral to improving hatchery management. Early life stages represent one of the most critical developmental bottlenecks in finfish aquaculture [1,2,3], because small discrepancies can result in decreased survival and substantial losses to a cohort. As the global seafood demand continues to rise, finfish aquaculture must increase its production efficiency and sustainability to meet the nutritional needs of a growing human population. Achieving these goals depends on overcoming biological constraints during the earliest phases of development where mortality and deformities are most prevalent [4,5,6].
Standardized detailed developmental embryo and larval staging guides are essential tools for hatcheries and researchers. They allow consistent monitoring of fertilization success, synchronization of feeding schedules, and early identification of deformities or abnormal growth. Without such guides, rearing protocols vary between facilities, leading to inconsistent growth, higher mortality, and reduced production efficiency. Developmental guides have been created for other aquaculture species such as zebrafish and various flounder [4,7,8]. These guides have advanced research outcomes by linking morphological and physiological transitions to environmental conditions, enabling others to conduct experiments using common developmental reference points. Additionally, embryonic development has been described in detail for related finfish within the family Moronidae, like European sea bass (Dicentrarchus labrax), and these studies provide useful reference points for interpreting general developmental progression [9]. However, comparable developmental guides for striped bass remain limited in the literature.
Striped bass are a euryhaline species valued for their rapid growth and large body size, giving them the potential to meet seafood market demands more readily than their hybrid counterparts [10]. Despite advances in selective breeding and spawning control, larval rearing remains one of the most limiting factors in striped bass aquaculture. Fluctuations in early growth and survival have been linked to developmental timing and endogenous energy depletion [11]. Earlier studies on larval Morone species described bone structure development [12], but most were based on wild-caught fish or first-generation cultured stocks and may lack relevance for the domesticated stock now used in aquaculture. Further, many of these publications either provided an incomplete developmental series or were published decades ago in a format where the diagrams or imagery are indistinct and indiscernible [13,14].
While foundational photographic guides have served as references for oocyte maturation and embryo development of striped bass [14,15,16], these resources end prior to larval development. The most detailed striped bass larval developmental guide consisted of hand drawn illustrations created by Mansueti [13] and later referenced in a U.S. Fish and Wildlife Service Biological report [17]. A more recent larval staging guide for hybrid striped bass [18] provided an updated framework with microscopic images but cannot be wholly applied to pure striped bass due to differences in growth rate and morphology between the two types of fish. Furthermore, domesticated striped bass have undergone multiple generations of selective breeding and may exhibit developmental patterns that are perhaps different from populations that older guides are based on.
Without detailed developmental guides, it is difficult to standardize rearing protocols, optimize feeding schedules, and accurately monitor larval conditions during these critical early life stages which can lead to inconsistent growth and higher mortality during culture. Other aquaculture species benefit from comprehensive developmental tables that inform best practices for larval rearing, disease management, and environmental control [19,20,21]. Developmental guides also provide a link between morphology, physiology, and genetics, which can enable more research on selective breeding and growth optimization, as well as developmental biology [22,23].
Establishing guides for striped bass begins with accurately characterizing embryonic development, which progresses following fertilization and is highly temperature dependent. Once ovulated and fertilized, striped bass egg development proceeds rapidly. In hatchery settings, the foundational reference is the photographic embryo staging guide created by Jack D. Bayless and included in Harrell et al. [14] which outlines key morphological milestones based on hours post-fertilization. While foundational for hatchery operations, the guide is missing some critical hourly developmental stages which leave gaps in our understanding of the developmental progression. Rogers et al. [24] quantified striped bass developmental timing under fixed temperature conditions, highlighting the strong influence of temperature on early life stages. Expressing developmental progress using degree days, as done in this study offers a potentially more transferable framework across variable thermal regimes and may improve consistency in staging across hatchery systems.
This study aims to build upon those foundational references by developing contemporary and comprehensive developmental staging guides for striped bass embryos and larvae that integrate degree days to account for temperature differences during incubation. Additionally, this study quantifies larval mortality in rearing aquaria and yolk and lipid or oil droplet consumption by larvae to link morphological progression with internal physiological energy use. Integrating both morphological and physiological aspects provides a more complete understanding of early developmental timing, viability, and susceptibility to mortality in hatchery-reared striped bass.
Standardizing these developmental benchmarks can enhance hatchery precision, allowing for more consistent monitoring of fertilization success, accurate feeding regimes, and survival during the transition from endogenous to exogenous nutrition. Incorporating degree day scaling ensures that this framework can be applied across systems in different geographic regions, while combining embryo/larval staging guides with endogenous/exogenous feeding transitions provides insight into the critical windows of larval vulnerability.
The objectives of this study were to: (1) Quantify larval mortality and yolk sac/lipid droplet (oil globule) depletion to link physiological energy use with developmental stages, determine the timing of peak mortality in aquaria, and evaluate the effects of larval density in aquaria on survival; (2) develop and document an updated embryo staging guide for striped bass incorporating degree days; and (3) create a larval staging guide from hatch through metamorphosis to highlight key morphological and diet transitions. Overall, this research addresses a gap in striped bass aquaculture research by establishing a contemporary and comprehensive developmental guide for embryos and larvae that links morphology, physiology, and hatchery management to improve early survival and production efficiency. We evaluated larval mortality and rearing density that coincided with rapid depletion of endogenous energy reserves. Integrating digital imaging with degree-day standardization clarifies how developmental timing and internal energy use define periods of vulnerability and inform feeding transitions in hatchery-reared striped bass.
2. Materials and Methods
2.1. Batch Spawning and Larval Collection
The domestic striped bass larvae used in the following studies (SB 2024 F8.1 and SB 2025 F8.2) were produced through batch spawning as described by Andersen et al. [25]. Batch spawns used 25 three-year-old males (SB 2021 F7.2 generation; 3.72 ± 0.56 kg weight, 628 ± 88 mm total length, all values given as mean + standard deviation) and 25 four-year-old females (SB 2020 F7.1 generation; 6.92 ± 0.84 kg weight, 741 ± 32 mm total length). All bass were bred in captivity for eight generations as part of the National Program for Genetic Improvement and Selective Breeding for the Hybrid Striped Bass Industry at the North Carolina State University Pamlico Aquaculture Field Laboratory and all studies described herein were also conducted at that site (PAFL, Aurora, NC, USA; 35.360080718666154, −76.71631148945245) [26]. Broodstock were conditioned in ambient photothermal regimes and maintained at 18–20 °C prior to spawning. Mature females were selected using ovarian biopsy (Bayless staging), and males were verified for spermiation. Fertilized eggs were collected via upwelling egg collectors, incubated in McDonald jars (Aquatic Equipment & Design, Mount Dora, FL, USA), and viable swim-up larvae were enumerated by volumetric subsampling.
2.2. Larval Mortality and Yolk Consumption
An exploratory density assessment and a developmental monitoring study were conducted to: (1) characterize mortality patterns of striped bass larvae in aquaria within the first three (72 h) days post-hatch (dph) across ten larval densities (larvae/mL) ranging from 1.1 to 6.8 larvae/mL and (2) characterize yolk sac absorption in larvae exclusively reared in aquaria up to 15 dph. For the mortality experiments, striped bass larvae were contained in ten approximately 90 L aquaria. At hatch, larvae were counted by collecting three random volumetric (30–50 mL) subsamples from each aquarium, slowly pouring the samples back into a pan, and counting living larvae with a handheld click counter. The larvae/mL was calculated for each sample and then averaged across the three samples from each aquarium. The average larvae/mL was multiplied by the volume of the associated aquarium to estimate the total number of larvae in the tank. The counts were completed in 24 h intervals for each aquarium for three days. Larvae mortality for every 24 h interval was calculated by subtracting the most recent count from the count preceding it. Total larvae mortality was calculated by adding the differences from each count for every aquarium. The larvae lost per hour was calculated by dividing the larval loss by the hours between counts. Lastly, the mortality percentage was calculated by dividing the larvae loss by the original number of larvae in the aquarium. Yolk consumption of larvae reared solely in aquaria was assessed daily from pre-hatch through 15 dph. At each sampling time point, three live larvae were imaged once movement ceased. Yolk and lipid droplet area were measured from acquired images using a stage micrometer and calibrated measurement tool in ImageJ (version 1.54p). In this study, the term ‘lipid droplet’ refers to the endogenous lipid reserve structure and is equivalent to the ‘oil globule’ terminology commonly used in fish developmental biology; these terms are used interchangeably here. Larvae were not provided with any food during this experiment. Water temperature was measured throughout the experiment and study. Distribution of the mortality percentage and yolk sac absorption data were analyzed for normality using a Shapiro–Wilk test (p = 0.05). Outliers were identified as values with z-scores greater than +3 or less than −3. Parametric data were analyzed by one-way ANOVA, and non-parametric data by Kruskal–Wallis test (p = 0.05). If significant differences were detected, Tukey’s HSD or Wilcoxon post hoc tests were used to identify pairwise differences. All statistical analyses were conducted in JMP Pro 18 (SAS Institute Inc., Cary, NC, USA).
2.3. Embryo Developmental Staging Guide
The updated embryo staging guide was created by taking samples of fertilized eggs from upwelling egg collectors shortly after a batch spawn occurred following our typical protocol outlined in 2.1. The time of the spawning event was noted as the time of fertilization. Embryo samples were placed on a watch glass for imaging under a dissecting microscope equipped with a digital camera (Celestron Digital Microscope Imager 2MP, Celestron, Torrance, CA, USA) at 40× magnification. A stage micrometer was also photographed to standardize all images. Images were captured for embryos from fertilization through hatching at hourly intervals, with fertilization time defined as a representative (average) time based on the spawning event. Eggs were then transferred to McDonald jars connected to aquaria for incubation between samples and held at 18 °C. Further, degree day calculations were performed for developing embryos. The formula used to calculate degree days was: Temperature (°C) × D = V, where D is days or hours and V is the value used for comparison. The value V used for comparison was divided by the temperature (18 °C) used as the point of reference for standardization [14]. A reference temperature of 18 °C was used as it reflects typical ambient spawning and early developmental conditions for striped bass under both natural and culture settings. For example, an embryo that was collected from a spawn 24 h previous and that was incubated in water that was 2 °C lower (16 °C) than the point of reference (18 °C), the formula would be as follows: 16 °C × 24 h = 384; 384/18 °C = 21.3 h. Thus, a 24 h embryo raised in 16 °C waters might more closely resemble a 20 to 22 h embryo raised in 18 °C waters. Embryo images were aligned in a digital guide based on a sequence starting from an unfertilized egg to a recently fertilized embryo through the 46–48 h of development post-fertilization (at hatching), with representative images and a written description included at every 1–2 h of development post-fertilization. The degree day calculations were used to normalize all images in the sequence. The average hatchery temperature across all days that eggs were sampled was recorded and reported below.
2.4. Larval Developmental Staging Guide
The larvae used to create the updated larval developmental staging guide were reared under the same conditions as previously described. Newly hatched larvae (0–2 dph) were maintained in aquaria, then transferred at 3 dph to outdoor pondside rearing tanks supplied with live zooplankton from earthen ponds [27].Daily samples of three larvae were taken from aquaria (0–2 dph) and pondside tanks (3–36 dph) and photographed using a dissecting microscope (40×) and a digital camera (Celestron Digital Microscope Imager 2MP), and a 10× loupe with an iPhone camera once larvae were 15 dph. Later stage larvae (33 and 36 dph) were photographed using only an iPhone camera with no magnification. A stage micrometer or ruler was also photographed to standardize all images. Representative images that captured key morphological transitions were selected for inclusion in the final staging guide. For each image in the staging guide, key developmental features were highlighted based on visual observations and findings from Gajbhiye et al. [18] and Mansueti [13]. In addition to morphological findings, larval feeding behavior on zooplankton and diet progression were noted throughout development. Each image includes mean total length (mm) calculated from three larvae per developmental stage (n = 3) and a description highlighting key morphological changes. Degree day calculations were performed for the larvae as outlined in 2.3. The average morning (0700 h) and afternoon (1700 h) water temperatures, as well as the average daily water temperature was recorded for the entire sampling period.
3. Results
3.1. Larval Mortality and Yolk Consumption
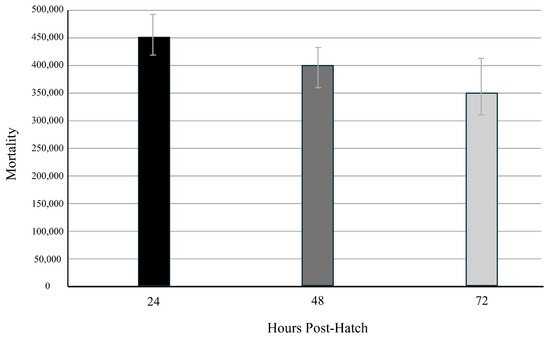
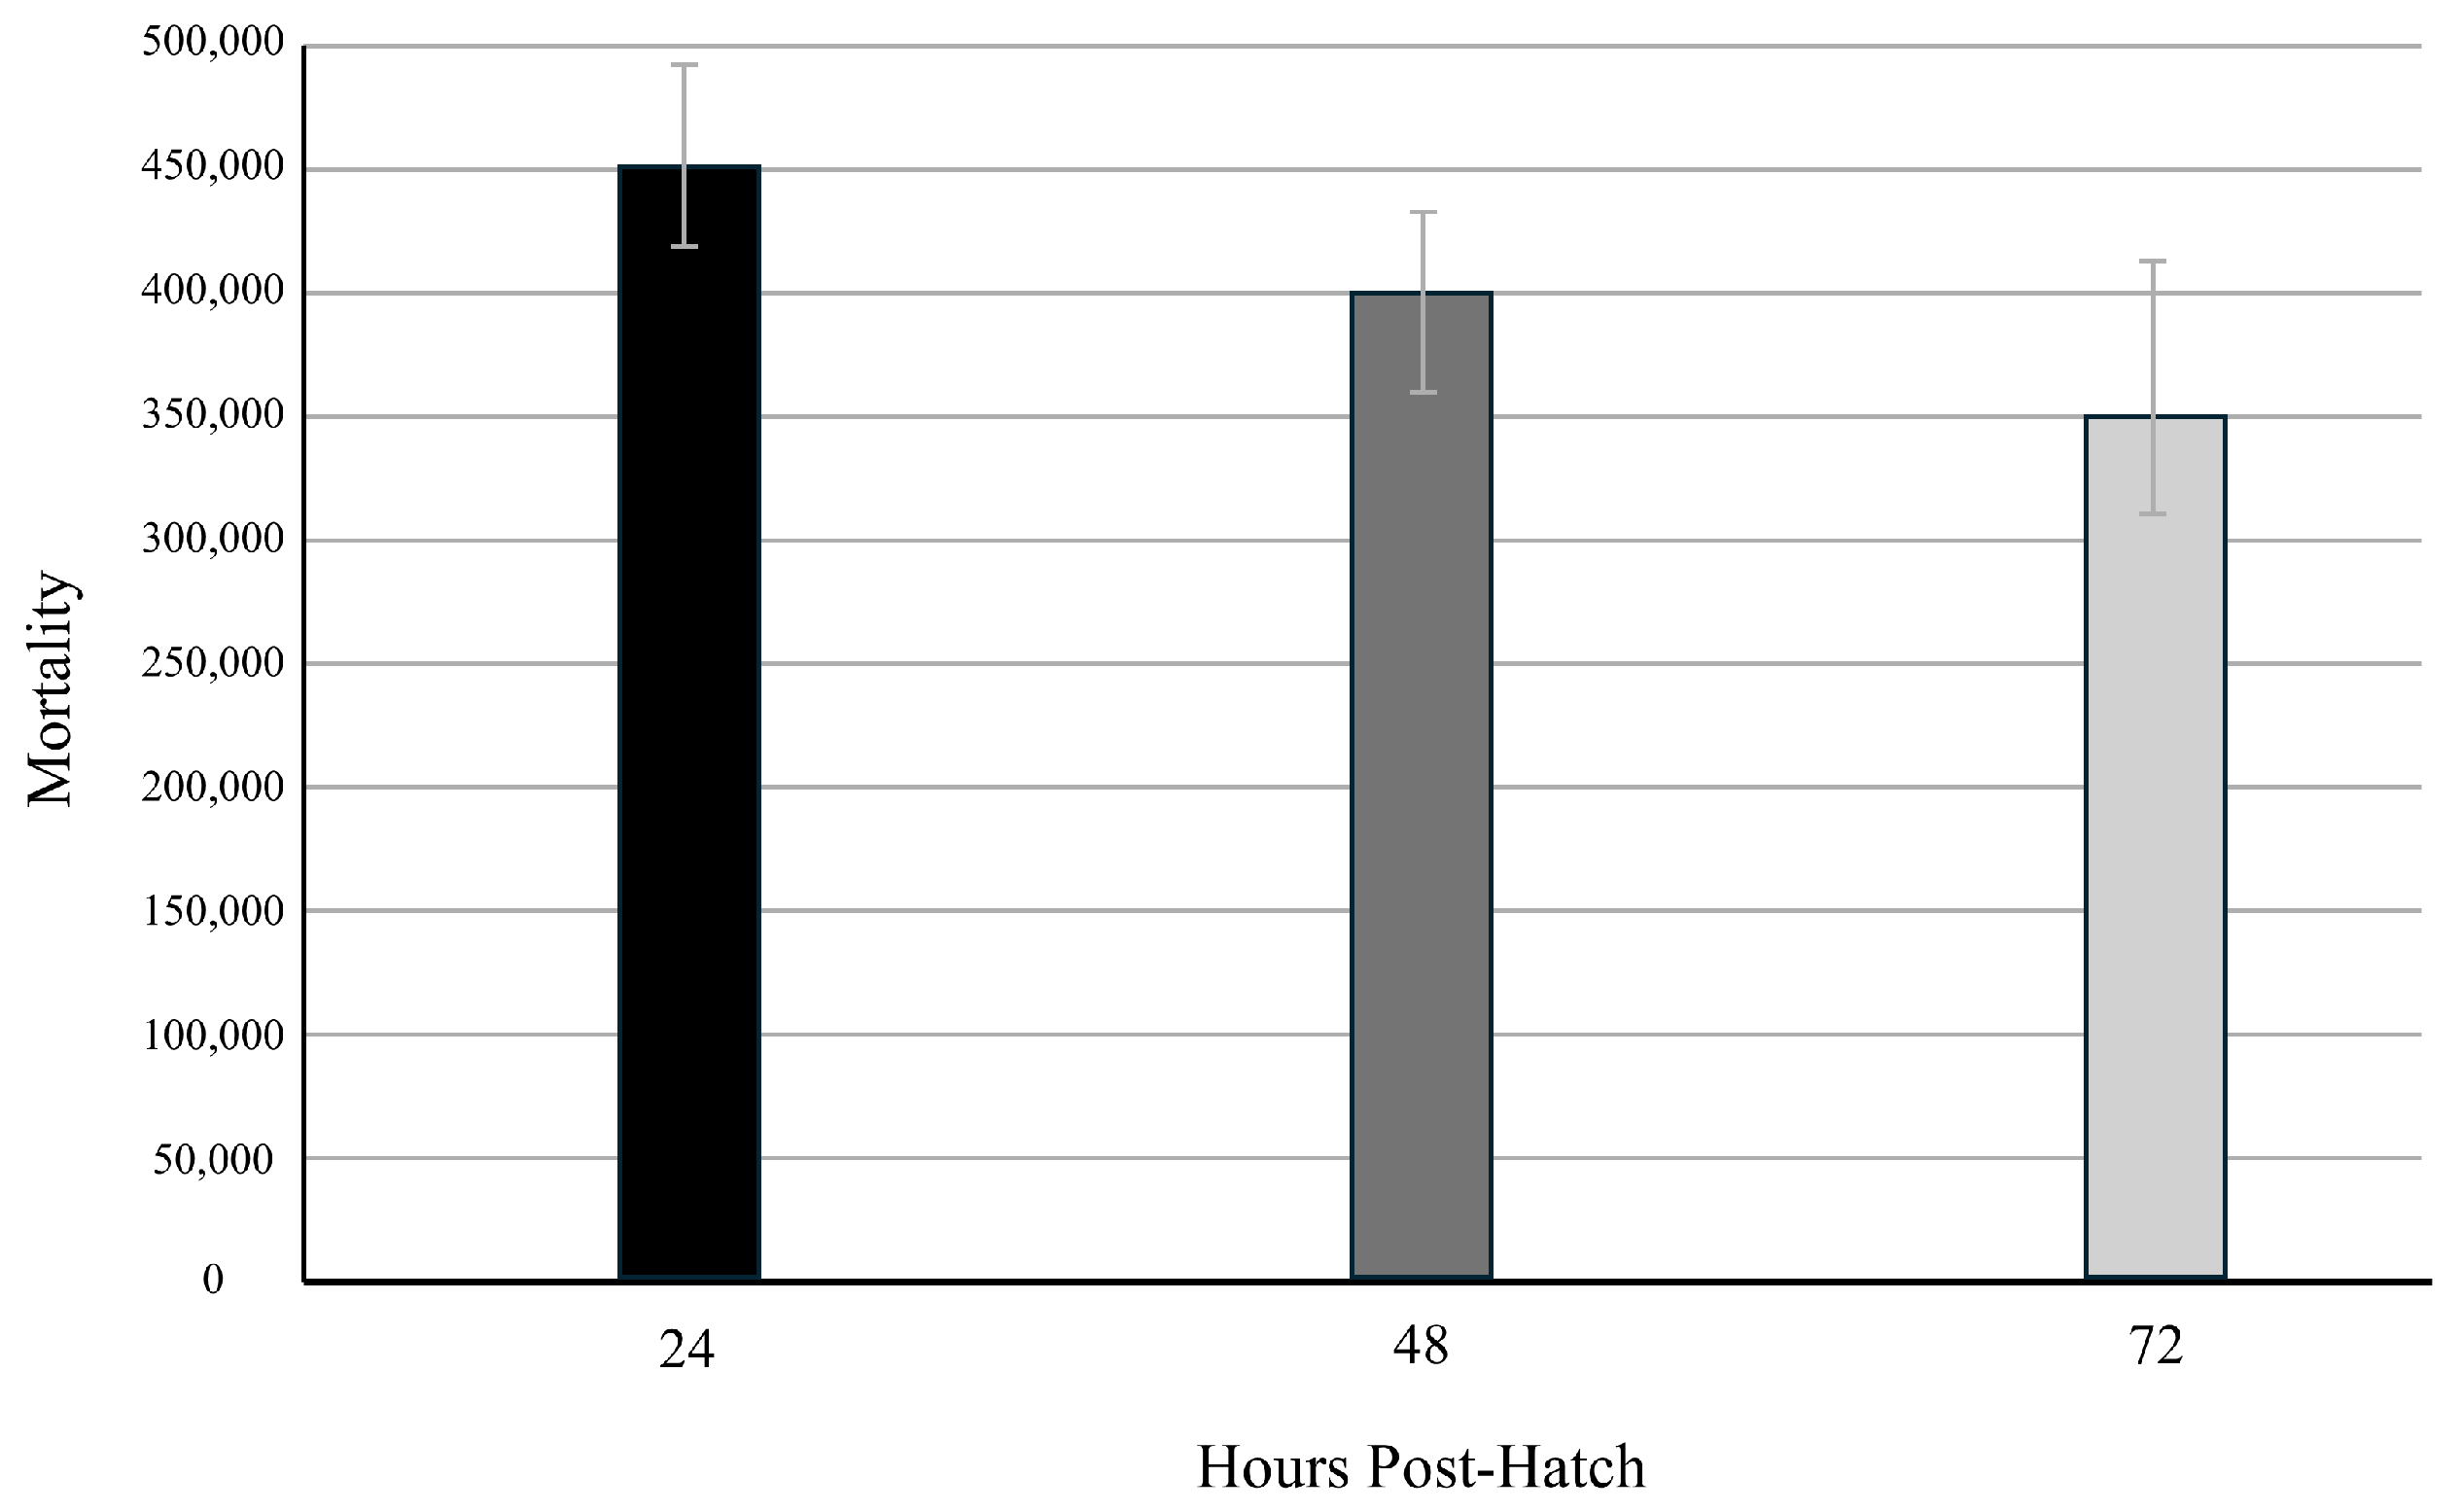
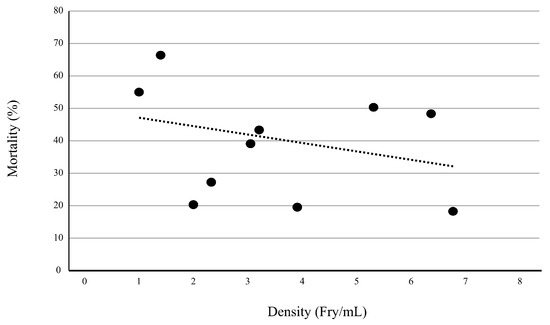
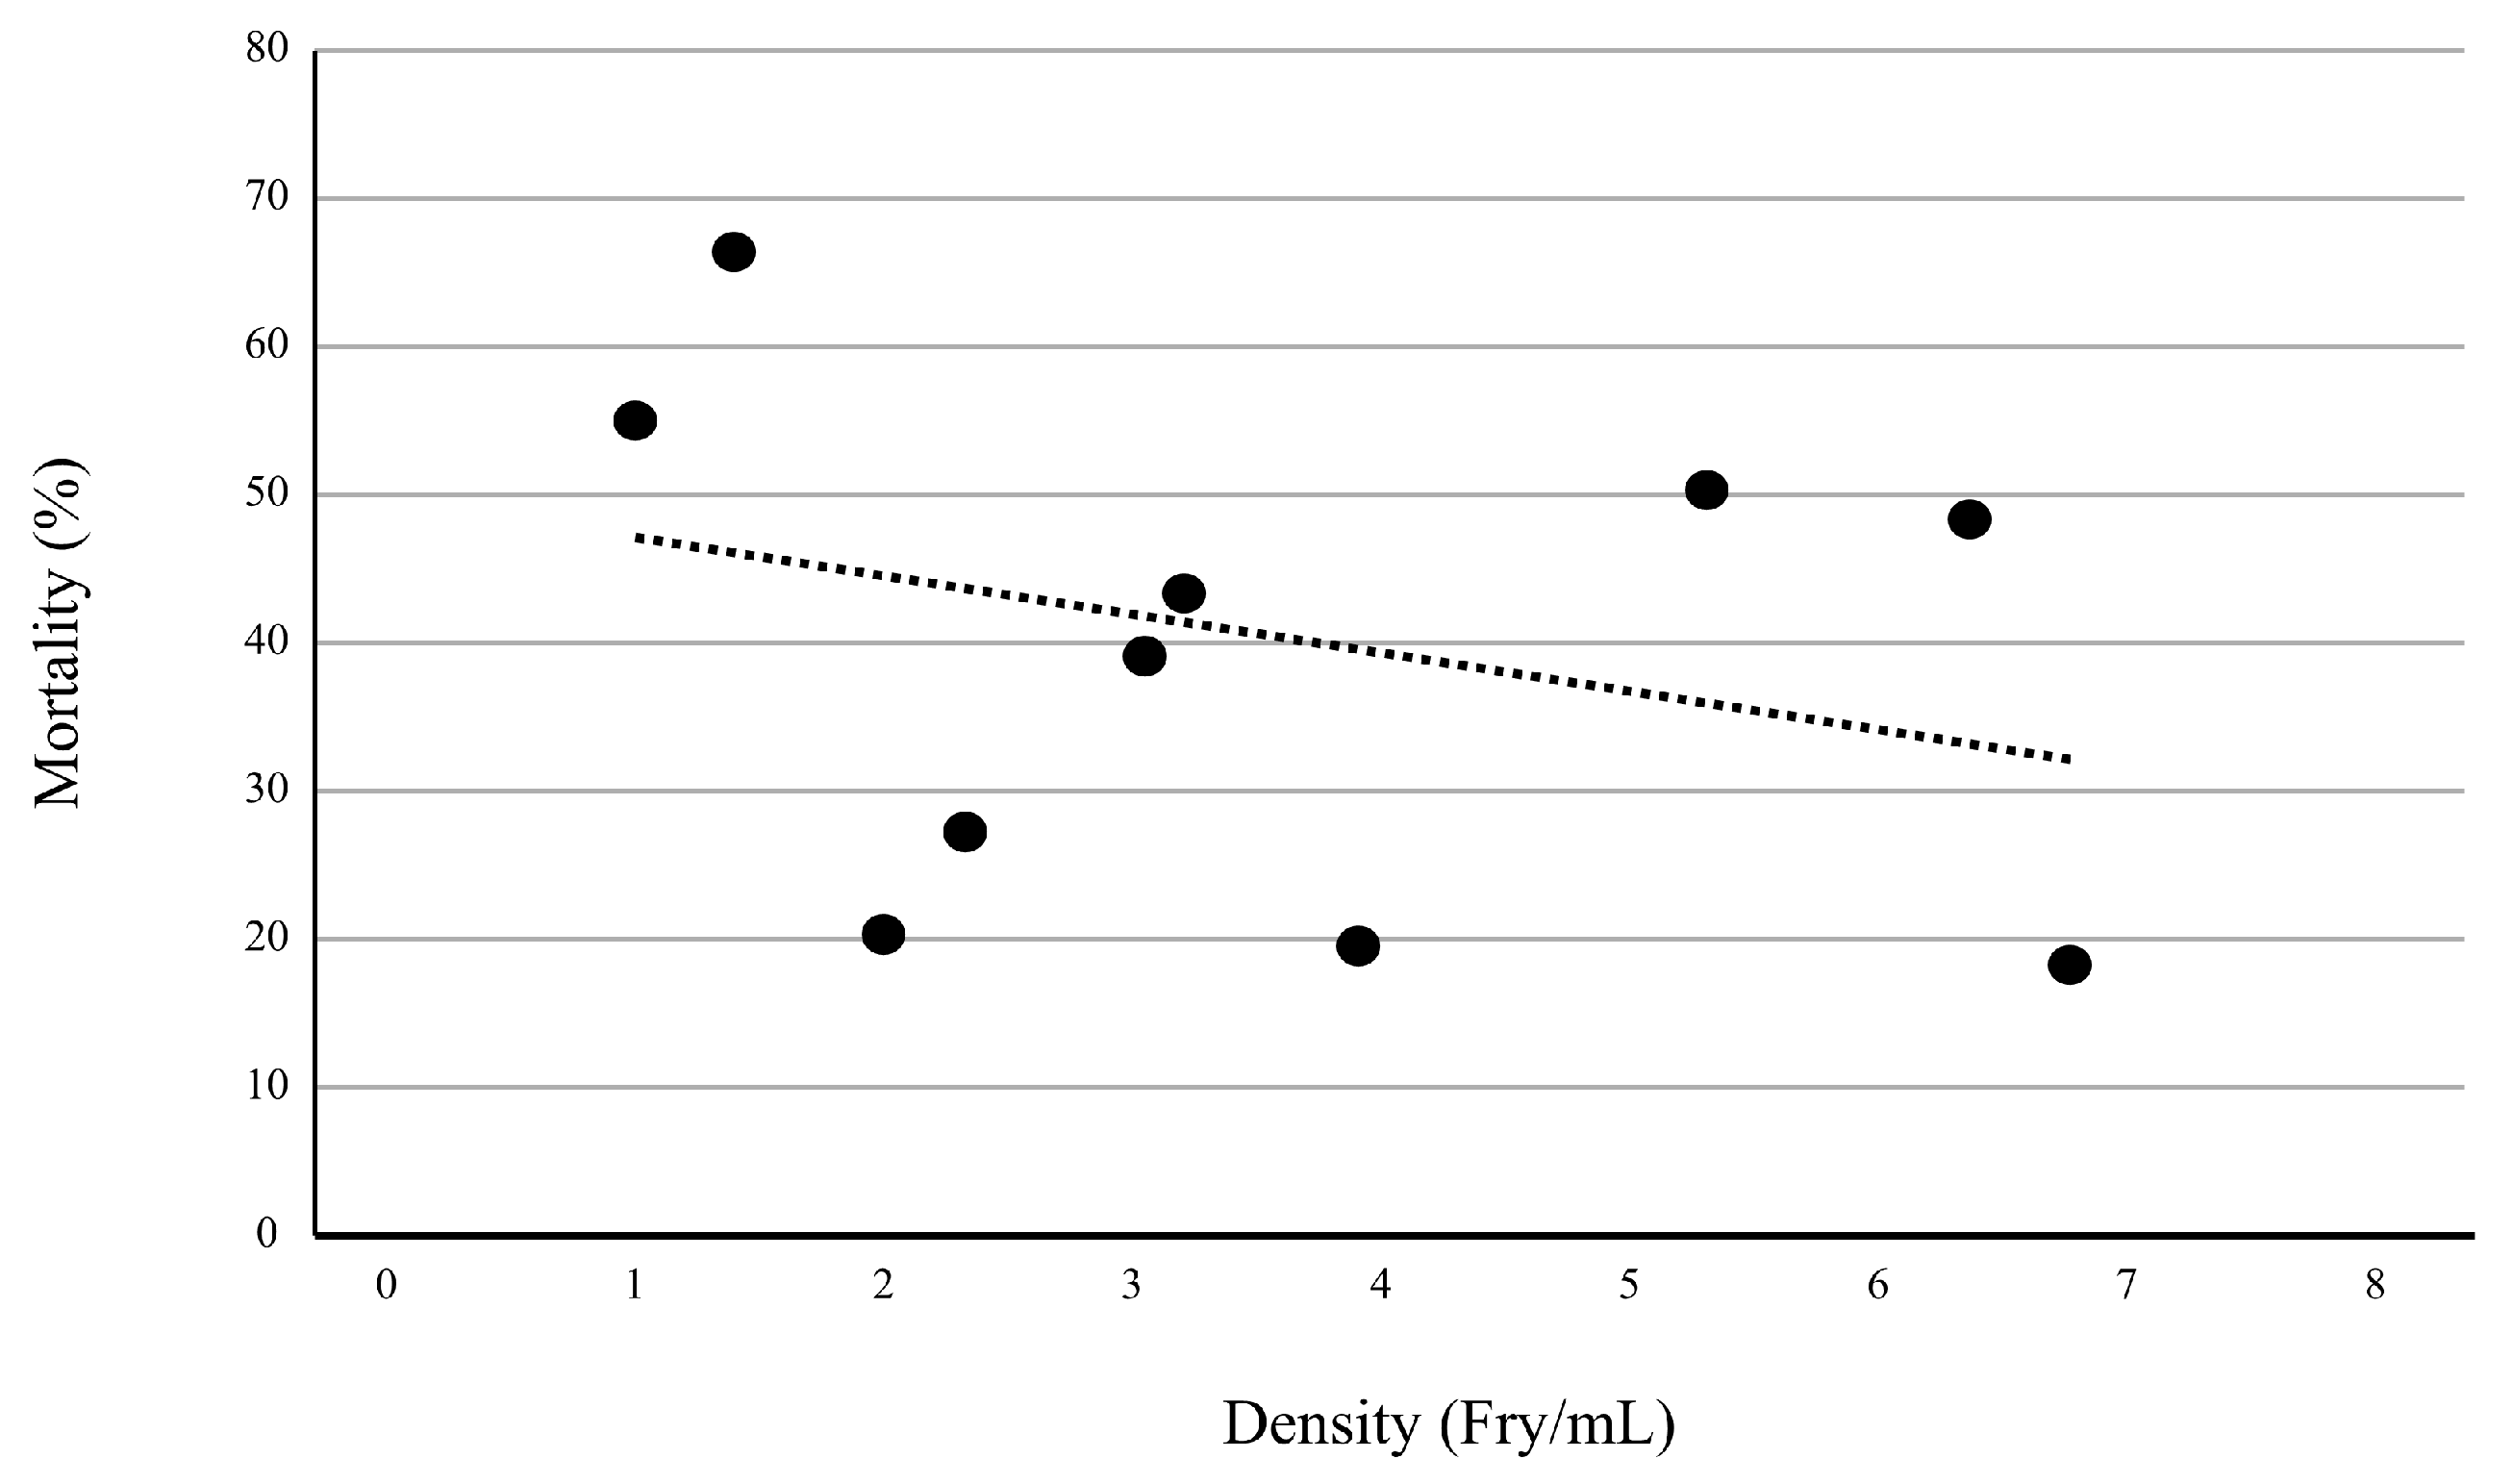
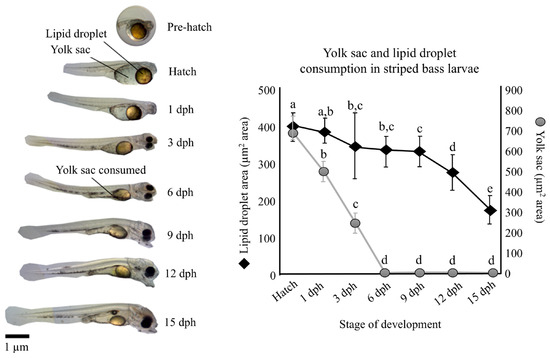
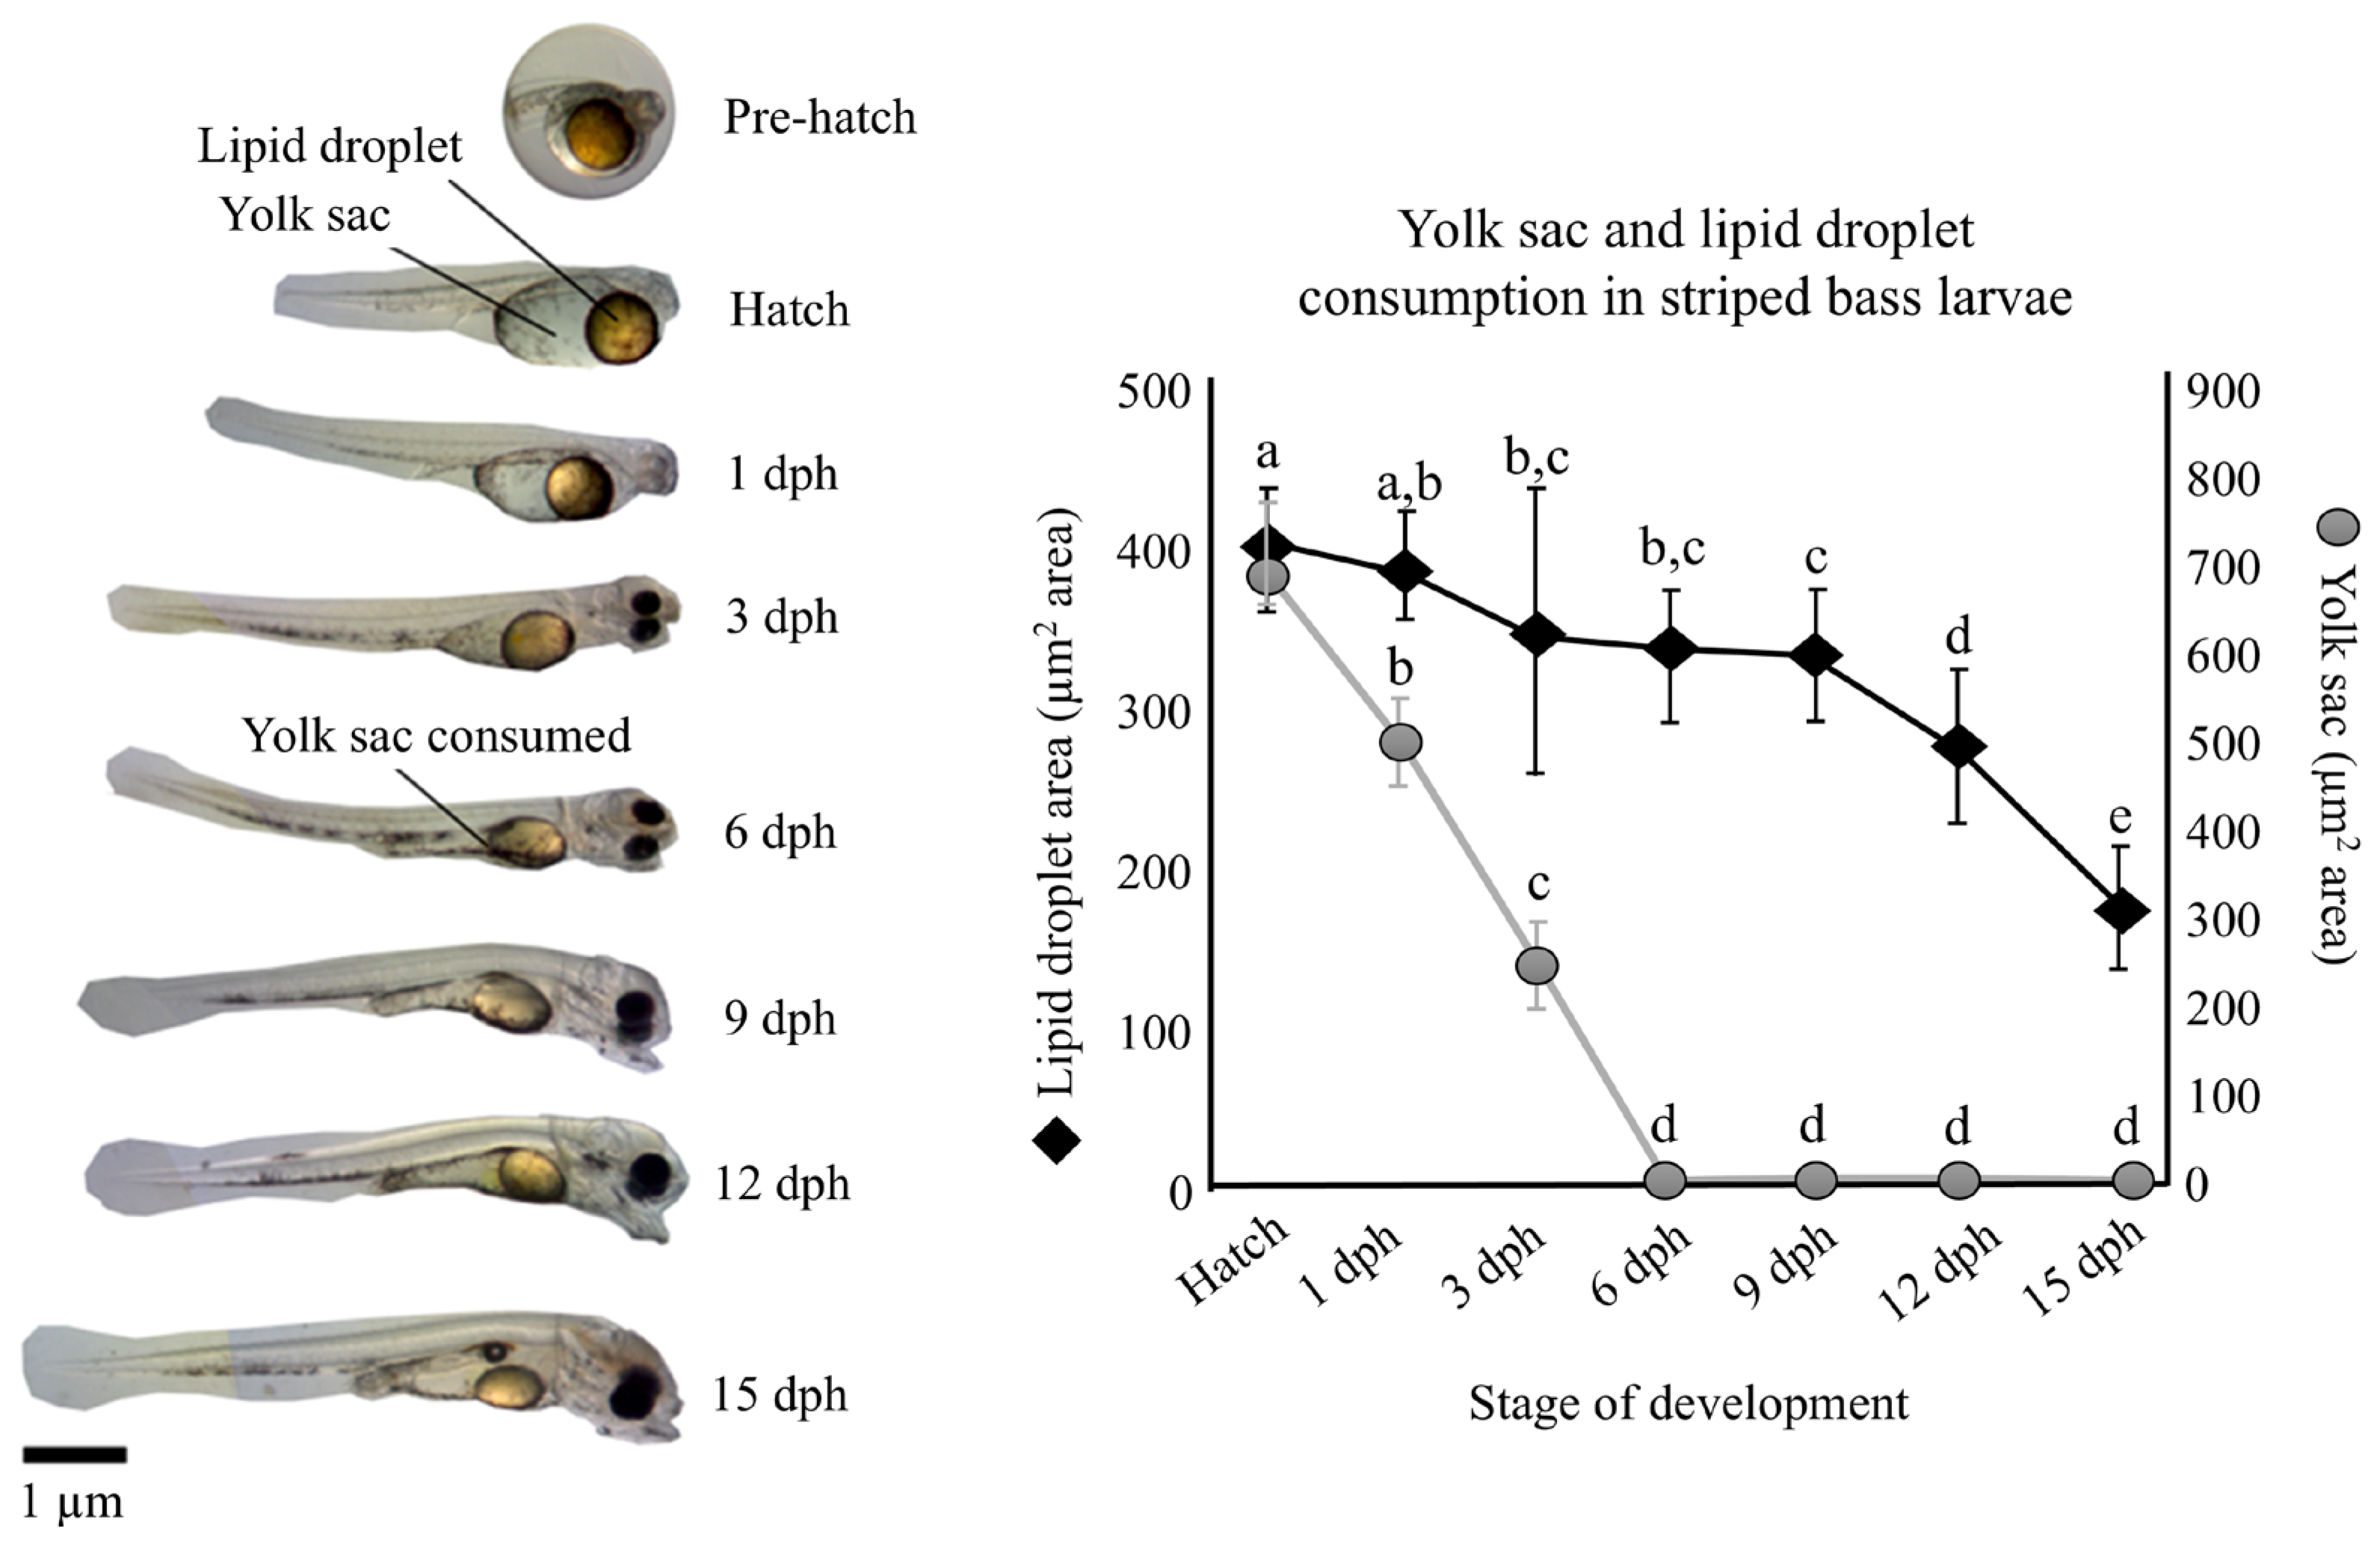
Ten larval rearing densities (1.1, 1.5, 2.0, 2.4, 3.1, 3.2, 3.9, 5.3, 6.3, 6.8 larvae/mL), based on common practice in hatchery settings, were chosen for evaluation. A Kruskal–Wallis test indicated no significant effect of time (24, 48, or 72 h post-hatch) on mortality percentage (p > 0.05; Figure 1). There was no correlation between (R2 = 0.0657, p = 0.47) mortality percentage and rearing density, at least within the range of densities evaluated (Figure 2). Yolk sac and lipid droplet areas decreased significantly over time (ANOVA, p < 0.05; Figure 3). The yolk sac was consumed by approximately six days post-hatch (dph), and the lipid droplet remained for later stage larvae as a nutrient source until 16–19 dph. The average hatchery water temperature during the sampling period was 18.9 + 1.2 °C.
Figure 1.
Total mortality percentage over 72 h post-hatch at the varying densities evaluated. This figure shows total mortality percentage across all aquaria at 24, 48, and 72 h post-hatch. A Kruskal–Wallis test indicated no significant effect of time on mortality percentage (p > 0.05). Bars represent average values of 10 tanks; brackets represent standard deviation.
Figure 2.
Mortality percentage as a function of rearing density. No correlation was observed between density and mortality (r2 = 0.0657, p = 0.47). There is a slightly negative trend (y = −2.2567x + 47.493) with mortality percentage and density such that aquaria with higher densities had slightly lower mortalities over the examined ranges. The dotted line represents the linear regression trendline.
Figure 3.
Yolk sac and lipid droplet consumption in larval striped bass from hatch to 15 dph. The yolk sac is consumed roughly by 6 dph with the lipid droplet remaining as a source of nutrition for later stage larvae. The data points on the graph reflect the mean of triplicate measurements taken from yolk sac and lipid droplet areas in 2D digital images of striped bass larvae, with images selected to represent typical morphology at each developmental stage. Significant differences are marked by data points that have different superscript letters (ANOVA, p < 0.05). The mouth develops around 3 dph, which generally aligns with the timing when larvae are stocked into outdoor ponds for first feeding.
3.2. Embryo Developmental Staging Guide
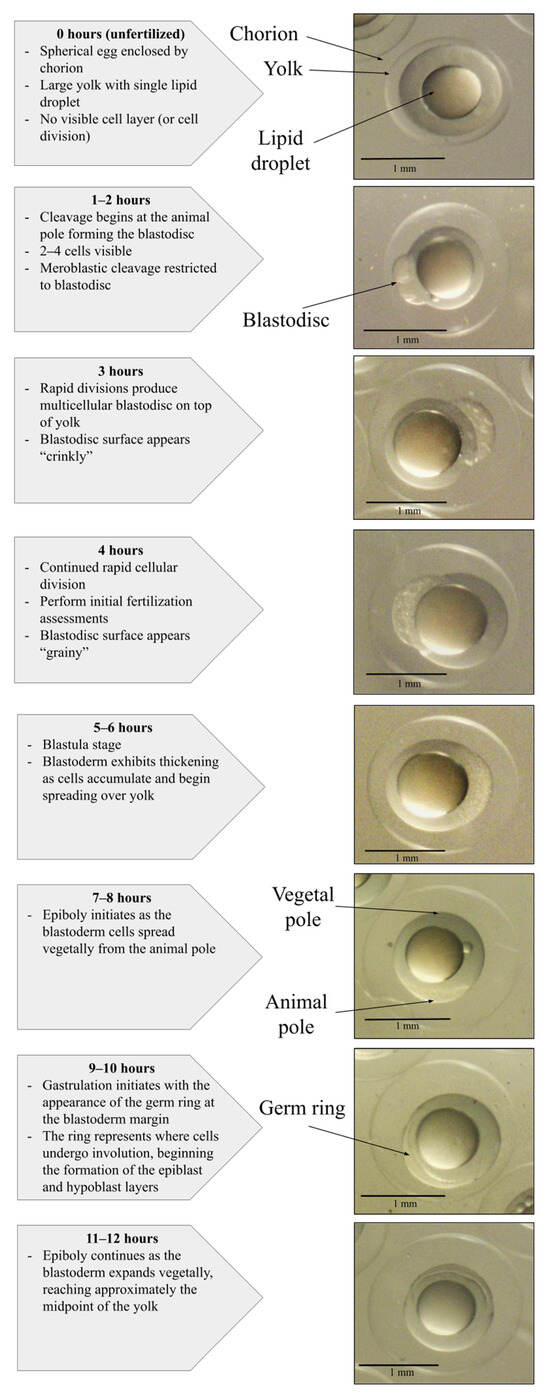
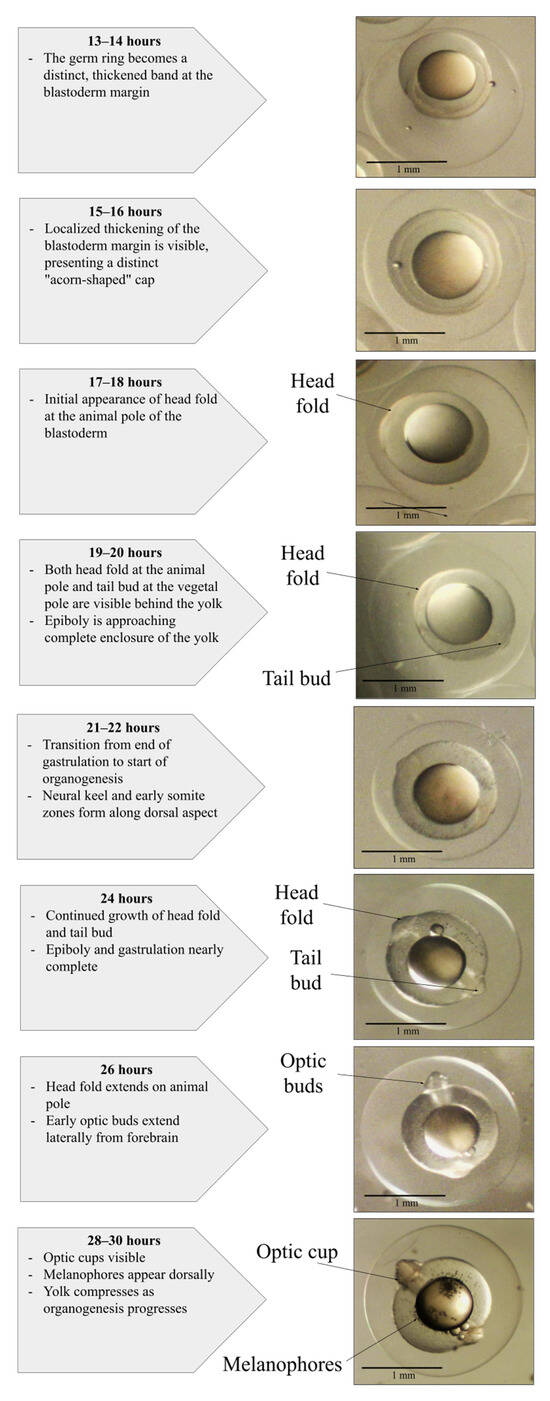
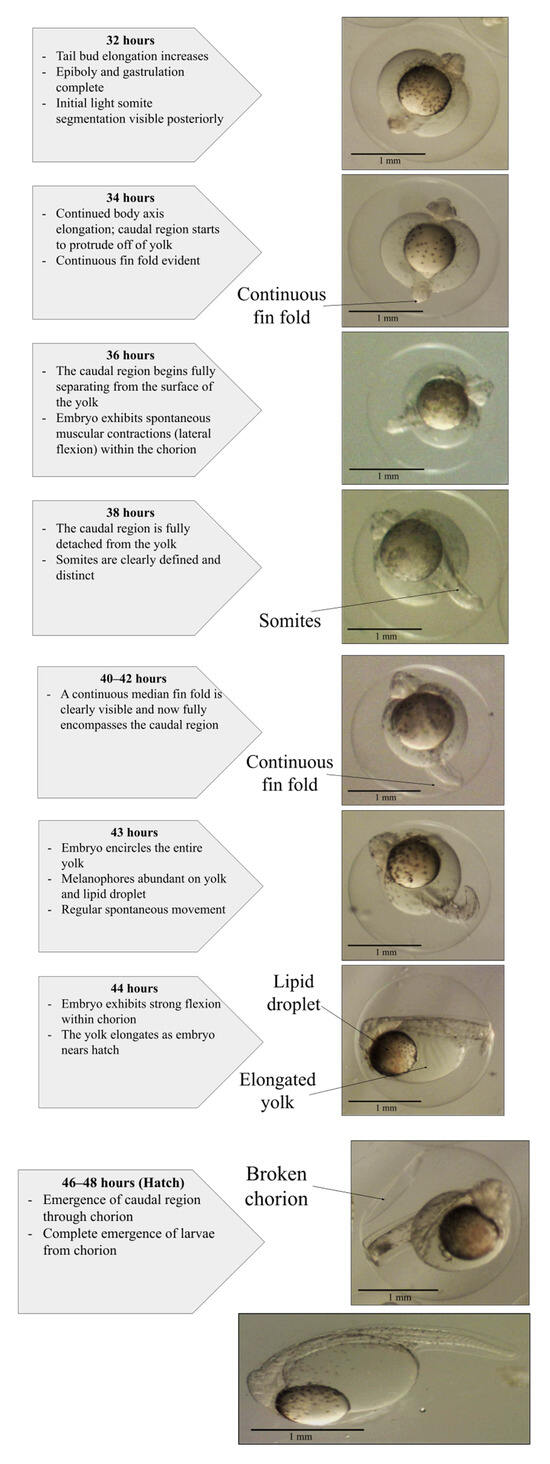
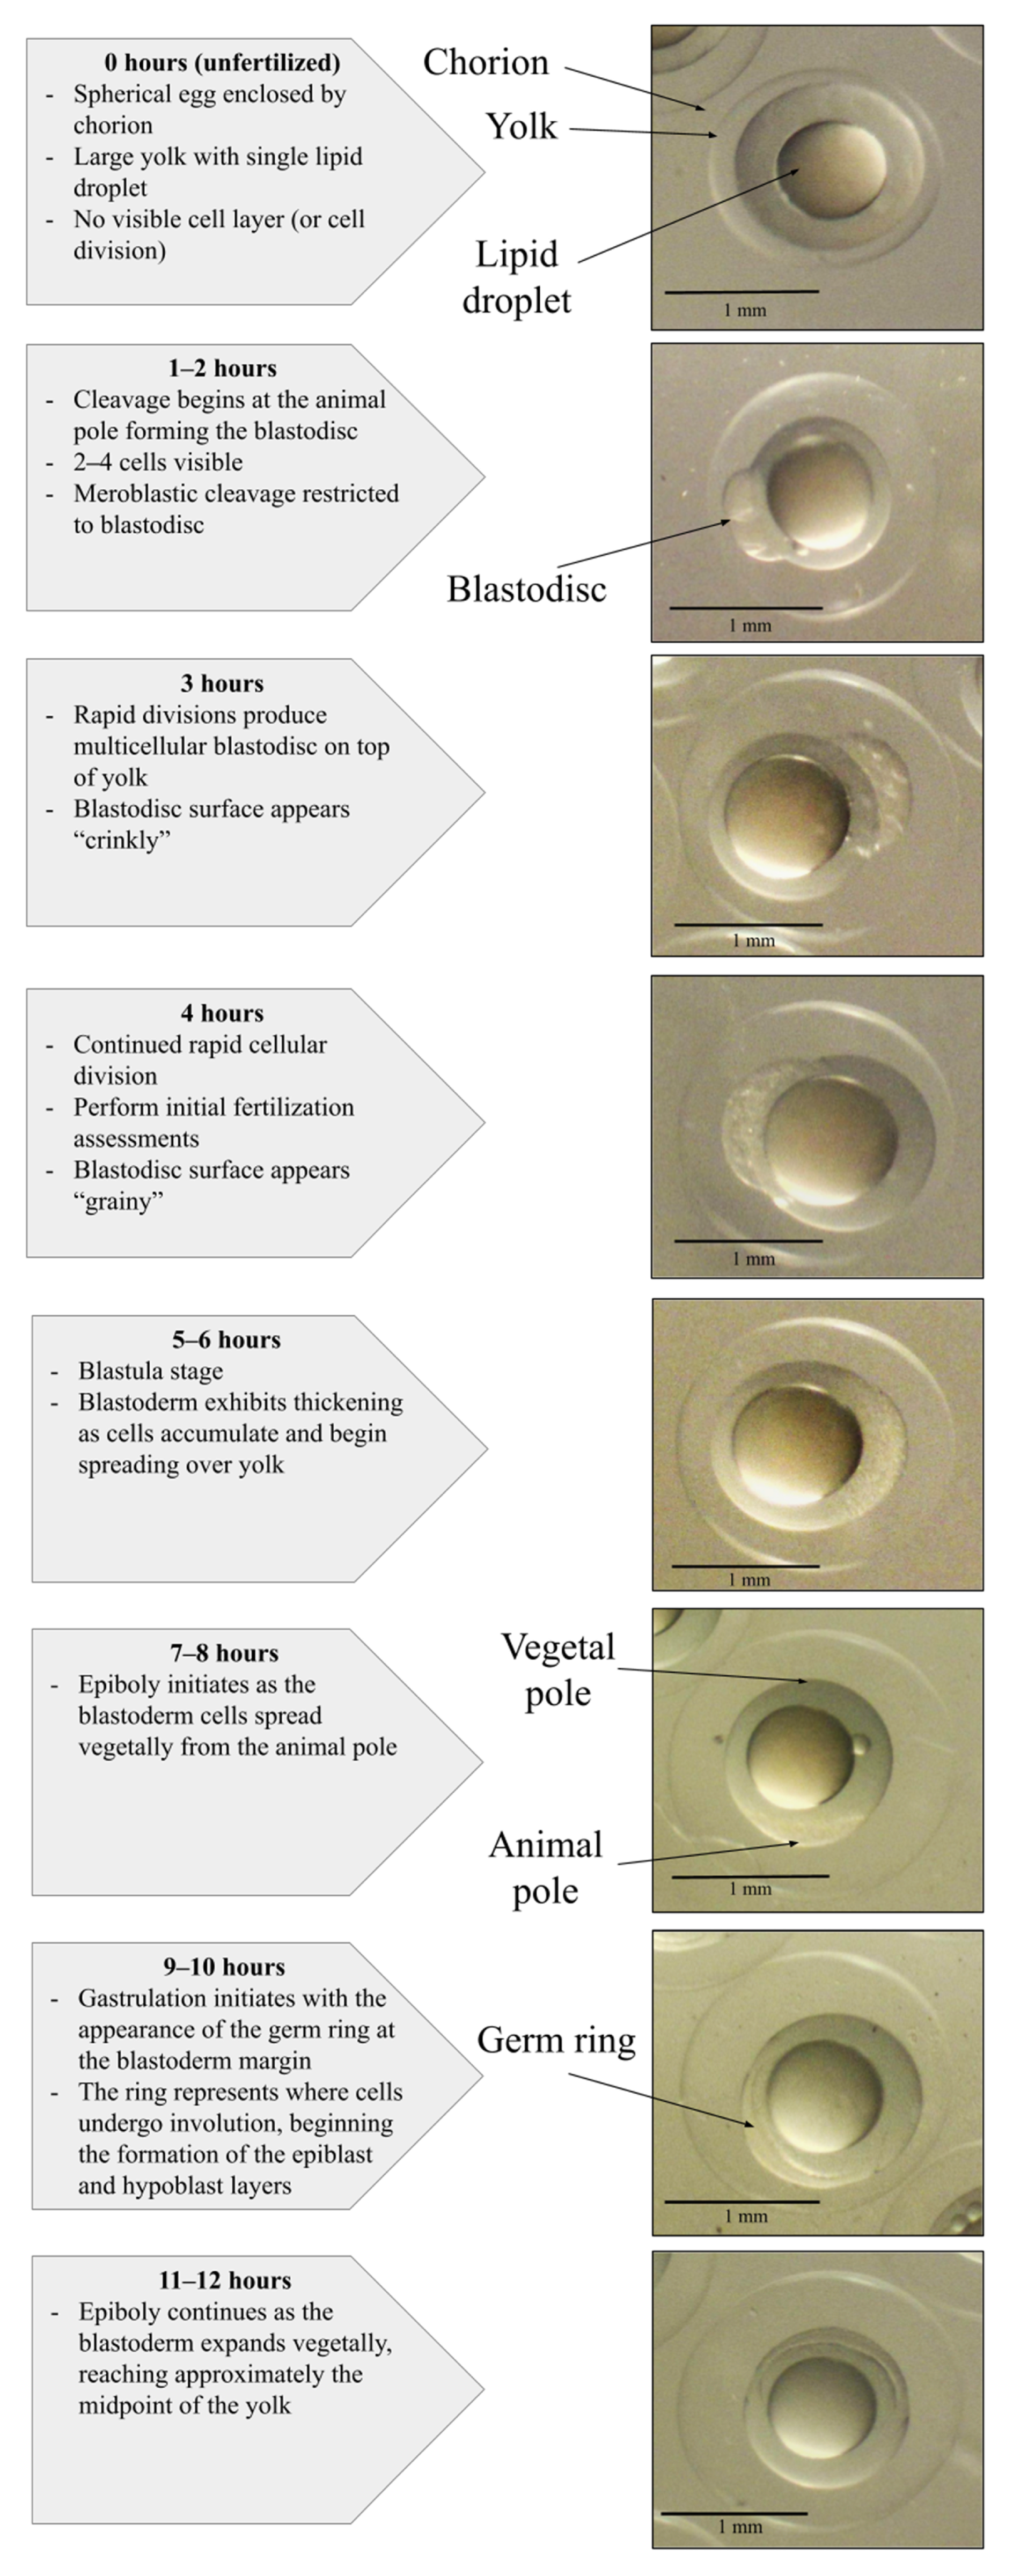
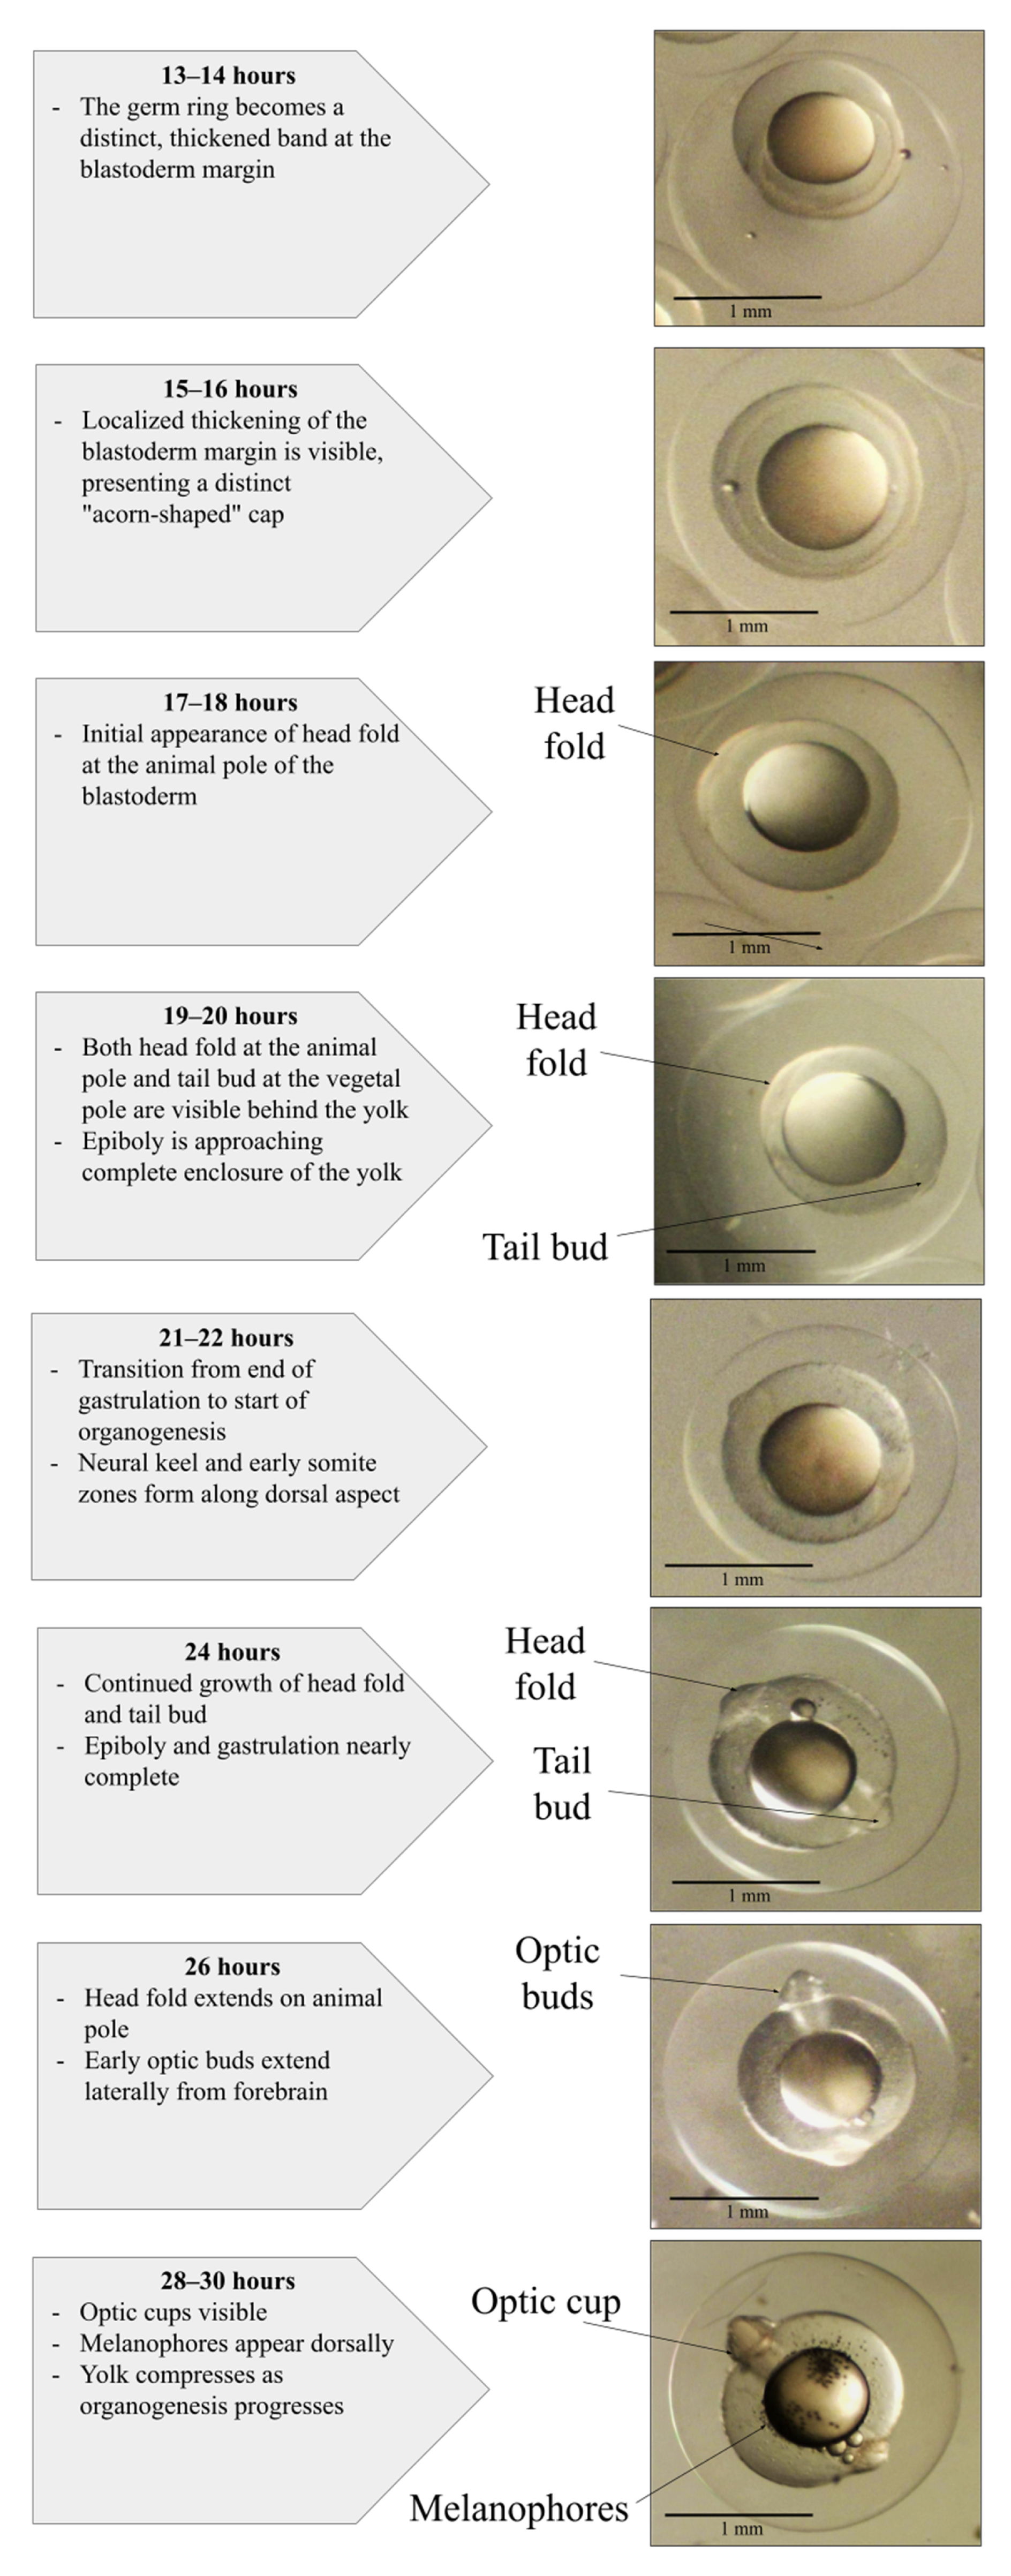
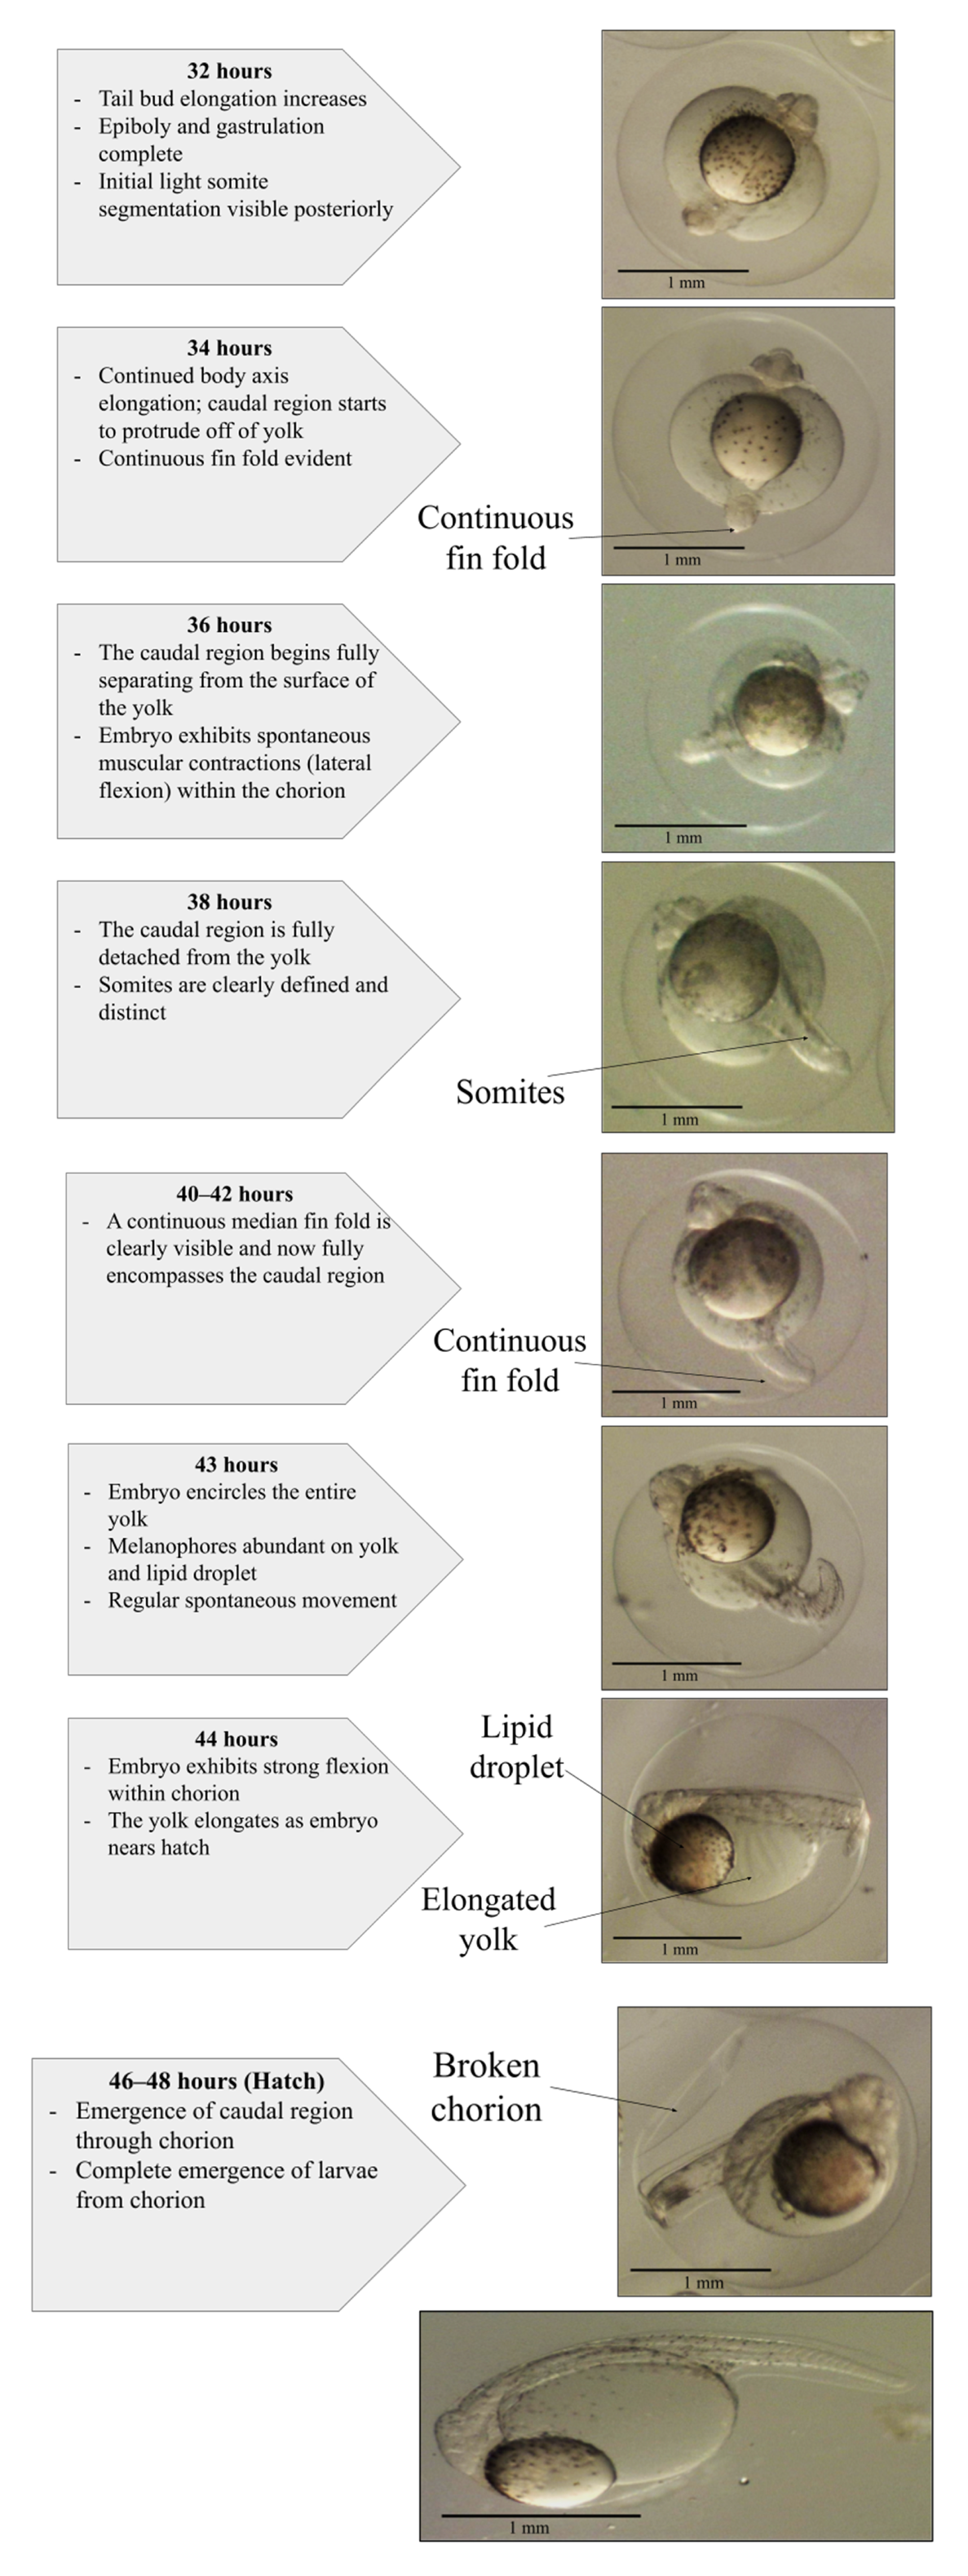
The staging guide includes a total of 25 representative images (Figure 4) documenting development from unfertilized eggs (0 h) through hatching (46–48 h post-fertilization). Embryonic development progressed through a series of morphologically distinct stages, beginning with meroblastic cleavage and blastula formation (1–10 h), during which repeated cell divisions produced a blastodisc that expanded into a blastoderm overlying the yolk. This was followed by epiboly and early gastrulation (11–16 h), characterized by progressive spreading of the blastoderm over the yolk and the onset of germ ring formation at the blastoderm margin. The embryonic shield subsequently became visible, indicating establishment of the dorsal axis. Head fold and tail bud formation (17–20 h) marked the transition toward organogenesis [28]. Continued growth and differentiation were observed through 30–36 h, including the appearance of melanophores (26 h), formation of pigmented eyespots (30 h), elongation of the tail bud and body axis (32 h), and progressive compression of the abdominal yolk during organogenesis (44 h). Development of body structures became increasingly apparent by approximately 32–36 h with completion of epiboly, somite formation, and separation of the tail from the yolk. The final stages of embryonic development included increased flexion of the embryo and tail curling within the chorion (38–44 h), resulting in complete larval emergence between 46–48 h. Spontaneous embryo movement, including muscular twitching, was observed from approximately 40 h onward. The average hatchery water temperature during the sampling period was 18.9 ± 1.2 °C.
Figure 4.
Developmental staging guide for striped bass embryos ranging from 0–48 h post-fertilization. This guide includes a total of 25 images that document the key developmental milestones in hourly intervals at a water temperature of 18.9 °C. The first developmental phase (0–10 h post-fertilization) display early cleavage stages through multi-cellular divisions. The next phase (11–16 h post-fertilization) includes the ring stages where cells migrate around the yolk and eventually create the “acorn” shape that indicates the first appearance of the head and tail body axes. The head and tail buds begin forming around 17 and 20 h post-fertilization. Rapid differentiation occurs at 21 to 36 h post-fertilization, including melanocyte appearance (26 h), elongation of the body (28–30 h), and eyespot formation (30 h). The heartbeat and bodily movements are visible around 40 h post-fertilization with hatching completed at 46–48 h post-fertilization.
3.3. Larval Developmental Staging Guide
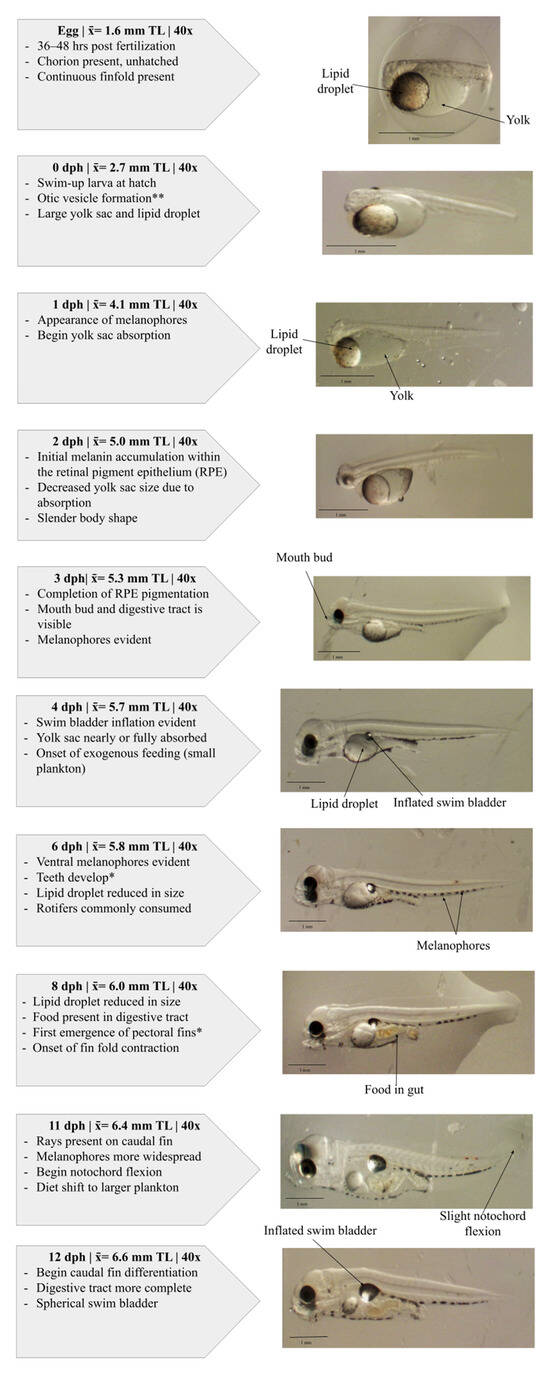
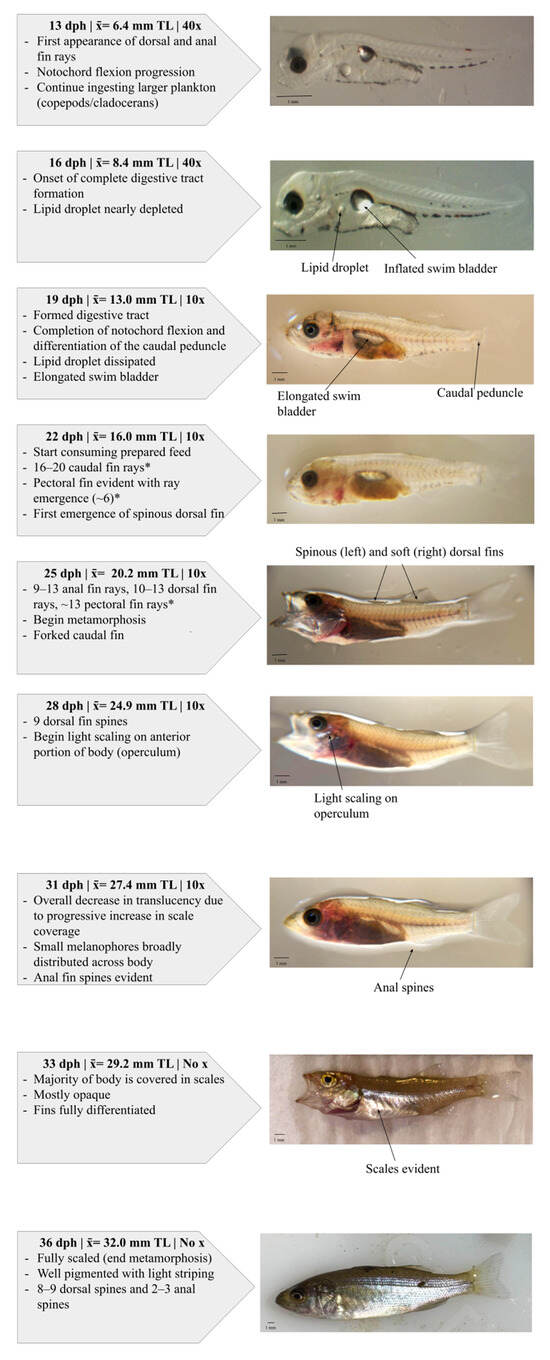
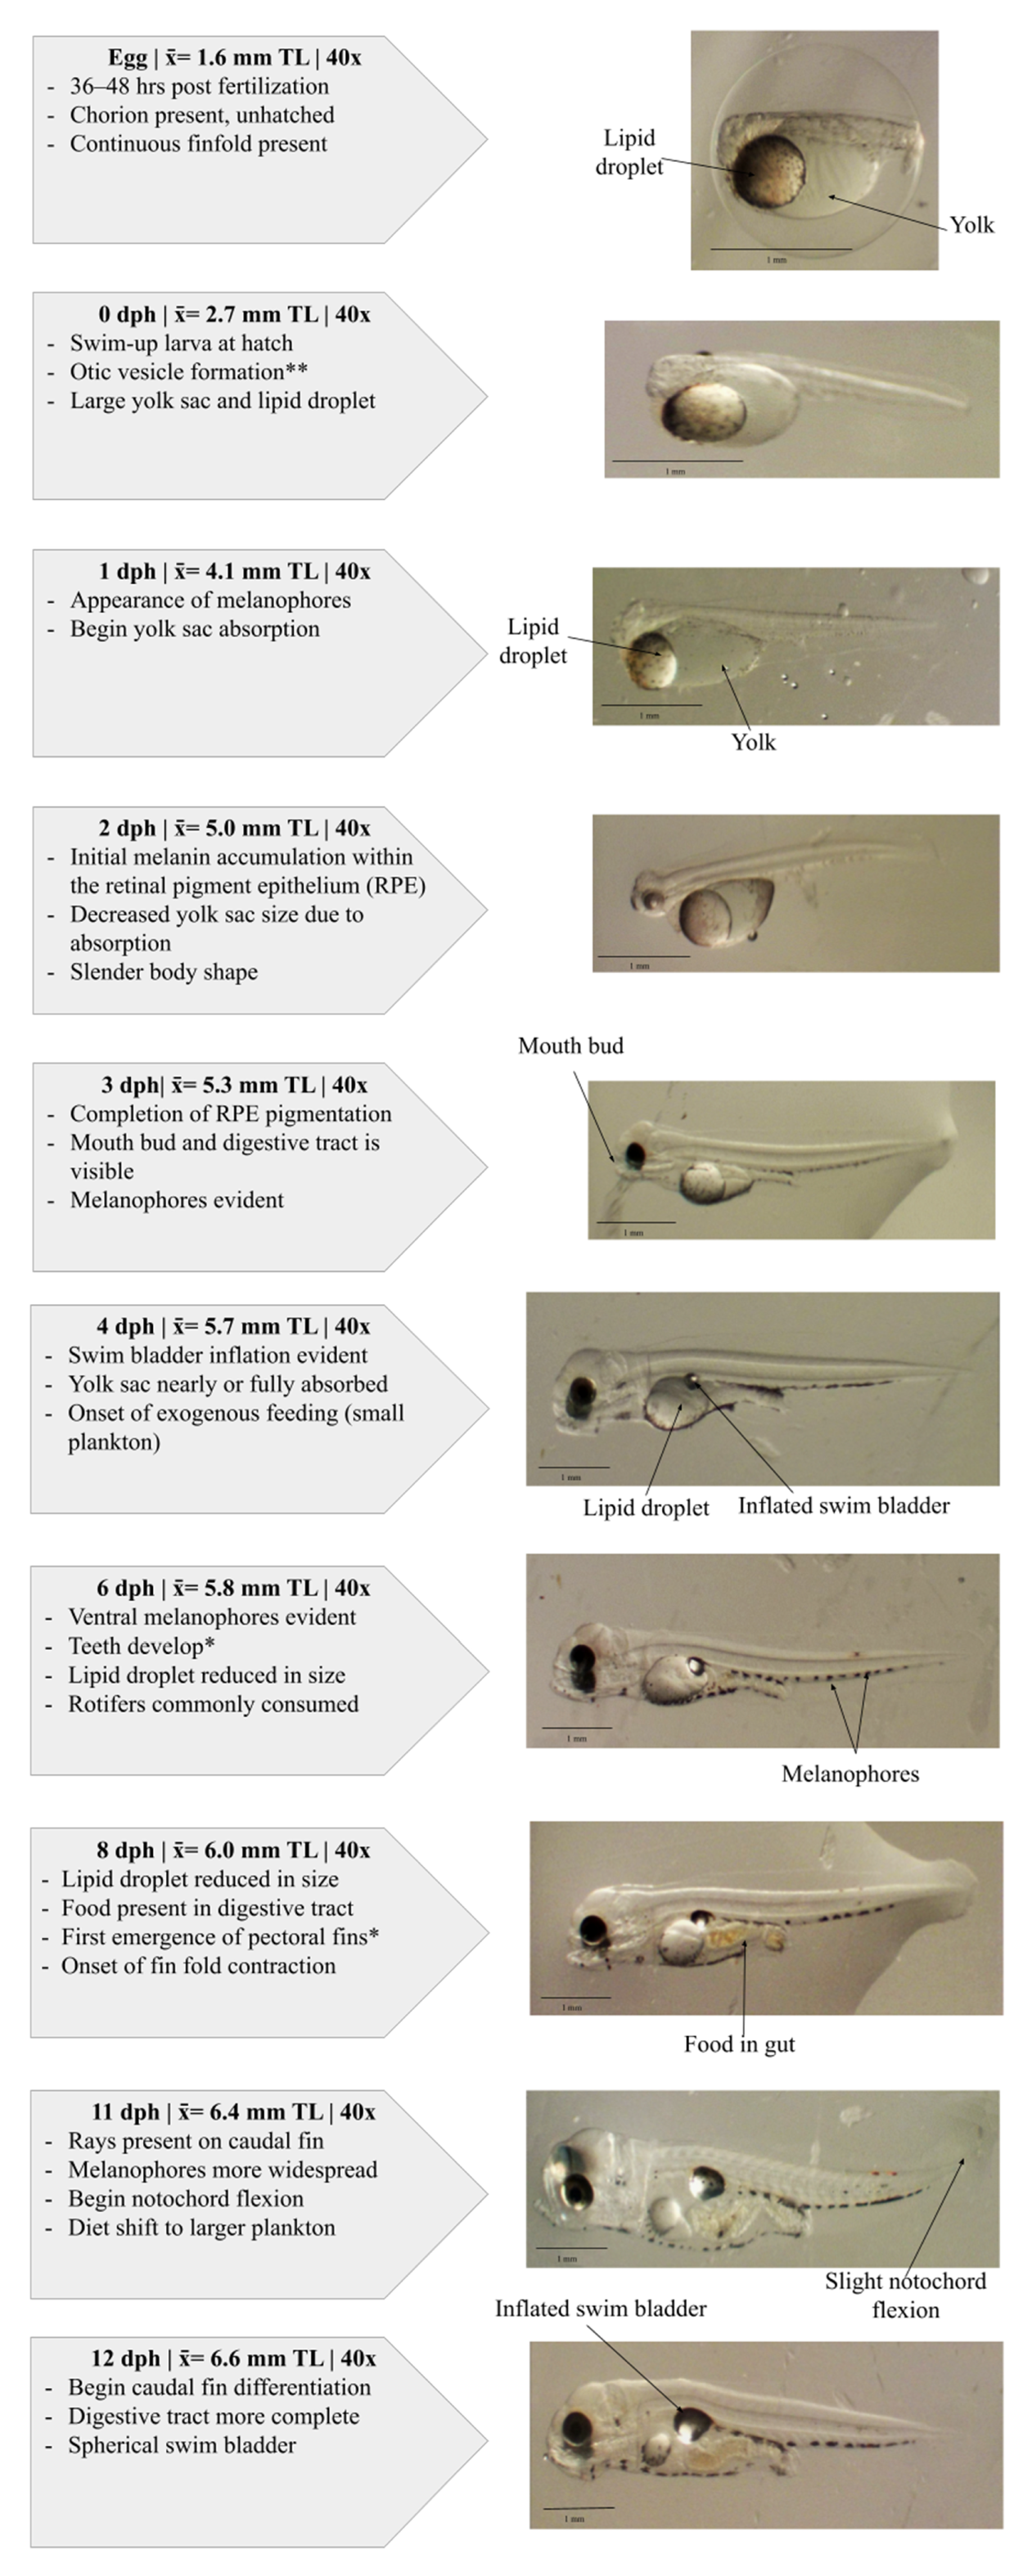
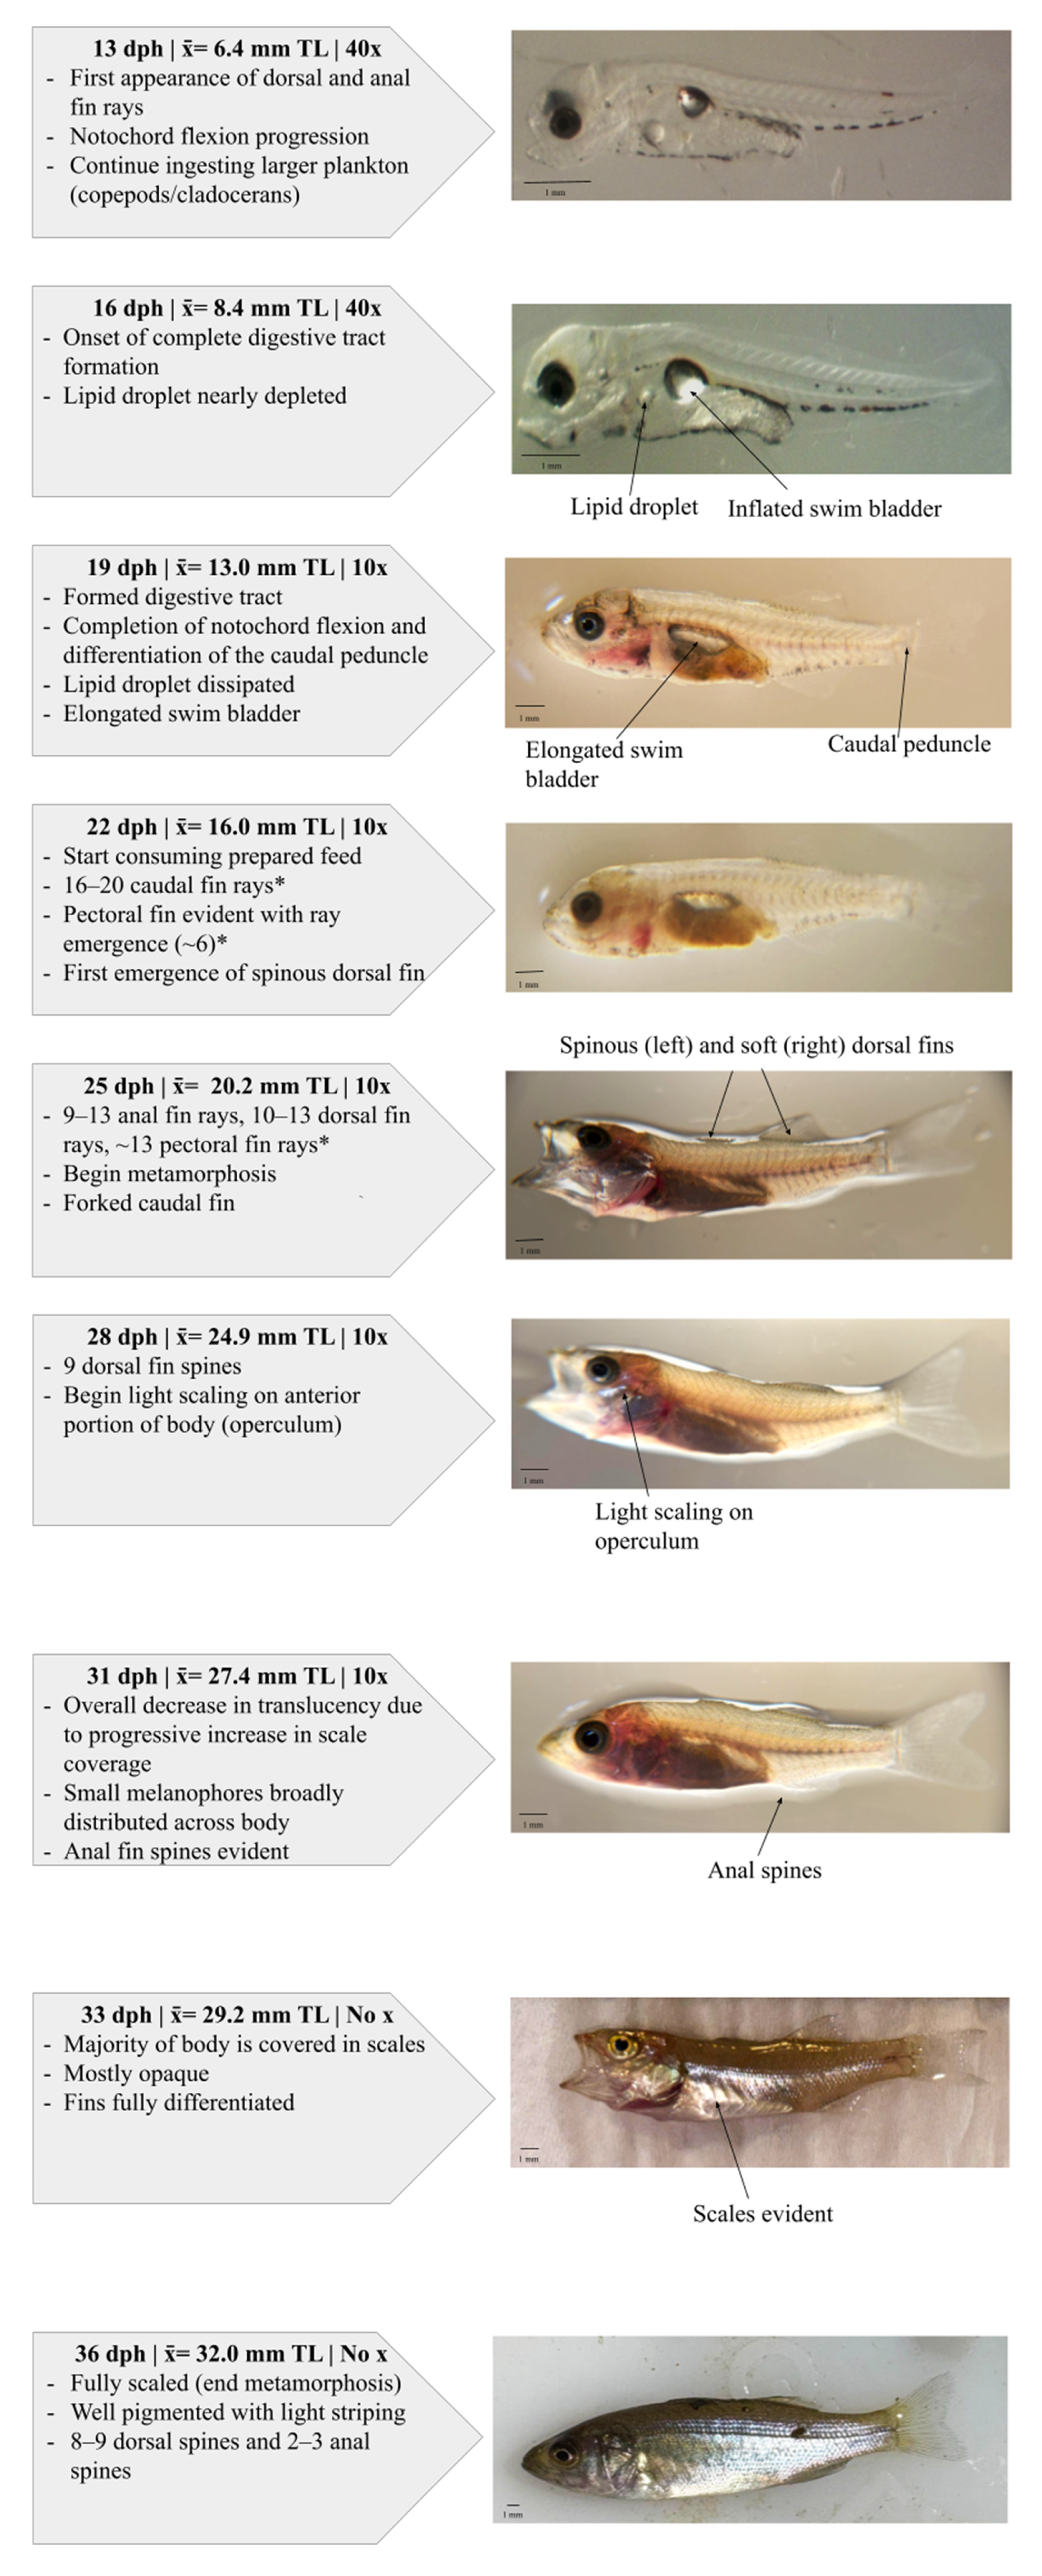
The larval staging guide included 19 representative images illustrating morphological and developmental progression from hatch through metamorphosis (Figure 5). Key morphological changes included swim-up behavior and otic vesicle formation at hatch (0 dph), onset of yolk sac absorption and early melanophore appearance (1–2 dph), mouth bud formation and early digestive tract development (3 dph), swim bladder inflation and transition to exogenous feeding (4 dph), spread of ventral melanophores, tooth development, and continued lipid droplet utilization (6 dph), and onset of fin fold contraction and emergence of pectoral fins (8 dph). Subsequent development included appearance of caudal fin rays and initiation of notochord flexion (11 dph), progression of dorsal and anal fin ray formation (13 dph), and completion of the digestive tract with near depletion of endogenous lipid reserves (16 dph). By 19 dph, larvae exhibited complete notochord flexion with formation of the caudal peduncle, an elongated swim bladder, and a fully formed gastrointestinal tract. Additional morphological transitions included emergence of spinous dorsal fin elements and initiation of prepared feed consumption (22 dph), followed by early metamorphic changes characterized by forked caudal fin formation and increased fin ray differentiation (25 dph). Metamorphosis progressed with development of dorsal fin spines and initial scale formation on the anterior portion of the body (28 dph), with scales identified based on visible presence under dissecting microscopy and/or by touch, followed by reduced body translucency associated with progressive scale coverage and increased melanophore distribution (31 dph), and near-complete body scaling with fully differentiated fins (33 dph). By 36 dph, larvae were fully scaled, well pigmented with light striping, and exhibited definitive dorsal and anal spine counts, marking the completion of metamorphosis. Yolk sac absorption was typically complete by 4–6 dph, while the lipid droplet persisted longer (until 16–19 dph) to serve as an internal energy reserve even after exogenous feeding commenced (3–4 dph). The guide also includes insights to larval diet shifts that occur while larvae are developing. Larvae initially consumed small plankton such as rotifers (100–500 μm) after 3–4 dph, transitioning to small copepods (500–2000 μm) by 8–9 dph, and subsequently to larger zooplankton including larger copepods and cladocerans (200–6000 μm) between 9 and 21 dph before switching to formulated crumble feed (#1 Crumble, Zeigler Bros. Inc., Gardners, PA, USA, 55% crude protein, 15% crude fat, 1.5% crude fiber) at 21 dph [27]. The average morning and evening water temperatures were 22.0 ± 2.6 °C and 26.3 ± 2.8 °C, respectively. The average water temperature was 24.2 ± 2.7 °C.
Figure 5.
Larval developmental staging guide for striped bass ranging from 1 to 36 dph. A total of 19 images (40×, 10×, no ×/magnification) were used to illustrate key developmental milestones. The most notable developmental milestones include mouth formation (3–5 dph), eye pigmentation (~3 dph), and swim bladder inflation (~4 dph). By 6–8 dph, melanophore appearance and yolk sac absorption are evident. Development of the digestive tract progresses around 17 dph, followed by the appearance of light body scaling between 24–28 dph. Early signs of metamorphosis appear around 25 dph. Final stages show a fully scaled body by 36 dph. Rearing temperatures averaged 24.2 °C, with morning and evening means of 22.0 °C ± 2.6 °C and 26.3 °C ± 2.8 °C, respectively. * Observations adapted from Mansueti [13]. ** Observations adapted from Gajbhiye et al. [18].
4. Discussion
This study provides contemporary developmental guides for striped bass by integrating both embryonic and larval staging guides with analyses of larval mortality and yolk consumption. The updated embryo guide expands upon earlier foundational references by documenting complete development from fertilization to hatch with hourly imaging and incorporating degree day standardization to account for temperature variation across hatcheries. The degree-day approach used in this study was intended to provide a practical framework for normalizing developmental progression under typical spawning conditions, rather than to define temperature-dependent growth relationships. The larval guide extends this timeline by tracking developmental changes through metamorphosis and highlighting key morphological and dietary transitions such as yolk and lipid droplet depletion, mouth and swim bladder development, and the onset of exogenous feeding. Mortality analyses indicated that most larval mortality occurred within 48 h post-hatch and were not dependent on density in aquaria. Yolk sac reserves were fully depleted by six dph and lipid droplets persisted longer (16–19 dph) as secondary energy stores. Together, these findings demonstrate that early survival is closely tied to developmental timing and endogenous energy availability rather than stocking density alone. Standardizing morphological and physiological benchmarks may support more precise feeding synchronization and larval assessment across rearing systems.
4.1. Larval Mortality and Yolk Consumption
Understanding the relationship between yolk sac utilization and early survival is essential for refining larval rearing strategies in striped bass hatcheries. Embryos were obtained from a single group spawning event involving multiple parental lineages of a domesticated striped bass population [29], and only viable, swim-up larvae representative of standard hatchery selection practices were used for subsequent analyses. In this study, most larval mortality occurred within the first 48 h post-hatch and was not significantly influenced by density within the tested range of 1.1–6.8 larvae/mL. Stocking density was evaluated based on common hatchery observations suggesting that aquaria stocked with higher numbers of larvae may experience greater total losses, consistent with reported striped bass hatchery practices [14]. Physical and environmental parameters (e.g., water quality, oxygen, and flow) are generally maintained within acceptable limits during this period. While higher stocking densities may increase total losses in hatchery settings, the results of this study indicate that mortality rates within the tested range were not directly driven by density, but instead aligned with the timing of endogenous energy depletion. Mortality coincided with the period of rapid yolk and lipid depletion, indicating that survival is more closely linked to internal energy availability rather than crowding effects. Both yolk and lipid droplet volumes declined significantly through time, with complete yolk absorption by six days post-hatch (dph) and lipid droplets persisting longer (16–19 dph) as a secondary energy source. These results support earlier observations that endogenous energy availability defines the critical window between hatch and the onset of exogenous feeding [11]. Similar patterns have been observed in other marine finfish aquaculture species where larval survival is strongly tied to energy sources rather than external conditions [30]. The vitellogenin-derived yolk proteins and lipids that sustain this developmental period are maternal in origin and are complex and highly regulated [31,32,33]. The maternally supplied reserves vary by species and reproductive strategy and result in adaptations that optimize larval nutrition and egg buoyancy. Multiple forms of vitellogenin (VtgAa, VtgAb, and VtgC) have been identified in the Morone species and each contribute differently to embryonic and larval nutrition [34,35]. For example, VtgAa derived yolk proteins tend to undergo more extensive degradation during maturation and thus produce amino acids that promote oocyte hydration and buoyancy, whereas VtgAb and VtgC derived proteins remain intact and serve as a long-term nutrient source during the early larval stages [34,35,36,37]. On the other hand, lipid droplets are derived from very low-density lipoproteins (VLDL) and provide additional energy stores used in later stages of development. Disruption in these vitellogenic pathways have been linked to poor egg quality, reduced hatching success, and post-hatch mortality across finfish species [35,36,37]. Collectively, the balance of protein and lipid deposition established during vitellogenesis defines the energetic window that dictates early larval performance and survival. The persistence of the lipid droplet observed in this study supports its proposed role as a delayed energy reserve that gives larvae a feeding buffer as they transition from endogenous nutrition to exogenous feeding. The timing of yolk depletion and the onset of feeding, therefore, represent a key survival threshold. If exogenous feeding is not synchronized with near depletion of endogenous reserves, then larvae may experience an energy gap that results in starvation and increased mortality. This relationship highlights that larval condition at first feeding is driven less by initial stocking density in aquaria and more by developmental readiness at the time of the transition. Although not significantly different, commercial hatcheries may consider stocking larvae at 2–5 larvae/mL, as well as ensure that larvae are developing properly and are physiologically prepared for first feeding. Overall, the results of this study emphasize that early striped bass mortality is primarily governed by the depletion rate of endogenous energy stores rather than by rearing density in aquaria. Yolk and lipid droplet reserves act as the primary determinants of larval viability, supporting growth and physiological development until feeding readiness is achieved. Standardizing hatchery feeding schedules with these physiological milestones may improve consistency in early survival across production systems.
4.2. Embryo Developmental Staging Guide
The contemporary embryonic staging guide refines and expands upon foundational references for striped bass development [14]. Compared to earlier manuals, this guide provides higher-resolution images captured at consistent hourly intervals, ensuring clear visualization of morphological changes from fertilization through hatch. Several previously undocumented intermediate stages are also included to provide a more complete developmental series for hatchery use. A key improvement is the incorporation of degree day standardization, which increases the guide’s applicability across hatcheries with different incubation temperatures. This guide also identifies the optimal timing to perform fertility assessments. As demonstrated by Chapman et al. [38], the most critical period of embryonic mortality occurs during the first few hours post-fertilization when development remains entirely dependent on maternal gene transcripts. Assessing viability too early fails to capture the transcript-dependent failures, which occur before the embryo starts to transcribe its own genes. The most significant losses of embryos occurred within the first four hours post-fertilization, and the percent of viable embryos observed at four hours were statistically similar to the percent of viable embryos at 24 h [38]. This indicates that a comprehensive assessment of the viability of an embryo can be made at four hours because most embryos that are going to fail due to egg quality issues would have already done so. Additionally, the staging guide provides practical reference points for hatchery management by linking visible developmental features to operational decision-making. Early cleavage and blastula stages confirm successful fertilization and initial development, while progression through epiboly and germ ring formation provides a clear indicator of normal developmental progression during gastrulation. The appearance of the embryonic shield and subsequent head fold and tail bud formation mark key transitions into organogenesis, allowing hatchery personnel to estimate proximity to hatch. Later-stage features such as pigmentation, somite formation, and tail elongation provide additional indicators of developmental timing and remaining time to hatching. These observable morphological benchmarks are particularly valuable when spawning events are not directly observed, as they enable hatchery managers to stage embryos under microscopy and predict hatching windows with greater accuracy. Thus, the guide serves not only as a descriptive framework, but as a practical tool for synchronizing hatchery operations with developmental timing. Together, these refinements enhance the precision and practical value of the striped bass embryo staging guide to enable more consistent developmental monitoring, improved hatchery decision making, and adaptability across facilities operating under variable environmental conditions. The integration of morphological benchmarks and temperature-based standardization provides a framework for evaluating egg quality and developmental progress to facilitate future comparative research and improvement to hatchery efficiency. While developmental staging has been described in related Moronidae species such as European sea bass (Dicentrarchus labrax) [9], this reference primarily serves as a comparative framework rather than a direct template for striped bass development. In the present study, the use of consistent imaging across development allowed for detailed documentation of striped bass embryonic stages, providing a more complete and species-specific staging sequence than those available from related species. Additionally, the striped bass used in this study have been maintained in captivity and selectively bred over multiple generations, which may further influence developmental timing and morphology relative to other Moronidae species, further emphasizing the importance of establishing a striped bass specific staging framework to support accurate hatchery interpretation and application.
4.3. Larval Developmental Staging Guide
The larval developmental staging guide establishes an updated visual and descriptive timeline for pure striped bass from hatch through metamorphosis. While Gajbhiye et al. [18] developed a staging table for hybrid striped bass, direct comparisons to pure striped bass are complicated by differences in growth rates and early-stage development [39,40]. The most detailed staging chart for striped bass remains Mansueti’s [13] work from 1958, which was last referenced in the U.S. Fish and Wildlife Service Biological Report [17]. This study builds upon that foundation using developmental benchmarks by integrating methodologies from Gajbhiye et al. [18] with Mansueti’s [13] descriptions along with observations from the sampled larvae/juveniles to create a comprehensive and contemporary timeline of larval development, providing a clearer framework for future research and hatchery applications. The staging chart documents critical morphological transitions including yolk sac absorption, mouth formation, swim bladder inflation, fin differentiation, and pigmentation, as well as diet shifts found in Kendrick et al. [27] as larvae progress. These features serve as practical indicators of developmental progress and feeding transitions for hatchery use. Linking morphological milestones with natural diet shifts provides direct management relevance by allowing hatcheries to match prey size and type to larval/juvenile developmental stage, minimizing periods of nutritional mismatch that can lead to mortality. Additionally, standardizing the larval/juvenile development to degree days again enables the guides’ adaptability and relevance to hatcheries across various geographical areas. Striped bass hatcheries typically conduct spawning operations during spring under moderately cool water temperatures, but even small differences among facilities or across days can alter the rate of embryonic and larval development. Because developmental progression is temperature dependent, relying solely on days post-hatch may result in mistimed feeding or misinterpretation of stage progression if water temperatures differ from the reference condition. By applying degree day calculations based on their actual incubation temperature, hatchery managers can estimate developmental stage more accurately and better align feeding schedules with physiological readiness, particularly during the transition from endogenous to exogenous nutrition. Together, these improvements make the larval developmental staging guide a versatile resource for both hatchery production as well as research, and it supports more standardized rearing protocols, improved feeding synchronization, and higher larval survival consistency.
4.4. Integration of Morphological and Physiological Development
Combining key visual development staging with physiological indicators such as yolk and lipid utilization provides a more comprehensive understanding of larval viability and mortality risk. Morphological observations alone capture external progress, but combining these with energetic metrics reveals the underlying metabolic context that influences developmental success or failure. Matching the depletion of endogenous reserves with key early external developmental cues like mouth formation, swim bladder inflation, and onset of exogenous feeding creates a unified developmental framework that is descriptive and functional. Similar relationships between developmental timing and early mortality have been reported in other cultured species; for instance, most unobserved mortality in larval walleye (Sander vitreus) occurred within the first eight days post-stocking, coinciding with the critical developments such as swim bladder inflation and first feeding [41]. Similarly, refinements to the larval staging framework for Atlantic herring (Clupea harengus) demonstrated that the developmental stage provided a more reliable measure of larval condition and survival potential than size alone [42]. When placing morphological and physiological data on the same time scale, hatcheries can more accurately interpret the biological readiness for larvae/juveniles at each rearing transition rather than relying solely on age in days post-hatch. This integrated approach improves feeding precision and survival assessment by assessing visible development in tandem with underlying energetic status. Beyond striped bass, this integrative framework could potentially serve as a model for creating or refining staging systems in other finfish aquaculture species by linking visible developmental progress with internal processes that sustain them.
4.5. Applications, Limitations, and Future Directions
The developmental staging guides created in this study have several practical applications. They serve as reference tools for hatcheries to monitor embryonic and larval progress, train new staff, and could standardize rearing protocols across facilities. Because both the embryo and larval guides include temperature standardization through degree days, they offer relevance to hatcheries with variable environmental conditions. These visual benchmarks also provide a common reference for researchers investigating larval physiology, growth, and survival under controlled or production-scaled conditions, as well as wild spawned individuals. Beyond hatchery applications, these staging guides may provide a comparative framework for evaluating early development in wild striped bass populations. Although the broodstock used in this study have been maintained in captivity for multiple generations and may not fully reflect wild developmental milestones, standardized morphological benchmarks linked to degree days offer a reference for assessing any similarities or differences between hatchery and wild-derived embryos and larvae. Such comparisons may be particularly relevant when evaluating environmental stressors like contaminant exposure, which can inhibit early development and could influence recruitment dynamics [43]. Establishing a documented baseline under controlled production conditions therefore contributes context for interpreting developmental variability observed in natural systems.
Nonetheless, interpretation of these guides must consider the specific environmental conditions under which they were developed. Pondside rearing conditions may not fully capture the range of environmental variability such as fluctuating oxygen/nutrients or water flow that occurs in commercial hatcheries or earthen pond settings. Similar studies in other aquaculture species highlight how environmental variability can shape early development. Temperature strongly influenced yolk utilization and deformity in European eel (Anguilla anguilla), while water quality and climate factors influenced larval growth and survival in stinging catfish (Heteropneustes fossilis) [44,45]. As such, the observed developmental stages in the guides should be interpreted within the context of these environments. Future research should aim to expand the density ranges evaluated in the larval trials and validate the staging guides across different hatchery systems and environmental regimes. The photographic guides provide valuable qualitative observation, though future refinements could incorporate molecular or histochemical markers to validate specific developmental timepoints to make this guide a more robust reference. Comparable approaches have been used to link physiological and molecular indicators to development in other finfish species. Studies in black tetra (Gymnocorymbus ternetzi) integrated digestive system ontogeny, enzyme activity, and feeding performance, whereas transcriptomic analyses in pikeperch (Sander lucioperca) was performed and revealed gene expression shifts associated with the transition from endogenous to exogenous feeding [46,47]. Such integrations for the striped bass guides would further strengthen the link between morphology, physiology, and gene expression, advancing both hatchery management and the broader biological understanding of early striped bass development. For example, the extent to which the timing of larval production aligns with the availability of natural plankton in the environment has long been proposed as a partial explanation for fluctuations in fish stock recruitment [48].
5. Conclusions
Overall, this study provides contemporary developmental guides for striped bass embryos and larvae that combine morphological and physiological milestones. The combination of embryo and larval staging guides with the analyses of yolk and lipid utilization and early mortality helps clarify how internal energy reserves and developmental timing define the critical window between hatch and first feeding. The incorporation of degree day standardization and digital imaging enhances its relevance across various hatcheries to enable consistent developmental assessment regardless of environmental variation. Beyond the guides’ value as a hatchery tool, this integrated framework strengthens the biological foundation for improving larval quality and survival for striped bass aquaculture. Linking visual and energetic development establishes a reproducible framework for evaluating rearing success, informing both applied management and future physiological or molecular validation studies. Collectively, these contributions advance striped bass aquaculture towards a future with greater precision, reproducibility, and biological insight, as well as offering a model for other species where early developmental bottlenecks constrain production.
Author Contributions
Conceptualization, R.W.C., M.S.H. and B.J.R.; Data curation, E.K.; Formal analysis, E.K.; Funding acquisition, B.J.R.; Methodology, E.K., R.W.C. and M.S.H.; Project administration, B.J.R.; Resources, R.W.C., M.S.H. and B.J.R.; Supervision, R.B., W.G.C., N.M. and B.J.R.; Writing—original draft, E.K.; Writing—review & editing, E.K., R.B., W.G.C., N.M. and B.J.R. All authors have read and agreed to the published version of the manuscript.
Funding
This research was supported by the North Carolina State University Agricultural Foundation and the William White Endowment. Additional support was provided by the National Oceanic and Atmospheric Administration Advanced Aquaculture Collaborative Programs (A/2019-AQUA-02; Establishing the Sea Grant Striped Bass Aquaculture Hub, “StriperHub”), the National Sea Grant College Program Special Projects (R/22-AQUA-06), and NOAA Marine Finfish Aquaculture: Juvenile Production Technologies (R/22-AQUA-03). The striped bass is a priority species for the United States Department of Agriculture National Institute of Food and Agriculture Multi-State National Research Support Project 8 (NRSP-8), National Animal Genome Research Program. Funding to support the National Program for Genetic Improvement and Selective Breeding for the Hybrid Striped Bass Industry was provided by NRSP-8, USDA National Institute of Food and Agriculture (Hatch Multistate Project), and the USDA Agricultural Research Service (Harry K. Dupree Stuttgart National Aquaculture Research Center, Stuttgart, AR, USA).
Institutional Review Board Statement
This study was carried out in accordance with the Guide for the Care and Use of Laboratory Animals of the National Institutes of Health [49] and under protocols approved by the Institutional Animal Care and Use Committee of North Carolina State University (Approval Code: 10-042-A, 19-065-O, and 25-192-A; Approval Date: 21 April 2025).
Data Availability Statement
The raw data supporting the conclusions of this article will be made available by the authors on request.
Acknowledgments
We thank the North Carolina State University Pamlico Aquaculture Field Laboratory for facilities and technical support during spawning and larval rearing. This manuscript is publication number 131 from the North Carolina State University Pamlico Aquaculture Field Laboratory. The larval mortality and yolk consumption data were collected as part of an undergraduate student research project, and we thank Kenneth Erickson who worked as a NOAA Ernest F. Hollings Undergraduate Scholar.
Conflicts of Interest
The authors declare no conflicts of interest.
Abbreviation
The following abbreviation is used in this manuscript:
| Dph | Days post-hatch |
References
- Vadstein, O.; Attramadal, K.J.K.; Bakke, I.; Olsen, Y. K-selection as a microbial community management strategy: A method for improved viability of larvae in aquaculture. Front. Microbiol. 2018, 9, 2730. [Google Scholar] [CrossRef] [Scilit]
- Oz, I.; Gajbhiye, D.S.; Columbus-Shenkar, Y.Y.; David, L.; Golan, M. Non-uniform metamorphosis underlies different development trajectories in hatchery-reared flathead grey mullet (Mugil cephalus). Front. Mar. Sci. 2022, 9, 967984. [Google Scholar] [CrossRef] [Scilit]
- Woolley, L.D.; Qin, J.G. Swimbladder inflation and its implication to the culture of marine finfish larvae. Rev. Aquac. 2010, 2, 181–190. [Google Scholar] [CrossRef] [Scilit]
- Aydın, İ.; Alemdağ, M.; Terzi, Y.; Öztürk, R.Ç.; Küçük, E.; Polat, H.; Çoban, D. Ontogeny of vertebral column and fin development, and detection of deformations in hatchery-reared European flounder (Platichthys flesus) during early life stage. Aquaculture 2024, 582, 740498. [Google Scholar] [CrossRef] [Scilit]
- Chandra, G.; Saini, V.P.; Kumar, S.; Fopp-Bayat, D. Deformities in fish: A barrier for responsible aquaculture and sustainable fisheries. Rev. Aquac. 2024, 16, 872–891. [Google Scholar] [CrossRef] [Scilit]
- Lv, X.; Wang, Y.; Xiao, Z.; Liu, Q.; Xu, S.; Zhai, J.; Li, J. Skeletal ontogeny and deformity during the early fry culture process for Epinephelus lanceolatus. Aquaculture 2019, 508, 113–126. [Google Scholar] [CrossRef] [Scilit]
- Martinez, G.M.; Bolker, J.A. Embryonic and larval staging of summer flounder (Paralichthys dentatus). J. Morphol. 2002, 255, 162–176. [Google Scholar] [CrossRef] [Scilit] [PubMed]
- Parichy, D.M.; Elizondo, M.R.; Mills, M.G.; Gordon, T.N.; Engeszer, R.E. Normal table of postembryonic zebrafish development: Staging by externally visible anatomy of the living fish. Dev. Dyn. 2009, 238, 2975–3015. [Google Scholar] [CrossRef] [Scilit] [PubMed]
- Cucchi, P.; Sucré, E.; Santos, R.; Leclère, J.; Charmantier, G.; Castille, R. Embryonic development of the sea bass Dicentrarchus labrax. Helgol. Mar. Res. 2012, 66, 199–209. [Google Scholar] [CrossRef] [Scilit]
- Andersen, L.; Clark, R.; Hopper, M.; Hodson, R.; Schilling, J.; Daniels, H.; Kenter, L. Methods of domestic Striped Bass (Morone saxatilis) spawning that do not require the use of any hormone induction. Aquaculture 2021, 533, 736025. [Google Scholar] [CrossRef] [Scilit]
- Eldridge, M.B.; Whipple, J.A.; Bowers, M.J. Bioenergetics and growth of striped bass, Morone saxatilis, embryos and larvae. Fish. Bull. 1982, 80, 461–474. [Google Scholar]
- Fritzsche, R.A.; Johnson, G.D. Early osteological development of white perch and striped bass with emphasis on identification of their larvae. Trans. Am. Fish. Soc. 1980, 109, 387–406. [Google Scholar] [CrossRef] [Scilit]
- Mansueti, R. Eggs, Larvae and Young of the Striped Bass, Roccus Saxatilis; Maryland Department of Research and Education: Baltimore, MD, USA, 1958; Volume 112, pp. 1–35. [Google Scholar]
- Harrell, R.M.; Kerby, J.H.; Minton, R.V. (Eds.) Culture and Propagation of Striped Bass and Its Hybrids; Striped Bass Committee, Southern Division, American Fisheries Society: Bethesda, MD, USA, 1990. [Google Scholar]
- Bonn, E.W.; Bailey, W.M.; Bayless, J.D.; Erickson, K.E.; Stevens, R.E. (Eds.) Guidelines for Striped Bass Culture; Striped Bass Committee, Southern Division, American Fisheries Society: Bethesda, MD, USA, 1976. [Google Scholar]
- Bayless, J.D. Artificial Propagation and Hybridization of Striped Bass, Morone saxatilis (Walbaum); South Carolina Wildlife Resources Department: West Columbia, SC, USA, 1972. [Google Scholar]
- U.S. Fish and Wildlife Service. Biological Report: Striped Bass (Morone saxatilis); U.S. Department of the Interior: Washington, DC, USA, 1978; pp. 95–103. [Google Scholar]
- Gajbhiye, D.S.; Oz, I.; Columbus-Shenkar, Y.Y.; Golan, M. Larval development staging table for hatchery-reared sunshine bass (Morone chrysops ♀ × Morone saxatilis ♂). Aquaculture 2022, 546, 737379. [Google Scholar] [CrossRef] [Scilit]
- Quirós-Pozo, R.; Concu, D.; Robaina, L.; Vallainc, D.; Loi, B.; Roo, J. Effects of Different Co-Feeding Protocols on the Early Weaning of Flathead Grey Mullet (Mugil cephalus) Larvae. Animals 2023, 13, 1685. [Google Scholar] [CrossRef] [Scilit]
- Xiong, J.; Dai, W.; Li, C. Advances, challenges, and directions in shrimp disease control: The guidelines from an ecological perspective. Appl. Microbiol. Biotechnol. 2016, 100, 6947–6954. [Google Scholar] [CrossRef] [Scilit]
- Kalaiselvan, P.; Ranjan, A.; Nazir, M.I.; Suresh, E. Exploring ontogenic development and larval rearing of striped murrel (Channa striatus). Aquac. Int. 2024, 32, 9711–9754. [Google Scholar] [CrossRef] [Scilit]
- Houston, R.D.; Bean, T.P.; Macqueen, D.J.; Gundappa, M.K.; Jin, Y.H.; Jenkins, T.L.; Selly, S.L.C.; Martin, S.A.M.; Stevens, J.R.; Santos, E.M.; et al. Harnessing genomics to fast-track genetic improvement in aquaculture. Nat. Rev. Genet. 2020, 21, 389–409. [Google Scholar] [CrossRef] [Scilit]
- Moran, M.N.; Jones, D.B.; Jensen, S.A.; Marcoli, R.; Jerry, D.R. Optimising commercial traits through gene editing in aquaculture: Strategies for accelerating genetic improvement. Rev. Aquac. 2024, 16, 1127–1159. [Google Scholar] [CrossRef] [Scilit]
- Rogers, B.A.; Westin, D.T.; Saila, S.B. Life Stage Duration Studies on Hudson River Striped Bass, Morone saxatilis (Walbaum); NOAA: Silver Spring, MD, USA, 1977. Available online: https://repository.library.noaa.gov/view/noaa/35581 (accessed on 22 January 2026).
- Andersen, L.K.; Clark, R.W.; McGinty, A.S.; Hopper, M.S.; Kenter, L.W.; Salger, S.A.; Schilling, J.; Hodson, R.G.; Kovach, A.I.; Berlinsky, D.L.; et al. Volitional tank spawning of domestic Striped Bass (Morone saxatilis) using human chorionic gonadotropin (hCG) and gonadotropin-releasing hormone analogue (GnRHa)-induced “pace-setting” females. Aquaculture 2021, 543, 735967. [Google Scholar] [CrossRef] [Scilit]
- Reading, B.J.; McGinty, A.; Clark, R.; Hopper, M.; Woods, L.C., III; Baltzegar, D. Genomic enablement of temperate bass aquaculture (family Moronidae). In Breeding and Culture of Perch and Bass; Science China Press (Chinese Academy of Sciences): Beijing, China, 2018; pp. 1–15. [Google Scholar]
- Kendrick, E.K.; Mamoozadeh, N.; Cope, W.G.; Borski, R.; Clark, R.W.; Hopper, M.S.; Reading, B.J. Evaluation of Pondside Tank Rearing Systems for Juvenile Striped Bass Production. Aquac. Rep. 2026; under review.
- Gilbert, S.F. Early development in fish. In Developmental Biology, 6th ed.; Sinauer Associates: Sunderland, MA, USA, 2000. Available online: https://www.ncbi.nlm.nih.gov/books/NBK10100/ (accessed on 4 November 2025).
- Andersen, L.K.; Abernathy, J.; Berlinsky, D.L.; Bolton, G.; Booker, M.M.; Borski, R.J.; Brown, T.; Cerino, D.; Ciaramella, M.; Clark, R.W.; et al. The status of striped bass, Morone saxatilis, as a commercially ready species for U.S. marine aquaculture. J. World Aquac. Soc. 2021, 52, 710–730. [Google Scholar] [CrossRef] [Scilit]
- artínez-Brown, J.M.; Álvarez-González, F.; Ibarra-Castro, L.; la Parra, M.I.A.-D.; Rodríguez-Ibarra, L.E.; Rojo-Cebreros, A.H.; Navarro-Flores, J. Benchmarking of early ontogeny parameters as predictors of the first-feeding larvae vitality in spotted rose snapper Lutjanus guttatus. Aquac. Rep. 2023, 30, 101619. [Google Scholar] [CrossRef] [Scilit]
- Reading, B.J.; Andersen, L.K.; Ryu, Y.-W.; Mushirobira, Y.; Todo, T.; Hiramatsu, N. Oogenesis and Egg Quality in Finfish: Yolk Formation and Other Factors Influencing Female Fertility. Fishes 2018, 3, 45. [Google Scholar] [CrossRef] [Scilit]
- Reading, B.J.; Hiramatsu, N.; Sawaguchi, S.; Matsubara, T.; Hara, A.; Lively, M.O.; Sullivan, C.V. Conserved and Variant Molecular and Functional Features of Multiple Egg Yolk Precursor Proteins (Vitellogenins) in White Perch (Morone americana) and other Teleosts. Mar. Biotechnol. 2009, 11, 169–187. [Google Scholar] [CrossRef] [Scilit]
- Hiramatsu, N.; Todo, T.; Sullivan, C.V.; Schilling, J.; Reading, B.J.; Matsubara, T.; Ryu, Y.-W.; Mizuta, H.; Luo, W.; Nishimiya, O.; et al. Ovarian yolk formation in fishes: Molecular mechanisms underlying formation of lipid droplets and vitellogenin-derived yolk proteins. General. Comp. Endocrinol. 2015, 221, 9–15. [Google Scholar] [CrossRef] [Scilit] [PubMed]
- Williams, V.N.; Reading, B.J.; Hiramatsu, N.; Amano, H.; Glassbrook, N.; Hara, A.; Sullivan, C.V. Multiple vitellogenins and product yolk proteins in striped bass, Morone saxatilis: Molecular characterization and processing during oocyte growth and maturation. Fish Physiol. Biochem. 2014, 40, 395–415. [Google Scholar] [CrossRef] [Scilit] [PubMed]
- Williams, V.N.; Reading, B.J.; Amano, H.; Hiramatsu, N.; Schilling, J.; Salger, S.A.; Islam Williams, T.; Gross, K.; Sullivan, C.V. Proportional accumulation of yolk proteins derived from multiple vitellogenins is precisely regulated during vitellogenesis in striped bass (Morone saxatilis). J. Exp. Zool. 2014, 321A, 301–315. [Google Scholar] [CrossRef] [Scilit] [PubMed]
- Reading, B.J.; Sullivan, C.V. The Reproductive Organs and Processes, Vitellogenesis in Fishes. In Encyclopedia of Fish Physiology; Farrell, A.P., Ed.; Academic Press: Cambridge, MA, USA, 2011; pp. 635–646. [Google Scholar]
- Reading, B.J.; Sullivan, C.V.; Schilling, J. Vitellogenesis in Fishes, Reference Module in Life Sciences; Elsevier: Amsterdam, The Netherlands, 2017. [Google Scholar]
- Chapman, R.W.; Reading, B.J.; Sullivan, C.V. Ovary Transcriptome Profiling via Artificial Intelligence Reveals a Transcriptomic Fingerprint Predicting Egg Quality in Striped Bass, Morone saxatilis. PLoS ONE 2014, 9, e96818. [Google Scholar] [CrossRef] [Scilit]
- Logan, H.J. Comparison of growth and survival rates of striped bass and striped bass x white bass hybrids under controlled environments. In Proceedings of the Annual Conference Southeastern Association of Game and Fish Commissioners; SEAFWA: Aiken, SC, USA, 1967; Volume 21, pp. 260–263. [Google Scholar]
- Tuncer, H.; Harrell, R.M.; Houde, E.D. Comparative energetics of striped bass (Morone saxatilis) and hybrid (M. saxatilis × M. chrysops) juveniles. Aquaculture 1990, 86, 387–400. [Google Scholar] [CrossRef] [Scilit]
- Neibauer, J.; Branville, C.; Holmes, K.; Hauser, E.; Firkus, T. Unobserved mortality occurs early in larval walleye (Sander vitreus) aquaculture. Front. Aquac. 2024, 3, 1387495. [Google Scholar] [CrossRef] [Scilit]
- Fischbach, V.; Finke, A.; Moritz, T.; Polte, P.; Thieme, P. A staging system for Atlantic herring (Clupea harengus) larvae based on external morphology and skeletal development. Limnol Ocean. Methods 2023, 21, 357–376. [Google Scholar] [CrossRef] [Scilit]
- Gaballah, S.; Swank, A.; Sobus, J.R.; Howey, X.M.; Schmid, J.; Catron, T.; McCord, J.; Hines, E.; Strynar, M.; Tal, T. Evaluation of Developmental Toxicity, Developmental Neurotoxicity, and Tissue Dose in Zebrafish Exposed to GenX and Other PFAS. Environ. Health Perspect. 2020, 128, 47005. [Google Scholar] [CrossRef] [Scilit] [PubMed]
- Politis, S.N.; Mazurais, D.; Servili, A.; Zambonino-Infante, J.L.; Miest, J.J.; Sørensen, S.R.; Tomkiewicz, J.; AEButts, I. Temperature effects on gene expression and morphological development of European eel, Anguilla anguilla larvae. PLoS ONE 2017, 12, e0182726. [Google Scholar] [CrossRef] [Scilit] [PubMed]
- Mahalder, B.; Haque, M.M.; Siddique, M.A.B.; Hasan, N.A.; Alam, M.M.; Talukdar, M.M.N.; Shohan, M.H.; Ahasan, N.; Hasan, M.M.; Ahammad, A.K.S. Embryonic and Larval Development of Stinging Catfish, Heteropneustes fossilis, in Relation to Climatic and Water Quality Parameters. Life 2023, 13, 583. [Google Scholar] [CrossRef] [Scilit] [PubMed]
- Franz, G.P.; Tönißen, K.; Rebl, A.; Lutze, P.; Grunow, B. The expression of myogenic gene markers during the embryo-larval-transition in Pikeperch (Sander lucioperca). Aquac. Res. 2022, 53, 4767–4781. [Google Scholar] [CrossRef] [Scilit]
- Lipscomb, T.N.; Yanong, R.P.; Ramee, S.W.; DiMaggio, M.A. Histological, histochemical and biochemical characterization of larval digestive system ontogeny in black tetra (Gymnocorymbus ternetzi) to inform aquaculture weaning protocols. Aquaculture 2020, 520, 734957. [Google Scholar] [CrossRef] [Scilit]
- Cushing, D.H. Plankton Production and Year-class Strength in Fish Populations: An Update of the Match/Mismatch Hypothesis. Adv. Mar. Biol. 1990, 26, 249–293. [Google Scholar] [CrossRef] [Scilit]
- National Research Council (NRC). Guide for the Care and Use of Laboratory Animals; The National Academies Press: Cambridge, MA, USA, 1996. [Google Scholar] [CrossRef] [Scilit]
Disclaimer/Publisher’s Note: The statements, opinions and data contained in all publications are solely those of the individual author(s) and contributor(s) and not of MDPI and/or the editor(s). MDPI and/or the editor(s) disclaim responsibility for any injury to people or property resulting from any ideas, methods, instructions or products referred to in the content. |
© 2026 by the authors. Licensee MDPI, Basel, Switzerland. This article is an open access article distributed under the terms and conditions of the Creative Commons Attribution (CC BY) license.