


Abstract
This study aimed to evaluate the stock status of the Japanese flying squid (Todarodes pacificus), a critical fishery resource in the waters of Korea, China, and Japan. To achieve this objective, we employed the Bio-Economic Stock Assessment (BESA) model, which integrates catch and market price data to estimate the biological and economic parameters of Japanese flying squid biomass. The assessment results indicated that the current biomass level of Japanese flying squid is below the biomass at Maximum Sustainable Yield (), suggesting that the stock is overfished. Moreover, the findings from the BESA model were consistent with results obtained from the Monte Carlo Method (CMSY) and Bayesian State-Space (BSS) models, both of which also indicated a collapsed status. Unlike the CMSY and BSS models, which rely on catch and catch per unit effort (CPUE) data, the BESA model utilizes market price data from National Statistics and the Food and Agriculture Organization (FAO), thereby eliminating the need for CPUE standardization. Consequently, the BESA model presents an alternative framework that complements existing assessment methods and enhances the reliability of fishery stock evaluations through its integrated approach, suggesting its potential applicability to the stock assessment of Japanese flying squid in Korea.
Keywords:
stock assessment; market price; catch per unit effort standardization; Maximum Sustainable Yield; Maximum Economic Yield; data-limited fisheries Key Contribution:
This study applies the BESA model, integrating catch and market price data, to reveal the overfished status of Japanese flying squid, offering a reliable alternative to traditional stock assessment methods.
1. Introduction
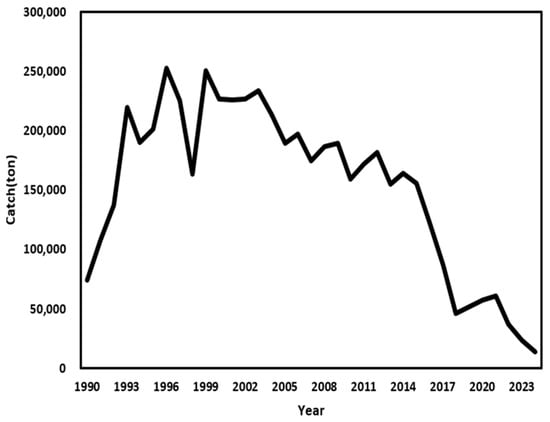
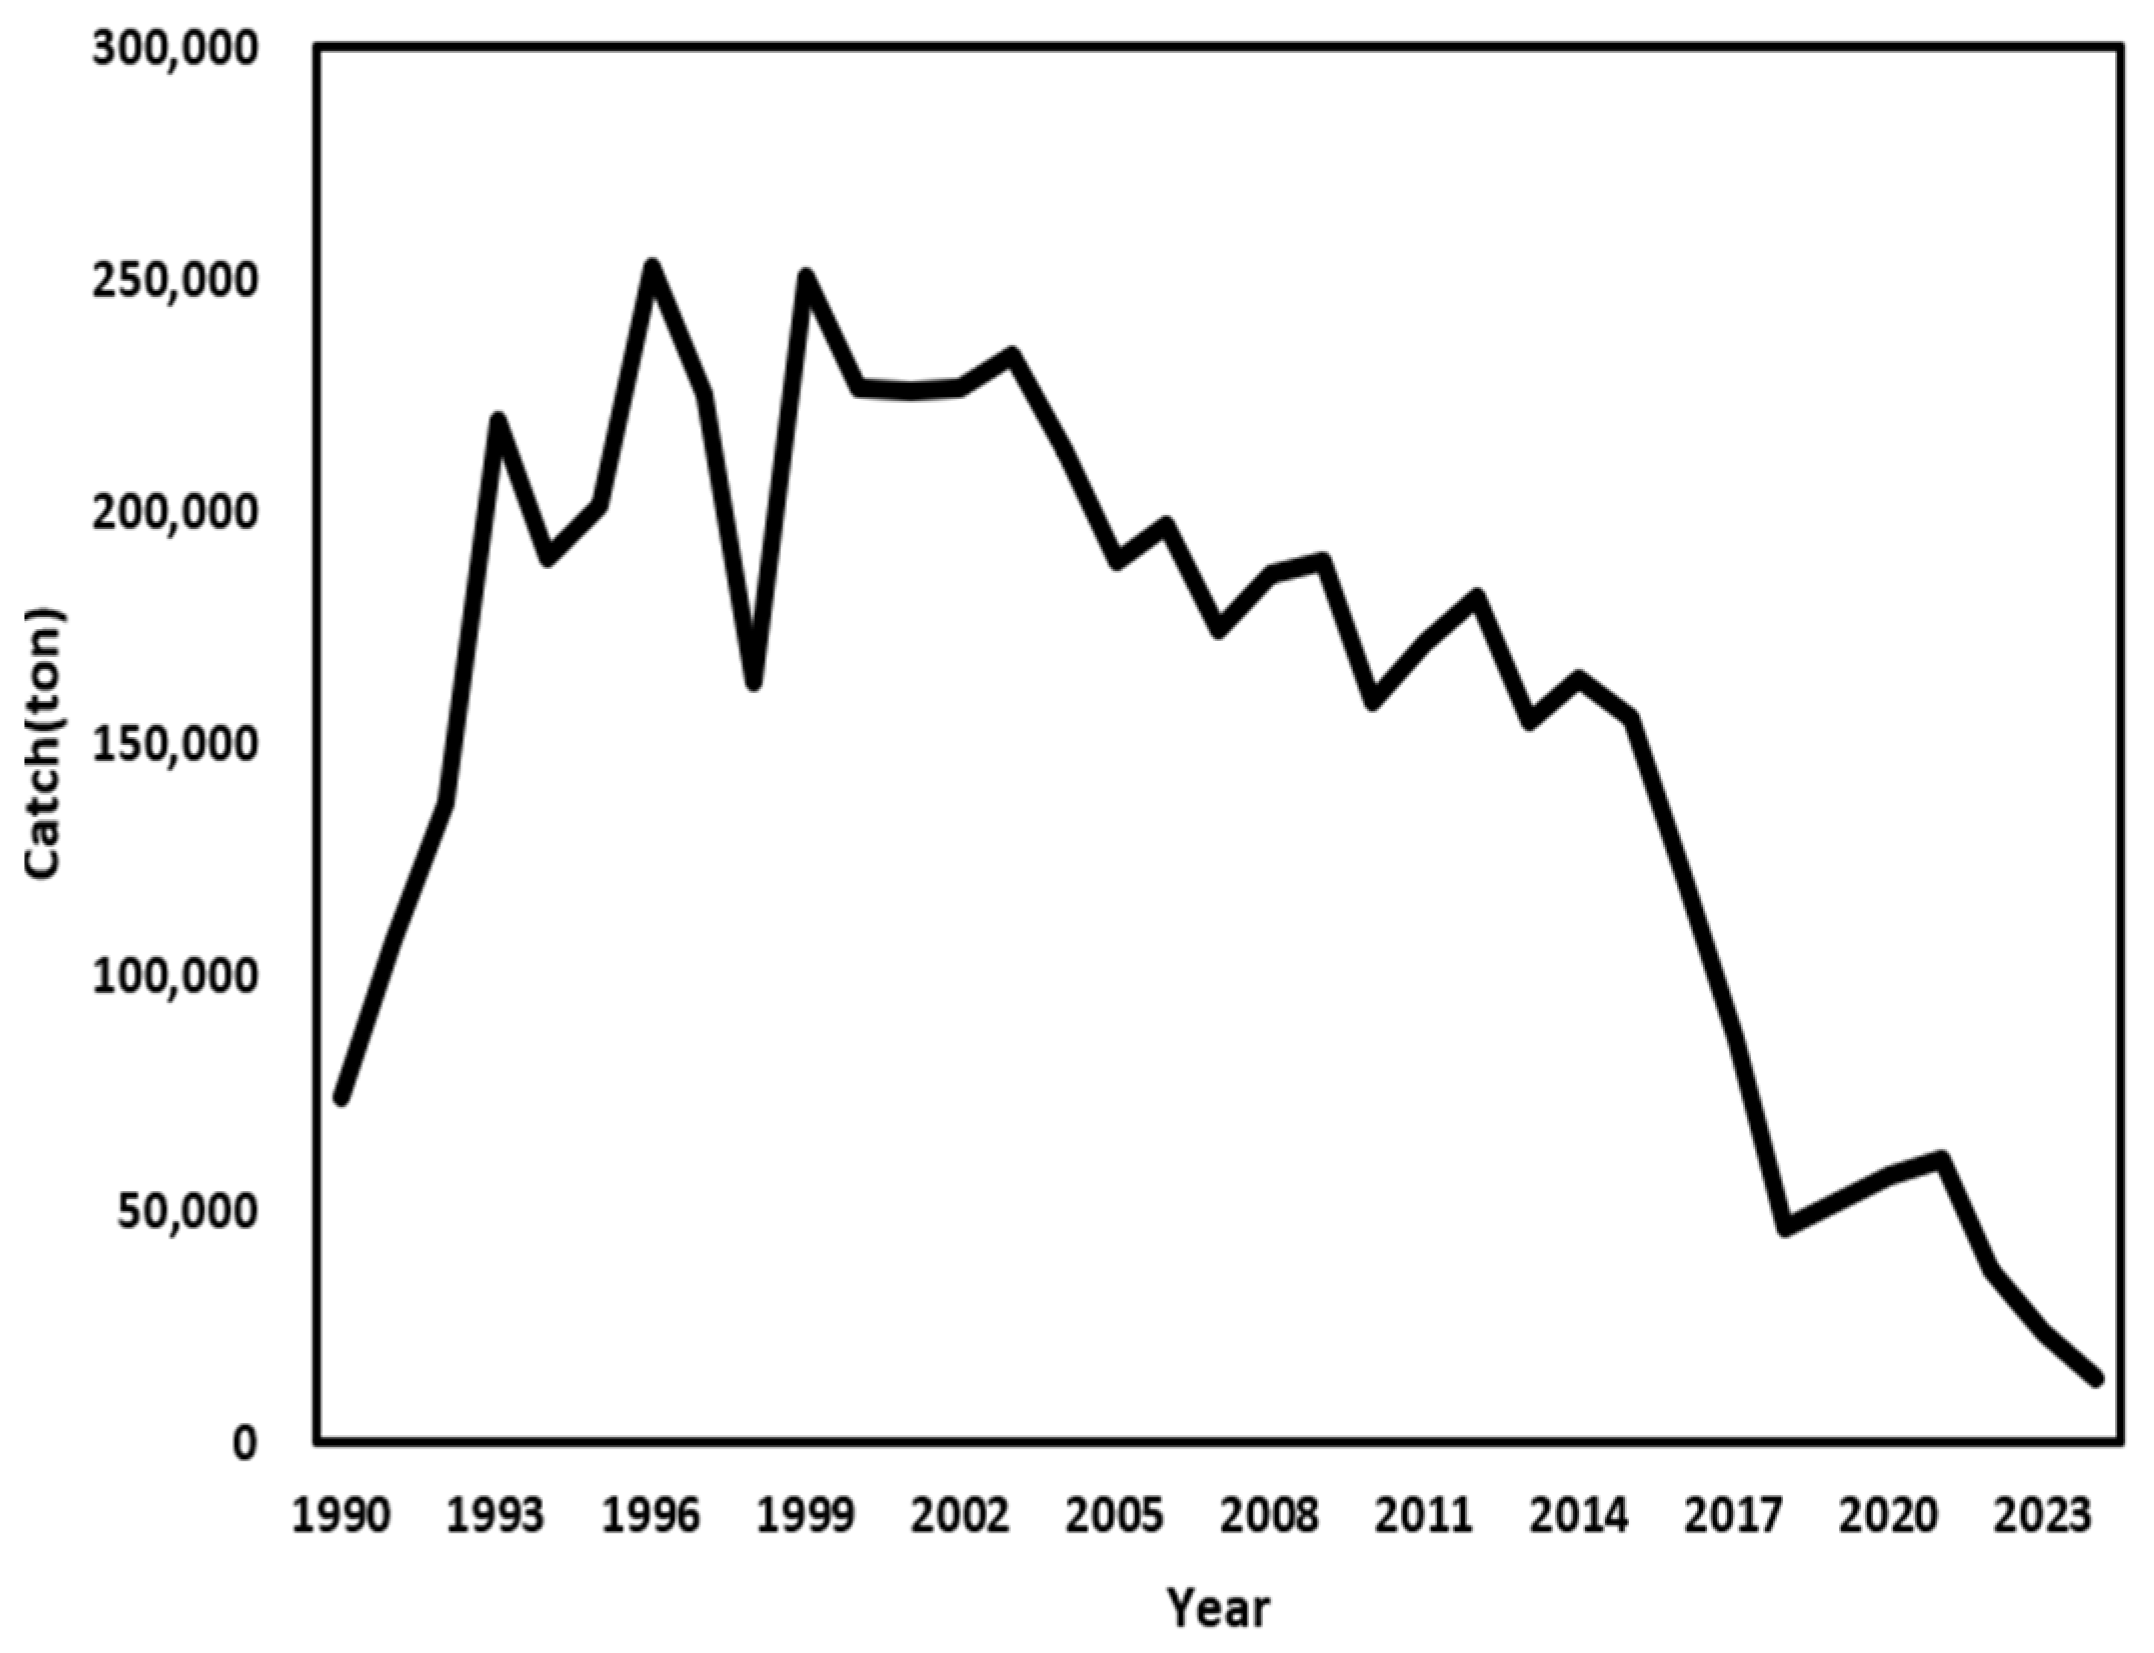
The Japanese flying squid (Todarodes pacificus) is a vital commercial species in Korea, with catches declining from a peak of 252,618 tons in 1996 to merely 13,546 tons in 2024, representing only 5.4% of the peak level [1]. Similar trends have been observed in neighboring countries, including China and Japan [2,3]. Despite this decline in catch, domestic consumer demand for Japanese flying squid remains robust, as a recent national perception survey indicates it is the most preferred seafood product among the public [4].
To promote the sustainable use and management of marine resources, Korea established the Total Allowable Catch (TAC) system in 1998. The Japanese flying squid was first integrated into the TAC framework in 2007 across four fisheries: squid jigging, mid-sized trawl, large trawl, and large purse seine. Additional fisheries, including large pair-trawl in 2018 and offshore gillnet in 2020, were subsequently incorporated into the system [5]. Recent government initiatives, such as the “Fishery Innovation 2030 Plan” and “Fisheries Modernization Measures,” emphasize the importance of TAC-based management for coastal fisheries, underscoring the necessity for precise TAC determinations.
Accurate stock assessment is essential for effective TAC management. Data-limited stock assessments typically utilize models such as the Monte Carlo Method (CMSY) and Bayesian State-Space (BSS) models [6,7]. The CMSY model estimates stock status using only catch data, making it applicable to TAC species in Korea and global fisheries [8,9,10,11,12,13]. Conversely, the BSS model incorporates both catch and catch per unit effort (CPUE) data while accounting for observation and process errors, thereby providing more reliable stock estimates when CPUE data are available [6,14,15,16].
Previous studies on Japanese flying squid in Korea and Japan have predominantly employed CMSY and BSS models, consistently indicating stock depletion below the biomass at Maximum Sustainable Yield () [17,18,19,20,21]. Recently, stock assessment models that incorporate Artificial Neural Networks (ANNs) have been developed to address data-limited scenarios [22]. In situations where available data are limited and uncertain, the accuracy of stock assessments can be enhanced by applying multiple models and comparing their results.
Accordingly, this study utilizes the Bio-Economic Stock Assessment (BESA) model to assess the Japanese flying squid fishery in Korea for the first time, alongside conventional CMSY and BSS models, to evaluate its stock status. The BESA model enhances the BSS framework by integrating catch and market price data to concurrently estimate biological and economic parameters [23]. Market prices influence fishing effort; elevated prices for preferred species may lead to overexploitation [23,24,25].
The BESA model has been validated across various species, yielding estimates that align with those derived from the Stochastic Surplus Production Model in Continuous Time (SPiCT) model [23]. Considering the recent decline in catches of Japanese flying squid, coupled with a significant increase in market prices and intensified fishing pressure across multiple sectors, the application of the BESA model offers a valuable method for enhancing stock assessment accuracy under current fishery conditions. This study employs the BESA model to evaluate the stock status of Japanese flying squid and utilizes the well-established CMSY and BSS models for comparative analysis with the BESA results. Furthermore, the study provides an indicative estimate of Japanese flying squid populations in the waters of Korea, China, and Japan, considering the species’ migratory behavior.
2. Materials and Methods
2.1. Status and Trends in the Catch of Todarodes pacificus
Annual catches of Japanese flying squid in Korea reached a peak of 252,618 tons in 1996, followed by a declining trend marked by fluctuations throughout the 2000s. Catches fell below 100,000 tons in 2017, recording 87,024 tons, and continued to decline, ultimately reaching 13,546 tons in 2024. This figure represents only 5.4% of the peak observed in 1996 and is over 40% lower than the catch recorded in 2023 (Figure 1) [1].
Figure 1.
Annual catch of Todarodes pacificus by Korea (1990–2024): [1].
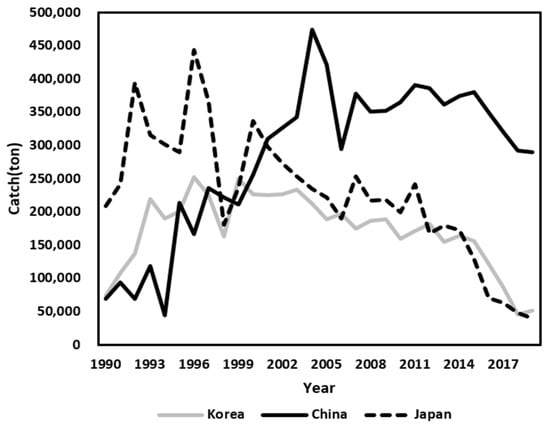
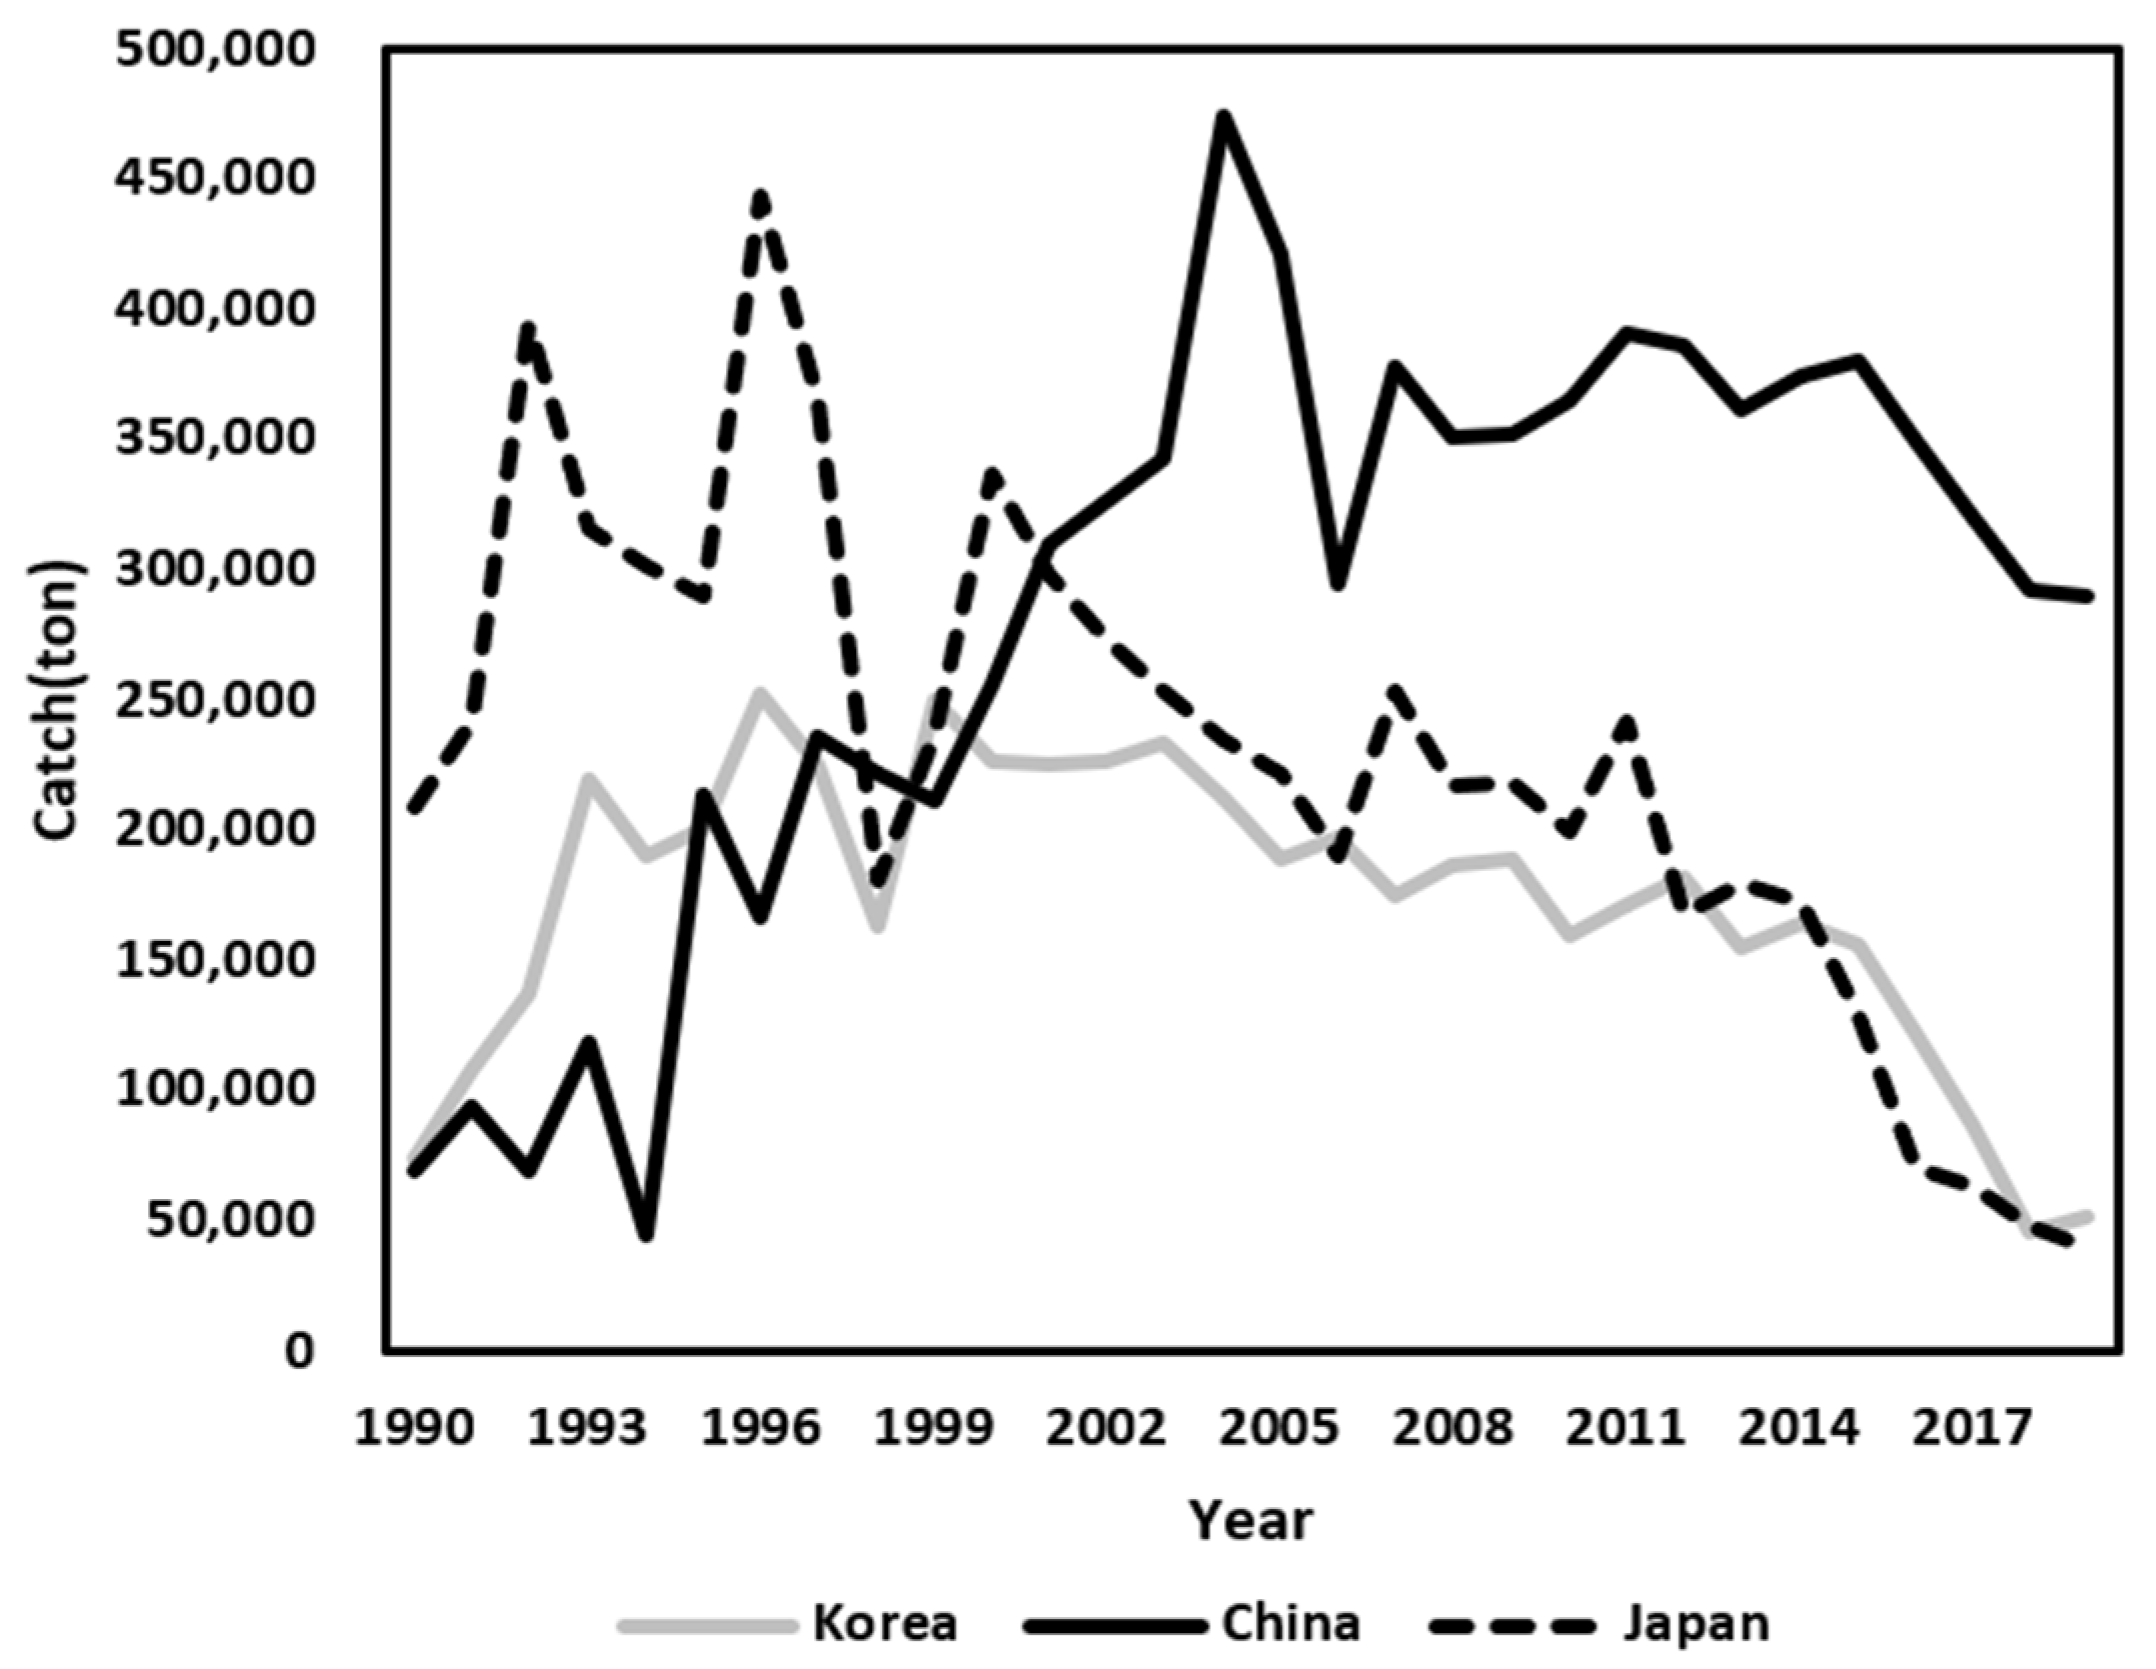
A similar trend has been noted in neighboring countries, including China and Japan. In China, catches increased steadily from 166,319 tons in 1996, peaking at 473,922 tons in 2004, before entering a decline that reduced numbers to 289,987 tons by 2019 [3]. Japan, which historically maintained high catch levels until the 1990s, has also experienced a continuous decline since the early 2000s. As of 2019, Japan’s catch was 39,587 tons, approximately 70% of Korea’s catch level of 51,817 tons during the same year (Figure 2) [2].
Figure 2.
Annual catch of the Todarodes pacificus by Korea, China, and Japan (1990–2019): [1,2,3].
Table 1 presents the average catch of Japanese flying squid by TAC fisheries over the past five years (2020–2024). There has been a significant decline in Japanese flying squid catches since 2021, leading to corresponding decreases across all TAC fisheries. Notably, the mid-sized trawl fishery experienced a sharp decline in 2023, with catches falling to just 3 tons. Collectively, TAC fisheries accounted for approximately 76.8% of the total Japanese flying squid catch, with squid jigging (10,649 tons), large pair-trawl (6608 tons), and large trawl (4426 tons) being the primary contributors [1].
Table 1.
Average annual TAC of Todarodes pacificus by fishery (2020–2024, tons).
The decline of the Japanese flying squid stock in the East Sea can be attributed to a combination of factors. Environmental variability plays a crucial role, as fluctuations in coastal sea temperature and the distribution of thermal fronts significantly impact stock density and fishing efficiency [26,27,28]. Additional pressures include advancements in fishing technology, increased fishing effort [29], collaborative operations between offshore jigging and trawl fisheries (including both large and mid-sized trawls) [30], overfishing by the Chinese fishery [31], and broader marine environmental changes associated with climate change [32]. Furthermore, disruptions in fishing activities resulting from the Russia–Ukraine conflict have led squid jigging vessels to cease operations in Russian waters, significantly contributing to the recent sharp decline in squid jigging production [33].
Specifically, the mid-sized trawl fishery targets Japanese flying squid for approximately five to six months each year and has traditionally been regarded as a profitable sector due to cooperative operations with squid jigging vessels [34]. However, the recent collapse of the squid stock has led to a substantial deterioration in economic performance. The average operating profit of this fishery was 206,241 thousand KRW during 2020–2022 but turned negative in 2023 (−66,999 thousand KRW) and 2024 (−30,946 thousand KRW) [35].
In contrast, the offshore gillnet fishery, which does not primarily target Japanese flying squid (focusing instead on yellow croaker), has been less directly affected by fluctuations in squid abundance. Consequently, the decline in catch within this sector has been comparatively modest [1].
2.2. Analysis Method
The BESA model performs stock assessments through the utilization of state-space modeling and Bayesian inference [23]. This framework capitalizes on the strengths of state-space models to simultaneously address process errors associated with population dynamics and observation errors derived from existing data [36,37].
To implement stock assessments employing Bayesian inference—a statistical analysis technique grounded in Bayes’ theorem—prior distributions must be assigned to the intrinsic growth rate (), carrying capacity (), and market price (). The BESA model operates under a surplus production framework prior to the application of these distributions [38,39]. Consequently, the biomass at time is modeled using a logistic function based on the biomass at time . Acknowledging the inherent uncertainty in biomass, it is assumed to follow a lognormal distribution, as articulated in Equation (1) [23,40,41].
Within this framework, denotes the biomass for year , while represents the harvest for the corresponding year. This study estimates the market price () based on the profit structure of fishermen. According to the Gordon–Schaefer framework, the CPUE is posited to be proportional to biomass. Assuming a constant cost per unit of fishing effort, the fishing cost () is proportional to harvest and inversely proportional to biomass [23]. This relationship is articulated in Equation (2).
Fishing costs are subject to external influences such as climate variability and economic conditions, which can be represented as outlined in Equation (3) [42]. In this context, and denote the stochastic term capturing cost uncertainty and the cost proportionality constant ( > 0), respectively. The marginal cost (MC) per unit of catch is derived by differentiating the fishing cost with respect to harvest, as demonstrated in Equation (4). This represents the incremental cost associated with an additional unit of harvest while controlling for other variables. Given the specified cost structure, the average cost equates to the marginal cost. In an open-access equilibrium, the equilibrium price aligns with the marginal cost, reflecting the proportional relationship between fishermen’s revenue and costs. When the price equals the marginal cost, marginal revenue also equals marginal cost, resulting in zero economic profit. To linearize this relationship, a logarithmic transformation was employed, as shown in Equation (5) [23].
The Maximum Economic Yield (MEY) signifies the harvest level that maximizes social welfare by considering both revenues generated from the harvest and the associated fishing costs. This concept is derived from the social welfare function () outlined in Equation (6). In this equation, revenue is represented as a function of harvest, with indicating the inverse demand function (price as a function of harvest), and representing costs as a function of biomass. To optimize social welfare in relation to biomass and harvest, the optimization process is conducted under the condition , where is the logistic growth function defined in Equation (7) [23].
To attain MEY, it is crucial to maximize the social welfare function presented in Equation (6). This is achieved by differentiating the welfare function with respect to biomass and identifying the point at which the slope equals zero. Subsequently, the growth function from Equation (7) is integrated, leading to the formulation of Equation (8). In this equation, denotes the slope of the growth function, and represents the cost associated with the growth function. Under the equilibrium condition between fish stock growth and fishing costs, the biomass corresponding to MEY () can be estimated using Equation (9), with MEY itself derived from Equation (10) [23].
The prior distribution of was established based on resilience data provided by SeaLifeBase (www.sealifebase.se), in accordance with [4]. Following the methodological definitions outlined in Froese et al. [7], the prior ranges of were categorized into four overlapping classifications: High (0.6–1.5), Medium (0.2–0.8), Low (0.05–0.5), and Very Low (0.015–0.1).
The prior range for was determined based on the relationship between the maximum catch (max(C)) and , in alignment with the three assumptions detailed in Table 2 [7]. Acknowledging that capturing the entire unexploited stock within a single year is impractical, max(C) was utilized to establish the lower bound of under the first assumption. To incorporate the second assumption, max(C) was divided by the upper and lower bounds of , yielding the corresponding upper and lower limits of the prior range for . Consequently, the prior bounds for can be expressed using Equations (11) and (12), where and denote the upper and lower limits of the prior range for , respectively, and and represent the corresponding upper and lower limits for . When the prior biomass is relatively low compared to max(C), Equation (11) is applicable; conversely, Equation (12) is employed when the prior biomass is higher. The prior classification of relative biomass levels () is categorized into three classifications: Low (0.01–0.4), Medium (0.2–0.6), and High (0.5–0.9), as defined in Froese et al. [7].
Table 2.
Assumption for deriving the prior range of k.
Upon establishing the prior ranges for and , ‘’ pairs are generated. The initial biomass for the first year is sampled from the prior biomass range, and biomass for subsequent years is estimated recursively using Equation (1). This iterative process yields a feasible set of ‘’ pairs. Pairs for which the predicted biomass falls below 0.01 or that lie outside the prior biomass range for intermediate or final years are excluded. The resulting feasible pairs typically exhibit a triangular distribution, with most points aligned along two linear boundaries [7]. Among these feasible pairs, the most probable value is determined through a linear regression model based on the Schaefer equation for Maximum Sustainable Yield (MSY), as indicated in Equation (13).
Following the determination of the priors, the model integrates them with a likelihood function that evaluates the goodness of fit between the estimated and observed values. The likelihood function is defined in Equation (14), where, for the observed data are represented as in Equation (15). Each observation at time is assumed to follow a normal distribution , conditional on the previous observations, where and represent the state estimate and its variance, respectively. Taking the logarithm of both sides yields Equation (16). By substituting the residuals () and their variances , the expression can be reformulated into the log-likelihood function, as shown in Equation (17) [23,43].
Deriving the posterior distribution from prior distributions and likelihoods requires high-dimensional integration. Consequently, this study employed the Hamiltonian Monte Carlo (HMC) algorithm—an implementation of Markov Chain Monte Carlo (MCMC) methods—via the rstan package in Rstudio (Version 2024.12.0, Posit Software, PBC, Boston, MA, USA) [23,44]. The MCMC approach generates random samples from the target posterior distribution based on a Markov chain, facilitating stochastic estimation without direct numerical integration [45,46]. Specifically, the No-U-Turn Sampler (NUTS, Version 2.32.6, Stan Development Team, New York, NY, USA) was utilized to efficiently sample from posterior distributions with correlated parameters [45]. The HMC sampling process consisted of a total of 20,000 iterations, with 6000 samples allocated for a warm-up phase to eliminate dependency on initial values. To mitigate autocorrelation among samples, every fifth draw was retained through a thinning procedure [23,47].
The CMSY and BSS models employed the same prior assumptions for r and k as the BESA model; however, they utilized the Just Another Gibbs Sampler (JAGS) software (Version 4.3.2, Martyn Plummer, Geneva, Switzerland) instead of rstan for MCMC-based parameter sampling [6,7]. In these models, Gibbs sampling was applied, with parameters sequentially drawn from their conditional posterior distributions [48]. The MCMC configuration consisted of a total of 60,000 samples, with the initial 30,000 discarded as burn-in to mitigate the influence of initial values. To address autocorrelation, every tenth sample was retained [7]. The terms burn-in (in MCMC) and warm-up (in HMC) are conceptually equivalent, both referring to the removal of early samples to eliminate initialization effects [44,49].
Using the models, the stock status of Japanese flying squid was assessed, and the results were compared across models and with previous studies. Consistent with the classification used in earlier research, the stock status was evaluated based on the ratio of final-year biomass to , as summarized in Table 3, which delineates five stock status categories.
Table 3.
Definitions of stock states based on /.
2.3. Dataset for Analysis
For the stock assessment utilizing the BESA model, data on catch, market price, and resilience were employed. Catch and price data for Japanese flying squid were sourced from the Korean Statistical Information Service (KOSIS), encompassing 35 years of coastal fisheries catch data from 1990 to 2024. Market prices were calculated in accordance with the methodology outlined in Lancker et al. [23], which involves dividing the total production value by the catch. These prices were subsequently adjusted for inflation using the Korean Consumer Price Index (CPI) [1].
Resilience was utilized to define prior ranges for . The prior value for Japanese flying squid (1.12; 95% confidence interval: 0.74–1.68) was derived from SeaLifeBase (www.sealifebase.se) and categorized as having “High” resilience [51,52]. This value was incorporated into the BESA model analysis.
For the CMSY and BSS models, data on catch, CPUE, and resilience were required, differing from the market price data used in the BESA model. CPUE was calculated by dividing the catch of six TAC fisheries targeting Japanese flying squid by the corresponding standardized fishing effort, covering an 18-year period (2006–2023). These six fisheries represented approximately 77% of the total Japanese flying squid catch during the most recent five years (2020–2024).
Due to variability in fishing effort units across different fisheries, standardization was performed using a Generalized Linear Model (GLM) [53]. The goodness of fit of the model was evaluated using Akaike’s Information Criterion (AIC). Among the datasets analyzed, the TON dataset demonstrated the lowest AIC value (376.5) (Table 4) and the highest statistical significance (Table 5), leading to its selection for further analyses. Resilience was integrated in the same manner as in the BESA model.
Table 4.
AIC value per unit.
Table 5.
Significance level of the generalized linear model.
For the stock assessment of Japanese flying squid in the waters of Korea, China, and Japan, the CMSY model was employed exclusively due to the unavailability of CPUE data for China and Japan. The analysis utilized 30 years of catch data (1990–2019), contingent upon data availability. Catch data were obtained from KOSIS for Korea, the Food and Agriculture Organization (FAO) for Japan, and the China Fishery Statistical Yearbook for China [1,2,3].
The China Fishery Statistical Yearbook aggregates the catches of Japanese flying squid under a single category labeled “squid,” without differentiating between species. Among the eight ommastrephid species harvested in the East China Sea, the winter cohort of Japanese flying squid examined in this study is known to spawn in the northern East China Sea [54,55], with the primary fishing grounds encompassing the waters of Korea, China, and Japan [56,57]. Given these spatial and ecological characteristics, the Japanese flying squid has long been recognized as a commercially significant species in the region [21,30,58,59,60,61], and previous transnational assessments have included statistics from the Chinese Fishery Yearbook for this purpose [21].
However, we do not assume that the Japanese flying squid constitutes a known, stable, or dominant proportion of the aggregated “squid” category. Instead, the inclusion of Chinese catch statistics represents an unavoidable data constraint in multinational stock assessments, where species-specific reporting remains limited. This uncertainty is explicitly acknowledged and treated as a structural limitation of the analysis, leading to conservative interpretations of the resulting biomass estimates.
3. Results
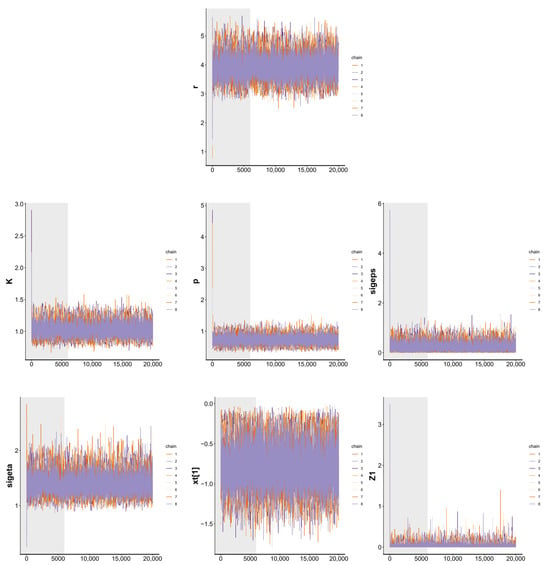
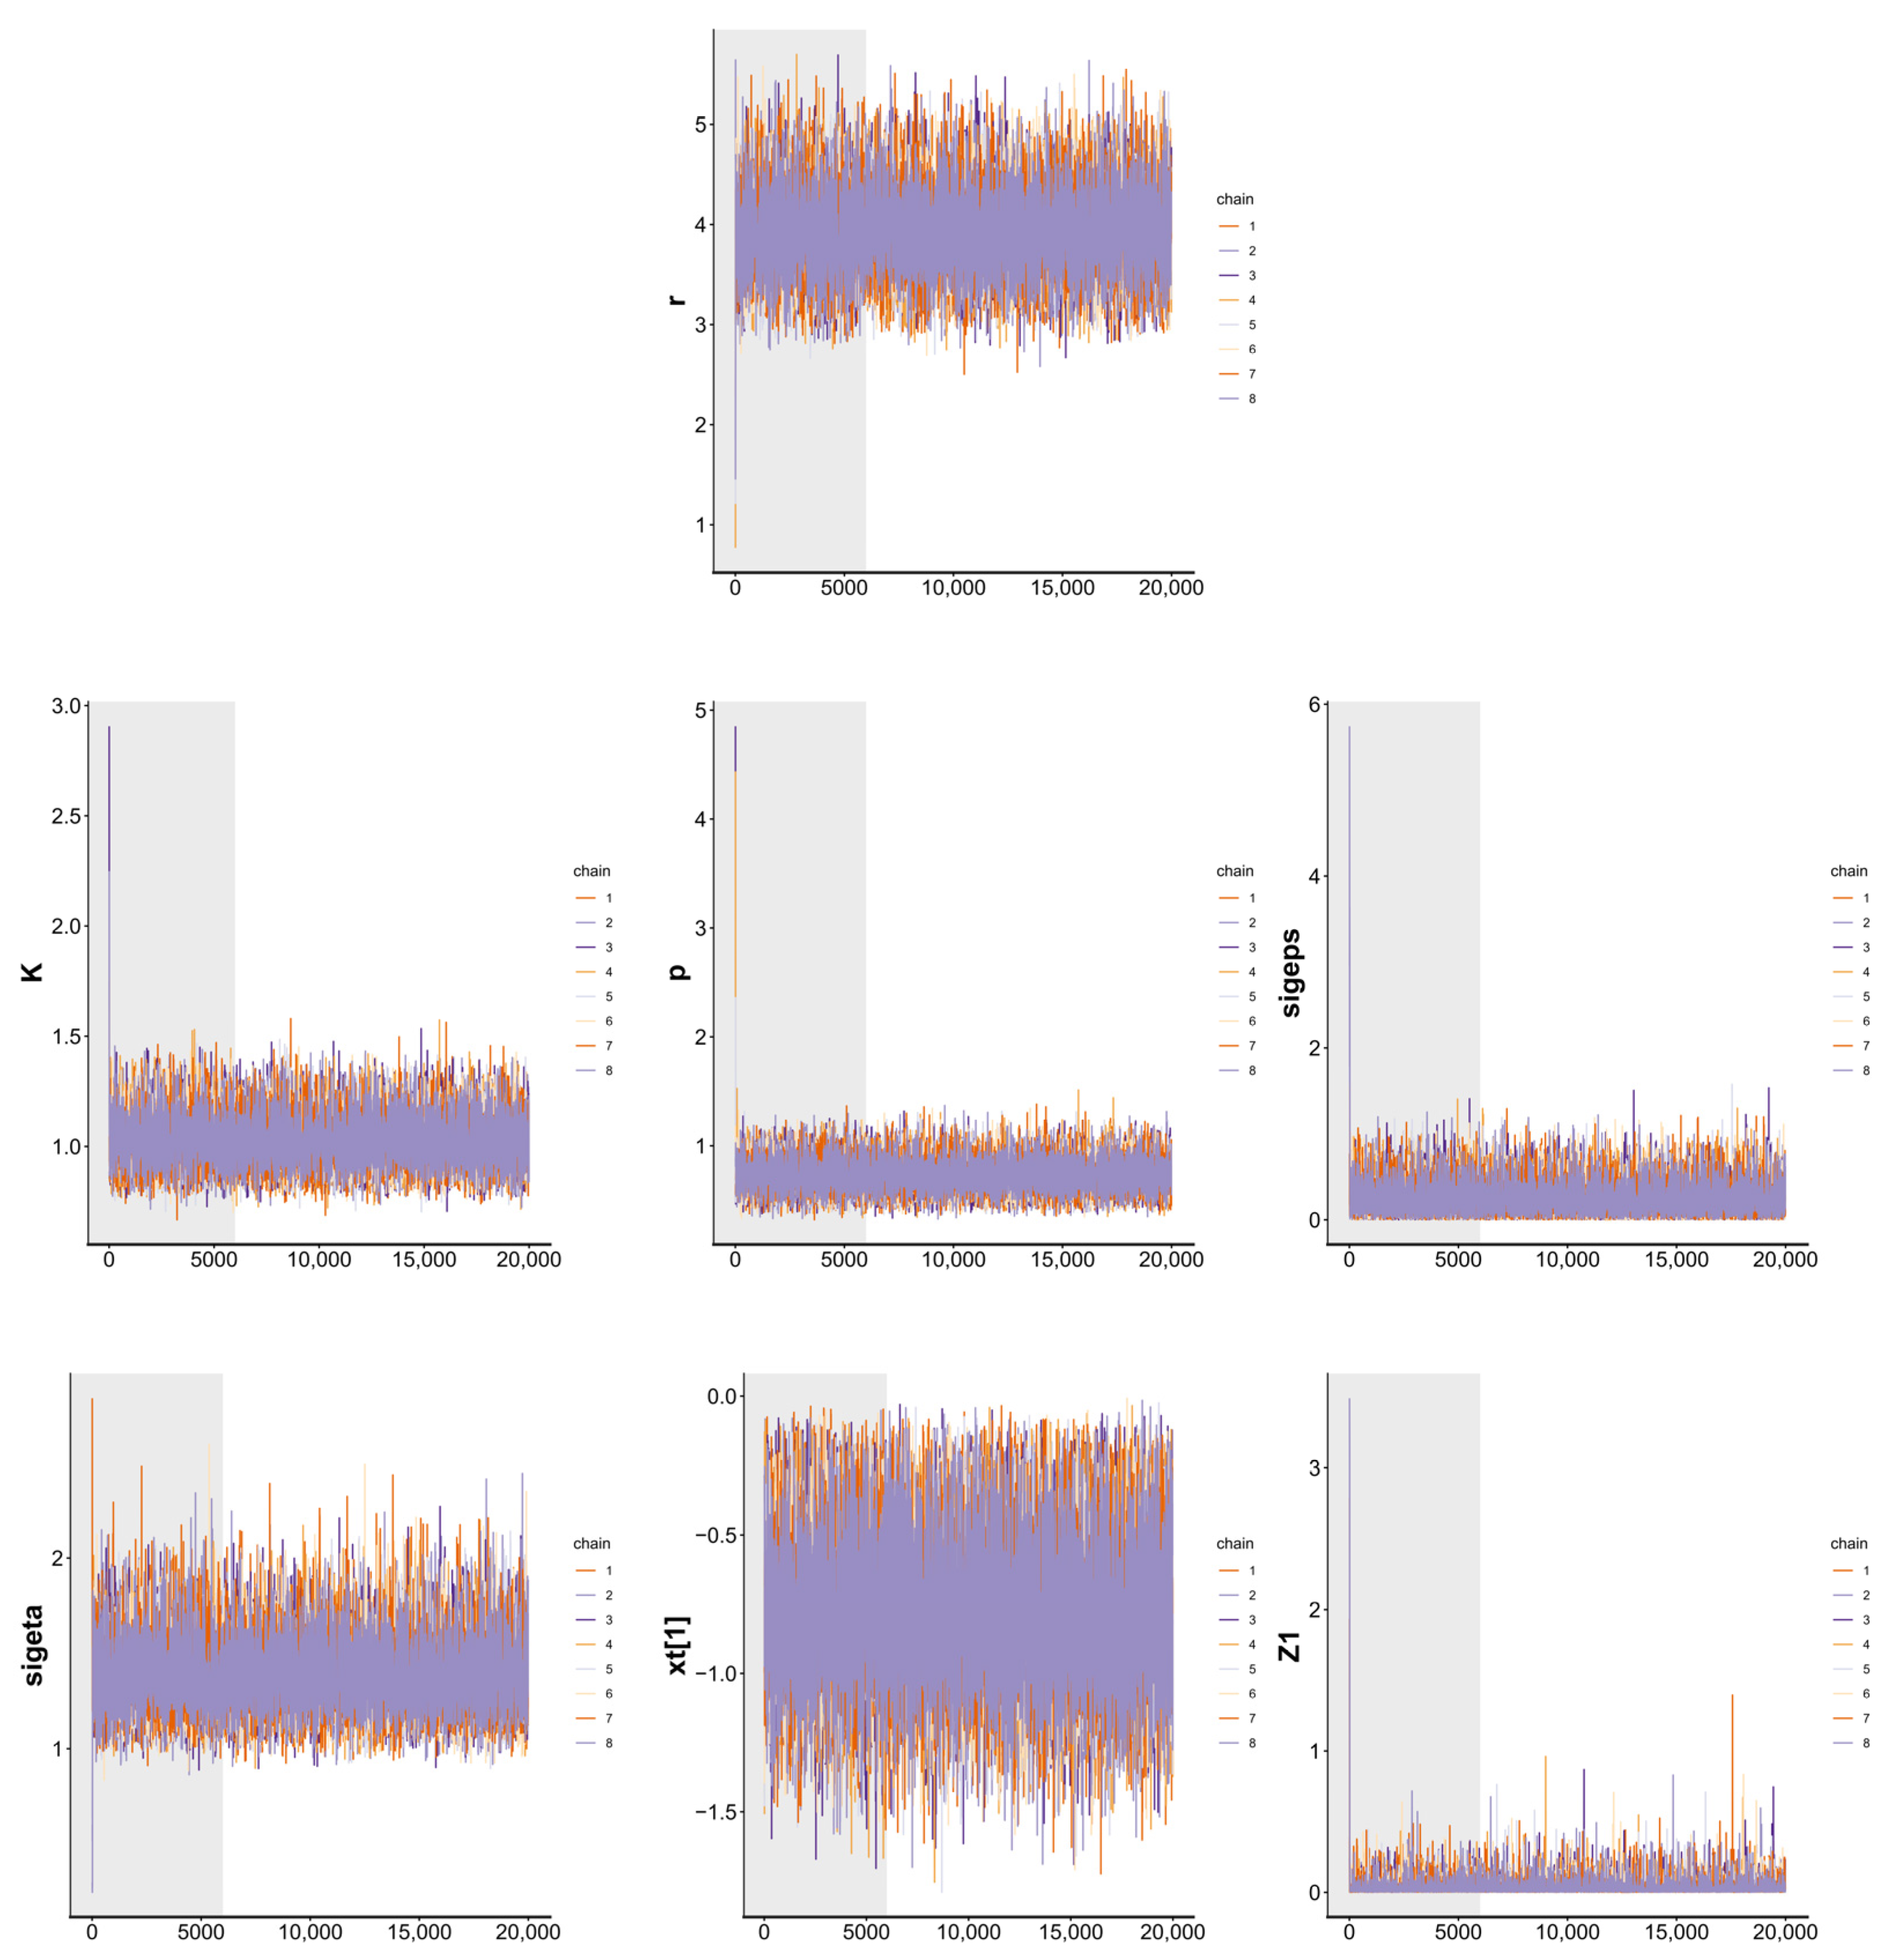
Prior to conducting the stock assessment of Japanese flying squid utilizing the BESA model, trace plots were analyzed to visually evaluate the convergence of estimated parameters. Convergence was confirmed as parameter estimates fluctuated symmetrically around their medians, resembling white noise [62]. As illustrated in Figure 3, all estimated parameters exhibited random fluctuations without discernible trends, indicating satisfactory convergence.
Figure 3.
Trace plots for NUTS (from the top left): , , , sigma epsilon, sigma eta, starting depletion (X1), and variance of X1 (Z1).
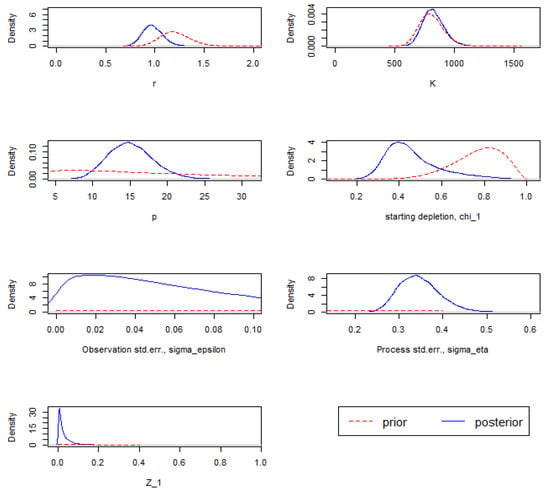
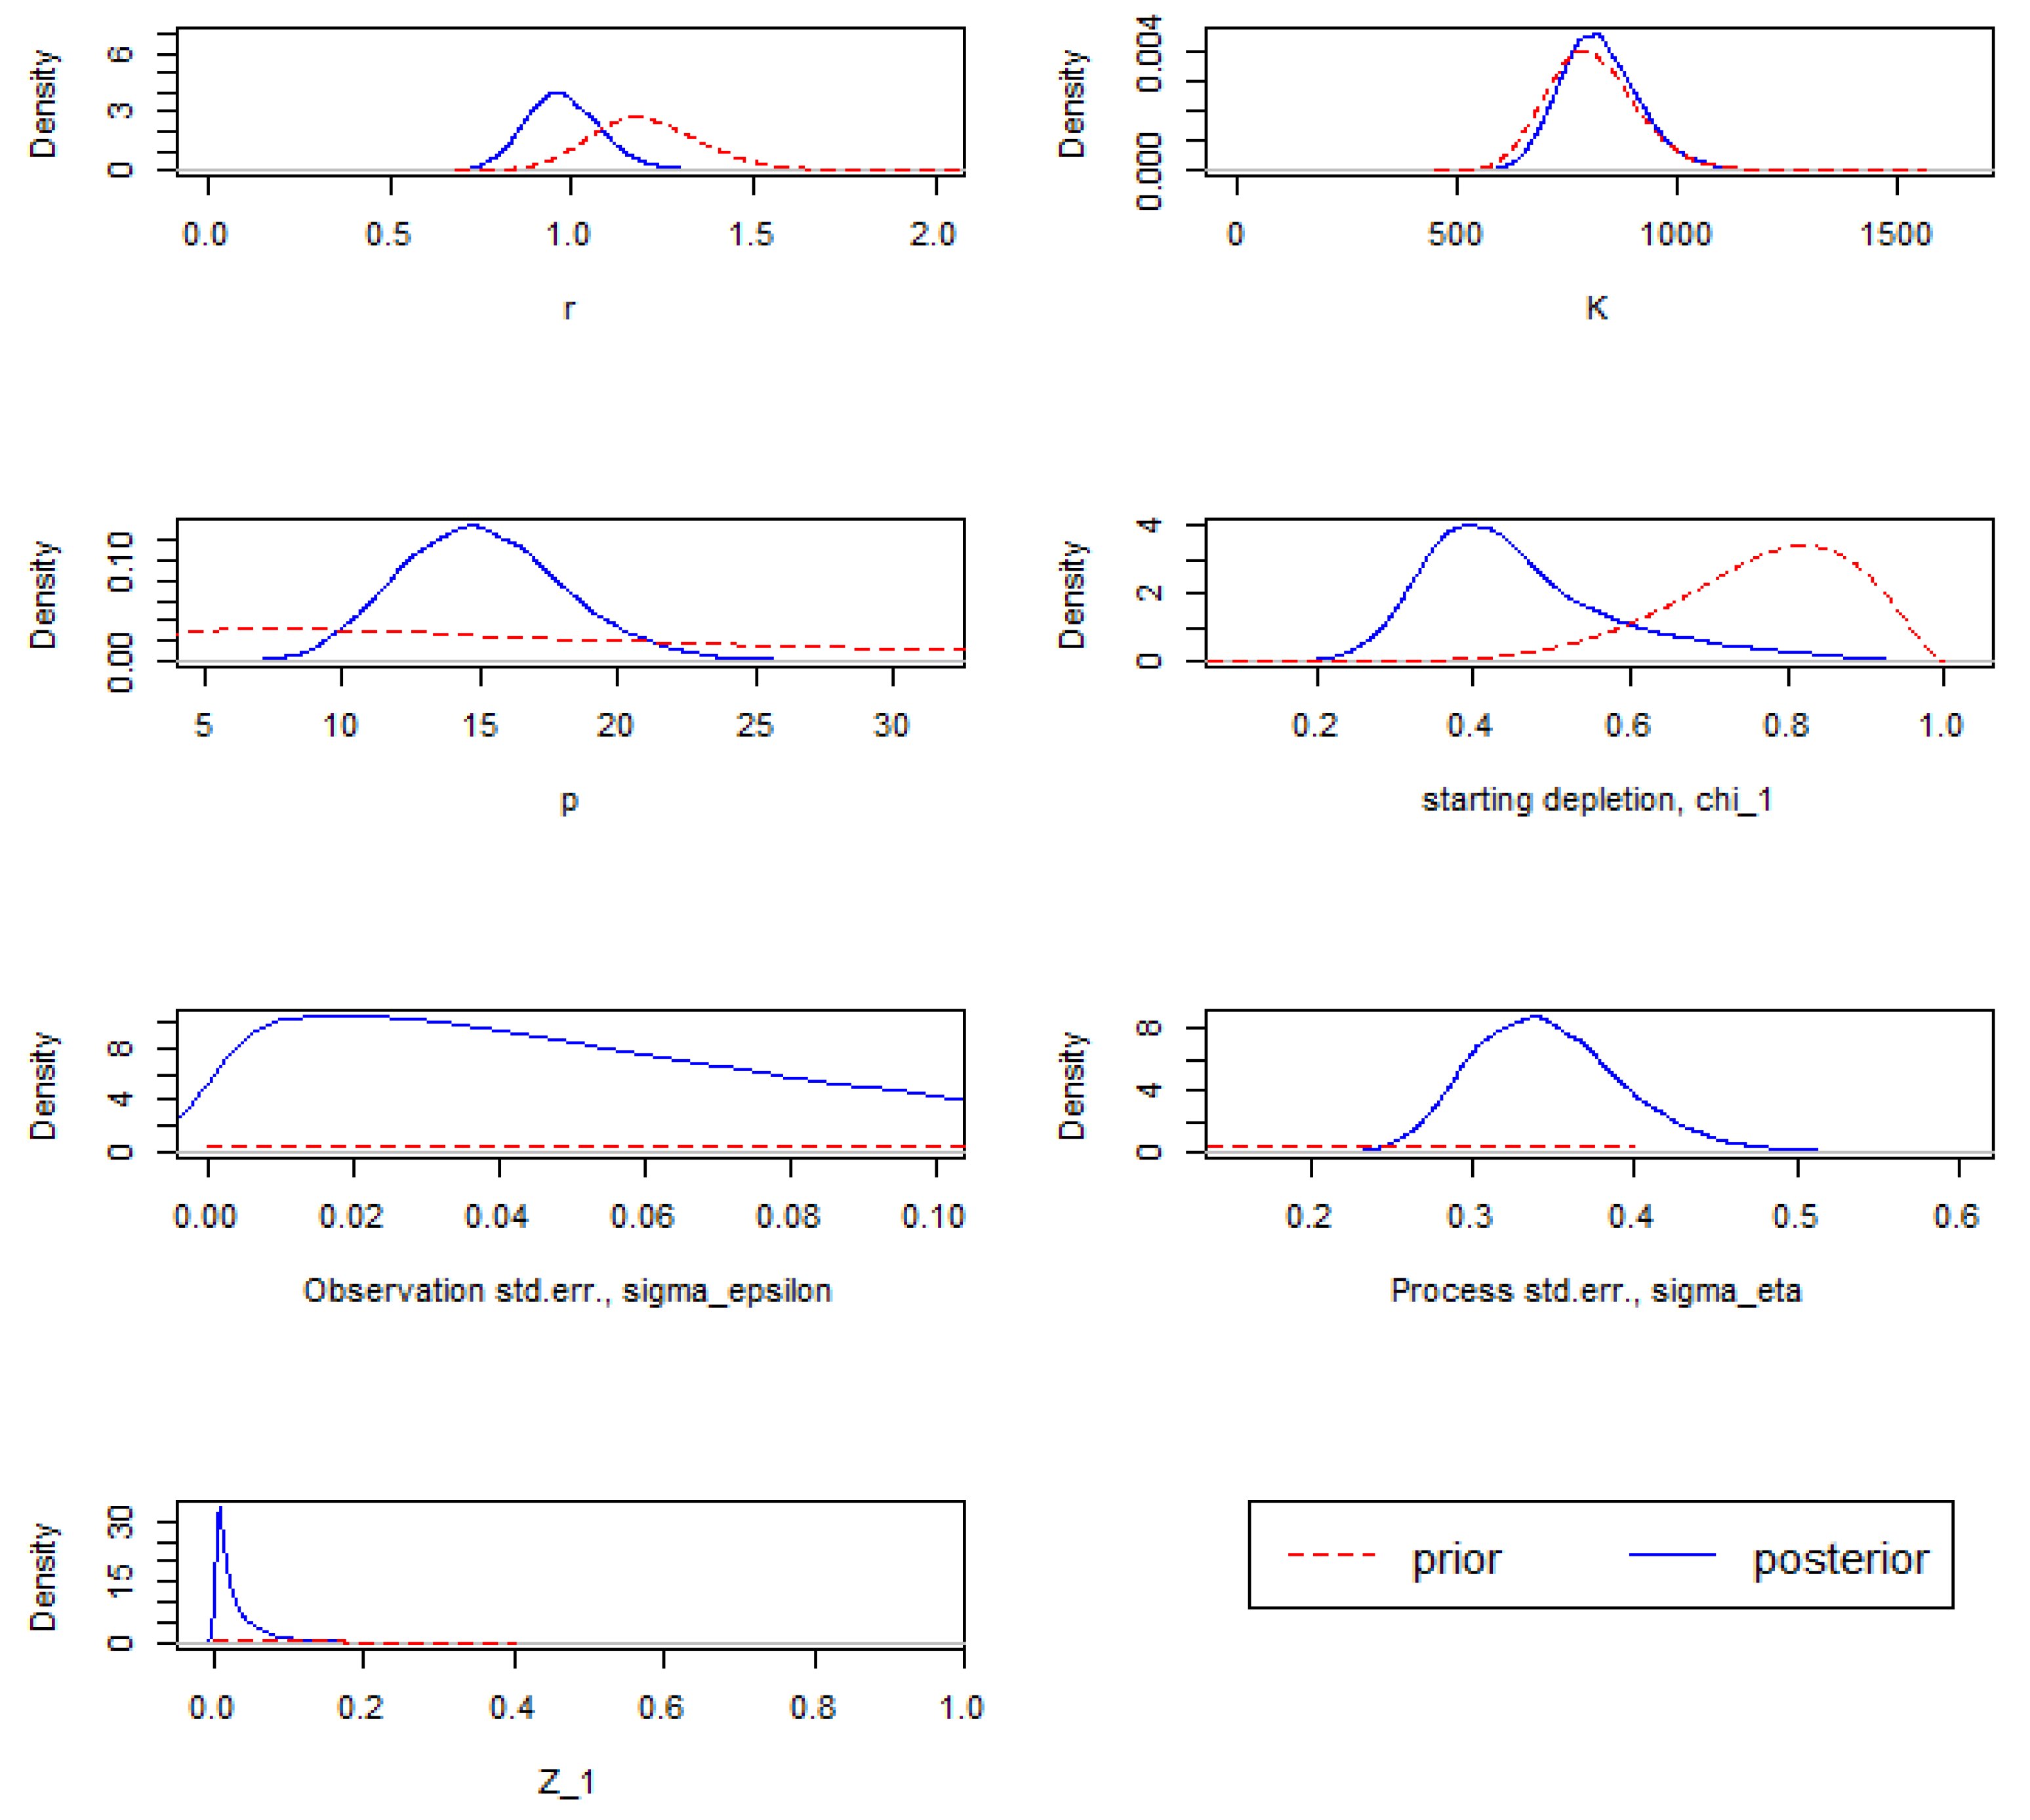
Subsequently, posterior distributions of the BESA-derived estimates were examined. Given that these distributions were asymmetric (Figure 4), median values were employed as representative estimates.
Figure 4.
Prior distributions (dashed line) and posterior distributions (solid line).
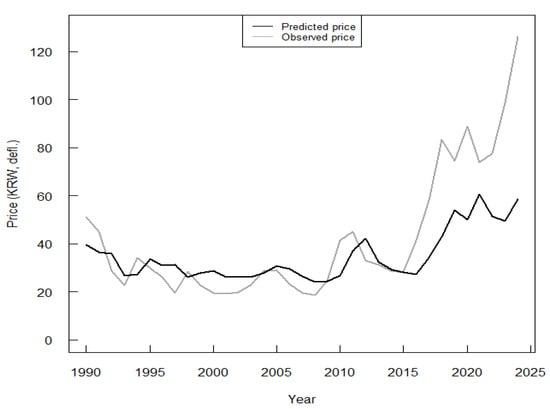
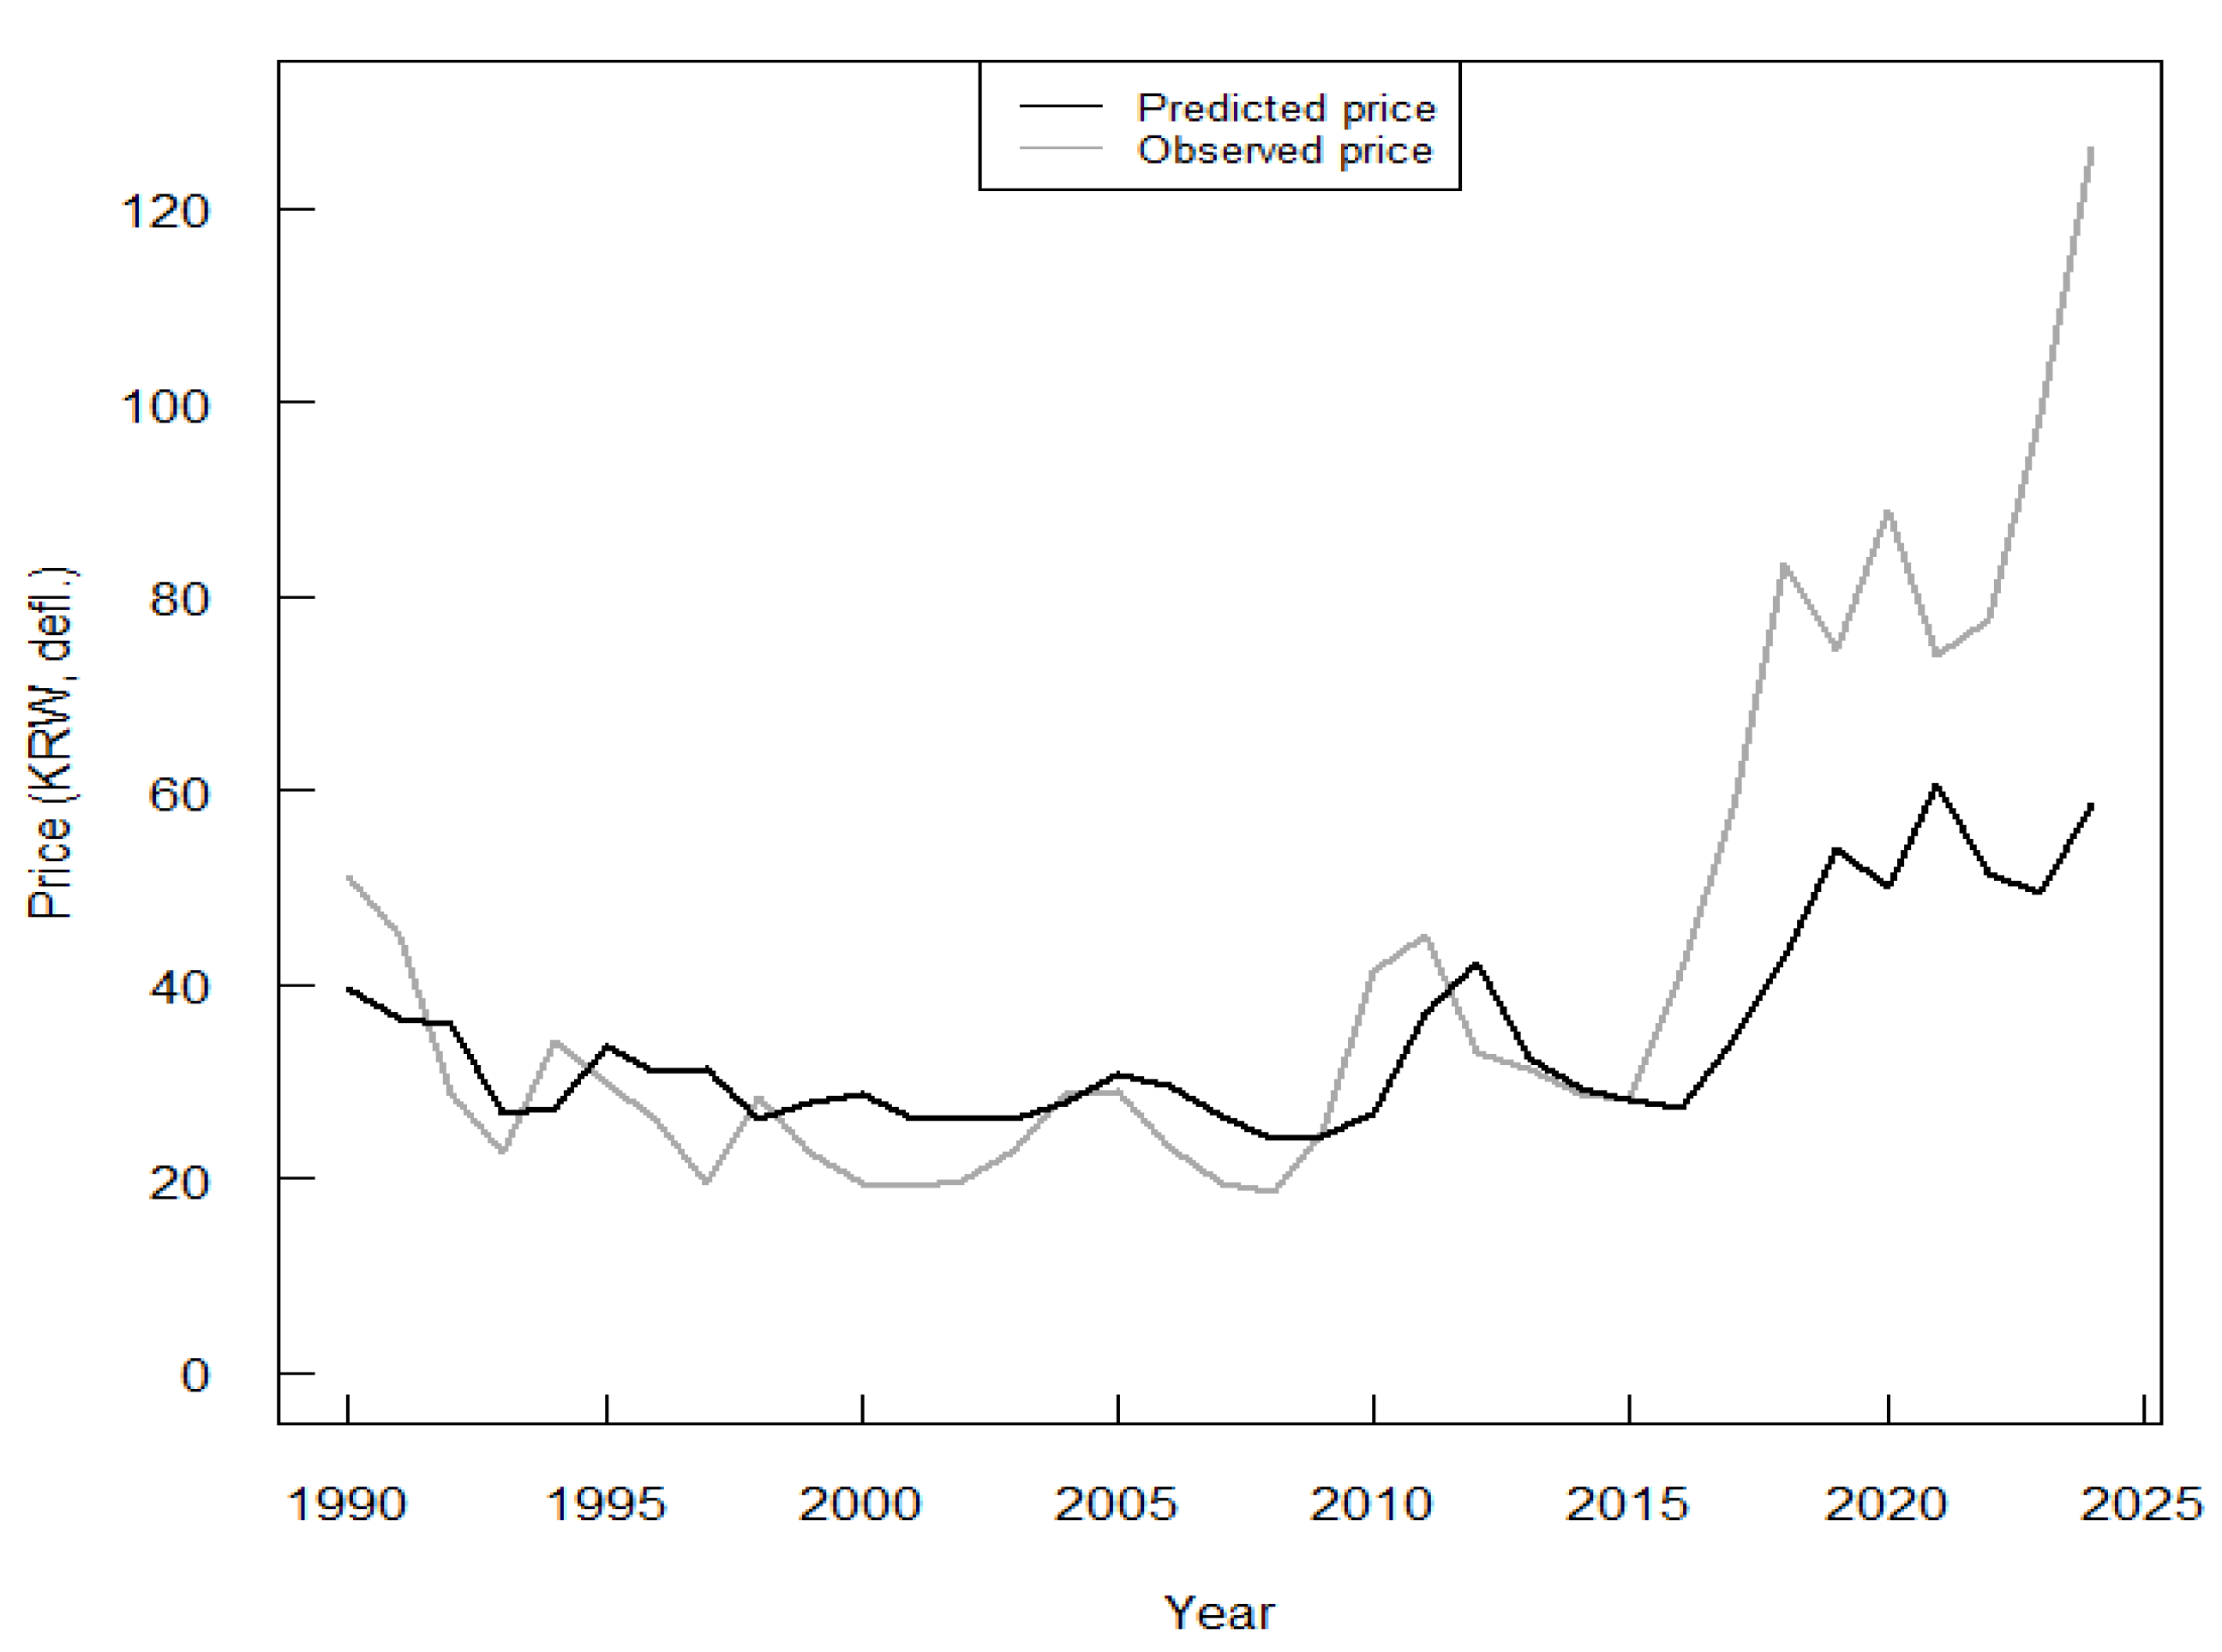
To validate the BESA model, the estimated prices () were compared with observed market prices. As depicted in Figure 5, the estimated prices are closely aligned with observed price trends, effectively capturing significant fluctuations during specific years. In 2015, both the estimated and observed prices demonstrated similar patterns; however, post-2015, the estimated prices generally fell below actual price levels. Enhancing estimation accuracy in these subsequent years would improve the reliability of the BESA model results.
Figure 5.
Prices estimated by BESA model (dashed line) and observed prices (solid line).
The results of the stock assessment for Japanese flying squid, based on the BESA, CMSY, and BSS models, are summarized in Table 6. The BESA and BSS models utilized 95% credible intervals, while the CMSY model employed 95% confidence intervals. Overall, the estimated values of , , and MSY were comparable across the models. Notably, the estimated by the BESA model (0.978) exceeded the estimates from the CMSY and BSS models. In contrast, the estimated by the BESA model (827,340 tons) was lower than those derived from the CMSY and BSS models. The MSY estimated by the BESA model (201,709 tons) surpassed the estimates from the other two models. Additionally, the economic estimate of MEY was determined to be 162,416 tons.
Table 6.
Results of the Todarodes pacificus stock assessment using three models (1990–2024).
As summarized in Table 7, the estimated biomass for 2024 () based on the BESA model was 258,512 tons, corresponding to 62% of , indicating that the stock status is classified as “Overfished.” In contrast, the CMSY and BSS models estimated biomass levels corresponding to 16% and 5.4% of , respectively, classifying the stock as “Collapsed.” Thus, the BESA model provided a more optimistic assessment compared to the CMSY and BSS models. All models consistently indicated a continuing decline in stock biomass, remaining below .
Table 7.
Todarodes pacificus stock state estimated from the three models (1990–2024).
Furthermore, the BESA model estimated at 594,483 tons, exceeding . This finding suggests that the fishery has the potential to improve economic efficiency while maintaining biological sustainability [63,64]. Fishing at the MEY level of 162,416 tons would support the preservation of a larger biomass relative to under reduced fishing intensity.
However, the results generated by the BESA model present inconsistencies when compared to catch data and alternative stock assessment models. Specifically, the BESA model estimates the biomass for 2024 () at 258,512 tons, approximately 62% of (413,670 tons), while the actual catch was only 13,546 tons, representing about 5% of . This disparity indicates that the BESA model may overestimate current biomass levels.
This internal inconsistency is not incidental; it stems from a structural vulnerability within the BESA framework, which assumes an equilibrium relationship between price signals and biomass levels. During rapid, environment-driven stock collapses—triggered by significant oceanographic shifts and abrupt socio-political disruptions, such as the cessation of fishing in Russian waters due to the Russia–Ukraine conflict—market prices primarily reflect acute scarcity rather than biological abundance. This results in a breakdown of the model’s equilibrium assumption, leading to a systematic overestimation of standing biomass.
Conversely, the CMSY and BSS models yield comparable estimates but project significantly lower current biomass levels (78,321 tons and 26,523 tons, respectively), which are more aligned with observed declines in catch. The divergence between price-derived biomass estimates and empirical landings underscores structural limitations in the BESA specification, particularly its reliance on equilibrium assumptions that may not be valid during rapid, environment-driven stock collapses.
Consequently, the outputs of BESA are presented solely to illustrate methodological behavior under data-limited conditions and should not be construed as actionable stock indicators. In contrast, the CMSY and BSS models provide estimates that align more closely with observed catch trends, thereby offering more reliable baselines for evaluating current stock status. Therefore, the observed inconsistencies should be viewed as diagnostic indicators of model limitations under non-equilibrium conditions, rather than as deficiencies within the overall comparative assessment framework. Accordingly, the discrepancies noted in the BESA outputs are interpreted as context-dependent signals that reflect model sensitivity to non-equilibrium conditions.
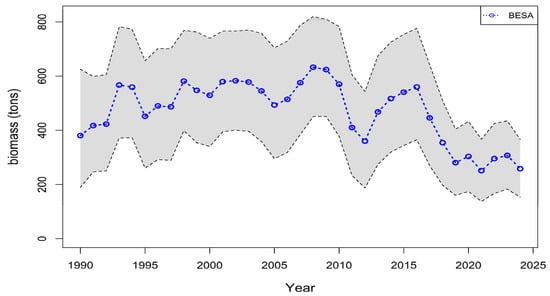
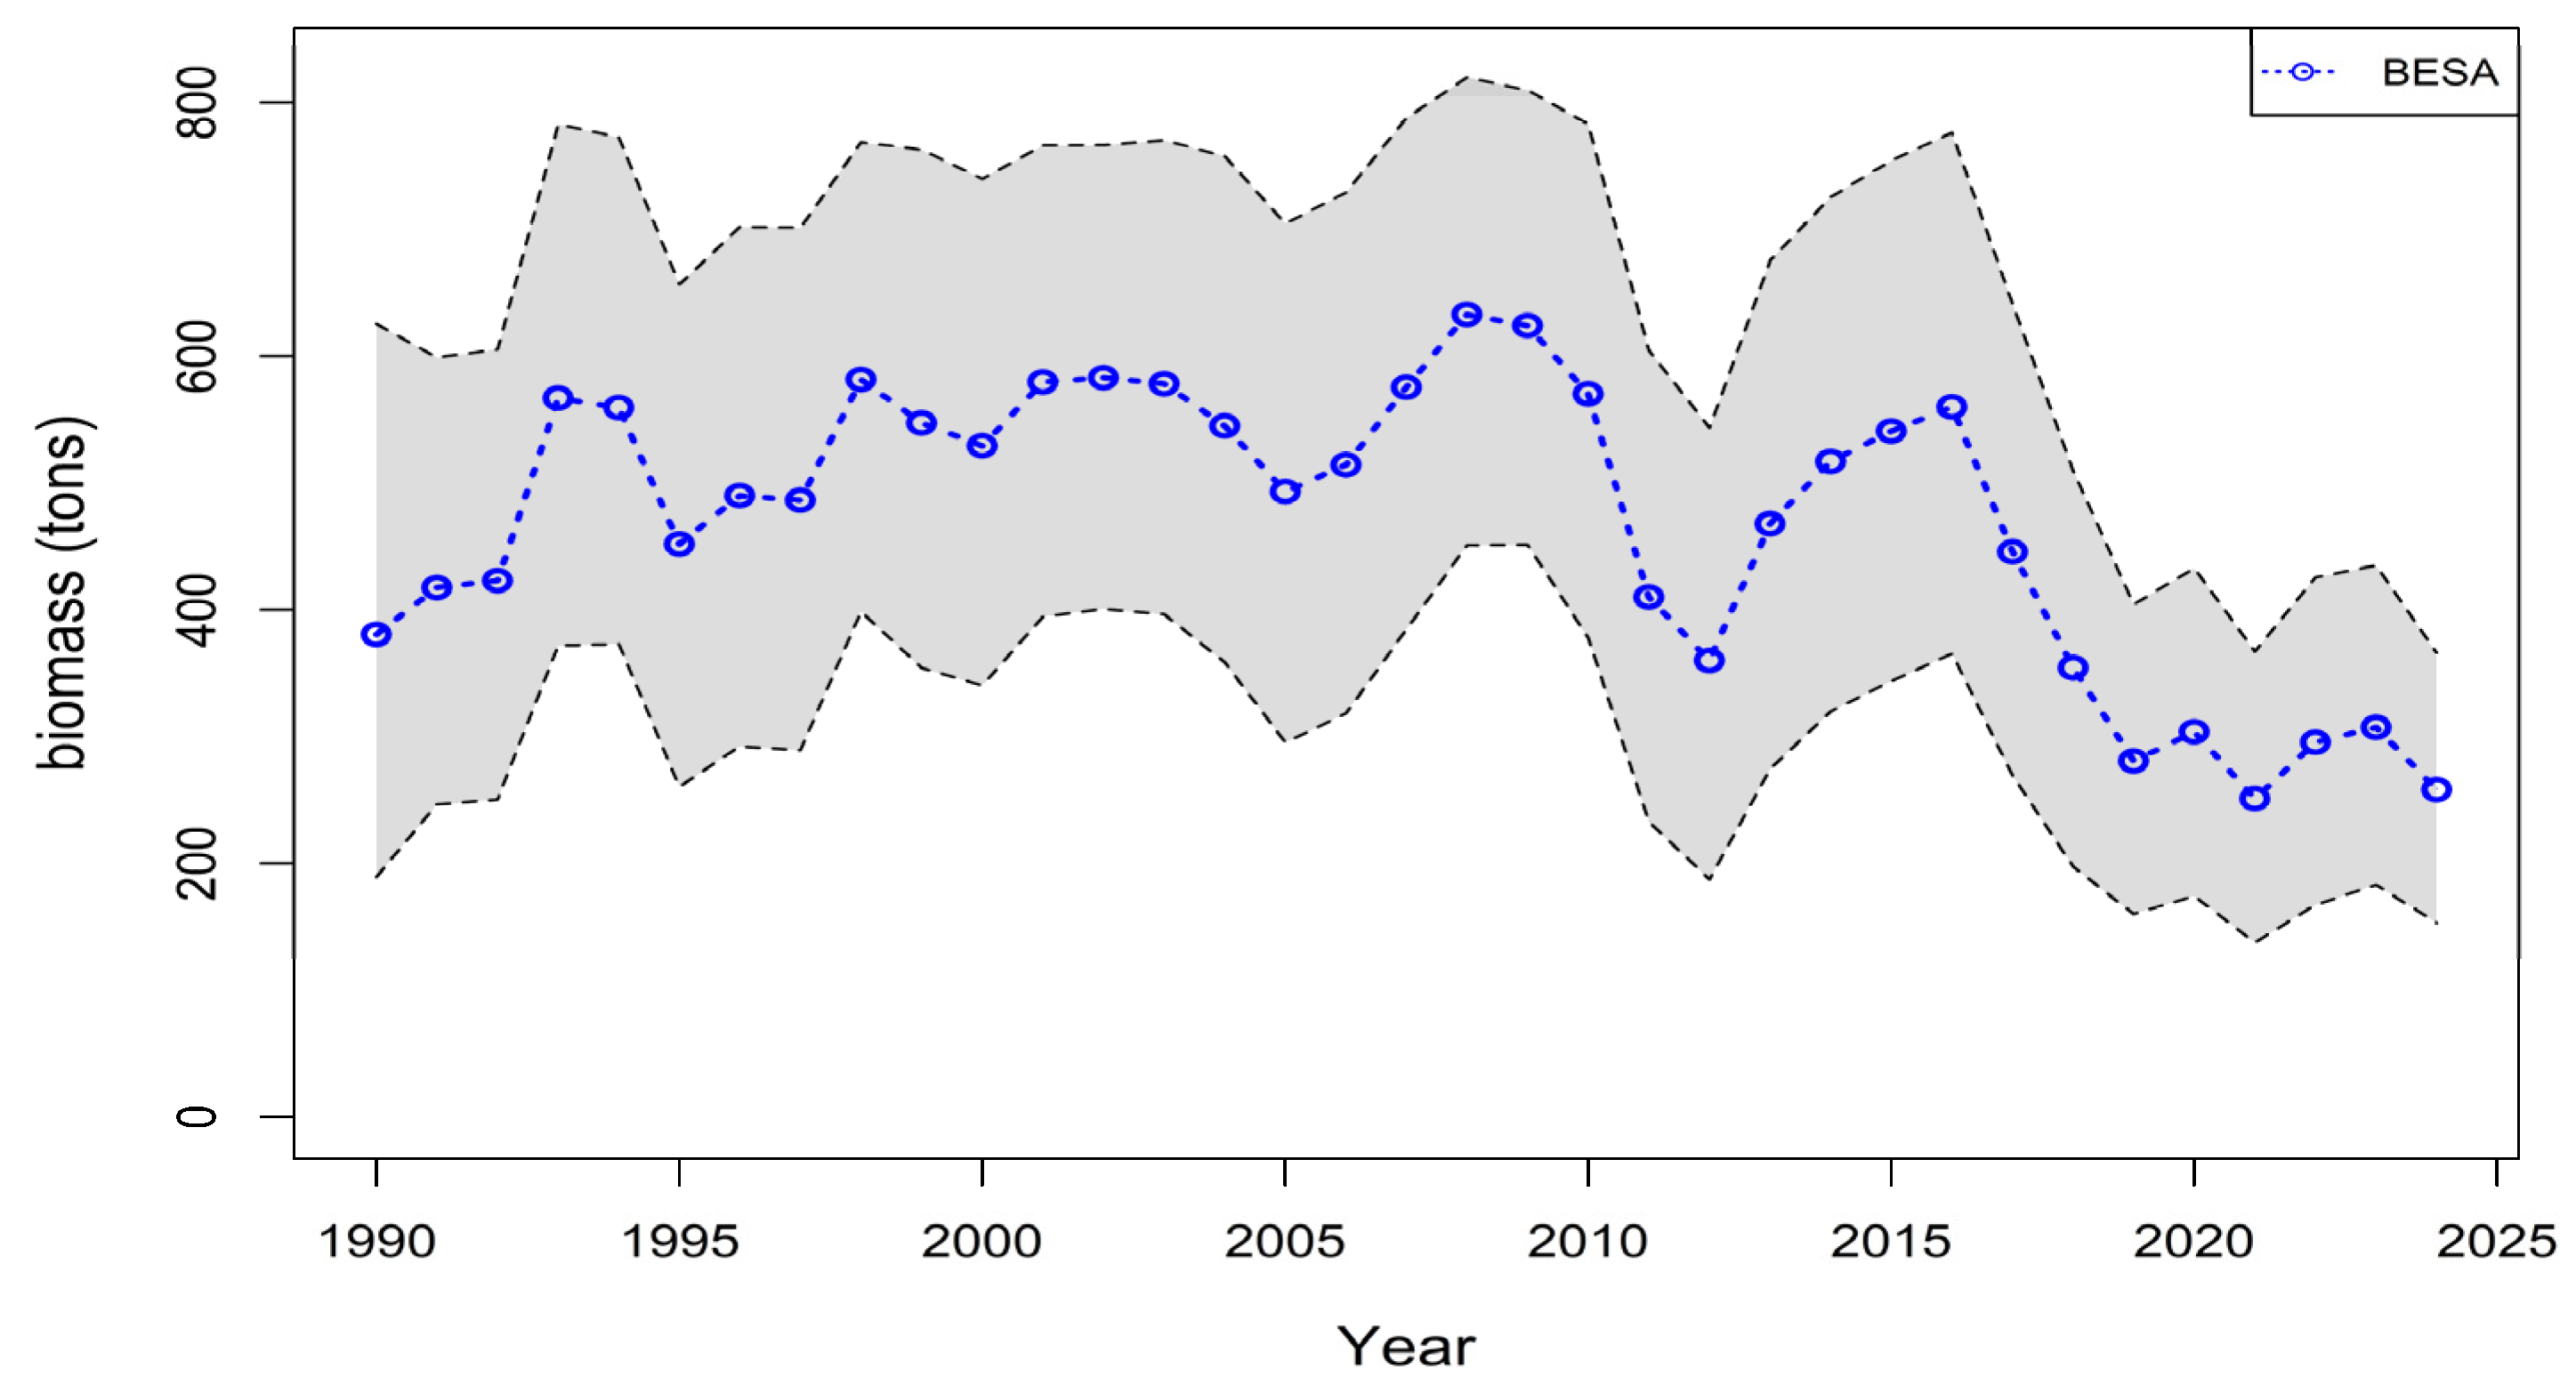
The annual biomass of Japanese flying squid is illustrated in Figure 6, with shaded areas representing the 95% confidence intervals for each year. Since 2018, biomass levels have consistently remained below , indicating a persistent failure to return to sustainable levels.
Figure 6.
Changes in the Todarodes pacificus biomass by BESA model. The gray shaded area represents the 95% confidence interval.
The results of the stock assessment for Japanese flying squid, which incorporates total catch data from Korea, China, and Japan, are summarized in Table 8. The estimated parameters are = 1.18, = 2,567,606 tons, and MSY = 755,164 tons. The corresponding biomass in 2019 () was 774,620 tons, which represents approximately 60% of , thereby categorizing the stock as “Overfished.”
Table 8.
Results and stock state of the Todarodes pacificus stock assessment in the waters of Korea, China and Japan (1990–2019).
4. Discussion and Conclusions
This study evaluated the stock status of the Japanese flying squid, a highly migratory species inhabiting the waters of Korea, China, and Japan. The assessment utilized both conventional models—CMSY and BSS, which have been extensively employed in previous domestic research—and the newly introduced BESA model, which has not yet been applied to this species in Korea. Due to the species’ migratory nature, catch data from all three countries were amalgamated to estimate the overall stock biomass. In contrast to conventional models, the BESA model integrates market price data, enabling the simultaneous estimation of biological and economic parameters.
The BESA model estimated MSY, , MEY, and at 201,709, 413,670, 162,416, and 594,483 tons, respectively. The projected biomass for 2024 is 258,512 tons, indicating that the stock is currently overfished. Previous studies have similarly reported an overfished or collapsed status, although most focused exclusively on a subset of fisheries and often neglected migratory behavior [18,19,21]. Currently, six TAC-targeted fisheries account for approximately 80% of the total catch. To provide a more comprehensive representation of total biomass, data from all TAC-targeted fisheries should be utilized.
Japan has managed squid under TAC since 1996, while China has imposed a three-month seasonal closure in key spawning areas since 2020 [65,66]. Previous assessments typically concentrated on national waters, limiting the evaluation of the entire stock [17]. Effective management requires a coordinated, multinational approach.
Despite the existence of national management measures, there are currently no publicly available regional or multinational stock assessment reports within the domestic management framework that comprehensively evaluate the Japanese flying squid across its entire migratory range. Consequently, direct comparison with coordinated regional evaluations is not feasible. In this context, the present study serves as a diagnostic, data-limited assessment aimed at identifying potential risks under the real-world data constraints typical of multinational fisheries, rather than as a substitute for formal regional management assessments.
In stock assessments of migratory species, reliance on data from a limited portion of their distribution can result in biased biomass estimates [67]. To mitigate this bias and account for the migratory behavior of the Japanese flying squid, this study incorporated catch statistics from the Chinese Fishery Yearbook (squid category). However, this dataset has inherent limitations, particularly regarding the lack of species-level identification, which introduces uncertainty into the analysis. Wang et al. [68] emphasized the absence of reliable long-term catch records for Chinese waters and underscored the necessity for significant improvements in the reporting practices of the Chinese Fishery Yearbook. Consequently, more systematic and species-specific statistical monitoring is essential to enhance the accuracy of stock assessments for the Japanese flying squid in the East China Sea.
The BESA model provides practical advantages, including access to data from KOSIS and FAO, as well as the elimination of CPUE standardization. However, several limitations persist. Utilizing price data can present challenges; while price time series offer valuable insights into market responses, appropriate deflation and selection of price indices can be complex, with regional price variation or aggregation across market segments potentially introducing confounding effects [23]. Although the model estimates biological and economic parameters concurrently, the economic aspect has been addressed only partially. A more comprehensive economic evaluation would necessitate additional data on operational costs, enhancing the model’s applicability for bio-economic management. Furthermore, the demographic and size structure of the population, which can influence both stock dynamics and market prices, was not explicitly incorporated [69].
The Japanese flying squid, a cephalopod species characterized by a short lifespan (approximately one year), high metabolic rates, and variable natural mortality, may not be ideally suited for traditional surplus production models like the Schaefer model [70]. In Korea, the availability of additional biological data on the Japanese flying squid is limited, making surplus production models a practical alternative. The applicability of such approaches for cephalopod stock assessment has been demonstrated both domestically and internationally [17,18,19,21,68,71,72,73,74].
Price data is crucial for evaluating market responses in the fisheries sector; however, it is essential to implement appropriate deflation procedures to mitigate inherent uncertainties [23]. This study employed the deflation approach outlined by Lancker et al. [23]. Nonetheless, individual price time series may not fully capture market integration across regions, seasonal variations, or differences in product forms (e.g., fresh versus frozen), which could introduce bias into the analysis. Despite this limitation, rigorously controlled market price data enables the investigation of the relationship between stock biomass and market prices, serving as a “minimum information” tool [25]. While the BESA model posits that fishing effort is adjusted each period until marginal profit reaches zero, real-world constraints, such as vessel financing and labor availability, may limit the extent of effort adjustment, potentially affecting the accuracy of biomass estimates [23].
Moreover, we acknowledge that deriving price as value divided by catch constrains the independence of the price series, as value and catch are not empirically separable in many fisheries. This formulation establishes a mechanical linkage between unit price and CPUE-related variation, introducing an element of endogeneity that limits the extent to which price can function as an independent economic indicator. Such structural dependence can systematically shift the BESA likelihood toward signals consistent with higher productive capacity, providing a plausible explanation for the comparatively elevated biomass estimates produced by the BESA model relative to the CMSY and BSS results.
In this context, the relatively high biomass estimates generated by the BESA model, compared to the CMSY and BSS models, likely result from a combination of factors, including the relevance of market price data, the ecological characteristics of the Japanese flying squid, and limitations in the available data. For instance, the BESA model estimated a biomass in 2024 of 258,512 tons, while the CMSY and BSS models estimated 78,321 tons and 26,523 tons, respectively. Therefore, the biomass derived from the BESA model should be interpreted with caution and utilized as a complementary tool for stock management in a data-limited domestic context, ideally in conjunction with other assessment models to facilitate comparative analysis.
Conventional models also possess limitations. CMSY relies solely on catch data and predetermined parameter assumptions, which can lead to overestimations of FMSY and underestimations of compared to data-moderated models such as SPiCT [75,76]. In contrast, BSS offers higher accuracy but depends on uncertain CPUE data [77]. For the Japanese flying squid, captured by over 20 Korean coastal fisheries, these uncertainties are further exacerbated.
Future stock assessments should integrate multiple models, including BESA, while improving the quality of datasets. Importantly, the observed decline in the Japanese flying squid catches in Korea should not be interpreted as direct evidence of a basin-wide stock collapse, as alternative mechanisms—such as distributional shifts, localized depletion, or environmentally driven changes in availability—cannot be disentangled under the current data limitations.
Accurate catch and biological data, along with age- or length-structured approaches such as Length-Based Bayesian (LBB) and Length-Based Spawning Potential Ratio (LBSPR) models, are essential for evaluating stock dynamics and informing management decisions. In response to the decline in Japanese flying squid biomass, it is recommended to strengthen stock recovery measures by raising the Minimum Landing Size (MLS) to protect immature individuals and restricting the trade of smaller Japanese flying squid.
Author Contributions
Conceptualization, D.-H.K. and D.-J.K.; methodology, D.-H.K., J.-H.C. and D.-J.K.; software, D.-H.K. and D.-J.K.; validation, D.-H.K., J.-H.C. and D.-J.K.; formal analysis, D.-J.K.; investigation, D.-H.K.; resources, J.-H.C. and D.-J.K.; data curation, D.-J.K., J.-H.C. and D.-H.K.; writing—original draft preparation, D.-H.K. and D.-J.K.; writing—review and editing, D.-H.K., J.-H.C. and D.-J.K.; visualization, D.-J.K.; supervision, D.-H.K. and J.-H.C.; project administration, D.-J.K.; funding acquisition, J.-H.C. and D.-H.K. All authors have read and agreed to the published version of the manuscript.
Funding
This work was supported by a grant from the National Institute of Fisheries Science (R2026007).
Institutional Review Board Statement
Not applicable.
Informed Consent Statement
Not applicable.
Data Availability Statement
The original contributions presented in this study are included in the article. Further inquiries can be directed to the corresponding author.
Conflicts of Interest
The authors declare no conflicts of interest.
References
- KOSIS. Korean Statistical Information Service: Fishery Production Survey. Available online: https://kosis.kr/statHtml/statHtml.do?orgId=101&tblId=DT_1EW0001 (accessed on 25 March 2025).
- Food and Agriculture Organization of the United Nations. FishStatJ, a Tool for Fishery Statistics Analysis; FAO: Rome, Italy, 2025; Available online: https://www.fao.org (accessed on 20 March 2025).
- Bureau of Fisheries of the Ministry of Agriculture. China Fishery Statistical Yearbook; China Agriculture Press: Beijing, China, 2025. [Google Scholar]
- Korea Maritime Institute. National Public Awareness Survey on Oceans and Fisheries (In Korean); KMI: Busan, Republic of Korea, 2022; Available online: https://www.kmi.re.kr/web/board/view.do?rbsIdx=297&idx=6 (accessed on 7 December 2025).
- Korea Fisheries Resources Agency. TAC Species-Specific Utilization Status; FIRA: Busan, Republic of Korea, 2023; Available online: https://www.fira.or.kr/ (accessed on 22 March 2025).
- Meyer, R.; Millar, R.B. BUGS in Bayesian stock assessments. Can. J. Fish. Aquat. Sci. 1999, 56, 1078–1087. [Google Scholar] [CrossRef]
- Froese, R.; Demirel, N.; Coro, G.; Kleisner, K.M.; Winker, H. Estimating fisheries reference points from catch and resilience. Fish Fish. 2017, 18, 506–526. [Google Scholar] [CrossRef] [Scilit]
- Fitzgerald, C.J.; Delanty, K.; Shephard, S. Inland fish stock assessment: Applying data-poor methods from marine systems. Fish. Manag. Ecol. 2018, 25, 240–252. [Google Scholar] [CrossRef] [Scilit]
- Musinguzi, L.; Bassa, S.; Natugonza, V. Assessment of exploited fish species in the Lake Edward System, East Africa. J. Appl. Ichthyol. 2021, 37, 216–226. [Google Scholar] [CrossRef] [Scilit]
- Zhang, S.; Wang, Y.; Wang, Y.; Liang, C.; Xian, W. Assessment of 11 exploited fish and invertebrate populations in the Japan Sea using the CMSY and BSM methods. Front. Mar. Sci. 2020, 7, 525363. [Google Scholar] [CrossRef] [Scilit]
- Hong, J.B.; Kim, D.H. A Study on Stock Assessment of Chub Mackerel (Scomber japonicus) in South Korea Using CMSY and BSS Models. J. Fish. Mar. Sci. Educ. 2021, 33, 1272–1283. [Google Scholar] [CrossRef] [Scilit]
- Schijns, R.; Froese, R.; Hutchings, J.; Pauly, D. Five centuries of cod catches in eastern Canada. ICES J. Mar. Sci. 2021, 78, 2675–2683. [Google Scholar] [CrossRef] [Scilit]
- Ferrer, E.M.; Giron-Nava, A.; Aburto-Oropeza, O. Overfishing increases the carbon footprint of seafood production from small-scale fisheries. Front. Mar. Sci. 2022, 9, 768784. [Google Scholar] [CrossRef] [Scilit]
- Chaloupka, M.; Balazs, G. Using Bayesian state-space modelling to assess the recovery and harvest potential of the Hawaiian green sea turtle stock. Ecol. Model. 2007, 205, 93–109. [Google Scholar] [CrossRef] [Scilit]
- Thorson, J.T.; Minto, C. Mixed effects: A unifying framework for statistical modelling in fisheries biology. ICES J. Mar. Sci. 2015, 72, 1245–1256. [Google Scholar] [CrossRef] [Scilit]
- Xu, L.; Li, B.; Chen, X.; Chen, Y. A comparative study of observation-error estimators and state-space production models in fisheries assessment and management. Fish. Res. 2019, 219, 105322. [Google Scholar] [CrossRef] [Scilit]
- Ren, Q.; Liu, M. Assessing Northwest Pacific fishery stocks using two new methods: The Monte Carlo catch-MSY (CMSY) and the Bayesian Schaefer model (BSM). Front. Mar. Sci. 2020, 7, 430. [Google Scholar] [CrossRef] [Scilit]
- An, D.Y.; Kyuhan, K.H.; Kang, H.J.; Hyun, S.Y. A Bayesian state-space production assessment model for common squid Todarodes pacificus stock caught by multiple fisheries in Korean waters. Korean J. Fish. Aquat. Sci. 2021, 54, 769–781. [Google Scholar] [CrossRef]
- Bae, J.H.; Hong, J.B.; Kim, D.H. Analysis of the Stock Status of the Common Squid in Korea Using CMSY and BSM Methods. In Proceedings of the Korean Society of Fisheries and Ocean Technology Conference, Jeju, Repulic of Korea, 27 August 2021; pp. 212–215. Available online: http://db.koreascholar.com/Article/Detail/409585 (accessed on 25 March 2025).
- Kim, J.W.; Hyun, S.Y.; Yoon, S.C. A state-space production assessment model with a joint prior based on population resilience: Illustration with the common squid Todarodes pacificus stock. Korean Fish. Aquat. Sci. 2022, 55, 183–188. [Google Scholar] [CrossRef]
- Lim, S.; Kim, D.-H.; Hong, J.-B. A study on stock assessment of Japanese flying squid (Todarodes pacificus) in Korea·China·Japan waters. Environ. Resour. Econ. Rev. 2022, 31, 451–480. [Google Scholar] [CrossRef]
- Froese, R.; Winker, H.; Coro, G.; Palomares, M.-L.; Tsikliras, A.C.; Dimarchopoulou, D.; Touloumis, K.; Demirel, N.; Vianna, G.M.S.; Scarcella, G.; et al. New Developments in the Analysis of Catch Time Series as the Basis for Fish Stock Assessments: The CMSY++ Method. Acta Ichthyol. Piscat. 2023, 53, 173–189. [Google Scholar] [CrossRef] [Scilit]
- Lancker, K.; Voss, R.; Zimmermann, F.; Quaas, M.F. Using the best of two worlds: A bio-economic stock assessment (BESA) method using catch and price data. Fish Fish. 2023, 24, 744–758. [Google Scholar] [CrossRef] [Scilit]
- Pinnegar, J.K.; Hutton, T.P.; Placenti, V. What relative seafood prices can tell us about the status of stocks. Fish Fish. 2006, 7, 219–226. [Google Scholar] [CrossRef] [Scilit]
- Marvasti, A.; Dakhlia, S. Minimum information management and price-abundance relations in a fishery. Can. J. Agric. Econ. 2021, 69, 491–518. [Google Scholar] [CrossRef] [Scilit]
- Cho, K.-D.; Kang, G.-H. Relationship between fishing condition of common squid and oceanic condition in the East Sea. J. Korean Soc. Mar. Environ. Saf. 2004, 10, 61–67. [Google Scholar]
- Choi, K.; Lee, C.I.; Hwang, K.; Kim, S.-W.; Park, J.-H.; Gong, Y. Distribution and migration of Japanese common squid, Todarodes pacificus, in the southwestern part of the East (Japan) Sea. Fish. Res. 2008, 91, 281–290. [Google Scholar] [CrossRef] [Scilit]
- Jo, M.J.; Kim, M.-J.; Kim, H.W.; Kang, H.; Kim, C.S. Long-term changes in biological characteristics of common squid Todarodes pacificus in response to environmental and stock variability in the Korean jigging fishery. Korean J. Fish. Aquat. Sci. 2025, 58, 353–363. [Google Scholar] [CrossRef]
- Oh, T.-Y.; Seo, Y.-I.; Hwang, K.-S.; Cha, H.K.; Jo, H.S.; Ahn, Y.S.; Lee, Y.W. Change of fishing power index by technological development in the offshore squid jigging fishery. J. Korean Soc. Fish. Technol. 2018, 54, 224–230. [Google Scholar] [CrossRef] [Scilit]
- Hwang, K.-S.; Kang, S.-K.; Oh, T.-Y.; Choi, K.-H.; Lee, D.-W. Change in the fishing grounds and the relationship between the abundance of the common squid Todarodes pacificus and the distribution of zooplankton in the East Sea. Korean J. Fish. Aquat. Sci. 2012, 45, 173–179. [Google Scholar] [CrossRef] [Scilit]
- Lee, J.-S.; Ryu, J.-G.; Kee, H.-K. A study on the status of Chinese fishing in the East Sea off North Korea and directions for countermeasures. J. Fish. Bus. Adm. 2017, 48, 61–74. [Google Scholar] [CrossRef]
- Kim, Y.-H.; Jung, H.K.; Lee, C.I. Changes in the spawning ground environment of the common squid, Todarodes pacificus, due to climate change. Ocean Polar Res. 2018, 40, 127–143. [Google Scholar] [CrossRef]
- Korea Maritime Institute. The Ocean Strategy Report; KMI: Busan, Republic of Korea, 2024; p. 157. [Google Scholar]
- Jang, C.-S.; Song, W.-S.; Kang, M.-H.; Cho, Y.-H.; Kim, B.-Y.; An, Y.-S. Fishing gear and method and improvement of regulation of the middle sized trawl fishery in the East Sea of Korea. J. Korean Soc. Fish. Ocean Technol. 2016, 52, 162–168. [Google Scholar] [CrossRef] [Scilit]
- KOSIS. Korean Statistical Information Service: Fishery Management Survey. Available online: https://kosis.kr/statHtml/statHtml.do?orgId=101&tblId=DT_1EW0001 (accessed on 7 December 2025).
- Aanes, S.; Engen, S.; Sæther, B.E.; Aanes, R. Estimation of the parameters of fish stock dynamics from catch-at-age data and indices of abundance: Can natural and fishing mortality be separated? Can. J. Fish. Aquat. Sci. 2007, 64, 1130–1142. [Google Scholar] [CrossRef] [Scilit]
- Aeberhard, W.H.; Flemming, J.M.; Nielsen, A. Review of state-space models for fisheries science. Annu. Rev. Stat. Appl. 2018, 5, 215–235. [Google Scholar] [CrossRef] [Scilit]
- Gordon, H.S. The economic theory of a common-property resource: The fishery. J. Polit. Econ. 1954, 62, 124–142. [Google Scholar] [CrossRef] [Scilit]
- Schaefer, M. Some considerations of population dynamics and economics in relation to the management of marine fisheries. J. Fish. Res. Board Can. 1957, 14, 669–681. [Google Scholar] [CrossRef] [Scilit]
- Reed, W.J. Optimal escapement levels in stochastic and deterministic harvesting models. J. Environ. Econ. Manag. 1979, 6, 350–363. [Google Scholar] [CrossRef] [Scilit]
- Costello, C.; Gaines, S.D.; Lynham, J. Can catch shares prevent fisheries collapse? Science 2008, 321, 1678–1681. Available online: http://www.jstor.org/stable/20144847 (accessed on 10 March 2025). [CrossRef] [Scilit] [PubMed]
- Lancker, K.; Deppenmeier, A.L.; Demissie, T.; Schmidt, J.O. Climate change adaptation and the role of fuel subsidies: An empirical bio-economic modeling study for an artisanal open-access fishery. PLoS ONE 2019, 14, e0220433. [Google Scholar] [CrossRef] [Scilit] [PubMed]
- Durbin, J.; Koopman, S.J. Time Series Analysis by State Space Methods, 2nd ed.; Oxford University Press: Oxford, UK, 2012; pp. 138–152. [Google Scholar]
- Stan Development Team. Stan Modeling Language Users Guide and Reference Manual, Version 2.30; Stan Development Team: Online, 2024. Available online: https://mc-stan.org (accessed on 12 December 2024).
- Annis, J.; Miller, B.J.; Palmeri, T. Bayesian inference with Stan: A tutorial on adding custom distributions. Behav. Res. Methods 2017, 49, 863–886. [Google Scholar] [CrossRef] [Scilit]
- Choi, Y.K. An Economic Evaluation of the Fishing Effort Control System in Korean Coastal Fisheries. Master’s Thesis, Chung-Ang University, Seoul, Republic of Korea, 2018. [Google Scholar]
- Matsuura, K. Bayesian Statistical Modeling Using STAN and R; Gilbut Publishing: Seoul, Republic of Korea, 2019; pp. 39–42. (In Korean) [Google Scholar]
- Kéry, M.; Schaub, M. Bayesian Population Analysis Using WinBUGS: A Hierarchical Perspective; Academic Press: London, UK, 2011. [Google Scholar]
- Plummer, M. JAGS: A program for analysis of Bayesian graphical models using Gibbs sampling. In Proceedings of the 3rd International Workshop on Distributed Statistical Computing (DSC 2003), Vienna, Austria, 20–22 March 2003; Available online: https://www.r-project.org/conferences/DSC-2003/Proceedings/Plummer.pdf (accessed on 10 March 2025).
- Palomares, M.L.D.; Froese, R.; Derrick, B.; Nöel, S.-L.; Tsui, G.; Woroniak, J.; Pauly, D. A Preliminary Global Assessment of the Status of Exploited Marine Fish and Invertebrate Populations; The Sea Around Us for OCEANA: Washington, DC, USA, 2018. [Google Scholar]
- Froese, R.; Pauly, D. FishBase 2000: Concepts, design and data sources. In FishBase 2000: Concepts, Design and Data Sources; Froese, R., Pauly, D., Eds.; ICLARM: Los Baños, Philippines, 2000; pp. 167–175. [Google Scholar]
- Froese, R.; Demirel, N.; Sampan, A. An overall indicator for the good environmental status of marine waters based on commercially exploited species. Mar. Policy 2015, 51, 230–237. [Google Scholar] [CrossRef] [Scilit]
- Gavaris, S. Use of a multiplicative model to estimate catch rate and effort from commercial data. Can. J. Fish. Aquat. Sci. 1980, 37, 2272–2275. [Google Scholar] [CrossRef] [Scilit]
- Nasu, K.; Okutani, T.; Ogura, M. Squid—From the Organism to Consumption; Seongsandan: Tokyo, Japan, 1991. [Google Scholar]
- Sakurai, Y.; Ichii, T.; Fukui, T. Ommastrephid squid fisheries in the world. In Advances in Squid Biology, Ecology and Fisheries, Part II: Oegopsid Squids; Rosa, R., O’Dor, R., Pierce, G.J., Eds.; Nova Biomedical: New York, NY, USA, 2013; pp. 249–272. [Google Scholar]
- Wang, G.Y.; Chen, X.J. The Resource and Biology of Economic Oceanic Squid in the World; Ocean Press: Beijing, China, 2005. [Google Scholar]
- Arkhipkin, A.I.; Rodhouse, P.G.; Pierce, G.J.; Sauer, W.; Sakai, M.; Allcock, L.; Arguelles, J.; Bower, J.R.; Castillo, G.; Ceriola, L.; et al. World squid fisheries. Rev. Fish. Sci. Aquac. 2015, 23, 92–252. [Google Scholar] [CrossRef] [Scilit]
- Song, H.-T.; Ding, T.; Yu, K.; Shen, J.; Wang, X.; Ruan, B. Species composition and quantitative distribution of cephalopod in the north of East China Sea. J. Zhejiang Ocean Univ. 1999, 18, 99–105. [Google Scholar]
- Li, J.; Yan, L. Quantity distribution of Todarodes pacificus and its relation with environment in the East China Sea. Mar. Fish. 2004, 26, 193–198. [Google Scholar]
- Du, T. Resources Assessment for Cephalopod in Offshore Water of China and Classification of Genus Level of Squids. Master’s Thesis, Shanghai Ocean University, Shanghai, China, 2016. [Google Scholar]
- Shin, D.; Park, T.H.; Lee, C.-I.; Jo, J.H.; Choi, C.G.; Kang, S.; Park, H.J. Feeding ecology of common squid Todarodes pacificus in the South Sea of Korea determined through stable isotope and stomach content analyses. Water 2022, 14, 3159. [Google Scholar] [CrossRef] [Scilit]
- Scanlon, T. Evaluating the Efficiency of Markov Chain Monte Carlo Algorithms. Master’s Thesis, University of Arkansas, Fayetteville, Arkansas, 2021. Available online: https://scholarworks.uark.edu/etd/4217 (accessed on 25 March 2025).
- Grafton, Q.R.; Kompas, T.; Chu, L.; Che, N. Maximum economic yield. Aust. J. Agric. Resour. Econ. 2010, 54, 273–280. [Google Scholar] [CrossRef] [Scilit]
- Grafton, Q.R.; Kompas, T.; Che, T.N.; Chu, L.; Hilborn, R. BMEY as a fisheries management target. Fish Fish. 2012, 13, 303–312. [Google Scholar] [CrossRef] [Scilit]
- Lee, J.S.; Ryu, J.K.; Shim, S.H.; Ko, D.H.; Oh, S.Y.; Han, D.J. A Study on Measures to Strengthen Fisheries Resource Management Based on Total Allowable Catch (TAC); KMI Basic Series; Korea Maritime Institute (KMI): Busan, Republic of Korea, 2019. [Google Scholar]
- MOA; Ministry of Agriculture and Rural Affairs of the People’s Republic of China. Notice on Strengthening the Conservation of Squid Resources on the High Seas and Promoting the Sustainable Development for Offshore Fisheries; MOA: Beijing, China, 2025. Available online: http://www.moa.gov.cn (accessed on 30 March 2025).
- Cadrin, S.X. Defining spatial structure for fishery stock assessment. Fish. Res. 2020, 221, 105397. [Google Scholar] [CrossRef] [Scilit]
- Wang, Y.; Liang, C.; Wang, Y.; Xian, W.; Palomares, M.L. Stock status assessments for 12 exploited fishery species in the Tsushima Warm Current region, Southwest Japan and East China, using the CMSY and BSM methods. Front. Mar. Sci. 2020, 7, 640. [Google Scholar] [CrossRef] [Scilit]
- Hixon, M.; Johnson, D.W.; Sogard, S.M. Boffffs: On the importance of conserving old-growth age structure in fishery populations. ICES J. Mar. Sci. 2014, 71, 2171–2185. [Google Scholar] [CrossRef] [Scilit]
- Arkhipkin, A.I.; Hendrickson, L.C.; Payá, I.; Pierce, G.J.; Roa-Ureta, R.H.; Robin, J.-P.; Winter, A. Stock assessment and management of cephalopods: Advances and challenges for short-lived fishery resources. ICES J. Mar. Sci. 2021, 78, 714–730. [Google Scholar] [CrossRef] [Scilit]
- Urías-Sotomayor, R.; Rivera-Parra, G.I.; Martínez-Cordero, F.J.; Castañeda-Lomas, N.; Pérez-González, R.; Rodríguez-Domínguez, G. Stock assessment of jumbo squid Dosidicus gigas in northwest Mexico. Lat. Am. J. Aquat. Res. 2018, 46, 330–336. [Google Scholar] [CrossRef] [Scilit]
- Geraci, M.L.; Falsone, F.; Gancitano, V.; Scannella, D.; Fiorentino, F.; Vitale, S. Assessing cephalopods fisheries in the Strait of Sicily by using poor data modeling. Front. Mar. Sci. 2021, 8, 584657. [Google Scholar] [CrossRef] [Scilit]
- Li, G.; Xu, L. Using a State-Space Surplus Production Model to Assess the Jumbo Flying Squid (Dosidicus gigas) Stock in the Southeast Pacific. In Proceedings of the 9th Meeting of the Scientific Committee, Virtually, 27 September–2 October 2021. [Google Scholar]
- Costello, C.; Ovando, D.; Clavelle, T.; Strauss, C.K.; Hilborn, R.; Melnychuk, M.C.; Branch, T.A.; Gaines, S.D.; Szuwalski, C.S.; Cabral, R.B.; et al. Global fishery prospects under contrasting management regimes. Proc. Natl. Acad. Sci. USA 2016, 113, 5125–5129. [Google Scholar] [CrossRef] [Scilit]
- Bouch, P.; Minto, C.; Reid, D.G. Comparative performance of data-poor CMSY and data-moderate SPiCT stock assessment methods when applied to data-rich, real-world stocks. ICES J. Mar. Sci. 2021, 78, 264–276. [Google Scholar] [CrossRef] [Scilit]
- Ovando, D.; Free, C.M.; Jensen, O.P.; Hilborn, R. A history and evaluation of catch-only stock assessment models. Fish Fish. 2022, 23, 616–630. [Google Scholar] [CrossRef] [Scilit]
- Hilborn, R.; Walters, C.J. Quantitative Fisheries Stock Assessment: Choice, Dynamics and Uncertainty; Chapman and Hall: New York, NY, USA, 1992. [Google Scholar]

Disclaimer/Publisher’s Note: The statements, opinions and data contained in all publications are solely those of the individual author(s) and contributor(s) and not of MDPI and/or the editor(s). MDPI and/or the editor(s) disclaim responsibility for any injury to people or property resulting from any ideas, methods, instructions or products referred to in the content. |
© 2026 by the authors. Licensee MDPI, Basel, Switzerland. This article is an open access article distributed under the terms and conditions of the Creative Commons Attribution (CC BY) license.