


Abstract
Taxi drivers are a group with high driving exposure and are involved in a significant number of urban traffic casualties. Using two modelling approaches, this study examines whether the intention to speed, as measured by the Theory of Planned Behaviour (TPB), can better fit a crash frequency model than errors or lapses as measured by the Driving Behaviour Questionnaire (DBQ). Data from 1000 drivers in Tehran was collected through questionnaires. The crash prediction model included a cross-sectional model using negative binomial (NB) regression methods and a tree regression model from a previous study. In the last three years, the drivers had been involved in 544 road crashes, and of those, 42 resulted in serious injuries. Due to the rare and random nature of crashes, the empirical Bayesian (EB) method was used for model testing. Comparing AIC and BIC showed that zero-inflated NB (ZINB) models performed better. The final selected model was the intention-based ZINB model without the age variable. The coefficients for intention, exposure, and driver experience were 0.205, 0.103, and −0.443, respectively. The high EB coefficients indicated strong reliance on predicted crash values. The conclusion is that road crashes are closely related to taxi drivers’ intention to speed rather than errors and lapses. This indicates that it can be described as a traffic violation, rather than a mistake. Therefore, significant efforts are required to increase compliance with speed limits and reduce road crashes. Further education and high-quality campaigns are essential elements to achieve this goal.
1. Introduction
According to WHO estimates [1], 1.19 million deaths occur in traffic each year. The level of income is related to road traffic deaths, and more than 90% of road traffic deaths occur in low- and middle-income countries. The average rate of death per 100.000 in low-income countries is 27.5, which can be compared with 8.3 deaths per 100.000 in high-income countries [1,2]. In Iran, which is often described as a middle-income country, the rate of road traffic fatality is 20.5 per 100,000 inhabitants [2]. This is the third-highest rate amongst other middle-income countries [3]. Due to the high amount of traffic exposure (travelled distance, high workloads, and traffic maneuvers) in urban areas, taxi drivers may account for a significant part of crashes. A study showed that the frequency of unsafe behaviours was observed in 52.5% of taxi drivers in Tehran [4]. Through telematics monitoring with 2,644,846 datapoints in Tehran, Tavolinejad et al. [5] showed that taxi drivers were more likely to exceed speed limits in non-camera zones. The maximum urban speed limit in Iran is set at 60 km/h. The law on urban speed limits for passenger cars and motorcycles is weak in Iran, in the sense that there is a law, but urban speed limits are higher than 50 km/h [6]. In urban roads, the average excess speed above the limit speed is reported to be more than 30 km/h. Local authorities have no discretion when it comes to changing speed limits. Additionally, there are no national speed reduction targets.
The causation of road crashes is complex and involves several interacting factors. Broadly speaking, they can be categorized into three general factors: human, environmental, and vehicle-related factors. Human factors (HF) play a significant role in the causation of crashes, and it has been estimated that HF aspects are involved in more than 90% of crashes and that it is the absolute cause of road crashes in more than 50% of the crashes [7,8,9,10]. Various crash models have been presented, and one of the aims has been to determine the relationship between HF and crash rate. For instance, Cantor et al. [11] focused on truck drivers’ characteristics and their safety performance, but also the condition of the vehicle. The findings showed that past crashes, driver’s age, gender, job stability, and the condition of the vehicle were significantly related to the probability of a crash. Das et al. [12] conducted a similar study aimed at developing a crash prediction model to estimate the probability of future crashes for at-fault drivers. They used a logistic regression method and eight years of crash data. Besides human factors, the model included other variables such as characteristics of the roadway, the environment, and the vehicle. The final model was able to predict 62.4 percent of at-fault crashes in the upcoming year. By distinguishing the distal (i.e., personality factors) and proximal (i.e., aberrant driving behaviours) factors in predicting traffic accident involvement, Sümer [13] indicated that while aberrant driver behaviours yielded a direct effect on accident involvement, psychological factors yielded an indirect effect mediated by driver behaviours. Meanwhile, distal factors predict crash involvement directly and indirectly through errors, violations, and hazard monitoring [14]. Using a Classification and Regression Tree (CART) method, Tinella et al. [15] determined the sociodemographic and psychological profiles of drivers with a history of motor vehicle crashes. They suggested that road trauma analysis should focus on both distal and proximal driver-related factors.
However, classifying crashes into at-fault and not at-fault based on crash-related variables is problematic. For instance, to judge if an improper maneuver or disregarding a traffic sign is intentional or not is very difficult without having more background information from the driver. Thus, to reduce crash frequency, a thorough understanding of factors that contribute to crashes is necessary when designing appropriate interventions.
1.1. Driver Behaviour Questionnaire (DBQ)
Understanding driver behaviour and various contributing factors was the aim of researchers at Manchester who first developed a self-reported questionnaire measuring human factors (Driving Behaviour Questionnaire, DBQ; Ref. [16]). Reason et al. [16] originally distinguished between three distinct behaviours: errors, lapses, and violations. Errors could be a failure to see an oncoming vehicle or a misjudgment of its speed. Lapses could include failing to put in the right gear when driving away from a traffic light or having no clear recollection of the road just travelled. Violations describe drivers’ improper actions performed consciously, such as speeding or driving close to the car in front as a signal to its driver to go faster or get out of the way [17].
Subsequently, the DBQ has been widely used across several cultural contexts [18,19,20,21,22,23,24,25,26,27,28,29,30]. In general, the respondents included in these studies are drawn from the general population, although some studies have focused on commercial taxi drivers [19,20,21,22,23,24,25,26,27,28,29,30,31,32,33]. In general, studies using the DBQ replicate the three-factor structure (errors, lapses, and violations), although some studies have presented a four or even a five-factor structure. For instance, a four-factor solution with violations being split into two, ordinary and aggressive, has been found [33,34,35]. Similar results were also presented by Parishad et al. [26], who focused on Iranian drivers. In their study, the four factors included: violations, aggressive behaviour, dangerous errors, and lapses. Åberg and Rimmö [18], on the other hand, found two different errors: inattention and inexperienced error. A five-factor solution was presented by Maslać et al. [21], including errors, ordinary violations, positive behaviour, aggressive violations, and lapses. Furthermore, errors and lapses are not always separated into two different factors. For instance, Gras et al. [36] demonstrated that one factor included a mixture of lapses and errors. The reason for these mixed results remains unclear, although it is possible that cultural factors, which in turn influence cultural norms and attitudes, play an important part [26,37,38].
The relationship between the factors included in the DBQ and crash involvement has been assessed. However, some studies have found that the effect of violations on crashes, rather than errors and lapses, tends to be greater [16,23,30,36,37,38,39,40,41,42,43]. This might not be surprising, since one of the behaviours resulting in high scores on violations is speeding, which increases the risk of being involved in a crash [44,45]. In contrast, in two studies, one included Ghanaian drivers and the other Iranian drivers, found that both violations and errors predicted crashes [24,46]. This is in line with the results from a meta-analysis including 174 DBQ studies stating that errors and violations were more or less equal in their prediction of self-reported accidents [47].
Other data, such as driving experience and exposure (KMs driven per week), have also been included in order to increase the model’s predictive power. This is then consistent with studies which have stated that exposure to road environments is one of the main variables used to estimate the frequency of crashes [48,49,50]. Some have even suggested that exposure is more effective at predicting crashes than, for instance, self-reported behaviour as measured by the DBQ [51].
Even though the results of DBQ are not always consistent, it has useful practical implications since it helps us to understand if unsafe driving behaviour is intentional or unintentional. That means that it clarifies the type of human factors involved, which in turn indicates what countermeasures to take when wanting to change the behaviour. However, it does not explain why the actions are taken by the driver. Different theories have been developed to try to understand the motives behind the actions, and the Theory of Planned Behaviour (TPB) [52] is one that has been widely used to increase our understanding of what it is that predicts traffic violations (e.g., [53,54,55,56]).
1.2. Theory of Planned Behaviour (TPB)
The TPB predicts that overt behaviour is a function of behavioural intention, which in turn is a function of attitude, subjective norm, and perceived behavioural control. Intention has a central role within the TPB theory and is generally regarded as a sufficient immediate cause of behaviour. Attitude describes the respondents’ positive or negative evaluation of the behaviour. Subjective norm deals with the impact of the social environment on behaviour. It is described as the individual’s perception of other people’s reaction to them performing or not performing a certain behaviour. A reaction sometimes described as a form of social pressure [57]. Perceived behavioural control refers to a person’s perception about his/her own capability to perform an act. Intention is used as a substitute for behaviour, and according to the theory, it is most likely that behaviour will be performed if the intention to perform a unique behaviour is strong [52]. If the constructs within the TPB have been appropriately measured, then it is believed that intention “should be able to predict specific behaviours with considerable accuracy” [57]. Moreover, the theory outlines various antecedents, or indirect measures, of attitude, subjective norm, and perceived behavioural control. For example, a person’s overall attitude is shaped by their beliefs about the attitude object. Theoretically, this is described as a combination of behavioural beliefs and outcome evaluations: the former refers to the perceived consequences of performing the behaviour, while the latter concerns how these consequences are assessed. These beliefs may be directly linked to intention, and therefore the theory can be tested using either direct or indirect measures [58].
The majority of studies using the TPB tend to include self-reported behaviour, rather than observed, which can be seen as a weakness. However, some evidence has been presented which confirms the relationship between observed behaviour and intention (e.g., [55,56,57,58]). In the study by Elliot et al. [59], participants’ behaviour was assessed using a driving simulator one week after they completed a survey. The study by Warner and Åberg [60] measured drivers’ speed using a GPS over a period of up to four weeks. The results from these two studies showed that the model was able to explain 28% to 36% of the speeding variance. Hai et al. [61] and Somoray et al. [62] presented the results from an extensive meta-analysis including more than 100 records. The results showed that the correlation between intention and behaviours in driving behaviours was between 0.58 and 0.68. For speeding alone, the correlation was 0.61 [62]. Furthermore, Elliot et al. [59] also demonstrated that self-reported behaviour and observed behaviour were strongly correlated, suggesting that the former is a good proxy for the latter. When it comes to the relationship between intention and road crashes, even fewer studies have been conducted. This is likely because such crashes are rare and would require a very large sample size. Another way to address this issue is to focus on professional drivers with high driving exposure, such as taxi drivers, who account for a significant number of traffic fatalities (e.g., [63]). This is due not only to their high driving exposure (e.g., [64]) but also to aberrant driving behaviour [33].
1.3. The Aim
The aim of the study was to examine factors from the Theory of Planned Behaviour (TPB), the Driving Behaviour Questionnaire (DBQ), and demographic variables—such as age, driving experience, and exposure—to predict crash frequency among taxi drivers. After testing three regression models, the best-fitting model was used to estimate individual crash risks in a new driver sample, providing insights for policy and behavioural interventions.
2. Methods
2.1. Participants
Data from 1000 drivers were collected using questionnaires from male taxi drivers in Tehran. The term ‘taxi’ in this study refers to the cars under the supervision of Tehran Taxi Organization, which employs male drivers only; ride-hailing and private taxis with both male and female drivers are outside the scope of the research. All these drivers received their taxi driving permits from this organization. While maintaining ownership of their car, they were granted permission to operate as taxi drivers. For the 1000 training subjects (Table 1), the data shows that 43.1% are 50 years old and over, followed by 42 to 49 years old, who include almost 30% of all drivers. The drivers above 40 have an average driving experience of more than 20 years and work more than eight hours a day. Driving experience was considered from the time of getting a driving licence and was grouped in four categories: Less than 5 years, 5–10 years, 11–20 years, and more than 20 years. In the last three years, the drivers had been involved in 544 road crashes, and of those, 42 resulted in serious injuries. The maximum frequency of crashes for one driver was 6 crashes, and the maximum frequency of crashes with serious injuries was 2 crashes.
Table 1.
Descriptive data for 1000 training subjects.
2.2. Material (Survey)
The questions in the survey were loosely based on the DBQ and the TPB. The questions based on the DBQ included 10 items measuring errors and lapses. Drivers were asked how often they committed each of the listed behaviours. Errors were measured by seven items (e.g., “Overtake someone that I had not noticed to be signalling a left turn” and “I misjudge my own speed when leaving the main road”). Lapses were measured by three items (e.g., “I get into the wrong lane when approaching the junction” and “When turning right at the crossroad, I use the wiper instead of the indicator”). All responses were measured on a Likert scale from 1 to 5 (1 = Never; 2 = Seldom; 3 = Sometimes; 4 = Often; 5 = Very often). Violations were included in the TPB model and not measured by the DBQ to avoid double-counting problems.
The questions based on the TPB focused on a specific traffic violation, namely speeding in an urban area. To measure this, the survey included indirect measures of attitude, subjective norm, descriptive norm, perceived behavioural control, and intention. The indirect belief did not include the combination of, for instance, behavioural belief and outcome evaluation. The reason for this was to limit the number of questions and increase the chance of a satisfactory response rate.
With the view to give the respondents a clear understanding of the situation, the questions were linked to a scenario and a picture (see Figure 1 in [65]). In the scenario, the principle of compatibility, target context, and time [57] were clearly specified as follows [65]:
“Suppose you are driving your taxi on the left lane on Hafte-Tir Boulevard (pictured below) and you are approaching the Mesbah signalized crossroad. It is in the middle of the week, and the time is around 11:00. The speed limit on this avenue is 40 km/h, and in the distance, you can see that the traffic light is green. You want to cross the crossroad before it turns red, and therefore, you increase your speed to 60 km/h. With this in mind, rate the following questions.”
The following questions were to be answered with this scenario in mind, regardless of whether it would apply to them as drivers or not.
The attitude towards the behaviour was measured by six items. Two of them describe negative consequences: being frustrated and unnecessary risks; and four positive consequences: feeling brave, accidents extremely low, and being fined also extremely low. Two items measured subjective norm: passengers’ and other taxi drivers’ acceptance. The descriptive norm was measured by one item asking what they believed other taxi drivers would do in the same situation. Control belief was measured by two items: easy to drive like this, and more likely if they are in a hurry. Intention to speed was measured by two items: I intend to drive in 60 km/h on a 40 km/h road within the next month, and it will be probable for me to drive in 60 km/h on a 40 km/h road within the next month. All the responses to the scenario were measured on a Likert scale from 1 to 5 (1 = I do not agree at all; I slightly agree; To some extent; I very much agree; 5 = I strongly agree).
The end of the survey included some background questions such as age, education level, residence area type, driving experience, exposure, and the number of serious and minor crashes (last three years) and near crashes (last month).
To analyze the reliability of the questionnaire, a small sample of 120 taxi drivers took part. To carry out the test–retest process, the questionnaire was then given to the same 120 taxi drivers after four weeks. Two approaches were used to carry out the testing: variance testing and average testing. The results of the multivariate test statistics, including Box’s test and Pillai’s Trace, Wilks’ Lambda, Hotelling’s Trace, and Roy’s Largest Root, showed no significant variance or average difference in the answers between the first and the second test. This means that factors which motivate speeding amongst taxi drivers were stable over a four-week period.
2.3. Procedure
The collection of data was conducted at 52 taxi terminals in Tehran, located in 22 urban districts over a period of two months. Initially, the survey was conducted directly at taxi terminals, but due to the busy schedule of drivers, the process was slow. Therefore, only a small number of questionnaires were completed inside the terminals, and almost all the questionnaires were completed at CNG stations located near the terminals when the driver was stopped and idle for several minutes. The survey was administered in paper form rather than online. A key reason for this choice was to ensure anonymity, which the interviewer clearly communicated to all respondents before they completed the questionnaire. The collection of data stopped when 1000 taxi drivers had responded to the surveys. Totally, 1650 drivers were approached during the period, which meant that 650 drivers refused to participate in the study. To ensure more privacy in responding, the questionnaire was completed by the respondents themselves and then collected by three data collectors who were supervised by a leader.
After collecting answers from 1000 participants, a further 40 taxi drivers from the same 22 districts of Tehran participated in the study, later described as test drivers. The 1000 data samples were evaluated as training data in the model creation phase, and the 40 data samples as test data in the model application phase. The 1000 data sampling was used to develop a crash model in the crash model creation phase, and the 40 data sampling was used to estimate the expected crashes of drivers in the crash model application phase. The 40 test respondents completed the same survey as described above, except they were not required to declare their intention to speed.
2.4. Statistical Analysis
The model creation in this study uses two approaches for crash prediction purposes, including an intention-based (i.e., TPB-based) model and a model based on errors and lapses (DBQ-based). The intention-based model creation contains a direct measure of the driver’s intention to speed. In the model application phase, the intention value was estimated using the TPB concepts. The second model creation approach included errors and lapses loosely based on the DBQ instrument.
2.4.1. Factors Used in Creation of Crash Frequency Models
For the reason of model agility and briefing the effects in both TPB-based and DBQ-based models, only the key variables, including simple but effective demographic factors (i.e., age, driving experience, and daily driving hours), are considered within the model creation phase. The predictor variables in the intention-based crash frequency model include the intention to violate, driver age, driving experience (years of driving), and exposure (number of hours driving each day). The dependent variable of the model is the frequency of total crashes in the last three years (i.e., serious plus minor crashes). The predictor variables in the error and lapse-based crash frequency model include the amount of the two factored errors and lapses values, driver age, driving experience, and the exposure measure (number of hours driving each day). This model assumes that crashes are outcomes of unintentional mistakes. The dependent variable of the model is, as before, the frequency of total crashes in the last three years (i.e., serious plus minor crashes). The combination of Intention-based and Errors and Lapses-based crash frequency models incorporates a mixture of the driver’s intention to violate and the amount of the two factored errors and lapses values, as well as driver age, driving experience, and exposure values.
Verification of TPB Factors: Attitudes, Subjective Norms, Perceived Behaviour Control (PBC), and Intention
In this study, the tree regression model is not directly used in creating the crash frequency models. In the final application, the crash frequencies will be estimated using the predicted intention values. These predicted intention values are, in turn, estimated using the TPB components. The two items measuring intention were first combined (α = 0.79) and then included as the independent variable.
The tree-regression model used to predict the intention value in the model application phase was developed in a previous study [66] with the factors extracted by a Principal Component Analysis (PCA) and Varimax technique with Kaiser normalization as the rotation method (five items were loaded on each of the two factors, see Bakhtiary et al. [65], for details). The PCA revealed two factors (see Table 2) as the predictors for the intention value. The intention value itself included the average of the two items introduced in Section 2.2 with no PCA procedure involved. By determining the factors, Cronbach’s alpha and composite reliability (CR) criteria [65] were used as internal consistency scales for each factor as well as the entire TPB questionnaire. Variance Inflation Factor (VIF) (reciprocal of tolerance: [67] was used to determine the value of multicollinearity.
Table 2.
Items in two explored factors: ATTITUDE and PBC_NORMS [66].
Before creating the decision tree model as a means to predict the intention value, a stepwise regression method was conducted to determine a subset of influential variables. Using a decision tree algorithm, the degree of intention to commit speed violation was predicted based on TPB components, and cross-validation was performed using the k-folds technique. In this model, using the TPB elements (attitude towards violations, subjective norms, descriptive norms, and perceived behavioural control), the amount of intention to violations was predicted by applying the decision tree algorithm. The previous study [66] showed that only TPB components, including the ATTITUDE factor (α = 0.864) and PBC_NORMS factor (α = 0.847) (see Table 2), were identified as influencing variables on the intention value, while exposure and demographic effects were not significant factors in predicting the intention. Finally, the structure of the decision tree was formed of 57 decision rules that were written as “If-Then” statements with a k-fold cross-validated RMSD of 0.26 and adjusted R2 of 0.746 for the tree regression model (adjusted R2 in the stepwise linear model was 0.669).
Verification of DBQ Factors: Lapses and Errors
The DBQ approach is an alternative for the intentional violations addressed by the TPB approach since it also includes mistakes, i.e., errors and lapses. The extraction method was PCA, and the rotation method used was the Varimax with Kaiser normalization. The total Cronbach’s alpha and composite reliability (CR) values, respectively, equal 0.876 and 0.860 for the whole model, show a convincing two-factor structure which explains 49.2% of the total variance (Table 3). Factor 1 included items normally described as errors, with one exception for the last item about misjudgment, which has been described as a lapse. The items in Factor 2 neatly describe various lapses. One of the items, “I fail to notice that the traffic light has turned red,” earned a loading less than 0.5 and was therefore excluded. Accordingly, the average response of the items for the two factors will be used as covariates in the DBQ-based model creation phase.
Table 3.
Loadings for nominal errors and lapse items matched to the two explored factors.
Criterion Variables: Self-Reported, Model-Predicted, and Bayesian Weighted Crash Frequency
The variables denoting crash frequencies fall into three operational criteria. First, the self-reported crashes represent the observed crashes (NObserved) of drivers with the same rarity and randomness nature as characterized for road sites in the Highway Safety Manual [7]. Second, model-predicted crashes (NPredicted) are estimated by a crash frequency model set through a cross-sectional approach. In the same way, they usually include covariate estimates by a generalized linear model such as Negative Binomial (NB) or its extensions as described further in Section 2.4.2. Third, the Bayesian weighted crash frequency (NExpected) is an expected reliable value addressing the regression-to-the-mean (RTM) effects triggered by the randomness and natural fluctuation of observed (i.e., self-reported) crash data. Due to its reliability, this is a principal rating criterion to make the final judgement about each individual driver.
Inclusion of Exposure, Experience, and Age
The three demographic variables used as the model covariates include exposure (the so-called mileage criterion in some studies), driving experience, and age. The gender factor was not taken into account because all subjects included in the study were among public-sector taxi drivers, who consist of male drivers only. The exposure variable somehow denotes the workload criterion in terms of the number of daily driving hours. Driving experience is the duration from receiving the driving licence card, divided into four groups: beginners (5 years and less), low-experienced drivers (6 to 10 years), experienced drivers (11 to 20 years), and professional drivers (more than 20 years). Age is also used as an ordinal variable set into five groups: group 1 (18–25), group 2 (26–33), group 3 (34–41), group 4 (42–49), and group 5 (50 and older). The reason for treating driving experience and age as ordinal variables is to align more closely with the TPB and DBQ scales.
2.4.2. Creation of Crash Frequency Models
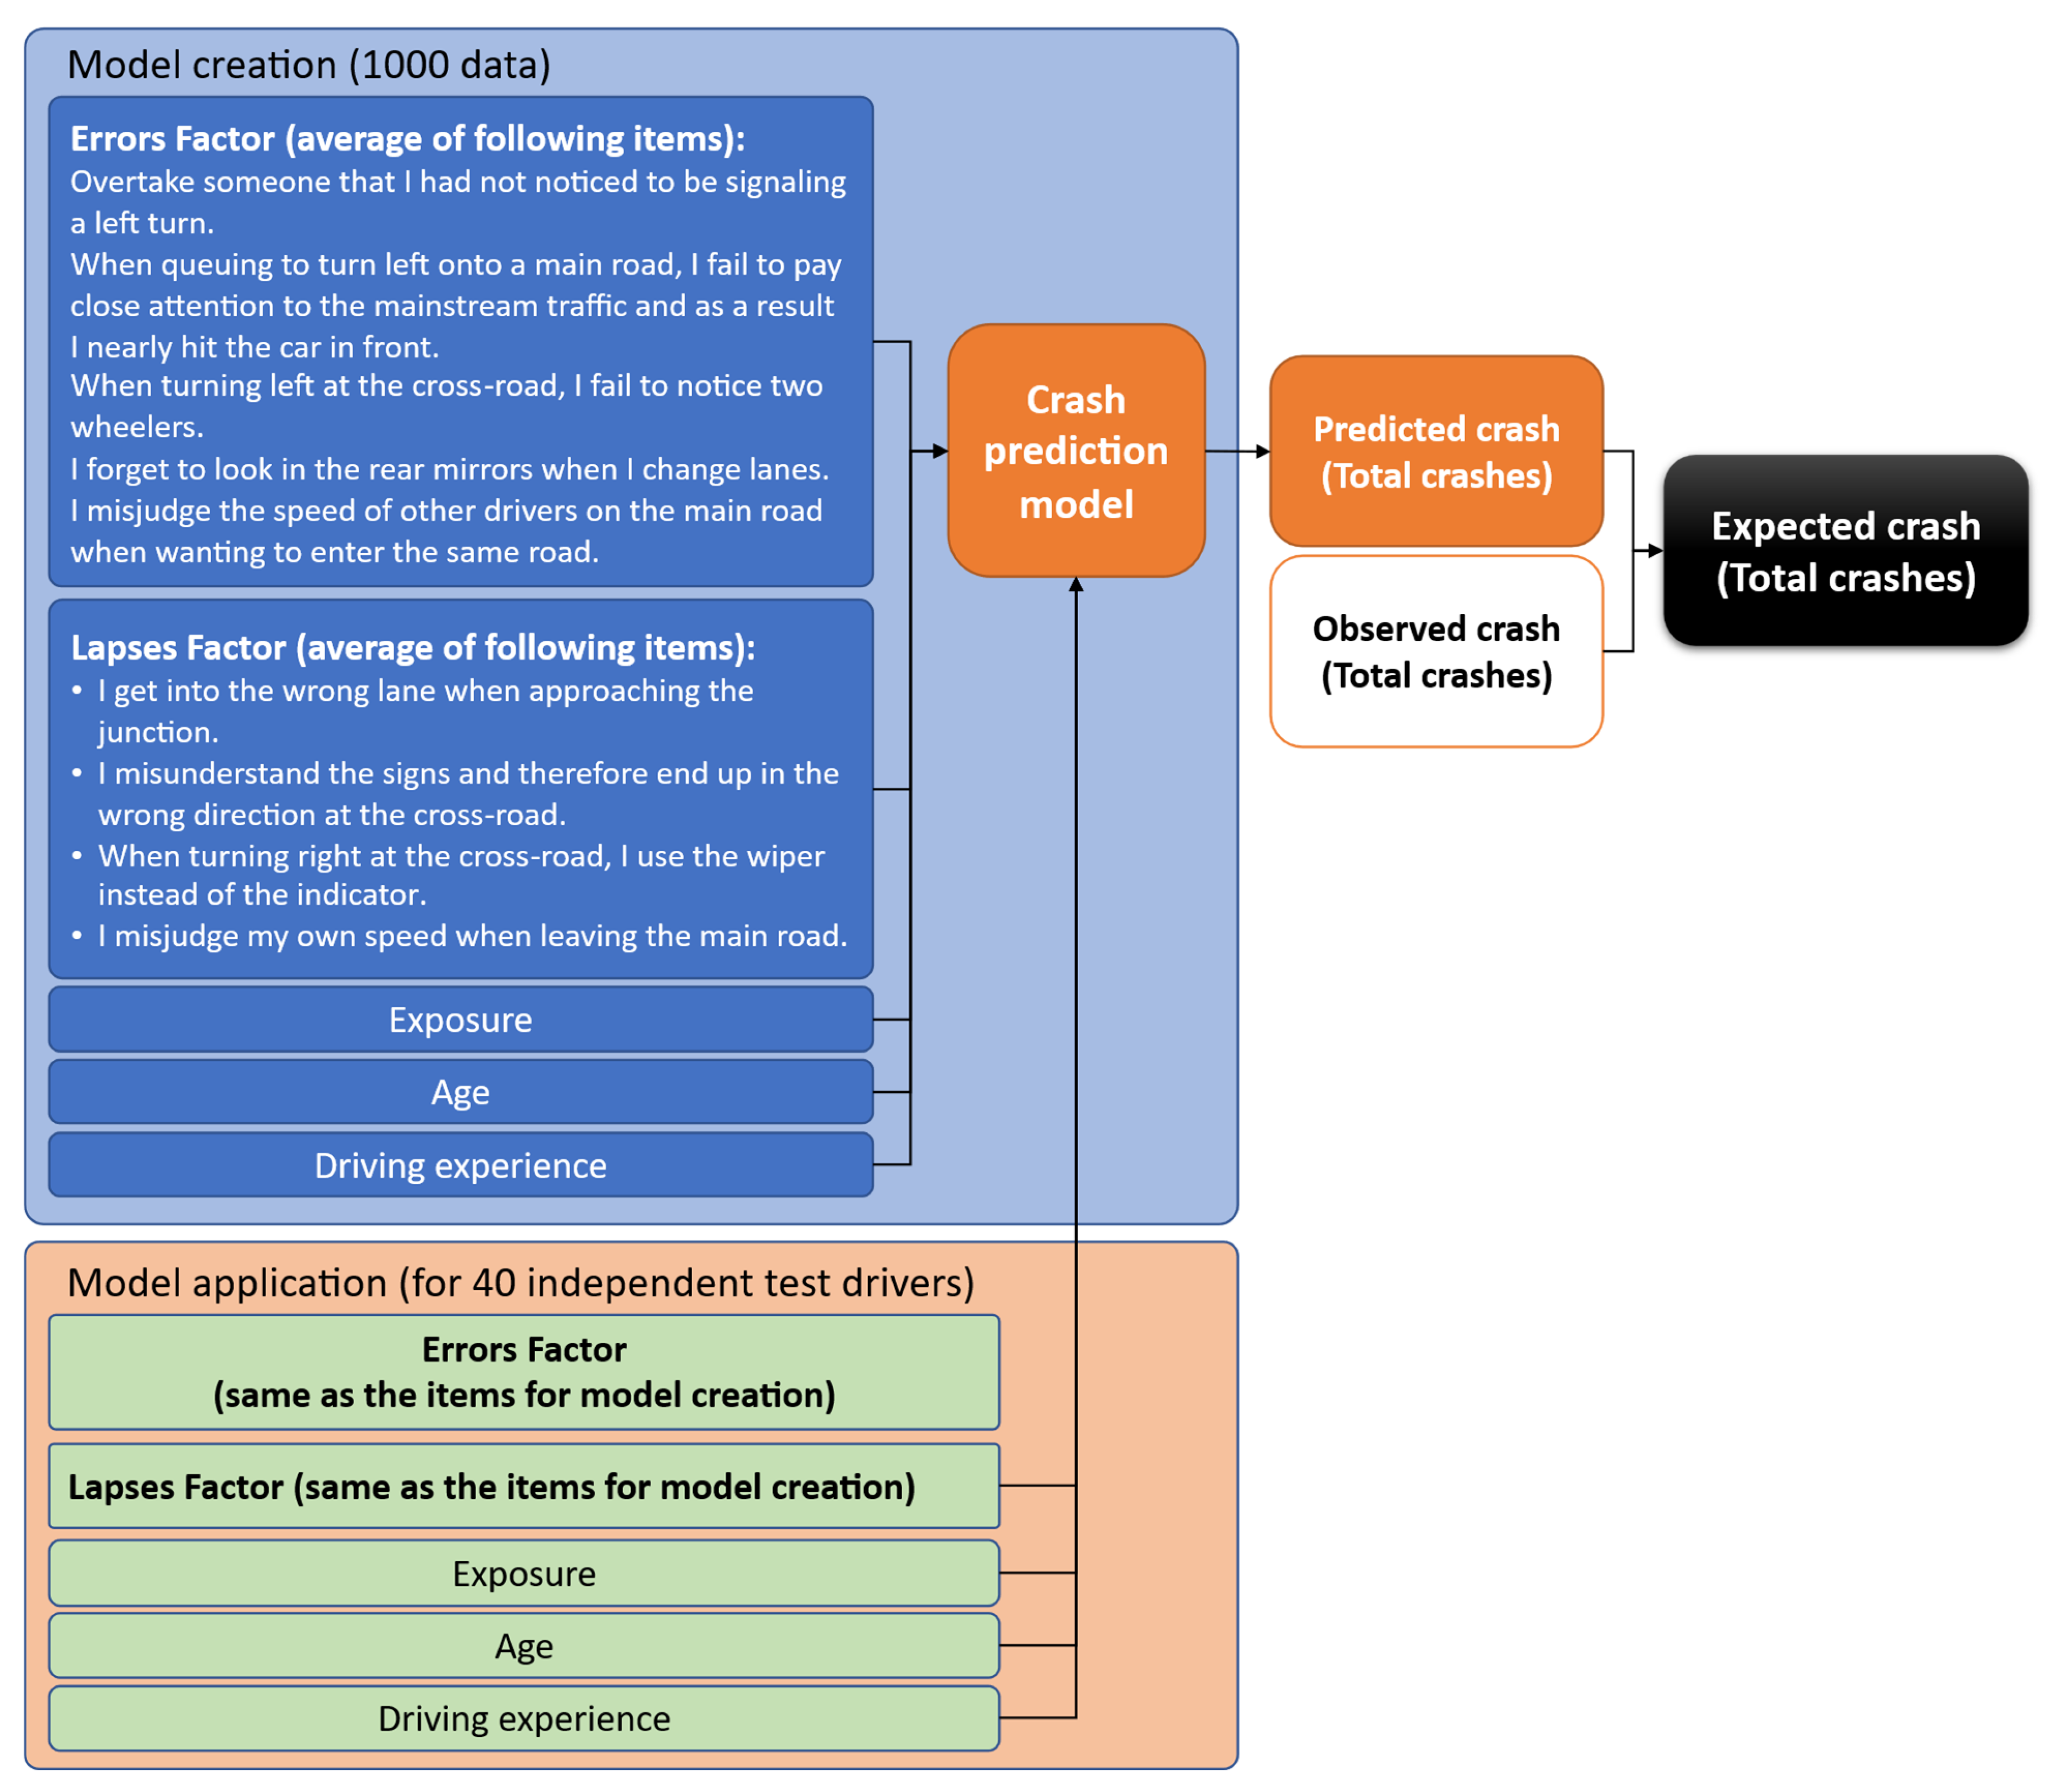
The context of all data includes two data acquisition environments: model creation and model application. The model creation uses two approaches for crash prediction purposes, including an intention-based model and a model based on errors and lapses (see Figure 1 and Figure 2). The dependent variables with respect to this are the model-predicted criteria described in Section Criterion Variables: Self-Reported, Model-Predicted, and Bayesian Weighted Crash Frequency.
Figure 1.
Intention-based crash frequency model.
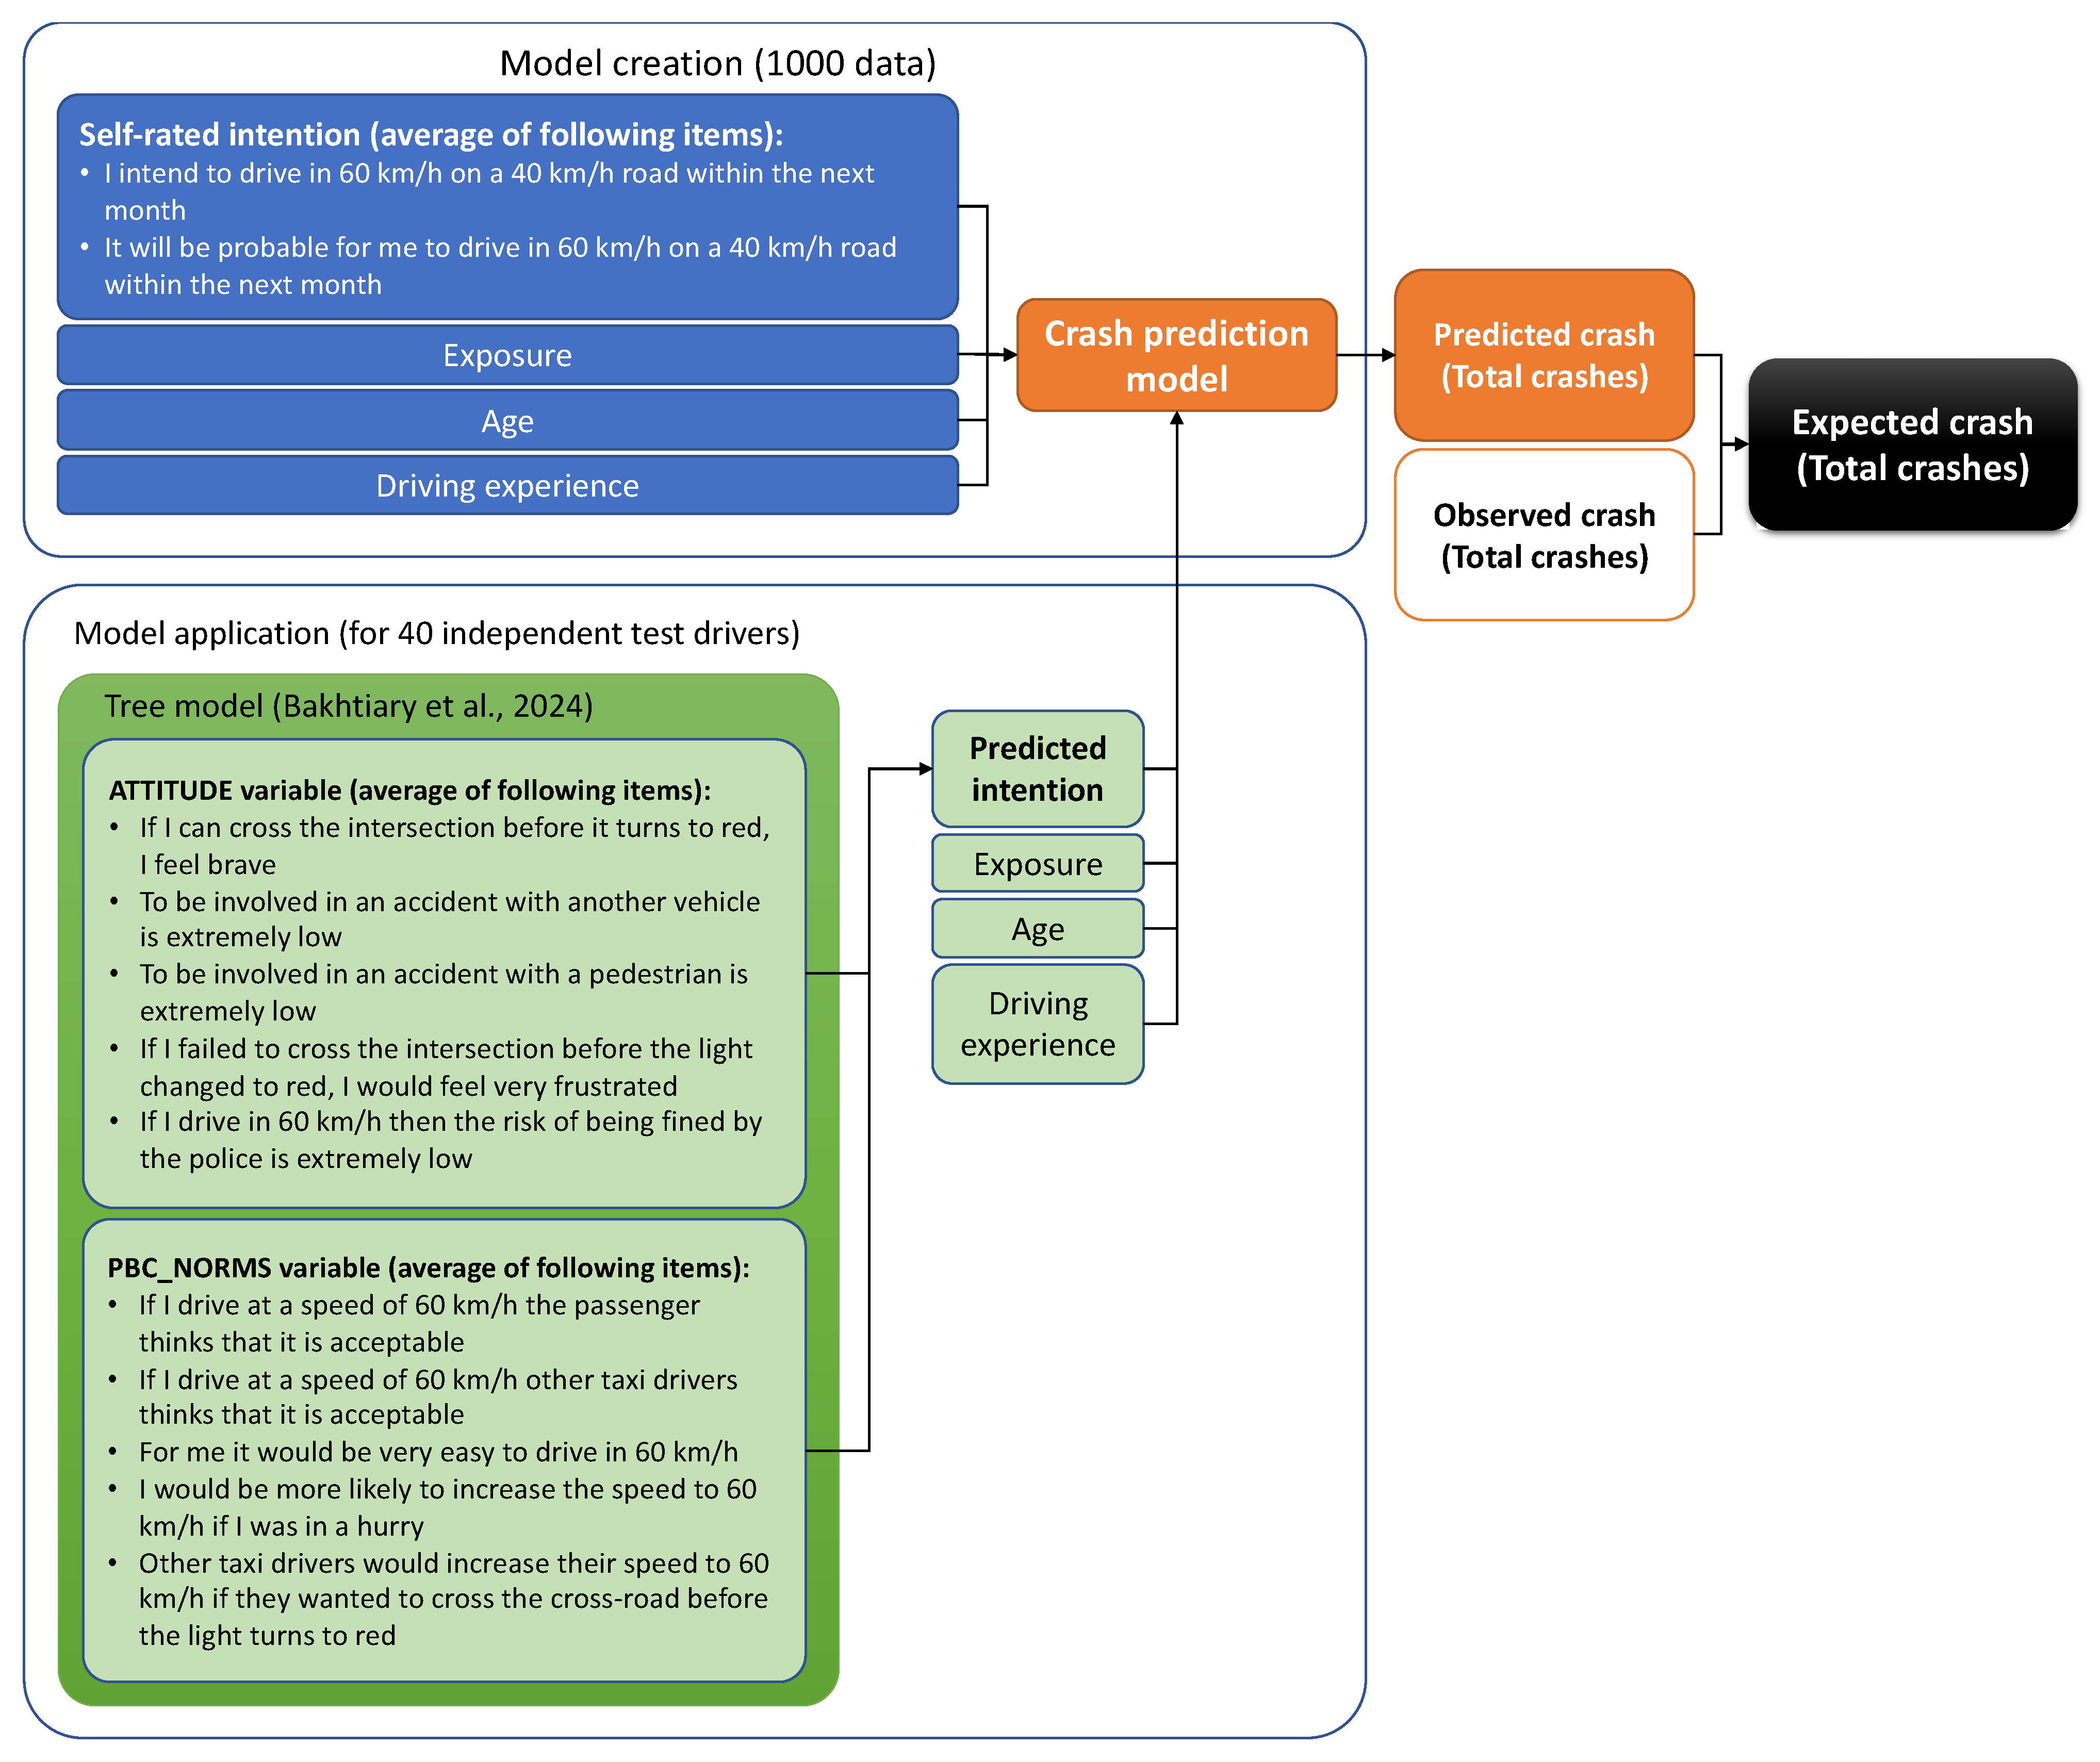
Figure 2.
Error and lapse-based crash frequency model.
The intention-based model creation contains a direct query of the driver’s intention to commit a speed violation. Therefore, the TPB factors, including attitudes, subjective norm, and perceived behaviour control, are not included within the model creation phase. The model application phase in this approach does not apply the direct statement of the intention value, but a predicted value, which would be estimated using the tree-based regression model developed by Bakhtiary et al. [65]. The tree regression model used the two TPB factors: ATTITUDE and PBC_NORMS. Thus, the intention to violate will act as a mediator variable in predicting the crash frequency for a given driver.
The model based on errors and lapses predicts crashes as a function of DBQ Factors (Section Verification of DBQ Factors: Lapses and Errors) and demographic variables (Section Inclusion of Exposure, Experience, and Age). The questions asked in the DBQ-based model application phase are the same as those used in the model creation phase because errors and lapses are not predicted or namely mediator variables, as we had in the intention-based model, but actually the values being directly asked in the application phase, e.g., a renewal of a driving permit. A third combined model of the two approaches was created as well. The combination of Intention-based and Errors and Lapses-based crash frequency models is shown in Figure 3.
Figure 3.
A combination of intention-based, error and lapse-based crash frequency models.
Dealing with Overdispersed Crash Data
The negative binomial, as a model that covers overdispersion, is one of the most widely used methods in predicting the frequency of crashes. It should be noted that conventional normally distributed linear models and their extensions would not work when dealing with overdispersed data, especially when a large number of zero data points exist. The negative binomial (NB) (or Poisson-gamma) model is an extension of the Poisson model that was introduced to overcome the overdispersion observed in data [68] for which the variance exceeds the mean value. In addition, we usually face a large amount of zero data in crash data. The zero-inflated negative binomial model can cover the large number of zero data in crash data [69]. Zero-inflated count models were first introduced by Lambert [70] to provide another method of accounting for excessive zero counts. They are two-part models, consisting of both binary and count model sections. This mixture of modelling zeros is reflected in the log-likelihood function. The crash prediction model used in this study includes a cross-sectional model using covariates [68] and a corresponding mixed Poisson model.
Models Tested
Finally, six different models are developed with one negative binomial (NB) and one zero-inflated negative binomial (ZINB) technique for each of the two modelling approaches, i.e., the intention-based and error and lapse-based approaches, as well as a combination of these two approaches, see Table 4. The rationale for separately testing intention-based and DBQ-based models is to explore the distinct nature of intentional and unintentional violations within their respective contexts. The intention-based model serves as an alternative to the DBQ-based models previously tested as described in Section 1.1. Additionally, demographic factors were included in the crash frequency models due to their potential to reflect personal traits. These traits were not found to be significant predictors of intention values in earlier analyses, i.e., the decision-tree regression model.
Table 4.
Six crash frequency models.
The general models for predicting the crash frequencies fall into the following equations:
- For the intention-based crash frequency models (CFM-1 and CFM-2):
- For the error and lapse-based crash frequency models (CFM-3 and CFM-4):
- For the combined approach (CFM-5 and CFM-6):
Decision Criteria for Testing the Models
Both Akaike Information Criterion (AIC) and Bayesian Information Criterion (BIC) are used as goodness-of-fit criteria for comparing models with each other. The AIC is based on the concept of entropy and shows how much information is lost when using a statistical model. In other words, this criterion establishes a balance between the accuracy of the model and its complexity [71]. Given the data, the six competing models can be ranked according to the AIC value, and the model with the lowest AIC is the best.
2.4.3. Model Application Using the Bayesian Weighted Crash Frequency
After the selection of models used to predict crash frequency, the data from the 40 taxi drivers were included. In the model application phase, the intention-based crash frequency model uses the predicted values of the intention instead of the direct self-reported measures. This intention prediction is done by the tree regression model developed by Bakhtiary et al. [65] and described in Section Verification of TPB Factors: Attitudes, Subjective Norms, Perceived Behaviour Control (PBC), and Intention. It should be noted that the model application phase does not provide a testing procedure but a method to show how the created models can be used in operation.
For crash frequency prediction models, due to the nature of crashes, which are rare and random events, as an alternative approach for model testing, the empirical Bayesian (EB) combination of observed (i.e., self-reported) and predicted crash frequencies is used. Finally, the frequency of expected crashes is obtained from this combination, which can best serve as a criterion for evaluating driver safety [7]. That is, the model with the 40 data was tested for two reasons: First, to determine the differences between stated and predicted intention values; Second, to estimate the expected crash frequency by combining their self-reported and predicted crashes using the empirical Bayesian (EB) combination. The latter is a practical usage of the final product of this research. This is similar to the process that is used in the analysis of road crash-prone segments in order to screen and prioritize them [7]. Doing this scoring provides an operational look at the model obtained from this study.
By using empirical Bayesian in the combination of predicted and self-reported crash frequency, the expected crash frequency becomes more reliable. The empirical Bayesian method is a key tool to compensate for the potential of regression to the mean effect. The frequency of crashes varies from one period to another and has a natural fluctuation. Equations (4) and (5) are directly used to estimate the expected crash frequency at a site (in this study, for one driver) by combining the predicted and observed crash frequencies, the same as the procedure used for road segments [7]:
where Nexpected, Npredicted, and Nobserved are expected, predicted, and self-reported crash frequencies, respectively. In these equations, w is a weighting coefficient that is applied to the predicted crash frequency value. This weighting factor is inversely related to the overdispersion parameter , in the sense that higher overdispersion values due to higher natural fluctuations in modelling data will lead to lower w values and hence lower reliance on predicted values.
3. Results
3.1. Variables
In the data set for the dependent variable, i.e., the frequency of total crashes, the variance value is higher than the average (Table 5), which shows the overdispersion of crash data. There are 69.3 percent of zero values in the data of the total crashes, and the high number of zeros in the variables justifies the use of a zero-inflated negative binomial model [69]. The mean value of the intention to speed, including “In the next month I would be likely to drive 60 km/h on streets with a 40 km/h speed limit” and “I would tend to drive 60 km/h on streets with a 40 km/h speed limit in the next month,” is considered the degree of intention. The average score of intention speed was 2.59, and the number of drivers who scored three or less was 75.7% (i.e., on a scale from one to five, with one indicating “I do not agree at all”).
Table 5.
Descriptive statistics.
The average scores for independent variables in the TPB-based model (ATTITUDE and PBC_NORMS) were higher than the scores for the variables in the DBQ-based model (Errors and Lapses), in the sense that taxi drivers rate themselves with higher intended risky behaviours than unintentional errors and lapses. More than 90% rated themselves with error and lapse scores of three or lower than three, while, respectively, 62% and 54% rated themselves with ATTITUDE and PBC_NORMS scores of three or less. The mean values from the items included in the DBQ showed that it was more usual for the drivers to commit errors than lapses.
One of the reasons why Poisson-Gamma models have been used is the non-normality of crash data distribution. In order to prove this issue, two well-known tests of normality, namely the Kolmogorov–Smirnov test and the Shapiro–Wilk test, were used. The Shapiro–Wilk test is more suitable for small sample sizes (fewer than 50 samples), but it can also be used for sample sizes up to 2000. The way to detect normality is that if the significant value of the Shapiro–Wilk test is less than 0.05, the data does not follow a normal distribution. The significant values of 0.401 and 0.613 were calculated as Kolmogorov–Smirnov and Shapiro–Wilk statistics, respectively, which in both cases show that the crash data is not normally distributed. In addition, in the histogram and the Q-Q plot of total crash data in Figure 4, the distribution of crash data shows zero inflation and non-normality of the data.
Figure 4.
Crash data distribution: Histograms and normal Q-Q plots for total crash data.
3.2. Crash Frequency Models: Creation
In order to find the selected model, a combination of different independent variables was developed with one negative binomial and one zero-inflated negative binomial approach, and the dependent variable of total crashes for 1000 drivers. The sample size of 1000 drivers that previously sufficed in the following study [66] for the tree regression model is well above the required amount suggested for power calculation purposes in negative binomial models and the extensions (e.g., [72]). The model outputs were evaluated using AIC and BIC values [73]. Rather few taxi drivers had been involved in a road crash resulting in serious injury (4.2%) in the last three years. For this reason, none of the algorithms converged in the negative binomial and zero-inflated negative binomial techniques for serious-injury crash models, and gave errors with different combinations and algorithms. Because of this, modelling was done with the total number of crashes, which also included damage-only crashes (n = 544, 54.4%). In Table 6, the outputs of the six model configurations with the combination of different independent variables and two techniques, NB and ZINB, are presented. For each model, coefficients of independent variables, overdispersion parameters, and AIC and BIC values are provided. An interesting result observed in Table 6 is that the coefficients for the Exposure variable in all models were significant, whereas this did not apply to the Age and Driving Experience variables. This result shows the important role of exposure value in triggering road crashes and verifies the consideration of this measure in the crash frequency models. In the models created by Errors and Lapses, other than the high values calculated for AIC, BIC, and overdispersion criteria, insignificant coefficients (high p-values) are estimated for both variables.
Table 6.
Crash frequency models.
Comparing AIC and BIC in models with the same combination of independent and dependent variables and NB and ZINB techniques shows that ZINB models have better results in all models, CFM-1 to CFM-6. Out of the six models, CFM-2 can be selected as the best model because it has the lowest AIC and BIC values as well as the lowest overdispersion parameter, but the variable Age was not found significant (p-value > 0.005) in this model. The p-value threshold of 0.005 was chosen because of underlying highly significant results in light of a sufficiently great sample size (1000 participants). Age was not significant and therefore removed from the same model, and the results are shown for a new CFM-2-a model in Table 7, Step 3. The results showed slight improvements in AIC, BIC, and overdispersion criteria, while keeping the significance of coefficients for the three remaining variables: Intention, Exposure, and Driving experience. That is, the final selected frequency model for total crashes is obtained as follows:
Table 7.
Extended trials for intention-based crash frequency models.
By removing the Age variable, the changes in the remaining three coefficients were not considerable, the greatest change in which is found for the Driving experience variable: −0.317 to −0.443, i.e., 28.4% increase in the negative effect of driving experience. Not surprisingly, driving experience was closely linked to driver age.
In order to gain a better understanding of the effect of the Intention to violate, it was added directly into the crash frequency model. Of course, it should be remembered that this practice has a conceptual flaw: attitude, norm, and behavioural control factors based on TPB theory can predict driver behaviour, not crash frequency. However, to test the direct effect of TPB factors on crash frequency, two more models were added to the supplementary steps in Table 7: Directly using TPB factors resulted by Bakhtiary et al. [65]—without age effect (CFM2-b model) and Directly using nominal TPB variables—without age effect (CFM2-c model). In the CFM2-b model, the same factors of ATTITUTE and PBC_NORMS as extracted by Bakhtiary et al. [65] for the same scenario and the same subjects were used as the main covariates. The CFM2-c model includes attitudes, norms, and the PBC groups with the items assigned by their nominal definitions, but not through an exploratory process. The results in Table 7 show that using the Intention variable in the CFM2-a model still shows better performance criteria (AIC = 1875, BIC = 1900, and = 0.106) and the direct use of TPB variables, either factored (CFM2-b: AIC = 1894, BIC = 1923, and = 0.215) or nominal (CFM2-c: AIC = 1880, BIC = 1914, and = 0.261), does not provide a better model.
If we compare the overdispersion parameter λ in all the models, the models with the ZINB method have a lower overdispersion parameter than the NB method. This shows that the ZINB approach was able to cover the overdispersion caused by the high number of zeros. In this regard, in the calculation of the expected frequency of total crashes for the test data, the value close to zero for the overdispersion parameter (0.106) has caused a higher value to be given to the predicted values than the observed values in the empirical Bayesian combination. Therefore, the expected crash frequency values are close to the predicted crash frequency values.
In the final (selected) model of total crashes, it was shown that with an increase of one unit in the value of the intention to speed, the logarithmic difference in the frequency of total crashes increases by a factor of 0.205 or 20.5%. Drivers with a greater intention to commit violations show more dangerous driving (behaviour) and have a higher chance of crash involvement. With a one-unit increase in the amount of exposure (a one-hour increase in the amount of daily driving), the logarithmic difference in the frequency of total crashes increases by a factor of 0.103 or 10.3%. Similarly to what happens in predicting crash frequency at road sites, the greater the amount of exposure (for road sites, the daily volume of traffic per year, and for drivers, the number of hours of driving per day), the higher the probability of crash involvement. With the increase in one unit of driving experience, the logarithmic difference in total crash frequency decreases by a factor of 0.443 or 44.3%. An important result, which also confirms the TPB, is that the attitude, subjective norms, and perceived behavioural control predict crash frequency via intention and not directly.
3.3. Crash Frequency Models: Application
The results for the 40-person independent test group of taxi drivers are presented in Table 8. In contrast to the previous sample of 1000 taxi drivers, the respondents’ anonymity could not be protected, and therefore their self-reported intention to speed was not included in the survey.
Table 8.
The crash model application for 40 test drivers.
Thereby, a predicted value of the Intention variable was estimated for each driver using the two TPB factored variables: ATTITUDE and PBC_NORMS. Because the intention value was scaled between 1 and 5 in the model creation stage, the predicted intention lower than 2.5 is considered as drivers with low intention to engage in risky behaviour. Same as the model creation phase, the exposure measure was recorded in terms of the daily hours of driving. The conventional value of 8 h per day is known here as a threshold for high workloads. The four groups of driving experience introduced in the model creation were used here too: Groups 1 and 2 are known as low-experienced drivers (less than 10 years), and Groups 3 and 4 are known as high-experienced drivers (more than 10 years). Because of not accessing the crash records, self-reported total crashes were asked from the drivers as observed crashes. Finally, the expected crash frequencies were estimated using Equations (4) and (5) (see Section 2.4.3). These two equations are directly used to estimate the expected crash frequency at a site (in this study, for one driver) by combining the predicted and observed (self-reported) crash frequencies. The coefficient w reflects the difference between predicted and expected crash frequencies. The low amount of the estimated overdispersion parameter (λ = 0.106) has led to high w coefficients (w ≥ 0.882 for all 40 drivers), which shows high reliance on the predicted value of crashes, and that is why the expected values are estimated nearer to the predicted values than the observed values. The expected total crashes are estimated between 0.28 and 1.32, with an average of 0.65 crashes in three years. Accordingly, the results for all influencing variables are assessed below:
- For lower values of the predicted risky intention (with scales less than 2.5), drivers are often associated with a lower expectation of crashes. This issue is especially evident for people who have more driving experience (groups 3 and 4), and the expected amount of crashes decreases with the reduction in exposure (see drivers 1, 2, 3, 4, 5, 6, 12, 20, and 23). Here, a decisive criterion in this assessment is the history of crashes. Meanwhile, for drivers with no crash history, even with a large number of hours of driving (more than 8 h per day), few crashes are expected (see drivers 15, 16, and 17).
- A low intention to commit a violation does not guarantee low expected crashes. This issue is strongly influenced by driving experience, so that in drivers with low driving experience (groups 1 and 2), even with a lower intention to risky behaviour, more crashes (>0.65) are expected (see drivers 11, 18, 21, 22, 26, and 38).
- Regardless of the driver’s intention for risky behaviour, the high volume of driving (more than 8 h per day) for low-experienced drivers (groups 1 and 2) leads to a high crash expectation (see drivers 13, 14, 18, 22, 26, 38, and 40).
- Highly experienced drivers (groups 3 and 4) are not necessarily safe drivers. Their high intention to unsafe behaviour and their high exposure (more than 8 h of driving per day) can define them as unsafe drivers (see drivers 7, 9, 32, and 35); even if they do not have a lot of crash history (such as driver 35).
- Not having a crash history in the records cannot be proof that the driver is safe (see drivers 11, 14, 18, 21, 22, 26, and 38). As seen, the three factors of the driver’s intention to risky behaviour, his exposure, and driving experience can determine his level of safety. This can be an important message for car insurers and other driver safety assessors.
These results can applicably lead us to important policy decisions that are described at the end of Section 4.
4. Discussion
The current study aimed to increase our understanding of what predicts road crashes among taxi drivers. More precisely, the study examined whether the intention to speed, as measured by the Theory of Planned Behaviour (TPB), can better fit a crash frequency model than errors or lapses as measured by the Driving Behaviour Questionnaire (DBQ). The variable of intention to commit violations is considered a mediator variable that represents the behaviour of a driver and is predicted in a previous model through attitudes, norms, and perceived behavioural control [61]. In the final application, the crash frequencies were estimated using the predicted intention values. These predicted intention values were, in turn, estimated using the TPB components. The results showed that driving experience was the most influential variable in the crash involvement estimations, followed by the intention to speed and exposure. The value for intention to speeding violation directly entered within the crash frequency model resulted in the best-performing model. The DBQ items were extracted into two factors, including Errors and Lapses, with one lapse item included in the Errors factor. The final selected crash frequency model excluded the age variable because of its insignificant effect in the model.
The model, including the intention variable, showed promising results, especially by considering the randomness effect through a negative binomial model, which was not shown in other studies. Using a structural equations model (SEM), Iversen and Rundmo [39] have shown that the intention to violate and dangerous behaviours had a significant effect on crash involvement, which was also confirmed by the current study. Not considering the overdispersion caused by the randomness effect and the fluctuating nature of crash data was a great shortcoming in their study. Mostly, the DBQ factors, i.e., errors and lapses, were included in crash frequency models in previous studies. In the study by Omidi et al. [32], no significant association of crash frequencies was found with errors and lapses, which is consistent with the results achieved in the current study. Neither of the two studies addressing the relationship between the DBQ components and crash involvement for taxi drivers had used negative binomial or its extensions in order to tackle the randomness and overdispersion issues in modelling crash data. Mehdizadeh et al. [23] used a logistic regression analysis, and Taiwo et al. [28] applied a SEM in this regard, both of which showed the significant increasing role of drivers’ violations, errors, and lapses in crash involvement, while in the current study using NB and ZINB models, unintentional errors and lapses were found to have some increasing but insignificant effects on crash involvement. However, the error and lapse items in the current study were similar to the factors utilized in both studies, as well as some other studies (e.g., [26,27,34,35]). For example, similar to Gras et al. [40], some error and lapse items were combined in the resulting factors, namely Lapse and Error factors, respectively.
In addition to behavioural factors, the effects of variables such as exposure (also known as mileage) and driving experience were also included in the driver crash prediction model. The effect of exposure on crash involvement in drivers can be used similarly to what has been used to predict crashes on road sites [7]. Results in the current study show that with a one-hour increase in the amount of daily driving, the logarithmic difference in the frequency of total crashes increases by 10.3%. In some studies, similar to the results in the current study, the increase in exposure has shown an increase in the probability of crash involvement [48,49,50], while some others show some uncertainty about this issue for the effect of exposure as a confounding variable [32,74,75]. The effect of exposure in the current study did not exceed the behavioural variables, i.e., TPB factors, which is in contrast to the results by Davey et al. [76]. Same as the results in this study, driving experience has shown a stronger role in estimating the probability of crash involvement in various studies, and along with the effect of age, it has had a stronger history of studies [76,77,78,79,80,81]. Several studies (e.g., [11,39,82]) have concluded that younger drivers and drivers with less experience commit more dangerous behaviour, which is consistent with the current study, which shows that more experienced drivers have fewer crashes. However, the final models do not include the age effects due to the insignificant relationship, but they also show the contributing effects of driver experience on crash reduction. The results of the current study show that with the increase in one unit of driving experience (the driving experience group mentioned in Table 5), the logarithmic difference in total crash frequency decreases by 44.3%. Recent studies on professional drivers (same as the taxi drivers in this study) confirm the considerable effect of driving experience on crash involvement [83,84,85].
The results achieved by the model application would lead us to critical policy decisions. Behaviour-oriented interventions such as targeted campaigns and education focused on specific risky driving behaviours can improve drivers’ behaviour by tackling unsafe beliefs. This way, quantitative measures can be defined to evaluate the effectiveness of such interventions (something like the Crash Modification Factors—CMFs used for safety treatments in road sites). High driving experience is an important factor in defining a driver as a safe driver, but it does not apply in all cases. That is, low-experienced taxi drivers must be treated more cautiously. A possible conclusion by the model application is that low-experienced taxi drivers (less than 10 years of experience) should not be permitted to drive more than 8 h per day. Possibly, a high number of working hours may seriously affect the crash expectation even for highly experienced drivers, hence all taxi drivers should be discouraged from working more than 8 h a day. For the low-experienced drivers, preparedness programmes or professional development strategies, as well as skill improvement measures such as targeted hazard perception training, can offset the adverse effects of lower qualifications. Finally, the last but most important concluding remark is that a driver’s crash history is not a reliable measure for defining the safety level of a driver and should not be used as a determinant for defining the safety level of a driver.
Indeed, these policy decisions are applicable in several institutional interventions throughout the road safety management system, including the design and evaluation of safety campaigns and education programmes, car insurance pricing, surveillance on commercial drivers, and law enforcement interventions. That is, the results in this study grant us a new insight for defining a safe driver by changing the paradigm to the application of expected crash frequencies, not the observed crashes.
5. Limitations
There were some limitations in the present study. Only the criterion of intention and not observed behaviour was measured, which could be regarded as a weakness. However, a large number of studies have been able to confirm that intention can predict future behaviour (e.g., [60,61,62,63]).
This research was conducted in the capital of Iran, and for the group of taxi drivers, and this pattern of intention to commit violations can be different for other cities and countries or other groups of drivers. In addition, the taxi drivers studied are mostly men over 40 years old, and the research results may not be well generalized to the group of drivers that includes a high percentage of women and young drivers. Excluding females in the study was inevitable because the society of public taxi drivers in Iran includes men only. Taxis in private and ride-hailing (internet taxis) modes, which use female drivers, were not included in this study. However, it is worth noting that the resulting model could be used as a business tool in examining a specific group of commercial drivers in a distinct society, but not a public model generalized for all road users.
The collection of data using a survey might include some self-reporting bias, as drivers might be unwilling to disclose personal information. However, this might be different when it comes to traffic violations, particularly speeding, which this study focuses on. According to Elliot et al. [60], self-reported driving behaviour and observed behaviour were strongly correlated. A possible explanation could be that disregarding the speed limit is a frequently reported violation and therefore carries little stigma among the public. The self-reported data set also includes serious injury crashes, which could not have been successful in a predictive frequency model due to the poor performance criteria. Thereby, methodological alternatives, such as longer data collection periods, larger samples, or analytical techniques specifically suited to rare events, could somehow help improve the model performance for very rare serious injury/fatal crashes.
6. Conclusions
The main goal of this research was to estimate the predicted crash frequency of a driver using characteristics such as the intention to commit violations (intentional), errors and lapses (unintentional), demographic information such as age and driving experience, and exposure criteria such as mileage or daily driving time. The obtained results showed that the zero-inflated negative binomial (ZINB) models provide better results in predicting the frequency of crashes, but in cases where there are too many zero values, even the ZINB model does not work. Such a result was shown in this study when the estimate for model coefficients failed in a number of suggested ZINB frequency models for crashes that resulted in an injury. That is, developing a crash frequency model for very rare crash severities (i.e., serious injury) could not be possible for the taxi drivers, although they have had more exposure, hence more possible crashes than normal drivers.
The results obtained from the selected model can be used to evaluate drivers and safety training processes. Therefore, the crash prediction model was built in such a way that it can estimate crashes with the predicted value of the intention to violate, not its direct self-rated value. The results showed that errors and lapses had an insignificant effect on the increase in crashes, but the magnitude of the effect of the intention to commit violations on crashes was significant and greater than errors and lapses. Based on a tree regression model, estimating this intention became possible by self-reporting the TPB components. Similar to what happens in predicting the frequency of crashes at road sites, the greater the amount of exposure (for road sites, the daily volume of traffic per year, and for drivers, the number of hours of driving per day), the higher the probability of crashes. But driving experience (the age of the driver’s licence) was a key significant factor in reducing the effects in predicting the crash frequency of taxi drivers in Tehran. In addition to the internal factor predicting the intention to speed, the effect of external social pressure can also help in understanding speed choice. One of these external factors is the maximum speeds that are legally set on urban roads. As mentioned in the introduction, these speed limits are currently set on urban roads in Iran, even up to 60 km/h. This speed limit, as an external factor, can be examined in direct interaction with the intention factor. The local effects of both intentional and social pressure are an important issue of concern. Therefore, the examination can be done using spatial data in future studies, which, of course, becomes more important if each jurisdiction can establish its own rules for determining speed limits.
The results of this study can lead to broader transformations in the professional transport sector, including the rise in app-based mobility services and evolving economic pressures on traditional taxi drivers. As an illustration, mobile apps can be developed to evaluate and predict the risk of drivers based on behaviour-based crash frequency predictive models by embedding the concepts of this study in a user-interactive fashion. In this extended context, these changes may influence occupational stress, competitiveness, and potentially driving behaviour.
Author Contributions
Conceptualization, H.R.B.; methodology, H.R.B., S.E.F. and M.B.; software, M.B. and H.R.B.; formal analysis, H.R.B. and S.E.F.; investigation, H.R.B. and M.B.; data curation, M.B.; writing—original draft preparation, H.R.B., M.B. and S.E.F.; writing—review and editing, H.R.B., S.E.F. and J.A.; supervision, J.A., S.E.F. and H.R.B.; project administration, H.R.B. All authors have read and agreed to the published version of the manuscript.
Funding
This research received no external funding.
Institutional Review Board Statement
The study was conducted in accordance with the Declaration of Helsinki and approved by the Institutional Review Board of the Civil Engineering–Transportation Department of Imam Khomeini International University (Minutes No. 1290, dated 25 November 2025).
Informed Consent Statement
Informed consent was obtained from all subjects involved in the study.
Data Availability Statement
The data presented in this study are available on request from the corresponding author.
Conflicts of Interest
The authors declare no conflicts of interest.
References
- World Health Organization. Road Traffic Injuries; World Health Organization: Geneva, Switzerland, 2023; Volume 28, Available online: https://www.who.int/news-room/fact-sheets/detail/road-traffic-injuries (accessed on 22 May 2026).
- World Health Organization. Global Status Report on Road Safety 2018; World Health Organization: Geneva, Switzerland, 2019. [Google Scholar]
- Shams, M.; Mohebi, F.; Gohari, K.; Masinaei, M.; Mohajer, B.; Rezaei, N.; Sheidaei, A.; Khademioureh, S.; Yoosefi, M.; Farzadfar, F.; et al. The level and trend of road traffic injuries attributable mortality rate in Iran, 1990–2015: A story of successful regulations and a roadmap to design future policies. BMC Public Health 2021, 21, 1722. [Google Scholar] [CrossRef] [Scilit]
- Adl, J.; Dehghan, N.; Abbaszadeh, M. The survey of unsafe acts as the risk factors of accidents in using taxis for intercity travelling in Tehran. Saf. Promot. Inj. Prev. 2014, 2, 39–46. [Google Scholar]
- Tavolinejad, H.; Malekpour, M.R.; Rezaei, N.; Jafari, A.; Ahmadi, N.; Nematollahi, A.; Abdolhamidi, E.; Mehr, E.F.; Hasan, M.; Farzadfar, F. Evaluation of the effect of fixed speed cameras on speeding behavior among Iranian taxi drivers through telematics monitoring. Traffic Inj. Prev. 2021, 22, 559–563. [Google Scholar] [CrossRef] [Scilit]
- World Health Organization. Global Status Report on Road Safety 2023: Country and Territory Profiles; World Health Organization: Geneva, Switzerland, 2024. [Google Scholar]
- National Research Council (US). Transportation Research Board. Task Force on Development of the Highway Safety Manual, & Transportation Officials. Joint Task Force on the Highway Safety Manual. In Highway Safety Manual; Aashto: Washington, DC, USA, 2010; Volume 1. [Google Scholar]
- Shinar, D. Traffic Safety and Human Behavior; Emerald Publishing Limited: Leeds, UK, 2017. [Google Scholar]
- Singh, S. Critical Reasons for Crashes Investigated in the National Motor Vehicle Crash Causation Survey. (No. DOT HS 812 115); NHTSA: Washington, DC, USA, 2015. [Google Scholar]
- Touahmia, M. Identification of risk factors influencing road traffic accidents. Eng. Technol. Appl. Sci. Res. 2018, 8, 2417–2421. [Google Scholar] [CrossRef] [Scilit]
- Cantor, D.E.; Corsi, T.M.; Grimm, C.M.; Özpolat, K. A driver focused truck crash prediction model. Transp. Res. Part E Logist. Transp. Rev. 2010, 46, 683–692. [Google Scholar]
- Das, S.; Sun, X.; Wang, F.; Leboeuf, C. Estimating likelihood of future crashes for crash-prone drivers. J. Traffic Transp. Eng. (Engl. Ed.) 2015, 2, 145–157. [Google Scholar]
- Sümer, N. Personality and behavioral predictors of traffic accidents: Testing a contextual mediated model. Accid. Anal. Prev. 2003, 35, 949–964. [Google Scholar] [CrossRef] [Scilit]
- Dotse, J.E.K.; Rowe, R. Applicability of the contextual mediated model to predicting road crashes in Ghana and the United Kingdom. Transp. Res. Part F Traffic Psychol. Behav. 2025, 109, 635–651. [Google Scholar]
- Tinella, L.; Bosco, A.; Koppel, S.; Lopez, A.; Spano, G.; Ricciardi, E.; Traficante, S.; Napoletano, R.; Grattagliano, I.; Caffò, A.O. Sociodemographic and psychological factors affecting motor vehicle crashes (MVCs): A classification analysis based on the contextual-mediated model of traffic-accident involvement. Curr. Psychol. 2024, 43, 25683–25703. [Google Scholar]
- Reason, J.; Manstead, A.; Stradling, S.; Baxter, J.; Campbell, K. Errors and violations on the roads: A real distinction? Ergonomics 1990, 33, 1315–1332. [Google Scholar] [CrossRef] [Scilit]
- Parker, D.; Reason, J.T.; Manstead, S.R.; Stradling, S.G. Driving errors, driving violations and accident involvement. Ergonomics 1995, 38, 1036–1048. [Google Scholar] [CrossRef] [Scilit]
- Åberg, L.; Rimmö, P.A. Dimensions of aberrant driver behaviour. Ergonomics 1998, 41, 39–56. [Google Scholar] [CrossRef] [Scilit]
- Al-Karablieh, J.; Kehagia, F. Comparison of Driver’s Behavior in Greece and Palestine (West Bank). In Advances in Mobility-as-a-Service Systems: Proceedings of the 5th Conference on Sustainable Urban Mobility, Virtual CSUM2020, 17–19 June 2020; Springer International Publishing: Berlin/Heidelberg, Germany, 2021; pp. 923–934. [Google Scholar]
- Gupta, L.; Goswami, S.; Kumar, R. Analysis of driver behaviours towards road safety measures using DBQ in the Indian context. Trans. Transp. Sci. 2021, 12, 12–18. [Google Scholar] [CrossRef] [Scilit]
- Lawton, R.; Parker, D.; Stradling, S.G.; Manstead, A.S. Predicting road traffic accidents: The role of social deviance and violations. Br. J. Psychol. 1997, 88, 249–262. [Google Scholar] [CrossRef] [Scilit]
- Maslać, M.; Antić, B.; Lipovac, K.; Pešić, D.; Milutinović, N. Behaviours of drivers in Serbia: Non-professional versus professional drivers. Transp. Res. Part F Traffic Psychol. Behav. 2018, 52, 101–111. [Google Scholar]
- Mehdizadeh, M.; Shariat-Mohaymany, A.; Nordfjærn, T. Driver behaviour among professional taxi and truck drivers: Light passenger cars versus heavy goods vehicles. Transp. Res. Part F Traffic Psychol. Behav. 2019, 62, 86–98. [Google Scholar] [CrossRef] [Scilit]
- Memarian, M.; Lazuras, L.; Rowe, R.; Karimipour, M. Impulsivity and self-regulation: A dual-process model of risky driving in young drivers in Iran. Accid. Anal. Prev. 2023, 187, 107055. [Google Scholar] [CrossRef] [Scilit] [PubMed]
- Mokarami, H.; Alizadeh, S.S.; Pordanjani, T.R.; Varmazyar, S. The relationship between organizational safety culture and unsafe behaviors, and accidents among public transport bus drivers using structural equation modeling. Transp. Res. Part F Traffic Psychol. Behav. 2019, 65, 46–55. [Google Scholar] [CrossRef] [Scilit]
- Parishad, N.; Aghabayk, K.; Rezaie, R.; Samerei, A.; Mohammadi, A. Validation of the driver behavior questionnaire in a representative sample of Iranian drivers. Civ. Eng. Infrastruct. J. 2020, 53, 161–171. [Google Scholar]
- Rejali, S.; Aghabayk, K.; Shiwakoti, N. A clustering approach to identify high-risk taxi drivers based on self-reported driving behavior. J. Adv. Transp. 2022, 2022, 6511225. [Google Scholar] [CrossRef] [Scilit]
- Taiwo, O.A.; Hassan, S.A.; Mohsin, R.B.; Mahmud, N. Road traffic accidents involvement among commercial taxi drivers in Nigeria: Structural equation modelling approach. Accid. Anal. Prev. 2024, 208, 107788. [Google Scholar] [CrossRef] [Scilit]
- af Wåhlberg, A.E.; Barraclough, P.; Freeman, J. The Driver Behaviour Questionnaire as accident predictor; A methodological re-meta-analysis. J. Saf. Res. 2015, 55, 185–212. [Google Scholar] [CrossRef] [Scilit]
- Zhang, Q.; Jiang, Z.; Zheng, D.; Wang, Y.; Man, D. An application of the driver behavior questionnaire to Chinese carless young drivers. Traffic Inj. Prev. 2013, 14, 867–873. [Google Scholar] [CrossRef] [Scilit] [PubMed]
- Hussain, Z.; Hussain, Q.; Soliman, A.; Mohammed, S.; Mamo, W.G.; Alhajyaseen, W.K. Aberrant driving behaviors as mediators in the relationship between driving anger patterns and crashes among taxi drivers: An investigation in a complex cultural context. Traffic Inj. Prev. 2023, 24, 393–401. [Google Scholar] [CrossRef] [Scilit] [PubMed]
- Omidi, L.; Mousavi, S.; Moradi, G.; Taheri, F. Traffic climate, driver behaviour and dangerous driving among taxi drivers. Int. J. Occup. Saf. Ergon. 2022, 28, 1482–1489. [Google Scholar] [PubMed]
- Vahedi, J.; Shariat Mohaymany, A.; Tabibi, Z.; Mehdizadeh, M. Aberrant driving behaviour, risk involvement, and their related factors among taxi drivers. Int. J. Environ. Res. Public Health 2018, 15, 1626. [Google Scholar] [CrossRef] [Scilit]
- Lajunen, T.; Parker, D.; Summala, H. The Manchester driver behaviour questionnaire: A cross-cultural study. Accid. Anal. Prev. 2004, 36, 231–238. [Google Scholar] [CrossRef] [Scilit]
- Lawton, R.; Parker, D.; Manstead, A.S.; Stradling, S.G. The role of affect in predicting social behaviors: The case of road traffic violations. J. Appl. Soc. Psychol. 1997, 27, 1258–1276. [Google Scholar] [CrossRef] [Scilit]
- Gras, M.E.; Cunill, M.; Sullman, J.M.; Planes, M.; Aymerich, M. Self-Reported Aberrant Driving Behaviour in a Sample of Spanish Drivers. In International Conference on Traffic and Transport Psychology, Nottingham, UK. 2004. Available online: https://www.sciencedirect.com/science/article/abs/pii/S0001457512004113 (accessed on 22 May 2026).
- Hussain, B.; Sato, H.; Xiong, S.; Miwa, T.; Nguyen, N.T.; Morikawa, T. Cross-cultural differences in aberrant driving behaviors: Comparison of Japanese, Chinese, and Vietnamese drivers. J. East. Asia Soc. Transp. Stud. 2019, 13, 43–59. [Google Scholar]
- Özkan, T.; Lajunen, T.; Joannes El Chliaoutakis, J.; Dianne Parker, P.; Summala, H. Cross-cultural differences in driving behaviours: A comparison of six countries. Transp. Res. Part F 2006, 9, 227–242. [Google Scholar] [CrossRef] [Scilit]
- Iversen, H.; Rundmo, T. Attitudes towards traffic safety, driving behaviour and accident involvement among the Norwegian public. Ergonomics 2004, 47, 555–572. [Google Scholar] [CrossRef] [Scilit]
- Gras, M.E.; Sullman, M.J.; Cunill, M.; Planes, M.; Aymerich, M.; Font-Mayolas, S. Spanish drivers and their aberrant driving behaviours. Transp. Res. Part F Traffic Psychol. Behav. 2006, 9, 129–137. [Google Scholar]
- Parker, D.; West, R.; Stradling, S.; Manstead, A.S. Behavioural characteristics and involvement in different types of traffic accident. Accid. Anal. Prev. 1995, 27, 571–581. [Google Scholar] [CrossRef] [Scilit]
- Rutter, D.R.; Quine, L.; Chesham, D.J. Predicting safe riding behaviour and accidents: Demography, beliefs, and behaviour in motorcycling safety. Psychol. Health 1995, 10, 369–386. [Google Scholar] [CrossRef] [Scilit]
- Sullman, M.J.; Meadows, M.L.; Pajo, K.B. Aberrant driving behaviours amongst New Zealand truck drivers. Transp. Res. Part F Traffic Psychol. Behav. 2002, 5, 217–232. [Google Scholar] [CrossRef] [Scilit]
- Aarts, L.; Van Schagen, I. Driving speed and the risk of road crashes: A review. Accid. Anal. Prev. 2006, 38, 215–224. [Google Scholar] [CrossRef] [Scilit] [PubMed]
- Elvik, R.; Vadeby, A.; Hels, T.; Van Schagen, I. Updated estimates of the relationship between speed and road safety at the aggregate and individual levels. Accid. Anal. Prev. 2019, 123, 114–122. [Google Scholar] [CrossRef] [Scilit]
- Dotse, J.E.; Rowe, R. Modelling Ghanaian road crash risk using the Manchester driver behaviour Questionnaire. Saf. Sci. 2021, 139, 105213. [Google Scholar] [CrossRef] [Scilit]
- de Winter, J.C.; Dodou, D. The Driver Behaviour Questionnaire as a predictor of accidents: A meta-analysis. J. Saf. Res. 2010, 41, 463–470. [Google Scholar] [CrossRef] [Scilit]
- Elvik, R. Driver mileage and accident involvement: A synthesis of evidence. Accid. Anal. Prev. 2023, 179, 106899. [Google Scholar]
- Regev, S.; Rolison, J.J.; Moutari, S. Crash risk by driver age, gender, and time of day using a new exposure methodology. J. Saf. Res. 2018, 66, 131–140. [Google Scholar] [CrossRef] [Scilit]
- Shen, S.; Benedetti, M.H.; Zhao, S.; Wei, L.; Zhu, M. Comparing distance and time as driving exposure measures to evaluate fatal crash risk ratios. Accid. Anal. Prev. 2020, 142, 105576. [Google Scholar] [CrossRef] [Scilit]
- Davey, J.; Wishart, D.; Freeman, J.; Watson, B. An application of the driver behaviour questionnaire in an Australian organisational fleet setting. Transp. Res. Part F Traffic Psychol. Behav. 2007, 10, 11–21. [Google Scholar] [CrossRef] [Scilit]
- Ajzen, I. The theory of planned behavior. Organ. Behav. Hum. Decis. Process. 1991, 50, 179–211. [Google Scholar] [CrossRef] [Scilit]
- Ali, N.; Nakayama, S.; Yamaguchi, H. Using the extensions of the theory of planned behavior (TPB) for behavioral intentions to use public transport (PT) in Kanazawa, Japan. Transp. Res. Interdiscip. Perspect. 2023, 17, 100742. [Google Scholar] [CrossRef] [Scilit]
- Bayer, J.B.; Campbell, S.W. Texting while driving on automatic: Considering the frequency-independent side of habit. Comput. Hum. Behav. 2012, 28, 2083–2090. [Google Scholar] [CrossRef] [Scilit]
- Jin, L.; Guo, B.; Jiang, Y.; Hua, Q. Analysis on the influencing factors of driving behaviours based on theory of planned behaviour. Adv. Civ. Eng. 2021, 1, 6687674. [Google Scholar] [CrossRef] [Scilit]
- Tang, T.; Wang, H.; Zhou, X.; Gong, H. Understanding Electric Bikers’ Red-Light Running Behavior: Predictive Utility of Theory of Planned Behavior vs Prototype Willingness Model. J. Adv. Transp. 2020, 2020, 7097302. [Google Scholar] [CrossRef] [Scilit]
- Ajzen, I.; Fishbein, M. The influence of attitudes on behaviour. In The handbook of Attitudes; Albarracín, D., Johnson, B.T., Zanna, M.P., Eds.; Lawrence Erlbaum: Mahwah, NJ, USA, 2005; pp. 173–221. [Google Scholar]
- Ajzen, I.; Driver, B.L. Prediction of leisure participation from behavioural, normative, and control beliefs: An application of the theory of planned behaviour. Leis. Sci. 1991, 13, 185–204. [Google Scholar] [CrossRef] [Scilit]
- Ajzen, I.; Fishbein, M. Attitude and the Attitude-Behaviour Relation: Reasoned and Automatic Processes. In European Review of Social Psychology. Volume 11, pp. 1–33. Available online: https://people.umass.edu/aizen/pubs/ersp.pdf (accessed on 22 May 2026).
- Elliott, M.A.; Armitage, C.J.; Baughan, C.J. Using the theory of planned behaviour to predict observed driving behaviour. Br. J. Soc. Psychol. 2007, 46, 69–90. [Google Scholar] [CrossRef] [Scilit]
- Warner, H.W.; Åberg, L. Drivers’ decision to speed: A study inspired by the theory of planned behavior. Transp. Res. Part F Traffic Psychol. Behav. 2006, 9, 427–433. [Google Scholar]
- Hai, D.N.; Minh, C.C.; Huynh, N. Meta-analysis of driving behavior studies and assessment of factors using structural equation modeling. Int. J. Transp. Sci. Technol. 2024, 14, 219–236. [Google Scholar] [CrossRef] [Scilit]
- Somoray, K.; White, K.M.; Watson, B.; Lewis, I. Predicting risky driving behaviours using the theory of planned behaviour: A meta-analysis. Accid. Anal. Prev. 2024, 208, 107797. [Google Scholar] [CrossRef] [Scilit]
- La, Q.N.; Lee, A.H.; Meuleners, L.B.; Van Duong, D. Prevalence and factors associated with road traffic crash among taxi drivers in Hanoi, Vietnam. Accid. Anal. Prev. 2013, 50, 451–455. [Google Scholar] [CrossRef] [Scilit]
- Bakhtiary, M.; Behnood, H.R.; Forward, S.; Andersson, J. A tree-based extended model to predict intention to speed for taxi drivers. Transp. Res. Part F Traffic Psychol. Behav. 2024, 103, 190–200. [Google Scholar]
- Tseng, C.M. Operating styles, working time and daily driving distance in relation to a taxi driver’s speeding offenses in Taiwan. Accid. Anal. Prev. 2013, 52, 1–8. [Google Scholar]
- Peterson, R.A.; Kim, Y. On the relationship between coefficient alpha and composite reliability. J. Appl. Psychol. 2013, 98, 194. [Google Scholar] [CrossRef] [Scilit]
- O’brien, R.M. A caution regarding rules of thumb for variance inflation factors. Qual. Quant. 2007, 41, 673–690. [Google Scholar] [CrossRef] [Scilit]
- Lord, D.; Qin, X.; Geedipally, S.R. Highway Safety Analytics and Modeling; Elsevier: Amsterdam, The Netherlands, 2021. [Google Scholar]
- Hilbe, J.M. Negative Binomial Regression; Cambridge University Press: Cambridge, UK, 2011. [Google Scholar]
- Lambert, D. Zero-inflated Poisson regression, with an application to defects in manufacturing. Technometrics 1992, 34, 1–14. [Google Scholar] [CrossRef] [Scilit]
- Williamson, J.M.; Lin, H.; Lyles, R.H.; Hightower, A.W. Power calculations for ZIP and ZINB models. J. Data Sci. 2007, 5, 519–534. [Google Scholar] [CrossRef] [Scilit]
- Akaike, H. A new look at the statistical model identification. IEEE Trans. Autom. Control 1974, 19, 716–723. [Google Scholar] [CrossRef] [Scilit]
- Lee, D.; Guldmann, J.M.; Choi, C. Factors contributing to the relationship between driving mileage and crash frequency of older drivers. Sustainability 2019, 11, 6643. [Google Scholar] [CrossRef] [Scilit]
- Thiesmeier, R.; Skyving, M.; Möller, J.; Orsini, N. A probabilistic bias analysis on the magnitude of unmeasured confounding: The impact of driving mileage on road traffic crashes. Accid. Anal. Prev. 2023, 191, 107144. [Google Scholar] [CrossRef] [Scilit]
- Davey, J.; Freeman, J.; Wishart, D. A study predicting self-reported crashes among fleet drivers. In 2006 Australasian Road Safety Research, Policing and Education Conference Proceedings; Able Video and Multimedia Pty Ltd.: Southport, UK, 2006; pp. 1–11. [Google Scholar]
- Drummond, A.E.; Yeo, E.Y. The Risk of Driver Crash Involvement as a Function of Driver Age; Monash University, Accident Research Centre: Clayton, Australia, 1992; Volume 49. [Google Scholar]
- Eby, D.W. An Analysis of Crash Likelihood: Age Versus Driving Experience; The University of Michigan Transportation Research Institute: Ann Arbor, MI, USA, 1995. [Google Scholar]
- McCartt, A.T.; Shabanova, V.I.; Leaf, W.A. Driving experience, crashes and traffic citations of teenage beginning drivers. Accid. Anal. Prev. 2003, 35, 311–320. [Google Scholar] [CrossRef] [Scilit]
- McCartt, A.T.; Mayhew, D.R.; Braitman, K.A.; Ferguson, S.A.; Simpson, H.M. Effects of age and experience on young driver crashes: Review of recent literature. Traffic Inj. Prev. 2009, 10, 209–219. [Google Scholar] [CrossRef] [Scilit]
- Curry, A.E.; Pfeiffer, M.R.; Durbin, D.R.; Elliott, M.R. Young driver crash rates by licensing age, driving experience, and license phase. Accid. Anal. Prev. 2015, 80, 243–250. [Google Scholar] [CrossRef] [Scilit]
- Horswill, M.S.; Hill, A.; Jackson, T. Scores on a new hazard prediction test are associated with both driver experience and crash involvement. Transp. Res. Part F Traffic Psychol. Behav. 2020, 71, 98–109. [Google Scholar] [CrossRef] [Scilit]
- Kim, D.H.; Ramjan, L.M.; Mak, K.K. Prediction of vehicle crashes by drivers’ characteristics and past traffic violations in Korea using a zero-inflated negative binomial model. Traffic Inj. Prev. 2016, 17, 86–90. [Google Scholar] [CrossRef] [Scilit]
- Bandyopadhyaya, V.; Bandyopadhyaya, R.; Barman, S. Understanding key behavioral factors affecting road traffic citation and crash involvement of professional bus and passenger van drivers using a modified driver behavior questionnaire: An Indian perspective. Int. J. Occup. Saf. Ergon. 2023, 29, 1486–1503. [Google Scholar] [CrossRef] [Scilit]
- Jakobsen, M.D.; Glies Vincents Seeberg, K.; Møller, M.; Kines, P.; Jørgensen, P.; Malchow-Møller, L.; Andersen, A.B.; Andersen, L.L. Influence of occupational risk factors for road traffic crashes among professional drivers: Systematic review. Transp. Rev. 2023, 43, 533–563. [Google Scholar] [CrossRef] [Scilit]
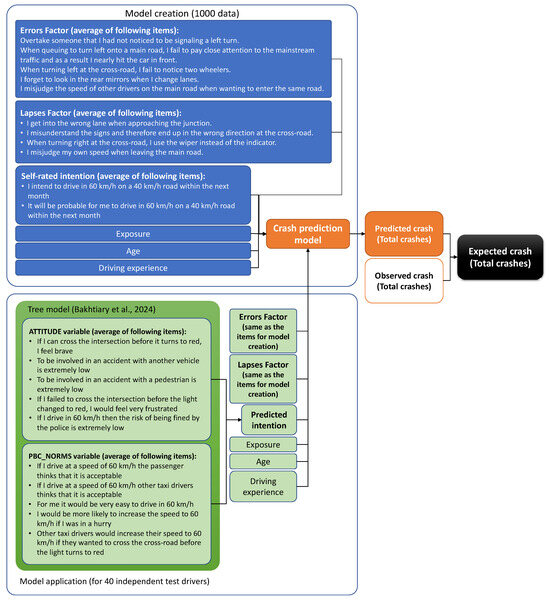
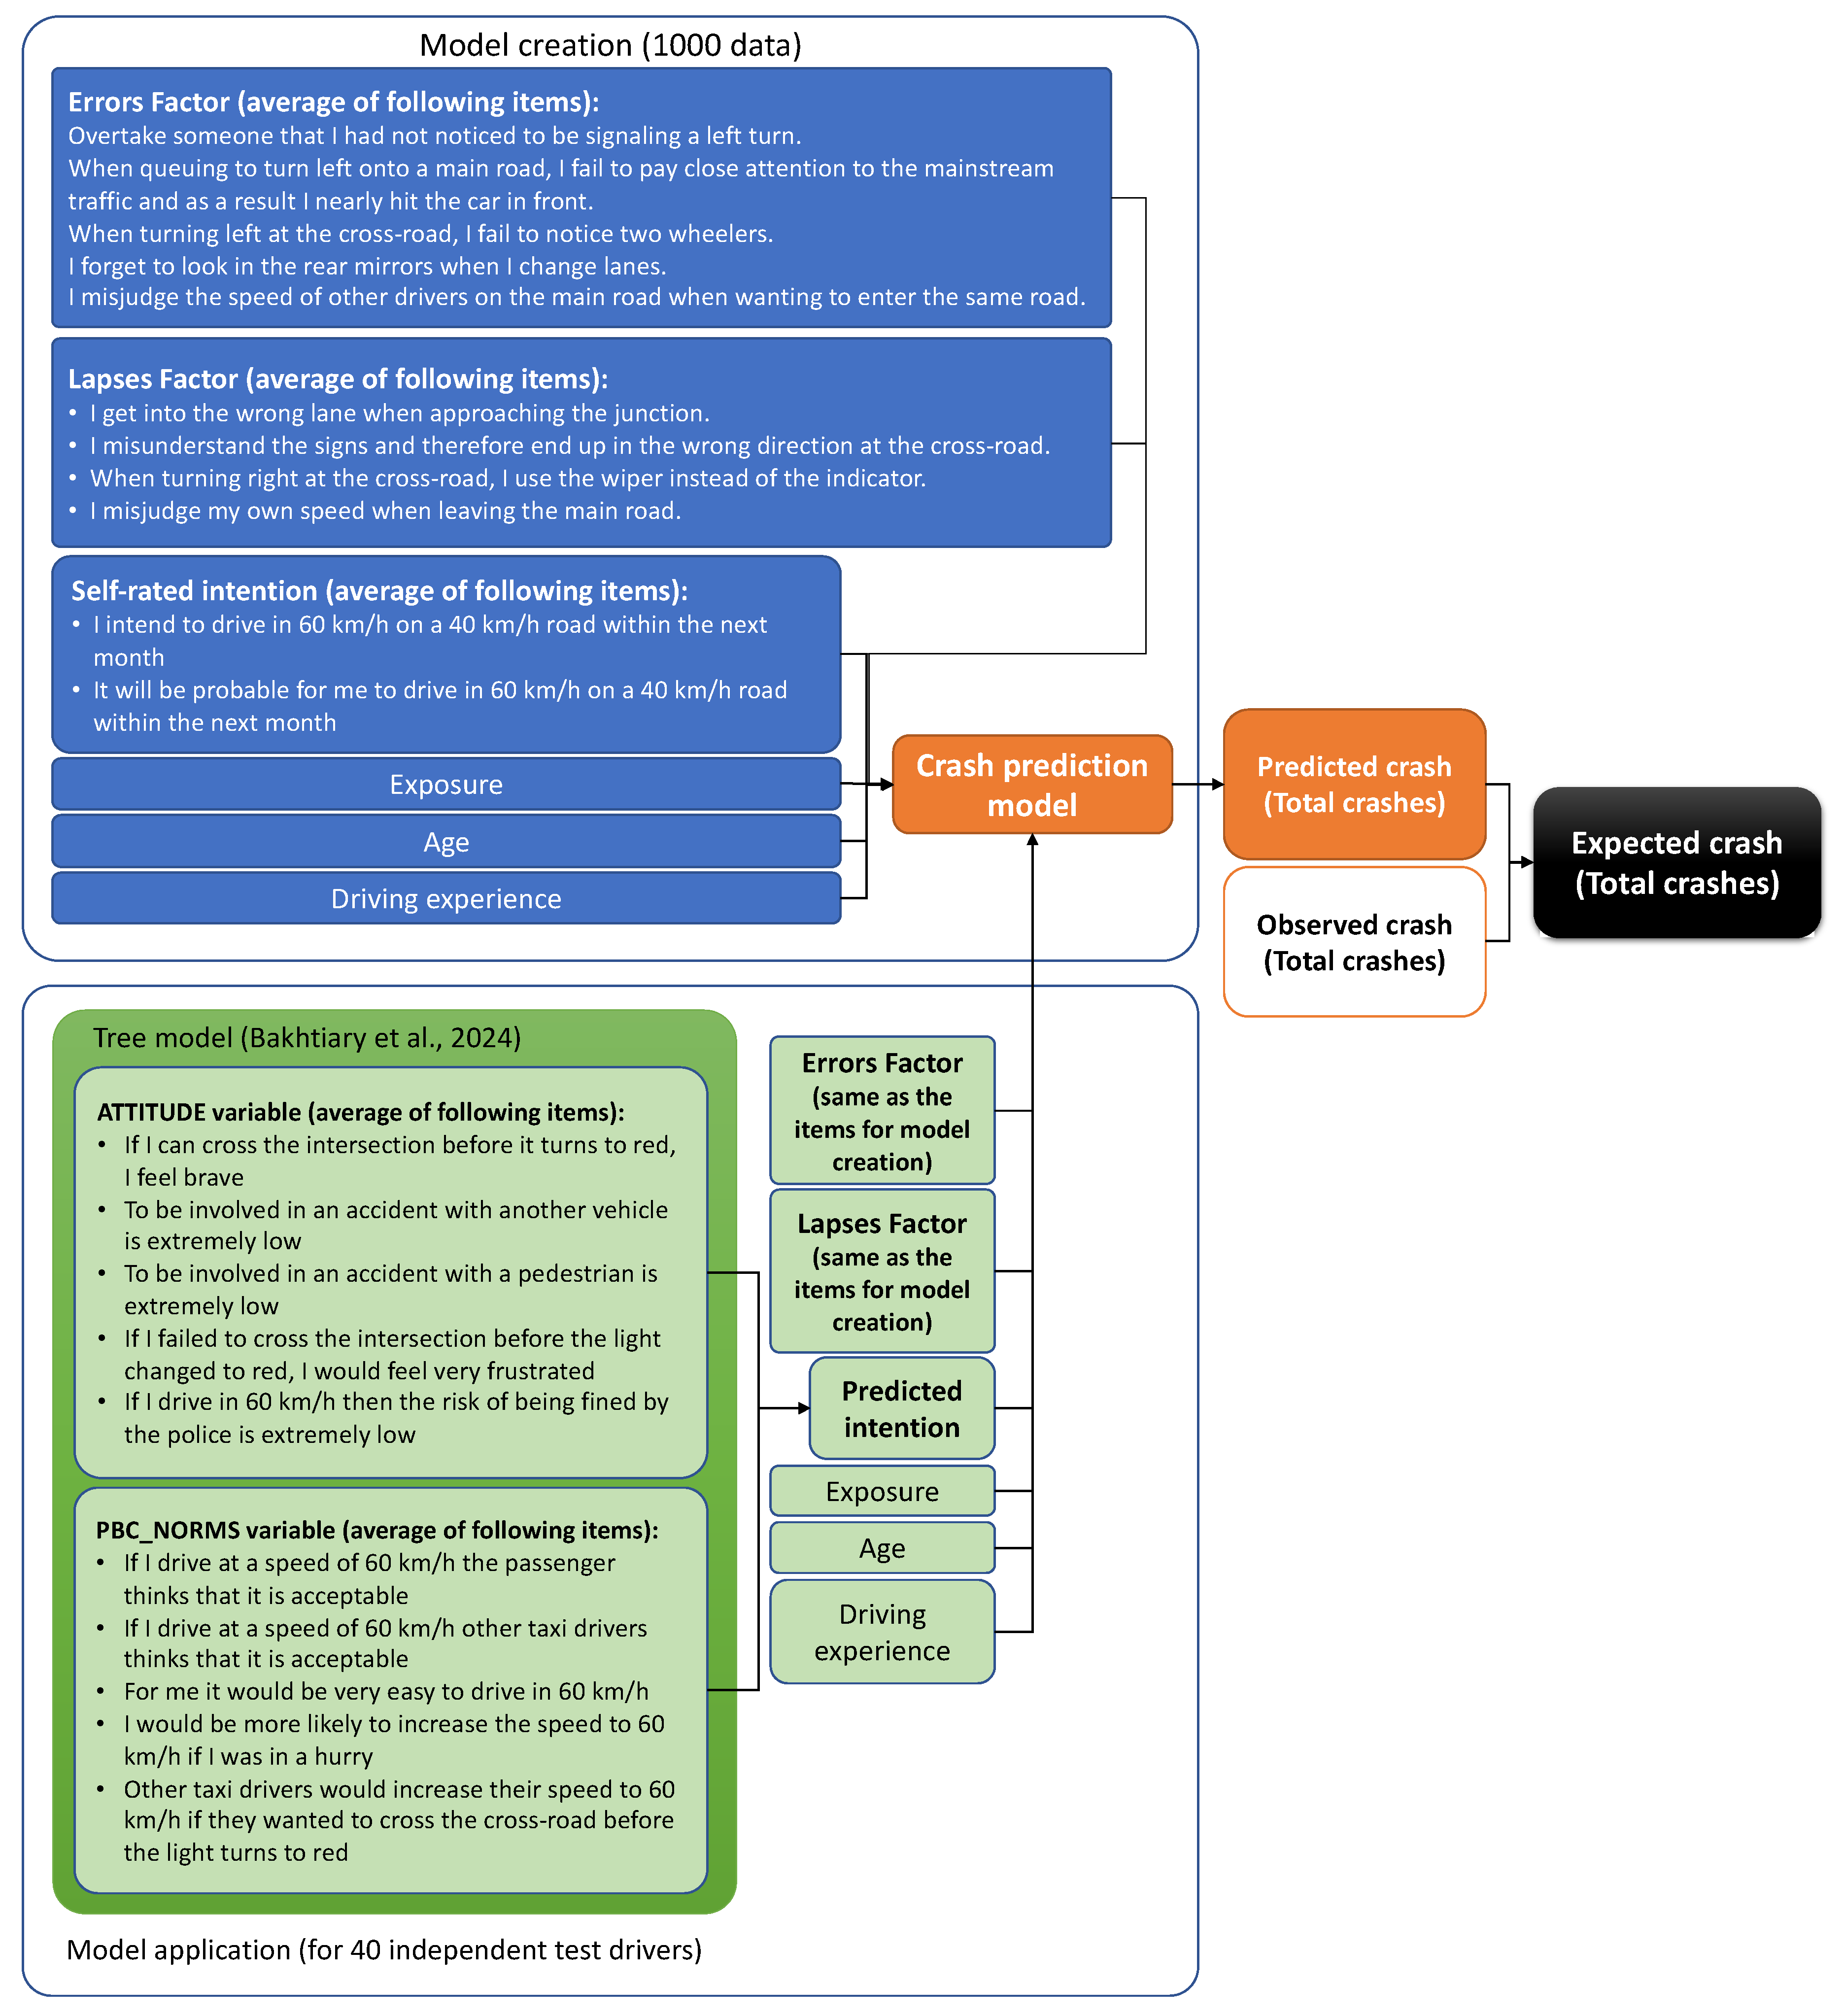
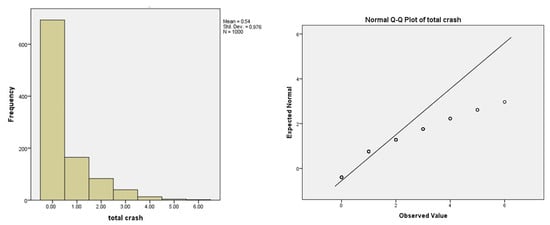
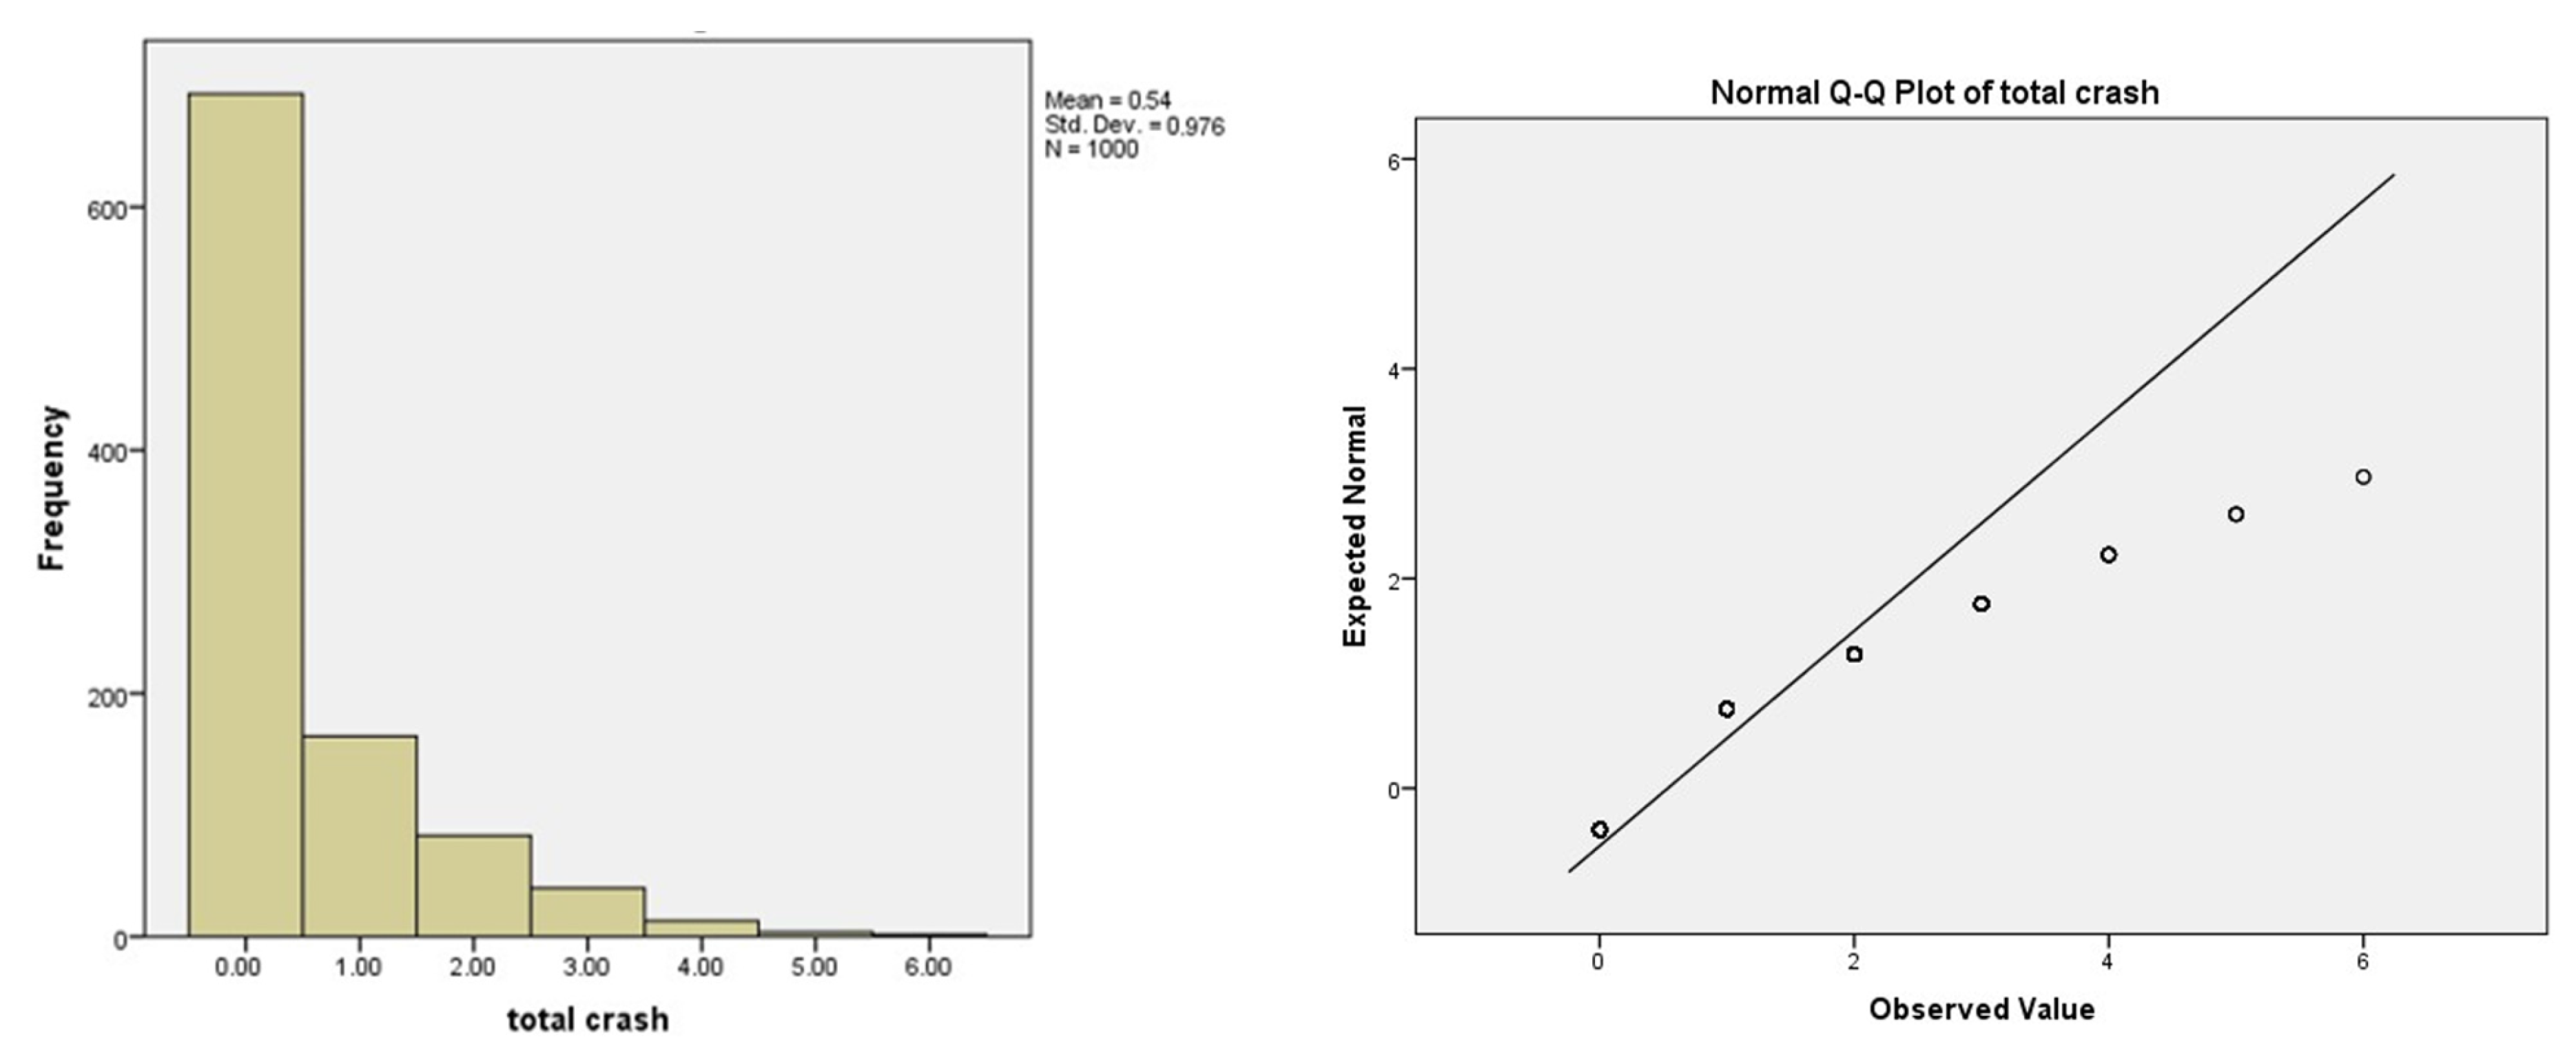

Disclaimer/Publisher’s Note: The statements, opinions and data contained in all publications are solely those of the individual author(s) and contributor(s) and not of MDPI and/or the editor(s). MDPI and/or the editor(s) disclaim responsibility for any injury to people or property resulting from any ideas, methods, instructions or products referred to in the content. |
© 2026 by the authors. Licensee MDPI, Basel, Switzerland. This article is an open access article distributed under the terms and conditions of the Creative Commons Attribution (CC BY) license.