1. Introduction
Additive manufacturing (AM) refers to several types of processes used to make parts from 3D computer models, often by a layer-upon-layer approach [
1]. Two types of AM processes, powder bed fusion (PBF) and directed energy deposition (DED), use powders to build parts. In PBF, thermal energy (e.g., a laser) is used to selectively fuse the first layer polymer or metal powder to a build platform, then subsequent layers on top of it in a powder bed to make a part. In DED, thermal energy (e.g., a laser or electron beam) is used to fuse metal powder by melting as it is deposited onto a build plate to make a part [
2].
During PBF and DED processes with metal powder feedstocks, opportunities exist for inhalation and dermal exposure to substances with known potential to cause adverse human health effects [
3]. PBF and DED processes with metal powder require an inert atmosphere to prevent oxidation and fire, so the machines are sealed during operation. As such, inhalation exposure potential is generally higher during pre-printing tasks (e.g., loading powder into a printer), post-printing tasks (e.g., part retrieval, machine cleaning and maintenance, powder recycling), and post-processing tasks (e.g., cutting parts off their build plate, grinding) compared with the printing task [
3]. There are numerous reports in the literature of airborne emissions and potential for inhalation exposure to hazardous metals during PBF and DED processes [
3]. Despite the opportunity for skin contact with metals, only a few studies have evaluated surface contamination in AM facilities and dermal exposure among AM workers [
4,
5,
6]. Ljunggren et al. used a removal sampling technique (tape stripping) to monitor skin exposure on the index finger skin of PBF machine operators using Hastelloy
®, a predominantly nickel and chromium powder. At the end of the workweek, the operators had measurable levels of cobalt (Co), chromium (Cr), and nickel (Ni) on their index finger skin. Biological monitoring of metals in urine confirmed exposures in these workers [
4]. Dugheri et al. used an interception technique, i.e., mixed cellulose ester filters attached to PBF machine operators at different anatomical locations (arms, chest, and front side of the shoulders) and biological monitoring as part of an exposure assessment at a workplace using powders that contained Co, Cr, and Ni. They reported the presence of Co, Cr, and Ni on filters, especially for those positioned on arms, which indicated exposure potential; however, no measurement values were given. They also indicated that AM operators had measurable amounts of Co, Cr, and Ni in urine, but levels were below reference values [
5]. Paulse et al. has performed the most extensive dermal exposure assessment of metal AM workers and surface contamination assessment to date. They used a removal sampling technique (wiping) to monitor skin exposure at five different anatomical locations (index finger, palm, wrist, back of the hand, and neck) of PBF machine operators using CO-548 powder, composed primarily of Co and Cr with molybdenum (Mo). They reported that, post-shift, the highest concentration of each metal was detected on the finger and followed a trend of Co > Cr > iron (Fe) > aluminum (Al) > Mo > Ni. Ten commonly touched surfaces, including door handles, computer touch screens and peripherals, office desks, workbenches, and sieves; after a full shift, metals contamination was observed on all samples in AM and non-AM areas [
6].
Constituents of some metal feedstock powders used for PBF and DED printing are known to cause dermatitis, though we are unaware of any reports in the literature of metal-induced dermatitis specifically among AM workers. A few examples include Cr metal dust, which is a skin irritant and sensitizer [
7,
8,
9,
10,
11], Mo and tin (Sn) which are skin irritants [
10,
12], and Co and Ni, both skin sensitizers [
11,
13]. Irritant contact dermatitis (ICD) is a non-immunological inflammation of the skin from exposure to an exogenous substance [
14,
15]. Allergic contact dermatitis (ACD) is a delayed T-cell mediated immune response and once a person becomes sensitized, subsequent skin exposure to a sufficient dose of the offending substance can elicit a skin reaction [
15,
16]. Co, Cr, and Ni are the most common metal allergens affecting adults [
13]. Co and Ni exist in the +2 valence state; however, for Cr, both the trivalent (Cr(III)) and hexavalent (Cr(VI)) ionic forms are allergenic [
17]. For those who develop ACD, only further avoidance of the offending substance can prevent elicitation of an allergic reaction [
16]. Occupational dermatitis is estimated to have an annual economic burden of US
$1.5 billion [
18]. Hence, an improved understanding of surface contamination and dermal exposures in metal powder AM workplaces is necessary to develop risk mitigation strategies.
3. Materials and Methods
For purposes of this study, the facility was categorized into production and administrative (non-production) areas. A schematic of the floor plan is shown in
Figure S1. The production area included a main hallway and the PBF, DED, and post-processing (PP) rooms. The administrative area included offices and break rooms. The production and administrative areas had separate ventilation systems.
At the time of this survey, several work practices were in place to mitigate the spread of metals contamination in the facility. Company policy was that all employees in the PBF and DED rooms wear nitrile gloves whether they work directly with powder or not. The gloves covered the hands but not the wrists. Additionally, disposable arm sleeves were required when wearing a cloth lab coat and working with powder and were available to employees wearing short sleeve shirts if they wished to use them. The arm sleeves were held in place at the wrist by an elastic band. As such, unless they were taped to gloves, the sleeves could shift and expose skin while an employee works. Nitrile gloves were readily available to employees in other production areas who opted to wear them. All employees in the PBF and DED rooms were required to wear boot covers in the rooms (and doff [remove] them when leaving). Additionally, when working directly with powders, they were required to wear Tyvek® suits and powered air-purifying respirators (PAPRs) equipped with high-efficiency particulate air (HEPA) filters (assigned protection factor of at least 25). The Tyvek® suits had a hood that covered the back and top of the head and sides of the face to approximately the temples. The PAPR consisted of a helmet with a facepiece that had an elastomer seal that pressed against the perimeter of the face to form a seal. Employees in the PBF room were also required to wear PAPRs if there were open powder containers, even if they did not work directly with the powder. Employees in the DED room were required to wear a PAPR with HEPA These employees also periodically cleaned surfaces (multiple times per week) by wet wiping. Adhesive (“tacky”) mats were placed inside the PBF and DED rooms at exit doors to the main hallway or the PP room.
3.1. Feedstock Powders
At the time of this survey, there were four metal powders in use: 316L stainless steel, Inconel 718, titanium–aluminum–vanadium alloy (Ti64), and aluminum–silica–magnesium (AlSi10Mg). These powders were used in both the PBF and DED printers, except AlSi10Mg which was only used in PBF printers. Bulk samples of unused powders were obtained for characterization as described below.
3.2. Main Hallway
The main hallway had an open floor plan that included machine monitoring, shipping, and part testing areas. Additionally, there were doors from the main hallway to individual offices, an office suite, an engineering office suite, the personal protective equipment (PPE) changeout room for the PBF room, and the DED and PP rooms.
3.3. Powder Bed Fusion Room
The PBF room was accessed via the PPE changeout room. Employees entered the “clean” side of the changeout room from the main hallway, donned (put on) their PPE, then entered the PBF room. Employees exited the PBF room to the “dirty” side of the PPE changeout room, doffed their PPE, exited to the clean side of the room, then to the main hallway. Two large roll-up garage doors with a space in between created an anteroom (staging area) for moving large items such as finished parts on hand carts in and out of the PBF room. Once in the main hallway, the employee would push the cart to the part testing or shipping areas in the main hallway or to the PP room (via the roll-up doors in the DED room). The procedure was repeated in reverse when bringing items into the PBF room.
The PBF room was under negative pressure and was served by general room ventilation with HEPA filters; the room air turnover reported by the company was 1 air exchange per 1.25 min. The main pre-printing tasks were sieving and blending powder and loading powder into PBF printers. There were two versions of PBF printers in use at this facility. The older version 1 (v1) printers had a powder sieve station separate from the printer. The newer version 2 (v2) printers had a sieve station connected to the printer that automatically transported powder to the printer by means of a sealed pneumatic system. Regardless of printer version, once printing was complete (v1 and v2 printer build chambers under positive pressure during operation), the final part was immersed in powder. The main post-printing tasks were removal of the part from powder, which was a two-step process, and machine cleaning. The first step for powder removal used a vacuum. For v1 printers, the access doors had to be opened so that an external shop vacuum with HEPA filter could be used to remove excess powder. Version 2 printers had a built-in vacuum to remove most powder from the part before the printer door was opened. Once a v2 printer door was opened, a shop vacuum with HEPA filter was used to remove remaining powder for recycling or disposal. The second step for powder removal was to place a vacuumed part (still attached to a build plate) into a depowdering station. This station was a glove box under negative pressure with a compressed argon gas gun to dislodge loose powder in difficult to reach areas of the printed part (e.g., inside crevices). After depowdering, the part was slid onto a cart for transport to the part testing area, shipping area, or the PP room.
There were two v1 printers (one using Inconel 718 and the other using 316L stainless steel) and three v2 printers (one using Ti64, one using AlSi10Mg, and the other Ti64 or stainless steel) in use. A new v2 printer was being installed but not operational. Two v1 powder sieve stations were in use (one for the Inconel 718 printer and the other for the 316L stainless steel printer) and another was undergoing maintenance.
3.4. Directed Energy Deposition Room
The DED room was accessed via large roll-up garage doors and was served by general room ventilation with HEPA filters; the room air turnover reported by the company was once every 12 min. One roll-up door provided access to/from the main hallway and the other provided access to/from the PP room. The main pre-printing task was to load powder from buckets into a pneumatic feeder system. Since DED printers use a thermal energy source to simultaneously melt the metal powder as it is deposited onto the build plate to make an object, the final product does not have to go through an extensive post-printing powder removal process. Part retrieval consisted of using a wire brush to scour the surface of the metal part to dislodge any unmelted powder. A shop vacuum was used to remove any residual powder from the part as well as to clean vertical and horizontal surfaces within the printer build chamber. After vacuuming, the part (still attached to a build plate) was placed onto a cart and transported to the testing or shipping areas or the PP room via the roll-up garage doors. Employees could don their PPE in the DED room or in a water closet/shower room off the main hallway.
There were two DED machines in this room. At the time of this site visit, the operator only performed post-printing tasks (part retrieval and machine cleaning) on one machine.
3.5. Post-Processing Room
Parts were delivered from the PBF and DED rooms to the PP room using hand carts via the roll-up garage doors in the DED room. Employees entered/exited the PP room through a short hallway off the main hallway. In the PP room, parts were cut from their build plate using a wire electrical discharge machine (EDM), and if desired, taken to the manual finishing area for finishing. After cutting off a part, the build plates were wet machined to achieve dimensional tolerance prior to reuse. The PP room was an open floor plan and included a maintenance cage, employee desks, and manual finishing area (work benches and pneumatic tools). From the PP room, there were doors to a quality control laboratory, an employee break room, and a water closet. Aside from voluntary use of nitrile gloves, there were no other PPE requirements for employees in this room.
3.6. Administrative Areas
Administrative areas included individual offices with doors that opened to the main hallway. There was also an administrative office suite (with a breakroom) and an engineering office suite that were accessed by separate doors from the main hallway. The employee breakroom, accessed by a door from the PP room, was also categorized as an administrative area for this survey.
3.7. Dermal Exposure Assessment
Employees wore street clothing in production areas, and it was observed during a walk-through survey that most wore short sleeve shirts. As such, a small-scale evaluation of dermal exposures was conducted with four employees. Wipe samples were collected on the employee’s wrists, directly above the hand as part of a National Institute for Occupational Safety and Health (NIOSH) Health Hazard Evaluation (HHE). NIOSH conducts HHEs pursuant to its authorities in the Occupational Safety and Health Act, 29 U.S.C. §§ 651-676 and its regulation at Title 42 CFR Part 85.
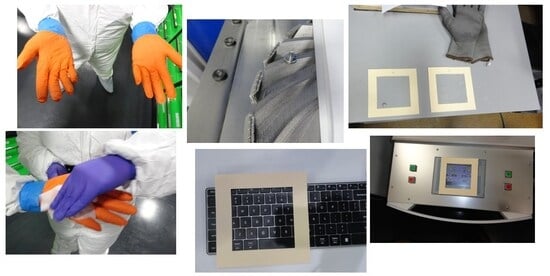
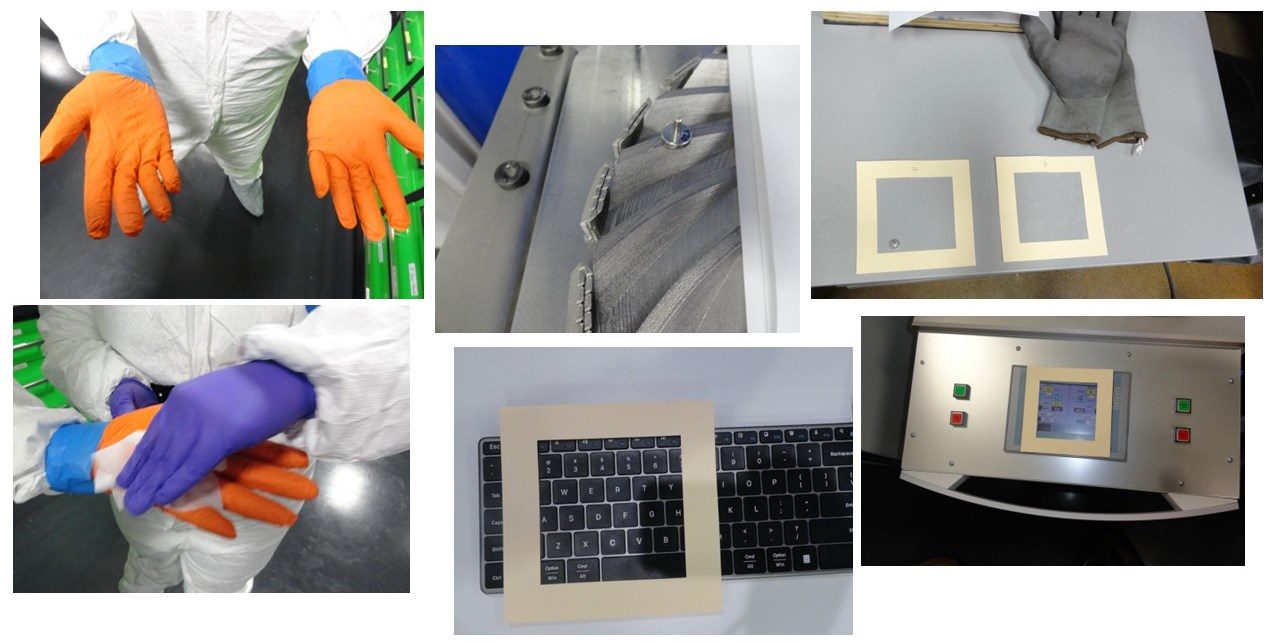
All employees working on the three days of the survey were invited to voluntarily participate in the HHE. Given the variety of work performed throughout the facility, a task-based exposure assessment approach was deemed most informative. Participants were asked to place their forearms side-by-side and a NIOSH staff person donned a clean pair of nitrile gloves and placed a clean acetate paper sampling template (10 cm × 10 cm opening) on the employees’ wrist and held it securely in place (see
Figure S2). Each wrist filled approximately one half of the template. Wearing a clean pair of nitrile gloves, another NIOSH employee wiped the wrist skin in the template opening using a pre-moistened towelette (Ghost Wipe™, Environmental Express, Charleston, SC, USA) based on NIOSH surface sampling guidance which aligns with standardized guidance and procedures from ASTM and ISO [
19]. First, wrists were wiped in an S-shaped pattern from left to right. The wipe was folded in half and used to wipe the wrists in an S-shaped pattern from top to bottom. The wipe was folded in half once more and used to wipe the wrists in an S-shaped pattern diagonally, from corner to corner (i.e., one Ghost Wipe™ sample for both wrists). Each wipe, representing both wrists, was placed in a clean individual labeled bag until analysis. The pre-task wipe samples were collected mid-morning after the start of work, so they do not represent a baseline for unexposed skin. At the end of each task, the wipe sample collection procedure was repeated. All skin wipes were analyzed for Al, Cr, Co, copper (Cu), Fe, Mo, Ni, Sn, titanium (Ti), and vanadium (V) [
20]. These elements were selected because they are constituents in the feedstock powders used at this facility and have propensity to cause ICD and/or ACD. A total of four employees, all in the PBF room, participated in the dermal exposure assessment. One employee was vacuuming a sieve station for a v1 printer, and the other three were installing a new v2 printer.
3.8. Surface Sampling
Two types of surface samples were collected to understand whether powder migration occurred from the PBF and DED rooms to other rooms in the facility: scanning electron microscopy (SEM) pin stubs (Ted Pella Inc., Redding, CA, USA) and wipes (see
Figure S2). SEM pin stub samples were used to identify the presence of particles with composition and morphology on surfaces that were similar to feedstock powders. Wipe samples were used to quantify the amounts of metals on surfaces. Commonly touched surfaces were targeted for wipe sampling to understand the breadth and magnitude of metals throughout the facility.
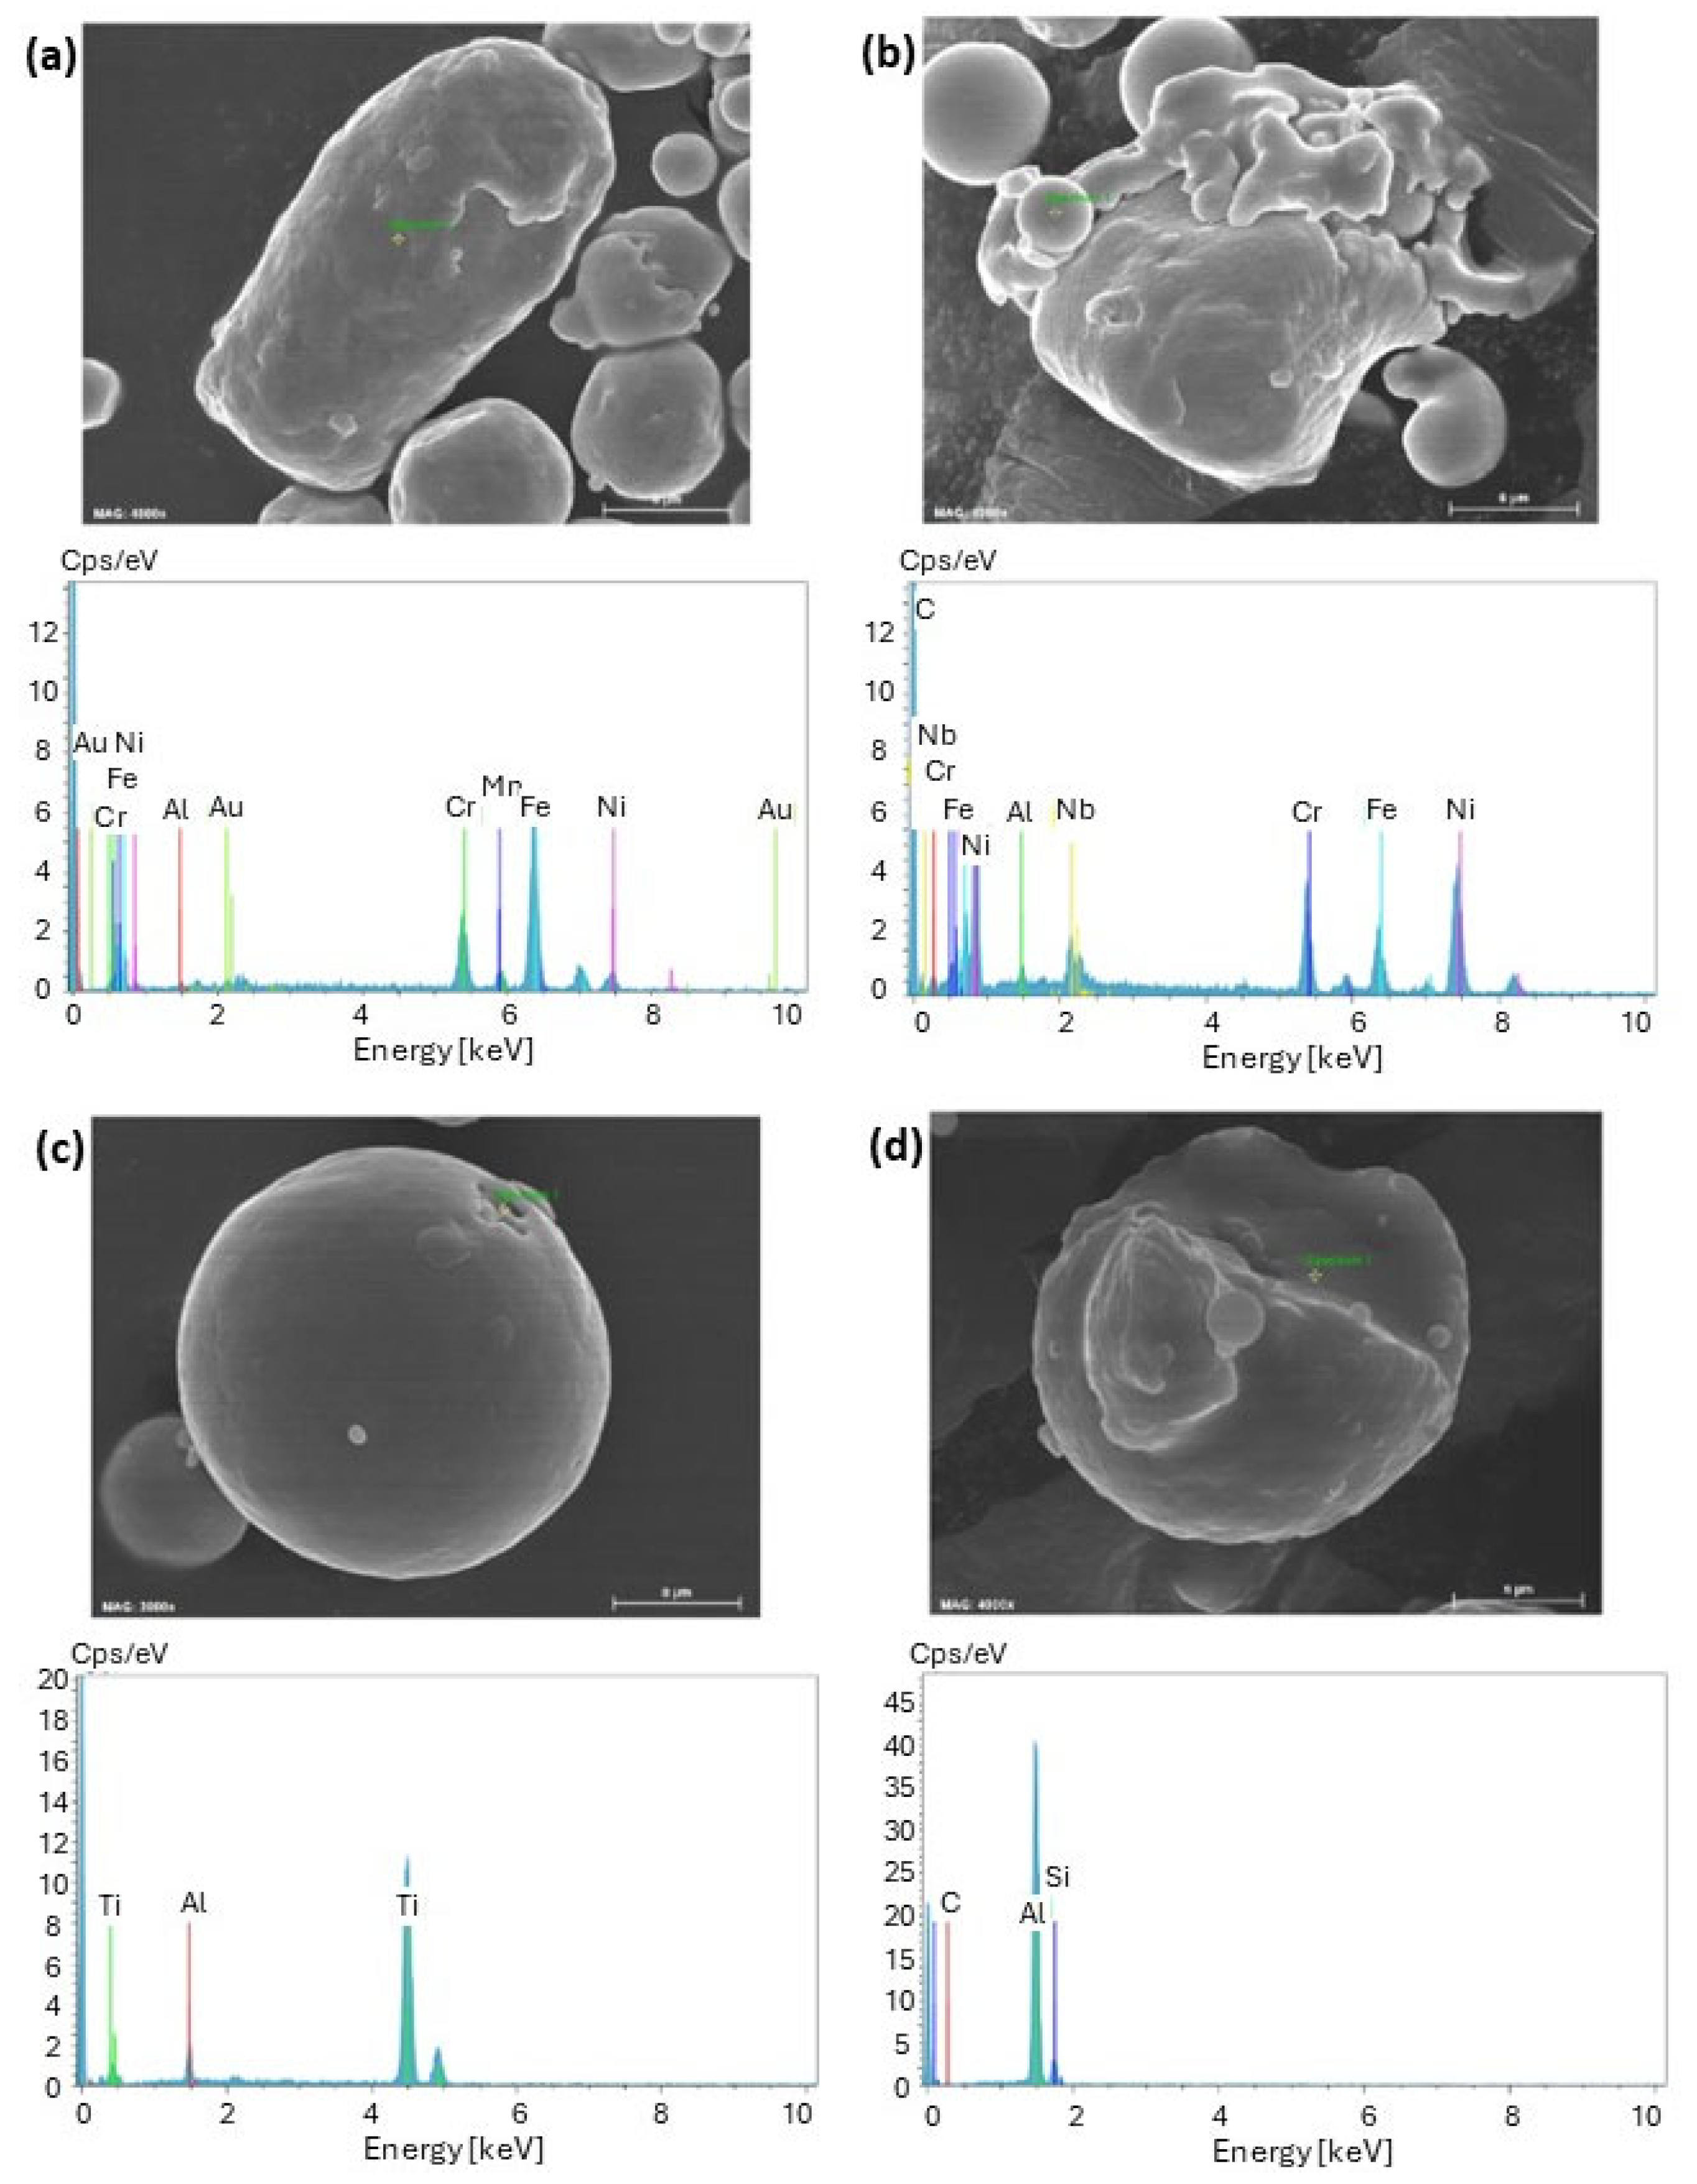
SEM pin stubs with double-sided carbon tape were briefly touched to surfaces throughout the facility. Samples were analyzed at NIOSH using a field emission SEM (Hitachi High-Tech America, Inc., Dallas, TX, USA) with energy dispersive X-ray spectroscopy (EDX) (Bruker, Madison, WI, USA). For each SEM stub sample, several different fields were inspected to get an overview of the appearance and elemental composition of particles. Pin stub sample findings were qualitatively compared with SEM images of bulk samples of feedstock powders. Magnification of images was typically 500× to 10,000×.
The same approach as described for skin sampling was used for surface sampling using Ghost Wipe™ or polyvinyl chloride (PVC) filter media, i.e., a template with a 10 cm × 10 cm opening was placed on a surface and held securely then wiped in an S-shaped pattern from left to right, top to bottom, and diagonally [
19]. Each wipe was placed in a clean individually labeled bag until analysis. A new template and clean gloves were used for each sample. If a template could not be used because the surface had an irregular shape (e.g., a door handle), the dimensions of the surface were measured using a ruler to calculate the area. All Ghost Wipe™ samples were analyzed using NIOSH Method 7303 to quantify the amount of Al, Cr, Co, Cu, Fe, Mo, Ni, Sn, Ti, and V [
20]. All PVC filters were analyzed for hexavalent chromium [Cr(VI)] using U.S. Occupational Safety and Health Administration Method W4001 [
21].
Wipe samples (Ghost Wipe™ or PVC filter) were also collected from surfaces of PPE such as PAPRs, cloth laboratory coats, Tyvek
® suits, gloves, and boots, and from employees’ shirts (see
Figure S2). For Tyvek
® suits (chest area), gloves, and shirts (abdomen area) samples were collected before and after performing a job task. A total of seven employees participated in the shirt and PPE sampling, six in the PBF room and one in the DED room. Of the six employees in the PBF room, five participated in the shirt wipe sampling (one vacuuming a sieve station for a v1 printer, one loading powder into a v1 printer, and three installing a new v2 printer) and one participated in the PPE sampling (transferring powder containers into the sieve station of a v2 printer). The employee in the DED room participated in the PPE wipe sampling (post-print cleaning tasks) on multiple days.
3.9. Quality Control and Data Analysis
One field blank (Ghost Wipe™ or PVC filter) was collected for every 10 wipe samples, and the level of any metal of interest (if detected) was subtracted from the results so all values in tables and figures are background corrected. The resulting surface wipe data were not-normally distributed and were log-transformed for statistical analysis. Measurements collected within a room were not expected to be clustered because nearly all samples were collected from distinct locations; only a few wipes were collected from the same location, i.e., before and after cleaning a surface. All except two out of 50 room-element combinations had autocorrelations less than 0.5, with a majority being less than 0.3.
Statistics were calculated using SAS (version 9.4, SAS Institute Inc., Cary, NC, USA) at a significance level of 0.05. Variable fractions of the background-corrected metal concentrations were below the limit of detection (LOD) in the different room locations. Thus, summary statistics were calculated using the maximum likelihood estimate (MLE) method, which is consistently shown to have low bias in estimating the mean under various sample size, geometric standard deviation (GSD) and left censoring conditions [
22]. Summary statistics were calculated for each metal using Tobit regression model which implements the MLE method [
23]. For small sample size (n < 20), GSD ≤ 4, and censoring fraction of ≤50%, the simple MLE method has a low bias (−1%) for estimating the mean, and comparable to other advanced MLE methods; the bias is even lower (−0.5%) for sample size n ≥ 20 [
22]. For censoring in the range of 50–80% and a sample size n ≥ 20, the MLE method remained the preferred method though the effect of small sample size (n < 20) was not evaluated at the higher censoring. The LIFEREG procedure in SAS was used to fit the Tobit regression model using the log-transformed metal concentration with a fixed effect of room location to obtain geometric mean estimates (GM) for each metal concentration for the different room locations. with a fixed effect of room location to obtain geometric mean estimate (GM) for each metal concentration for the different room locations.
4. Results
Table 1 summarizes the composition as given on the safety data sheets (SDSs) for the four bulk feedstock powders used for printing. Additionally, the table provides information on skin hazards of these constituents, where applicable.
4.1. Contamination of Skin with Metals
Table 2 summarizes the results of the dermal wipe sampling. As expected, since the pre-task samples were collected after the start of work, there were measurable masses of metals on wrist skin. Post-task samples revealed changes in masses during vacuuming and installation tasks in the PBF room. Sample durations were 91, 307, 312, and 308 min for Employees A–D, respectively. Masses of V were below the LOD of 0.02 micrograms (µg) per sample on all wrist wipe samples. For Employee A, who vacuumed a sieve station dedicated to Inconel 718 powder at a v1 PBF printer, there was a net accumulation of Cr, Co, Fe, Mo, Ni, and Ti on both wrists during this task, though the amount of Al decreased. Among those installing a new v2 PBF printer, Employee B had higher post-task levels of Cr, Co, Mo, Ni, and Sn on their wrists, whereas the other two employees generally had lower post-task levels of metals on their wrists.
4.2. Contamination of Clothing with Metals
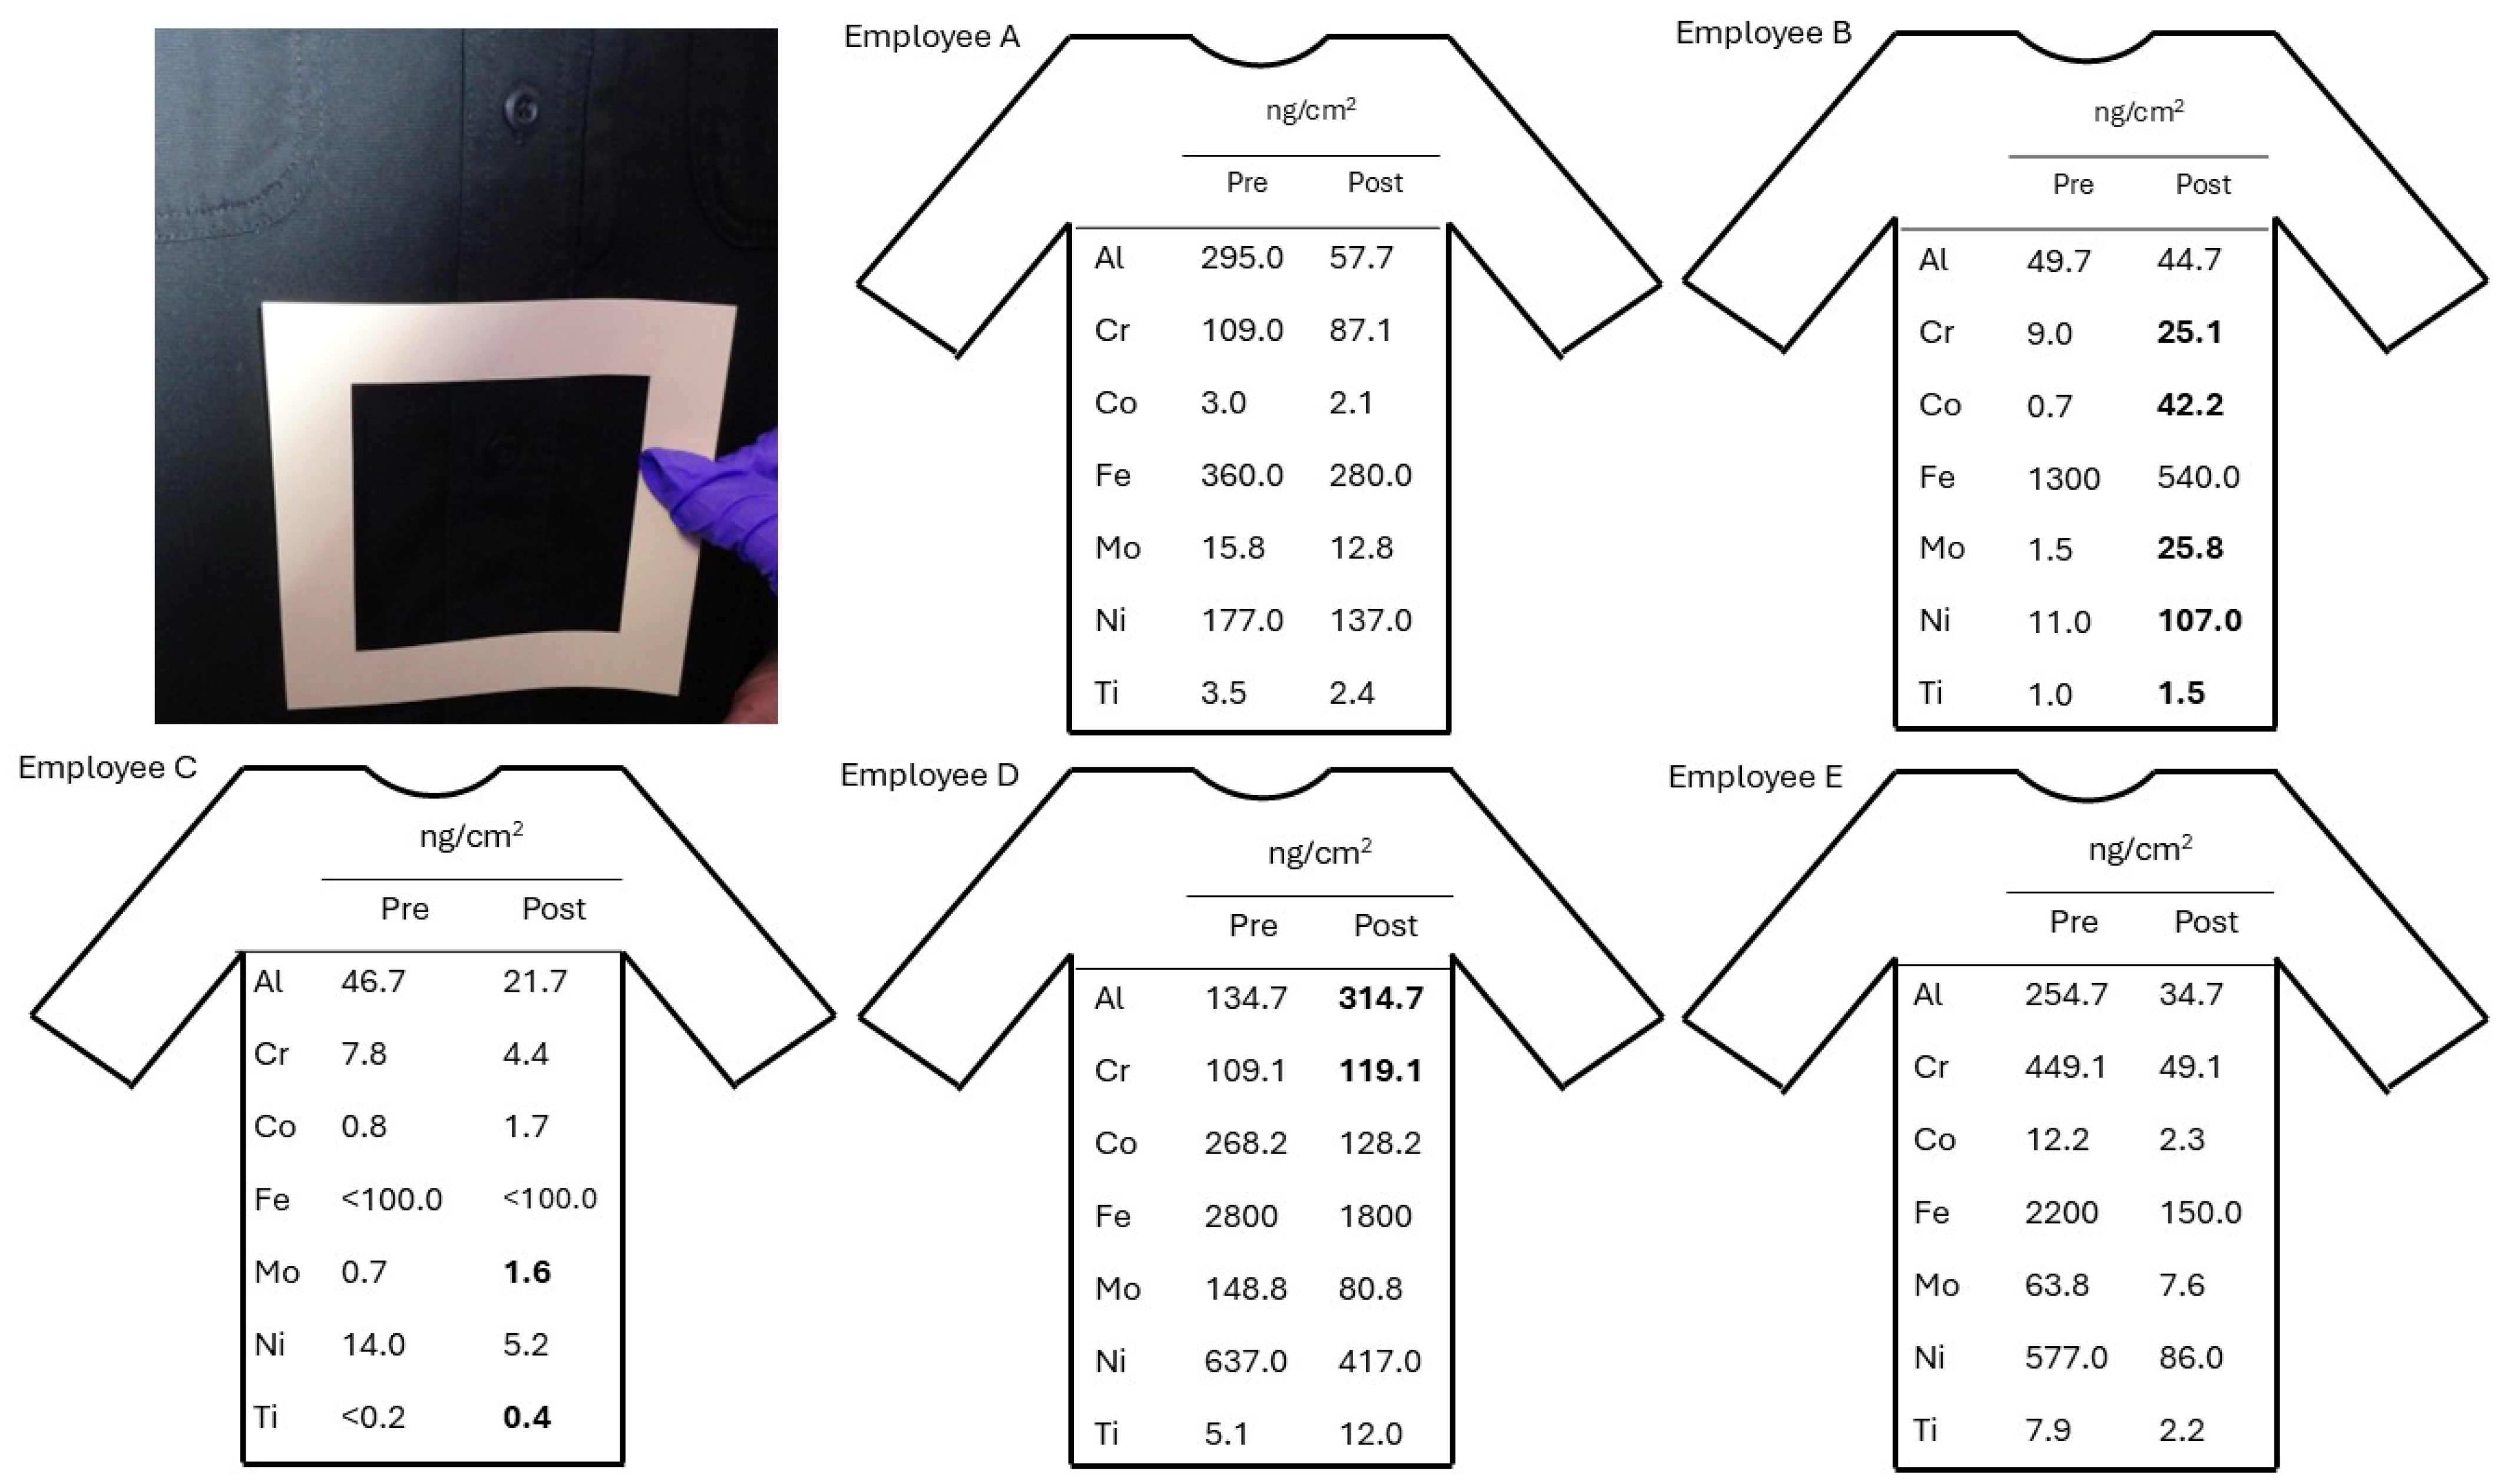
Figure 1 shows the masses of metals on employees’ shirts before and after various tasks in the PBF room. Note that masses on shirts were lower compared with the skin wipe samples, and a template was used to demarcate the wipe area, so these results are expressed in units of nanograms per square centimeter (ng/cm
2). Masses of Cu, Sn, and V were below their LODs of 5.0, 5.0, and 0.2 ng/cm
2, respectively on most clothing wipe samples. For Employee A (vacuuming a v1 PBF printer) and Employee E (loading powder into a v1 PBF printer), masses of all metals on shirts were lower on post-task samples compared with pre-task samples. Employees B–D that were installing a new v2 PBF printer had an accumulation of two to five metals.
4.3. Contamination of PPE with Metals
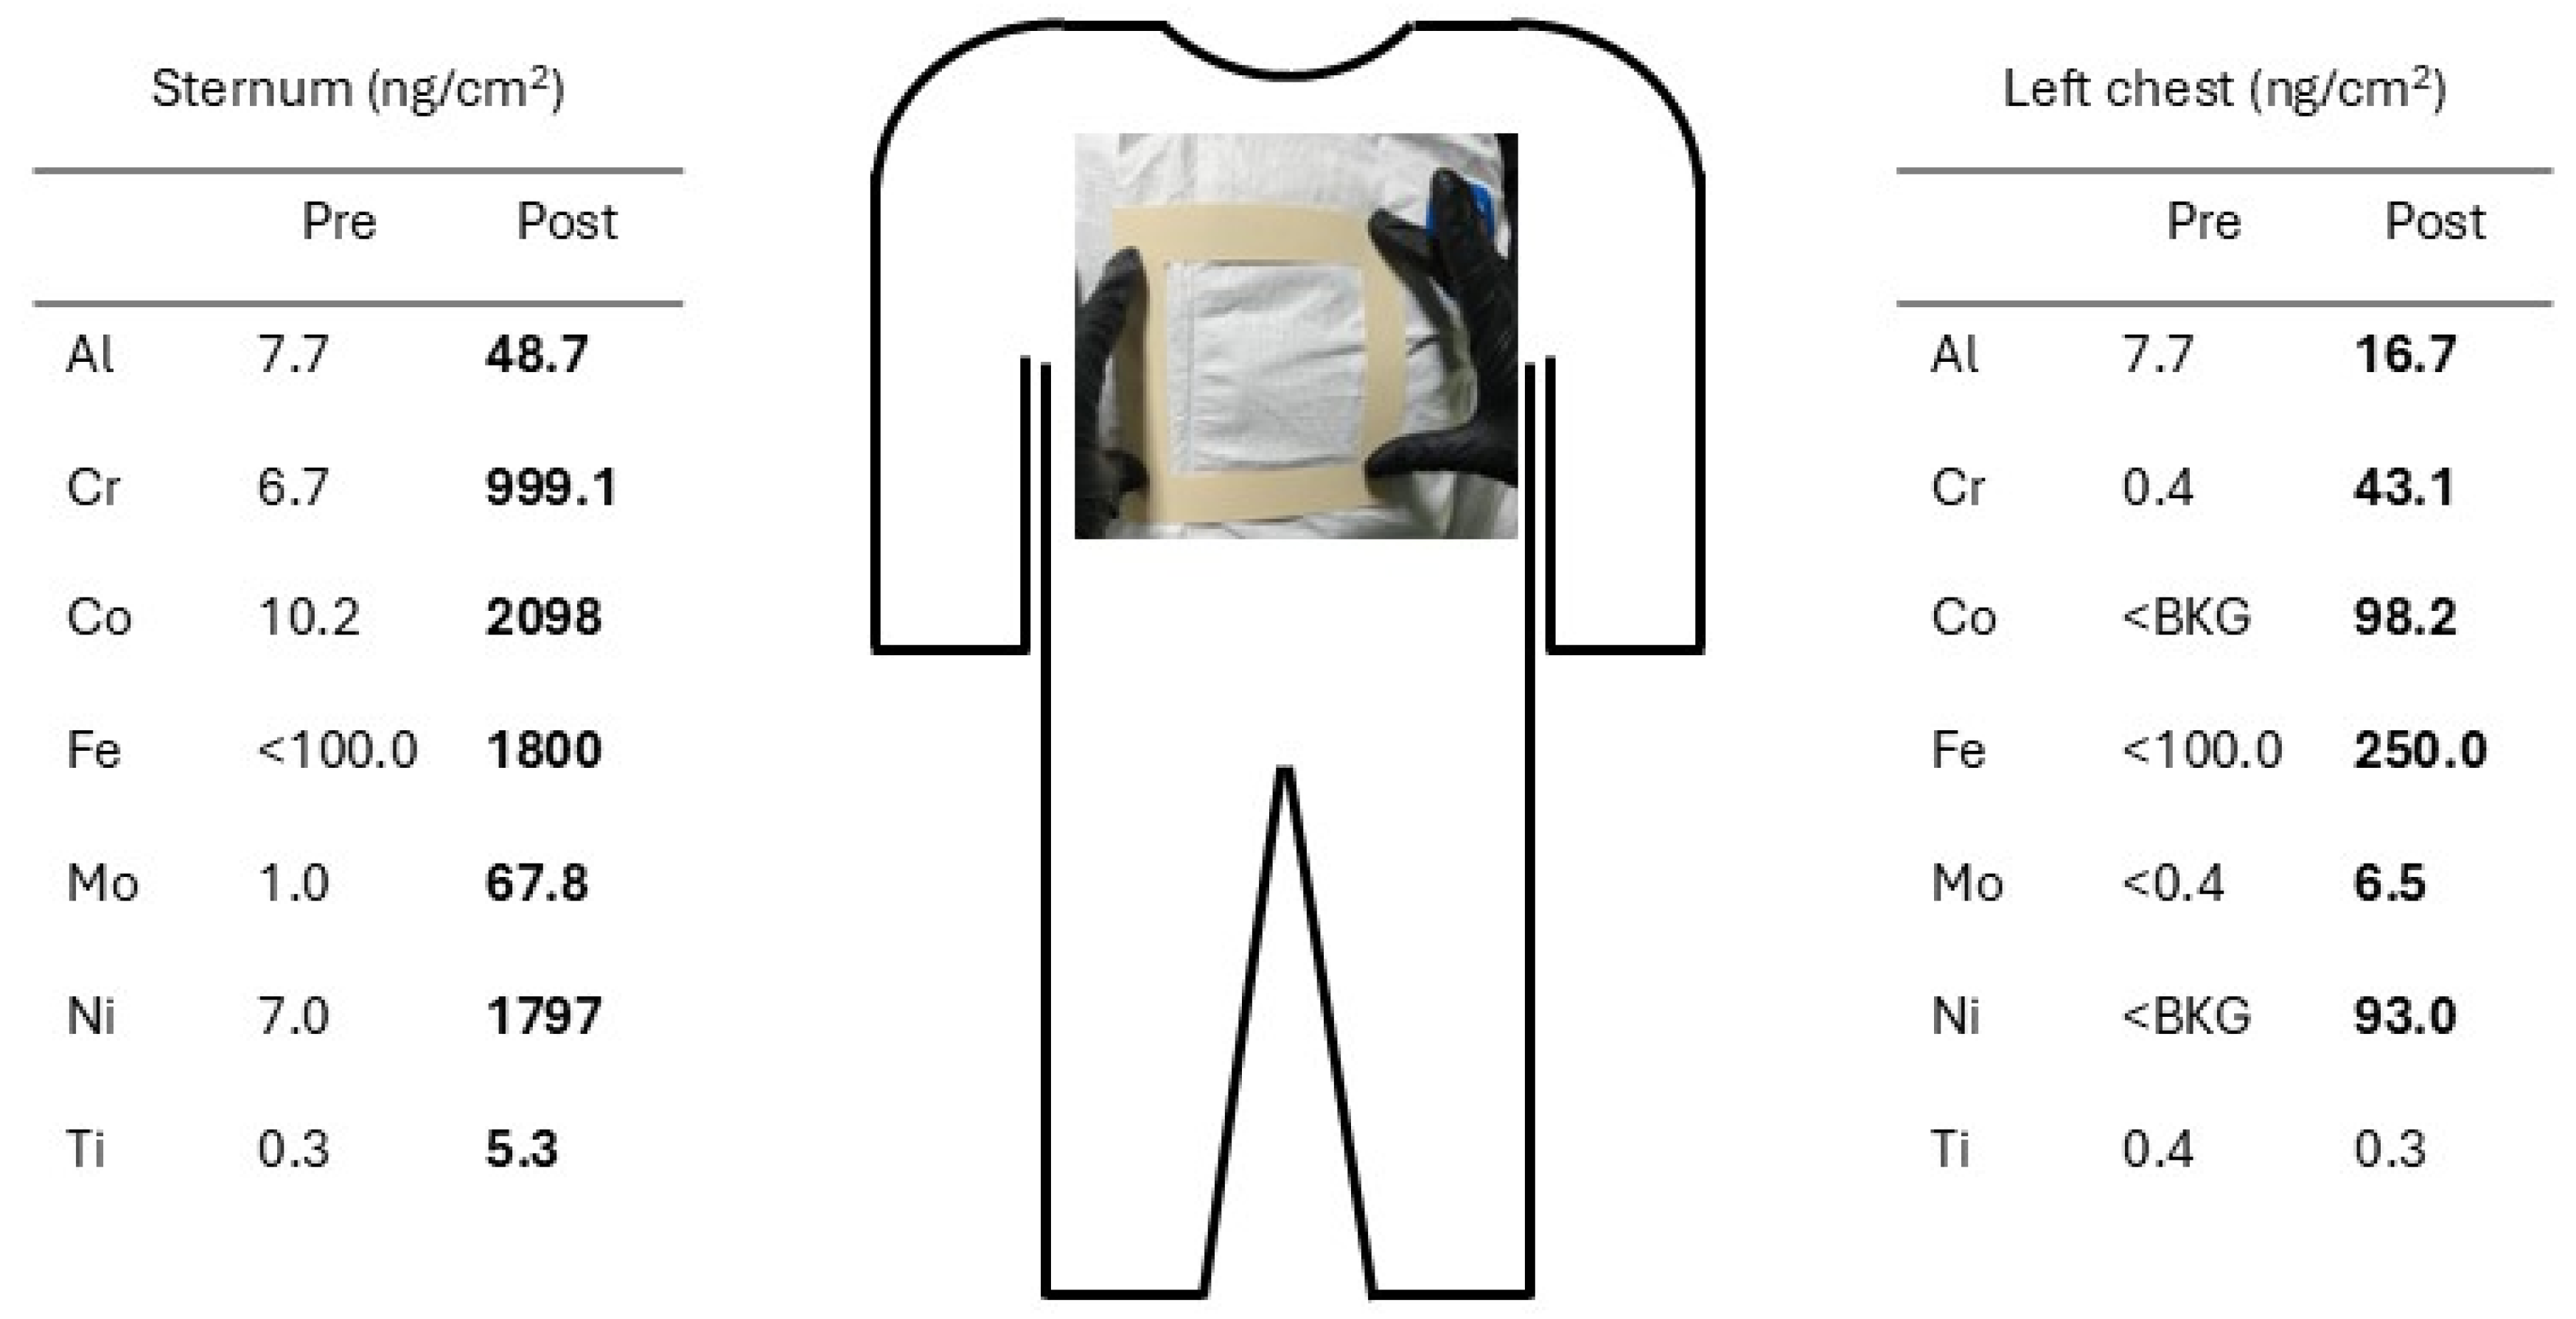
Figure 2 shows the changes in masses of metals on Tyvek
® coveralls (Employee F) from cleaning a DED machine on two different days (new clean coveralls worn each time). Masses of Cu, Sn, and V were below their LODs of 5.0, 5.0, and 0.2 ng/cm
2, respectively on most coverall wipe samples. During cleaning on both days, nearly all samples demonstrated an accumulation of metals on the employee’s protective suit.
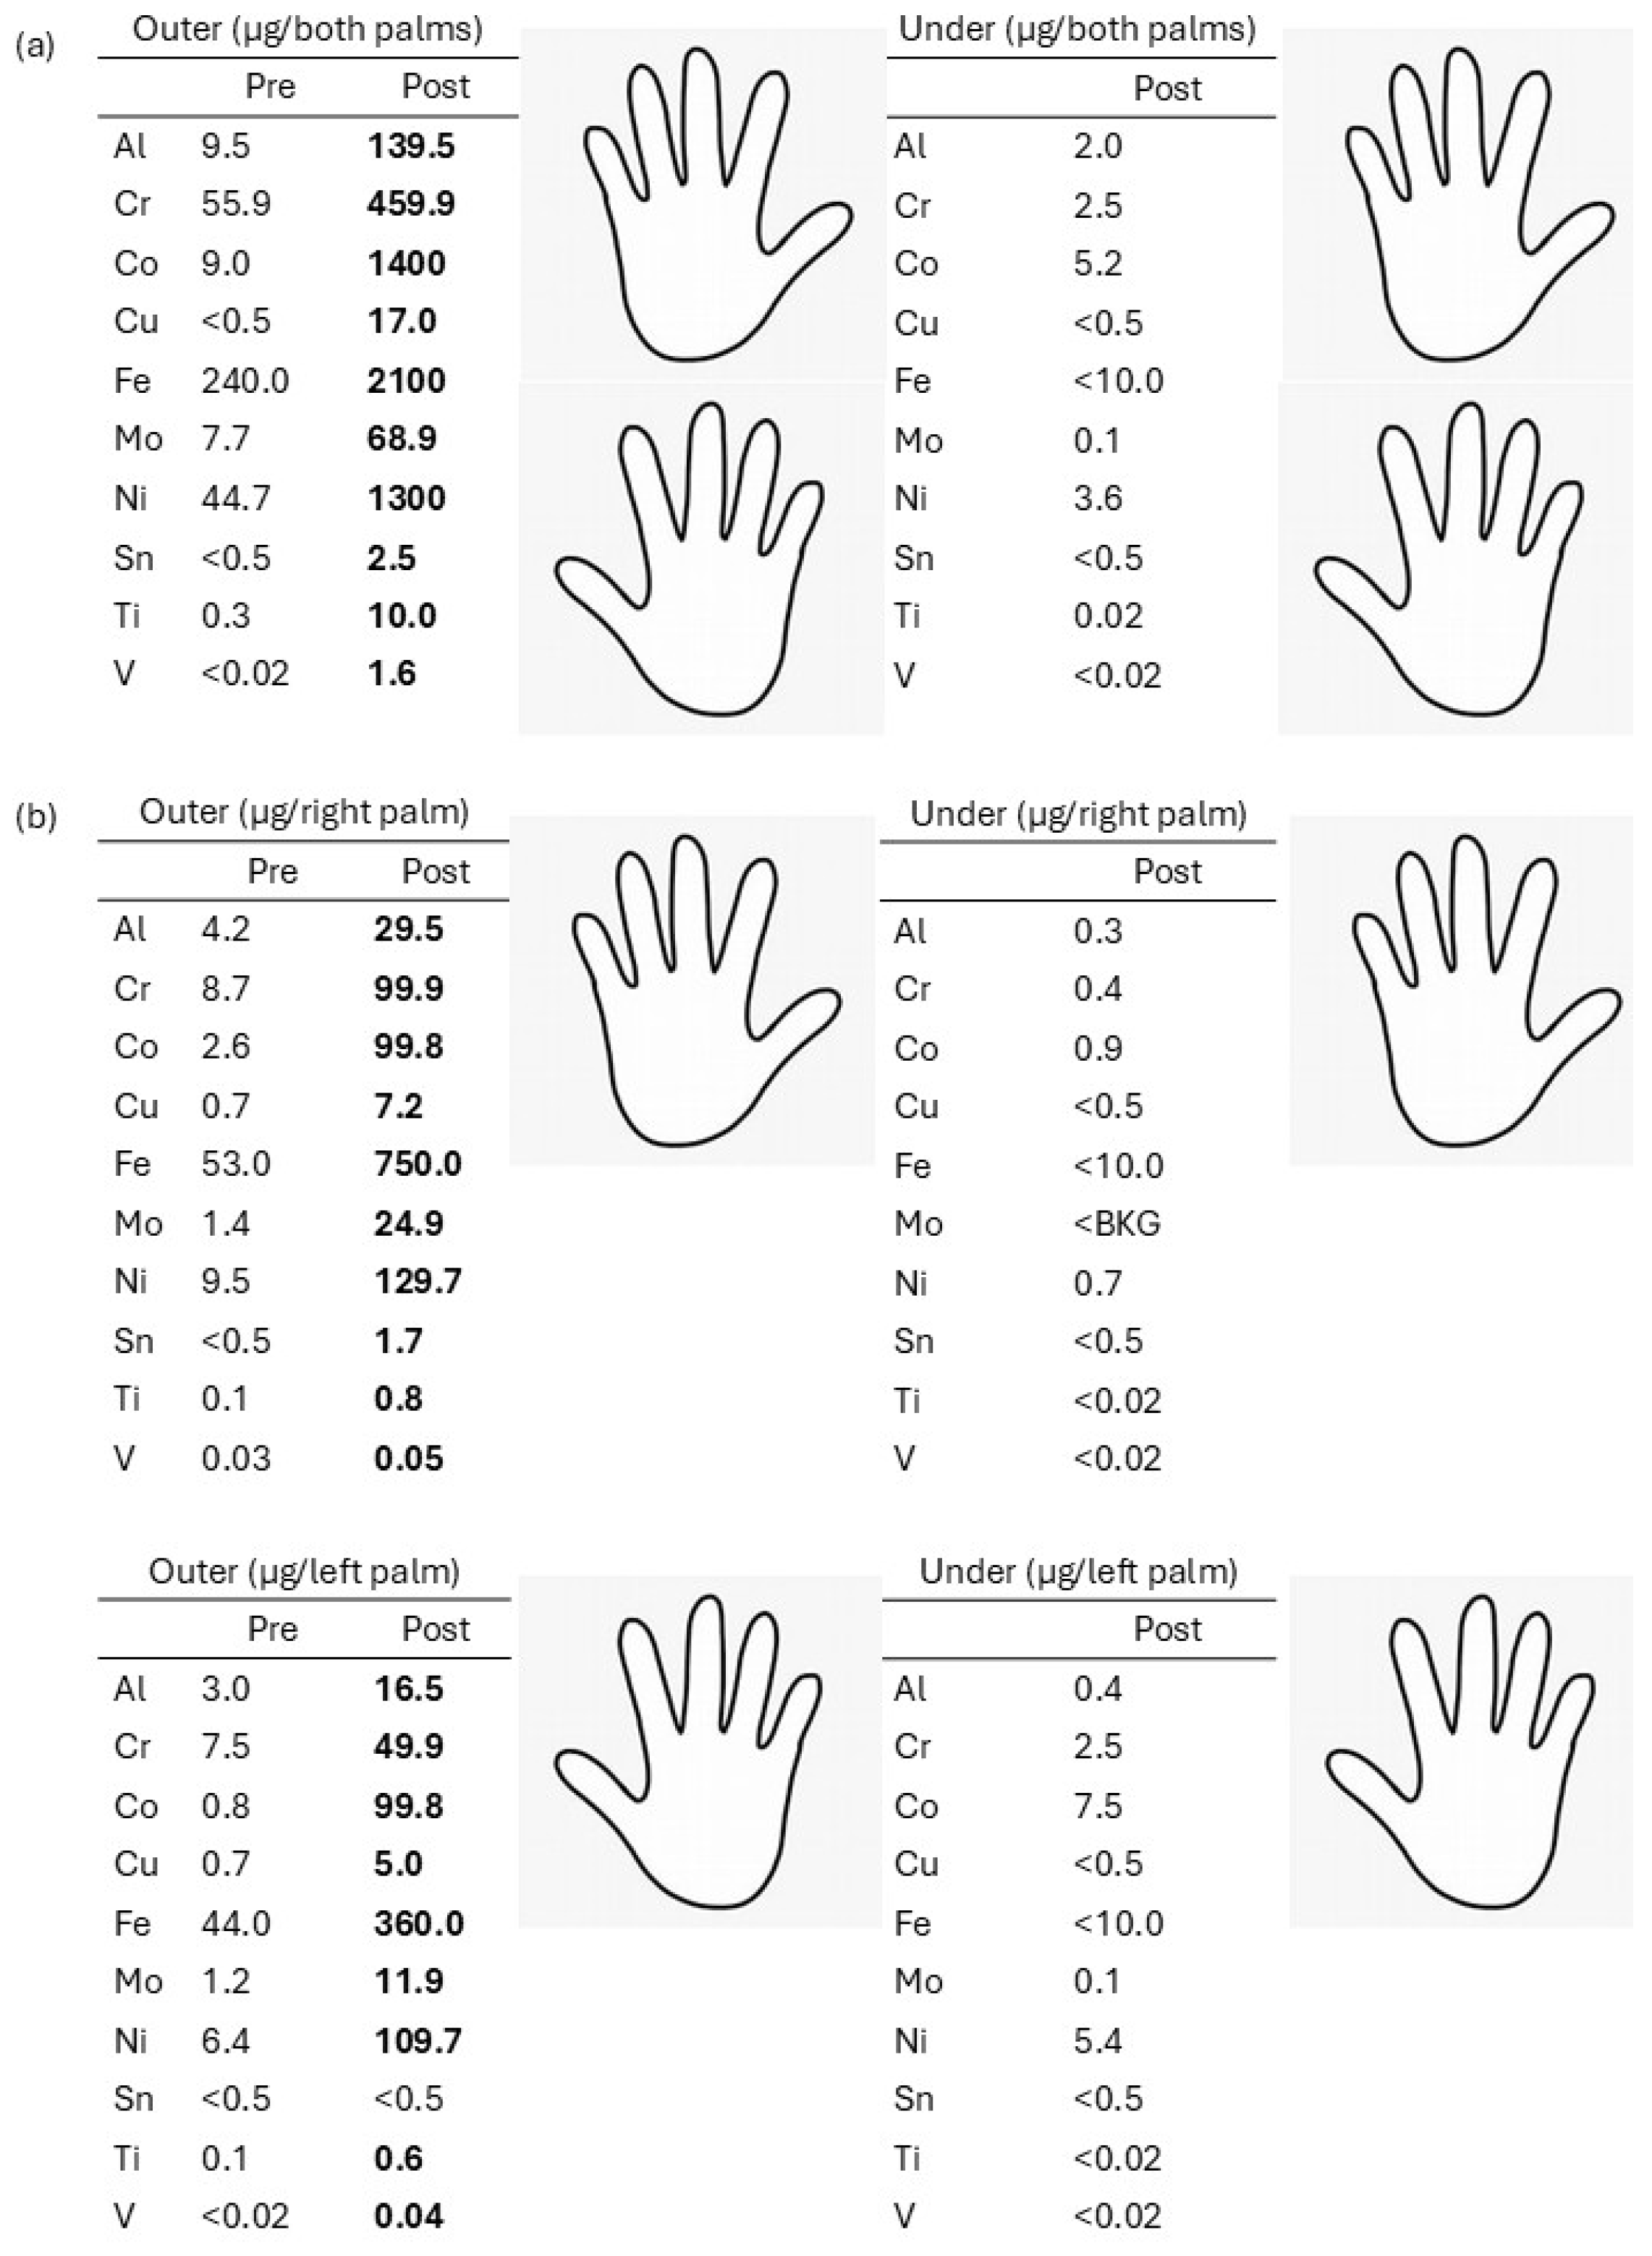
Figure 3 shows the changes in masses of metals on disposable nitrile gloves worn during each DED machine cleaning event (Employee F). Each event, the employee wore three layers of nitrile gloves. During cleaning on the day that the sternum area of their coverall was wiped, both palms (left and right hands) of the outer gloves were sampled using a single wipe before and after cleaning (
Figure 3a). Given the magnitude of levels of metals, results are expressed in units of µg/both glove palms. There was an accumulation of all metals on the palms of outer gloves after cleaning. There was no visible physical damage to the outer gloves after completion of the cleaning task on this day, and a single wipe sample of both palms of the under gloves confirmed that levels of metals were lower or similar to the pre-task sample for the outer gloves (
Figure 3a). On the day that the left chest area of the coverall was wiped, separate wipe samples were collected from the left and right gloves (
Figure 3b). These results are expressed in units of µg/right or µg/left glove palm. All metals were higher on the post-wipe sample for the outer right glove and were higher for all but Sn on the outer left glove. After cleaning, the left glove palm had physical damage (nicks and tears), but the right glove palm did not. A wipe sample of the left under glove had higher levels of Cr, Co, and Ni compared with the right under glove.
Additionally, wipe samples were collected from the palms of both outer nitrile gloves of Employee G who manually opened four containers of powder, scooped a portion into a secondary container, then placed the original containers in the powder transfer station hood for a v2 PBF printer. Except for Cu and Sn, there was a net accumulation of all metals upon completion of this task (µg/both glove palms): Al (519.5 vs. 1199.5), Cr (3.1 vs. 10.9), Co (0.7 vs. 1.2), Fe (18.0 vs. 39.0), Mo (0.8 vs. 2.0), Ni (6.2 vs. 20.7), Ti (0.6 vs. 0.9), and V (0.05 vs. 0.07).
Supplemental Table S1 summarizes the levels of metals on wipe samples collected from PPE including two PAPRs, a cloth laboratory coat worn in the PBF room, the inside of cloth gloves, and the bottom of work boots. A PAPR and cloth lab coat in the clean side changeout room and a PAPR stored in the open in the DED room were contaminated with all metals except Cu and Sn. The PAPR stored in the DED room had measurable amounts of metals on the head band and the neckband on the interior of the hood. The bottom treads of work boots worn in the production area were contaminated with measurable amounts of all metals. Levels of all metals on an employee’s personal backpack brought into the DED room were below their LOD or background.
4.4. SEM-EDX of Bulk Powders
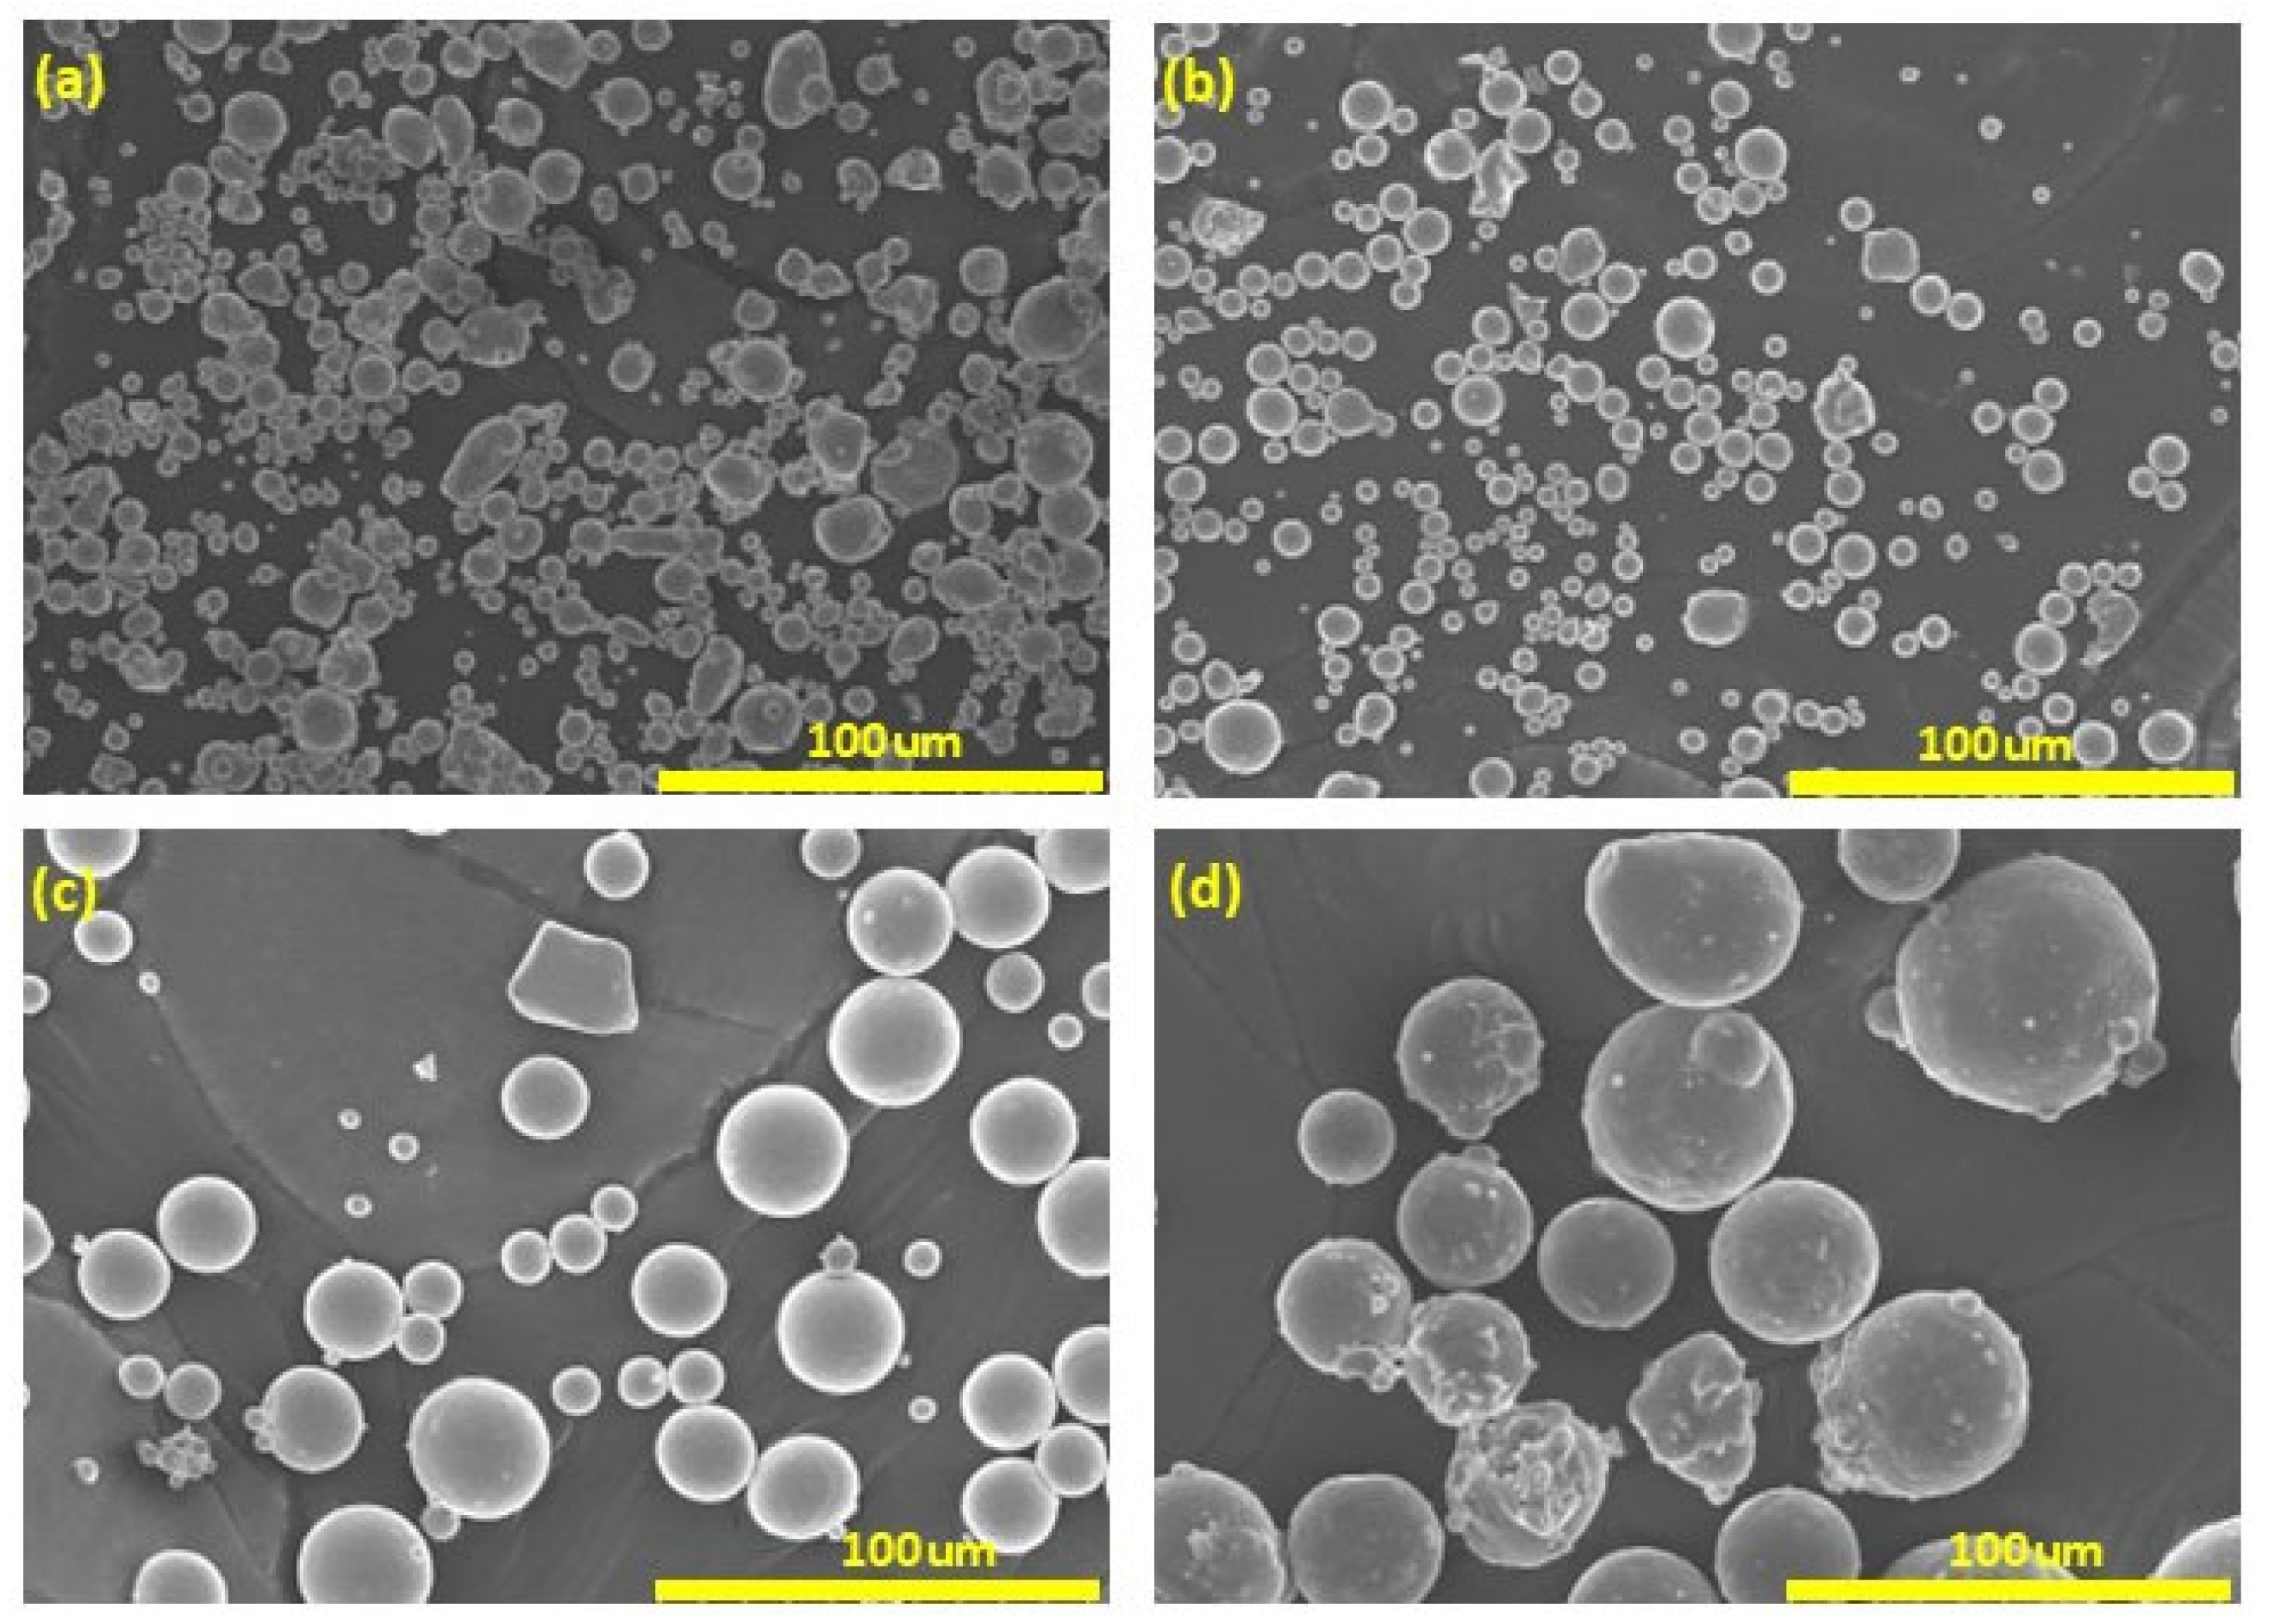
Figure 4 shows SEM images of four unused feedstock powders from the facility. Powder particles had spherical shape with occasional particles that were longer than they were wide. Some particles had smaller “satellite” particles on their surface. The 316L stainless steel and Inconel 718 powder particles were generally smaller than the Ti64 and AlSi10Mg powder particles.
Figure 5 is the EDX pattern of each bulk feedstock powder illustrating that their composition was consistent with that stated on the SDSs (see
Table 1).
4.5. Metal Powder Migration
Supplemental Table S2 summarizes the results of the pin stub samples. Particles with morphology and elemental composition consistent with feedstock powders (
Figure 4 and
Figure 5) were identified on nearly all (19/22) pin stub samples. The exceptions were a computer mouse and refrigerator door handle in the administrative suite and the handle of a cart in the PP room. Employees who were not directly engaged in production but spent time in these areas and had an individual office or an office in the engineering suite that opened to the main hallway in the production area, had feedstock powder particles on their work surfaces (e.g., computer mouse).
4.6. Surface Contamination with Metals
A total of 97 Ghost Wipe™ samples for 10 metals and 36 PVC filter wipes for Cr(VI) were collected throughout the facility. The number of wipe samples collected from each room ranged from six to 37, with the fraction below the LOD ranging from 2.7 to 80%. Most of the room-metal combinations had LOD fractions of <50%, with nine room-metal combinations having LOD fractions in the range of 50–80%.
Table 3 gives the GM levels of metals on surface wipe samples by room. Sn was excluded from analysis because 96/97 wipe samples were below the LOD of 5 ng/cm
2. Levels of Cr, Co, Fe, Mo, Ni, and Ti on surfaces in administrative areas were significantly lower compared with the other rooms. The level of Al in the administrative areas was not different from the DED room but was significantly lower than the remaining rooms. Levels of Al on surfaces in the PP room were significantly higher than measured in the PBF and DED rooms. Levels of Cr, Cr(VI), Co, Cu, Fe, and Ni on surfaces were not significantly different among the PP, PBF, and DED rooms. Levels of Mo and V were significantly higher on surfaces in the PP room compared with the PBF room. Levels of Ti in the PP room were significantly higher compared with the PBF and DED rooms.
Supplemental Table S3 summarizes the categories of commonly touched surfaces wiped in rooms at the facility, which included, but were not limited to, door handles, furniture, printers, and tools.
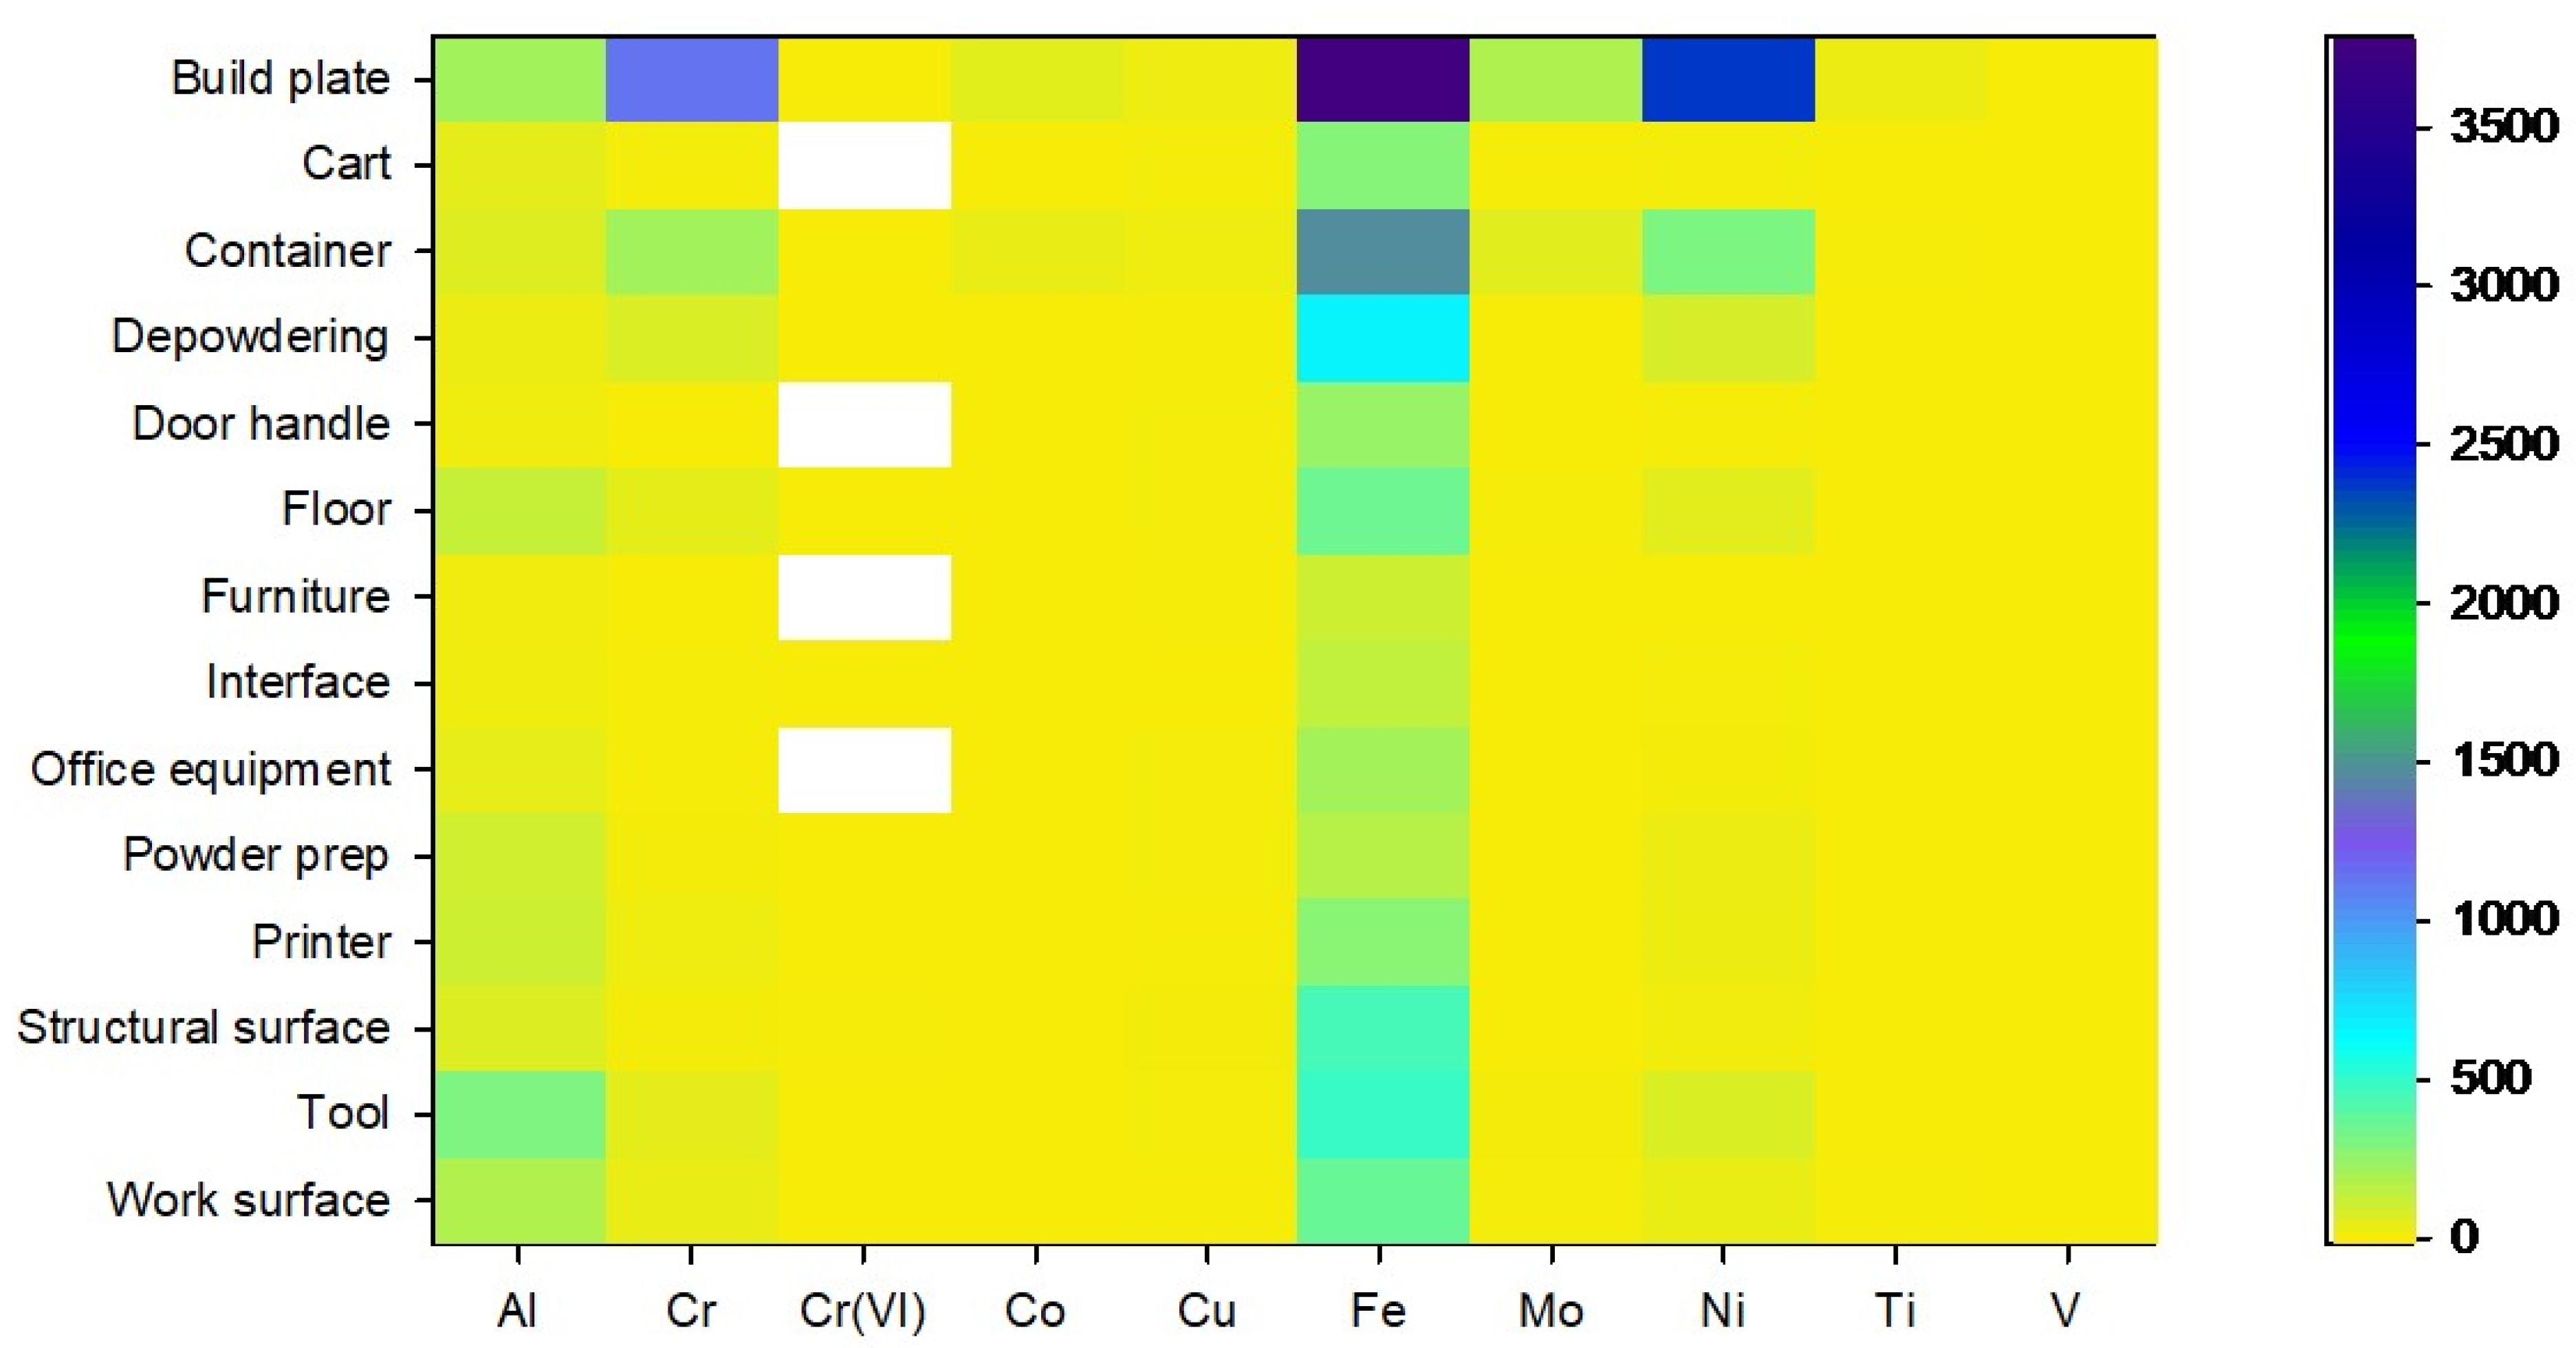
Figure 6 is a heat map diagram that visualizes the GM surface wipe concentrations by these categories. Build plates had the highest surface concentrations of Fe, Ni, and Cr. Other surfaces with relatively higher surface concentrations included containers (Cr, Fe, Ni), the depowdering station (Cr, Fe, Ni), door handles (Fe), floors (Al, Fe, Ni), structural surfaces (Fe), tools (Al, Fe, Ni), and work surfaces (Al, Fe).
Supplemental Table S4 (PBF room),
Table S5 (DED room),
Table S6 (post-processing room),
Table S7 (main hallway), and
Table S8 (administrative areas) give the measured levels of metals on surfaces for each room. Notable findings from these wipe samples are briefly summarized by room herein.
In the PBF room, wipe samples collected from surfaces of the v2 PBF printers dedicated to Ti64 and AlSi10Mg revealed the presence of Cr, Co, Fe, and Mo, which can be contrasted to the composition of powders given on the SDSs (
Table 1). Similarly, wipe samples from vacuums dedicated to specific feedstock powders quantified metals that are inconsistent with their respective powder SDS. Samples from the door handle, touch panel, and build chamber of the new v2 PBF printer that was being installed had measurable levels of all metals except Cu and V. The amounts of Fe, Mo, Ni, and Cr on the depowdering station door handle were among the highest of all surfaces in the PBF room. Wipe samples from the inner surfaces of the neoprene gloves attached to the depowdering station had measurable levels of most metals. Wipe samples collected from a build plate after vacuuming and then again after depowdering showed a decrease, but not complete removal of residual powder from the surface (
Table S4). All metals but Cu and V were present on the handle of a cart dedicated to the v1 PBF printer (316L stainless steel). The highest level of Cr(VI) measured in the facility was on a HEPA filter cabinet. Wipe samples collected from surfaces in the PPE change out room revealed metals on both the dirty and clean sides.
In the DED room, the surface of a keypad on machine one was wiped before and after cleaning by an employee and the results indicated a general reduction in metal levels. Samples from handles and external surfaces of waste and feedstock powder containers had some of the highest levels of Cr, Fe, Mo, Ti, and V among all samples collected in the DED room. Several metals were quantified on wipe samples collected from floors and transport carts. Levels on metals on samples collected from door handles were mostly below analytical LODs.
Wipe samples collected from surfaces on (keyboard, control panel) or adjacent (table) to the EDM machine had some of the highest levels of Co, Cr, Mo, and Ni among samples collected in this room. Handles of carts used to transport parts from the PBF and DED rooms to the PP room had measurable levels of all metals except Cu, Sn, and V. Additionally, many metals were present on shop packs that contained routing information for parts and build plates. The surface of a work bench in the manual finishing area was wiped before and after cleaning by an employee, and the results indicated a reduction in metal levels. Several employees had desks in the PP room. A wipe sample from a computer keyboard showed measurable levels of all metals except Cu and Sn. Wipe samples from surfaces in the maintenance cage and quality control laboratory had measurable levels of most metals.
In the main hallway, a wipe sample from a wheel of a robot that moves among powder and non-powder handling areas in the production side of the facility had measurable levels of all metals. Some printed parts bypassed post-processing and were sent directly to the part testing area. Wipe samples collected in this area had measurable amounts of all metals but Cu. Several samples were collected from the floor at various locations in the main hallway, and all had measurable levels of most metals.
Wipe samples collected from computer equipment and desktops in the administrative areas had measurable levels of Al, Cr, Co, Cu, Fe, Mo, Ni, and Ti. Levels in the individual offices and office suite tended to be higher than those in the engineering suite (most were near or below LODs). Levels of most metals (except Al and Cr) on wipe samples collected from countertops, chairs, and tables in the two breakrooms were below LODs. The levels of metals on refrigerator door handles in the administrative suite breakroom were almost all below LOD, whereas they were almost all measurable on refrigerator door handles in the employee breakroom accessed via the PP room.
5. Discussion
Results of wrist wipe samples from four employees showed high inter-individual variability in masses on skin and that post-task levels of metals were sometimes higher or lower compared with baseline. There are several reasons that could explain these observations. All employees wore nitrile gloves while performing their work tasks. One employee was observed to put on disposable arm sleeves after collecting the baseline sample. Two employees reported washing their hands two to three times between collecting the baseline and post-task samples. Additionally, the type of tasks differed, i.e., Employee A was holding a vacuum nozzle whereas Employees B–D were using various hand tools and frequently contacting printer surfaces during the printer installation. Further, Employees B–D worked on the same task, though differences in how they each performed their work (e.g., frequency of contact with contaminated surfaces) also contributed to variability. Hence, limitations of this dermal exposure assessment that preclude widespread generalizability of results included small number of participants and the lack of repeated measures over multiple days to better understand exposure variability. Previously, Ljunggren et al. measured metals contamination (by tape stripping) on the index finger of PBF machine operators that used Hastelloy
® feedstock powder. Levels of metals on skin were Co = 0.11 μg/cm
2, Ni = 0.63 μg/cm
2, and Cr = 0.37 μg/cm
2 [
4]. In a more recent study, Paulse et al. used Ghost Wipe™ sampling (same as our study) to monitor skin exposure at the index finger, palm, wrist, back of the hand, and neck of PBF machine operators using CO-548 feedstock powder before and after operating phases (preprocessing, printing, and post-processing). The highest average concentration detected was for Co (1.2 μg/cm
2) on the finger during the pre-processing phase [
6]. As shown in
Figure S2, each employees’ wrist filled approximately one half of the template so if we assume the total area of skin wiped on both wrists in the current study was 100 cm
2, post-task levels in
Table 2 are approximately: Co = 0.002 to 0.7 μg/cm
2, Ni = 0.002 to 1.6 μg/cm
2, and Cr = 0.001 to 0.2 μg/cm
2, which are consistent with Ljunggren et al. [
4] but approximately a factor of two lower for Co as reported by Paulse et al. [
6] Skin exposure to some metal constituents in the feedstock powders can elicit an immunological reaction (see
Table 1); among these, Co, Ni, and Cr are the most common causes of ACD [
25]. It is well established that once in contact with the skin, metal particles can undergo dissolution to produce water-soluble ions [
25]. These ions are referred to as the bioaccessible fraction. A portion of these bioaccessible ions can penetrate the skin and reach the underlying immunologically active epidermis where they exacerbate existing allergy or cause new allergy [
25]. The ions that are absorbed in the skin are referred to as the bioavailable fraction. Whether an individual has an immunological response following skin exposure to a metal is difficult to predict because it depends on several factors. Firstly, bioaccessibility of metals is influenced by the composition of sweat and its pH, which can differ among people [
13,
26]. Secondly, penetration of ions across the skin will depend on the physical condition of the stratum corneum (i.e., intact vs. abraded) and properties of the ions such as their diameter and valence state [
13,
25]. For example, Larese Filon et al. reported that Co and Ni powders more readily permeated through damaged skin compared with Cr powder [
25]. They speculated that the lower permeation of Cr was due to binding with skin proteins. In the case of Cr, protein binding is highly dependent on valence state of the ions [
25]. Cr powder that undergoes dissolution in sweat can produce Cr(III) and/or Cr(VI) ions. Valence state affects electrophilicity of the ion and it is known that Cr(III) ions have high electrophilicity and therefore a strong affinity for binding with skin proteins. Hence, more Cr(III) ions are needed to achieve the same degree of sensitization as Cr(VI) when exposure is via topical application. Cr(VI) ions are reduced to Cr(III) ions in artificial sweat, which suggests a competition between the rate of dissolution and the rate of change in valence state in the absorption and permeation of Cr ions [
17]. Thirdly, while the goal of dermal exposure assessment is to understand the amount of metal ultimately absorbed in the skin (bioavailable), what is measured on wipe samples is the mass of metal that was removed from skin. Quantification of the mass of metal on a skin wipe sample is done by dissolving the metal particles using acids and/or heat and/or pressure followed by analysis using spectroscopy. However, these digestion conditions are not representative of the dissolution conditions that particles are subjected to in sweat, so the measured mass values are hundreds to thousands of times higher than the bioaccessible mass [
17]. Finally, because ACD is an immunological response, differences in genetic susceptibility among people also makes it difficult to know who and to what degree a person will respond. Compounding these issues are the absence of occupational exposure limits for metals on skin. As such, it is unknown whether the exposure levels reported in
Table 2 present a health risk to some or all workers. Our results and the available literature raise awareness for the importance of protecting skin (e.g., wearing long sleeve shirts or consistent use and proper donning and doffing of gloves and disposable arm sleeves) and frequent skin hygiene (e.g., washing) of metal powder AM workers to minimize exposure to metals with propensity to cause irritation or sensitization.
Shirts worn by employees appeared to be personal clothing, not company-issued work shirts. Post-task sample results showed levels of metals were often, but not always higher compared with baseline though results varied by employee. The presence of metals on clothing indicated potential for exposure to employees through skin contact. Additionally, if worn out of the facility, there is potential for migration to vehicles and homes that could result in exposure to non-employees. Dugheri et al. attached filter samples to PBF machine operators at several anatomical locations (it was unclear if they were attached to clothing or PPE) and reported the presence of Cr, Co, and Ni, especially for those positioned on arms [
5]. Metals contamination on clothing and migration from powder AM facilities could be reduced by implementing administrative controls such as requiring company-issued work clothing while in production areas, or if personal clothing is worn, requiring employees to change into clean clothing before leaving a facility. Professional laundering of company-issued (or personal clothing) could reduce or remove contamination before re-wearing.
Wipe samples from PPE (
Figure 2 and
Figure 3,
Table S1) indicated metals contamination that could potentially lead to skin contact. The presence of metals on a PAPR stored in the clean side change out room indicated that contaminated PPE was brought in from the dirty side room. The PAPR stored in the DED room had measurable amounts of metals on the headband and the neckband on the interior of the hood, which indicated potential for direct skin contact. Furthermore, the inside of a cloth glove worn over nitrile gloves in the PP room was contaminated with metals, which could be a source of exposure if an employee placed an ungloved hand in it. Samples from Tyvek
® suits and gloves after cleaning tasks demonstrated an accumulation of metals. Our findings highlight the need for awareness to properly don and doff protective clothing to prevent skin exposure. Additional practices that could be implemented to reduce opportunities for skin exposure from handling or using PPE in powder AM facilities include frequent (e.g., after every use) wet cleaning of PAPRs (while wearing nitrile gloves), storing PAPRs in a clean location (e.g., cabinet) when not in use, eliminating use of cloth laboratory coats that cannot be easily wiped clean (or frequently laundering), and providing wet wipes, nitrile gloves, and plastic bags in the dirty side change out room to clean and isolate PPE before bringing it to the clean side room.
SEM-EDX analysis of pin stub samples collected throughout the facility provided qualitative evidence of feedstock powder migration within the PBF and DED rooms and from these rooms to almost all non-powder handling areas in this facility (
Table S2). Wipe sampling quantitatively confirmed metals contamination on nearly all surfaces throughout the facility (
Tables S4–S7); however, levels tended to be significantly lower in administrative areas compared with production areas (
Table 3). This finding is consistent with a suite of effective engineering, administrative, and PPE controls in place to minimize contamination migration between production and non-production areas. Levels of metals in the PP room were similar or higher compared with the PBF and DED rooms (
Table 3). This observation indicated that controls in place to minimize contamination migration from powder handling rooms to non-powder handling rooms in the production area could be improved to enhance their effectiveness. If contamination migration alone is insufficient to reduce surface contamination levels, additional controls such as gloves and arm sleeves could be implemented for employees in the PP room to protect their skin from contact with metals.
In the PBF room, wipe samples collected from surfaces of the v2 printers using Ti64 and AlSi10Mg revealed the presence of Cr, Co, Fe, and Mo that were not ingredients listed on the SDSs of these powders (
Table 1). Similarly, wipe samples from vacuums dedicated to specific feedstock powders quantified metals that were not listed on their respective powder SDS. These results are consistent with observations during sample collection that employees often moved from one printer to another without changing their nitrile gloves. As such, metals likely move between equipment in the PBF room via contaminated gloves, though it is also possible transfer could be from settled dust. Within the PBF room, wipe samples from the inner surfaces of the neoprene gloves attached to the depowdering station ports had measurable levels of metals present which indicated contamination from placing dirty disposable nitrile gloved hands inside them. Employees were observed wearing short-sleeved shirts and placing their gloved hands but uncovered arms in the depowdering station gloves, potentially exposing their skin to metals. Wipe samples collected from a new v2 PBF printer during installation had measurable levels of metals. The exact source of these metals is unknown but could be residues from when the printer was assembled at the parent company and tested (then disassembled) before shipping to the facility, cross-contamination from gloves or tools used for tasks involving other feedstock powders in the PBF room, and/or dust in air that settled on printer surfaces. All floor samples collected inside the PBF and DED rooms and in non-powder handling areas had measurable amounts of metals.
Evidence of powder migration pathways was revealed from wipe samples. For example, samples collected from handles of carts in the PBF (
Table S4) and DED rooms (
Table S5) that are used to transport parts to the PP room had measurable levels of all metals except Cu, Sn, and V. In fact, the sample from the handle of the transport cart in the DED room was among the highest levels of Al, Cr, Co, Fe, and Ni for samples collected in that room. Handles of two carts in the post-processing room were wiped and shown to have measurable levels of all metals except Cu, Sn, and V (
Table S6), which implicated carts that moved throughout the facility as a source of contamination movement. Wipe samples of a build plate after vacuuming and depowdering indicated the presence of metals (
Table S4). The same build plate was wiped after it was brought into the PP room and placed on a shelf outside the quality control testing laboratory. Levels of most metals from the sample collected in the PP room were higher compared with those from the sample collected in the PBF room, which indicated vibration and/or other movement during transport further dislodged loose powder in the part and build plate. The sample collected from the build plate in the PP room had the highest levels of Cr, Fe, Mo, and Ni among all samples in that room (
Table S6). Further, widespread metals contamination was observed in the part testing area (
Table S7), which indicated that parts that go directly from the PBF or DED rooms to the part testing area are a source of contamination migration. In the main hallway, a wipe sample from a wheel of a robot that goes into the PBF and DED rooms to transmit video of processes had measurable levels of all metals, which indicates this mobile equipment was a source of contamination movement. Metals were also present on office equipment (e.g., computers and peripherals) in production and administrative areas. Though levels of metals on surfaces in breakrooms where food is consumed were generally the lowest in the facility, it still raises awareness for the prospect of potential for ingestion as a route of exposure.
On a few occasions, the same surface was sampled before and after wet cleaning (
Tables S5 and S6). Results demonstrated a reduction in levels, which supports the effectiveness of housekeeping to remove surface contamination. Levels of metals on samples collected from door handles were often near or below analytical LODs, though it is unclear if this observation was the result of good housekeeping practices and/or brush off from frequent touching of these surfaces by employees.
Previously, Ljunggren et al. reported Co on floors and machine displays in the production area of a PBF facility [
4], and our results are consistent with their observations. Paulse et al. wiped various high contact surfaces in a PBF facility, including handles on printers and doors, printer displays and computer equipment, work benches, sieving equipment, and administrative office desks and computer equipment [
6]. These authors reported results as the summed concentration of metals (Al, Cr, Co, Fe, Mo, and Ni) by type of surface. In general, total concentrations were (all values in µg/cm
2): 0.19–0.28 (printer handle), 0.06–2.1 (door handle), 0.16 (printer display), 4.0–19.7 (work benches), 2.8 (sieving equipment), and 0.11–0.53 (desks and computer mouse). Direct quantitative comparison of our results to those given by Paulse et al. is hampered by differences in collection strategies (task-based in the current study vs. process phase-based in their study), feedstocks and metal constituents (e.g., our study also included Cr(VI), Cu, Ti, and V) in use, and scale of operations. Nonetheless, the data agrees that metals can migrate throughout powder AM facilities and brings attention for the need to control their movement to prevent exposure. Based on the literature and our results, there are several options for consideration by AM facilities to minimize migration of metal contamination throughout their facilities and to reduce levels of surface contamination such as
Ensure consistent use and changing of shoe covers and nitrile gloves whenever entering or leaving a powder handling area.
Utilize adhesive mats on both sides (entrance and egress) of doors to remove metals from bottoms of shoes and periodically replace mats to ensure effectiveness.
Change nitrile gloves between working at different printers or sieve stations or handling tools, etc., within areas of a room.
Increase awareness among all employees to wash hands with soap throughout the day and before leaving production areas and entering non-production areas.
Frequently wet clean surfaces (e.g., door and cart handles, touch screens, shop packs, etc.) and reusable PPE such as PAPRs with a disposable towel and appropriate liquid.
Frequently clean floors with a wet mop.
Utilize desk, chair, table, and computer equipment covers made of a smooth easily cleanable material and frequently wet clean.
Encapsulate build plates in a plastic bag when removing from powder handling rooms to non-powder handling rooms.




 ,
,