


Abstract
Radiomics may aid the noninvasive characterization of adrenal incidentalomas; however, reproducibility is limited by methodological heterogeneity. In this retrospective, single-center, exploratory study, we tested whether radiomic features from baseline non-enhanced computed tomography (NECT) discriminate benign from malignant/metastatic adrenal lesions and contextualized results with a PRISMA 2020 systematic review (PubMed/Scopus 2017–2025; PROSPERO CRD420251276627). Thirty-three patients (36 lesions: 12 lipid-rich adenomas, 9 lipid-poor adenomas, 6 pheochromocytomas, 7 malignant/metastatic lesions, 2 myelolipomas) were included; myelolipomas were excluded from primary comparisons. Two abdominal radiologists performed consensus 3D segmentation on NECT. Using LIFEx (v7.8.0) and IBSI definitions, 42 features were extracted and z-score standardized. LASSO selected four heterogeneity descriptors: First-order Entropy, gray-level co-occurrence matrix (GLCM) entropy, gray-level size zone matrix (GLSZM) non-uniformity, and neighboring gray tone difference matrix (NGTDM) busyness. Heterogeneity increased from lipid-rich adenomas to pheochromocytomas and malignant/metastatic lesions (Kruskal–Wallis, all p < 0.001. Pairwise separability, measured using the Vargha–Delaney A index (VDA) as a rank-based measure of separability, was highest for lipid-rich adenomas versus malignant/metastatic lesions (0.93), intermediate for lipid-poor adenomas versus pheochromocytomas (0.73), and lowest for lipid-rich versus lipid-poor adenomas (0.64). The review identified 18 eligible CT radiomics studies that consistently reported higher entropy/non-uniformity in pheochromocytomas and malignant lesions than in lipid-rich adenomas. Global heterogeneity metrics on NECT may complement conventional CT criteria in indeterminate lesions; external validation with robust reference standards is needed in larger, multicenter cohorts with harmonization.
1. Introduction
Adrenal incidentalomas are common imaging findings and are benign in most cases; however, a subset requires further diagnostic assessment to exclude hormonally active lesions or malignancy [1,2,3]. Non-contrast CT attenuation (Hounsfield units, HU) and contrast-enhanced washout studies remain key diagnostic tools, yet a proportion of lesions remain indeterminate in routine practice [1,2]. Radiomics is a quantitative imaging approach that extracts high-dimensional descriptors of lesion heterogeneity and texture beyond visual assessment [4]. Nevertheless, published evidence in adrenal imaging radiomics is often limited by small cohorts and methodological heterogeneity (acquisition, segmentation, discretization, feature extraction, and analysis), which can hinder reproducibility and generalizability [5,6]. In this context, standardized radiomics workflows and transparent reporting, including IBSI-aligned feature definitions and software, are needed to improve comparability across studies [7].
Therefore, we performed a single-center, retrospective, exploratory radiomics analysis of baseline NECT and complemented the original data with a PRISMA-based systematic review (PROSPERO: CRD420251276627) to contextualize feature-level trends reported in the literature [8,9]. Our objective was not to propose a validated diagnostic classifier, but to test whether global heterogeneity metrics on NECT show consistent, interpretable gradients across common adrenal lesion categories, thereby providing a hypothesis-generating framework for future external validation.
2. Materials and Methods
2.1. Study Design and Population
This was a single-center retrospective exploratory study. The database was queried between October 2024 and May 2025 to retrieve patients with available abdominal CT examinations, including scans acquired before this query window. The reference standard was defined using a composite approach including histopathology when available, biochemical evaluation when indicated, and imaging follow-up. No missing data were present for the analyzed variables. All benign lesions without histopathological confirmation showed radiological stability on imaging follow-up of at least 12 months. Baseline non-enhanced CT (NECT) examinations acquired at the time of initial lesion detection and prior to any treatment were used for radiomic analysis.
Patients were eligible if they had an adrenal incidentaloma detected on CT and sufficient imaging quality for segmentation and feature extraction. Lesions were classified as lipid-rich adenoma, lipid-poor adenoma, pheochromocytoma, or malignant/metastatic lesion based on a composite reference standard that integrated imaging features, biochemical assessment when indicated, and longitudinal follow-up. Myelolipomas were recorded but excluded from primary group comparisons due to their characteristic fat-containing appearance and the limited number of cases.
2.2. Radiomic Feature Extraction
Only NECT images were analyzed. All NECT examinations were performed on a single multidetector CT scanner (120 kVp, automatic tube current modulation, collimation 0.6–1.0 mm, reconstructed slice thickness 2–3 mm) using a soft-tissue kernel. Images were exported in DICOM format for radiomic processing.
Lesions were manually segmented in three dimensions (3D) on axial NECT images by two abdominal radiologists (with 8 and 15 years of experience in abdominal imaging) working in consensus. Both readers jointly reviewed each case and generated a single consensus segmentation for each lesion. Particular care was taken to exclude surrounding fat, vessels, and adjacent organs to minimize partial-volume effects and avoid contamination of radiomic features. Radiomic feature extraction was performed using LIFEx software (v7.8.0) [10] according to IBSI feature definitions [7]. A total of 42 features were initially extracted, including first-order intensity features, gray-level co-occurrence matrix (GLCM), gray-level size zone matrix (GLSZM), and neighboring gray tone difference matrix (NGTDM) features.
Image intensities were discretized using a fixed-bin approach with 64 bins as implemented in LIFEx for CT imaging, applied to HU values within each segmented lesion. No additional intensity clipping, voxel resampling, or spatial interpolation was applied because all examinations were acquired on a single scanner with a consistent acquisition and reconstruction protocol. After feature extraction, all radiomic features were standardized using z-score transformation and rescaled to the 0–1 range to support robust statistical comparisons across lesion groups. The overall study workflow is summarized in Figure A1 (Appendix B).
2.3. Feature Selection and Statistical Analysis
To reduce feature redundancy and multicollinearity in this exploratory setting, feature selection was performed using the Least Absolute Shrinkage and Selection Operator (LASSO) regression [11]. LASSO was applied in a supervised manner using a binary outcome (benign versus malignant/metastatic lesions) solely to guide feature selection, not to develop or validate a predictive classifier. All preprocessing steps, including feature standardization and LASSO-based feature selection, were performed on the full dataset, as no data splitting or predictive modeling was intended in this exploratory analysis. The regularization parameter (lambda) was selected using 5-fold cross-validation to minimize the cross-validated error. The four selected features were then compared across lesion categories using non parametric tests. The selected radiomic features are summarized in Table 1. Radiomic feature extraction and statistical analysis were performed using dedicated software and Python libraries, as detailed in Appendix A.
Table 1.
Radiomic features selected by LASSO and used for group comparisons.
Overall group differences were assessed using the Kruskal–Wallis test. Pre-specified pairwise comparisons were performed using Dunn’s test with Bonferroni correction to control for multiple comparisons. Effect sizes were summarized using Cliff’s delta and the Vargha–Delaney A index (VDA), a probabilistic measure of separability related to Cliff’s delta [12]. The Vargha–Delaney A index (VDA) is a nonparametric, rank-based measure of stochastic superiority that quantifies the probability that a randomly selected observation from one group has a higher value than a randomly selected observation from another group.
2.4. Segmentation Robustness and Reproducibility
All segmentations were performed in consensus by two abdominal radiologists using a standardized 3D delineation protocol. However, no independent repeated segmentations were performed, and therefore interobserver reproducibility could not be quantified using intraclass correlation coefficients (ICC). Given that radiomic features are known to be sensitive to segmentation variability, the lack of reproducibility assessment represents a methodological limitation.
2.5. Systematic Review (Protocol Registration and Search Strategy)
The systematic review protocol was registered in PROSPERO (CRD420251276627) [9]. PubMed and Scopus were searched for English-language articles published from 1 January 2017 to 31 May 2025. Reference list checking (backward citation searching) and forward citation searching were also performed. Titles/abstracts and full texts were screened independently by two reviewers, with disagreements resolved by discussion and consensus. As pre-specified in the protocol, the study risk of bias was not assessed. The review is reported in accordance with PRISMA 2020 [8]. The study selection process is illustrated in Figure A2 (Appendix B).
The search identified 94 records (58 from PubMed, 36 from Scopus). After removing 14 duplicates, 80 unique records were screened. Title/abstract screening excluded 46 records; 34 full texts were assessed for eligibility, and 18 studies met the inclusion criteria and were included in the qualitative synthesis.
Inclusion criteria were radiomic analysis on NECT images of adrenal lesions with a clinical or pathological reference standard and extractable feature-level data; when multiphasic CT was used, studies were included only if NECT-derived radiomic data were reported separately. Exclusion criteria comprised non-CT imaging, non-NECT feature extraction, case reports, narrative reviews, and studies without extractable radiomic feature data. Included studies enrolled between 25 and 310 patients and predominantly used manual 3D segmentation, IBSI-aligned software platforms (e.g., LIFEx or PyRadiomics), and feature selection methods such as LASSO.
3. Results
The final cohort included 33 patients with 36 adrenal lesions; three patients presented with bilateral involvement. The mean age was 58.4 years (range 41–77), with 18 women (54.5%) and 15 men (45.5%). Lesion composition included 12 lipid-rich adenomas (33.3%), 9 lipid-poor adenomas (25.0%), 6 pheochromocytomas (16.7%), 7 malignant or metastatic lesions (19.4%), and 2 myelolipomas (5.6%). As specified in advance, myelolipomas were excluded from primary group comparisons. Radiomic features showed a progressive increase in heterogeneity from lipid-rich adenomas to pheochromocytomas and malignant/metastatic lesions. The distribution of radiomic feature values across lesion groups is reported in Table 2.
Table 2.
Median values with interquartile ranges (25th–75th percentiles) of the four selected radiomic features by lesion group (normalized to 0–1).
Statistical Analysis
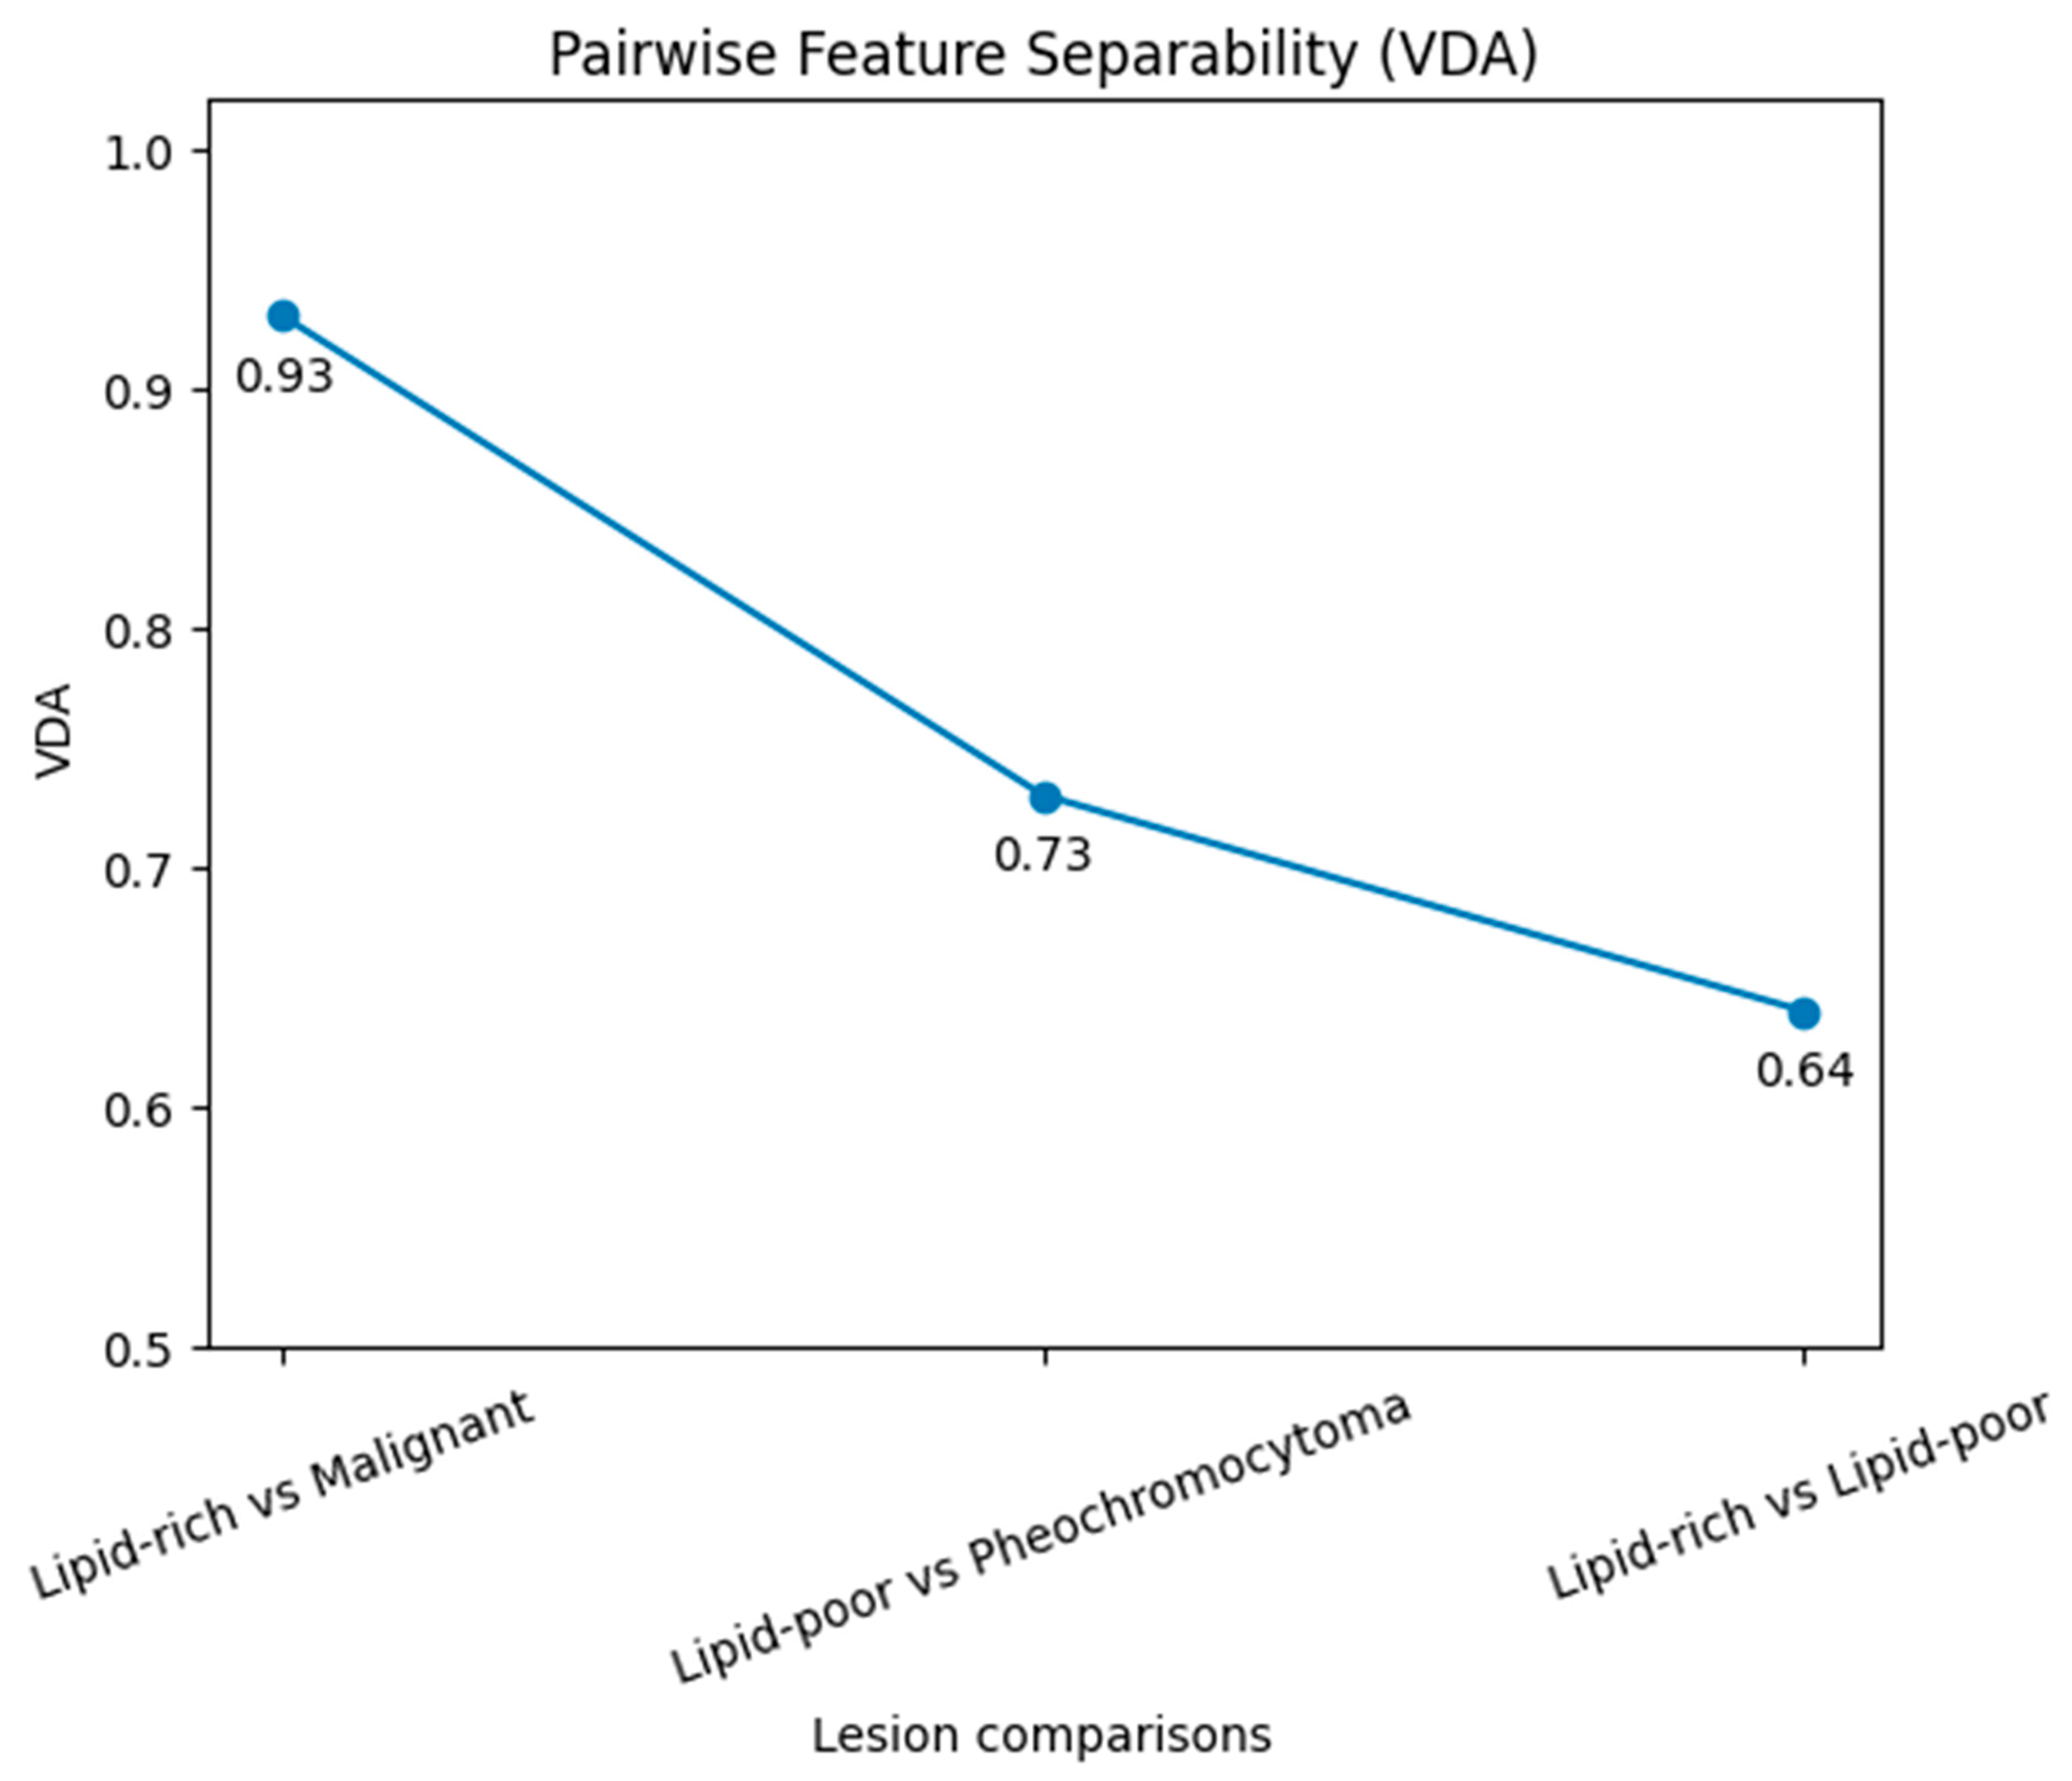
Statistical analysis confirmed significant differences across adrenal lesion groups for all radiomic features examined. Pairwise comparisons and effect sizes are summarized in Table 3. The Kruskal–Wallis test indicated global significance for First-order Entropy, GLCM Entropy, GLSZM Non-uniformity, and NGTDM Busyness (all p < 0.001). Post hoc pairwise comparisons using Dunn’s test with Bonferroni correction demonstrated a progressive gradient of differentiation. The most significant differences were observed between lipid-rich adenomas and malignant lesions (all p < 0.001), with very large effect sizes (Cliff’s delta = 0.80–0.88). Comparisons between lipid-poor adenomas and pheochromocytomas yielded moderate differences (p = 0.03–0.05, Cliff’s delta 0.41–0.47). By contrast, lipid-rich versus lipid-poor adenomas did not reach conventional statistical significance (p = 0.06–0.09), with small effect sizes (Cliff’s delta 0.25–0.29) (Table 3). To provide a probabilistic measure of discrimination, the Vargha–Delaney A index (VDA) was calculated for the main pairwise contrasts. Pairwise separability results are reported in Table 4. The VDA values are presented as preliminary, rank-based estimates of feature separability and should not be interpreted as measures of diagnostic performance. As no predictive model was developed, conventional performance metrics such as AUC, sensitivity, and specificity were not calculated. VDA values reached 0.93 for lipid-rich adenomas versus malignant lesions, 0.73 for lipid-poor adenomas versus pheochromocytomas, and 0.64 for lipid-rich versus lipid-poor adenomas. These values indicate strong, moderate, and weak feature-level separability, respectively. In particular, separability was highest for lipid-rich adenomas versus malignant lesions (VDA = 0.93), intermediate for lipid-poor adenomas versus pheochromocytomas (VDA = 0.73), and lowest between lipid-rich and lipid-poor adenomas (VDA = 0.64), indicating a progressive gradient across lesion types. The pairwise feature-level separability across lesion groups is visually illustrated in Figure A3. (Appendix B). The integrated literature review, conducted according to PRISMA-inspired criteria, identified 94 studies, of which 18 met the inclusion criteria (2017–2025). Fifteen studies were retrospective, and three were prospective, with sample sizes ranging from 25 to 310 patients. LIFEx, PyRadiomics, and proprietary software were the most frequently employed platforms.
Table 3.
Pairwise comparisons (Dunn’s test) and effect sizes (Cliff’s delta) for the four selected radiomic features.
Table 4.
Pairwise separability between lesion groups measured using the Vargha–Delaney A index (VDA).
VDA values indicated strong (0.93), moderate (0.73), and weak (0.64) feature-level separability across the three central lesion contrasts. The most frequently analyzed features were GLCM, GLSZM, NGTDM, and first-order intensity metrics. Across studies, pheochromocytomas and malignant lesions consistently showed higher entropy and non-uniformity than lipid-rich adenomas. Table 5 summarizes the comparison between the present exploratory study and the published literature, highlighting the convergence of findings across independent cohorts. Overall, these findings indicate that heterogeneity-related radiomic descriptors exhibit consistent behavior across adrenal lesion subtypes, reinforcing their potential as complementary markers for the non-invasive characterization of indeterminate incidentalomas. VDA was used exclusively as an exploratory, rank-based metric to quantify pairwise feature separability and was not intended to assess diagnostic or predictive performance, which would require validated classification models.
Table 5.
Studies included in the systematic review (2017–2025) and key methodological features.
4. Discussion
This exploratory, single-center study integrated original NECT radiomics data with a PRISMA-based systematic review (PROSPERO: CRD420251276627) [8,9]. We observed a consistent heterogeneity gradient across adrenal lesion categories: lipid-rich adenomas showed the lowest entropy and non-uniformity values, lipid-poor adenomas showed intermediate values, and pheochromocytomas and malignant/metastatic lesions showed the highest heterogeneity. This pattern is biologically plausible and aligns with prior CT radiomics studies and meta-analytic evidence in adrenal lesion characterization [6]. The individual studies and related literature considered in the systematic review, along with the contextual comparisons, are listed in References [13,14,15,16,17,18,19,20,21,22,23,24,25,26,27,28,29,30,31,32,33,34,35,36,37,38,39,40,41,42,43,44].
Methodologically, we employed 3D manual consensus segmentation and an IBSI-aligned feature-extraction workflow using LIFEx [7,10]. By focusing on global (whole-lesion) heterogeneity metrics, the analysis reduces sensitivity to local HU fluctuations and minor boundary differences that can affect voxel-wise or map-based approaches on NECT. The single-scanner acquisition and consistent reconstruction protocol further limited technical variability, supporting consistency with feature-level trends reported in the literature (Table 6). These comparisons are descriptive and intended to provide qualitative context only; they do not imply methodological equivalence with performance metrics such as AUC derived from predictive models. Literature ranges are approximate and derived from heterogeneous studies, and are therefore not directly comparable due to differences in acquisition, preprocessing, and feature extraction pipelines… Compared with existing imaging approaches, this study does not aim to demonstrate superior diagnostic performance, but rather to confirm consistent feature-level behavior across lesion types. The potential incremental value lies in supporting the interpretation of indeterminate lesions rather than replacing established diagnostic criteria. Clinically, radiomics offers limited added value for lesions with unequivocal imaging appearance (e.g., lipid-rich adenomas and myelolipomas), but may complement conventional CT criteria in indeterminate lesions where diagnostic overlap persists despite guideline-based assessment [1,2]. In clinical practice, these findings suggest that heterogeneity-related radiomic features may support the characterization of indeterminate adrenal lesions, particularly when conventional CT criteria are inconclusive. However, no specific decision thresholds can be proposed at this stage due to the exploratory design. Importantly, this work is feature-level and hypothesis-generating: we did not develop or validate a classifier, and external validation integrating biochemical assessment and standardized reporting is required before clinical implementation.
Table 6.
Qualitative comparison of feature-level trends with previously published radiomics studies (2017–2025).
This study has some limitations. The sample size was modest, reflecting its exploratory design, and larger prospective cohorts are needed to consolidate these findings. No external validation cohort was available, and the findings should therefore be considered preliminary and not directly generalizable beyond this exploratory setting. In addition, the relatively small sample size combined with the high dimensionality of radiomic features introduces a substantial risk of overfitting. In such settings, feature selection methods, including LASSO, may be unstable, leading to variability in the selected features depending on the specific sample composition. Moreover, no feature selection stability analysis (e.g., resampling or leave-one-out procedures) was performed. Therefore, the robustness of the selected feature set cannot be assessed, and the findings should be considered exploratory and hypothesis-generating.
The relatively small sample size reflects the exploratory nature of the study and limits statistical power and generalizability. Therefore, the results should be interpreted as hypothesis-generating and require confirmation in larger multicenter cohorts with external validation. Lesion segmentation was performed manually, which may introduce inter-observer variability; however, a standardized protocol and joint review by two experienced radiologists were employed to minimize this effect. Additionally, the use of non-enhanced CT (NECT) limits the characterization of lipid content, and a monocentric retrospective design may reduce the generalizability of the results. Formal reproducibility metrics, such as the intraclass correlation coefficient (ICC), were not assessed. Finally, although a consistent reconstruction protocol was used, variability in reconstruction algorithms could influence radiomic feature stability in multicenter settings. Given the limited sample size, LASSO-based feature selection was used for exploratory dimensionality reduction rather than for predictive modeling; the results should be interpreted accordingly. The Vargha–Delaney A index (VDA) [12] was used as a preliminary, rank-based measure of group discrimination. However, it should not be interpreted as equivalent to AUC in multi-class comparisons, and its results are intended only as an exploratory indication of feature separability. Because no predictive or multivariable classification model was developed, conventional diagnostic metrics, such as AUC, were not directly evaluated. A formal risk-of-bias assessment was not performed, as pre-specified in the PROSPERO protocol. This work aimed primarily to provide an exploratory, feature-level synthesis of radiomic heterogeneity patterns rather than to estimate diagnostic accuracy or develop predictive models. To enhance transparency and reproducibility, we reported the radiomics workflow using IBSI-aligned terminology and LIFEx (v7.8.0) [7]. Future studies that develop and validate prediction models should follow established reporting guidelines and checklists (e.g., CLAIM and TRIPOD-AI) and include external validation and reproducibility analyses (e.g., ICC-based feature stability) [45,46].
5. Conclusions
NECT radiomics identified a reproducible heterogeneity gradient across major adrenal incidentaloma categories, with increasing entropy and non-uniformity from lipid-rich adenomas to pheochromocytomas and malignant/metastatic lesions. In this exploratory cohort, feature distributions and separability measures showed qualitative agreement with trends reported in the literature. Radiomics appears most relevant for indeterminate lesions (e.g., lipid-poor adenomas versus pheochromocytomas or metastases) where conventional CT criteria may be insufficient. Larger multicenter studies with robust assessments of reproducibility and external validation are warranted.
Author Contributions
Conceptualization: P.F., D.M.; Methodology: P.F., F.V., P.R., and D.M.; Software and Formal Analysis: P.F., D.M.; Investigation: P.F., F.V., P.R., and D.M.; Resources: P.F., F.V., P.R., and D.M.; Data Curation: all authors; Writing—Original Draft Preparation: P.F.; Writing—Review and Editing: P.F., F.V., P.R., and D.M.; Supervision: D.M. All authors have read and agreed to the published version of the manuscript.
Funding
This research received no external funding.
Institutional Review Board Statement
The study was conducted in accordance with the Declaration of Helsinki. The retrospective analysis of anonymized imaging data was authorized at the department level (Department of Radiological, Oncological and Pathological Sciences, Sapienza University of Rome), in accordance with local institutional policies; no protocol code is available.
Informed Consent Statement
Consent was waived due to the study’s retrospective design and the use of anonymized imaging data.
Data Availability Statement
The data presented in this study are available from the corresponding author upon reasonable request. The data are not publicly available due to privacy and institutional restrictions.
Conflicts of Interest
The authors declare no conflicts of interest.
Abbreviations
The following abbreviations are used in this manuscript:
| PROSPERO | International prospective register of systematic reviews |
| PRISMA | Preferred Reporting Items for Systematic Reviews and Meta-Analyses |
| MTH | malignant/metastatic lesion |
| Pheo | pheochromocytoma |
| LP-A | lipid-poor adenoma |
| LR-A | lipid-rich adenoma |
| ICC | intraclass correlation coefficient |
| LASSO | least absolute shrinkage and selection operator |
| VDA | Vargha–Delaney A index |
| ROI | region of interest |
| NECT | non-enhanced computed tomography |
| NGTDM | neighboring gray tone difference matrix |
| GLSZM | gray-level size zone matrix |
| GLCM | gray-level co-occurrence matrix |
| IBSI | Image Biomarker Standardization Initiative |
| HU | Hounsfield unit |
| CT | computed tomography |
| AUC | area under the curve |
Appendix A. Appendix Libraries Used for Statistical and Radiomic Analysis in Python 3.10
- NumPy (v1.24.3)
- Pandas (v2.0.3) SciPy (v1.11.4)
- Scikit-learn (v1.3.0)
- Matplotlib (v3.7.2) & Seaborn (v0.12.2)
Appendix B. Figure A1(1a,1b,1c,1d) Schematic Representation of the Study Design; Figure A2 PRISMA Flow Diagram; Figure A3 Pairwise Feature-Level Separability Across Lesion Groups Measured Using the Vargha–Delaney A Index (VDA)
Figure A1.
Schematic representation of the study design, including ROI segmentation on NECT images (1a), radiomic feature extraction (1b), LASSO-based feature selection (1c), systematic review conducted according to PRISMA guidelines, and subsequent statistical analysis (1d). Arrows indicate workflow progression, different colors represent distinct processing steps, and the symbol ‘?’ indicates decision or evaluation points. NECT: non-enhanced computed tomography; ROI: region of interest.
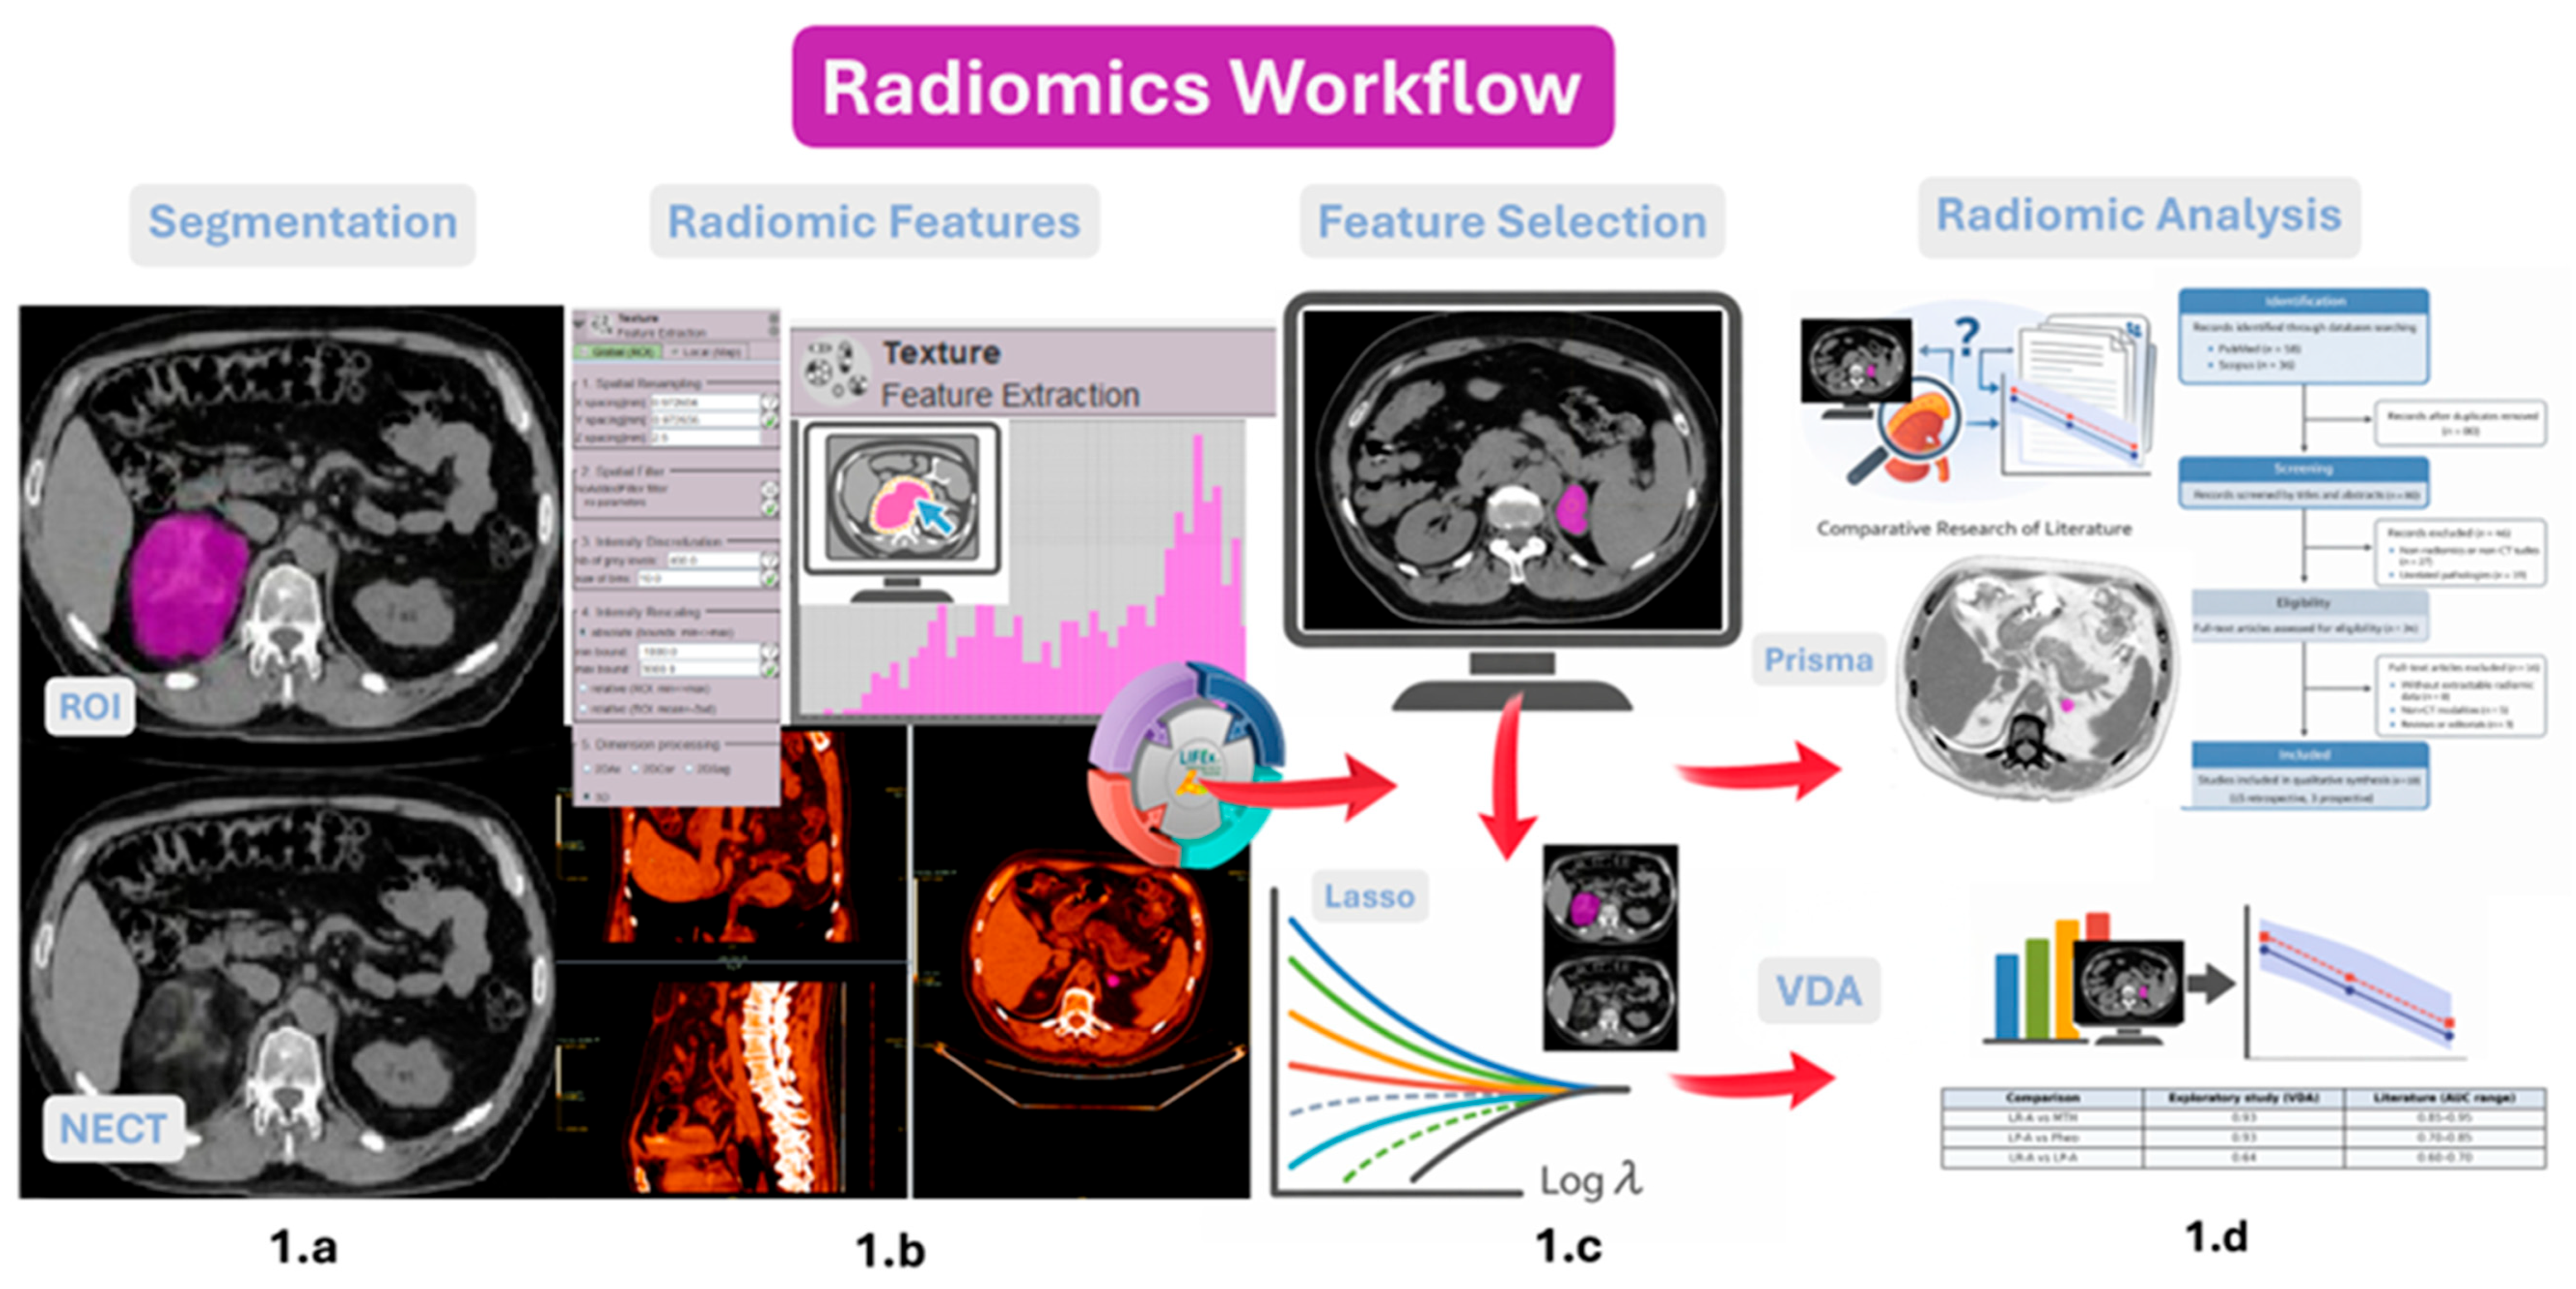
Figure A2.
PRISMA 2020 flow diagram of study selection [8].
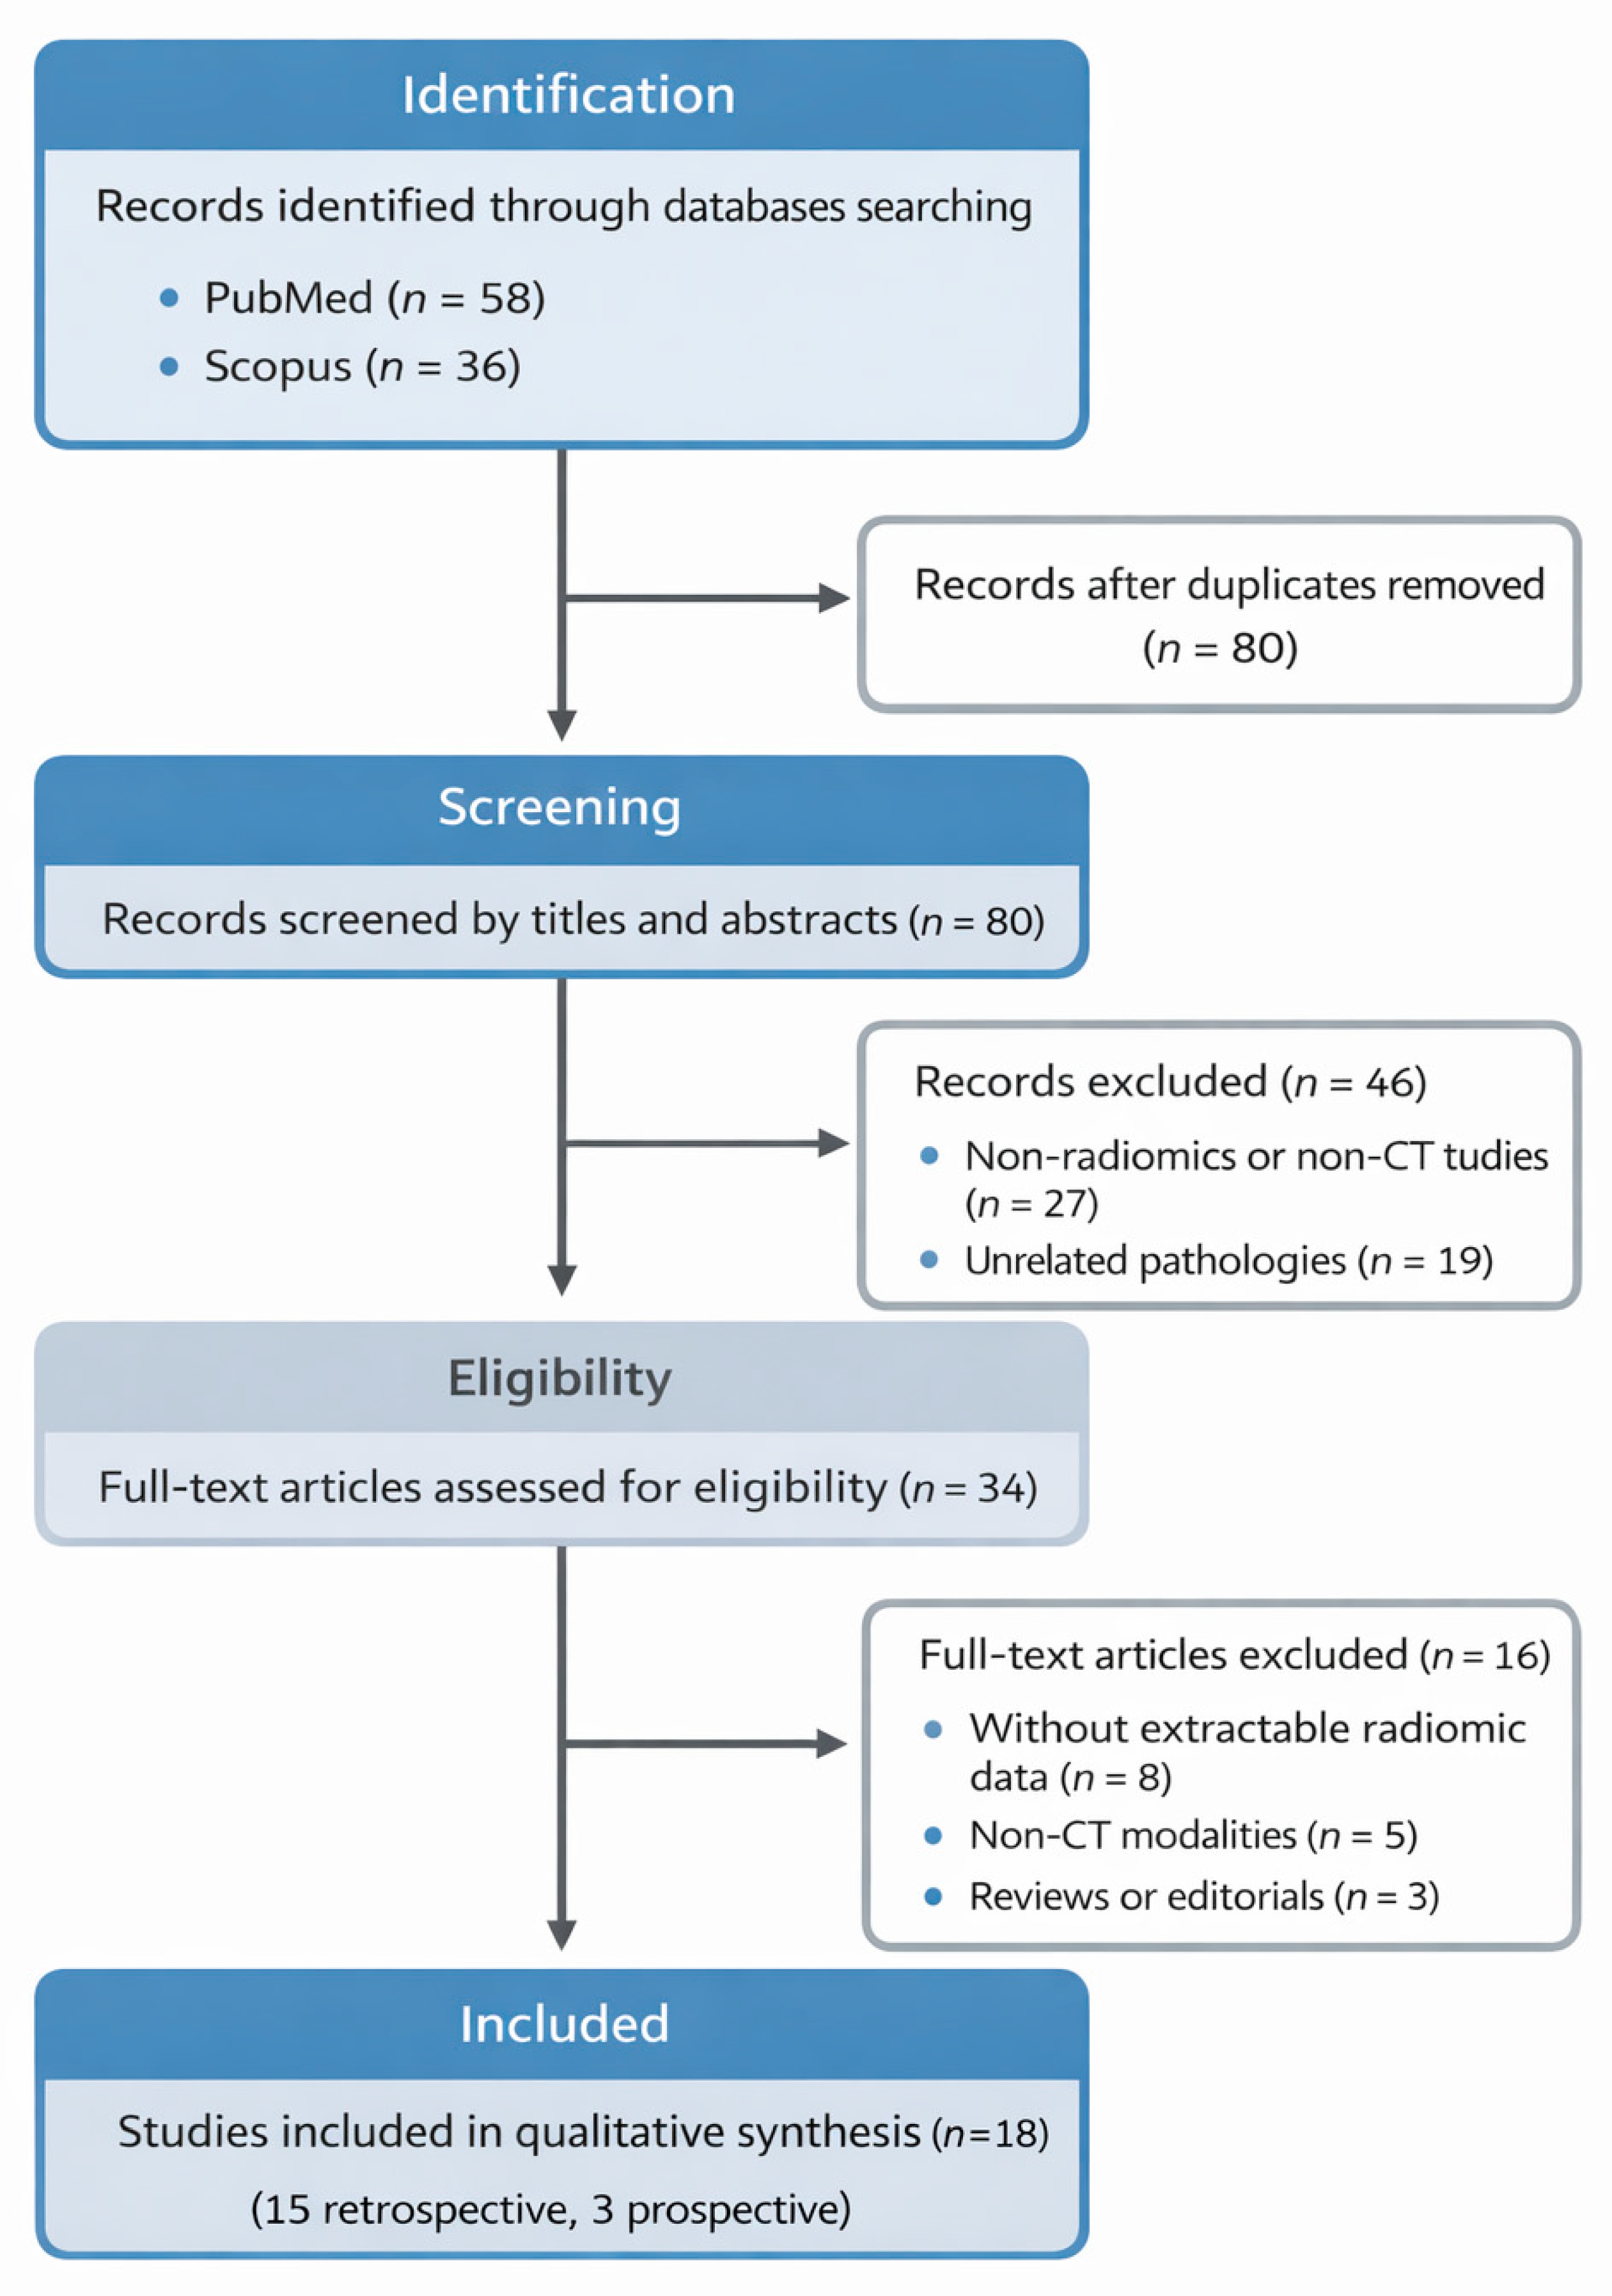
Figure A3.
Pairwise feature-level separability across lesion groups measured using the Vargha–Delaney A index (VDA). The plot illustrates a progressive gradient of separability, with higher values indicating greater distributional differences between groups.
References
- Mayo-Smith, W.W.; Song, J.H.; Boland, G.W.; Francis, I.R.; Israel, G.M.; Mazzaglia, P.J.; Berland, L.L.; Pandharipande, P.V.; Kamel, I.R.; Krishnaraj, A.; et al. Management of Incidental Adrenal Masses: A White Paper of the ACR Incidental Findings Committee. J. Am. Coll. Radiol. 2017, 14, 1038–1044. [Google Scholar] [CrossRef] [Scilit] [PubMed]
- Fassnacht, M.; Dekkers, O.M.; Else, T.; Baudin, E.; Berr, C.M.; Beuschlein, F.; Bilezikian, J.P.; Castinetti, F.; Chortis, V.; Corcuff, J.B.; et al. European Society of Endocrinology clinical practice guideline on the management of adrenal incidentalomas, in collaboration with the European Network for the Study of Adrenal Tumors (ENSAT). Eur. J. Endocrinol. 2023, 189, G1–G42. [Google Scholar] [CrossRef] [Scilit]
- Okroj, D.; Rzepecka, A.; Kłosowski, P.; Babińska, A.; Sworczak, K. Review of Diagnostic Modalities for Adrenal Incidentaloma. J. Clin. Med. 2023, 12, 3739. [Google Scholar] [CrossRef] [Scilit]
- Lambin, P.; Rios-Velazquez, E.; Leijenaar, R.; Carvalho, S.; van Stiphout, R.G.P.M.; Granton, P.; Zegers, C.M.L.; Gillies, R.; Boellard, R.; Dekker, A.; et al. Radiomics: Extracting more information from medical images using advanced feature analysis. Eur. J. Cancer 2012, 48, 441–446. [Google Scholar] [CrossRef] [Scilit]
- Li, C.; Fu, Y.; Yi, X.; Guan, X.; Liu, L.; Chen, B.T. Application of radiomics in adrenal incidentaloma: A literature review. Discov. Oncol. 2022, 13, 112. [Google Scholar] [CrossRef] [Scilit]
- Zhang, H.; Lei, H.; Pang, J. Diagnostic performance of radiomics in adrenal masses: A systematic review and meta-analysis. Front. Oncol. 2022, 12, 975183. [Google Scholar] [CrossRef] [Scilit]
- Zwanenburg, A.; Vallières, M.; Abdalah, M.A.; Aerts, H.J.W.L.; Andrearczyk, V.; Apte, A.; Ashrafinia, S.; Bakas, S.; Beukinga, R.J.; Boellaard, R.; et al. The Image Biomarker Standardization Initiative: Standardized quantitative radiomics for high-throughput image-based phenotyping. Radiology 2020, 295, 328–338. [Google Scholar] [CrossRef] [Scilit]
- Page, M.J.; McKenzie, J.E.; Bossuyt, P.M.; Boutron, I.; Hoffmann, T.C.; Mulrow, C.D.; Shamseer, L.; Tetzlaff, J.M.; Akl, E.A.; Brennan, S.E.; et al. The PRISMA 2020 statement: An updated guideline for reporting systematic reviews. Br. Med. J. 2021, 372, n71. [Google Scholar] [CrossRef] [Scilit] [PubMed]
- Frisina, P.; Messineo, D. Radiomic Characterization of Adrenal Incidentalomas on Non-Enhanced CT: A Retrospective Exploratory Study and Systematic Review. PROSPERO 2026: CRD420251276627. Available online: https://www.crd.york.ac.uk/PROSPERO/view/CRD420251276627 (accessed on 18 February 2026).
- Nioche, C.; Orlhac, F.; Boughdad, S.; Reuzé, S.; Goya-Outi, J.; Robert, C.; Pellot-Barakat, C.; Soussan, M.; Frouin, F.; Buvat, I. LIFEx: A freeware for radiomic feature calculation in multimodality imaging to accelerate advances in the characterization of tumor heterogeneity. Cancer Res. 2018, 78, 4786–4789. [Google Scholar] [CrossRef] [Scilit] [PubMed]
- Tibshirani, R. Regression shrinkage and selection via the lasso. J. R. Stat. Soc. Ser. B 1996, 58, 267–288. [Google Scholar] [CrossRef] [Scilit]
- Vargha, A.; Delaney, H.D. A critique and improvement of the CL common language effect size statistics of McGraw and Wong. J. Educ. Behav. Stat. 2000, 25, 101–132. [Google Scholar] [CrossRef] [Scilit]
- Zhang, G.-M.-Y.; Shi, B.; Sun, H.; Jin, Z.-Y.; Xue, H.-D. Differentiating pheochromocytoma from lipid-poor adrenocortical adenoma by CT texture analysis: Feasibility study. Abdom. Radiol. 2017, 42, 2305–2313. [Google Scholar] [CrossRef] [Scilit]
- Yi, X.; Guan, X.; Chen, C.; Zhang, Y.; Zhang, Z.; Li, M.; Liu, P.; Yu, A.; Long, X.; Liu, L.; et al. Adrenal incidentaloma: Machine learning-based quantitative texture analysis of unenhanced CT can effectively differentiate sPHEO from lipid-poor adrenal adenoma. J. Cancer 2018, 9, 3577–3582. [Google Scholar] [CrossRef] [Scilit]
- Shi, B.; Zhang, G.-M.-Y.; Xu, M.; Jin, Z.-Y.; Sun, H. Distinguishing metastases from benign adrenal masses: What can CT texture analysis do? Acta Radiol. 2019, 60, 1553–1561. [Google Scholar] [CrossRef] [Scilit]
- Yu, H.; Parakh, A.; Blake, M.; McDermott, S. Texture analysis as a radiomic marker for differentiating benign from malignant adrenal tumors. J. Comput. Assist. Tomogr. 2020, 44, 766–771. [Google Scholar] [CrossRef] [Scilit]
- Moawad, A.W.; Ahmed, A.; Fuentes, D.T.; Hazle, J.D.; Habra, M.A.; Elsayes, K.M. Machine learning-based texture analysis for differentiation of radiologically indeterminate small adrenal tumors on adrenal protocol CT scans. Abdom. Radiol. 2021, 46, 4853–4863. [Google Scholar] [CrossRef] [Scilit] [PubMed]
- Andersen, M.B.; Bodtger, U.; Andersen, I.R.; Thorup, K.S.; Ganeshan, B.; Rasmussen, F. Metastases or benign adrenal lesions in patients with histopathological verification of lung cancer: Can CT texture analysis distinguish? Eur. J. Radiol. 2021, 138, 109664. [Google Scholar] [CrossRef] [Scilit] [PubMed]
- Zhang, B.; Zhang, H.; Li, X.; Jin, S.; Yang, J.; Pan, W.; Dong, X.; Chen, J.; Ji, W. Can radiomics provide additional diagnostic value for identifying adrenal lipid-poor adenomas from non-adenomas on unenhanced CT? Front. Oncol. 2022, 12, 888778. [Google Scholar] [CrossRef] [Scilit]
- Liu, H.; Guan, X.; Xu, B.; Zeng, F.; Chen, C.; Yin, H.L.; Yi, X.; Peng, Y.; Chen, B.T. Computed tomography-based machine learning differentiates adrenal pheochromocytoma from lipid-poor adenoma. Front. Endocrinol. 2022, 13, 833413. [Google Scholar] [CrossRef] [Scilit]
- Maggio, R.; Messina, F.; D’Arrigo, B.; Maccagno, G.; Lardo, P.; Palmisano, C.; Poggi, M.; Monti, S.; Matarazzo, I.; Laghi, A.; et al. Machine learning-based texture analysis in the characterization of cortisol secreting vs. non-secreting adrenocortical incidentalomas in CT scan. Front. Endocrinol. 2022, 13, 873189. [Google Scholar] [CrossRef] [Scilit]
- O’Shea, A.; Kilcoyne, A.; McDermott, E.; O’Grady, M.; McDermott, S. Can radiomic feature analysis differentiate adrenal metastases from lipid-poor adenomas on single-phase contrast-enhanced CT abdomen? Clin. Radiol. 2022, 77, e711–e718. [Google Scholar] [CrossRef] [Scilit] [PubMed]
- Winkelmann, M.T.; Gassenmaier, S.; Walter, S.S.; Artzner, C.; Lades, F.; Faby, S.; Nikolaou, K.; Bongers, M.N. Differentiation of adrenal adenomas from adrenal metastases in single-phased staging dual-energy CT and radiomics. Diagn. Interv. Radiol. 2022, 28, 208–216. [Google Scholar] [CrossRef] [Scilit]
- Altay, C.; Başara Akın, I.; Özgül, A.H.; Adıyaman, S.C.; Yener, A.S.; Seçil, M. Machine learning analysis of adrenal lesions: Preliminary study evaluating texture analysis in the differentiation of adrenal lesions. Diagn. Interv. Radiol. 2023, 29, 234–243. [Google Scholar] [CrossRef] [Scilit] [PubMed]
- Xiao, D.-X.; Zhong, J.-P.; Peng, J.-D.; Fan, C.-G.; Wang, X.-C.; Wen, X.-L.; Liao, W.-W.; Wang, J.; Yin, X.-F. Machine learning for differentiation of lipid-poor adrenal adenoma and subclinical pheochromocytoma based on multiphase CT imaging radiomics. BMC Med. Imaging 2023, 23, 159. [Google Scholar] [CrossRef] [Scilit] [PubMed]
- Feliciani, G.; Serra, F.; Menghi, E.; Ferroni, F.; Sarnelli, A.; Feo, C.; Zatelli, M.C.; Ambrosio, M.R.; Giganti, M.; Carnevale, A. Radiomics in the characterization of lipid-poor adrenal adenomas at unenhanced CT: Time to look beyond usual density metrics. Eur. Radiol. 2024, 34, 422–432. [Google Scholar] [CrossRef] [Scilit]
- Feliciani, G.; Mascolo, F.; Cossu, A.; Urso, L.; Feletti, F.; Menghi, E.; Sarnelli, A.; Ambrosio, M.R.; Giganti, M.; Carnevale, A. Radiomics results for adrenal mass characterization are stable and reproducible under different software. Life 2025, 15, 560. [Google Scholar] [CrossRef] [Scilit]
- Xie, X.; Ma, S.-X.; Luo, X.-D.; Liao, D.-Y.; Han, D.; Huang, Z.-P.; Chen, Z.-H.; Li, X.-P.; Li, B.; Hu, S.-D.; et al. Automatic recognition of adrenal incidentalomas using a two-stage cascade network: A multicenter study. Ann. Med. 2025, 57, 2540596. [Google Scholar] [CrossRef] [Scilit]
- Cao, L.; Yang, H.; Yao, D.; Cai, H.; Wu, H.; Yu, Y.; Zhu, L.; Xu, W.; Liu, Y.; Li, J. Clinical-imaging-radiomic nomogram based on unenhanced CT effectively predicts adrenal metastases in patients with lung cancer with small hyperattenuating adrenal incidentalomas. Oncol. Lett. 2024, 28, 340. [Google Scholar] [CrossRef] [Scilit]
- Yi, X.; Guan, X.; Zhang, Y.; Liu, L.; Long, X.; Yin, H.; Wang, Z.; Li, X.; Liao, W.; Chen, B.T.; et al. Radiomics improves efficiency for differentiating subclinical pheochromocytoma from lipid-poor adenoma: A predictive, preventive and personalized medical approach in adrenal incidentalomas. EPMA J. 2018, 9, 421–429. [Google Scholar] [CrossRef] [Scilit]
- Ho, L.M.; Samei, E.; Mazurowski, M.A.; Zheng, Y.; Allen, B.C.; Nelson, R.C.; Marin, D. Can texture analysis be used to distinguish benign from malignant adrenal nodules on unenhanced CT, contrast-enhanced CT, or in-phase and opposed-phase MRI? AJR Am. J. Roentgenol. 2019, 212, 554–561. [Google Scholar] [CrossRef] [Scilit]
- Elmohr, M.M.; Fuentes, D.; Habra, M.A.; Bhosale, P.R.; Qayyum, A.A.; Gates, E.; Morshid, A.I.; Hazle, J.D.; Elsayes, K.M. Machine learning-based texture analysis for differentiation of large adrenal cortical tumours on CT. Clin. Radiol. 2019, 74, 818.e1–818.e7. [Google Scholar] [CrossRef] [Scilit]
- Torresan, F.; Crimì, F.; Ceccato, F.; Zavan, F.; Barbot, M.; Lacognata, C.; Motta, R.; Armellin, C.; Scaroni, C.; Quaia, E.; et al. Radiomics: A new tool to differentiate adrenocortical adenoma from carcinoma. BJS Open 2021, 5, zraa061. [Google Scholar] [CrossRef] [Scilit]
- Kong, J.; Zheng, J.; Wu, J.; Wu, S.; Cai, J.; Diao, X.; Xie, W.; Chen, X.; Yu, H.; Huang, L.; et al. Development of a radiomics model to diagnose pheochromocytoma preoperatively: A multicenter study with prospective validation. J. Transl. Med. 2022, 20, 31. [Google Scholar] [CrossRef] [Scilit]
- Ferro, M.; Tataru, O.S.; Carrieri, G.; Busetto, G.M.; Falagario, U.G.; Maggi, M.; Crocetto, F.; Barone, B.; Del Giudice, F.; Marchioni, M.; et al. Artificial intelligence and radiomics applications in adrenal lesions: A systematic review. Ther. Adv. Urol. 2025, 17, 17562872251352553. [Google Scholar] [CrossRef] [Scilit]
- Liu, X.; Liu, H.; Gao, C.; Zeng, W. Comparison of 68Ga-FAPI and 18F-FDG PET/CT for the diagnosis of primary and metastatic lesions in abdominal and pelvic malignancies: A systematic review and meta-analysis. Front. Oncol. 2023, 13, 1093861. [Google Scholar] [CrossRef] [Scilit]
- He, Q.; Kong, X.; Meng, X.; Shen, X.; Li, N. The value of PET/CT-based radiomics in predicting adrenal metastases in patients with cancer. Diagnostics 2025, 15, 1356. [Google Scholar] [CrossRef] [Scilit]
- Reginelli, A.; Vacca, G.; Belfiore, M.; Sangiovanni, A.; Nardone, V.; Vanzulli, A.; Grassi, R.; Cappabianca, S. Pitfalls and differential diagnosis on adrenal lesions: Current concepts in CT/MR imaging: A narrative review. Gland Surg. 2020, 9, 2331–2342. [Google Scholar] [CrossRef] [Scilit]
- Barat, M.; Cottereau, A.-S.; Gaujoux, S.; Tenenbaum, F.; Sibony, M.; Bertherat, J.; Libé, R.; Gaillard, M.; Jouinot, A.; Assié, G.; et al. Adrenal mass characterization in the era of quantitative imaging: State of the art. Cancers 2022, 14, 569. [Google Scholar] [CrossRef] [Scilit] [PubMed]
- Liu, M.-S.; Lou, Y.; Chen, H.; Wang, Y.-J.; Zhang, Z.-W.; Li, P.; Zhu, D.-L. Performance of DHEAS as a screening test for autonomous cortisol secretion in adrenal incidentalomas: A prospective study. J. Clin. Endocrinol. Metab. 2022, 107, e1789–e1796. [Google Scholar] [CrossRef] [Scilit] [PubMed]
- Evangelista, L.; Crimì, F.; Visentin, A.; Voltan, G.; Trentin, L.; Lacognata, C.; Cecchin, D.; Ceccato, F. [18F]FDG PET/CT and PET/MR in patients with adrenal lymphoma: A systematic review of literature and a collection of cases. Curr. Oncol. 2022, 29, 7887–7899. [Google Scholar] [CrossRef] [Scilit] [PubMed]
- Grazzini, G.; Pradella, S.; De Litteris, F.; Galluzzo, A.; Anichini, M.; Treballi, F.; Bicci, E.; Miele, V. Adrenal mass evaluation: Suspicious radiological signs of malignancy. Cancers 2025, 17, 849. [Google Scholar] [CrossRef] [Scilit]
- Stanzione, A.; Cuocolo, R.; Bombace, C.; Pesce, I.; Mainolfi, C.G.; De Giorgi, M.; Delli Paoli, G.; La Selva, P.; Petrone, J.; Camera, L.; et al. Prediction of 2-[18F]FDG PET-CT SUVmax for adrenal mass characterization: A CT radiomics feasibility study. Cancers 2023, 15, 3439. [Google Scholar] [CrossRef] [Scilit] [PubMed]
- Romanisio, M.; Daffara, T.; Pitino, R.; Ferrero, A.; Pizzolitto, F.; Zavattaro, M.; Biello, F.; Gennari, A.; Volpe, A.; Sacchetti, G.M.; et al. [18F]FDG-PET/CT in adrenal lesions: Diagnostic performance in different clinical settings. Endocrine 2025, 87, 325–333. [Google Scholar] [CrossRef] [Scilit] [PubMed]
- Mongan, J.; Moy, L.; Kahn, C.E., Jr. Checklist for artificial intelligence in medical imaging (CLAIM): A guide for authors and reviewers. Radiol. Artif. Intell. 2020, 2, e200029. [Google Scholar] [CrossRef] [Scilit] [PubMed]
- Collins, G.S.; Moons, K.G.M.; Dhiman, P.; Riley, R.D.; Beam, A.L.; Van Calster, B.; Ghassemi, M.; Liu, X.; Reitsma, J.B.; van Smeden, M.; et al. TRIPOD+AI statement: Updated guidance for reporting clinical prediction models that use regression or machine learning methods. BMJ 2024, 385, e078378. [Google Scholar] [CrossRef] [Scilit]

Disclaimer/Publisher’s Note: The statements, opinions and data contained in all publications are solely those of the individual author(s) and contributor(s) and not of MDPI and/or the editor(s). MDPI and/or the editor(s) disclaim responsibility for any injury to people or property resulting from any ideas, methods, instructions or products referred to in the content. |
© 2026 by the authors. Licensee MDPI, Basel, Switzerland. This article is an open access article distributed under the terms and conditions of the Creative Commons Attribution (CC BY) license.