


Abstract
This study evaluates the pyrolysis of recycled linear low-density and low-density polyethylene (rLLDPE/rLDPE) blends for producing wax suitable as a precursor for corrosion-resistant coatings. Experiments were performed in a horizontal quartz tubular reactor under argon, and we investigated different pyrolysis temperature (400, 450, 500 °C), residence time (45, 60, 75 min), and heating rate (3, 5, 10 °C min−1). Factorial design and response surface methodology (RSM) were applied to quantify factors and optimize wax yield. Analysis of Variance (ANOVA) indicated statistically significant models (p < 0.05), with heating rate having the highest standardized effect. The highest measured yield was 82% at 400 °C, 75 min, and 3 °C min−1; the DOE optimizer predicted an 84% yield at 400 °C, 45 min, and 3 °C min−1. Product quality was assessed by GC-MS analysis, which showed that the waxes were predominantly composed of 1-alkenes and n-alkanes (C9–C32), consistent with the literature and closely matching compositions of commercial waxes. Overall, slow heating at low temperature with short residence time maximized wax yield without compromising quality, confirming that pyrolysis of recycled PE is a viable route to produce high-yield, specification-consistent waxes suitable for protective coating applications.
1. Introduction
Global demand for thermoplastics continues to accelerate, with worldwide production projected to reach 445 million metric tons (MMT) in 2025 and 590 MMT by 2050, an increase of over 30% relative to 2025 levels [1]. Historically, polymer production expanded from 270 MMT in 2010 to nearly 370 MMT by 2020, underscoring plastics’ centrality across packaging, transportation, construction, and consumer goods [1,2,3]. This growth is driven by the versatility, durability, and cost-effectiveness of polymer materials. Yet, these very attributes, combined with environmental persistence, improper post-consumer disposal, and inefficiencies in municipal solid waste management, have amplified the pervasive issue of plastic pollution [3,4,5]. In response to the escalating environmental burden posed by plastic pollution, recycling, both mechanical and chemical, has emerged as a central strategy for mitigating waste accumulation and reducing dependence on virgin polymer feedstocks.
Despite the promise of recycling, the recycling process implementation remains suboptimal. As of 2019, only 9% of global plastic waste (353 MMT) was effectively recycled, and secondary polymers represented just 6% (29 MMT) of total polymer feedstock in new production [6]. Moreover, innovation in plastics recycling has lagged relative to overall plastics technology, comprising only 1.2% of plastics-related developments, hindered by inadequate source segregation, low and variable quality of recovered resins, and unfavorable unit economics [7]. Polyethylene grades, such as linear low-density polyethylene (LLDPE) and low-density polyethylene (LDPE), are widely used due to their processability and mechanical performance; however, their end-of-life handling remains difficult. LLDPE/LDPE waste streams often contain mixed branching structures and variable compositions, which influence degradation behavior during thermal treatment. Differences in molecular architecture (linear versus highly branched chains) can influence pyrolysis pathways, impacting product distribution, wax selectivity, and molecular-weight profiles of the condensable fractions [8,9].
Two main plastic recycling pathways exist: closed-loop and open-loop (also termed primary/mechanical and secondary/tertiary routes) [10,11,12,13]. Closed-loop recycling retains material properties for reuse in similar applications (e.g., bottle-to-bottle) under low contamination [14], whereas open-loop recycling accepts property changes for alternative applications (e.g., textile fibers) [15]. Additional value-recovery routes include polymer recovery, chemical feedstock production, syngas/biomass generation, and energy recovery. Mechanical recycling is cost-effective but limited by degradation and heterogeneity, while dissolution methods yield high-quality fractions but require complex solvent handling. Chemical recycling, especially pyrolysis and solvolysis, enables conversion of mixed plastics into oils, waxes, or monomers, supporting circularity despite higher energy demands [16,17,18,19,20].
Pyrolysis is an advanced thermal process that converts polymers into gases, condensable liquids, waxes, and char under inert conditions, typically between 300 and 800 °C [21]. Product distribution is governed by reactor configuration, temperature, heating rate, and vapor residence time, making the process particularly suitable for heterogeneous or contaminated plastic streams that challenge mechanical recycling [22]. For post-consumer multilayer films rich in LLDPE/LDPE, pyrolysis represents a technically feasible valorization route because it tolerates feed variability while enabling recovery of higher-value products. While many studies focus on maximizing liquid fuels, controlling wax selectivity in non-catalytic pyrolysis of recycled LLDPE/LDPE blends remains insufficiently understood, especially under low-severity conditions that suppress secondary cracking.
In polyethylene systems, product formation results from competition between primary chain scission, which produces heavy oligomers that condense into oils/waxes, and secondary reactions that generate lighter gases or char. Temperature and heating rate influence radical lifetimes and reaction conditions, while vapor residence time governs exposure to secondary cracking and aromatization pathways. Process conditions therefore direct selectivity among waxes, oils, gases, and char. Studies such as Donaj et al. demonstrated temperature-driven shifts in product volatility in mixed-polyolefin pyrolysis, while Kaminsky et al. and Demirbas reported similar liquid yields at higher temperatures with varying light-fraction formation [23,24,25]. Industrial systems (e.g., BP and BASF) further confirm the scalability of thermal and catalytic cracking for polyolefin-rich waste [26]. However, explicit optimization targeting high-yield wax from non-catalytic pyrolysis of LLDPE/LDPE blends, representative of multilayer film waste, remains relatively unexplored.
Because temperature, heating rate, and residence time interact non-linearly, Design of Experiments (DOE) combined with response surface methodology (RSM) provides a rigorous framework to map curvature, quantify interactions, and identify statistically defensible operating windows. RSM approaches, including central composite, Box–Behnken, and face-centered designs, enable efficient optimization using quadratic models and ANOVA. Prior DOE/RSM studies on other polymers provide methodological foundations: Selvaganapathy et al. demonstrated dominant temperature and residence-time effects in polystyrene pyrolysis [27], while Kumar and Singh optimized catalytic HDPE pyrolysis for liquid yield [28]. Additional studies involving mixed plastics and polyethylene systems consistently identify temperature as the principal driver of liquid production, with measurable interaction effects among variables [29,30] and hybrid RSM–ANN models further improving predictive capability [31].
Collectively, the literature supports DOE/RSM as a robust optimization strategy for polyolefin pyrolysis; however, most studies emphasize fuel production rather than materials-directed outcomes. In particular, systematic quantification of heating-rate effects and low-condition operating windows for wax-selective, non-catalytic pyrolysis of recycled LLDPE/LDPE blends remains sparse. Addressing this gap motivates the present work, which focuses on identifying statistically optimized conditions for producing high-yield wax and clarifying the relative influence and interactions of temperature, residence time, and heating rate in recycled polyethylene pyrolysis.
This study aims to optimize pyrolysis process parameters, temperature (400, 450, 500 °C), residence time (45, 60, 75 min), and heating rate (3, 5, 10 °C min−1) to maximize the yield and quality of wax recovered from recycled LLDPE/LDPE blends (rPE). The novelty lies in establishing a statistically validated low-condition operating window for wax-selective, non-catalytic pyrolysis, an underexplored pathway compared to conventional fuel-oriented product slates. Using RSM and ANOVA, the study quantitatively evaluates the relative influence and interactions of key process variables, identifying the most critical factors governing wax formation. GC–MS analysis is employed to assess hydrocarbon composition and benchmark the recovered wax against the literature-reported systems, linking process conditions not only to yield but also to compositional characteristics relevant to potential material applications. Rather than demonstrating final coating performance, this work positions the recovered wax as a potential precursor for future materials development, including corrosion-coating applications, while providing a systematic and statistically powered framework for wax-focused recycled polyethylene pyrolysis.
2. Results and Discussion
2.1. Model Development and Validation Using ANOVA
The coefficients involving two factors (e.g., , , ) represent interaction effects, showing how the impact of one factor depends on the level of another. Coefficients on squared terms (e.g., ) capture the quadratic curvature in the response surface. The accuracy of the developed model is assessed using the coefficient of determination , the adjusted , and the standard deviation (model error, ). Here, is the ratio of the regression sum of squares (SSR) to the total sum of squares (SST), indicating the proportion of variability in the response explained by the model, i.e., how closely the fitted values match the observed data. Adjusted corrects for the number of predictors, providing a fairer comparison across models, while quantifies the typical residual size; smaller indicates a tighter fit around the regression surface [32].
As shown in Table 1, the quadratic RSM model is statistically significant (overall F = 13.36, p < 0.001) and explains a substantial share of variation (R2 = 97.46%, adj-R2 = 91.66%, pred-R2 = 93.59%), with a small residual spread (S = 0.124), indicating no collinearity issues. ANOVA decomposition shows the linear block is significant (44.15% SS; F = 17.70, p < 0.001), driven chiefly by heating rate (A: 25.61% SS; F = 30.80, p < 0.001) and temperature (B: 18.26% SS; F = 21.96, p < 0.001), while residence time’s effect is not significant (C: F = 0.83, p = 0.370). Curvature dominates the response (quadratic block 56.77% SS; F = 22.76, p < 0.001), with a particularly strong A2 term (51.57% SS; F = 62.03, p < 0.001) and significant B2 and C2 (both F = 9.83, p = 0.003), confirming a U-shaped surface in each factor. Among interactions (5.87% SS; F = 2.36, p = 0.089), only B×C is significant (F = 5.06, p = 0.031), indicating residence time moderates’ temperature’s effect; while A × B and A × C are negligible. Practically, the signs and magnitudes of the coefficients indicate that increasing heating rate and temperature reduces wax yield, while positive quadratic terms and the B × C trade-off point to an operating region favoring low heating rate, low temperature, and short-to-moderate residence time; thus, the statistical model was developed specifically to optimize condensable wax yield rather than complete product distribution (gas/liquid/char). This approach aligns with the study objective of identifying operating windows favoring wax selectivity.
Table 1.
ANOVA and regression analysis of the models.
2.2. Interaction of Variables on Wax Yield
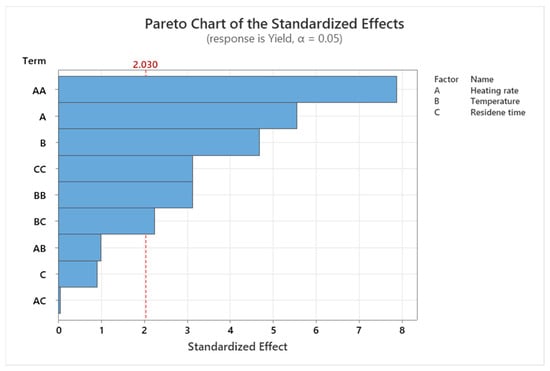
The complete design matrix for 45 experimental runs, including the coded factors of variables, together with the results obtained for wax yield, was used in the determination of all constants in Equation (1). A quadratic model was selected for the response, which is the yield of wax. In Figure 1, the Pareto chart of standardized effects (α = 0.05; critical value = 2.03) shows that the quadratic term in heating rate (A2) is the dominant contributor to wax-yield variability, followed by the linear effects of heating rate (A) and temperature (B). Curvature terms for time (C2) and temperature (B2) are also significant (bars just above the threshold), indicating measurable U-shaped behavior in those factors. The B × C interaction is the only two-factor interaction that is significant, implying that residence time moderates the effect of temperature on yield (i.e., longer time partly offsets losses at higher temperature, and shorter time is favored when the temperature is low). In contrast, A × B, A × C, and the main effect of C fall below the threshold, so residence time has a weak direct (linear) influence and does not materially interact with heating rate. Taken together, the ranking A2 » A > B > C2 ≈ B2 > B × C indicates that yield is most sensitive to the curvature in heating rate and then to the linear severities of heating rate and temperature; this optimization will require slow heating and lower temperature, with time tuned secondarily via the B–C trade-off. The non-significant terms can be omitted for parsimony (retaining hierarchy) without degrading predictive performance.
Figure 1.
Pareto chart of standardized effects.
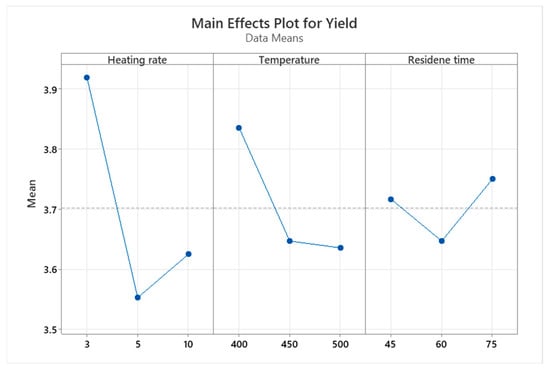
The main-effects plot in Figure 2 shows the same story as the Pareto chart: heating rate (A) is the dominant lever. Yield is highest at the slowest heating (3 °C/min) and drops sharply at 5 °C/min, with only a slight rebound at 10 °C/min, consistent with the large, significant A and A2 bars in the Pareto chart (curvature in A is strongest). Temperature (B) also depresses yield: the mean falls from 76 to 77% at 400 °C to 73% at 500 °C, matching the sizable B and B2 effects. Residence time (C) has the weakest linear influence; its profile is shallow and U-shaped, with a minimum near 60 min and higher means at 45 and 75 min, in line with a small main effect but a noticeable C2 term.
Figure 2.
Main effects plot for wax yield (%).
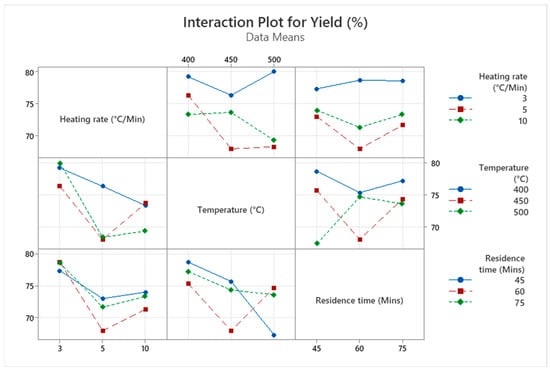
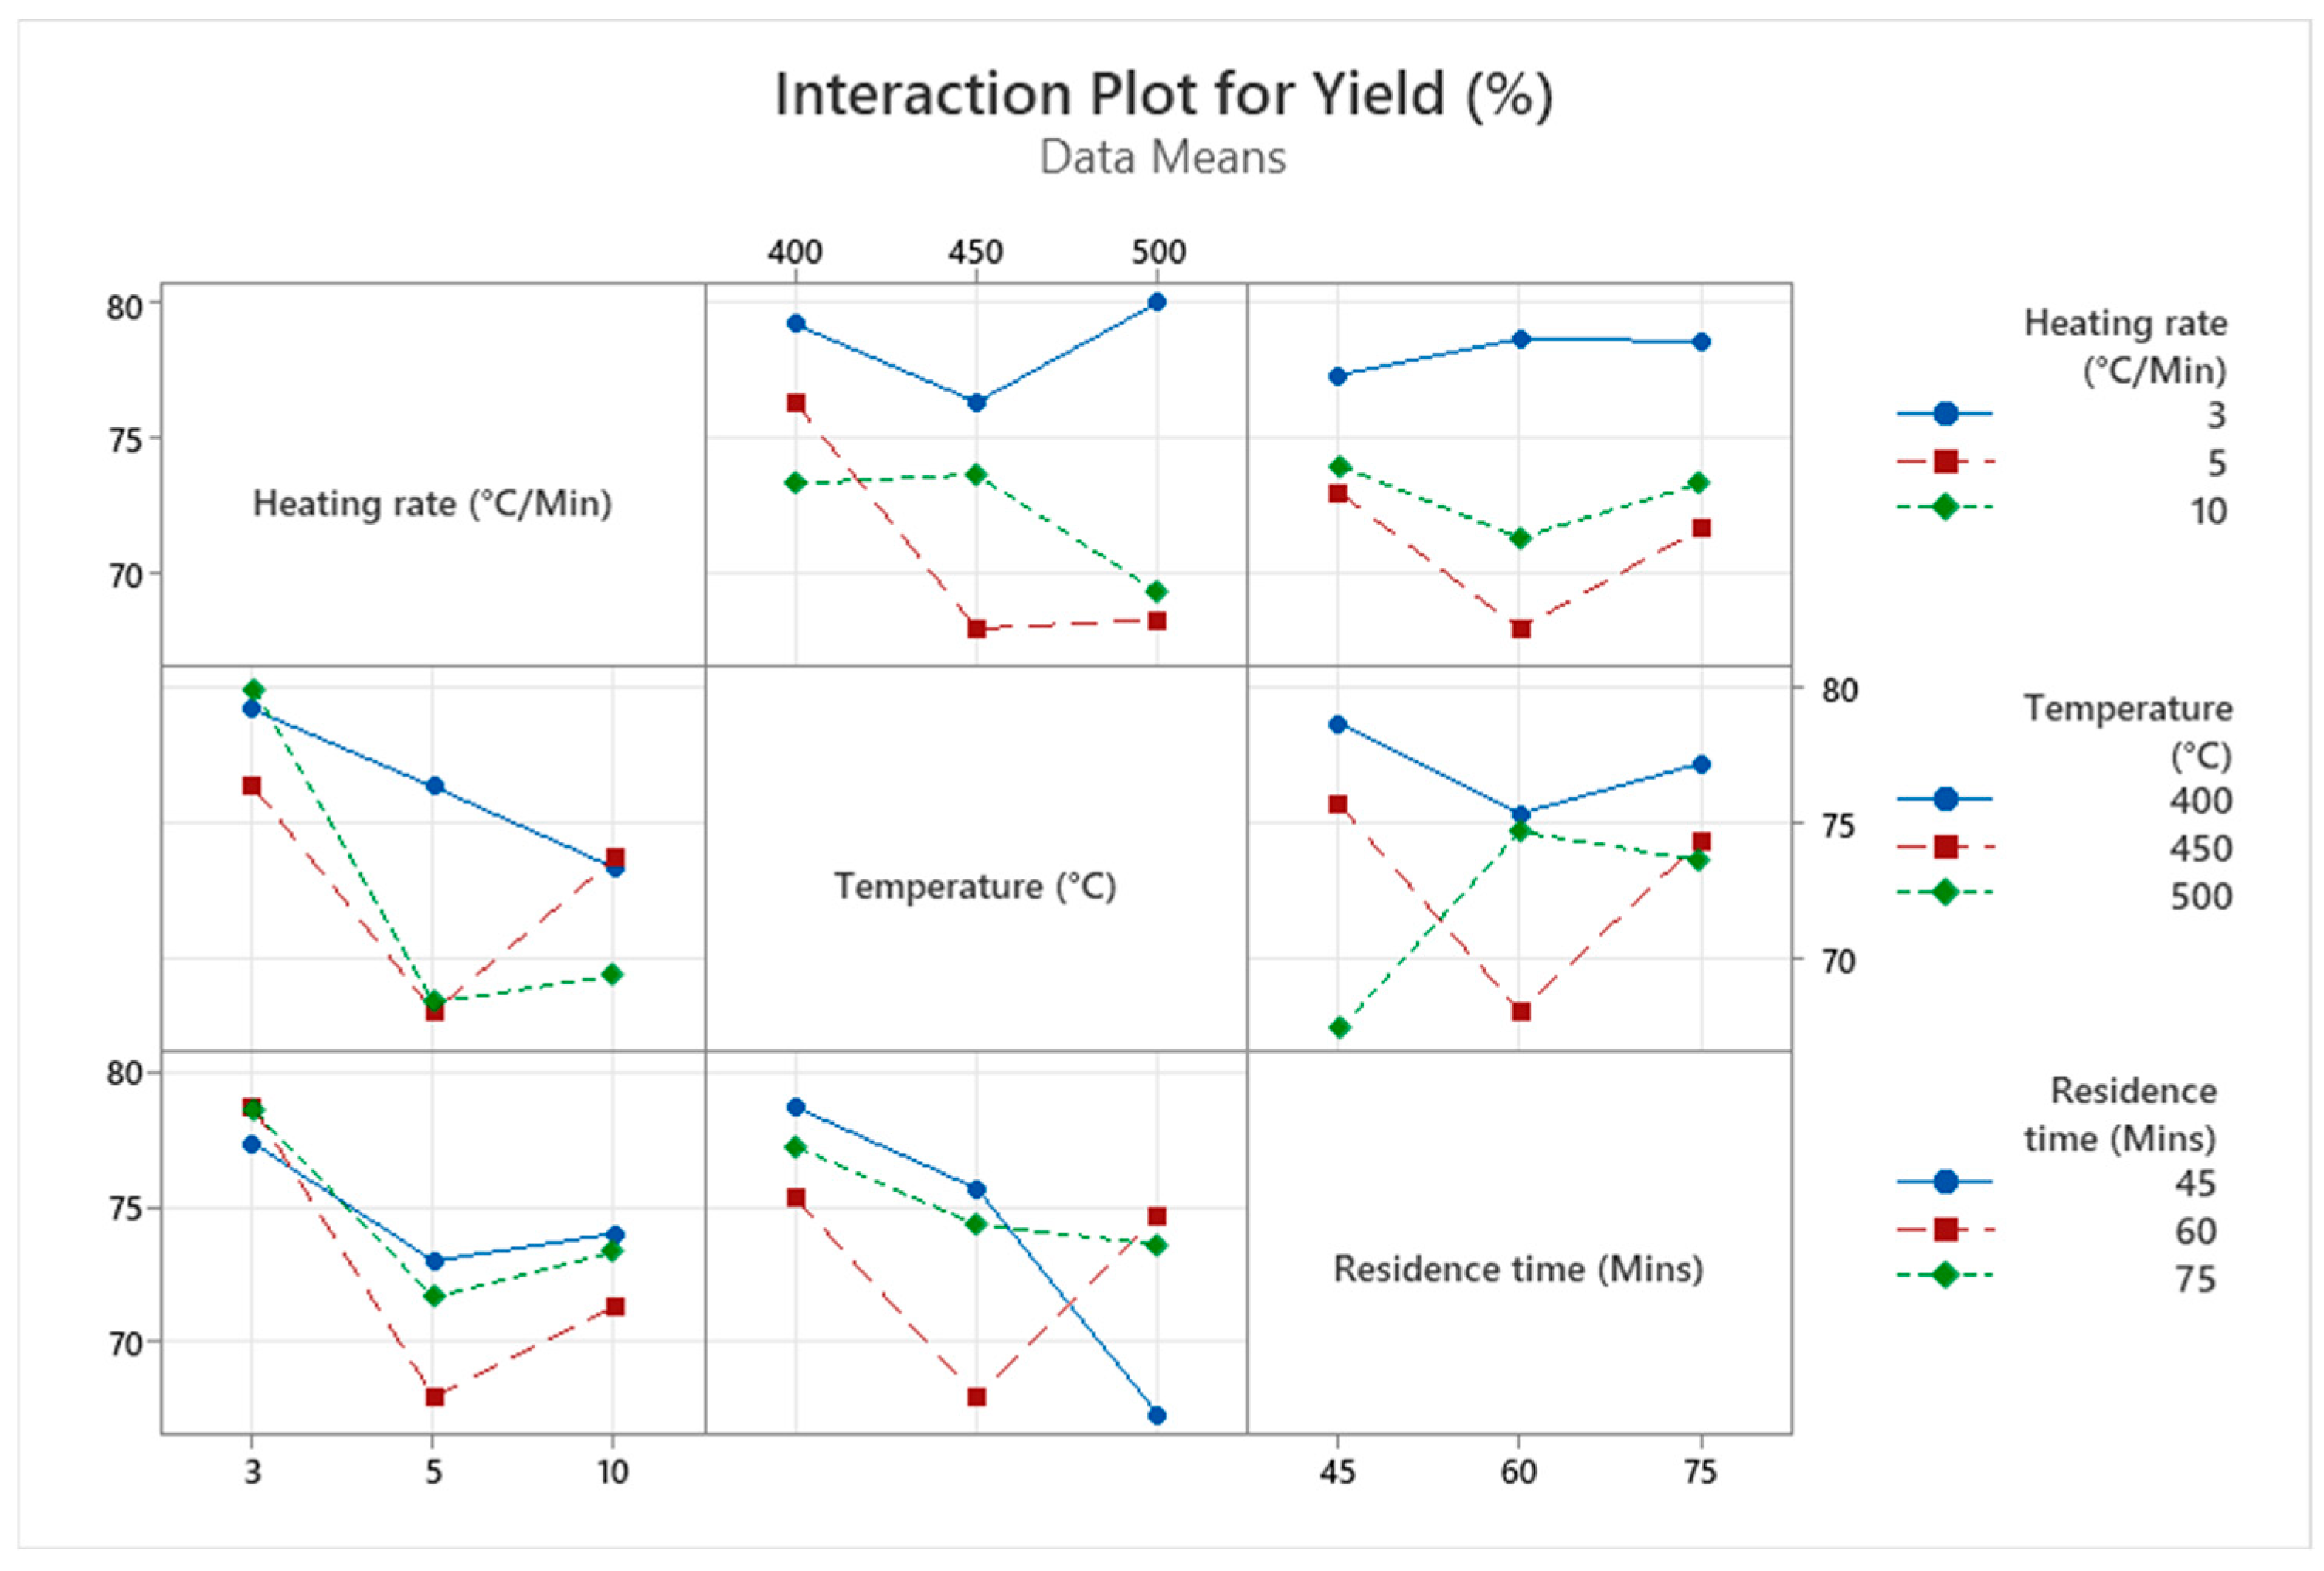
Likewise, the interaction plots in Figure 3 reinforce that B × C is the only practically important interaction: the lines for temperature versus time are clearly non-parallel and cross, indicating that the best residence time depends on temperature (e.g., at 400 °C, a shorter time performs best, whereas at higher temperatures, extending time partly recovers yield). By contrast, the A × B and A × C panels show largely parallel traces, echoing their sub-threshold bars on the Pareto chart. Taken together, the graphs confirm that wax yield is most sensitive to curvature in heating rate, then to temperature severity, with a meaningful B–C trade-off. This points to an operating region of low heating rate, low temperature, and short-to-moderate residence time for maximizing yield within the studied window.
Figure 3.
Interaction plot for wax yield (%).
2.3. Response Surface Plots
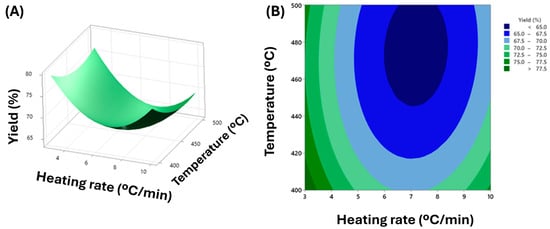
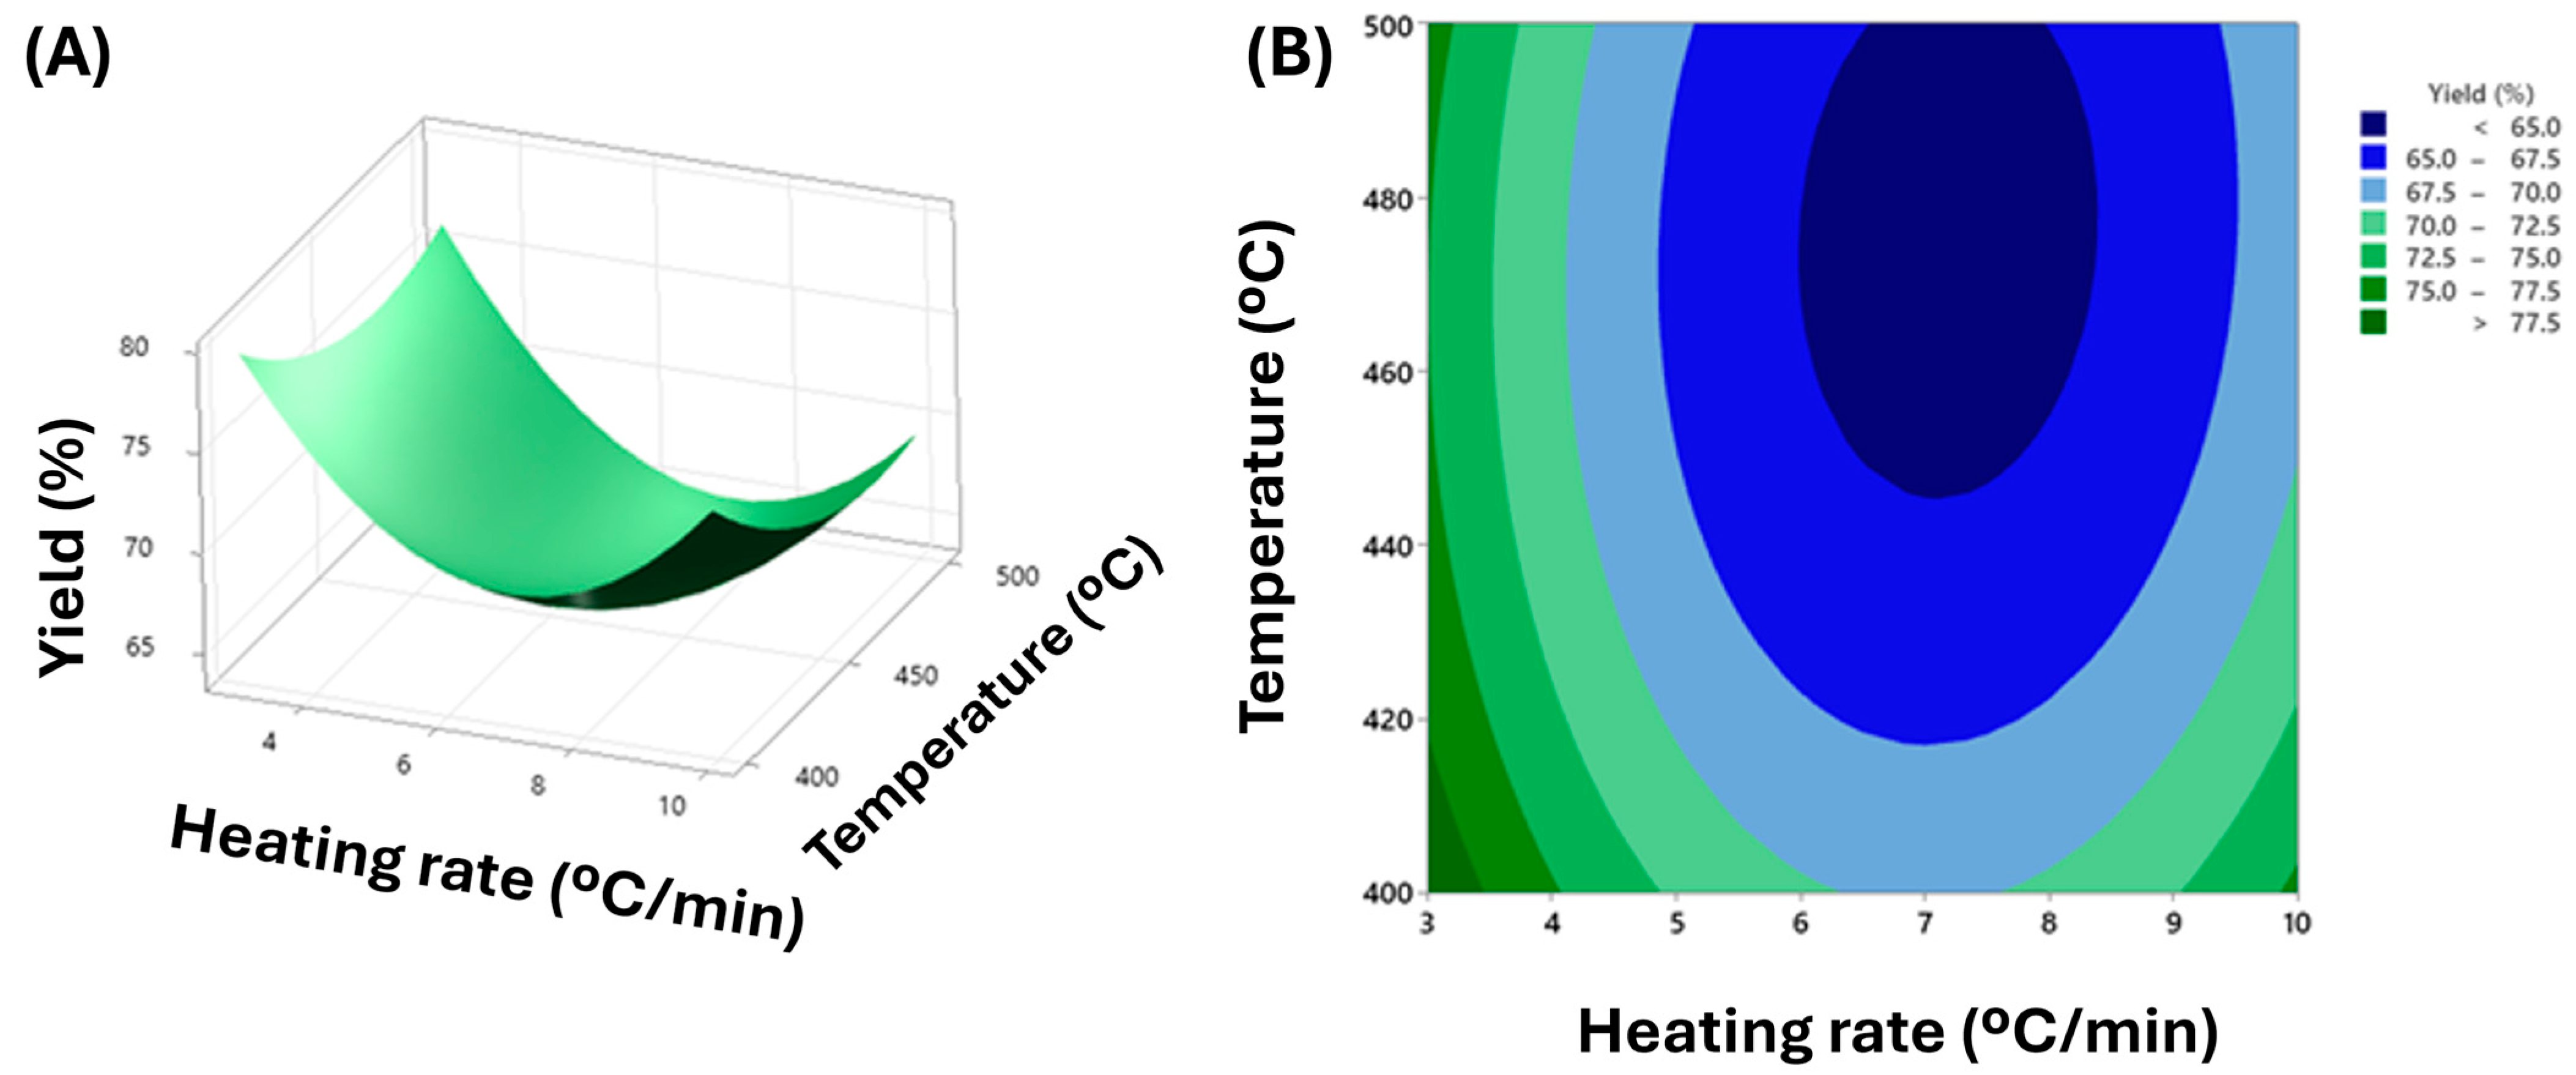
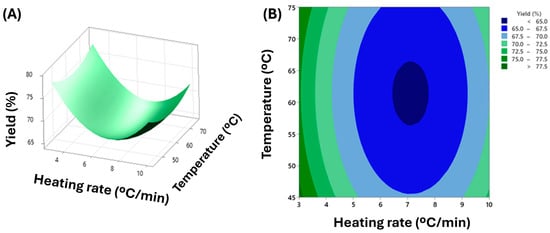
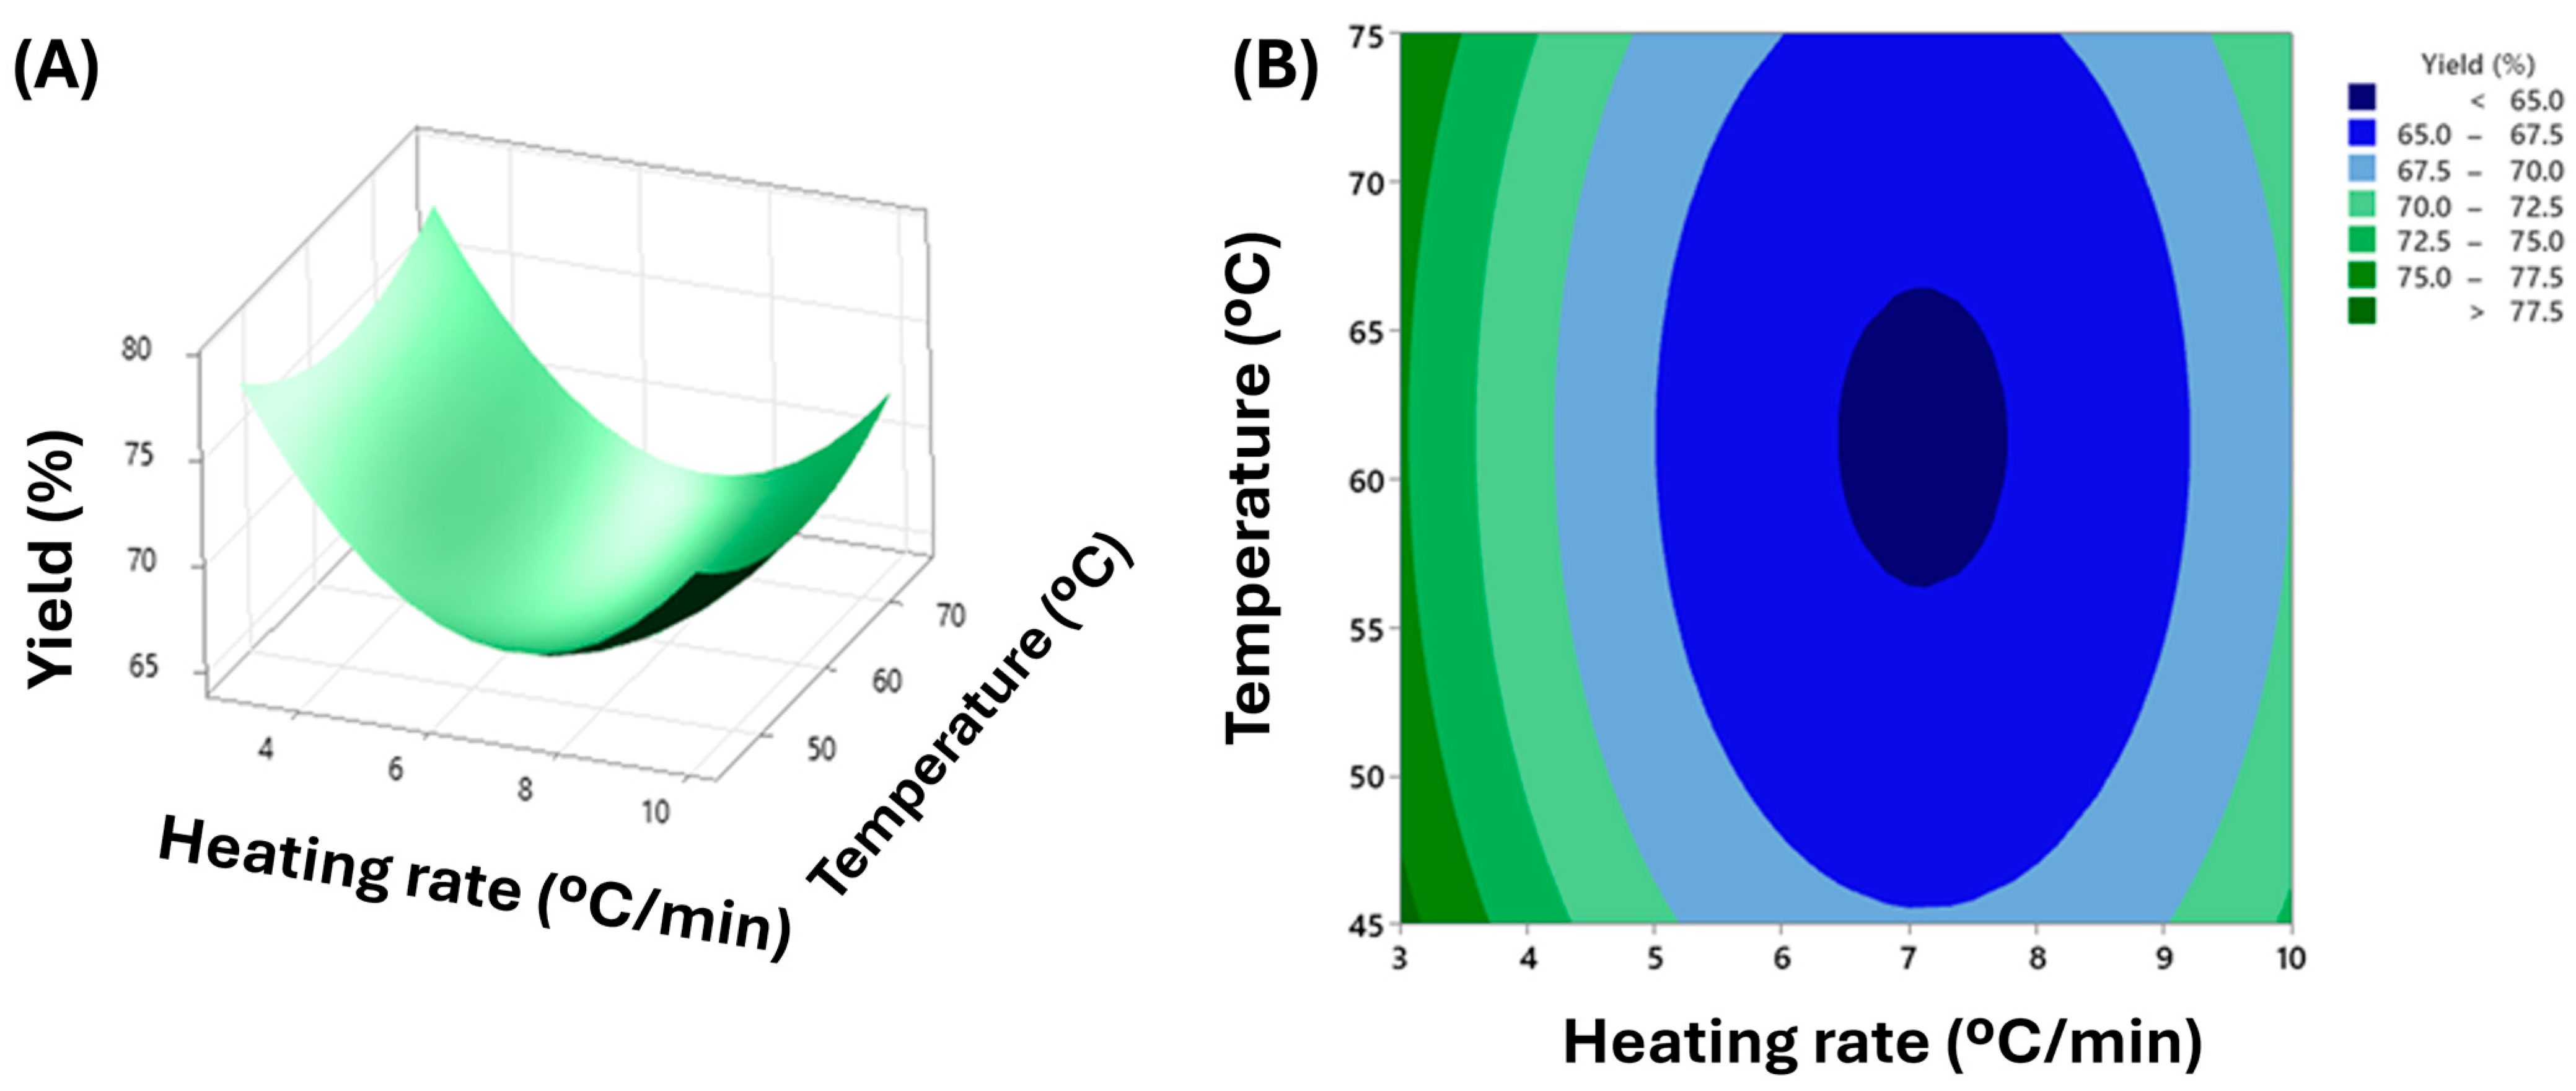
Across the response surfaces and matching contour maps (Figure 4, Figure 5 and Figure 6), the wax-yield landscape is bowl-shaped with a pronounced valley centered near heating rate 6–7 °C min−1 and residence time 60 min, confirming the dominant curvature in heating rate (A2) and the smaller but real curvatures in temperature (B2) and time (C2) indicated by the Pareto chart. When temperature and heating rate vary at C = 60 min (Figure 4), yield is maximized at the low-severity corner, which is the low heating rate (3 °C min−1) and low temperature (400 °C), and declines steeply as either factor increases toward the mid-field, with only a slight recovery at the most severe combinations. This surface mirrors the large standardized effects for A and A2 and the sizable effect for B, showing that kinetics governing secondary cracking intensify more rapidly with temperature than primary depolymerization, thereby reducing heavy-liquid (wax) selectivity at higher conditions, an observation consistent with the PE pyrolysis literature [23,24].
Figure 4.
(A) Surface plot of yield (%) vs. temperature (°C) and heating rate (°C/min). (B) Contour plot of yield (%) vs. temperature (°C) and heating rate (°C/min) when residence time is 60 min.
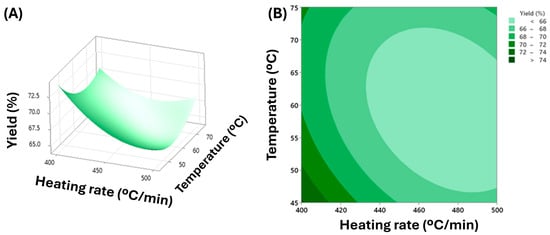
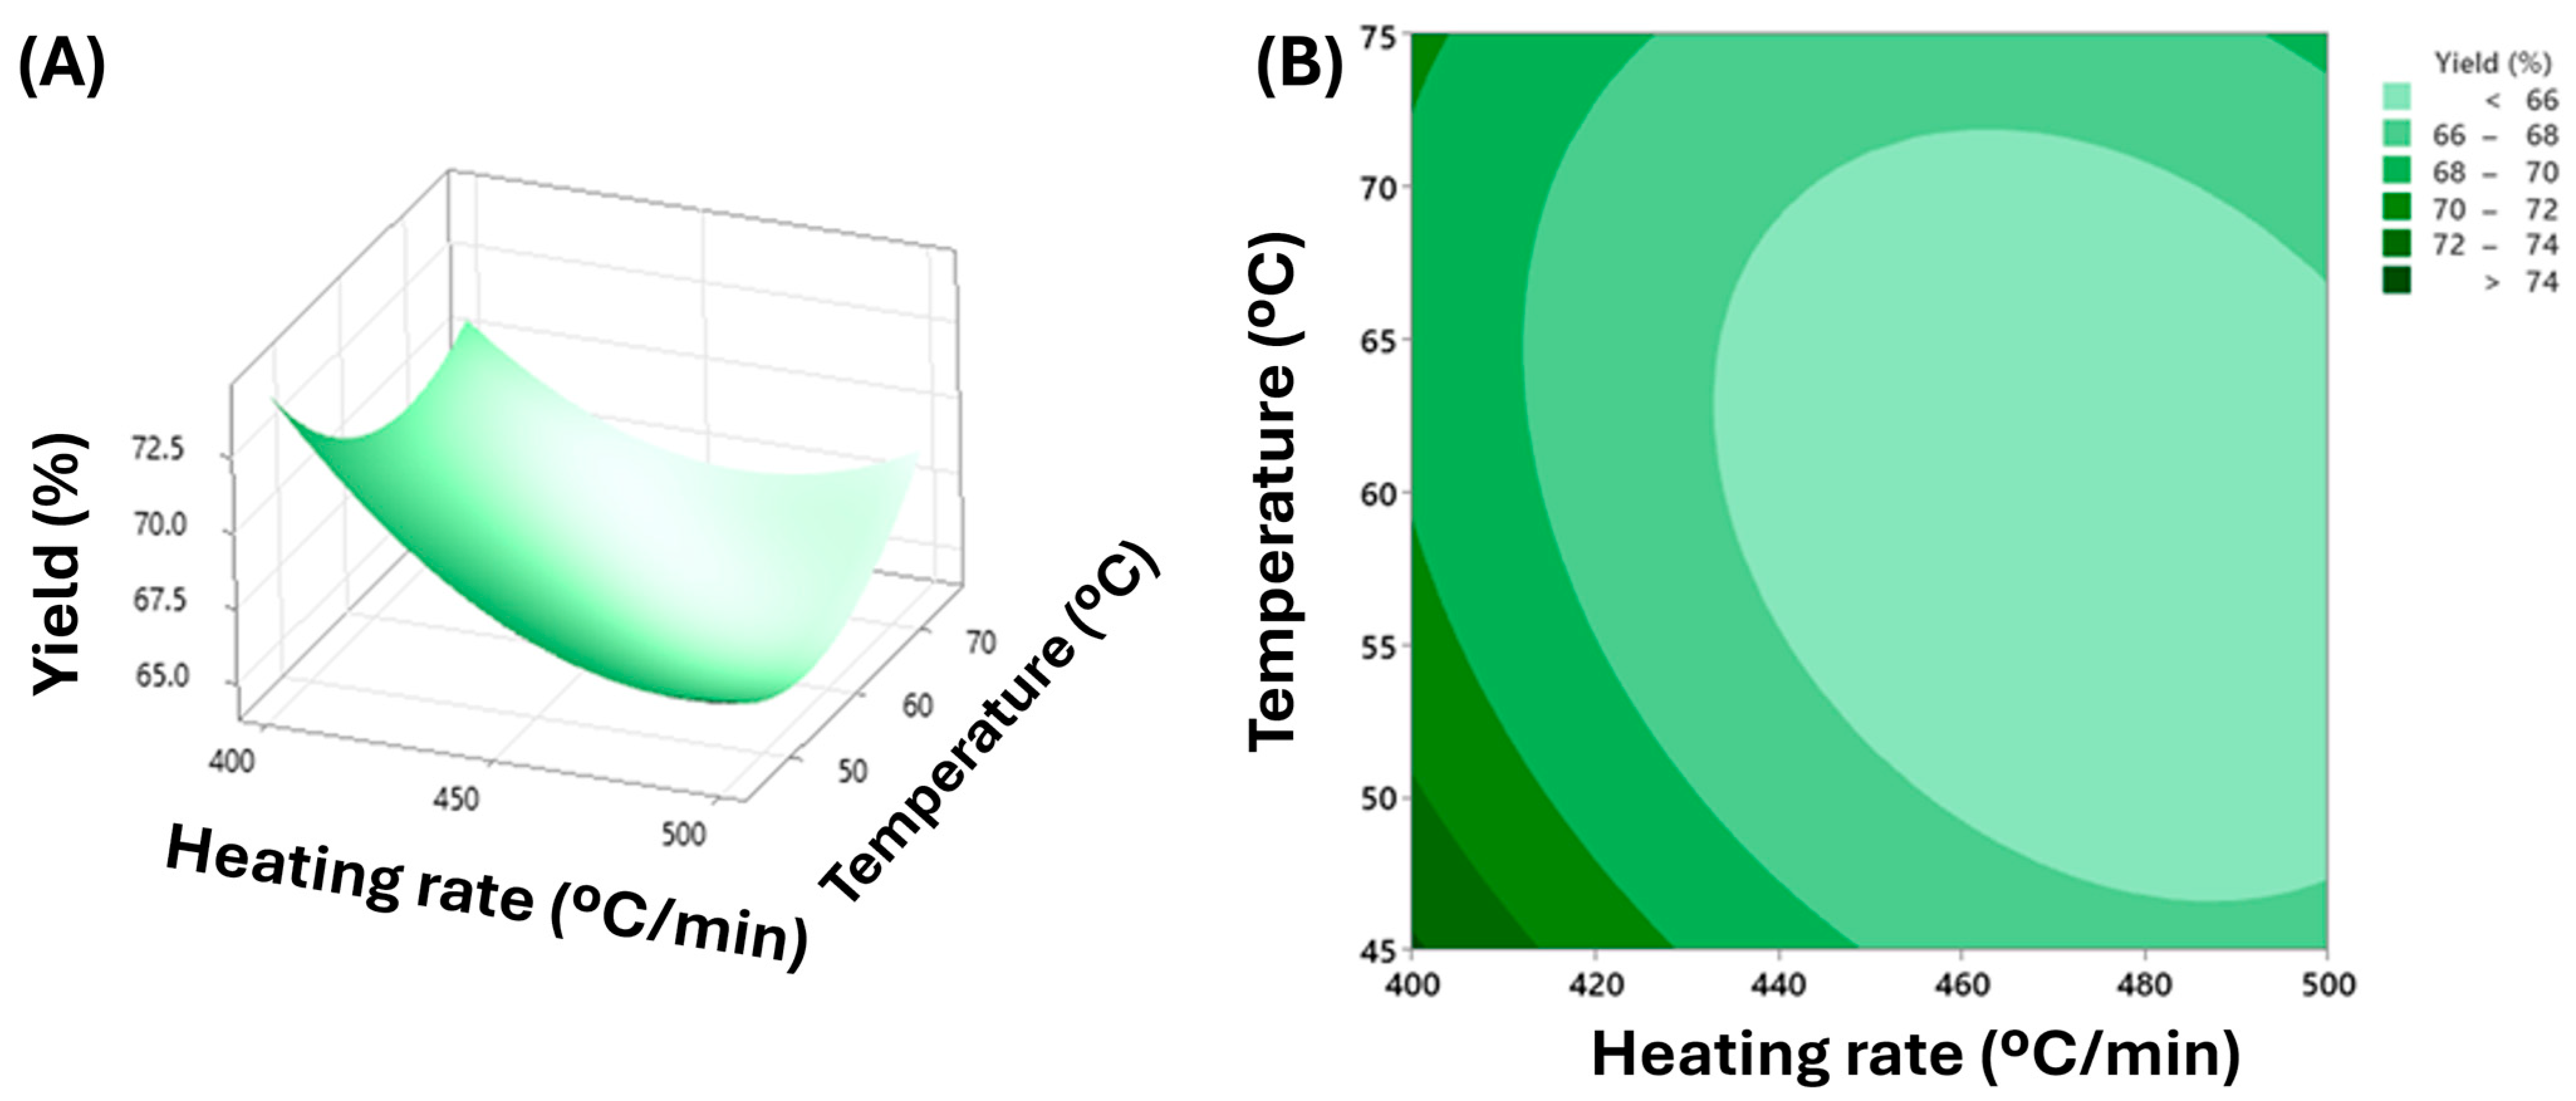
Figure 5.
(A) Surface plot of yield (%) vs. residence time (min) and heating rate (°C/min). (B) Contour plot of yield (%) vs. residence time (min) and heating rate (°C/min) when pyrolysis temperature is 450 °C.
Figure 6.
(A) Surface plot of yield (%) vs. residence time (min) and temperature (°C). (B) Contour plot of yield (%) vs. residence time (min) and temperature (°C) when heating rate is 6.5 °C/min.
With heating rate and time varied at B = 450 °C (Figure 5), the same convex basin appears: yield peaks at slow heating and longer time (75 min), while the minimum sits near 6–7 °C min−1 and 60 min. This pattern aligns with the significant C2 term but weak C main effect: time by itself is not strongly directional, yet moving away from the center (shorter or longer) improves yield at fixed temperature, and the contour’s slight tilt reflects the B×C interaction detected in the DOE; longer time partially compensates for the penalty of moderate temperature by allowing more condensable oligomers to form before over-cracking.
When temperature and time vary at A = 6.5 °C min−1 (Figure 6), yield is highest at low temperature (400 °C) with short (45 min) or long (75 min) residence and lowest near 500 °C, 60 min. The nearly elliptical contours and crossing trend in this panel visualize the significant B × C interaction: at higher temperatures, extending time lifts the yield slightly, whereas at low temperatures, shorter time is preferable, qualitatively the same compensation reported for PE systems where vapor-phase residence controls exposure to secondary scission and aromatization. Taken together, the paired surface/contour graphs corroborate the effect hierarchy from the Pareto chart A2 >> A > B > (C2, B2) > B × C, with A × B and A × C negligible, and point to an operating window that maximizes wax yield at slow heating, low temperature, and short-to-moderate residence time, consistent with mechanistic expectations for non-catalytic rLLDPE/rLDPE pyrolysis.
2.4. Response Optimization: Yield (%)
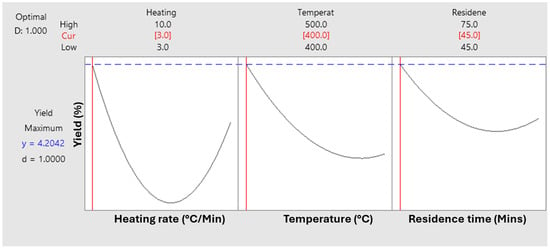
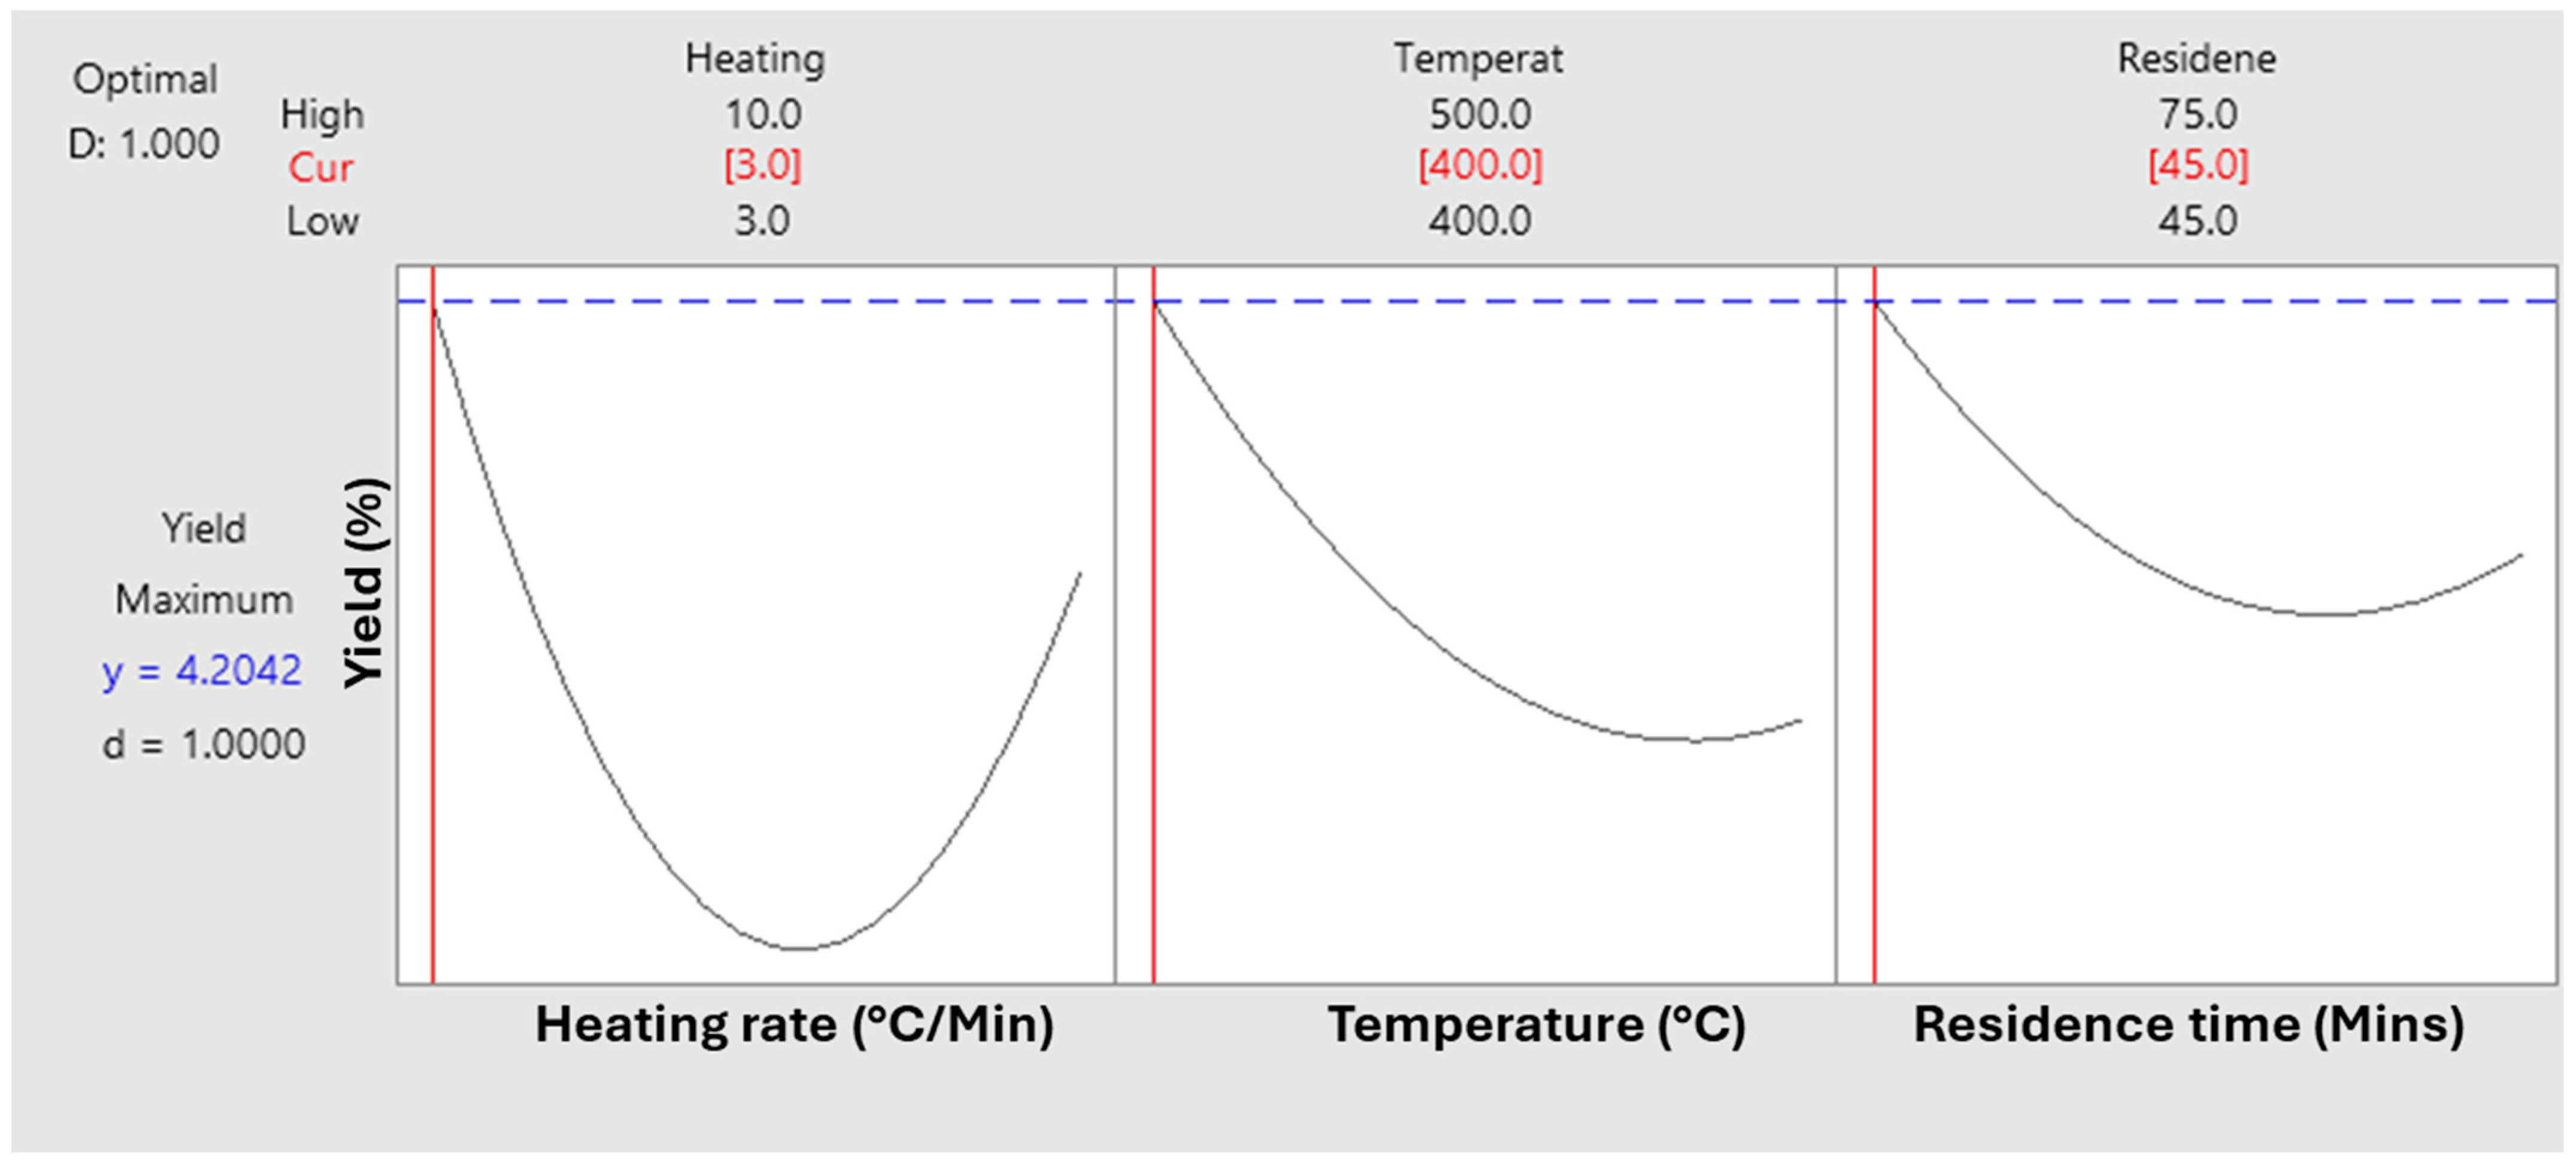
Using the response optimizer (Table 2), the model targeted maximum wax yield with a lower practical target of 64% and an upper of 90% (equal weights/importance). The optimizer selected a heating rate = 3 °C·min−1, a temperature = 400 °C, and a residence time = 45 min, returning a predicted yield = 84.08% with SE = 1.58, 95% CI = [80.87, 87.30], and 95% PI = [78.11, 90.06]; the composite desirability = 0.773, which indicates a strong, though not perfect, operating point (Table 2/Profiler in Figure 7). The profiler curves show classic concave shapes: yield falls sharply as heating rate increases from 3 to 7 °C·min−1 and as temperature rises from 400 to 500 °C, while the residence-time profile is shallow with a minimum around 60 min, which is consistent with our ANOVA/Pareto ranking (A2 >> A > B > C2 ≈ B2; B × C modest). Mechanistically, the optimum conditions (slow heating, low temperature, short time) are consistent with the PE pyrolysis literature, where minimizing secondary cracking/aromatization preserves heavy paraffinic intermediates and increases wax selectivity [23,24]. The narrow CI and realistic PI suggest good local precision with credible experimental variability. Practically, these set-points are attractive because they maximize yield without pushing against hard boundaries, and they align with the interaction observed between temperature and time (at lower temperatures, shorter times are favorable).
Table 2.
Response optimizer.
Figure 7.
Profiler curve for response optimization. The red vertical line in each panel marks the current/optimal setting (“Cur”) of that factor chosen by the optimizer while the other factors are held at their selected settings. Where the red line intersects the curve is the predicted response at that operating point (shown as y on the left).
2.5. GCMS Analysis of rLLDPE/rLDPE Wax
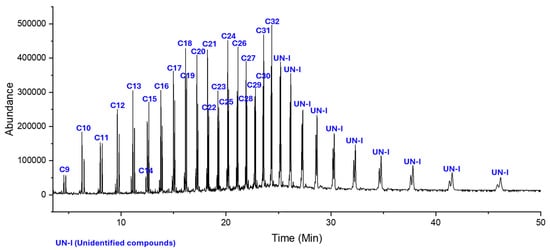
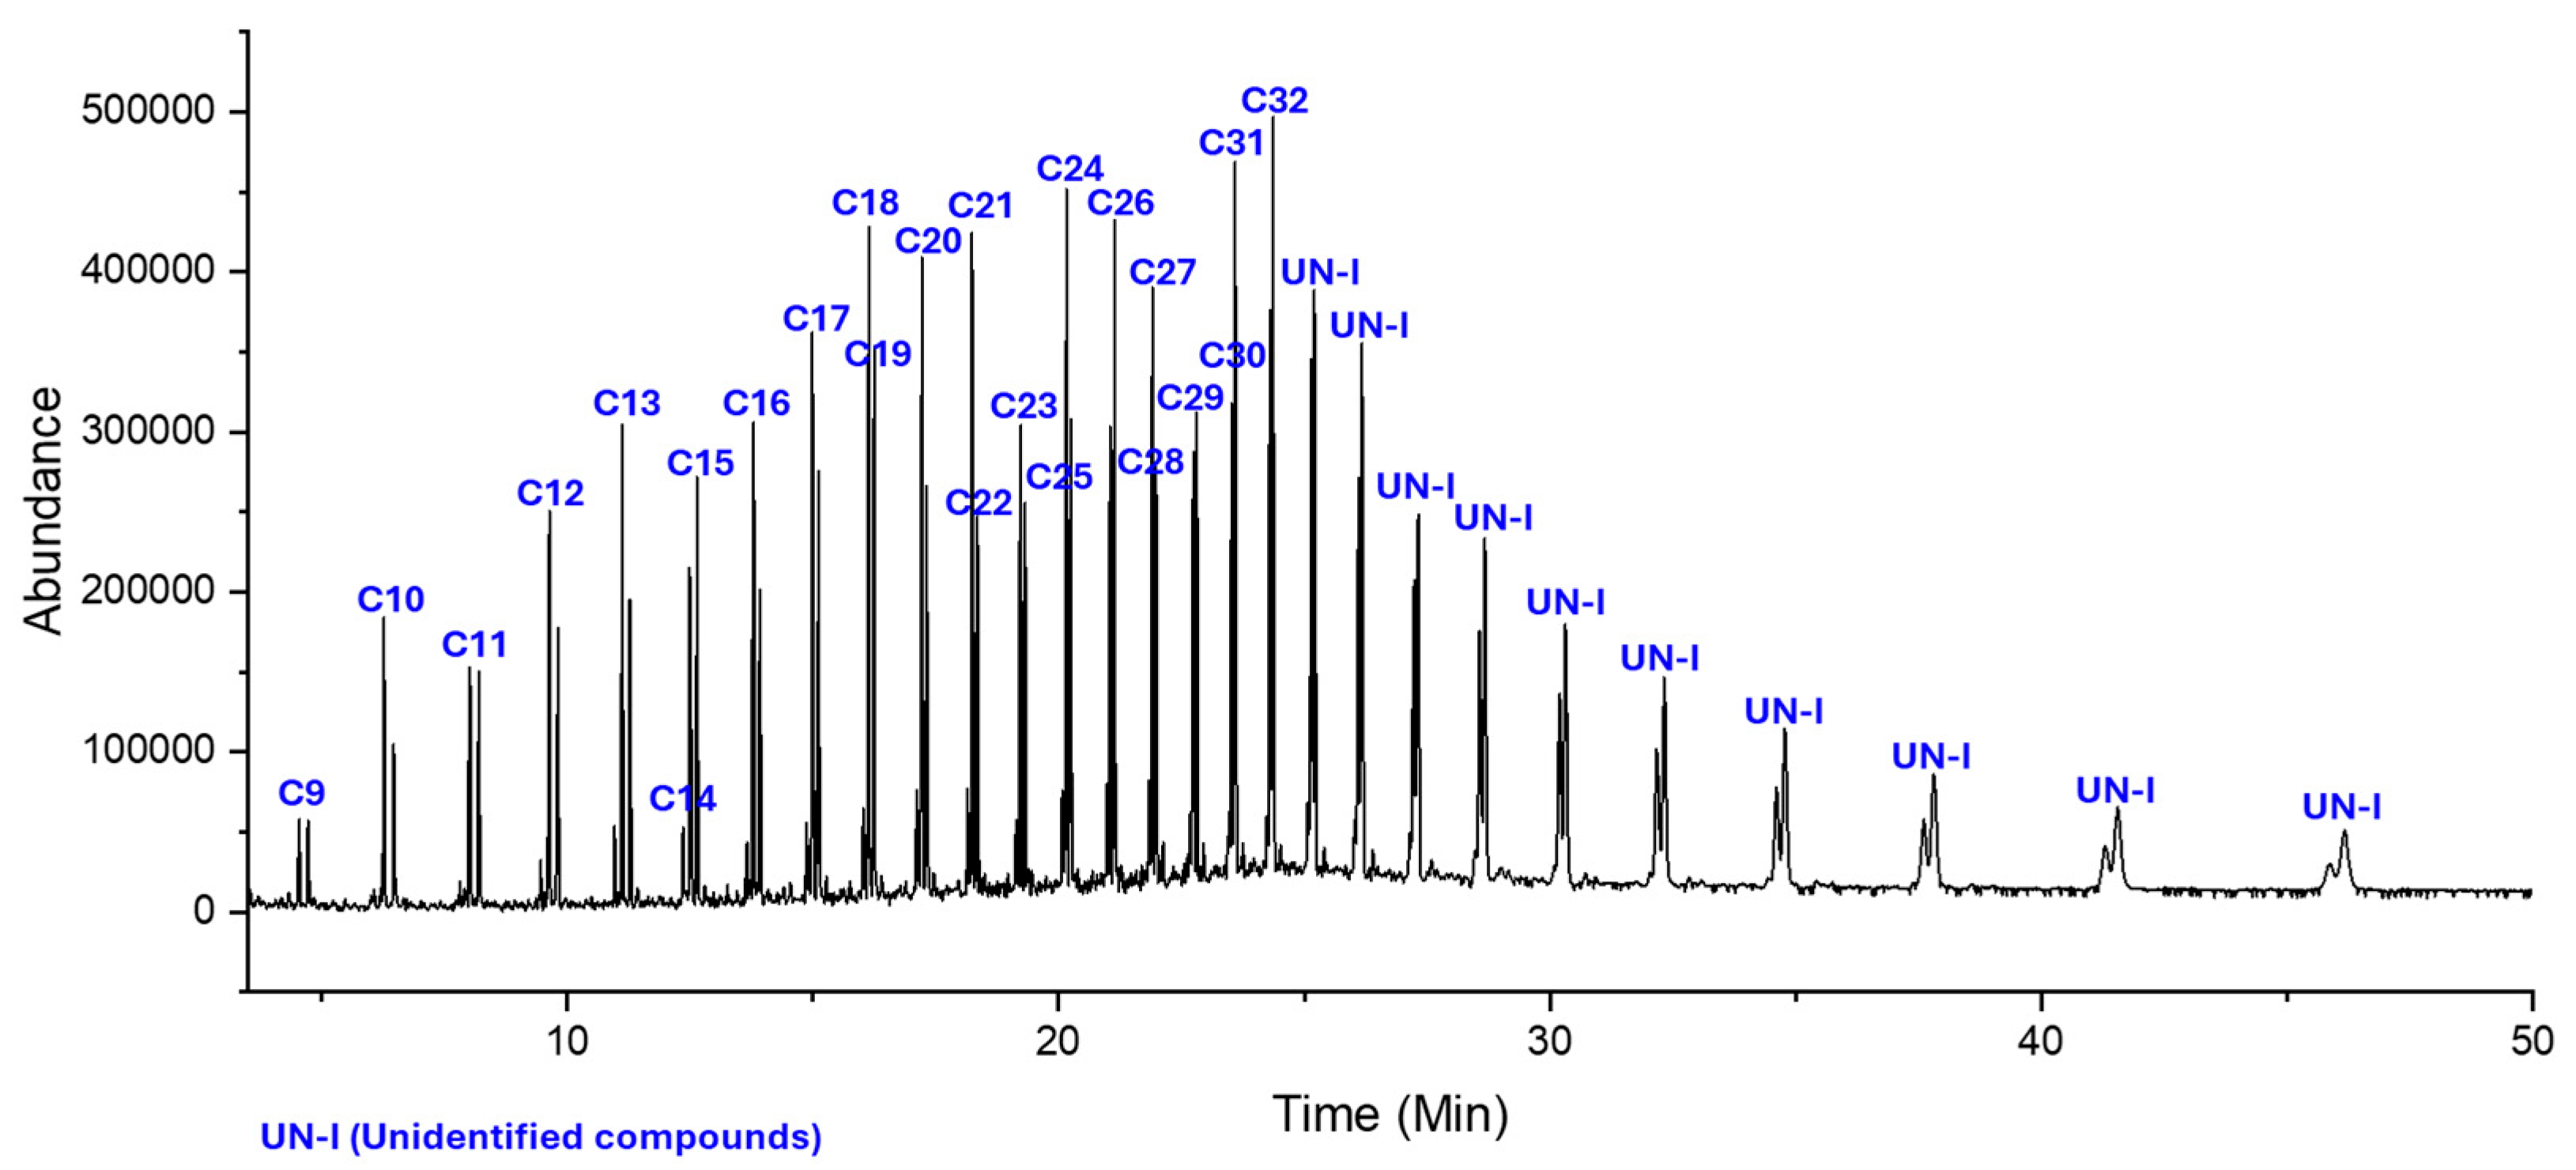
GC–MS of the pyrolyzed wax from rLLDPE/LDPE produced at 3 °C min−1, 400 °C, 75 min (conditions yielding 82% wax) is given in Figure 8, and the summary of the peaks is shown in Table 3. The result shows a clean alkane-rich slate dominated by 1-alkenes and n-alkanes spanning C9–C32. Retention times increase monotonically with molecular weight from C9 at a retention time of 4.6 min to C32 at 24.3 min, which is consistent with elution on a non-polar column where volatility tracks chain length. The relative area distribution is skewed toward the wax range (C20–C31): mid-chain species such as C23–C27 contribute 2–2.6% each, and long chains such as nonacosane (C29, 4.85%), triacontane (C30, 2.48%), hentriacontane (C31, 2.52%), and dotriacontane (C32, 2.53%) anchor the high molecular weight tail. Paired 1-alkene/alkane homologs (i.e., 1-pentadecene/n-pentadecane; 1-docosene/n-docosane) indicate random chain scission with limited secondary cracking and modest hydrogen transfer, typical of PE pyrolysis under mild conditions that preserves heavy hydrocarbon oligomers. Only a few minor peaks remain unidentified by the library and do not alter the overall result. The resulting composition, which is predominantly C9–C32 hydrocarbons and α-olefins with a pronounced C20–C31 envelope, is characteristic of wax-range products and aligns with reports for polyethylene-rich feeds in the literature (i.e., similar homologous patterns for film-plastic pyrolysis) [33,34,35]. This alkane-rich profile supports the wax’s suitability as a potential precursor for corrosion-coating formulations.
Figure 8.
GC-MS chromatogram of the rLLDPE/rLDPE wax.
Table 3.
Identified compounds present in the pyrolysis wax of rLLDPE/rLDPE.
3. Materials and Methods
3.1. Materials
Recycled LLDPE/LDPE resin (Ex-PCR-NC4 with a density of 0.925 g/cm3 and a melt flow index (MFI) of 1.0 g/10 min—2.16 kg at 190 °C) was supplied by NOVA Chemicals (Calgary, AB, Canada). The material was a commercial post-consumer recycled (PCR) blend received as supplied. The exact rLLDPE/rLDPE blend ratio was not disclosed by the supplier; therefore, only supplier-provided material properties are reported.
No additional chemical, thermal, or mechanical pretreatment was performed prior to pyrolysis. The resin was used as received to reflect realistic variability associated with recycled polyethylene streams.
3.2. Experimental Setup and Procedure for Pyrolysis of rLLDPE/rLDPE
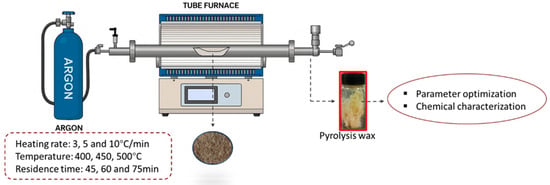
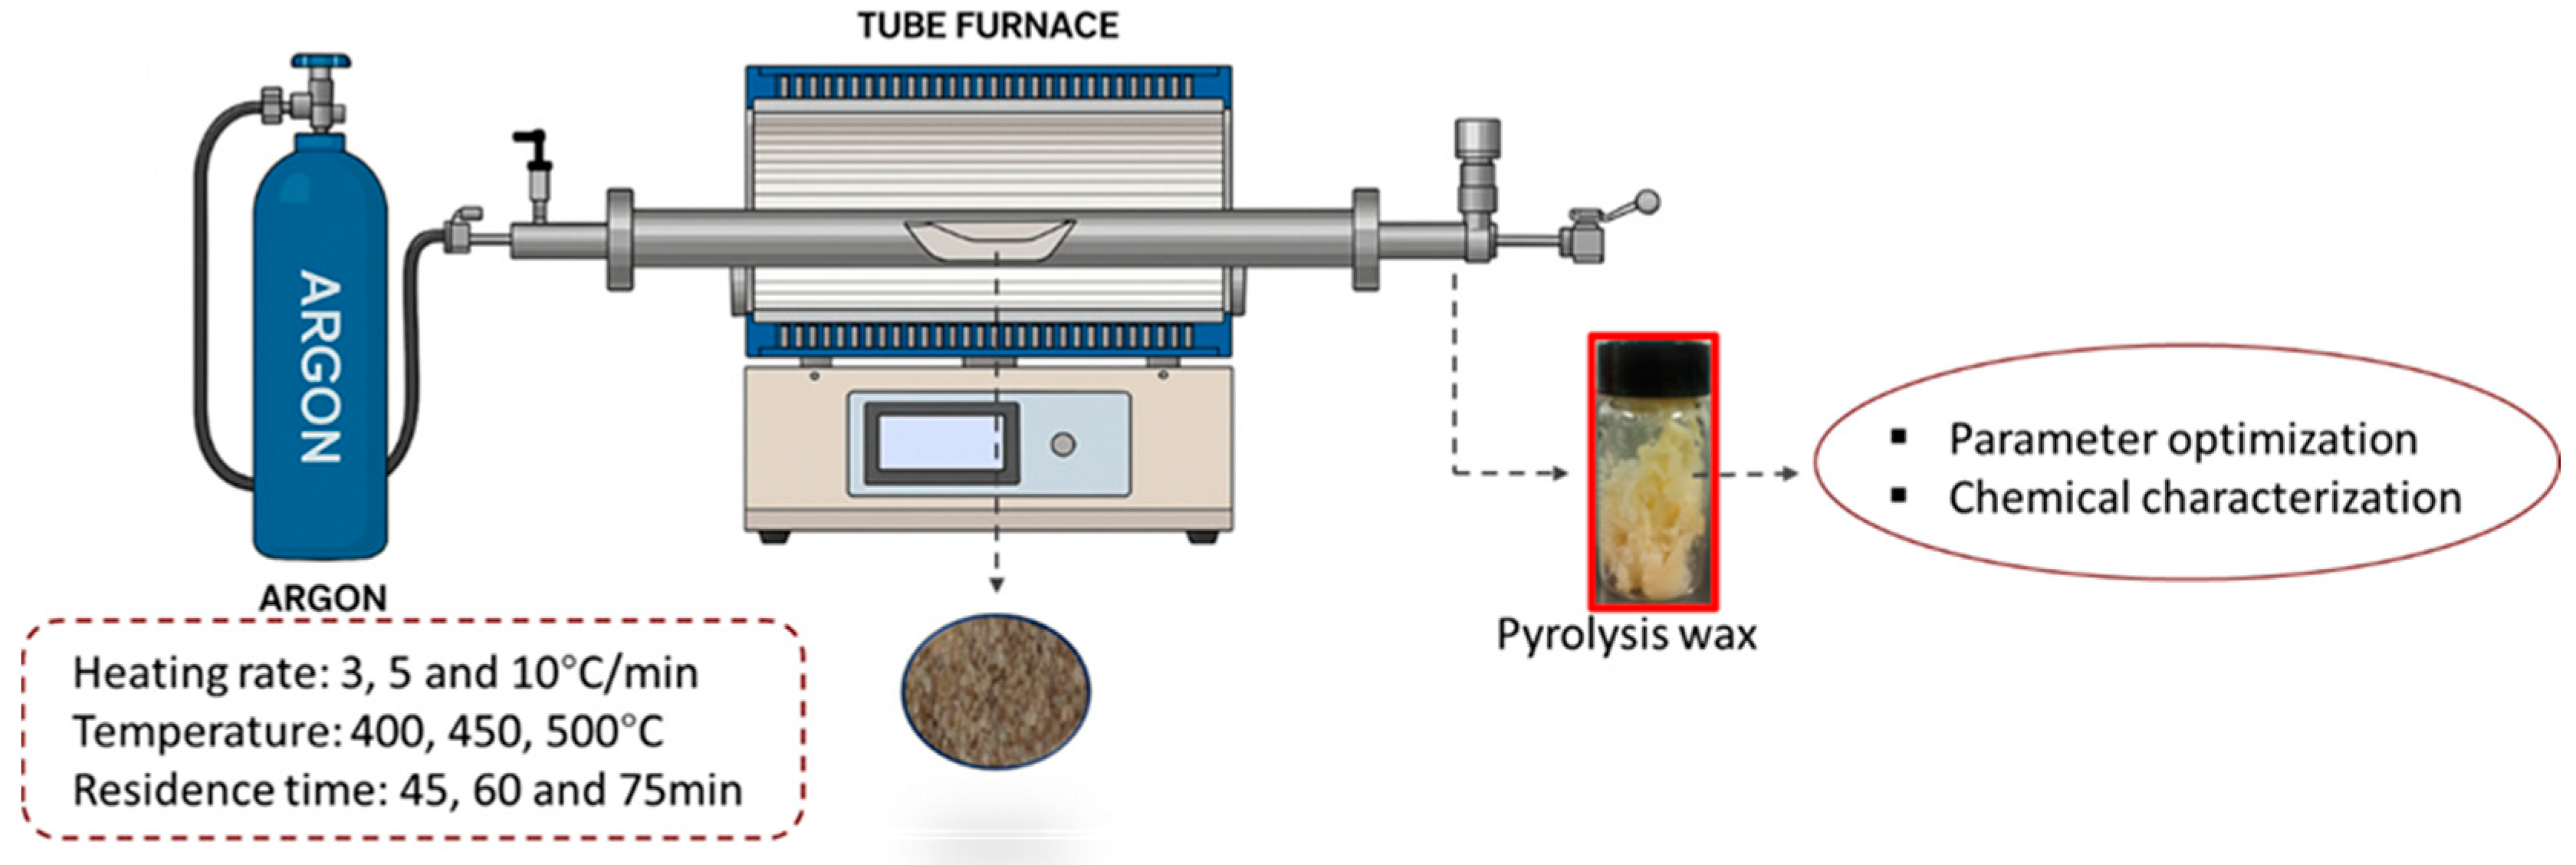
Pyrolysis experiments were performed in a horizontal quartz tubular reactor under argon, as shown in Figure 9. A crucible containing 5 g of rLLDPE/rLDPE blend was placed in the center of the reaction tube and heated according to the DOE. Prior to heating, the furnace was purged with argon at a flow rate of 30.0 mL/min for 10 min. Vapors exiting the reactor passed through a condensation section under ambient laboratory cooling conditions (20–25 °C), where the condensable wax product was collected. Non-condensable gases were not captured or quantified and exited the system under argon flow. Since the primary objective of this study was wax-selective process optimization, only the condensable fraction was quantitatively analyzed.
Figure 9.
Schematic representation of experimental design.
3.3. Experimental Design for Pyrolysis of rLLDPE/rLDPE
RSM is a suite of mathematical and statistical tools for modeling and analyzing systems in which a response is influenced by multiple variables, with the goal of optimizing that response using a limited number of experiments. For the pyrolysis of PE, temperature, heating rate, and residence time, which have significant effects on wax yield, were investigated, and the response variable used in the DOE optimization was wax yield (%), defined as the recovered condensable fraction. After the identification of the important parameters, the experimental range is tabulated in Table 4.
Table 4.
Range of independent variables used for experimental design.
A Box–Behnken statistical design with three factors, three levels, and three replicates was employed to fit a second-order polynomial model, and forty-five experiments were studied for this procedure. With the aid of Minitab® software (version 22.4.0, Minitab LLC., PA, USA), the data obtained from the DOE (shown in Table 5) were used for the analysis and optimization.
Table 5.
A combination sequence of the 3 factors, 3 levels, and 3 replicates design table (randomized).
The regression parameters of the developed model and the graphical interpretation of each response, along with their statistical significance, were obtained using Minitab. The experimental response () is expressed by the predictive model in Equation 1. The coefficients were estimated using a multiple linear regression analysis employing Minitab software.
with coded factors
where = heating rate (°C min−1), = temperature (°C), and = residence time (min).
After pyrolysis, products were collected and sealed in an airtight bottle, and the yield of the wax () was determined by weight difference using Equation (2),
where Wf is the final weight of wax, and Wi is the initial weight of polymer.
The optimization of rLLDPE/rLDPE pyrolysis was performed using RSM, with the assistance of ANOVA. The aim of the analysis was to identify the process parameters for the best results. The actual yield of wax was calculated through practical experiments, while the predicted wax yield values were obtained via Minitab software. The quality of fit of the developed model was assessed using ANOVA. The impact of various factors was determined using the F value and the ratio of the mean square of treatments to the mean square of the error, in conjunction with the coefficient values. A factor was deemed statistically significant when the F value was sufficiently large, and the p value was less than 0.05. In addition to p and F values, various correlation coefficients, such as R2, predicted R2 (R2 pred.), and adjusted R2 (R2 adj.), were considered to validate the accuracy of the model. 3D surface plots and contour plots were drawn to determine and analyze the effects of independent factors on the yield of wax.
3.4. Characterization of rLLDPE/rLDPE Wax
A gas chromatograph coupled with a mass spectrometer (GC-MS, Agilent 5975, Agilent Technologies, Santa Clara, CA, USA) was used for the composition analysis on a DB-5MS column (Agilent J&W, Santa Clara, CA, USA). Helium gas was used at a constant flow of 1.0 mL/min. The injector temperature used was 280 °C, and the oven was held at 50 °C for 2 min and then ramped to 300 °C with a speed of 10 °C/min and was held for 10 min. Operating conditions included the following: ionization energy, 70 eV; ion source temperature, 230 °C; scans per second, oven mass range, electron (m/z) 40–600. The identification of the GC-MS spectra features was achieved using the GC-MS Mass Hunter software, version 12.0 (10.2. SR3), which helped retrieve data from the NIST standard spectrum library for the identification of compounds.
4. Conclusions
This study showed that RSM efficiently models and optimizes non-catalytic pyrolysis of rLLDPE/rLDPE for high-yield wax using 45 runs. The quadratic model was statistically significant with sound fit metrics and low collinearity. Our analyses, including the Pareto chart, concluded that heating rate is the dominant driver (with strong curvature), followed by temperature, while residence time exhibits weak linear, but meaningful, quadratic behavior and a single important B×C interaction. The Response Optimizer identified a mild condition corner at 3 °C min−1, 400 °C, and 45 min, predicting 84% yield; experimentally, the maximum observed yield was 82% at 3 °C min−1, 400 °C, and 75 min. Mechanistically, these settings suppress secondary cracking/aromatization, preserving heavy paraffinic intermediates. These results show that reducing the severity of the process conditions, rather than process intensification, is the key design principle for maximizing wax selectivity in recycled polyolefin pyrolysis.
GC–MS analysis confirmed that the produced wax consisted primarily of n-alkanes and 1-alkenes (C9–C32), consistent with wax-like hydrocarbon products reported in the literature. In this study, GC–MS was used as a compositional verification tool to assess hydrocarbon distribution within the scope of process optimization. While the results indicate compositions consistent with paraffinic waxes, GC–MS alone does not provide complete material qualification. Additional characterization methods, including DSC, FTIR, TGA, rheology, and benchmarking against commercial wax standards, are required for comprehensive evaluation and will be addressed in future work. The observed composition suggests potential applicability of the recovered wax as a precursor for coating-related materials; however, coating performance and corrosion resistance were not investigated here. Because the study focused on wax-selective optimization, non-condensable gases were not quantified, and char formation was visually minimal under the investigated conditions. Overall, this work establishes a statistically validated framework for wax-focused pyrolysis of recycled polyethylene blends and provides insight into operational strategies for directing product selectivity toward value-added materials.
Author Contributions
Conceptualization, O.E.A.; methodology, O.E.A. and Y.L.; software, O.E.A.; Y.L. and J.Z.; validation, O.E.A., Y.L., J.Z. and U.S.; formal analysis, O.E.A., Y.L., J.Z. and U.S.; investigation, O.E.A.; resources, U.S.; data curation, O.E.A., Y.L., J.Z. and U.S.; writing—original draft preparation, O.E.A.; writing—review and editing, O.E.A., Y.L., J.Z. and U.S.; visualization, O.E.A., Y.L., J.Z. and U.S.; supervision, U.S.; project administration, U.S.; funding acquisition, U.S. All authors have read and agreed to the published version of the manuscript.
Funding
This research was funded by Natural Sciences and Engineering Research Council of Canada (NSERC) Discovery Grant RGPIN-04058/2020, the NSERC Alliance program, and funding from Alberta Innovates CASBE.
Data Availability Statement
The original contributions presented in this study are included in the article. Further inquiries can be directed to the corresponding author.
Acknowledgments
We thank the Center for Advanced Polymers and Nanotechnology (CAPNA), Department of Chemical and Petroleum Engineering, University of Calgary, Canada, for the technical support. We would like to thank E. Vignola and A. Dhaliwal of NOVA Chemicals for providing the rLLDPE/rLDPE blend samples.
Conflicts of Interest
The authors declare no conflicts of interest.
References
- Exploring Next Decades: Global Thermoplastic Production 2025-50; Intrepid Sourcing and Services: Hong Kong, China, 2023. Available online: https://intrepidsourcing.com/exploring-next-decades-global-thermoplastic-production-2025-50/ (accessed on 16 December 2025).
- Awogbemi, O.; Kallon, D.V.V. Achieving affordable and clean energy through conversion of waste plastic to liquid fuel. J. Energy Inst. 2023, 106, 101154. [Google Scholar] [CrossRef] [Scilit]
- Pradhan, R.; Mahalik, M.; Gantayat, M.; Rout, A.; Bhoi, K.; Mallick, S.; Grahacharya, M.; Mahapatra, M.; Sahoo, J.P. Revolutionize Recycling by Genetic Engineered Plastic Eating Bacteria: Prospective and Challenges. Biot. Res. Today 2024, 6, 148–151. [Google Scholar] [CrossRef]
- Pilapitiya, P.G.C.N.T.; Ratnayake, A.S. The World of Plastic waste: A Review. Clean Master 2024, 11, 100220. [Google Scholar] [CrossRef] [Scilit]
- Akindele, O.E.; dos Anjos, E.G.R.; Mapossa, A.B.; Sundararaj, U. Sustainable Fire-Resistant Materials: Recycled Polyethylene Composites with Non-Halogenated Intumescent Flame Retardants for Construction Applications. Recycling 2025, 10, 45. [Google Scholar] [CrossRef] [Scilit]
- OECD. Global Plastics Outlook: Economic Drivers, Environmental Impacts and Policy Options; OECD: Paris, Italy, 2022. [Google Scholar] [CrossRef] [Scilit]
- Houssini, K.; Li, J.; Tan, Q. Complexities of the global plastics supply chain revealed in a trade-linked material flow analysis. Commun. Earth Environ. 2025, 6, 257. [Google Scholar] [CrossRef] [Scilit]
- Baxter, L.; Lucas, Z.; Walker, T.R. Evaluating Canada’s single-use plastic mitigation policies via brand audit and beach cleanup data to reduce plastic pollution. Mar. Pollut. Bull. 2022, 176, 113460. [Google Scholar] [CrossRef] [Scilit] [PubMed]
- Recycled Content and Labelling Rules for Plastics: Regulatory Framework Paper. Available online: https://www.canada.ca/en/environment-climate-change/services/canadian-environmental-protection-act-registry/recycled-content-labelling-rules-plastics (accessed on 17 July 2025).
- Huysman, S.; Debaveye, S.; Schaubroeck, T.; De Meester, S.; Ardente, F.; Mathieux, F.; Dewulf, J. The recyclability benefit rate of closed-loop and open-loop systems: A case study on plastic recycling in Flanders. Resour. Conserv. Recycl. 2015, 101, 53–60. [Google Scholar] [CrossRef] [Scilit]
- Campilho, R.D.S.G. (Ed.) Natural Fiber Composites, 1st ed.; CRC Press: Boca Raton, FL, USA, 2015. [Google Scholar] [CrossRef] [Scilit]
- Valerio, O.; Muthuraj, R.; Codou, A. Strategies for polymer to polymer recycling from waste: Current trends and opportunities for improving the circular economy of polymers in South America. Curr. Opin. Green Sustain. Chem. 2020, 25, 100381. [Google Scholar] [CrossRef] [Scilit]
- Singh, N.; Hui, D.; Singh, R.; Ahuja, I.P.S.; Feo, L.; Fraternali, F. Recycling of plastic solid waste: A state of art review and future applications. Compos. Part B Eng. 2017, 115, 409–422. [Google Scholar] [CrossRef] [Scilit]
- Welle, F. Twenty years of PET bottle to bottle recycling—An overview. Resour. Conserv. Recycl. 2011, 55, 865–875. [Google Scholar] [CrossRef] [Scilit]
- Sarioğlu, E.; Kaynak, H.K. PET Bottle Recycling for Sustainable Textiles. In Polyester-Production, Characterization and Innovative Application; IntechOpen: London, UK, 2017. [Google Scholar] [CrossRef] [Scilit]
- Damián, P.; Dobránsky, J.; Michalík, P. Recent Advances in Polymer Recycling: A Review of Chemical and Biological Processes for Sustainable Solutions. Polymers 2025, 17, 603. [Google Scholar] [CrossRef] [Scilit]
- Lüdeke-Freund, F.; Gold, S.; Bocken, N.M.P. A Review and Typology of Circular Economy Business Model Patterns. J. Ind. Ecol. 2019, 23, 36–61. [Google Scholar] [CrossRef] [Scilit]
- Jehanno, C.; Pérez-Madrigal, M.M.; Demarteau, J.; Sardon, H.; Dove, A.P. Organocatalysis for depolymerization. Polym. Chem. 2019, 10, 172–186. [Google Scholar] [CrossRef] [Scilit]
- Aguado, J.; Serrano, D.P.; Escola, J.M. Fuels from Waste Plastics by Thermal and Catalytic Processes: A Review. Ind. Eng. Chem. Res. 2008, 47, 7982–7992. [Google Scholar] [CrossRef] [Scilit]
- Ellen MacArthur Foundation. Chemical Recycling: Green Chemistry for a Circular Economy; Ellen MacArthur Foundation: Wight, UK, 2020; Available online: https://ellenmacarthurfoundation.org/ (accessed on 16 December 2025).
- Tamizhdurai, P.; Mangesh, V.L.; Santhosh, S.; Vedavalli, R.; Kavitha, C.; Bhutto, J.K.; Alreshidi, M.A.; Yadav, K.K.; Kumaran, R. A state-of-the-art review of multilayer packaging recycling: Challenges, alternatives, and outlook. J. Clean. Prod. 2024, 447, 141403. [Google Scholar] [CrossRef] [Scilit]
- Hopewell, J.; Dvorak, R.; Kosior, E. Plastics recycling: Challenges and opportunities. Philos. Trans. R. Soc. B Biol. Sci. 2009, 364, 2115–2126. [Google Scholar] [CrossRef] [Scilit]
- Donaj, P.J.; Kaminsky, W.; Buzeto, F.; Yang, W. Pyrolysis of polyolefins for increasing the yield of monomers’ recovery. Waste Manag. 2012, 32, 840–846. [Google Scholar] [CrossRef] [Scilit]
- Kaminsky, W.; Predel, M.; Sadiki, A. Feedstock recycling of polymers by pyrolysis in a fluidised bed. Polym. Degrad. Stab. 2004, 85, 1045–1050. [Google Scholar] [CrossRef] [Scilit]
- Demirbas, A. Pyrolysis of municipal plastic wastes for recovery of gasoline-range hydrocarbons. J. Anal. Appl. Pyrolysis 2004, 72, 97–102. [Google Scholar] [CrossRef] [Scilit]
- Saxena, S. Pyrolysis and Beyond: Sustainable Valorization of Plastic Waste. Appl. Energy Combust. Sci. 2024, 21, 100311. [Google Scholar] [CrossRef] [Scilit]
- Selvaganapathy, T.; Muthuvelayudham, R.; Jayakumar, M. Process parameter optimization study on thermolytic polystyrene liquid fuel using response surface methodology (RSM). Mater. Today Proc. 2020, 26, 2729–2739. [Google Scholar] [CrossRef] [Scilit]
- Kumar, S.; Singh, R.K. Optimization of process parameters by response surface methodology (RSM) for catalytic pyrolysis of waste high-density polyethylene to liquid fuel. J. Environ. Chem. Eng. 2014, 2, 115–122. [Google Scholar] [CrossRef] [Scilit]
- Ayodele, T.R.; Durodola, O.; Ogunjuyigbe, A.S.; Munda, J.L. Effects of operating factors on the bio-oil produced from pyrolysis of plastic wastes using response surface methodology. In 2019 IEEE PES/IAS PowerAfrica; IEEE: New York, NY, USA, 2019; pp. 527–532. [Google Scholar] [CrossRef] [Scilit]
- Dutta, N.; Mondal, P.; Gupta, A. Optimization of process parameters using response surface methodology for maximum liquid yield during thermal pyrolysis of blend of virgin and waste high-density polyethylene. J. Mater. Cycles Waste Manag. 2022, 24, 1182–1193. Available online: https://ui.adsabs.harvard.edu/abs/2022JMCWM..24.1182D (accessed on 16 December 2025). [CrossRef] [Scilit]
- Gupta, S.; Patel, P.; Mondal, P. Biofuels production from pine needles via pyrolysis: Process parameters modeling and optimization through combined RSM and ANN based approach. Fuel 2022, 310, 122230. [Google Scholar] [CrossRef] [Scilit]
- Salam, K.K.; Arinkoola, A.O.; Oke, E.O.; Adeleye, J.O. Optimization of operating parameters using response surface methodology for paraffin-wax deposition in pipeline. Pet. Coal 2014, 56, 19–28. [Google Scholar]
- Quesada, L.; Perez, A.; Godoy, G.; Peula, F.J.; Calero, M.; Blazquez, G. Optimization of the pyrolysis process of a plastic waste to obtain a liquid fuel using different mathematical models. Energy Convers Manag. 2019, 188, 19–26. [Google Scholar] [CrossRef] [Scilit]
- Quesada, L.; Calero, M.; Martín-Lara, M.; Peula, F.J.; Pérez, A.; Blázquez, G. Characterization of fuel produced by pyrolysis of plastic film obtained of municipal solid waste. Energy 2019, 186, 115874. [Google Scholar] [CrossRef] [Scilit]
- Calero, M.; Solís, R.R.; Muñoz-Batista, M.J.; Pérez, A.; Blázquez, G.; Ángeles Martín-Lara, M. Oil and gas production from the pyrolytic transformation of recycled plastic waste: An integral study by polymer families. Chem. Eng. Sci. 2023, 271, 118569. [Google Scholar] [CrossRef] [Scilit]

Disclaimer/Publisher’s Note: The statements, opinions and data contained in all publications are solely those of the individual author(s) and contributor(s) and not of MDPI and/or the editor(s). MDPI and/or the editor(s) disclaim responsibility for any injury to people or property resulting from any ideas, methods, instructions or products referred to in the content. |
© 2026 by the authors. Licensee MDPI, Basel, Switzerland. This article is an open access article distributed under the terms and conditions of the Creative Commons Attribution (CC BY) license.