


Abstract
Proton exchange membrane fuel cells (PEMFCs) are promising electrochemical energy conversion technologies owing to their high efficiency, rapid dynamic response, and low-emission operation. Their performance is governed by strongly coupled electrochemical, protonic, mass-transport, and species-transport phenomena. In this study, a two-dimensional five-layer membrane electrode assembly (MEA) model was developed using the Hydrogen Fuel Cell interface in COMSOL Multiphysics. The model incorporates electronic and ionic charge transport, multicomponent gas diffusion, Darcy flow, Butler–Volmer kinetics, oxygen transport limitations, and hydrogen crossover. The model was calibrated against experimental polarization data obtained under humidified air and oxygen conditions at 100 °C and subsequently validated against experimental data at 100 °C and at 80 °C and 70% relative humidity. The calibrated parameter values obtained at 100 °C were directly applied to the 80 °C condition without further parameter fitting. Four electrochemical parameters—membrane electrolyte conductivity, ORR reference exchange current density, cathodic charge transfer coefficient, and limiting current density were calibrated to improve agreement with the experimental data. Subsequently, a one-factor-at-a-time (OFAT) analysis was performed by varying temperature (60–100 °C), relative humidity (40–70%), membrane thickness (5–15 µm), electrolyte conductivity (5–15 S m−1), ORR exchange current density (10−4–10−2 A m−2), and cell voltage (0.40–0.80 V). Electrode potential, electrolyte potential, pressure drop, and local O2, H2O, and N2 mole fractions were evaluated. ORR kinetics and cell voltage exhibited the strongest effects on the electrochemical responses, whereas temperature and relative humidity primarily influenced protonic, pressure, and species-transport behavior. Membrane thickness and electrolyte conductivity had comparatively limited effects within the investigated ranges. The agreement between the model predictions and experimental data at 80 °C and 70% relative humidity further demonstrates the model’s predictive capability across the investigated operating conditions. The results provide a physically interpretable framework for PEMFC model calibration, parametric assessment, and subsequent optimization studies.
1. Introduction
Proton exchange membrane fuel cells (PEMFCs) have attracted considerable attention as one of the most promising electrochemical energy conversion technologies due to their high efficiency, rapid start-up capability, low operating temperature, and nearly zero greenhouse gas emissions. These characteristics make PEMFCs suitable for automotive, portable, aerospace, and stationary power generation applications. However, despite remarkable progress over the last two decades, several challenges, including activation polarization, ohmic resistance, mass transport limitations, water management, and membrane degradation, continue to limit their widespread commercialization [1,2,3]. Among the material properties governing PEMFC performance, membrane thickness has received particular attention because PEMFC performance is strongly influenced by the coupled electrochemical reactions and multiphysics transport phenomena occurring within the membrane electrode assembly (MEA). Charge transport, gas diffusion, water transport, heat transfer, and electrochemical kinetics occur simultaneously within a highly heterogeneous porous structure. Consequently, numerical modeling has become an indispensable tool for understanding these coupled mechanisms while reducing the cost and time associated with experimental investigations [4,5].
Among the available numerical approaches, finite element analysis has become one of the reliable techniques for predicting PEMFC behavior under various operating conditions. In particular, the Hydrogen Fuel Cell interface implemented in COMSOL Multiphysics enables the simultaneous solution of electronic and ionic charge conservation, gas transport, Darcy flow through porous media, and Butler–Volmer electrochemical kinetics within a unified computational framework. Such multiphysics models have demonstrated good agreement with experimentally measured polarization curves and have therefore been widely adopted for fuel cell design and optimization [2,4].
Accurate prediction of PEMFC performance requires reliable estimation of several physical and electrochemical parameters that cannot be measured directly. Parameters such as membrane proton conductivity, oxygen reduction reaction (ORR) exchange current density, cathodic transfer coefficient, oxygen diffusion coefficient, and limiting current density are commonly determined through inverse modeling or parameter estimation techniques. Because these parameters strongly influence activation, ohmic, and concentration overpotentials, their accurate identification is essential for predictive numerical simulations [5,6,7,8]. Early investigations employed nonlinear least-squares optimization coupled with finite element models to estimate effective membrane conductivity and ORR kinetic parameters from experimental polarization curves [5]. More recently, various optimization algorithms, including genetic algorithms, particle swarm optimization, differential evolution, grey wolf optimization, artificial intelligence methods, and hybrid metaheuristic techniques, have been proposed to improve convergence speed and estimation accuracy [3,6,7,8,9].
Material properties of the MEA are equally important. Membrane thickness determines proton transport resistance and hydrogen crossover, whereas membrane electrolyte conductivity governs ohmic voltage losses throughout the cell. Likewise, ORR reference exchange current density strongly affects activation polarization, particularly at low current densities, while limiting current density represents oxygen transport limitations at high current densities. Previous studies have consistently demonstrated that these parameters influence the shape of polarization curves and the overall fuel cell efficiency [1,5,10]. The membrane is particularly critical because it simultaneously governs proton transport, water management, gas crossover, and overall ohmic resistance. Thinner membranes reduce proton transport resistance and improve power density; however, excessive thickness reduction may increase hydrogen crossover and accelerate membrane degradation. Conversely, thicker membranes suppress gas crossover but introduce greater ohmic voltage losses, particularly at high current densities. Therefore, membrane thickness must be considered in terms of the balance between electrochemical performance and long-term stability [2,11,12].
In addition to membrane properties, the gas diffusion layer (GDL) plays a fundamental role in PEMFC performance by facilitating reactant transport, product-water removal, electronic conduction, and mechanical support for the catalyst layers. Its porous microstructure strongly influences oxygen diffusion, liquid-water accumulation, and pressure distribution throughout the MEA. Variations in GDL porosity, permeability, thickness, and compression can significantly affect concentration overpotentials, particularly under high-current-density operating conditions. Consequently, accurate representation of porous transport properties is important for improving the predictive capability of multiphysics PEMFC simulations and for mitigating flooding and reactant starvation [12,13,14,15,16]. Similarly, the catalyst layer represents the electrochemically active region where hydrogen oxidation and oxygen reduction reactions occur simultaneously with proton, electron, gas, and water transport. Because the catalyst layer contains heterogeneous distributions of ionomer, catalyst particles, and pore networks, its numerical representation remains challenging. Catalyst utilization depends on oxygen availability, ionomer distribution, effective proton conductivity, and local water saturation, while the interaction between electrochemical kinetics and transport limitations becomes increasingly important as current density increases [5,11,12,13,14,15,16].
Sensitivity and parametric analyses provide an effective means of identifying the parameters that most strongly influence PEMFC performance without the computational requirements of full optimization studies. In particular, one-factor-at-a-time (OFAT) analysis allows the physical influence of individual variables to be directly evaluated by varying one parameter while maintaining the remaining parameters at constant reference values. This approach is useful for distinguishing the relative contributions of operating conditions, electrochemical kinetics, membrane properties, and transport characteristics to polarization behavior [3,6,8,15,16]. Membrane electrolyte conductivity is one such influential parameter, as it depends on factors including membrane hydration, operating temperature, membrane morphology, and polymer equivalent weight. Increasing membrane conductivity generally reduces ohmic polarization and improves current density and cell efficiency, making its accurate representation important for reliable numerical simulations and parameter estimation [2,10,11,12,13]. Likewise, the oxygen reduction reaction (ORR) at the cathode is widely recognized as the rate-limiting electrochemical process in PEMFCs. Its sluggish kinetics account for a substantial fraction of activation losses, particularly in the low-current-density region. Consequently, the ORR reference exchange current density and cathodic transfer coefficient are important parameters in both experimental and numerical investigations, and variations in these parameters can significantly alter predicted polarization behavior [1,5,14].
Although previous studies have investigated the effects of individual operating conditions, membrane properties, electrochemical parameters, and transport characteristics, many have primarily focused on model validation, parameter estimation, or optimization using experimental polarization data. Comparatively fewer studies have systematically assessed the relative influence of temperature, inlet relative humidity, membrane thickness, membrane electrolyte conductivity, ORR reference exchange current density, and operating voltage within a unified two-dimensional multiphysics model under identical reference conditions. This limitation makes it difficult to directly compare the relative importance of these operating, kinetic, and material parameters using a consistent modeling framework. A systematic OFAT analysis can therefore provide a clearer understanding of the dominant factors governing PEMFC polarization behavior while avoiding the additional computational complexity associated with comprehensive optimization [3,6,8,15,16]. In the broader context of the clean energy transition, hydrogen fuel cells occupy a crucial position. While renewable energy sources like solar and wind power are experiencing rapid adoption, their inherent intermittency presents operational challenges for grid stability. Hydrogen energy infrastructure addresses this limitation by storing surplus renewable power as chemical energy, which can later be converted back to electricity via fuel cells to seamlessly balance supply and demand while eliminating fossil-fuel-related pollution [17].
Operating conditions play a decisive role in PEMFC performance, where operating temperature directly influences reaction kinetics, membrane hydration, proton conductivity, and oxygen diffusivity. While increasing operating temperature accelerates electrochemical reactions and reduces activation losses, excessive thermal stress can induce membrane dehydration and accelerate degradation mechanisms, thereby increasing ohmic resistance. As highlighted in recent durability studies, adaptive temperature sensitivity characteristics are closely coupled with the cell’s State-of-Health (SoH), demonstrating that thermal management requires balancing short-term electrochemical performance with long-term MEA durability [18]. In the present formulation, membrane electrolyte conductivity is prescribed as a constant effective parameter and water transport is modeled purely in the gas phase as water vapor, neglecting two-phase flow and liquid condensation. The validity boundary of this single-phase assumption is defined by conditions where local water vapor partial pressure remains below or near saturation (PH2O ≤ PSAT(T)), which strictly holds for higher operating temperatures (≥80 °C) or low-to-moderate relative humidity regimes. At lower operating temperatures (60–80 °C) where condensation occurs, the model omits pore-flooding transport resistance, thus providing an upper-bound performance ceiling. Accordingly, the effects of temperature and relative humidity should be interpreted within the scope and validity boundaries of the present formulation [2,10,18].
Furthermore, accurate parameter identification remains critical for predictive multiphysics modeling. Recent advances in intelligent optimization techniques—such as metaheuristic algorithms, actor–critic-assisted frameworks, and hybrid machine learning engines—have significantly improved the ability to extract highly coupled, non-linear electrochemical parameters from experimental polarization data while avoiding local minima traps [19].
A recent study by Mei et al. [20] further demonstrated the importance of advanced optimization strategies in PEMFC parameter identification. The authors proposed a multi-strategy tuna swarm optimization (MS-TSO) algorithm for the precise estimation of unidentified parameters in a PEMFC voltage model. By improving the global search and convergence capabilities of the optimization procedure, the proposed method effectively reduced the risk of local minima and achieved improved parameter estimation accuracy compared with several conventional and metaheuristic optimization algorithms. These findings highlight the potential of advanced optimization methods for addressing the nonlinear and strongly coupled nature of PEMFC parameter identification, particularly for physical and electrochemical parameters that cannot be directly measured.
Furthermore, recent lattice Boltzmann simulations of liquid-water transport in compressible gradient-pore GDLs have demonstrated that liquid-water distribution is strongly influenced by the pore-scale microstructure, pore-size distribution, and compression-induced changes in pore connectivity [21]. These findings provide a microscopic explanation for the strong influence of GDL porosity and permeability on reactant transport and concentration overpotential, while also highlighting the limitations of single-phase water transport models in representing liquid-water accumulation within the GDL.
Recent advances in multiphysics simulation software have enabled increasingly realistic numerical representations of PEM fuel cells by coupling electrochemical reactions with fluid flow, mass transport, and charge conservation within a single computational framework. Among these platforms, COMSOL Multiphysics has become a widely adopted finite-element environment because of its flexibility in solving strongly coupled nonlinear governing equations. Numerous studies have successfully employed the Hydrogen Fuel Cell interface to reproduce experimentally measured polarization curves, investigate transport limitations, optimize MEA components, and evaluate the influence of operating conditions. The capability to simultaneously incorporate Darcy flow, multicomponent gas diffusion, Butler–Volmer kinetics, and proton conduction makes COMSOL particularly suitable for systematic PEMFC parametric investigations [15,16].
Therefore, the objective of the present study is to systematically investigate the individual effects of temperature, inlet relative humidity, membrane thickness, membrane electrolyte conductivity, ORR reference exchange current density, and operating voltage on PEMFC performance using a two-dimensional COMSOL Multiphysics model and an OFAT approach under identical reference conditions. The analysis aims to identify the relative influence of these six parameters on polarization behavior and current density and to provide a consistent basis for interpreting the thermal, transport, kinetic, and membrane-related mechanisms governing PEMFC performance.
Although sensitivity and parametric studies have been widely applied to PEMFC models, their scientific objectives and reported outputs differ considerably. Previous investigations have predominantly examined individual operating or material parameters, such as temperature, relative humidity, pressure, membrane thickness, catalyst loading, gas-diffusion-layer properties, or electrochemical kinetic coefficients. Other studies have focused on parameter estimation and model calibration, in which selected electrochemical parameters are adjusted to reproduce experimental polarization curves. These studies have provided important information regarding individual mechanisms; however, direct comparison of the relative influence of operating conditions, membrane properties, and cathode reaction kinetics within the same calibrated multiphysics model remains limited [3,4,5,6,7,8,15,16].
While the OFAT approach provides a clear, computationally efficient framework for isolating the primary direct impact of individual operating, kinetic, and structural parameters on cell performance, it does not capture multi-variable nonlinear interactions. Thus, the present study establishes a single-variable baseline, paving the way for future global sensitivity frameworks.
The limitation of previous sensitivity studies is not simply the number of parameters investigated, but the lack of a common modeling framework in which different classes of parameters can be evaluated against the same reference state and the same set of coupled multiphysics responses. Results obtained from separate models or under different baseline conditions cannot readily be compared because changes in geometry, boundary conditions, constitutive relationships, calibration procedures, or selected output variables may alter the apparent sensitivity of a parameter. Consequently, a parameter identified as influential in one study may not have the same relative importance when evaluated under a different electrochemical and transport regime. This issue is particularly relevant for PEMFCs because operating conditions, proton transport, gas transport, and electrochemical kinetics are strongly coupled.
Accordingly, the scientific advance of the present study is not the use of OFAT analysis itself, but the establishment of a common, experimentally calibrated multiphysics framework for comparing the sensitivity of fundamentally different parameter classes under identical reference conditions. The developed model simultaneously resolves electronic and ionic charge transport, multicomponent gas diffusion, porous-media flow, Butler–Volmer electrochemical kinetics, oxygen transport limitations, and hydrogen crossover. Following validation against experimental polarization data, six parameters representing distinct physical mechanisms—operating temperature, inlet relative humidity, membrane thickness, membrane electrolyte conductivity, ORR reference exchange current density, and cell voltage—are varied independently while all other model conditions are held constant. This design enables the relative response of electrochemical, protonic, pressure, and local species-transport fields to be interpreted within one consistent computational framework.
A further contribution is the identification of parameter-to-response relationships rather than a single global ranking of parameter importance. Specifically, the analysis distinguishes parameters that primarily affect electrochemical potential responses from those that predominantly modify protonic transport, pressure distribution, or local gas composition. This response-specific interpretation provides information that is directly relevant to model calibration: parameters producing strong changes in a particular model output can be prioritized for calibration or optimization, whereas parameters exhibiting weak responses under the same operating regime may be fixed without introducing substantial additional uncertainty. In this sense, the present work extends conventional PEMFC parametric analysis from isolated parameter studies toward a physically interpretable, response-oriented sensitivity framework.
Therefore, the principal contribution of this study is the integration of experimental calibration, multiphysics validation, controlled parameter perturbation, and response-specific sensitivity interpretation within a single PEMFC model. The resulting framework does not claim that the six investigated parameters have not been studied previously; rather, it provides a consistent basis for determining how their relative influence changes across different coupled electrochemical and transport responses under the same calibrated conditions. This distinction establishes the scientific value of the present work beyond simply combining six OFAT simulations and provides a basis for subsequent global sensitivity analysis, parameter optimization, surrogate modeling, and data-driven PEMFC studies.
2. Materials and Methods
A two-dimensional numerical model of a proton exchange membrane fuel cell (PEMFC) was developed using the Hydrogen Fuel Cell interface in COMSOL Multiphysics 5.3 (COMSOL AB, Stockholm, Sweden) [22]. The model represents a five-layer membrane electrode assembly (MEA) composed of an anode gas diffusion layer (GDL), an anode catalyst layer (CL), a proton exchange membrane, a cathode catalyst layer, and a cathode gas diffusion layer, as illustrated in Figure 1. The computational domain was selected to represent a repeating unit of the membrane electrode assembly located beneath the flow-field ribs and gas channels. The upper region of the computational domain corresponds to the cathode side, where humidified oxygen or air is supplied, whereas the lower region represents the hydrogen-fed anode. Owing to the high reactant stoichiometry, variations in gas composition along the flow direction were assumed to be negligible. Consequently, a two-dimensional cross-sectional model was considered sufficient to capture the dominant transport and electrochemical phenomena while significantly reducing the computational cost.
Figure 1.
Schematic representation of the two-dimensional five-layer PEMFC model.
The numerical model simultaneously solves electronic and ionic charge conservation throughout the membrane electrode assembly. Electron transport in the solid phase is governed by Ohm’s law, while proton transport through the membrane and catalyst layers is described by ionic charge conservation. Electrochemical reactions at both electrodes are represented by the Butler–Volmer equation. Hydrogen oxidation reaction (HOR) kinetics are implemented at the anode catalyst layer, whereas oxygen reduction reaction (ORR) kinetics are applied at the cathode catalyst layer. To account for concentration losses at high current densities, a limiting current density formulation is incorporated into the cathode reaction model. Gas transport inside the cathode porous media includes both diffusion and convection, while momentum transport is described using Darcy’s law. Hydrogen crossover through the membrane is also considered to account for the parasitic current generated by hydrogen permeation. The majority of the material properties, electrochemical parameters, and operating conditions employed in the present study were adopted from the experimental and numerical investigation reported by Butori et al. [1].
Figure 2 illustrates the computational domain and the finite element mesh adopted for the numerical simulations. Prior to the parametric analyses, a mesh independence study was carried out by comparing several mesh densities to ensure that the predicted electrochemical performance was insensitive to further mesh refinement. The selected mesh provided negligible changes in the calculated results while maintaining reasonable computational cost, and was therefore adopted for all subsequent simulations.
Figure 2.
Two-dimensional geometry and finite element mesh of the five-layer membrane electrode assembly (MEA) used in the PEMFC simulations.
The choice of a 2D cross-sectional domain is justified under high stoichiometric flow conditions, where reactant mass flow rates substantially exceed local electrochemical consumption rates along the gas channel length. Under these operating conditions, streamwise concentration gradients and along-channel pressure drops remain minor relative to the dominant transport resistances across the thickness of the gas diffusion layers and the membrane electrode assembly. Consequently, the 2D cross-sectional representation accurately resolves cross-plane mass diffusion, ionic transport, and localized electrochemical kinetics at representative channel locations, providing a computationally efficient and physically valid baseline for parametric sensitivity analysis.
The final computational mesh consisted of 708 domain elements, including 528 triangular elements and 180 quadrilateral elements, together with 168 edge elements and 14 vertex elements, resulting in a total of 499 mesh vertices. The mesh exhibited satisfactory numerical quality, with a minimum element quality of 0.5681 and an average element quality of 0.8728. The computational domain had a total area of 3.25 × 10⁻⁷ m2, while the element area ratio was 0.01622. To improve numerical accuracy, local mesh refinement was applied in the catalyst layers and at the membrane-electrode interfaces, where steep gradients of potential, current density, and reactant concentration occur. The remaining regions were discretized using a combination of triangular and quadrilateral finite elements, providing an efficient balance between solution accuracy and computational time. The governing equations describing charge transport, species transport, gas flow, and electrochemical reactions were solved using the finite element method implemented in COMSOL Multiphysics. A stationary solver with a segregated iterative solution scheme was employed to solve the strongly coupled nonlinear equations. The relative convergence tolerance was specified as 1 × 10⁻³, and the solution was considered converged when the residuals satisfied the prescribed tolerance for all dependent variables.
A mesh independence study was conducted using five different mesh densities consisting of 372, 490, 560, 708, and 1172 domain elements. The predicted electric potential exhibited progressively smaller variations as the mesh was refined, with the relative difference decreasing from 0.2920% to 0.0364% and reaching 0.0000% between the selected mesh (708 elements) and the finest mesh (1172 elements). Similarly, the pressure results showed negligible variations, with the relative difference decreasing to 0.000% between the 708- and 1172-element meshes. These results indicate that the numerical solution is effectively mesh-independent. Therefore, the mesh containing 708 domain elements was selected for the subsequent simulations, as it provides an appropriate balance between computational accuracy and computational cost. For a conservative assessment, the maximum pressure value obtained among the investigated mesh configurations, 0.02622, was taken as the representative pressure result (Table 1).
Table 1.
Mesh independence study of the PEM fuel cell model.
2.1. Geometry and Operating Conditions
The computational geometry consists of five individual layers representing the anode GDL, anode catalyst layer, membrane, cathode catalyst layer, and cathode GDL. The gas diffusion layer thickness was fixed at 150 μm, while both catalyst layers were assigned a thickness of 8 μm. The membrane thickness was selected as 9 μm. Both the channel width and rib width were taken as 1 mm, corresponding to one repeating channel-rib unit. Unless otherwise specified, the reference operating conditions were defined as a cell temperature of 100 °C, relative humidity of 70%, membrane electrolyte conductivity of 10 S m−1, membrane thickness of 9 μm, ORR reference exchange current density of 1 × 10⁻³ A m−2, and an operating cell voltage of 0.6 V. The remaining electrochemical, transport, and material parameters are summarized in Table 2, Table 3 and Table 4 [1].
Table 2.
Geometric Parameters.
Table 3.
Operating and Boundary Conditions.
Table 4.
Material and Transport Parameters.
In the present model, the membrane electrolyte conductivity was prescribed as an effective constant value of 10 S m−1 for the baseline simulations and was varied independently only in Case 4. No explicit membrane water-content variable or empirical relationship linking membrane hydration to electrolyte conductivity was implemented. Consequently, changes in temperature and inlet relative humidity were not modeled as direct causes of changes in membrane conductivity. The sensitivity results for these operating parameters are therefore interpreted with respect to the electrochemical, ionic, pressure, and gas-species responses obtained under the prescribed constant-conductivity formulation.
2.2. Parametric Analysis
A one-factor-at-a-time (OFAT) approach was employed to investigate the influence of key operating and material parameters on PEMFC performance. In each simulation series, only one parameter was varied while all remaining parameters were maintained at their baseline values. The investigated parameters included operating temperature (60, 80, and 100 °C), inlet gas relative humidity (40, 55, and 70%), membrane thickness (5, 10, and 15 µm), membrane electrolyte conductivity (5, 10, and 15 S m−1), ORR reference exchange current density (10−4, 10−3, and 10−2 A m−2), and cell operating voltage (0.40, 0.60, and 0.80 V). These parameter ranges were selected based on representative operating conditions reported in the PEMFC literature and were intended to evaluate the individual effects of thermal conditions, membrane properties, electrochemical kinetics, and operating potential on charge transport, electrolyte potential, pressure distribution, and overall fuel cell performance (Table 5).
Table 5.
Parametric study cases considered in this work.
2.3. Model Assumptions
To achieve a computationally efficient numerical solution while preserving the dominant transport and electrochemical mechanisms, several assumptions were introduced in the present PEMFC model. The simulations were performed under steady-state operating conditions, assuming that all transport and electrochemical variables remained constant over time. The membrane electrode assembly was represented by a two-dimensional cross-sectional geometry, assuming negligible variations along the flow-channel direction due to the high reactant flow rates. Electronic conduction in the solid matrix and proton transport within the membrane and catalyst layers were described independently using charge conservation combined with Ohm’s law. On the cathode side, oxygen, nitrogen, and water vapor transport through the porous gas diffusion layer and catalyst layer was assumed to occur by the combined effects of molecular diffusion and pressure-driven convection. Fluid flow inside the porous media was represented using Darcy’s law. Hydrogen transport resistance on the anode side was neglected because hydrogen was supplied in excess, resulting in insignificant concentration and partial pressure gradients within the anode porous layers. The electrochemical reactions occurring at both electrodes were described using the Butler–Volmer kinetic model. The hydrogen oxidation reaction (HOR) was assumed to proceed rapidly at the anode, whereas the oxygen reduction reaction (ORR) governed the activation losses on the cathode. The cathode reaction model included a limiting current density correction to account for mass transport limitations that become significant at high current densities. This correction represents additional concentration polarization associated with oxygen transport through the thin ionomer film surrounding the catalyst particles. Hydrogen crossover through the polymer membrane was considered by introducing membrane permeability, allowing a small parasitic current to develop at the cathode side due to hydrogen permeation. The material properties of each layer were assumed to be spatially uniform within the corresponding computational domains, while directional properties were retained where specified in the model. The operating temperature was considered spatially uniform throughout the computational domain. These assumptions are consistent with widely adopted PEMFC modeling approaches reported in the literature and provide an appropriate balance between computational efficiency and predictive capability.
The present model treats water exclusively through the gas-phase species-transport formulation and does not explicitly resolve liquid-water saturation, capillary transport, phase change, or liquid-water accumulation within the porous layers. This simplification is important when interpreting the water-management results. Over the investigated temperature range of 60–100 °C and inlet relative-humidity range of 40–70%, the model predicts a constant maximum H2O mole fraction of 0.71247 for all temperature and humidity cases. Therefore, the calculated H2O field represents gas-phase water transport under the prescribed boundary conditions rather than a quantitative prediction of liquid-water accumulation or flooding. The maximum O2 mole fraction changes by approximately 65.3% between 60 and 100 °C and by approximately 50.1% between 40 and 70% relative humidity, demonstrating that temperature and humidity substantially modify the calculated gas-phase composition. However, these changes cannot be directly converted into liquid-water saturation or flooding characteristics because a two-phase water-transport formulation is not included.
To quantitatively assess the limitation associated with neglecting liquid-water condensation, the maximum predicted H2O mole fraction was compared with the thermodynamic saturation condition. The maximum local H2O mole fraction obtained from the present simulations was 0.71247 for all investigated temperature and relative-humidity cases. At approximately atmospheric pressure, this value corresponds to a local water-vapor partial pressure of about 71.2 kPa. The saturation vapor pressures of water are approximately 19.9, 47.4, and 101.4 kPa at 60, 80, and 100 °C, respectively. Consequently, the corresponding local saturation ratios, defined as S = pH2O/PSAT(T), are approximately 3.58, 1.50, and 0.70 at 60, 80, and 100 °C, respectively. Thus, while the predicted water vapor remains below saturation at 100 °C, the calculated local gas-phase water field becomes thermodynamically supersaturated at 80 °C and particularly at 60 °C. This result quantitatively demonstrates the limitation of the single-phase formulation: when S > 1, the excess water vapor would physically tend to undergo condensation, but the present model retains it entirely in the gas phase. Therefore, the predicted transport and electrochemical performance under these conditions should be regarded as an upper-bound estimate, since the additional mass-transfer resistance associated with liquid-water accumulation, capillary transport, and pore blockage is not represented. In particular, the 70% RH cases at 60–80 °C are therefore suitable for evaluating gas-phase humidity trends but should not be interpreted as quantitative predictions of flooding severity. Quantitative prediction of flooding onset and liquid-water accumulation requires a two-phase formulation incorporating phase change, liquid saturation, and capillary transport.
The energy equation is likewise not solved in the present formulation, and the operating temperature is prescribed as spatially uniform throughout the computational domain. Consequently, temperature effects reported in this study represent the response of the electrochemical, gas-transport, and ionic fields to imposed temperature values rather than a fully coupled prediction of heat generation, heat conduction, convective heat transfer, evaporation, or condensation. This assumption is expected to be most appropriate for interpreting comparative trends under controlled, approximately isothermal operating conditions. It does not, however, provide sufficient resolution to quantify internal temperature gradients or thermal feedback on local water phase behavior. Accordingly, the present results should be interpreted as a single-phase, isothermal parametric assessment of gas-phase water and species transport rather than a comprehensive prediction of PEMFC water management and thermal behavior.
Water transport within the gas channels and porous electrodes is resolved purely in the gas phase as water vapor, neglecting explicit liquid-water condensation and two-phase Darcy flow. The validity boundary for this single-phase assumption is defined by the local water vapor partial pressure relative to the saturation pressure (PH2O ≤ PSAT(T)). This assumption is strictly valid for high-temperature operations (≥80 °C) or low-to-moderate relative humidity conditions where vapor-phase transport dominates. At lower operating temperatures (60–80 °C) and high current densities where condensation occurs, the model omits liquid condensation and pore flooding losses; hence, the simulated polarization and current transport fields reflect the theoretical performance ceiling without liquid-water mass transport limitations.
The use of a two-dimensional model and effective transport properties reduces the computational cost of the multiphysics simulations while preserving the main physical interactions considered in this study. However, these simplifications may limit the representation of complex three-dimensional transport phenomena and detailed microscale mechanisms. Further computational efficiency could be achieved through reduced-order or surrogate models while maintaining sufficient predictive accuracy. Such approaches could facilitate the application of the developed multiphysics framework to real-time control, optimization, and industrial PEMFC system analysis.
2.4. Mathematical Model
2.4.1. Hydrogen Fuel Cell
The electrochemical performance of the PEM fuel cell was described by coupled equations representing charge conservation, species transport, and gas flow within the membrane electrode assembly.
where is is the electronic current density (A m−2), σs is the electronic conductivity of the solid phase (S m−1), ϕs is the solid-phase electric potential (V), and iv,total is the volumetric electrochemical reaction rate (A m−3).
∇·is = −iv,total
is = −σs∇ϕs
2.4.2. Ionic Charge Conservation
∇·il = iv,total
il = −σl,eff∇ϕl
2.4.3. Species Transport
The transport of gaseous species inside the porous cathode was governed by the Maxwell–Stefan formulation.
where ji is the diffusive mass flux of species i (kg m−2 s−1), ρ is the gas density (kg m−3), u is the gas velocity (m s−1), ωi is the mass fraction of species i (dimensionless), xk is the mole fraction of species k (dimensionless), Dik,eff is the effective binary diffusion coefficient (m2 s−1), dk is the diffusion driving force (dimensionless), Ri,total is the volumetric source term due to electrochemical reactions (kg m−3 s−1), Mk is the molecular weight of species k (kg mol−1), Mn is the mean molecular weight of the gas mixture (kg mol−1), and pa is the absolute gas pressure (Pa).
∇·ji + ρ(u·∇)ωi = Ri,total
ji = −ρωi∑kDik,eff dk
dk = ∇xk + (1/pa)(xk − ωk)∇pa
xk = (ωk/Mk)Mn
2.4.4. Continuity Equation
∇·(ρu) = Qm
2.4.5. Darcy’s Law
Gas flow through the porous gas diffusion layer and catalyst layer was described by Darcy’s law:
where u is the gas velocity (m s−1), κg is the permeability of the porous medium (m2), μ is the dynamic viscosity of the gas (Pa s), and p is the gas pressure (Pa).
u = −(κg/μ)∇p
2.4.6. Absolute Pressure
pa = p + pref
2.4.7. Boundary Conditions
H2 Gas Phase
- (1)
- Partial Pressure
pi = xipa
The partial pressure of each gaseous species is calculated from its mole fraction and the absolute gas pressure. Here, pi denotes the partial pressure of species i (Pa), xi is the mole fraction of species i (dimensionless), and pa represents the absolute gas pressure (Pa).
- (2)
- Mixture Molecular Weight
Mn = ∑ixiMi
The average molecular weight of the gas mixture is determined from the mole-fraction-weighted molecular weights of all gas species. In this expression, Mn is the average molecular weight of the mixture (kg mol−1), xi is the mole fraction of species i (dimensionless), and Mi is the molecular weight of species i (kg mol−1).
- (3)
- Water Vapor Mole Fraction
xH2O = [pvap(Thum)/pa,hum]RHhum
The water vapor mole fraction in the humidified gas stream is calculated from the relative humidity and the saturation vapor pressure at the humidification temperature. Here, xH2O is the water vapor mole fraction (dimensionless), RHhum is the relative humidity (dimensionless), pvap(Thum) is the saturation vapor pressure at the humidification temperature (Pa), and pa,hum is the absolute pressure of the humidified gas (Pa).
- (4)
- Dry Gas Correction
xi = xi,dry(1 − xH2O)
The mole fraction of each gaseous species in the humidified mixture is obtained by correcting the corresponding dry-gas composition according to the water vapor content. In this equation, xi is the mole fraction in the humidified gas mixture (dimensionless), xi,dry is the mole fraction under dry conditions (dimensionless), and xH2O is the water vapor mole fraction (dimensionless).
2.5. Validation Study
To evaluate the predictive capability of the developed PEM fuel cell model, the numerical results were validated against the experimental polarization data reported by Butori et al. [1]. The validation dataset includes polarization curves obtained under two different oxidant conditions, namely humidified air and humidified oxygen, at an operating temperature of 100 °C. The use of pure oxygen provides a higher oxygen concentration at the cathode, resulting in higher current densities than those obtained with air at the same cell voltage. The agreement between the numerical model and the experimental measurements was improved through a parameter estimation procedure. Rather than modifying all model inputs simultaneously, only the electrochemical parameters that predominantly govern activation, ohmic, and concentration losses were calibrated. Consequently, the calibrated model reproduces the experimentally observed polarization behavior over the investigated operating range while maintaining the physical significance of the remaining material and geometric parameters. The polarization curve can generally be divided into three characteristic regions. At high cell voltages and low current densities, cell performance is primarily controlled by activation overpotentials associated with the oxygen reduction reaction (ORR), resulting in a nonlinear decrease in cell voltage with increasing current density. As the current density increases, ohmic resistance within the membrane and porous electrodes becomes increasingly dominant, producing an approximately linear decrease in cell voltage. At high current densities and low cell voltages, oxygen transport limitations become increasingly significant, particularly under air-fed operation, causing a pronounced deviation of the polarization curve toward the limiting-current region. To accurately capture these three operating regimes, four calibration parameters were selected during the validation process. The membrane electrolyte conductivity was adjusted to reproduce the slope of the polarization curve in the ohmic region. The ORR reference exchange current density and cathodic charge transfer coefficient were calibrated to improve the prediction of activation losses at low current densities. Finally, the limiting current density parameter was adjusted to represent oxygen transport limitations at high current densities. These parameters affect distinct regions of the polarization curve, enabling the numerical model to achieve consistent agreement with the experimental observations across the investigated operating range. The optimized parameter values obtained from the calibration procedure were subsequently used in the final numerical model. The comparison between the experimental measurements and numerical predictions is presented in Figure 3. The close agreement between the two datasets demonstrates that the developed model provides a satisfactory representation of the electrochemical behavior of the PEM fuel cell under both humidified air and humidified oxygen operating conditions.
Figure 3.
(a) Validation of the developed PEMFC model against experimental polarization data under humidified air and humidified oxygen conditions at 100 °C, and (b) validation of the developed PEMFC model against experimental polarization data at 80 °C and 70% RH.
It should be noted that while the benchmark experimental data from Butori et al. [1] were obtained at 100 °C, the underlying governing equations of the multiphysics model account for temperature variations through fundamental physical laws. Specifically, the electrochemical kinetics follow Arrhenius temperature dependence, gas diffusivities vary with temperature according to Kinetic Gas Theory, and water saturation pressure is continuously updated based on local thermal conditions. This ensures that the calibrated baseline model remains physically consistent and reliable when extrapolated across the parametric sweep range of 60 °C to 100 °C.
Furthermore, the model performance was also evaluated against the experimental polarization data reported by Butori et al. [1] at 80 °C and 70% relative humidity (Figure 3b). While the benchmark calibration was established at 100 °C (Figure 3a), the calibrated parameter values obtained from the 100 °C validation were directly applied to the 80 °C condition without further parameter fitting. The underlying governing equations of the multiphysics model account for temperature variations through the relevant physical relationships. Specifically, the electrochemical kinetics follow Arrhenius temperature dependence, gas diffusivities vary with temperature according to Kinetic Gas Theory, and water saturation pressure is updated according to the local thermal conditions. The agreement between the numerical predictions and experimental measurements at 80 °C and 70% RH provides additional evidence that the calibrated model maintains satisfactory predictive capability at an operating condition within the temperature and relative humidity ranges investigated in the present study.
3. Results
In Case 1, the effect of operating temperature on PEMFC electrochemical and transport behavior was investigated by varying the cell temperature from 60 to 100 °C (60, 80, and 100 °C), while the relative humidity, membrane thickness, membrane electrolyte conductivity, ORR reference exchange current density, and cell voltage were maintained at their baseline values of 70%, 9 µm, 10 S m−1, 10−3 A m−2, and 0.60 V, respectively.
As shown in Figure 4, the Electrode Potential with Respect to Ground decreases slightly with increasing operating temperature. At 60 °C, the maximum electrode potential is 0.6080 V, which decreases to 0.6063 V at 80 °C and further to 0.6030 V at 100 °C. Thus, increasing the temperature from 60 to 100 °C results in an overall decrease of approximately 0.0050 V (0.82%) in the electrode potential. The relatively small variation indicates that the electronic-phase potential is only moderately sensitive to temperature within the investigated range. Nevertheless, the relatively small variation in electrode potential indicates that the electronic-phase response is only moderately sensitive to temperature within the investigated range. Under the present model formulation, the observed variation can be interpreted in terms of changes in the coupled electrochemical and transport conditions associated with the imposed operating temperature. Because the membrane electrolyte conductivity is prescribed as a constant effective parameter in the present simulations, the results should not be interpreted as evidence of a temperature-induced change in membrane conductivity or membrane hydration.
Figure 4.
Electrode potential distribution in the PEMFC at different operating temperatures: (a) 60 °C, (b) 80 °C, and (c) 100 °C.
As shown in Figure 5 and the summary metrics, the electrolyte potential field across the cell domain shifts toward mathematically lower (more negative) values as the operating temperature increases. At 60 °C, the electrolyte potential reaches its maximum value of −0.0210 V at the cathode catalyst layer/electrolyte boundary and a minimum value of −0.0680 V at the anode catalyst layer/electrolyte boundary, yielding a domain spatial average of −0.0445 V. As the temperature increases to 80 °C and 100 °C, the maximum boundary potential at the cathode interface becomes more negative, dropping to −0.0386 V and −0.0638 V, respectively (representing an overall mathematical decrease of 0.0428 V across the maximum boundary). Concurrently, the minimum potential at the anode boundary decreases to −0.0760 V at 80 °C and −0.0830 V at 100 °C, while the domain spatial average decreases to −0.0573 V and −0.0734 V. The stronger variation observed in the electrolyte potential compared to the electrode potential indicates that the modeled protonic potential response is highly sensitive to changes in operating conditions. Since the membrane electrolyte conductivity is fixed at 10 S m−1 in the present model, this trend reflects the intrinsic response of the ionic potential field under coupled electrochemical transport conditions rather than temperature-dependent conductivity variations.
Figure 5.
Electrolyte potential distribution in the PEMFC at different operating temperatures: (a) 60 °C, (b) 80 °C, and (c) 100 °C.
The pressure distribution decreases with increasing operating temperature. The maximum pressure values are approximately 0.0099 Pa at 60 °C, 0.0085 Pa at 80 °C, and 0.0042 Pa at 100 °C. This reduction indicates that higher operating temperatures modify the gas transport characteristics within the porous regions and channels, resulting in a lower pressure level. The decrease in pressure is particularly pronounced between 80 and 100 °C, suggesting an enhanced influence of temperature on the flow and transport behavior of the PEMFC. Overall, the results demonstrate that operating temperature affects not only the electrochemical characteristics but also the pressure distribution and gas transport behavior within the cell (Figure 6).
Figure 6.
Pressure drop distribution in the PEMFC at different operating temperatures: (a) 60 °C, (b) 80 °C, and (c) 100 °C.
The maximum O2 mole fraction decreases progressively with increasing operating temperature, from 0.18106 at 60 °C to 0.14121 at 80 °C and 0.06287 at 100 °C. This corresponds to an overall reduction of approximately 65.3% in the maximum O2 mole fraction between 60 and 100 °C. The pronounced decrease in the maximum O2 mole fraction indicates that the local gas-phase oxygen distribution is strongly affected by the increase in operating temperature under the applied model conditions. The particularly low maximum value at 100 °C suggests a substantial change in oxygen distribution within the evaluated PEMFC domain. However, because these values represent the maximum local mole fractions, the observed reduction should be interpreted as a change in the local species distribution rather than direct evidence of increased overall oxygen consumption throughout the cell (Figure 7).
Figure 7.
O2 mole fraction distribution in the PEMFC at different operating temperatures: (a) 60 °C, (b) 80 °C, and (c) 100 °C.
The maximum H2O mole fraction remains constant at 0.71247 for all investigated operating temperatures of 60, 80, and 100 °C. This indicates that the maximum local H2O mole fraction does not exhibit a noticeable variation with temperature under the applied model and boundary conditions. Since the reported values correspond to the maximum local mole fraction, the constant value should be interpreted as an unchanged maximum H2O concentration within the evaluated PEMFC domain rather than as evidence that the water distribution is identical throughout the cell. The result suggests that the maximum local H2O mole fraction is relatively insensitive to operating temperature under the present simulation conditions (Figure 8).
Figure 8.
H2O mole fraction distribution in the PEMFC at different operating temperatures: (a) 60 °C, (b) 80 °C, and (c) 100 °C.
The maximum N2 mole fraction decreases substantially with increasing operating temperature, from 0.68114 at 60 °C to 0.53122 at 80 °C and 0.23650 at 100 °C. This corresponds to an overall reduction of approximately 65.3% in the maximum N2 mole fraction between 60 and 100 °C. The progressive decrease indicates that the maximum local N2 distribution is sensitive to temperature under the applied model and boundary conditions. The pronounced reduction at 100 °C indicates a substantial change in the local gas-phase composition within the evaluated PEMFC domain. This trend is qualitatively consistent with the decrease observed in the maximum O2 mole fraction, suggesting that increasing operating temperature modifies the local gas-species distribution in the cathode region. Since the reported values represent maximum local mole fractions, the observed reduction should be interpreted as a change in the local species distribution rather than direct evidence of increased nitrogen transport or reactant consumption throughout the entire cell (Figure 9).
Figure 9.
N2 mole fraction distribution in the PEMFC at different operating temperatures: (a) 60 °C, (b) 80 °C, and (c) 100 °C.
In Case 2, the influence of inlet gas relative humidity was examined by varying the relative humidity from 40 to 70% (40, 55, and 70%), while maintaining the operating temperature at 100 °C, membrane thickness at 9 µm, membrane electrolyte conductivity at 10 S m−1, ORR reference exchange current density at 10−3 A m−2, and cell voltage at 0.60 V.
The electrode potential shows a slight decrease with increasing inlet gas relative humidity. The maximum electrode potential was approximately 0.6054 V at 40% relative humidity, 0.6043 V at 55%, and 0.6030 V at 70%. Although the overall variation is relatively small, the gradual decrease indicates that increasing humidity modifies the electrochemical and proton-transport conditions within the membrane electrode assembly. The electrode potential shows a slight decrease with increasing inlet gas relative humidity. The maximum electrode potential was approximately 0.6054 V at 40% relative humidity, 0.6043 V at 55%, and 0.6030 V at 70%. Although the overall variation is relatively small, the gradual change indicates that the imposed inlet humidity modifies the coupled electrochemical and gas-transport conditions within the membrane electrode assembly. Under the present model formulation, membrane electrolyte conductivity is maintained at a constant value of 10 S m−1 for all relative-humidity cases. Therefore, the observed change in electrode potential should not be interpreted as resulting from a calculated humidity-dependent change in membrane proton conductivity. Instead, it reflects the response of the modeled electrochemical system to changes in the inlet gas composition and associated transport conditions (Figure 10).
Figure 10.
Electrode potential distribution in the PEMFC at different inlet gas relative humidity levels: (a) 40%, (b) 55%, and (c) 70%.
Figure 11 illustrates the electrolyte potential distribution in the PEMFC under different inlet gas relative humidity levels: (a) 40%, (b) 55%, and (c) 70%. As summarized in the table above, the electrolyte potential field shifts to lower mathematical values (becomes more negative) across the domain as relative humidity increases. At 40% RH, the electrolyte potential reaches its maximum value of −0.0430 V at the cathode catalyst layer/electrolyte boundary and a minimum value of −0.0882 V at the anode catalyst layer/electrolyte boundary, yielding a domain spatial average of −0.0656 V. As the relative humidity increases to 55% and 70%, the maximum boundary potential at the cathode interface drops (becomes more negative) to −0.0583 V and −0.0638 V, respectively. Concurrently, the domain spatial average potential decreases from −0.0656 V at 40% RH to −0.0717 V at 55% RH and −0.0734 V at 70% RH. This trend indicates that the modeled electrolyte potential field is sensitive to the imposed inlet humidity under the present operating and boundary conditions. Because the membrane electrolyte conductivity is prescribed as a constant value of 10 S m−1 for all relative humidity cases, the observed variation cannot be attributed to a simulated humidity-dependent change in membrane proton conductivity. Instead, the result reflects the response of the ionic potential field to changes in inlet gas composition and the associated coupled electrochemical and transport conditions. Furthermore, the smaller variation observed between 55% and 70% RH indicates a reduced incremental response of the modeled electrolyte potential at higher humidity levels.
Figure 11.
Electrolyte potential distribution in the PEMFC at different inlet gas relative humidity levels: (a) 40%, (b) 55%, and (c) 70%.
The pressure drop decreases progressively with increasing inlet gas relative humidity. The maximum pressure drop values were approximately 0.00810 Pa at 40% relative humidity, 0.00627 Pa at 55%, and 0.00427 Pa at 70%. This reduction indicates that increasing gas humidity alters the flow and transport characteristics within the porous regions of the PEMFC, leading to a lower pressure gradient. The most pronounced reduction occurs between 40% and 55% relative humidity, while a further decrease is observed at 70%. Overall, the results demonstrate that inlet gas relative humidity has a noticeable influence on the pressure distribution and gas transport behavior within the PEMFC (Figure 12).
Figure 12.
Pressure drop distribution in the PEMFC at different inlet gas relative humidity levels: (a) 40%, (b) 55%, and (c) 70%.
The maximum O2 mole fraction decreases progressively with increasing inlet gas relative humidity, from 0.12592 at 40% RH to 0.09439 at 55% RH and 0.06287 at 70% RH. This represents an overall reduction of approximately 50.1% in the maximum O2 mole fraction between 40% and 70% RH. The observed decrease indicates that the maximum local oxygen distribution is sensitive to inlet relative humidity under the applied model and boundary conditions. The lower maximum O2 mole fraction at higher relative humidity suggests that changes in humidity modify the local gas-phase composition and oxygen transport characteristics within the evaluated PEMFC domain. This behavior may be associated with changes in water content and gas-phase transport under humidified operating conditions. Since the reported values correspond to maximum local mole fractions, the observed reduction should be interpreted as a change in the local oxygen distribution rather than direct evidence of increased oxygen consumption or concentration losses throughout the entire cell (Figure 13).
Figure 13.
O2 mole fraction distribution in the PEMFC at different inlet gas relative humidity levels: (a) 40%, (b) 55%, and (c) 70%.
The maximum H2O mole fraction remains constant at 0.71247 for all investigated inlet relative humidity levels of 40%, 55%, and 70%. This indicates that the maximum local H2O mole fraction does not exhibit a noticeable variation with inlet relative humidity under the applied model and boundary conditions. Since the reported values correspond to the maximum local mole fraction, the constant value should be interpreted as an unchanged maximum H2O concentration within the evaluated PEMFC domain rather than as evidence that the complete water distribution remains identical throughout the cell. The result suggests that the maximum local H2O mole fraction is relatively insensitive to the investigated changes in inlet relative humidity under the present simulation conditions (Figure 14).
Figure 14.
H2O mole fraction distribution in the PEMFC at different inlet gas relative humidity levels: (a) 40%, (b) 55%, and (c) 70%.
The maximum N2 mole fraction decreases progressively with increasing inlet gas relative humidity, from 0.47371 at 40% RH to 0.35510 at 55% RH and 0.23650 at 70% RH. This corresponds to an overall reduction of approximately 50.1% in the maximum N2 mole fraction between 40% and 70% RH. The observed decrease indicates that the maximum local N2 distribution is sensitive to inlet relative humidity under the applied model and boundary conditions. The similar decreasing trend observed for the maximum O2 mole fraction suggests that increasing relative humidity modifies the local gas-phase composition and species distribution within the evaluated PEMFC domain. Since the reported values represent maximum local mole fractions, the observed reduction should be interpreted as a change in local species distribution rather than direct evidence of increased nitrogen transport or reactant consumption throughout the entire cell. The results therefore indicate that inlet relative humidity has a noticeable influence on the calculated maximum local gas-species distributions under the present simulation conditions (Figure 15).
Figure 15.
N2 mole fraction distribution in the PEMFC at different inlet gas relative humidity levels: (a) 40%, (b) 55%, and (c) 70%.
In Case 3, the effect of membrane thickness on PEMFC performance was evaluated by varying the membrane thickness between 5 and 15 µm (5, 10, and 15 µm), while the operating temperature, inlet relative humidity, membrane electrolyte conductivity, ORR reference exchange current density, and cell voltage were fixed at 100 °C, 70%, 10 S m−1, 10−3 A m−2, and 0.60 V, respectively.
The electrode potential showed very little variation with membrane thickness. The maximum electrode potential was 0.6029 V at 5 µm, while it increased slightly to 0.6030 V at both 10 and 15 µm. This negligible variation indicates that, under the investigated operating conditions, membrane thickness has a limited influence on the maximum electrode potential. The nearly identical values suggest that the effect of membrane thickness is more likely to be reflected in proton transport resistance and electrolyte potential rather than in the absolute maximum electrode potential (Figure 16).
Figure 16.
Electrode potential distribution in the PEMFC at different membrane thicknesses: (a) 5 µm, (b) 10 µm, and (c) 15 µm.
Figure 17 shows the electrolyte potential distribution in the PEMFC at different membrane thicknesses: (a) 5 µm, (b) 10 µm, and (c) 15 µm. As summarized in the table above, the electrolyte potential exhibits an almost negligible variation across the investigated thickness range. At a membrane thickness of 5 µm, the electrolyte potential reaches its maximum value of −0.06363 V at the cathode catalyst layer/electrolyte boundary and its minimum value of −0.0825 V at the anode catalyst layer/electrolyte boundary, yielding a domain spatial average of −0.0731 V. As the membrane thickness increases to 10 µm and 15 µm, the maximum potential shifts slightly to mathematically lower (more negative) values, reaching −0.06380 V for both cases. Concurrently, the domain spatial average potential shows a minimal change, decreasing slightly from −0.0731 V at 5 µm to −0.0735 V at 10 µm and −0.0740 V at 15 µm. This minor variation indicates that variations in membrane thickness have a very limited effect on the local electrolyte potential field under the prescribed operating conditions. The nearly identical values for the 10 µm and 15 µm cases further confirm that increasing membrane thickness beyond 10 µm does not significantly alter the maximum or average electrolyte potential within the membrane electrode assembly.
Figure 17.
Electrolyte potential distribution in the PEMFC at different membrane thicknesses: (a) 5 µm, (b) 10 µm, and (c) 15 µm.
The pressure drop showed a slight decrease as the membrane thickness increased. The pressure drop was 0.0434 Pa at 5 µm, decreased to 0.0426 Pa at 10 µm, and reached 0.0421 Pa at 15 µm. This corresponds to an overall reduction of approximately 3.0% between 5 and 15 µm. The relatively small variation indicates that membrane thickness has a limited effect on the pressure distribution under the investigated operating conditions (Figure 18).
Figure 18.
Pressure drop distribution in the PEMFC at different membrane thicknesses: (a) 5 µm, (b) 10 µm, and (c) 15 µm.
In Case 4, the influence of membrane electrolyte conductivity was investigated by varying its value from 5 to 15 S m−1 (5, 10, and 15 S m−1), while the operating temperature, inlet relative humidity, membrane thickness, ORR reference exchange current density, and cell voltage were kept constant at 100 °C, 70%, 9 µm, 10−3 A m−2, and 0.60 V, respectively.
The electrode potential exhibited only a very small variation with increasing membrane electrolyte conductivity. The maximum electrode potential increased from 0.6029 V at 5 S m−1 to 0.6030 V at 10 S m−1 and remained essentially unchanged at 0.6030 V at 15 S m−1. This negligible variation indicates that, under the investigated operating conditions, increasing membrane conductivity above 10 S m−1 provides only a marginal improvement in the electrode potential distribution. The result suggests that membrane ohmic resistance is not the dominant limitation within the investigated conductivity range, while other factors, such as electrochemical kinetics and mass-transport processes, may have a stronger influence on the electrode potential (Figure 19).
Figure 19.
Electrode potential distribution in the PEMFC at different membrane electrolyte conductivity levels: (a) 5 S m−1, (b) 10 S m−1, and (c) 15 S m−1.
Figure 20 illustrates the electrolyte potential distribution in the PEMFC at different membrane electrolyte conductivity levels: (a) 5 S m−1, (b) 10 S m−1, and (c) 15 S m−1. As summarized in the table above, the electrolyte potential field showed a very limited variation across the investigated conductivity range. At a membrane conductivity of 5 S m−1, the electrolyte potential reaches its maximum value of −0.0636 V at the cathode catalyst layer/electrolyte boundary and its minimum value of −0.0842 V at the anode catalyst layer/electrolyte boundary, yielding a domain spatial average of −0.0739 V. As the membrane electrolyte conductivity increases to 10 S m−1 and 15 S m−1, the maximum potential shifts slightly to mathematically lower (more negative) values, becoming −0.0638 V at 10 S m−1 and remaining essentially constant at −0.0638 V at 15 S m−1. Concurrently, the domain spatial average potential increases slightly (becomes less negative) from −0.0739 V at 5 S m−1 to −0.0734 V at 10 S m−1 and −0.07315 V at 15 S m−1. This minor variation indicates that increasing the membrane electrolyte conductivity beyond 10 S m−1 has a negligible effect on the overall protonic potential distribution under the investigated operating conditions. The results confirm that while proton transport resistance is slightly reduced as conductivity increases, the spatial distribution of the electrolyte potential field remains stable within the studied conductivity range.
Figure 20.
Electrolyte potential distribution in the PEMFC at different membrane electrolyte conductivity levels: (a) 5 S m−1, (b) 10 S m−1, and (c) 15 S m−1.
The pressure drop shows only a slight increase with increasing membrane electrolyte conductivity. The maximum pressure drop increases from 0.00422 Pa at 5 S m−1 to 0.00427 Pa at 10 S m−1 and 0.00429 Pa at 15 S m−1. This very small variation indicates that membrane electrolyte conductivity has a negligible effect on the pressure distribution within the PEMFC under the investigated operating conditions. The nearly constant pressure drop also suggests that gas-flow behavior is governed primarily by the porous transport properties and flow conditions rather than by protonic conductivity (Figure 21).
Figure 21.
Pressure drop distribution in the PEMFC at different membrane electrolyte conductivities: (a) 5 S m−1, (b) 10 S m−1, and (c) 15 S m−1.
In Case 5, the effect of cathodic reaction kinetics was investigated by varying the ORR reference exchange current density over three orders of magnitude, from 10−4 to 10−2 A m−2 (10−4, 10−3, and 10−2 A m−2). All other parameters were maintained at their baseline values, corresponding to an operating temperature of 100 °C, relative humidity of 70%, membrane thickness of 9 µm, membrane electrolyte conductivity of 10 S m−1, and cell voltage of 0.60 V.
The electrode potential increased systematically with increasing ORR reference exchange current density. The maximum electrode potential was 0.6004 V at 10−4 A m−2, increasing to 0.6030 V at 10−3 A m−2 and reaching 0.6080 V at 10−2 A m−2. This trend indicates that enhanced ORR kinetics reduce cathodic activation losses and consequently improve the electronic-phase potential within the PEMFC. The increase becomes more pronounced at the highest exchange current density, confirming that ORR kinetics have a direct influence on the electrochemical performance of the cathode. Overall, the results demonstrate that increasing the ORR reference exchange current density from 10−4 to 10−2 A m−2 improves the electrode potential by approximately 7.6 mV, highlighting the sensitivity of the PEMFC response to cathode reaction kinetics (Figure 22).
Figure 22.
Electrode potential distribution in the PEMFC at different ORR reference exchange current densities: (a) 10−4 A m−2, (b) 10−3 A m−2, and (c) 10−2 A m−2.
Figure 23 illustrates the electrolyte potential distribution in the PEMFC at different ORR reference exchange current density levels: (a) 10−4 A m−2, (b) 10−3 A m−2, and (c) 10−2 A m−2. As summarized in the table above, the electrolyte potential field shifts to lower mathematical values (becomes progressively more negative) across the entire domain as the ORR reference exchange current density increases. At 10−4 A m−2, the electrolyte potential reaches its maximum value of −0.0589 V at the cathode catalyst layer/electrolyte boundary and its minimum value of −0.0785 V at the anode catalyst layer/electrolyte boundary, yielding a domain spatial average of −0.0687 V. As the exchange current density increases to 10−3 A m−2 and 10−2 A m−2, the maximum boundary potential at the cathode interface drops (becomes more negative) to −0.0638 V and −0.0836 V, respectively. Concurrently, the domain spatial average potential decreases from −0.0687 V at 10−4 A m−2 to −0.0734 V at 10−3 A m−2 and −0.1091 V at 10−2 A m−2. This behavior indicates that enhanced ORR kinetics significantly affect the protonic potential distribution within the membrane electrode assembly. The relatively small shift observed between 10−4 and 10−3 A m−2 becomes considerably more pronounced at 10−2 A m−2, demonstrating a strong electrochemical coupling at higher exchange current densities. Overall, these results show that the ORR reference exchange current density exerts a substantially stronger influence on the electrolyte potential field than on the electrode potential field, highlighting the critical role of cathodic reaction kinetics in driving proton transport and associated ohmic/activation losses in the PEMFC.
Figure 23.
Electrolyte potential distribution in the PEMFC at different ORR reference exchange current density levels: (a) 10−4 A m−2, (b) 10−3 A m−2, and (c) 10−2 A m−2.
The pressure drop increases markedly with increasing ORR reference exchange current density. At 10−4 A m−2, the pressure drop is only 8.31 × 10⁻⁴ Pa, whereas it increases to 4.27 × 10⁻³ Pa at 10−3 A m−2 and reaches 1.09 × 10⁻² Pa at 10−2 A m−2. This corresponds to an approximately 5.1-fold increase from 10−4 to 10−3 A m−2, followed by a further 2.6-fold increase from 10−3 to 10−2 A m−2. The results indicate that enhanced ORR kinetics are accompanied by increased reactant consumption and stronger coupled transport effects within the porous electrode structure, leading to a higher pressure drop. Therefore, the ORR reference exchange current density has a noticeable indirect influence on gas-phase transport and pressure distribution in the PEMFC (Figure 24).
Figure 24.
Pressure drop distribution in the PEMFC at different ORR reference exchange current densities: (a) 10−4 A m−2, (b) 10−3 A m−2, and (c) 10−2 A m−2.
In Case 6, the influence of cell operating voltage on the electrochemical and transport characteristics of the PEMFC was evaluated at 0.40, 0.60, and 0.80 V. During this analysis, the operating temperature, inlet relative humidity, membrane thickness, membrane electrolyte conductivity, and ORR reference exchange current density were maintained at 100 °C, 70%, 9 µm, 10 S m−1, and 10−3 A m−2, respectively.
The electrode potential increases consistently with the applied cell operating voltage. The calculated electrode potential is 0.414 V at 0.40 V, 0.6030 V at 0.60 V, and 0.800 V at 0.80 V. The results show that the electrode potential closely follows the imposed cell voltage, with only a small deviation of approximately 0.014 V observed at 0.40 V. At 0.60 and 0.80 V, the calculated values are very close to the corresponding applied voltages, indicating that the electronic potential distribution is strongly governed by the prescribed cell operating voltage. This behavior confirms the consistency of the numerical model and demonstrates that cell voltage is a direct controlling parameter for the electrode potential distribution (Figure 25).
Figure 25.
Electrode potential distribution in the PEMFC at different cell operating voltages: (a) 0.40 V, (b) 0.60 V, and (c) 0.80 V.
Figure 26 illustrates the electrolyte potential distribution in the PEMFC at different cell operating voltages: (a) 0.40 V, (b) 0.60 V, and (c) 0.80 V. As summarized in the table above, the electrolyte potential field becomes mathematically higher (progressively less negative) across the entire domain as the cell operating voltage increases. At a cell operating voltage of 0.40 V, the electrolyte potential reaches its maximum value of −0.1080 V at the cathode catalyst layer/electrolyte boundary and its minimum value of −0.2030 V at the anode catalyst layer/electrolyte boundary, yielding a domain spatial average of −0.1555 V. As the operating voltage increases to 0.60 V and 0.80 V, the maximum potential at the cathode boundary increases to mathematically higher values of −0.0638 V and −0.0539 V, respectively. Concurrently, the domain spatial average potential increases (becomes less negative) from −0.1555 V at 0.40 V to −0.0734 V at 0.60 V and −0.0540 V at 0.80 V. Thus, increasing the cell operating voltage from 0.40 V to 0.80 V results in a substantial reduction in the magnitude of the electrolyte potential gradient across the membrane electrode assembly. The more negative electrolyte potential observed at 0.40 V corresponds to higher current densities and a greater proton-transport potential drop, whereas the smaller magnitude at 0.80 V reflects lower current densities and a more uniform protonic potential distribution. Overall, the results demonstrate that cell operating voltage exerts a dominant influence on proton transport and the associated electrochemical ohmic losses within the PEMFC.
Figure 26.
Electrolyte potential distribution in the PEMFC at different cell operating voltages: (a) 0.40 V, (b) 0.60 V, and (c) 0.80 V.
The pressure drop decreases significantly as the cell operating voltage increases. The calculated pressure drop is 0.0187 Pa at 0.40 V, decreases to 0.00427 Pa at 0.60 V, and reaches only 9.24 × 10⁻⁵ Pa at 0.80 V. This corresponds to a substantial reduction of approximately 77% when the voltage increases from 0.40 to 0.60 V, while the pressure drop at 0.80 V is nearly negligible compared with the lower-voltage cases. These results indicate that the cell operating voltage has a pronounced influence on the gas transport and pressure distribution within the PEMFC. The higher pressure drop at lower cell voltage can be associated with increased electrochemical activity and reactant consumption, which intensify coupled mass-transport effects in the porous electrode and gas-diffusion regions. Overall, the results demonstrate that increasing the operating voltage considerably reduces the pressure-drop response of the modeled PEMFC (Figure 27).
Figure 27.
Pressure drop distribution in the PEMFC at different cell operating voltages: (a) 0.40 V, (b) 0.60 V, and (c) 0.80 V.
The species-transport analysis was evaluated based on the maximum local mole fraction obtained for O2, H2O, and N2 in each parametric case. The maximum O2 and N2 mole fractions exhibited noticeable variations in Cases 1 and 2, where operating temperature and inlet relative humidity were varied, respectively. In contrast, the maximum H2O mole fraction remained constant at the evaluated value. For Cases 3–6, the maximum mole fractions of O2, H2O, and N2 remained essentially unchanged despite variations in membrane thickness, membrane electrolyte conductivity, ORR reference exchange current density, and cell operating voltage. These results indicate that, under the applied boundary conditions and at the locations corresponding to the maximum values, the local gas-phase composition is more sensitive to operating temperature and inlet relative humidity than to the investigated membrane and electrochemical parameters. However, the constancy of the maximum mole fractions in Cases 3–6 does not imply that the complete species distributions are identical throughout the PEMFC, since local concentration gradients and spatial distributions may still vary even when their maximum values remain unchanged.
4. Discussion
The parametric results show that operating conditions and electrochemical kinetics influence different aspects of PEMFC behavior. Among the investigated parameters, operating temperature produced a noticeable change in electrolyte potential, pressure distribution, and local gas composition, whereas its effect on electrode potential was relatively limited. The decrease in electrolyte potential from −0.0210 V at 60 °C to −0.0638 V at 100 °C indicates that temperature mainly affects the protonic transport behavior of the membrane electrode assembly. The parametric results show that operating conditions and electrochemical kinetics influence different aspects of PEMFC behavior. Among the investigated parameters, operating temperature produced a noticeable change in electrolyte potential, pressure distribution, and local gas composition, whereas its effect on electrode potential was relatively limited. The decrease in electrolyte potential from −0.0210 V at 60 °C to −0.0638 V at 100 °C indicates that the modeled protonic potential field is sensitive to the imposed operating temperature. Relative humidity showed a similar but more pronounced effect on electrolyte potential and local gas composition. Increasing RH from 40% to 70% resulted in a more negative electrolyte potential and lower maximum O2 and N2 mole fractions. These responses demonstrate that temperature and inlet humidity substantially affect the coupled transport and electrochemical fields represented in the present model. Importantly, the present simulations prescribe the membrane electrolyte conductivity as a constant effective value of 10 S m−1 across the temperature and relative-humidity cases. No explicit membrane water-content variable or hydration-dependent conductivity relationship is included in the model. Therefore, the observed changes in electrolyte potential should not be interpreted as direct evidence of changes in membrane hydration or proton conductivity. Rather, they represent the response of the modeled ionic potential field to changes in the imposed operating conditions and coupled transport processes. This distinction is important when interpreting the present sensitivity results and defines the scope of the conclusions that can be drawn from the current model formulation. The relatively small variation in electrode potential suggests that the electronic response is less sensitive to humidity than the protonic and species-transport fields under the present conditions. In contrast, membrane thickness and electrolyte conductivity produced only minor changes in the calculated responses. Although membrane thickness and proton conductivity are fundamental parameters in PEMFC transport models [2,12,15], their limited influence in the present simulations indicates that the investigated ranges were not the dominant sources of performance variation under the selected operating conditions. This also highlights the importance of considering parameter interactions and the operating regime when interpreting PEMFC model sensitivity. The ORR reference exchange current density exhibited a substantially stronger influence. Increasing the exchange current density from 10−4 to 10−2 A m−2 increased the electrode potential from 0.6004 to 0.6080 V and caused a marked increase in pressure drop. The corresponding change in electrolyte potential was also considerably larger than those obtained for membrane thickness or conductivity. These results confirm the importance of cathodic reaction kinetics, particularly ORR parameters, in determining PEMFC activation losses. Previous parameter-estimation studies have similarly identified electrochemical kinetic parameters among the most influential parameters in polarization-curve modeling [3,4,5,6,7,14,16]. The effect of cell voltage was also pronounced. Increasing the operating voltage from 0.40 to 0.80 V caused the electrode potential to approach the imposed voltage while substantially reducing the pressure drop and the magnitude of the electrolyte potential. The strong response to cell voltage is expected because the imposed operating potential directly determines the electrochemical driving conditions and associated reaction rates. Overall, the results agree with the established understanding that PEMFC performance results from the combined effects of activation, ohmic, and mass-transport losses [12,15]. An important outcome of the present analysis is that the different parameters do not affect all model responses in the same manner. ORR kinetics and cell voltage were particularly important for electrochemical potential responses, whereas temperature and relative humidity had greater effects on protonic potential and local gas-species distributions. This distinction is relevant for subsequent parameter calibration and optimization studies because treating all model parameters as equally influential may lead to inefficient calibration procedures. Previous studies have emphasized the difficulty of PEMFC parameter estimation due to parameter coupling and the different sensitivities of model outputs [3,4,5,6,7]. The present results therefore provide a physically interpretable basis for selecting parameters for future calibration, optimization, and data-driven PEMFC modeling. Finally, it is worth noting the methodological limitations of the present study. Although the OFAT parametric analysis successfully decouples and clarifies the direct physical mechanisms governing potential fields and transport losses, it inherently omits non-linear cross-parameter interactions. Given the strongly coupled multiphysics nature of PEMFCs, future work will focus on integrating Global Sensitivity Analysis (GSA) techniques (such as Sobol’ sensitivity variance analysis or Response Surface Methodology) to comprehensively map multi-parameter coupling and trade-offs across broader operational envelopes. The sensitivity results can also be translated into practical operational and membrane-design guidelines within the investigated parameter ranges. First, the appropriate operating strategy depends on the dominant polarization regime. At low current densities, the model indicates that electrochemical kinetics, particularly the oxygen reduction reaction (ORR), are more influential than variations in temperature or relative humidity. Therefore, for low-to-moderate load operation, excessive adjustment of temperature or humidity is not expected to provide the same benefit as improving cathode reaction kinetics. This interpretation is consistent with the observed sensitivity of the electrode potential to the ORR reference exchange current density and with the identification of ORR kinetics as a dominant factor in the activation-loss region. Second, for high-current-density operation, oxygen transport becomes increasingly important. The present simulations show that increasing inlet relative humidity from 40% to 70% decreases the maximum calculated O2 mole fraction from 0.12592 to 0.06287, indicating that excessive humidification can reduce the available gas-phase oxygen fraction under the present boundary conditions. Accordingly, a moderate relative-humidity level within the investigated range can be considered preferable for high-load operation when oxygen transport is the primary limitation. However, this recommendation should be interpreted with caution because the present model does not explicitly resolve liquid-water condensation or two-phase transport. In particular, the calculated water-vapor field becomes thermodynamically supersaturated at 60–80 °C under the investigated humidification conditions; therefore, high relative humidity at these temperatures should not be interpreted as an optimized flooding-free operating condition. Third, the membrane-thickness results suggest that approximately 10 µm provides a practical intermediate design point within the investigated range. The electrolyte potential distributions at 10 and 15 µm are nearly identical, while increasing the membrane thickness from 10 to 15 µm produces only a marginal change in the calculated electrochemical response. Similarly, the pressure drop changes by only approximately 3% between 5 and 15 µm. Therefore, increasing the membrane thickness beyond approximately 10 µm does not provide a substantial modeled benefit under the present operating conditions, whereas excessive thinning should be avoided when gas-crossover resistance and mechanical robustness are considered. Because membrane degradation and lifetime are not explicitly modeled in the present study, the 10 µm recommendation should be regarded as a performance-oriented design guideline rather than a quantified lifetime optimum. Overall, the sensitivity analysis suggests three practical strategies: (i) prioritize ORR kinetics for low-current-density operation, (ii) maintain moderate inlet humidity when operating at high current density to avoid unnecessarily reducing gas-phase oxygen availability, and (iii) use an intermediate membrane thickness of approximately 10 µm rather than increasing the thickness beyond this level without a specific durability or crossover requirement. These guidelines are limited to the investigated parameter ranges and should be further refined using global sensitivity analysis and two-phase, degradation-aware models.
5. Conclusions
A two-dimensional multiphysics model of a proton exchange membrane fuel cell (PEMFC) was developed using the Hydrogen Fuel Cell interface in COMSOL Multiphysics and subsequently validated against experimental polarization data under humidified air and humidified oxygen conditions. The validation procedure incorporated parameter estimation of membrane electrolyte conductivity, ORR reference exchange current density, cathodic charge transfer coefficient, and limiting current density. The resulting model successfully reproduced the characteristic activation, ohmic, and mass-transport regions of the experimental polarization curves, confirming the suitability of the developed model for systematic parametric investigations.
A one-factor-at-a-time (OFAT) analysis was subsequently conducted to quantify the effects of six governing parameters: operating temperature, inlet gas relative humidity, membrane thickness, membrane electrolyte conductivity, ORR reference exchange current density, and cell operating voltage. Electrode potential, electrolyte potential, pressure drop, and maximum local mole fractions of O2, H2O, and N2 were evaluated as representative electrochemical, transport, and species-transport responses. The principal conclusions can be summarized as follows.
- (1)
- Operating temperature produced a relatively small variation in the maximum electrode potential, which decreased from 0.6080 V at 60 °C to 0.6030 V at 100 °C. In contrast, the electrolyte potential exhibited a substantially stronger response, changing from −0.0210 V to −0.0638 V over the same temperature range. The pressure drop also decreased from approximately 0.0099 Pa to 0.0042 Pa. In addition, the maximum O2 mole fraction decreased from 0.18106 at 60 °C to 0.14121 at 80 °C and 0.06287 at 100 °C, corresponding to an overall reduction of approximately 65.3%. The maximum N2 mole fraction exhibited a similar trend, decreasing from 0.68114 to 0.53122 and 0.23650, respectively. In contrast, the maximum H2O mole fraction remained constant at 0.71247. These results indicate that operating temperature has a pronounced influence on the calculated local gas-species distributions, particularly for O2 and N2, in addition to its effects on protonic potential and pressure distribution.
- (2)
- Increasing inlet relative humidity from 40% to 70% resulted in a small decrease in the maximum electrode potential from 0.6054 to 0.6030 V, whereas the electrolyte potential changed from −0.0430 to −0.0638 V. The corresponding pressure drop decreased from 0.00810 to 0.00427 Pa. The maximum O2 mole fraction decreased from 0.12592 at 40% RH to 0.09439 at 55% RH and 0.06287 at 70% RH, representing an overall reduction of approximately 50.1%. Similarly, the maximum N2 mole fraction decreased from 0.47371 to 0.35510 and 0.23650, respectively. The maximum H2O mole fraction remained constant at 0.71247. These results demonstrate that inlet relative humidity influences not only the protonic potential and pressure distribution but also the calculated maximum local O2 and N2 mole fractions under the applied model conditions. Increasing inlet relative humidity from 40% to 70% resulted in a small decrease in the maximum electrode potential from 0.6054 to 0.6030 V, whereas the electrolyte potential changed from −0.0430 to −0.0638 V. The corresponding pressure drop decreased from 0.00810 to 0.00427 Pa. The maximum O2 mole fraction decreased from 0.12592 at 40% RH to 0.09439 at 55% RH and 0.06287 at 70% RH, representing an overall reduction of approximately 50.1%. Similarly, the maximum N2 mole fraction decreased from 0.47371 to 0.35510 and 0.23650, respectively. The maximum H2O mole fraction remained constant at 0.71247. These results demonstrate that inlet relative humidity influences not only the protonic potential and pressure distribution but also the calculated maximum local O2 and N2 mole fractions under the applied model conditions. It should be noted that the substantial reduction in O2 mole fraction observed when the inlet relative humidity increases from 40% to 70% does not by itself quantify flooding severity. As discussed in Section 2.3, the present single-phase formulation does not resolve liquid-water saturation or capillary transport; therefore, the 70% RH results at 60–80 °C should be interpreted as gas-phase humidity effects and as an upper-bound performance estimate rather than as a quantitative prediction of liquid-water flooding.
- (3)
- Membrane thickness showed a comparatively weak influence on the investigated electrochemical and transport responses. Increasing the membrane thickness from 5 to 15 µm changed the maximum electrode potential only from 0.6029 to 0.6030 V, while the electrolyte potential remained close to −0.0638 V. The pressure drop decreased slightly from 0.0434 to 0.0421 Pa. The maximum O2, H2O, and N2 mole fractions remained essentially unchanged over the investigated membrane thickness range. Thus, under the selected operating conditions, membrane thickness was not a dominant parameter for the maximum potential responses, pressure distribution, or maximum local species mole fractions.
- (4)
- A similarly weak response was observed for membrane electrolyte conductivity. Increasing the conductivity from 5 to 15 S m−1 resulted in an electrode potential change of only approximately 0.0001 V, while the electrolyte potential remained essentially unchanged at approximately −0.0638 V. The pressure drop varied only from 0.00422 to 0.00429 Pa. The maximum O2, H2O, and N2 mole fractions also remained essentially constant. These results indicate that, under the present baseline conditions, increasing membrane conductivity beyond approximately 10 S m−1 provides limited additional influence on the maximum electrochemical, transport, and species-transport responses.
- (5)
- The ORR reference exchange current density was identified as one of the most influential parameters. Increasing this parameter from 10−4 to 10−2 A m−2 increased the maximum electrode potential from 0.6004 to 0.6080 V, while the electrolyte potential became substantially more negative, changing from −0.0589 to −0.0836 V. At the same time, the pressure drop increased from 8.31 × 10⁻⁴ to 1.09 × 10⁻² Pa. In contrast, the maximum O2, H2O, and N2 mole fractions remained essentially unchanged. These results indicate that cathodic reaction kinetics strongly affect the electrochemical and coupled transport responses, while their direct influence on the maximum local gas-species mole fractions is limited under the present simulation conditions.
- (6)
- Cell operating voltage exerted a pronounced influence on the electrochemical and transport responses. The maximum electrode potential increased from 0.414 V at an imposed cell voltage of 0.40 V to 0.800 V at 0.80 V, closely following the prescribed operating voltage. The electrolyte potential became progressively less negative, changing from −0.108 V at 0.40 V to −0.0539 V at 0.80 V. Furthermore, the pressure drop decreased markedly from 0.0187 Pa to 9.24 × 10⁻⁵ Pa. The maximum O2, H2O, and N2 mole fractions remained essentially unchanged across the investigated voltage range. Therefore, cell operating voltage strongly controls the electrochemical state and pressure response of the modeled PEMFC, whereas its influence on the maximum local gas-species mole fractions is limited under the applied conditions.
An important limitation of the present study concerns the treatment of water and thermal transport. Water is represented through gas-phase H2O species transport, while liquid-water saturation, capillary transport, phase change, and flooding are not explicitly resolved. The maximum H2O mole fraction remained constant at 0.71247 throughout the investigated temperature and relative-humidity cases, whereas the maximum O2 mole fraction changed by approximately 65.3% with temperature and 50.1% with relative humidity. These results demonstrate sensitivity of the calculated gas-phase composition to the imposed operating conditions, but they should not be interpreted as quantitative predictions of liquid-water accumulation, flooding, or membrane hydration. Similarly, because the energy equation is not solved and the cell temperature is prescribed as spatially uniform, the reported temperature effects describe isothermal changes in the modeled electrochemical and species-transport fields rather than fully coupled thermal behavior. Therefore, the conclusions regarding temperature and relative humidity are restricted to gas-phase species transport, ionic potential, pressure distribution, and electrochemical responses under the specified isothermal conditions. Future work should incorporate coupled heat transfer and two-phase water transport to quantify thermal gradients, phase change, liquid-water saturation, and their feedback on membrane hydration and PEMFC performance.
Overall, the sensitivity analysis demonstrates that parameter importance in PEMFC simulations is response-dependent rather than universal. ORR reference exchange current density and cell operating voltage exerted the strongest influence on electrochemical potential responses, whereas operating temperature and inlet relative humidity produced more pronounced changes in protonic potential, pressure distribution, and local O2/N2 composition. In contrast, membrane thickness and membrane electrolyte conductivity showed limited sensitivity within the investigated ranges and under the selected baseline conditions. Thus, the principal outcome of the present framework is not a universal ranking of PEMFC parameters, but a physically interpretable mapping between parameter classes and specific multiphysics responses. This response-oriented interpretation provides a rational basis for prioritizing parameters during model calibration and optimization and distinguishes the present analysis from conventional parametric studies that evaluate individual parameters without a common calibrated reference framework. Because the species-related results represent maximum local mole fractions, these findings describe changes in the maximum local species response and should not be interpreted as evidence that the complete species distributions throughout the PEMFC remain unchanged in Cases 3–6. The combined experimental validation and parametric framework therefore provides a consistent basis for interpreting parameter-to-response relationships within the investigated operating regime. The validated framework can subsequently be extended to global sensitivity analysis, multi-objective optimization, artificial-intelligence-assisted surrogate modeling, and digital-twin development.
Overall, the developed multiphysics framework demonstrates that parameter importance in fuel cell simulations is intrinsically response-dependent rather than universal, offering an actionable physical baseline for membrane electrode assembly optimization. While oxygen reduction kinetics and cell operating voltage dominate electrochemical potential and activation overpotentials, thermal management and inlet relative humidity strongly govern protonic transport and local gas-phase species distributions, requiring careful operational control to balance kinetic acceleration with long-term State-of-Health durability. Conversely, membrane thickness and electrolyte conductivity exhibit threshold-stabilized sensitivities under well-humidified baseline conditions, indicating that membrane design should prioritize mechanical integrity and gas crossover mitigation over excessive thinning. Although single-phase transport modeling defines a theoretical upper-bound ceiling by omitting liquid condensation and pore flooding, this response-oriented mapping establishes a rational foundation for prioritizing calibration parameters and provides a clear computational roadmap toward future two-phase transport models, global sensitivity analysis, advanced metaheuristic optimization, and digital-twin applications.
Funding
This research received no external funding.
Institutional Review Board Statement
Not applicable.
Informed Consent Statement
Not applicable.
Data Availability Statement
The data supporting the findings of this study are available from the corresponding author upon reasonable request.
Conflicts of Interest
The author declares no conflicts of interest.
References
- Butori, M.; Eriksson, B.; Nikolic, N.; Lagergren, C.; Lindbergh, G.; Wreland Lindström, R. The effect of oxygen partial pressure and humidification in proton exchange membrane fuel cells at intermediate temperature (80–120 °C). J. Power Sources 2023, 563, 232803. [Google Scholar] [CrossRef] [Scilit]
- Dickinson, E.J.F.; Smith, G. Modelling the proton-conductive membrane in practical polymer electro-lyte membrane fuel cell (PEMFC) simulation: A review. Membranes 2020, 10, 310. [Google Scholar] [CrossRef] [Scilit] [PubMed]
- Mitra, U.; Arya, A.; Gupta, S. A comprehensive and comparative review on parameter estimation methods for modelling proton exchange membrane fuel cell. Fuel 2023, 335, 127080. [Google Scholar] [CrossRef] [Scilit]
- Carnes, B.; Djilali, N. Systematic parameter estimation for PEM fuel cell models. J. Power Sources 2005, 144, 83–93. [Google Scholar] [CrossRef] [Scilit]
- Ohenoja, M.; Leiviskä, K. Observations on the parameter estimation problem of polymer electrolyte membrane fuel cell polarization curves. Fuel Cells 2020, 20, 516–526. [Google Scholar] [CrossRef] [Scilit]
- Priya, K.; Sathishkumar, K.; Rajasekar, N. A comprehensive review on parameter estimation techniques for proton exchange membrane fuel cell modelling. Renew. Sustain. Energy Rev. 2018, 93, 121–144. [Google Scholar] [CrossRef] [Scilit]
- Kandidayeni, M.; Macias, A.; Amamou, A.A.; Boulon, L.; Kelouwani, S.; Chaoui, H. Overview and benchmark analysis of fuel cell parameters estimation for energy management purposes. J. Power Sources 2018, 380, 92–104. [Google Scholar] [CrossRef] [Scilit]
- Ashraf, H.; Abdellatif, S.O.; Elkholy, M.M.; El-Fergany, A.A. Computational techniques based on artificial intelligence for extracting optimal parameters of PEMFCs: Survey and insights. Arch. Comput. Methods Eng. 2022, 29, 3943–3972. [Google Scholar] [CrossRef] [Scilit]
- Hassan, M.H.; Kamel, S.; Mohamed, E.M. A review and hybrid metaheuristic approach for PEMFC parameter estimation. Results Eng. 2026, 30, 111006. [Google Scholar] [CrossRef] [Scilit]
- Alharbi, A.M.; Diab, A.A.Z. A Comprehensive Review of Parameter Estimation and Modeling Approaches for Proton Exchange Membrane Fuel Cells: Challenges, Methods, and Future Directions. Energies 2026, 19, 3389. [Google Scholar] [CrossRef] [Scilit]
- Springer, T.E.; Zawodzinski, T.A.; Gottesfeld, S. Polymer electrolyte fuel cell model. J. Electrochem. Soc. 1991, 138, 2334–2342. [Google Scholar] [CrossRef] [Scilit]
- Weber, A.Z.; Newman, J. Modeling transport in polymer-electrolyte fuel cells. Chem. Rev. 2004, 104, 4679–4726. [Google Scholar] [CrossRef] [Scilit] [PubMed]
- Wang, Y.; Chen, K.S.; Mishler, J.; Cho, S.C.; Adroher, X.C. A review of polymer electrolyte membrane fuel cells: Technology, applications, and needs on fundamental research. Appl. Energy 2011, 88, 981–1007. [Google Scholar] [CrossRef] [Scilit]
- Askarzadeh, A. Parameter estimation of fuel cell polarization curve using BMO algorithm. Int. J. Hydrogen Energy 2013, 38, 15405–15413. [Google Scholar] [CrossRef] [Scilit]
- Weber, A.Z.; Borup, R.L.; Darling, R.M.; Das, P.K.; Dursch, T.J.; Gu, W.; Harvey, D.; Kusoglu, A.; Litster, S.; Mench, M.M.; et al. A critical review of modeling transport phenomena in polymer-electrolyte fuel cells. J. Electrochem. Soc. 2014, 161, F1254–F1269. [Google Scholar] [CrossRef] [Scilit]
- Li, D.; Yang, B.; Han, Y. A critical note of major parameter extraction methods for proton exchange membrane fuel cell (PEMFC). Front. Energy Res. 2022, 9, 835397. [Google Scholar] [CrossRef] [Scilit]
- Li, X.; Ye, T.; Meng, X.; He, D.; Li, L.; Song, K.; Jiang, J.; Sun, C. Advances in the Application of Sulfonated Poly (Ether Ether Ketone) (SPEEK) and Its Organic Composite Membranes for Proton Exchange Membrane Fuel Cells (PEMFCs). Polymers 2024, 16, 2840. [Google Scholar] [CrossRef] [Scilit] [PubMed]
- Tang, X.; Yang, M.; Shi, L.; Hou, Z.; Xu, S.; Sun, C. Adaptive state-of-health temperature sensitivity characteristics for durability improvement of PEM fuel cells. Chem. Eng. J. 2024, 491, 151951. [Google Scholar] [CrossRef] [Scilit]
- Zhao, K.; Song, Z.; Hao, W.; Xu, Z.; Zhang, W.; Shi, Z.; Meng, G.; Hasanien, H.M.; Alharbi, M.; Ataollahi, N.; et al. Investigations of the Parameter Estimation Approach Based on the Actor-Critic-Assisted Optimization Algorithm for Proton Exchange Membrane Fuel Cells. Fuel Cells 2026, 26, e70148. [Google Scholar] [CrossRef] [Scilit]
- Mei, J.; Meng, X.; Tang, X.; Li, H.; Hasanien, H.; Alharbi, M.; Dong, Z.; Shen, J.; Sun, C.; Fan, F.; et al. An Accurate Parameter Estimation Method of the Voltage Model for Proton Exchange Membrane Fuel Cells. Energies 2024, 17, 2917. [Google Scholar] [CrossRef] [Scilit]
- Yan, S.; Yang, M.; Sun, C.; Xu, S. Liquid Water Characteristics in the Compressed Gradient Porosity Gas Diffusion Layer of Proton Exchange Membrane Fuel Cells Using the Lattice Boltzmann Method. Energies 2023, 16, 6010. [Google Scholar] [CrossRef] [Scilit]
- COMSOL AB. COMSOL Multiphysics 5.3: Fuel Cell & Electrolyzer Module; COMSOL AB: Stockholm, Sweden, 2017. [Google Scholar]
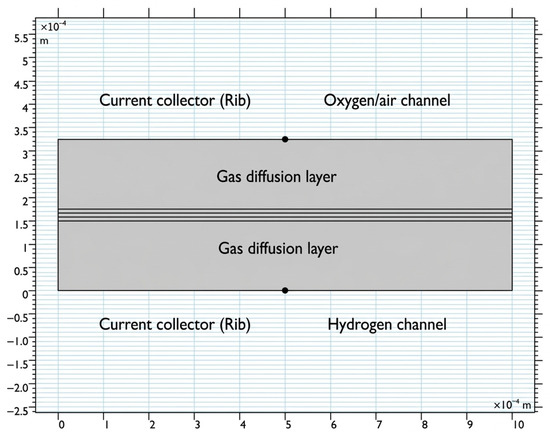
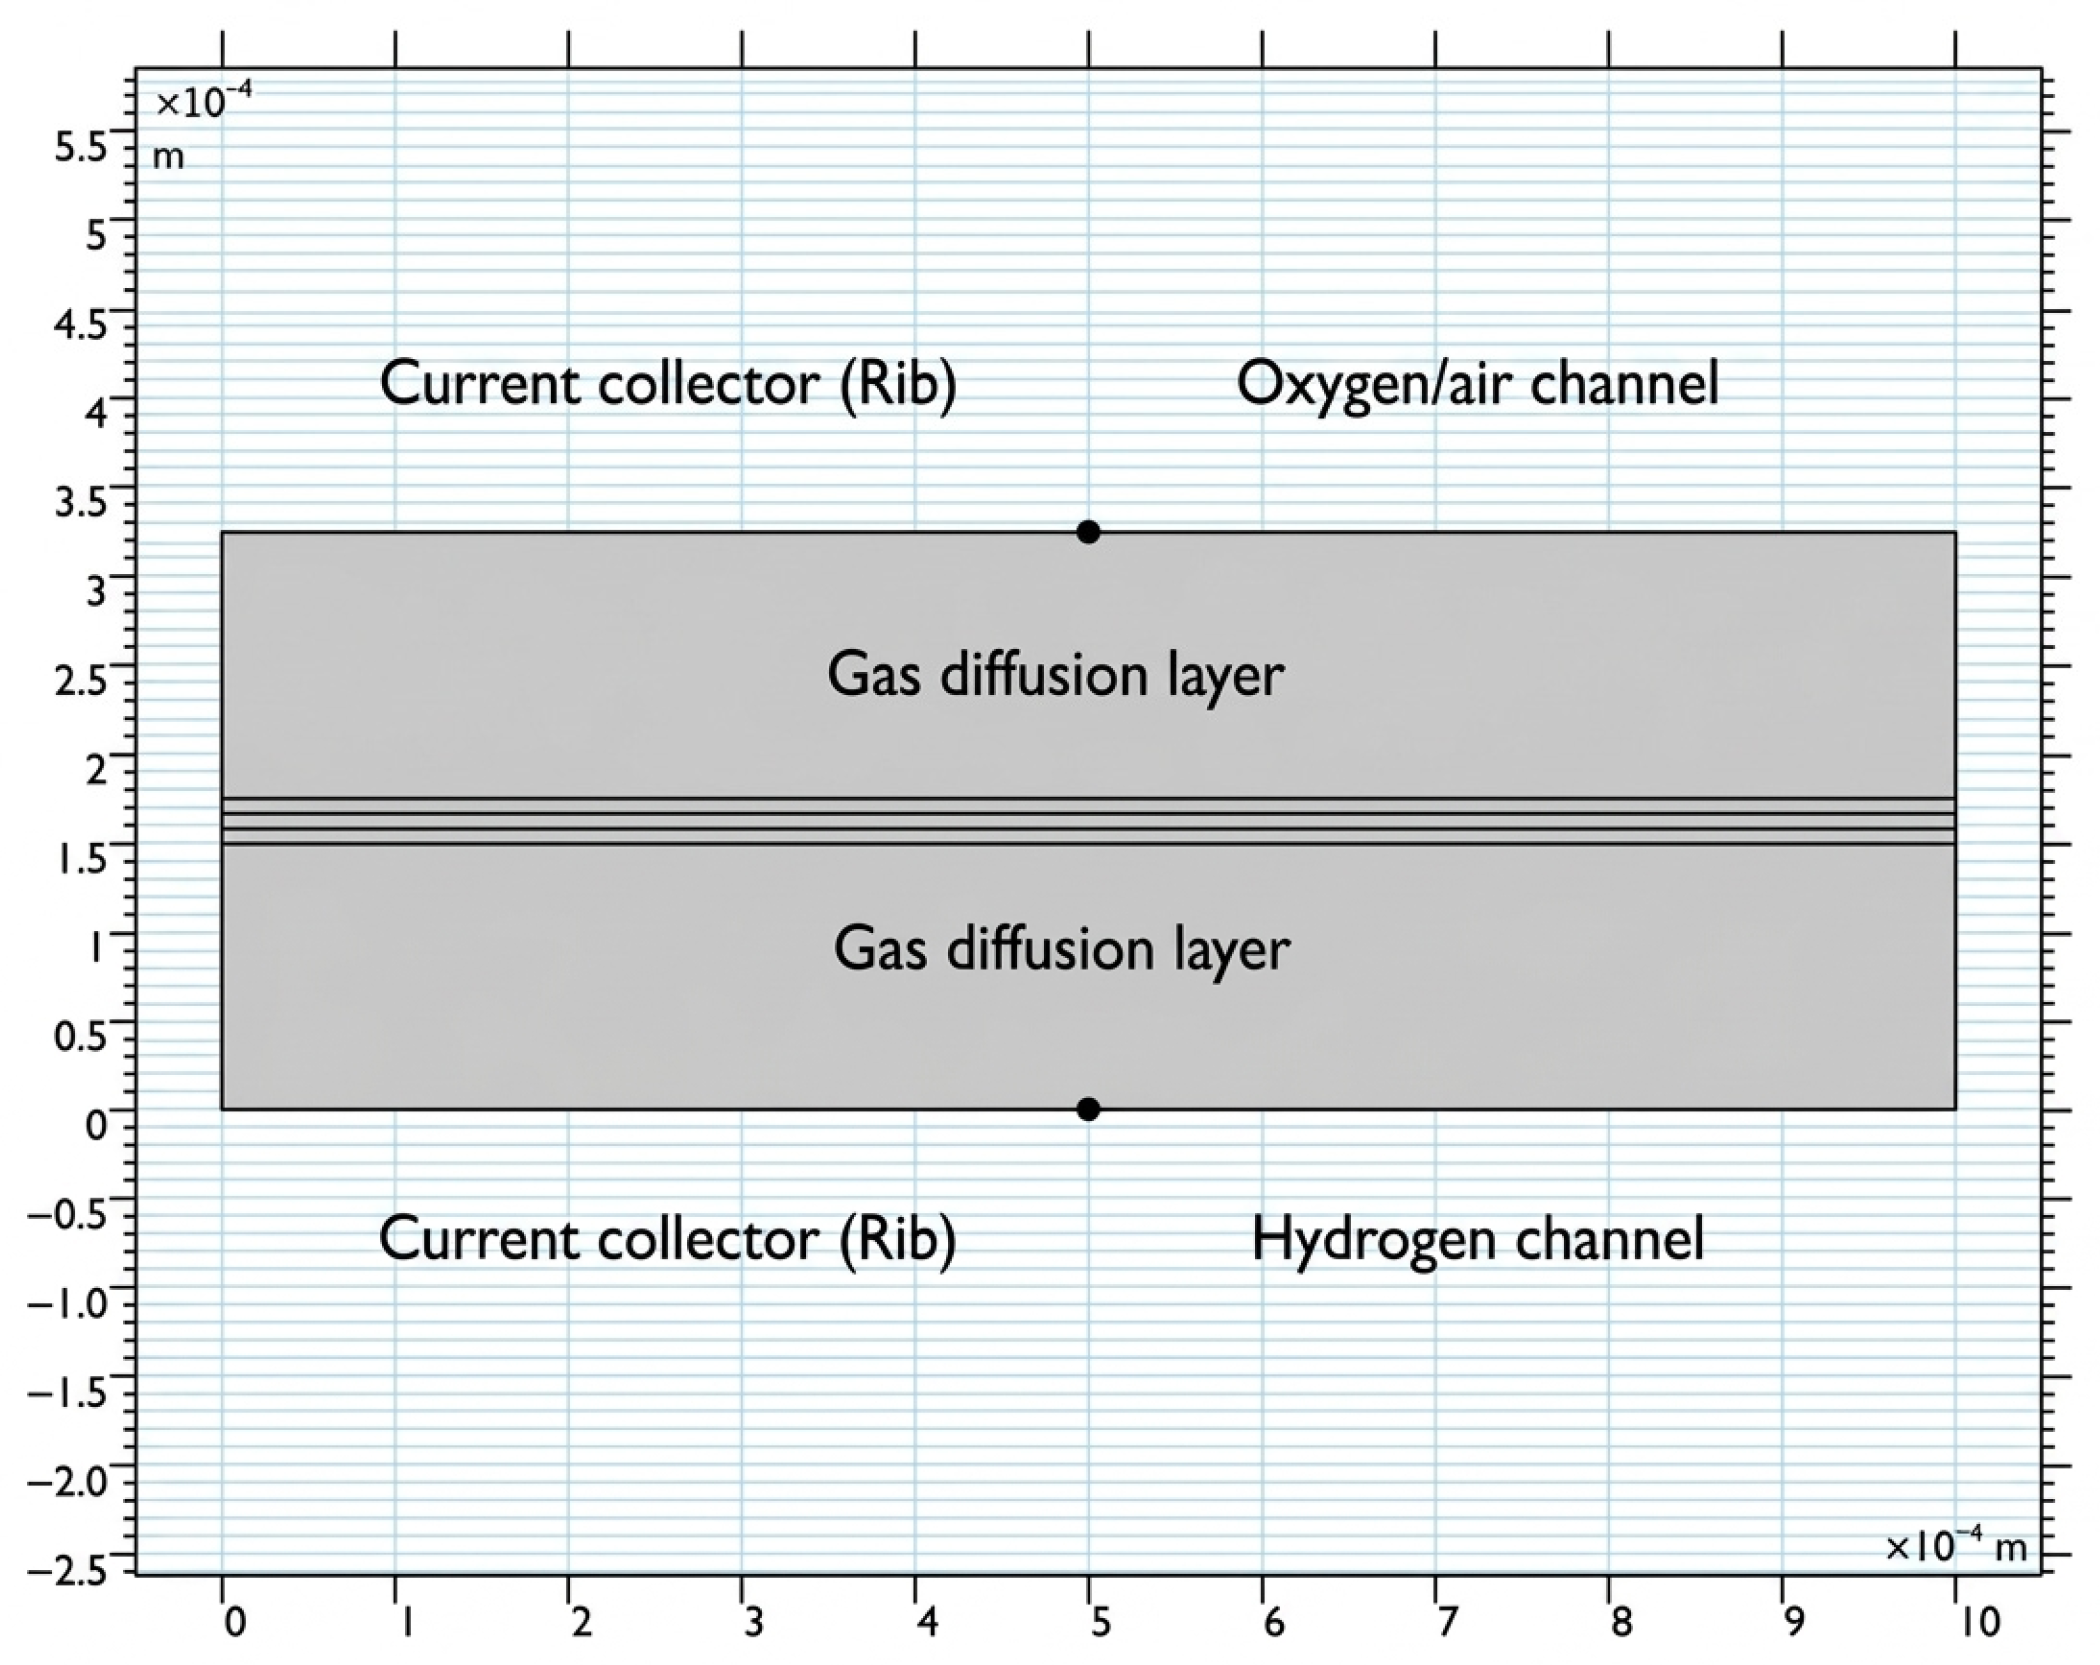
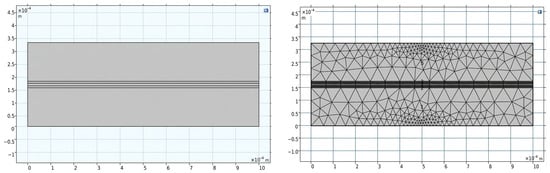
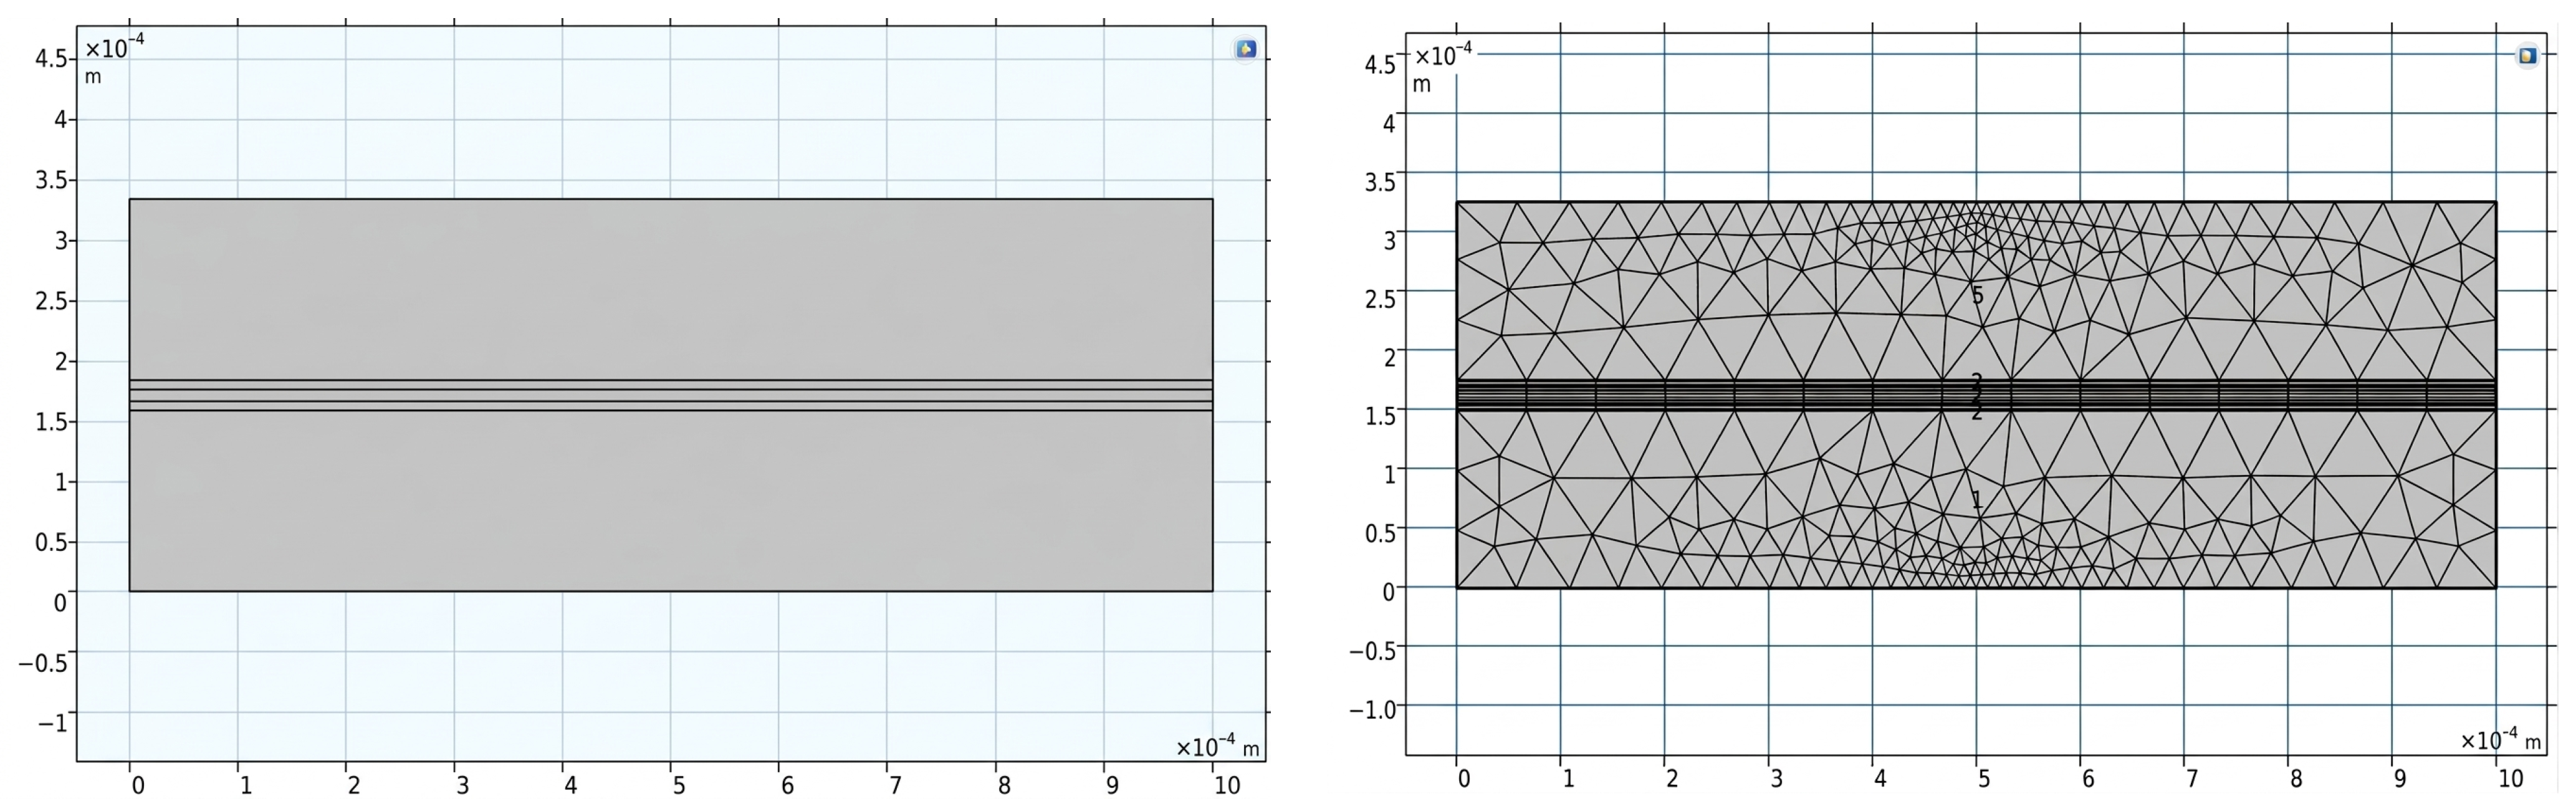
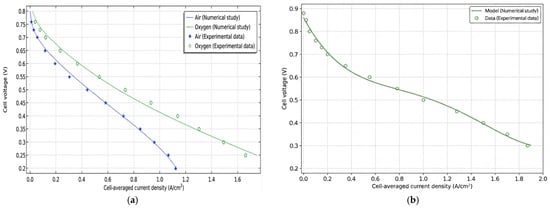
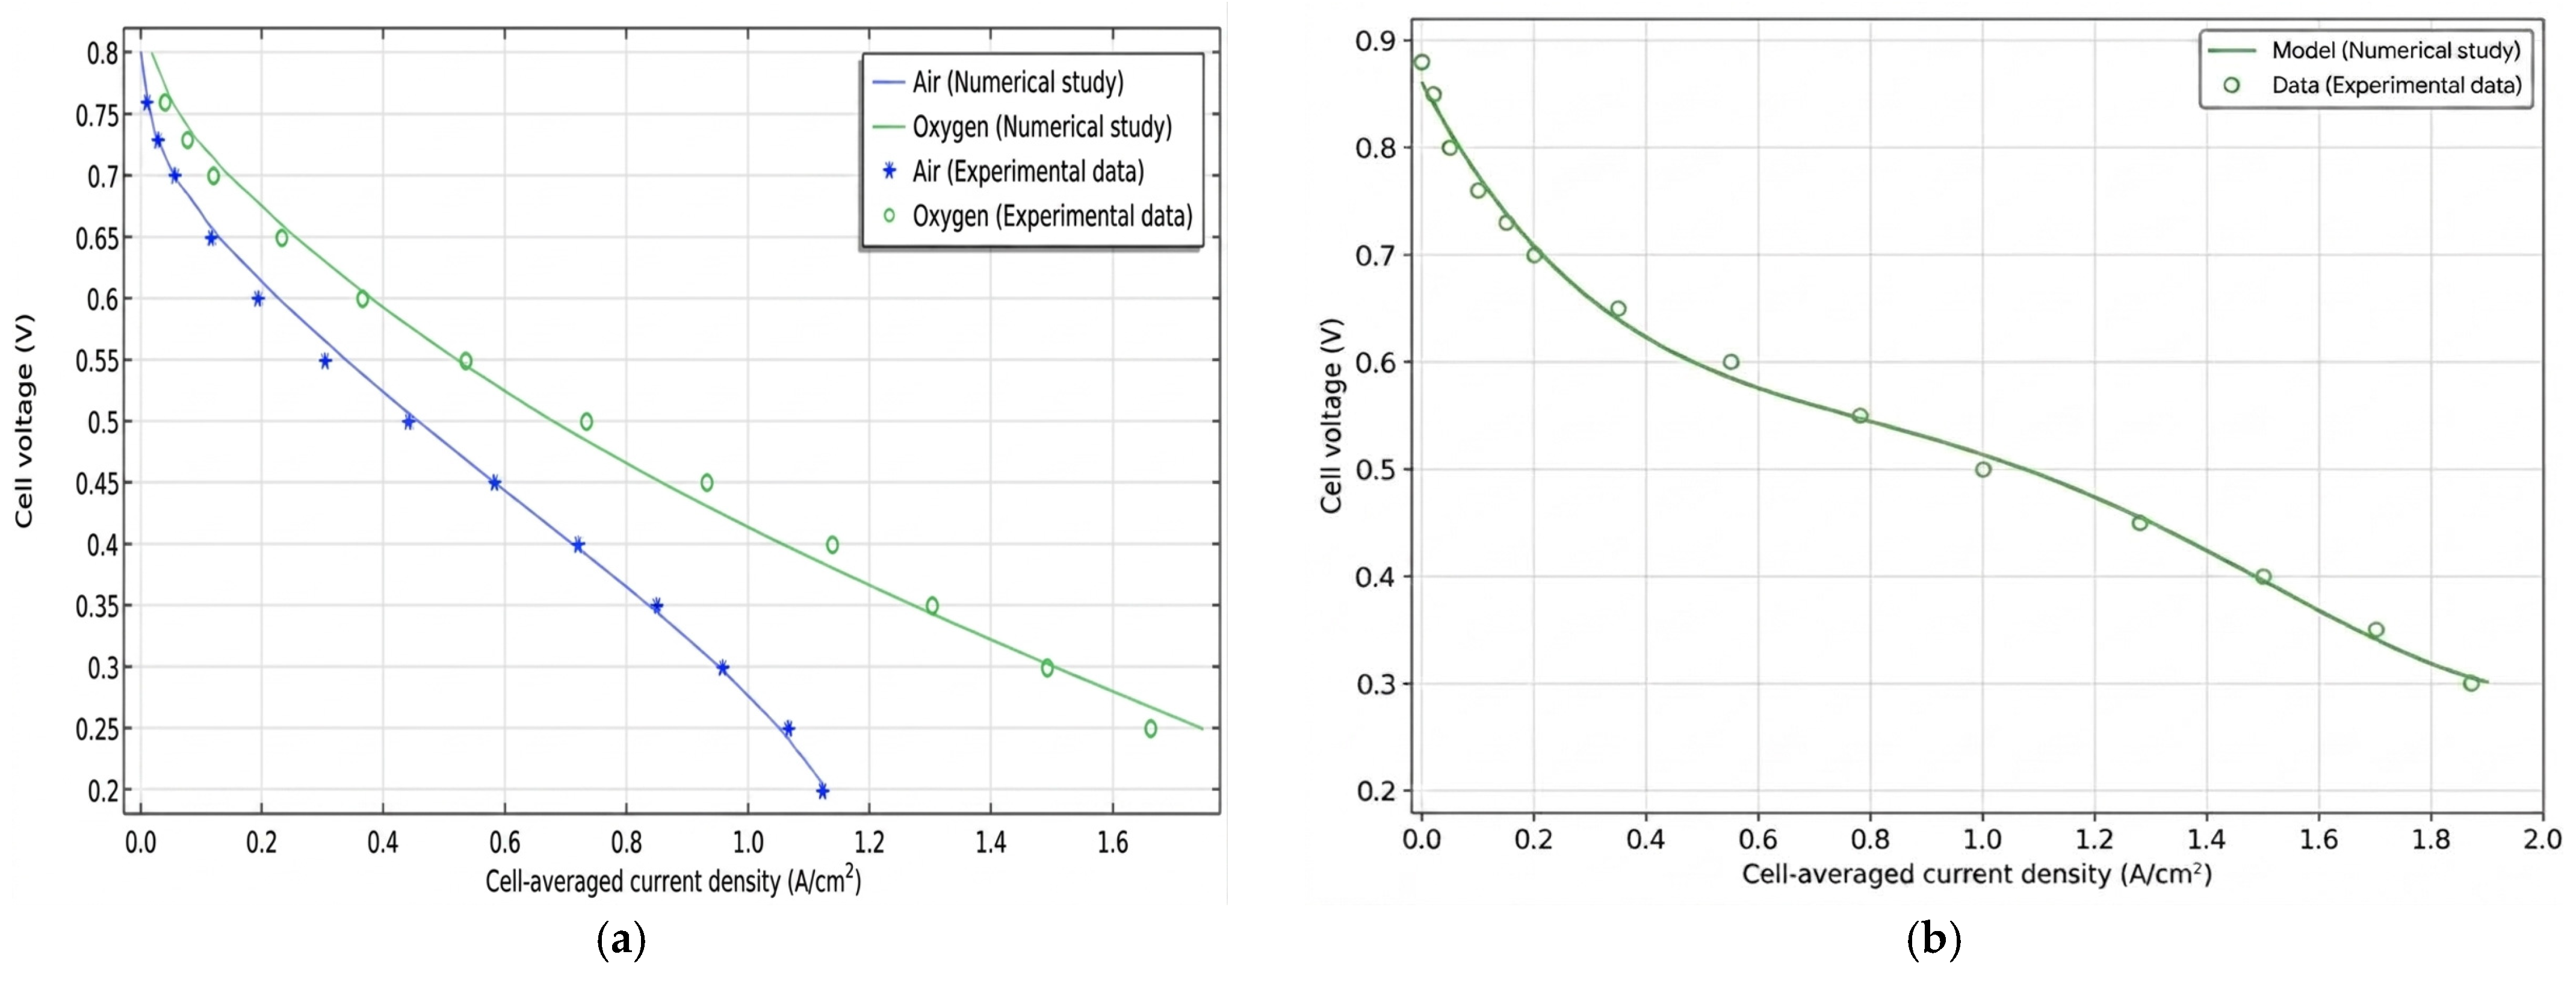
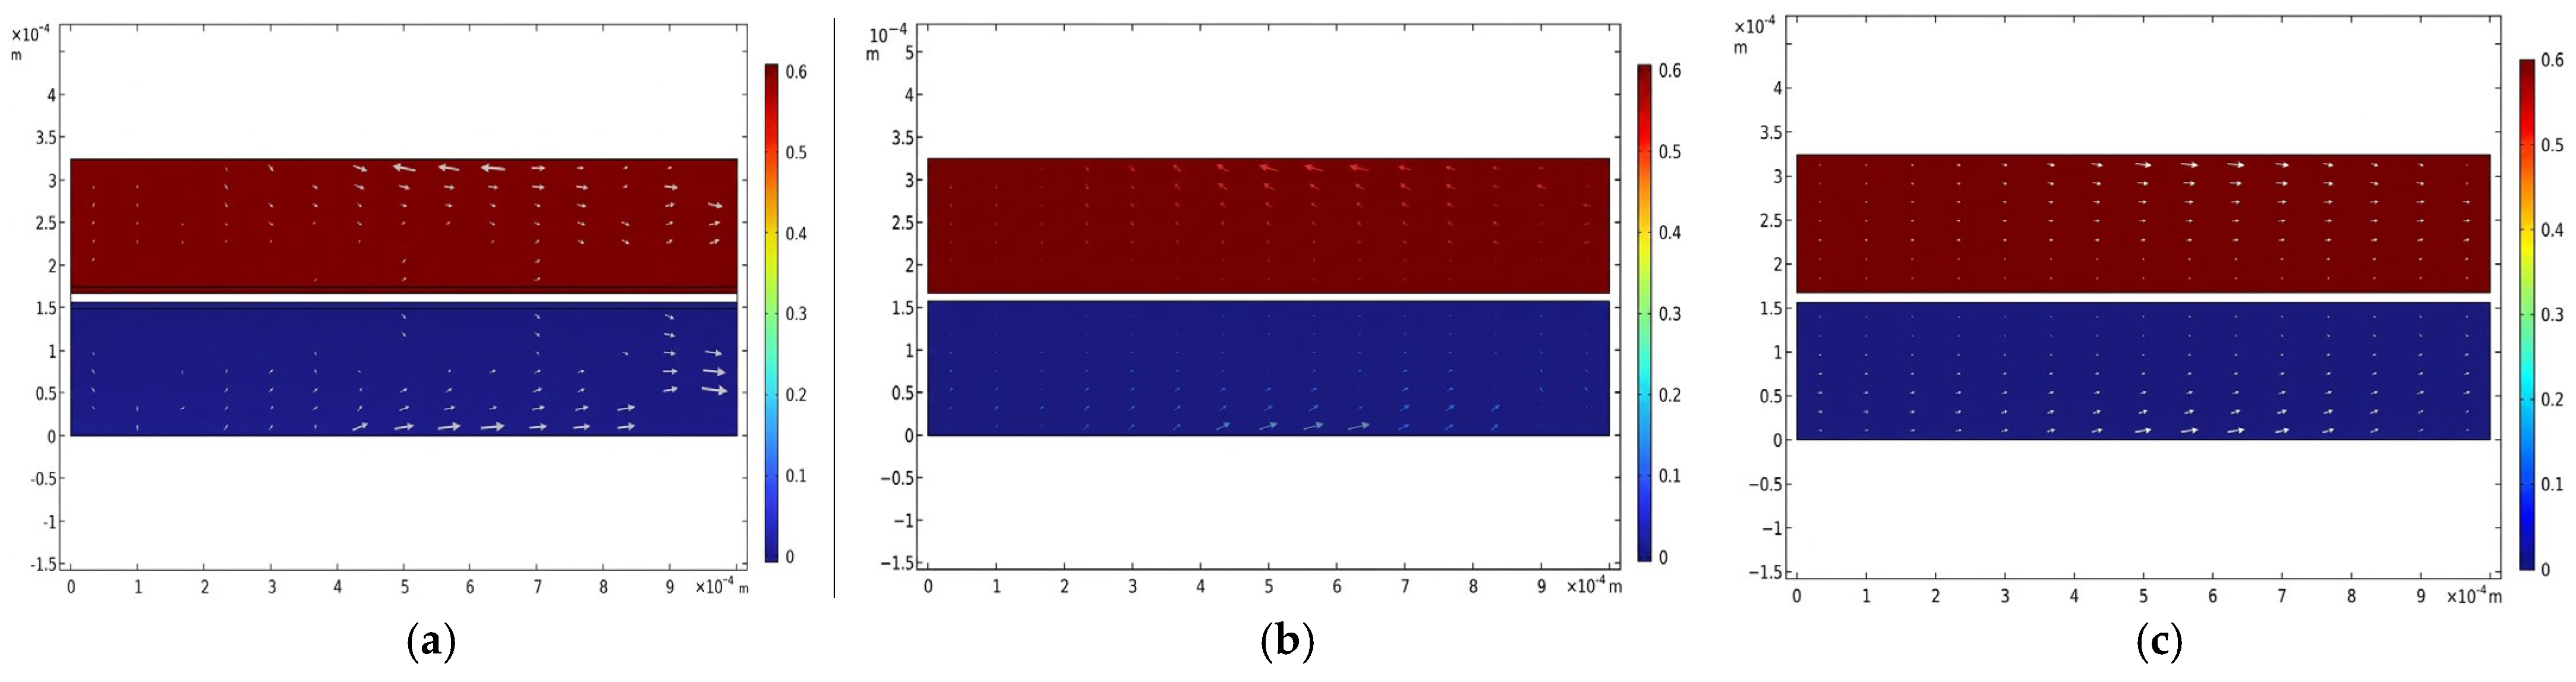
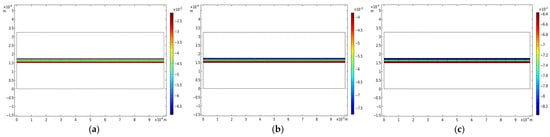
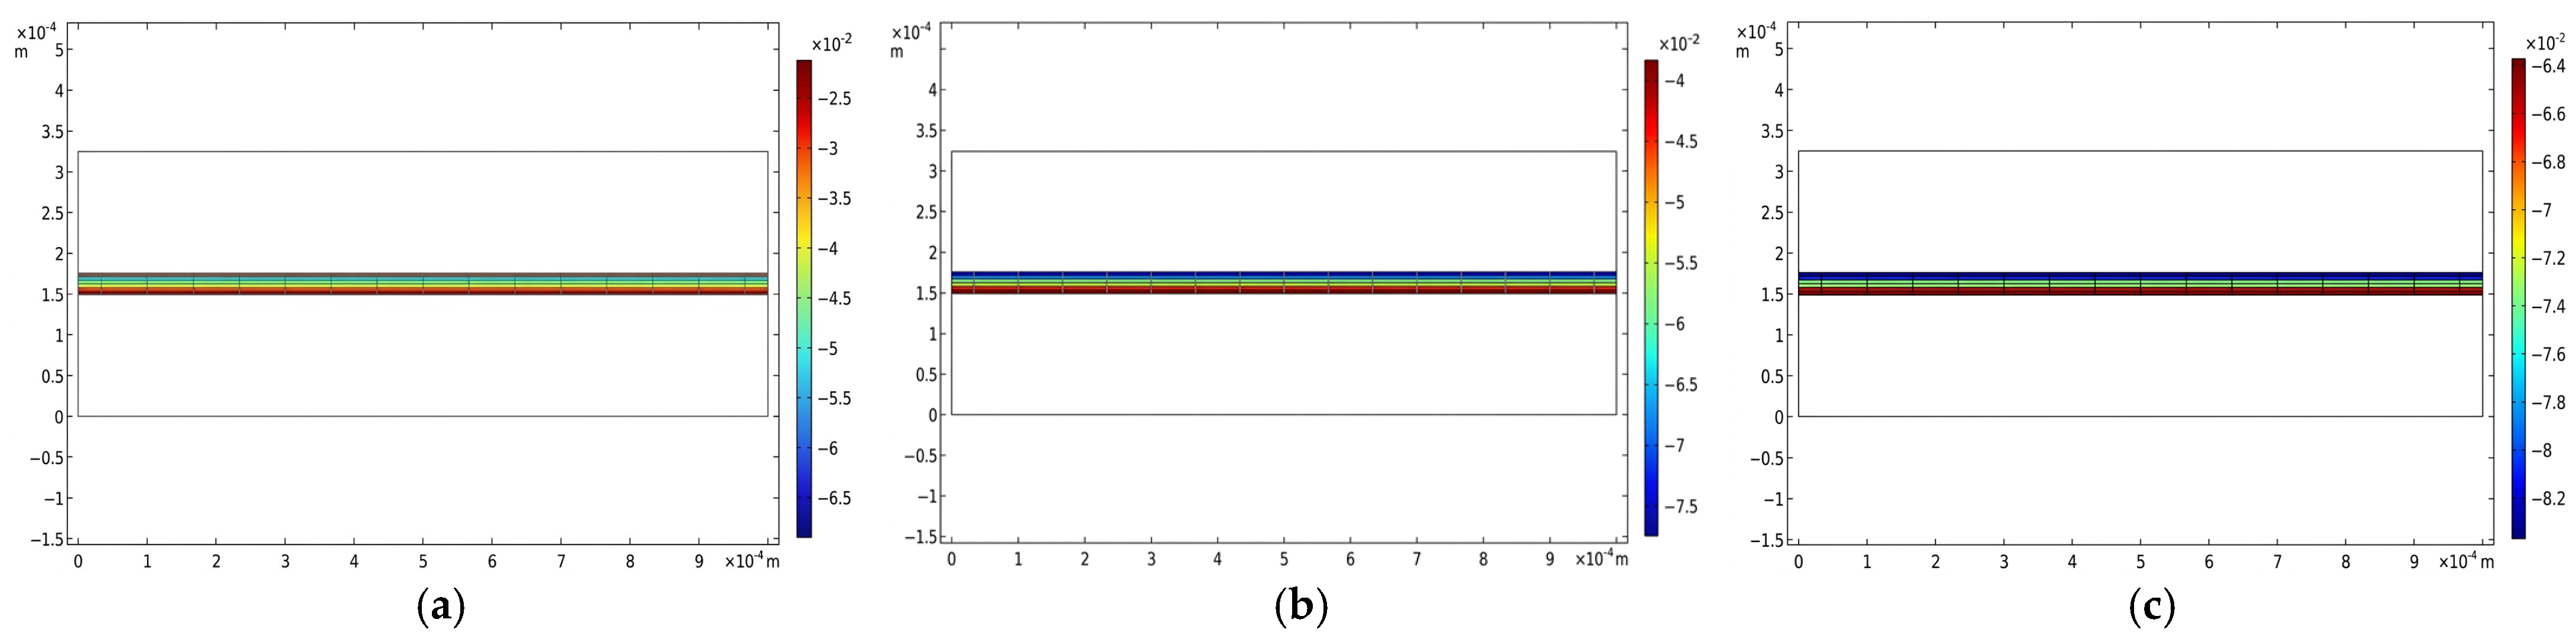
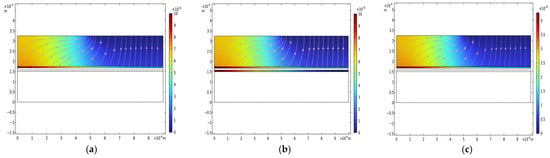
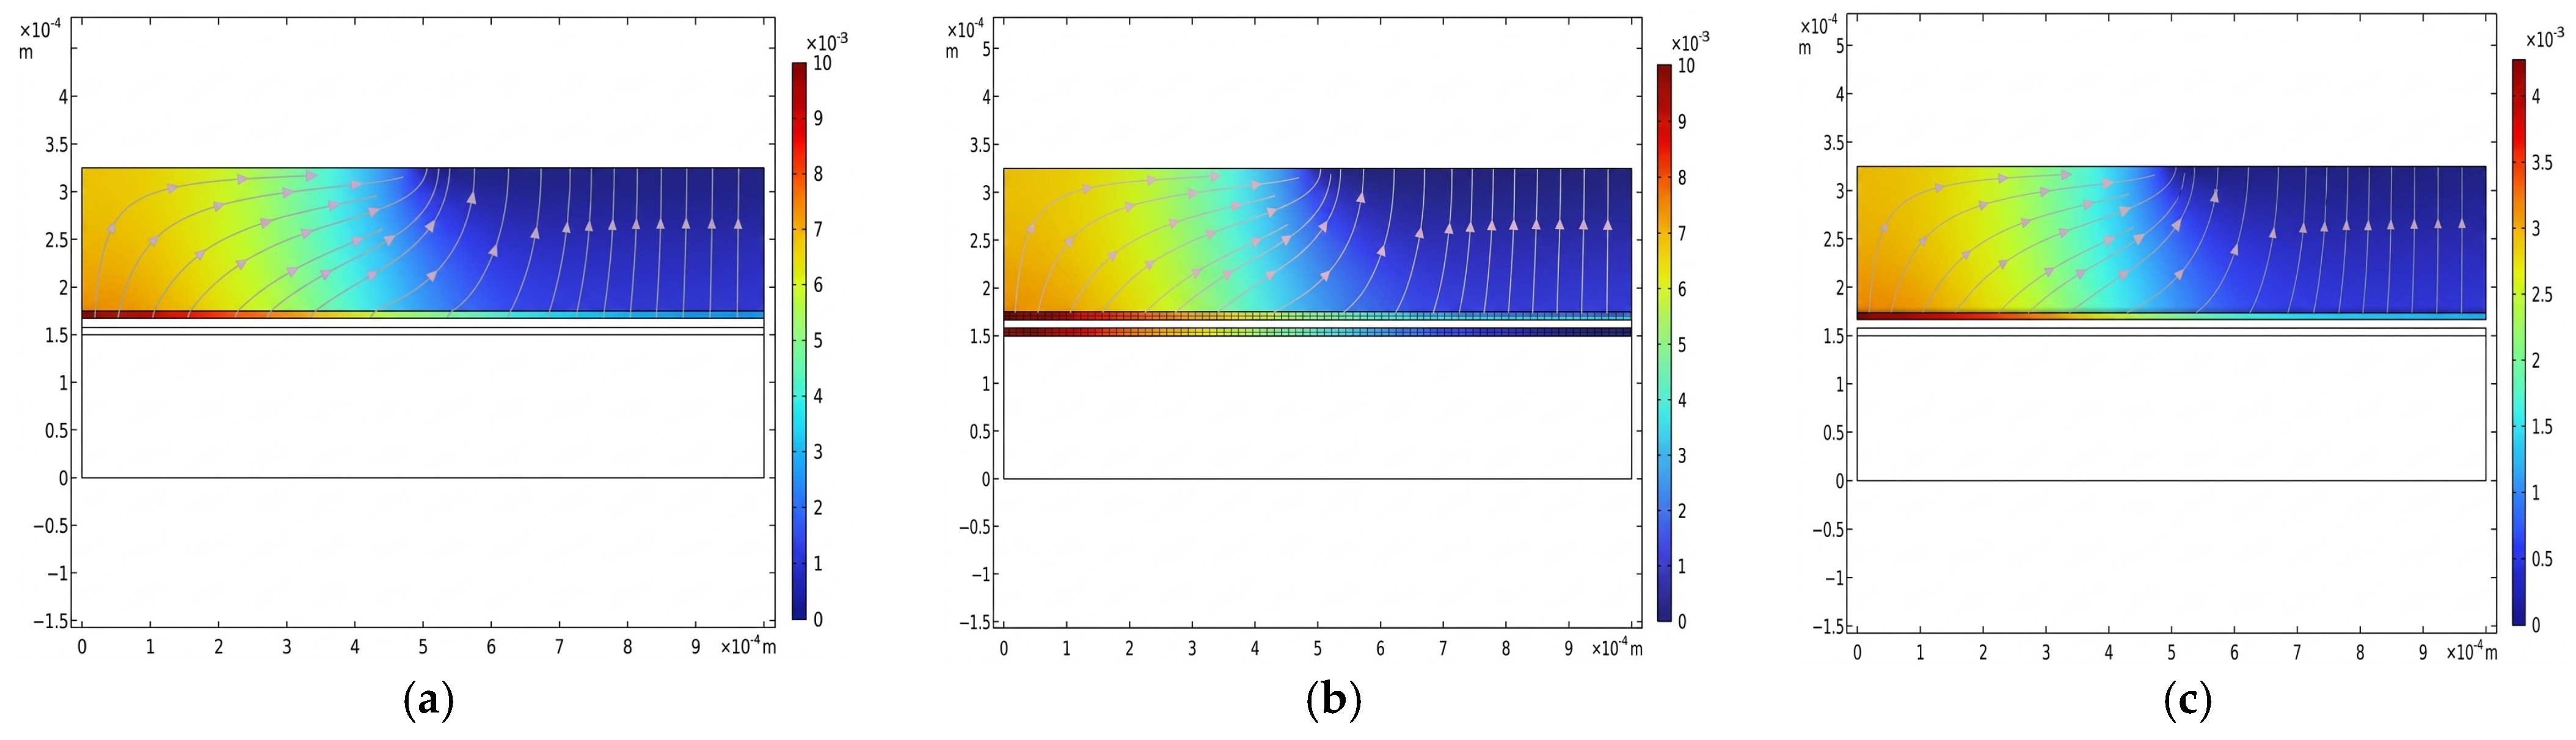
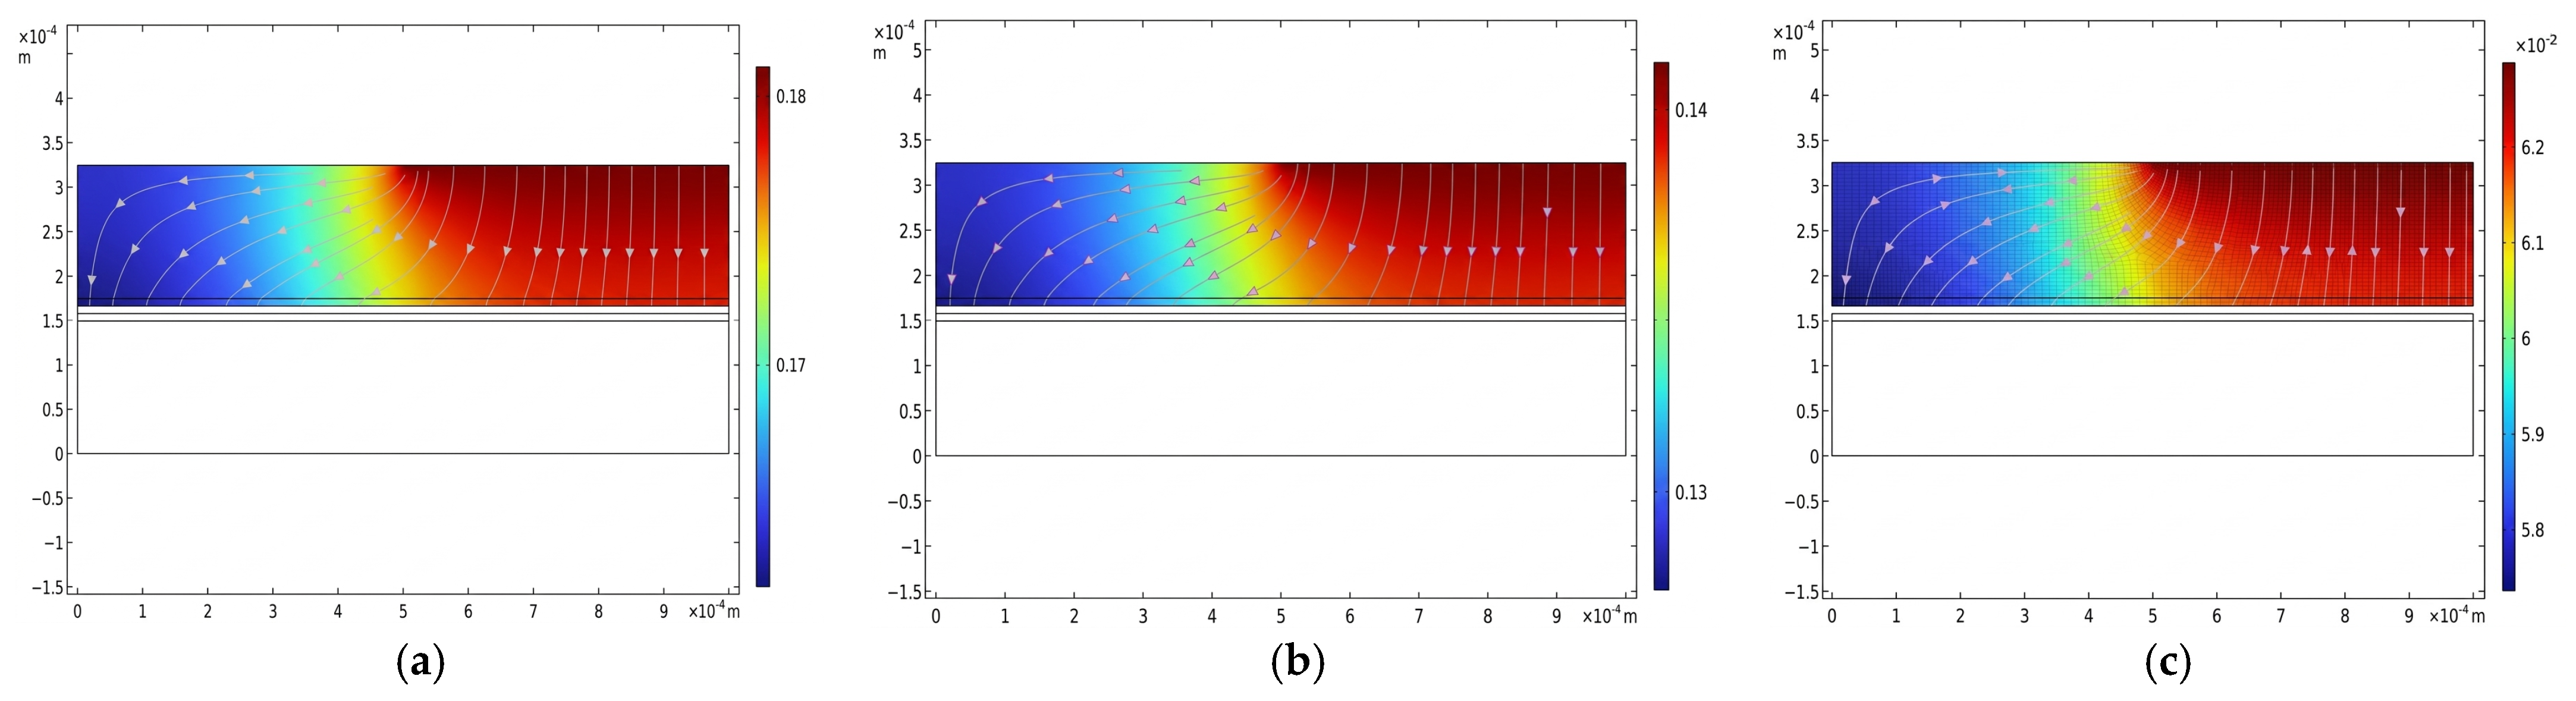
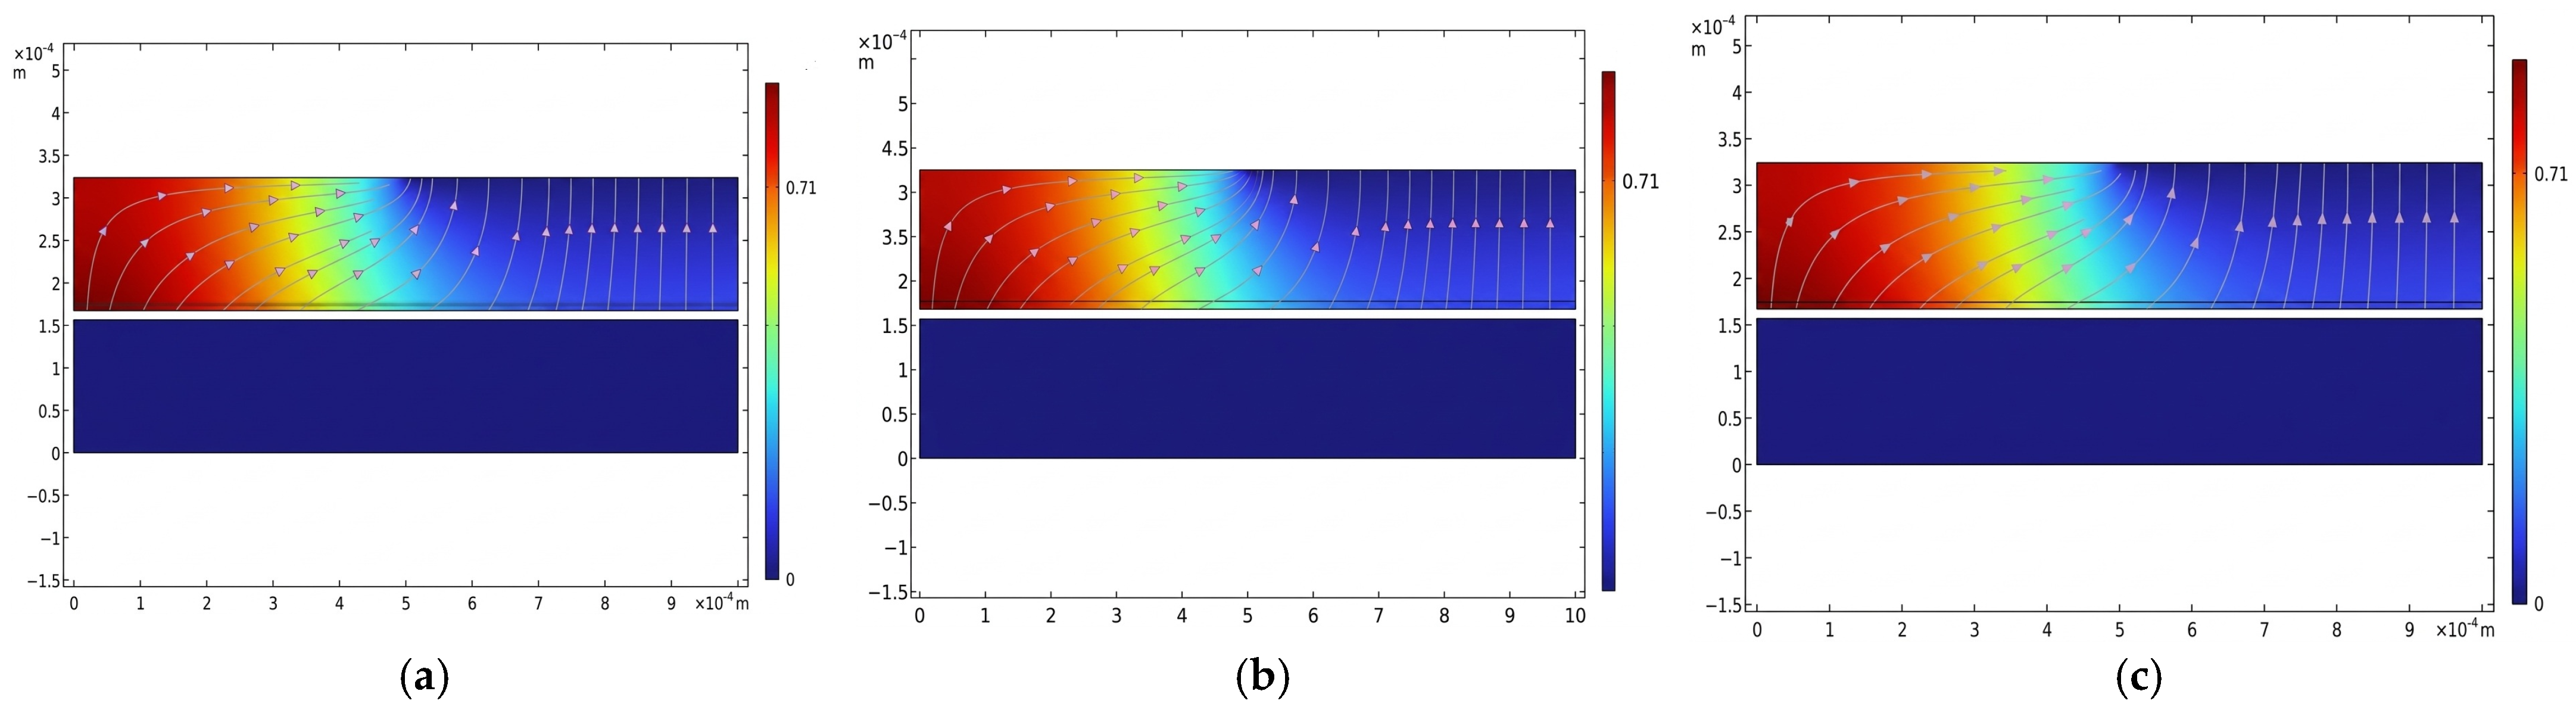
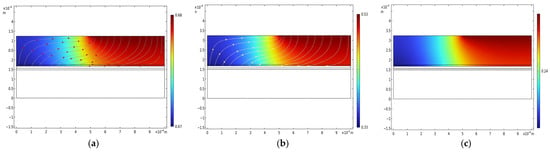
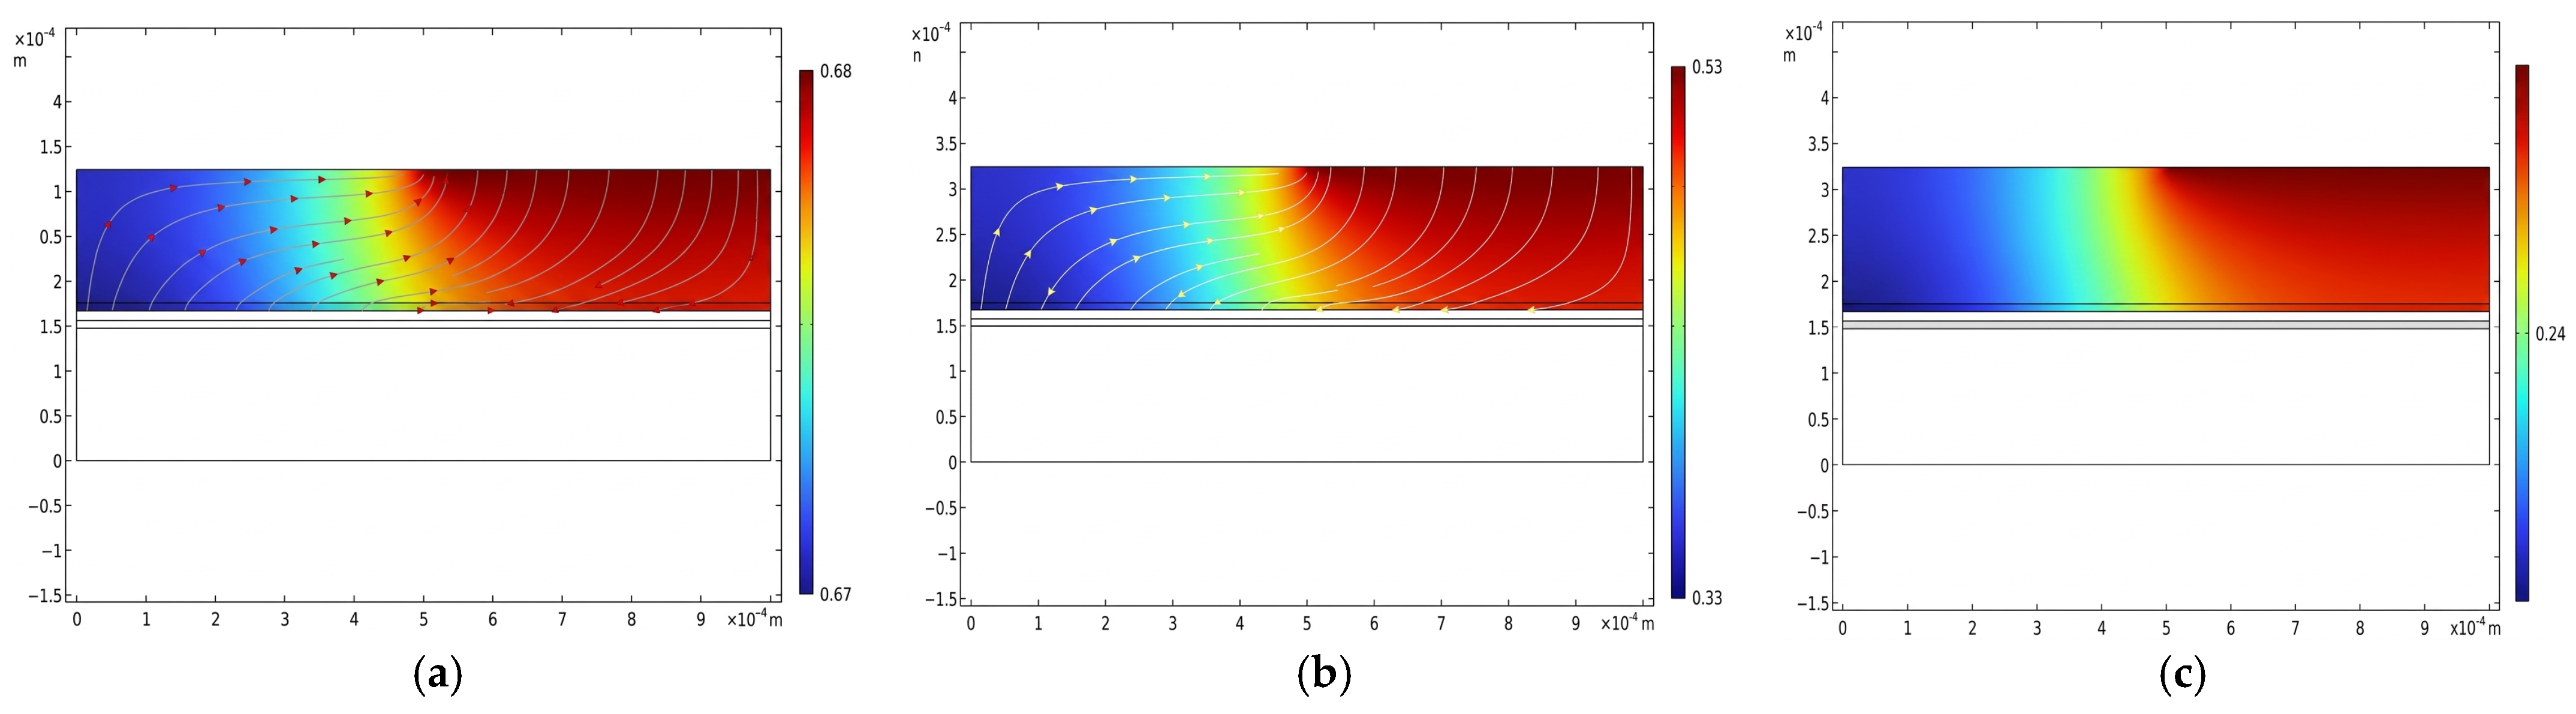
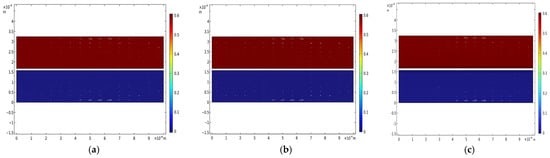
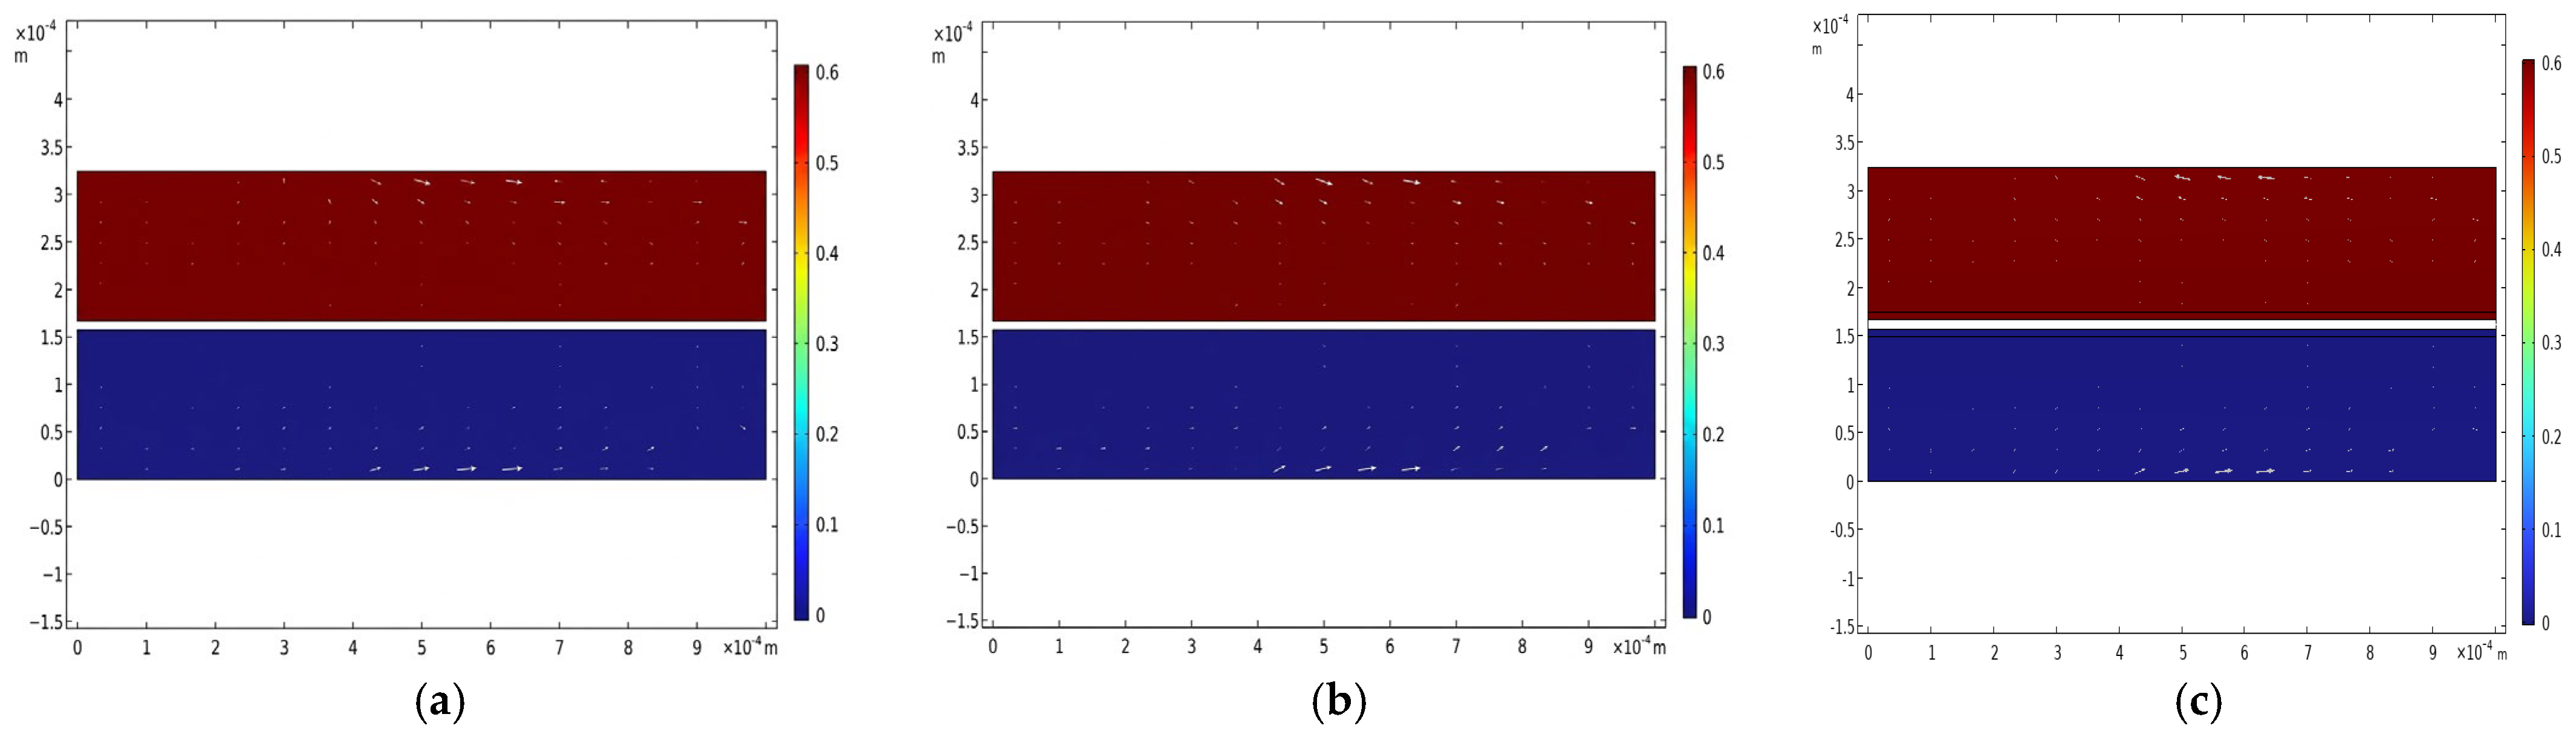
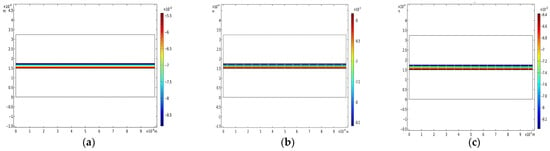
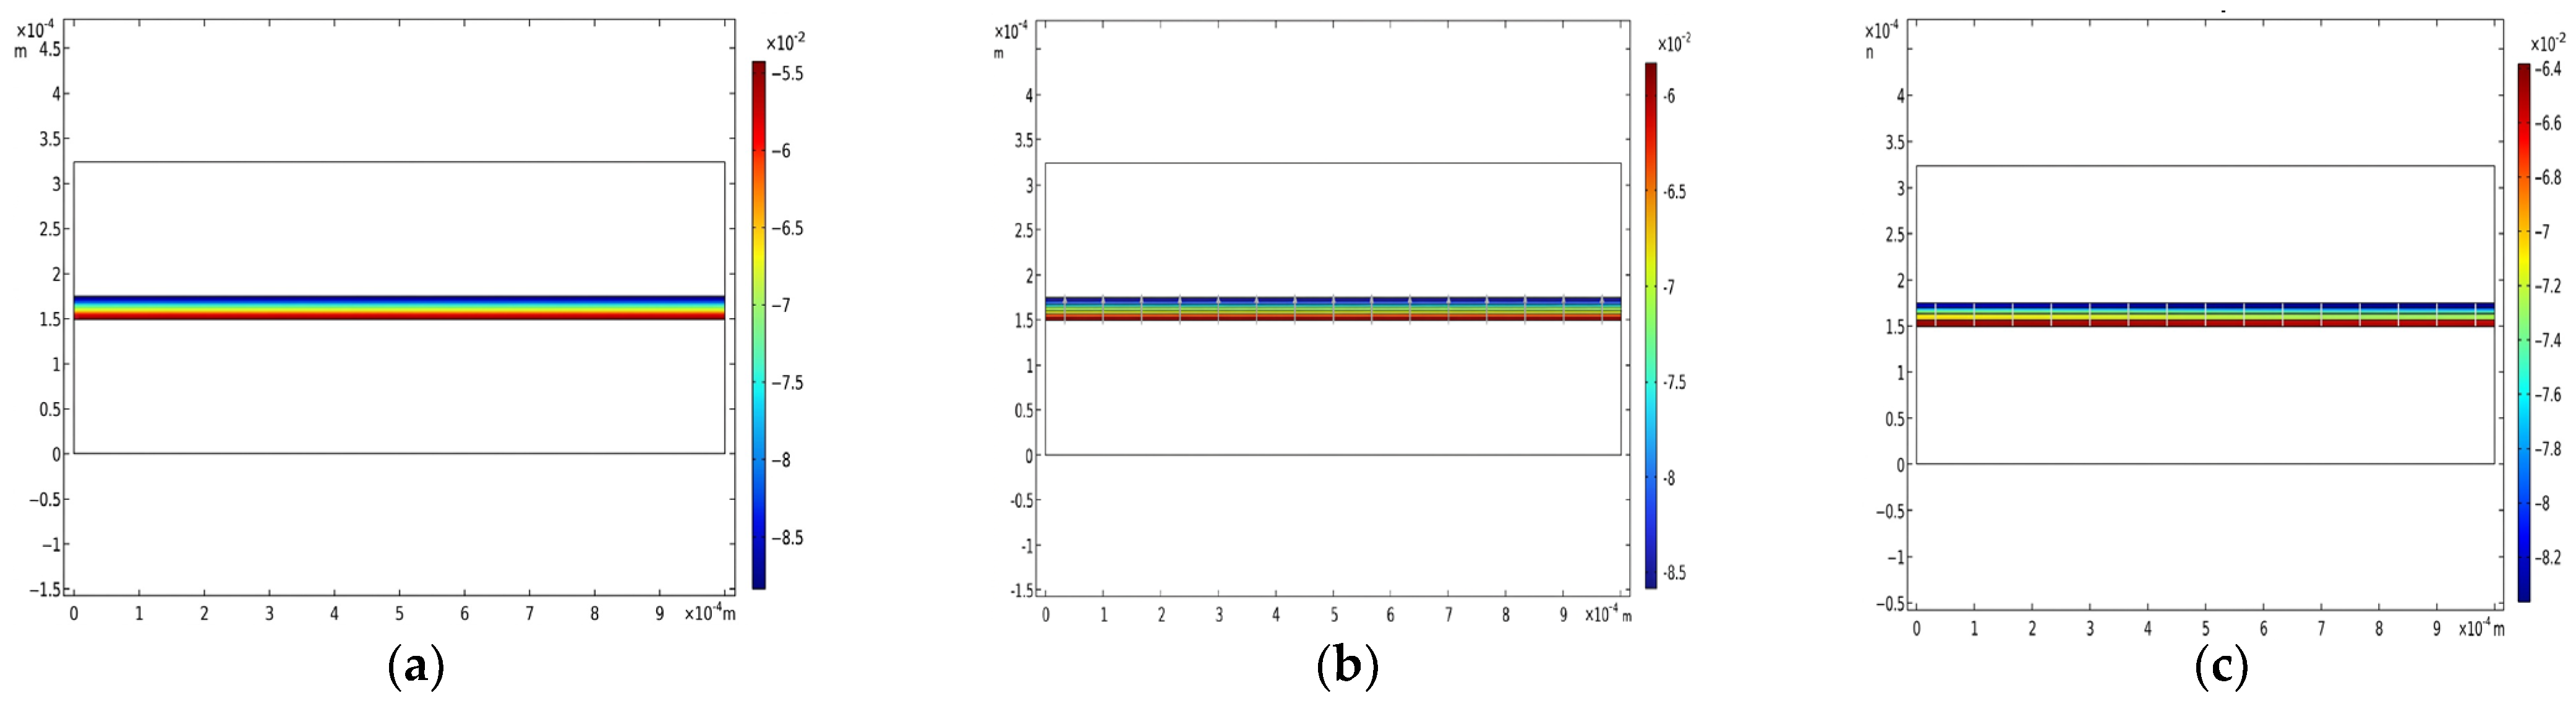
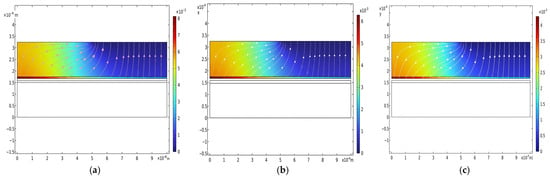
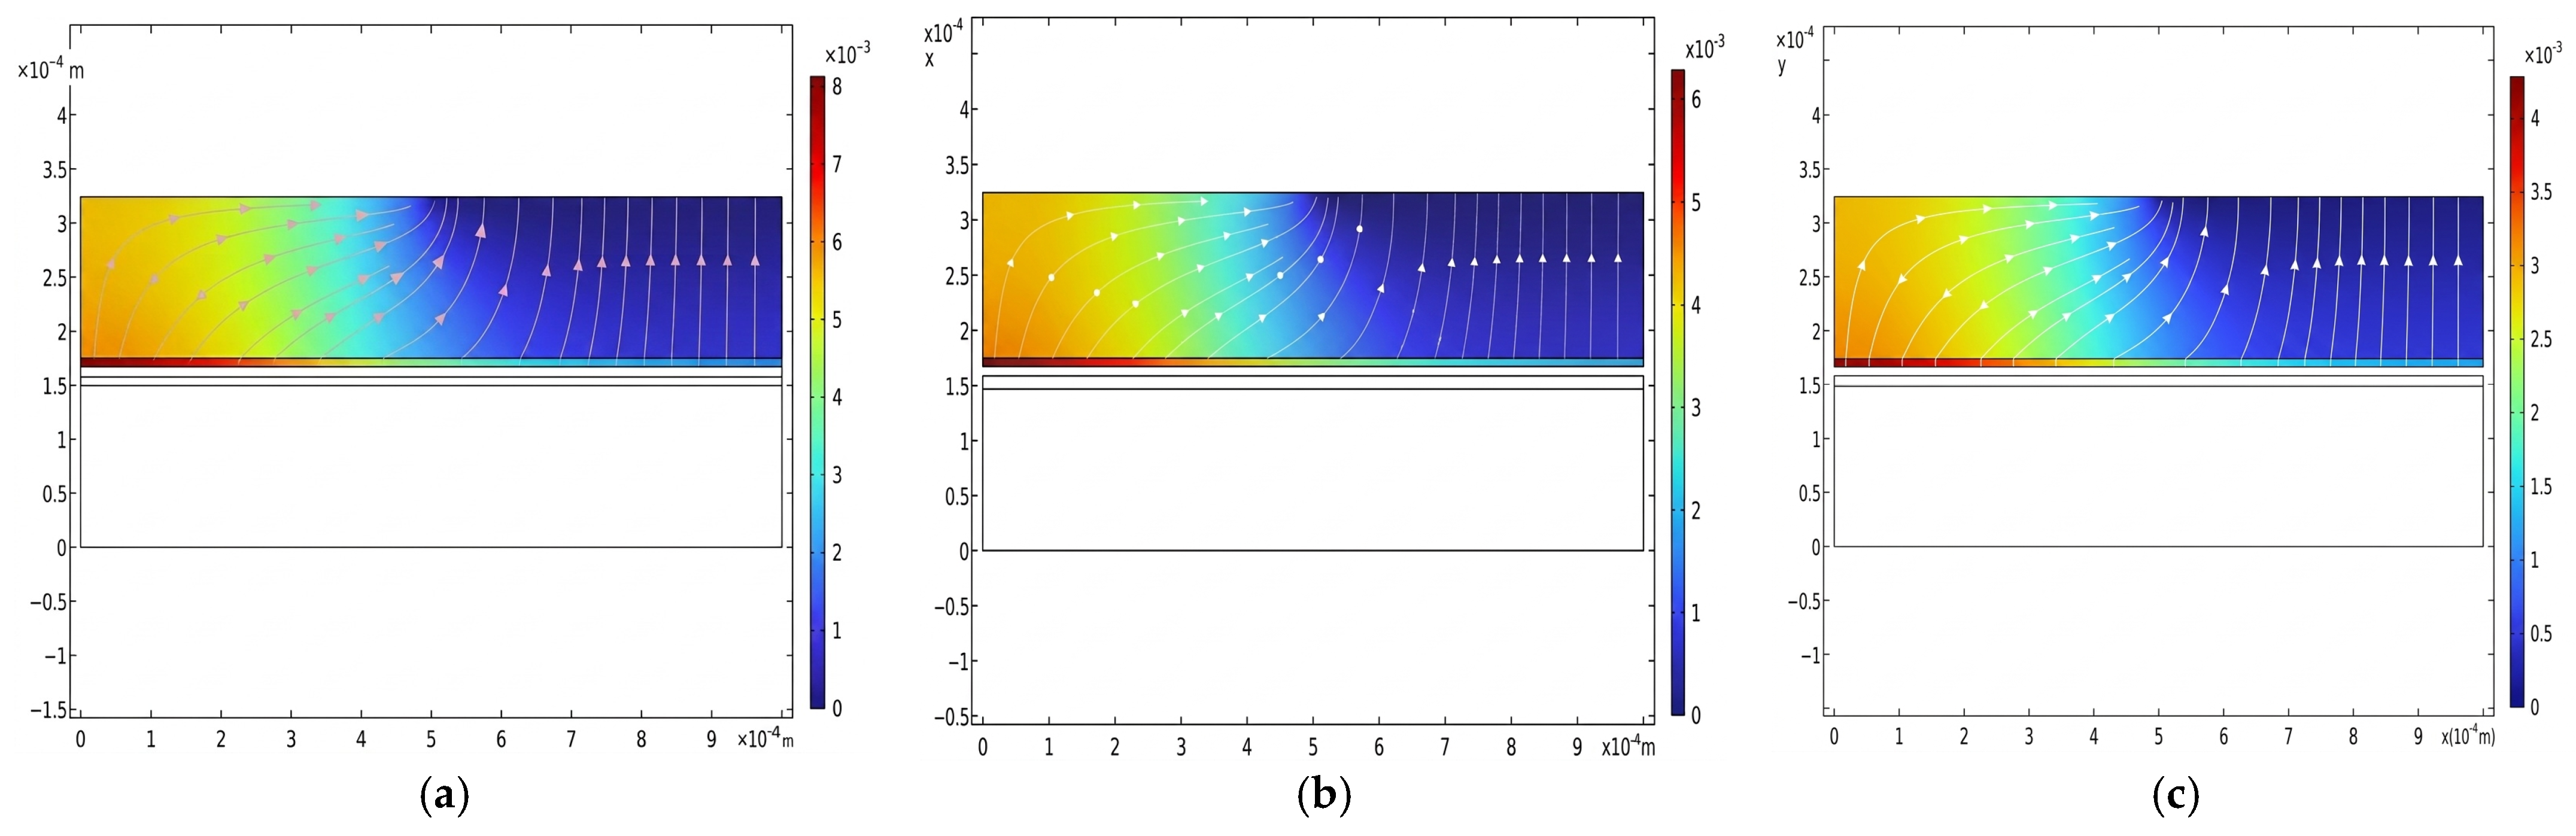
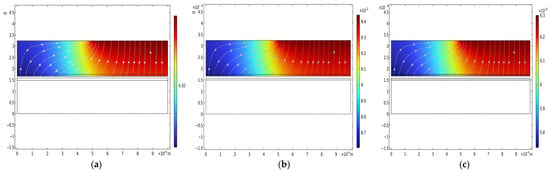
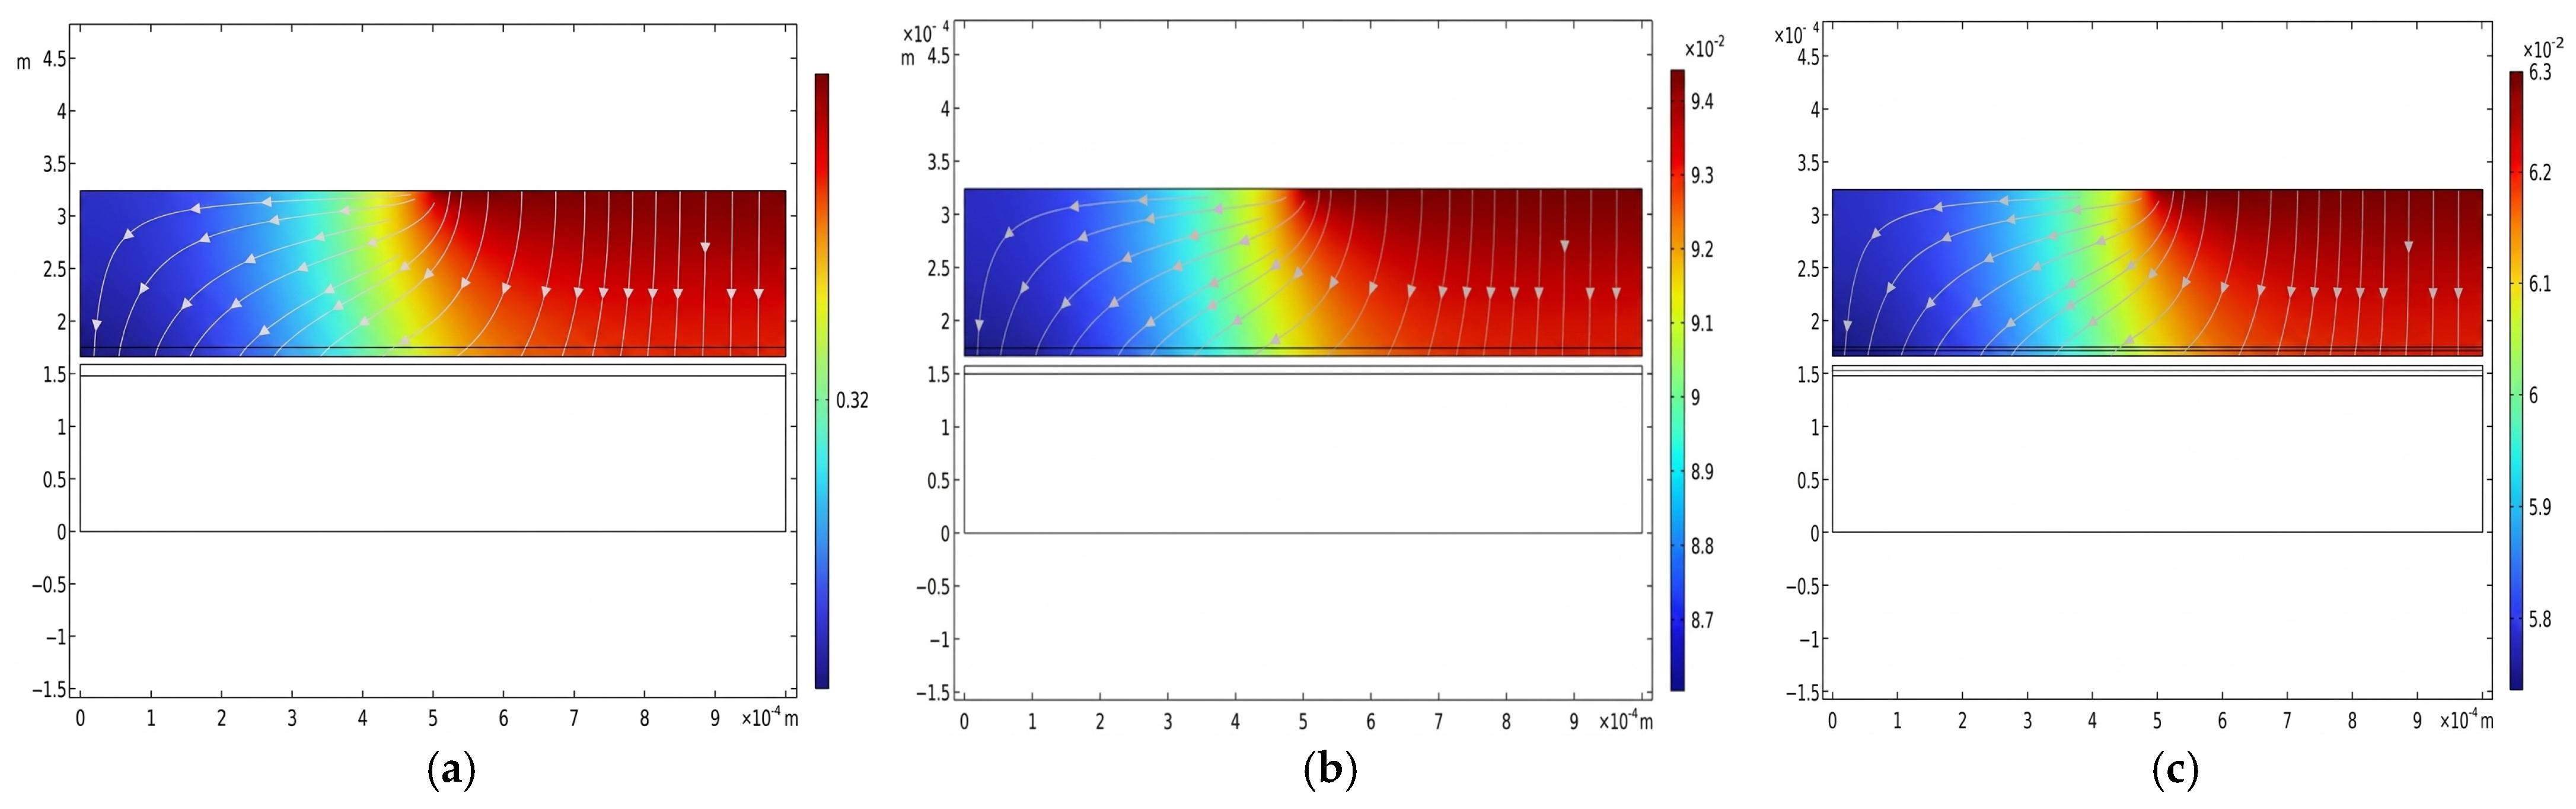
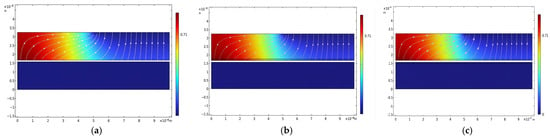
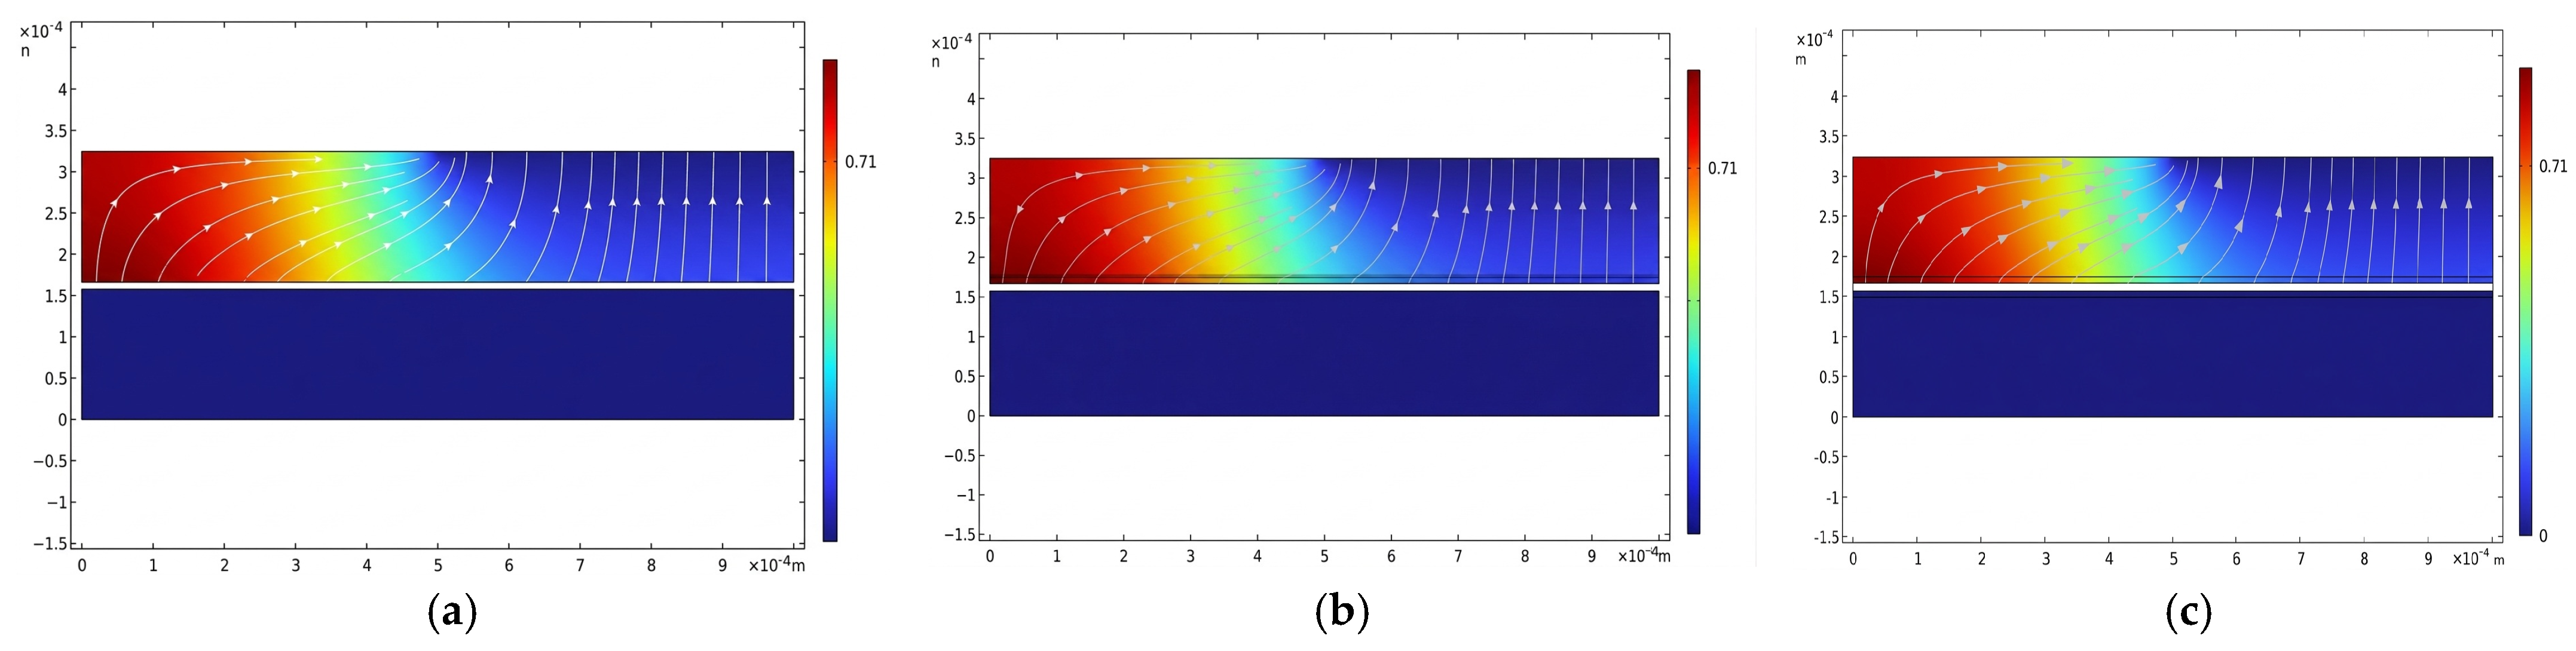
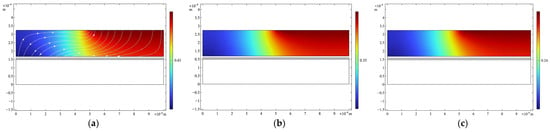
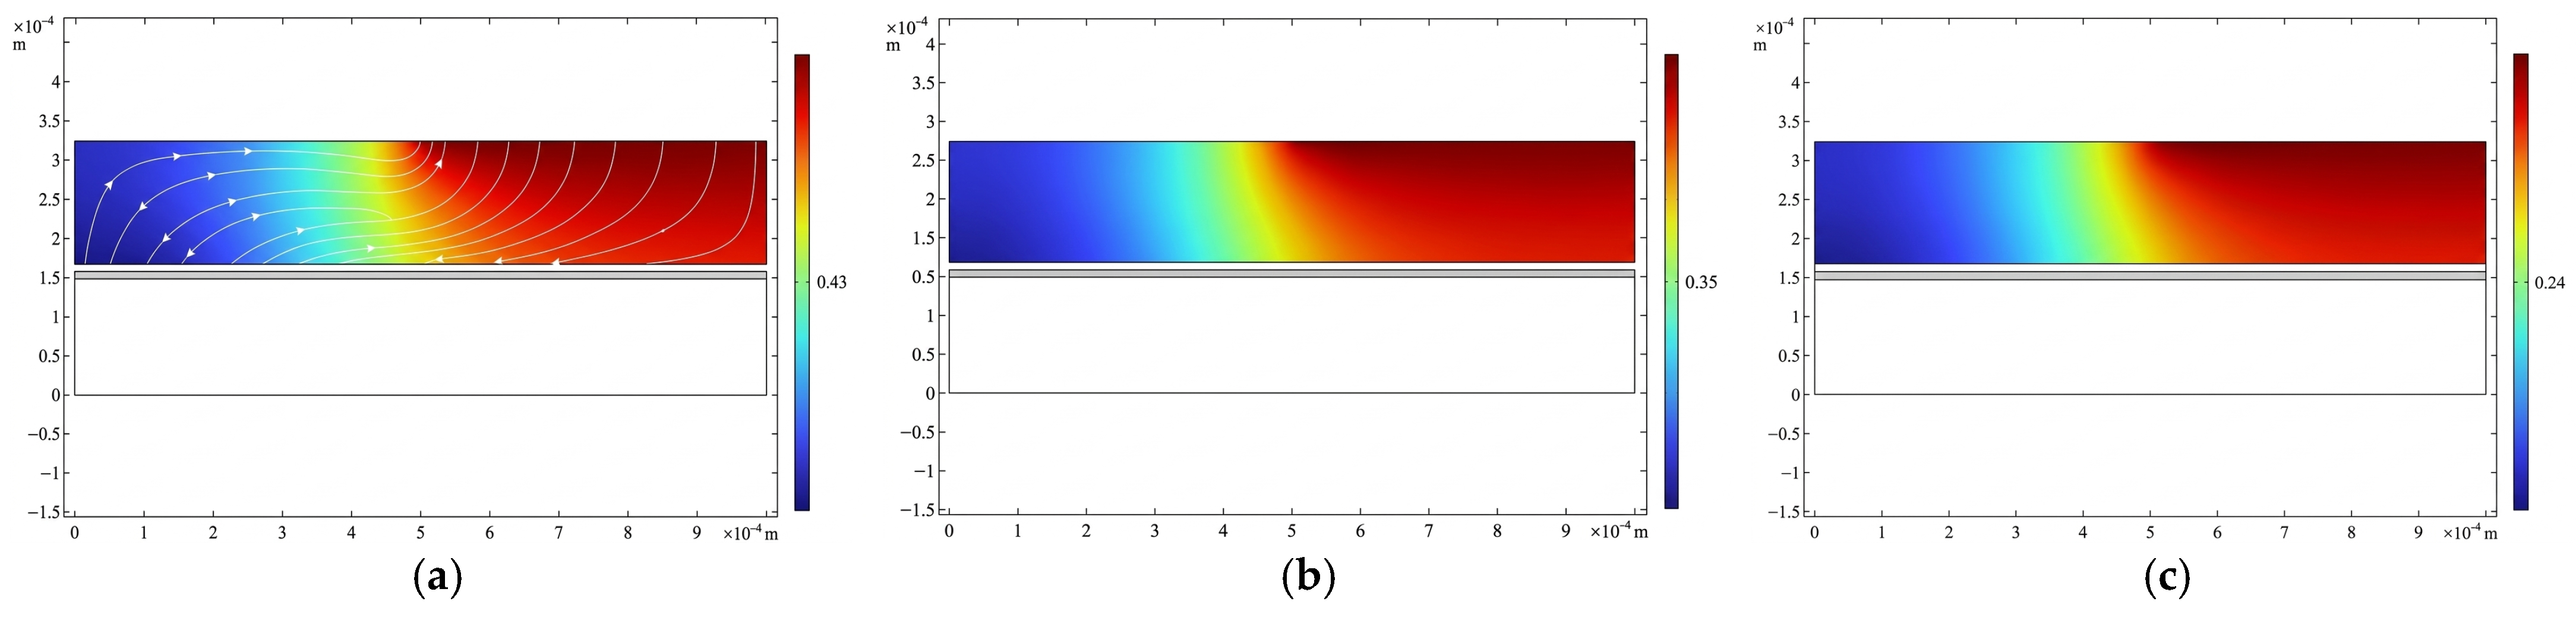
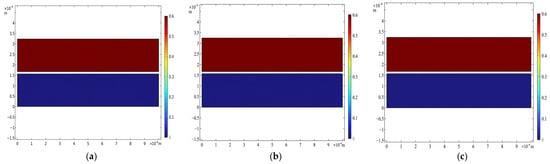
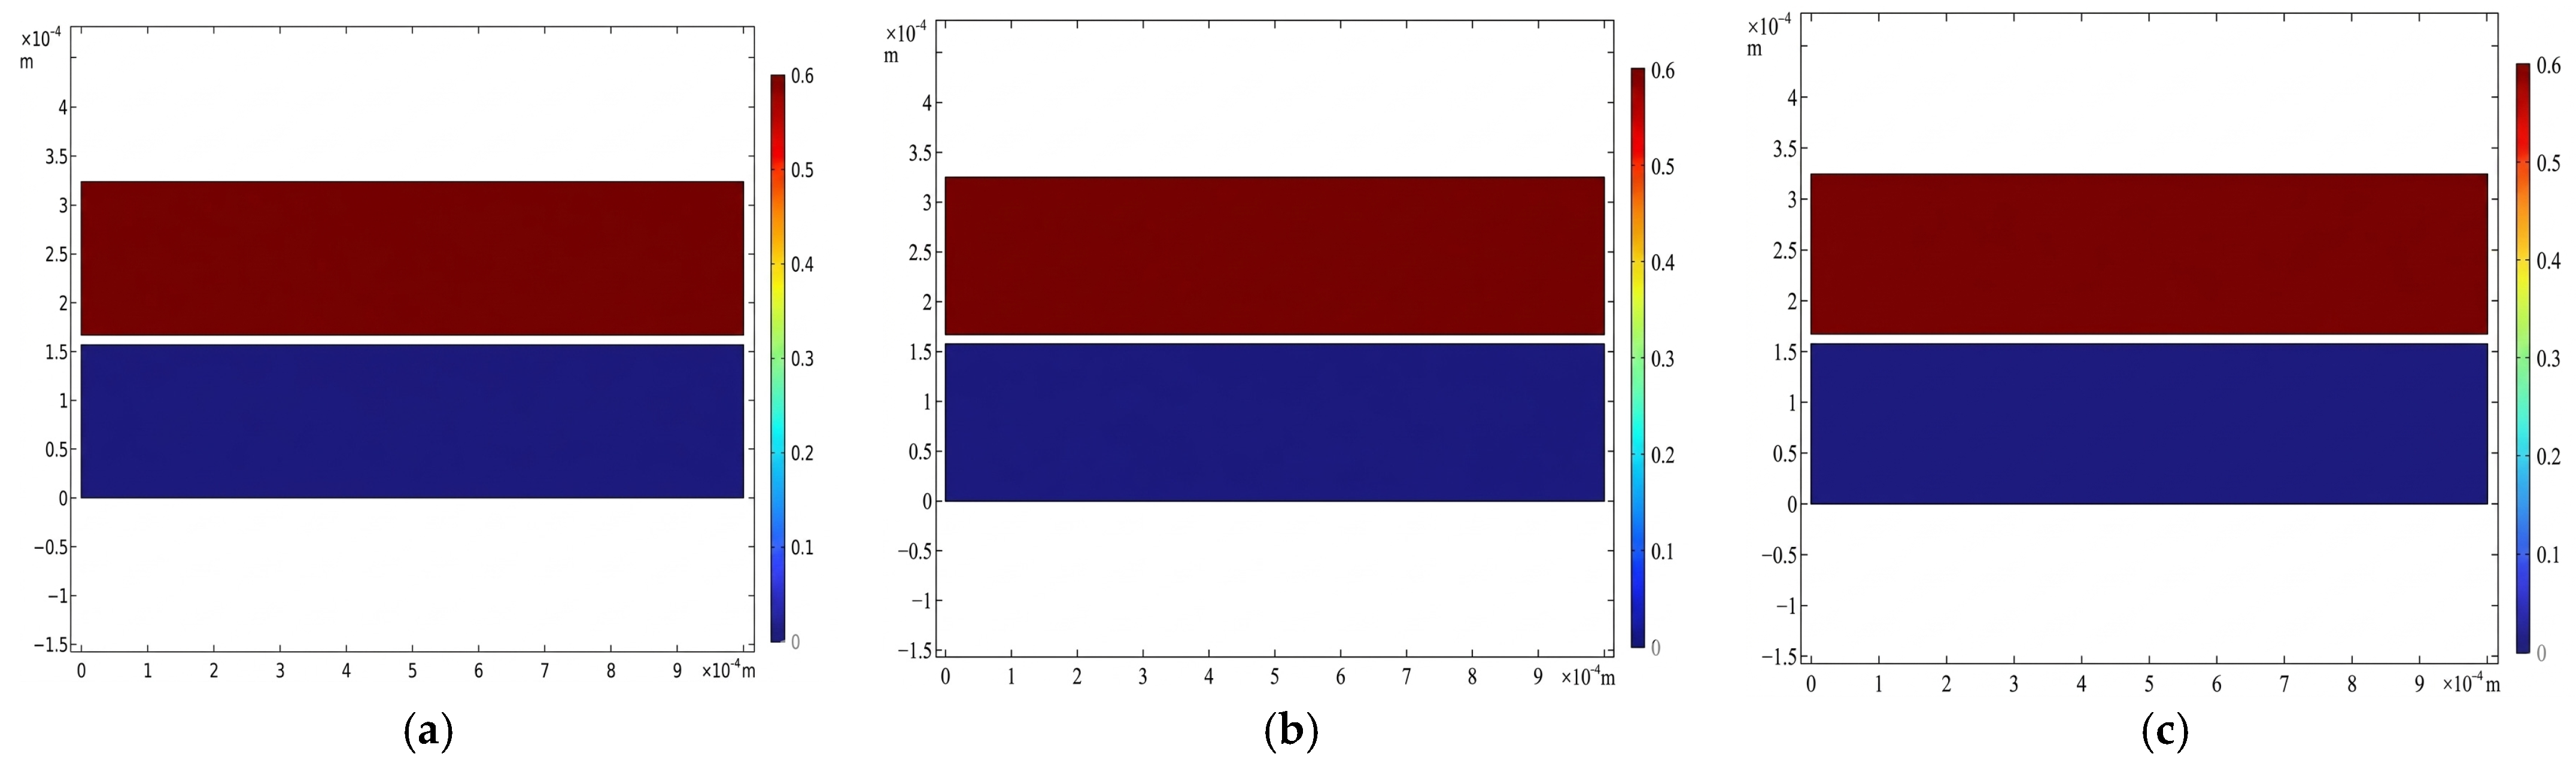
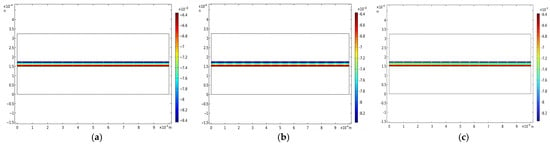
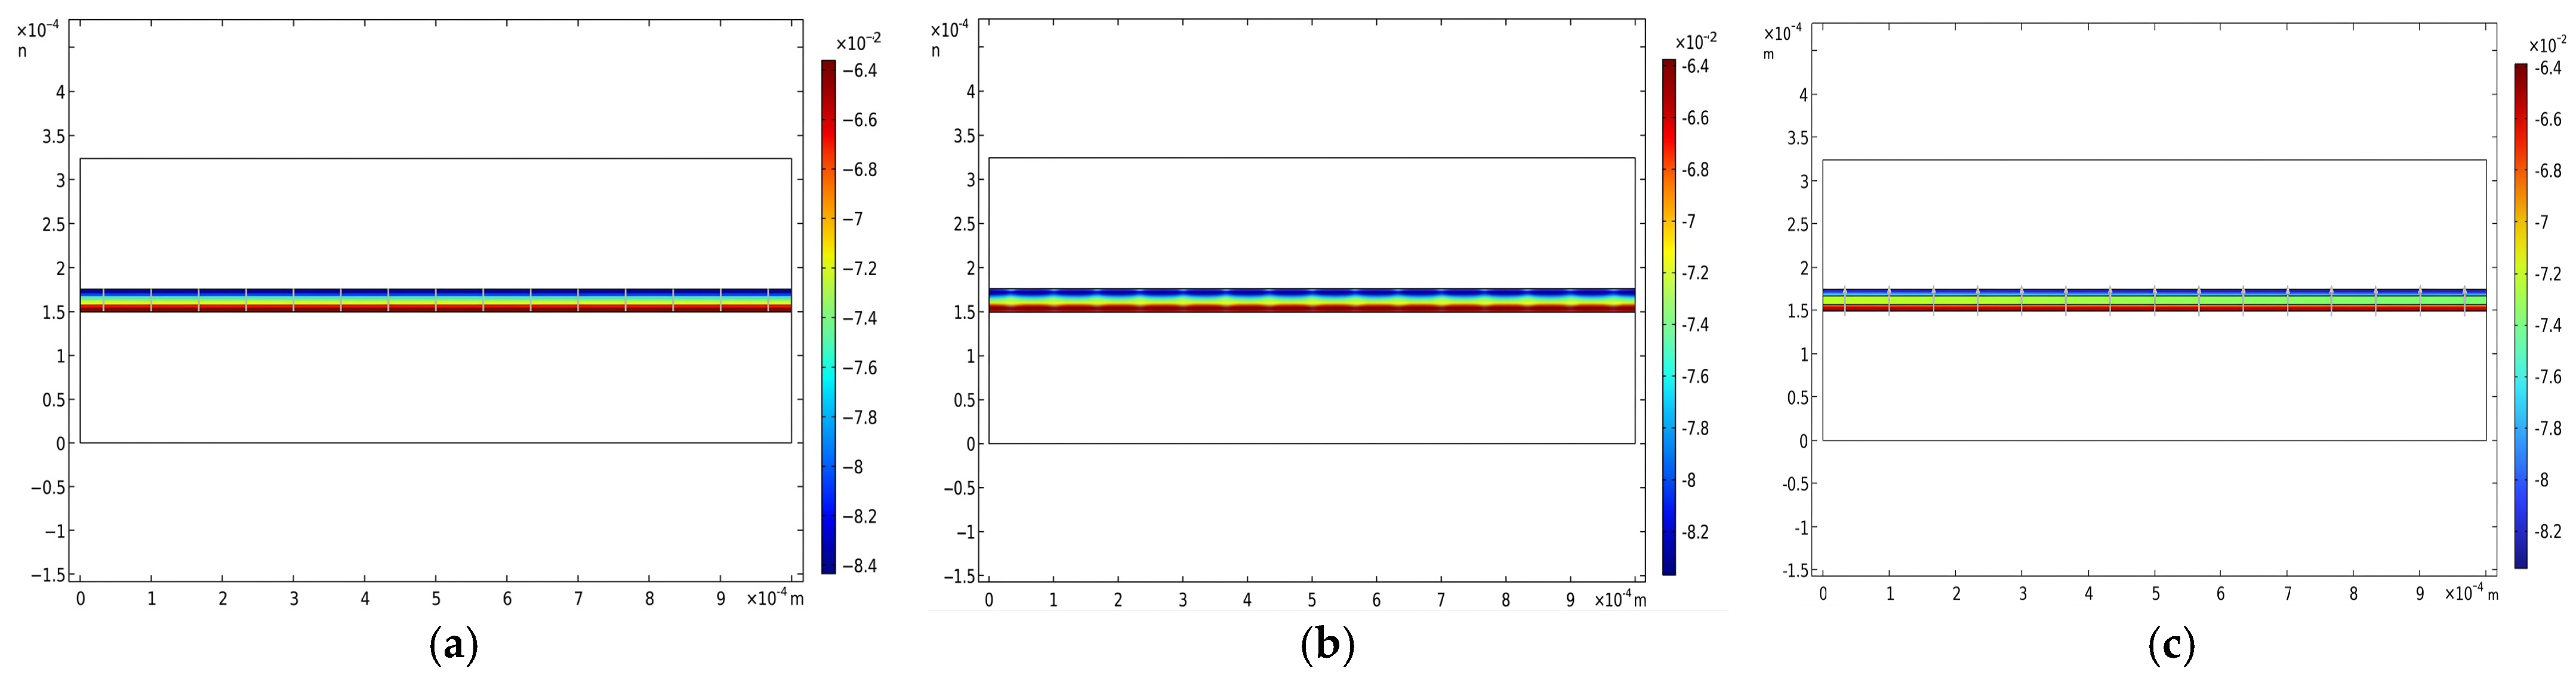
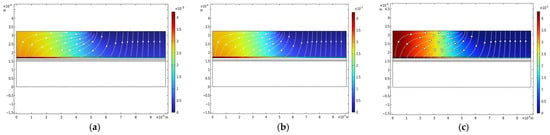
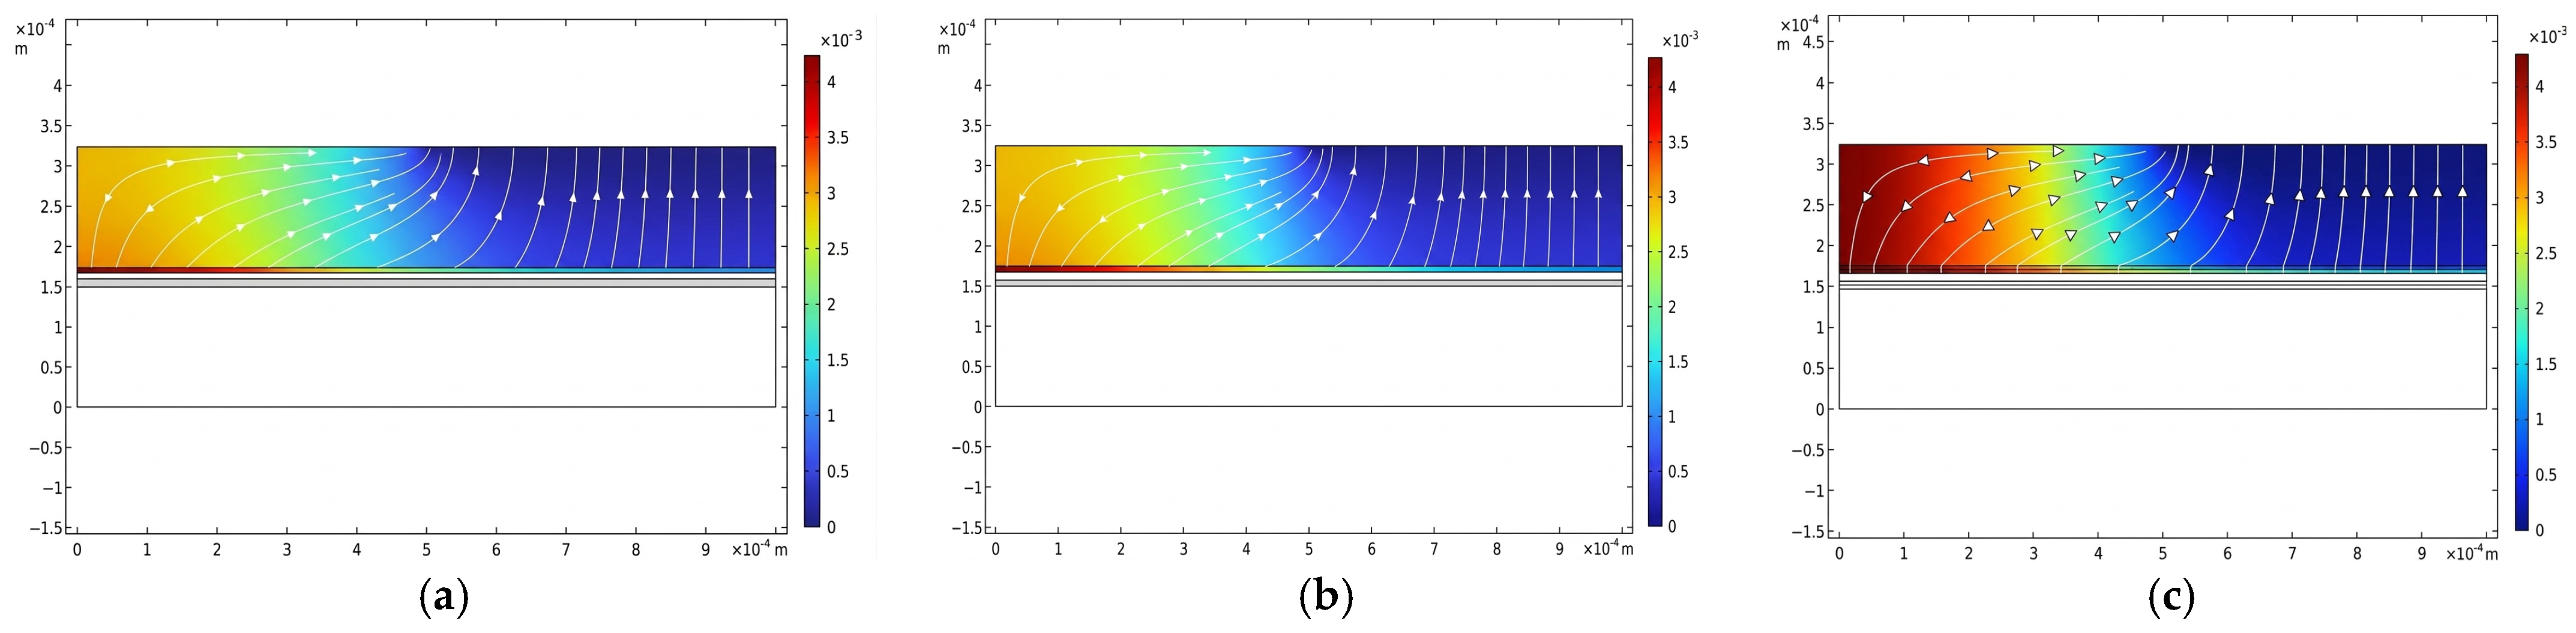
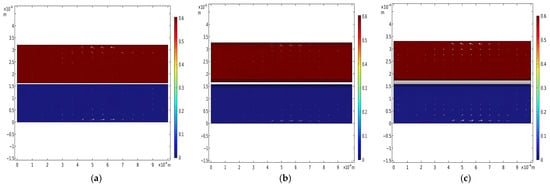
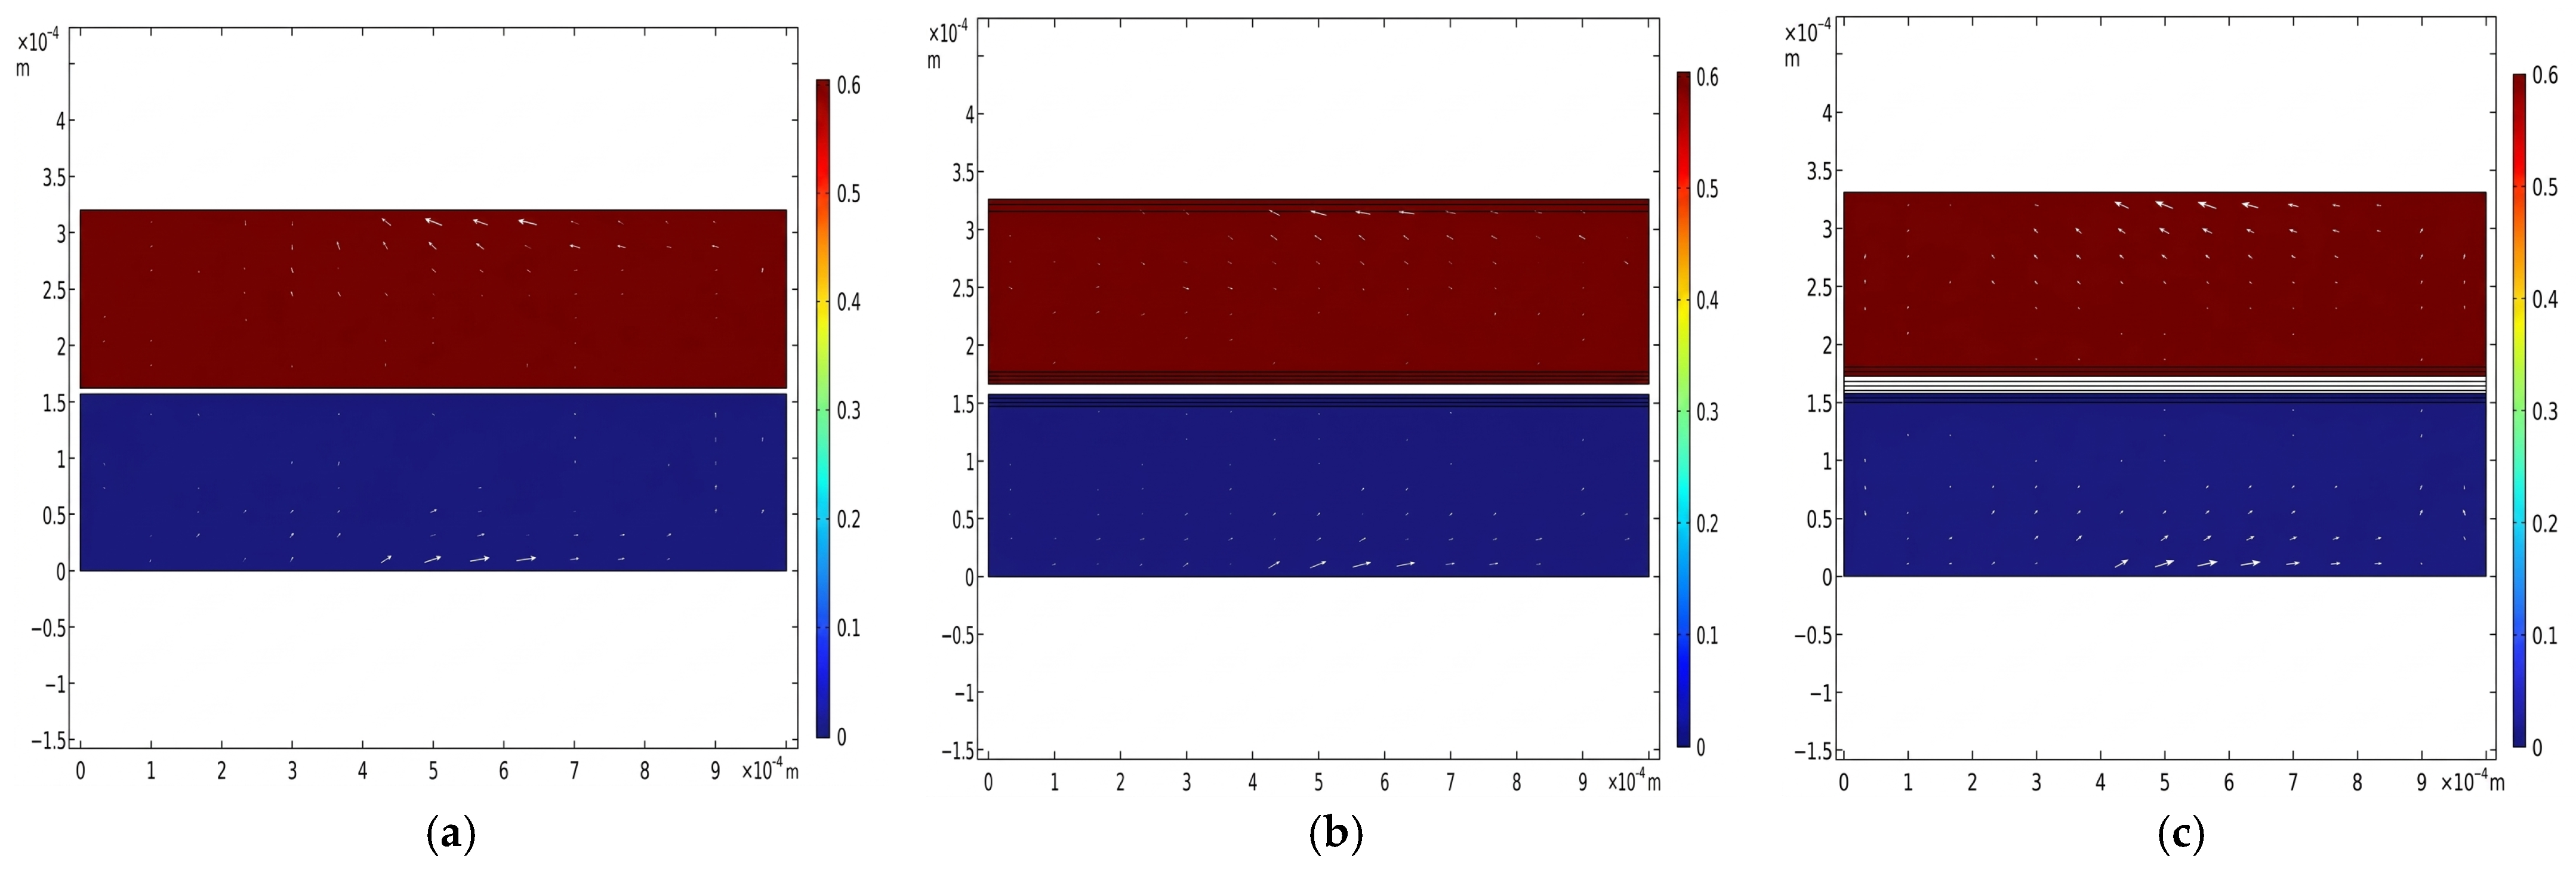
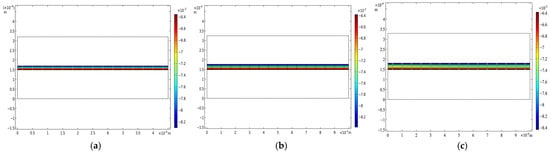
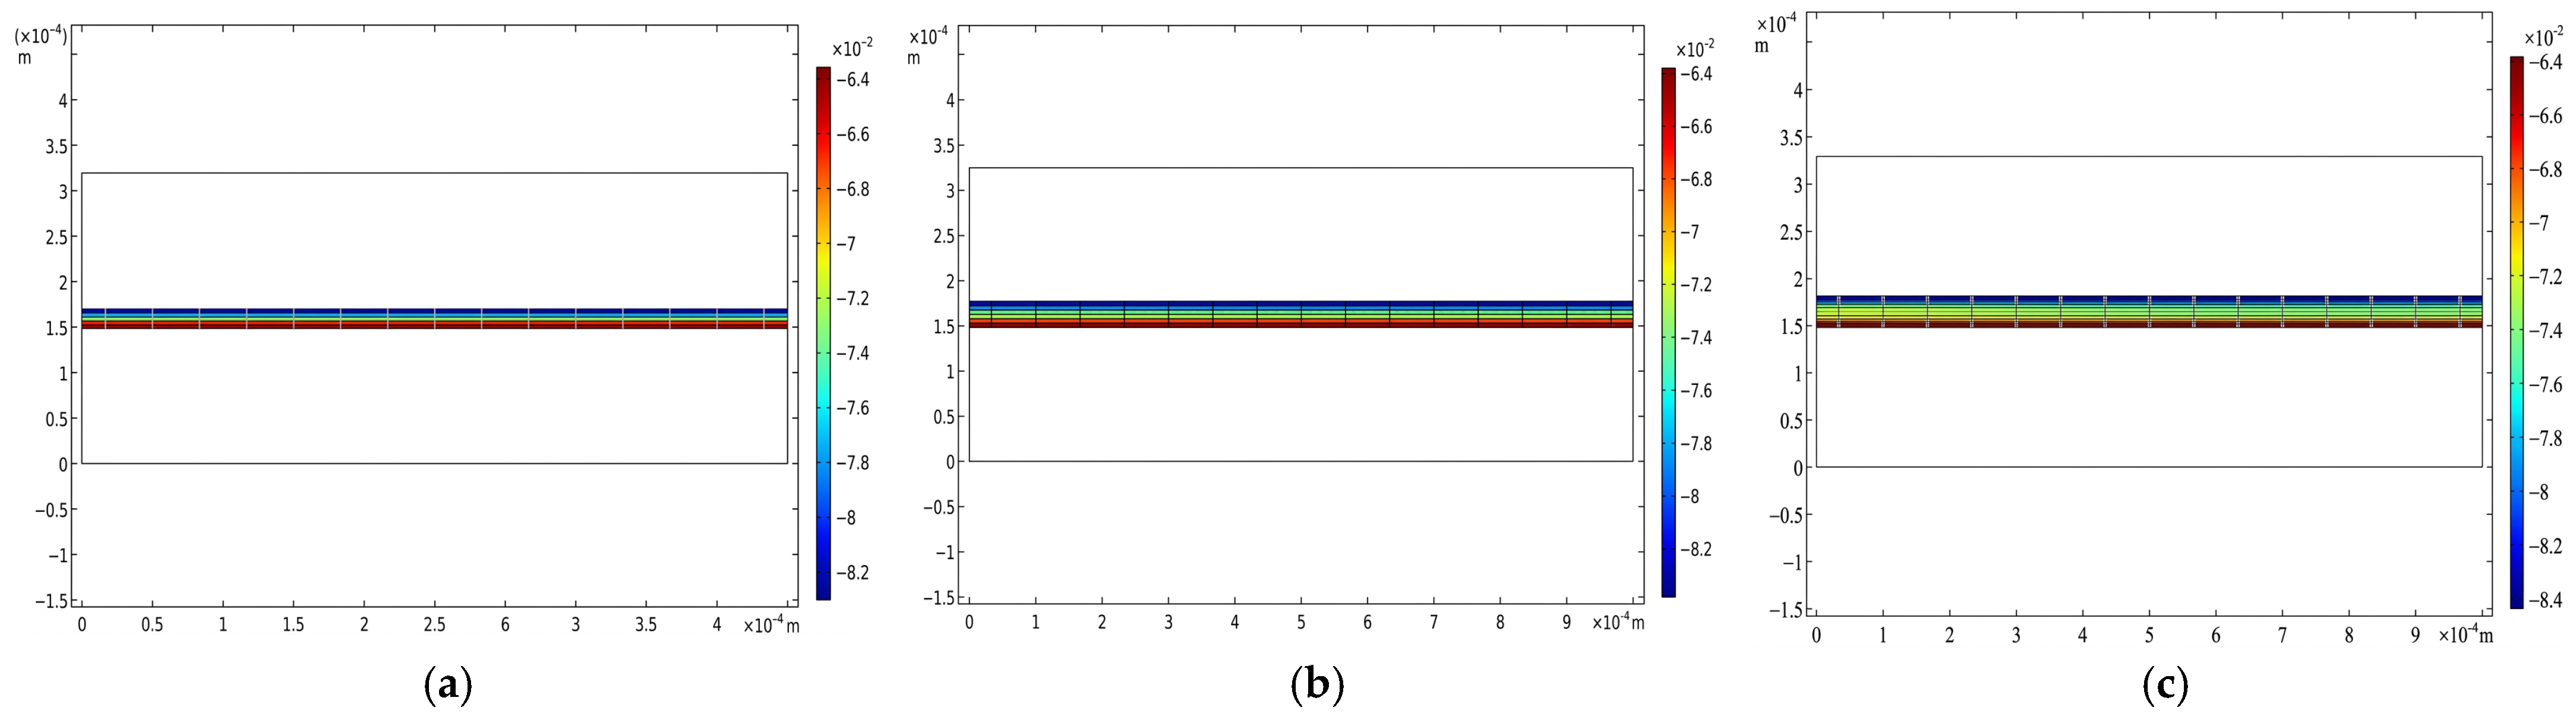
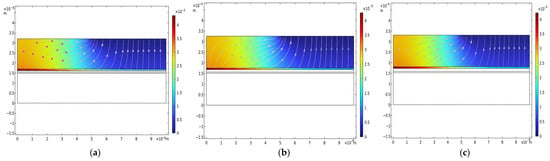
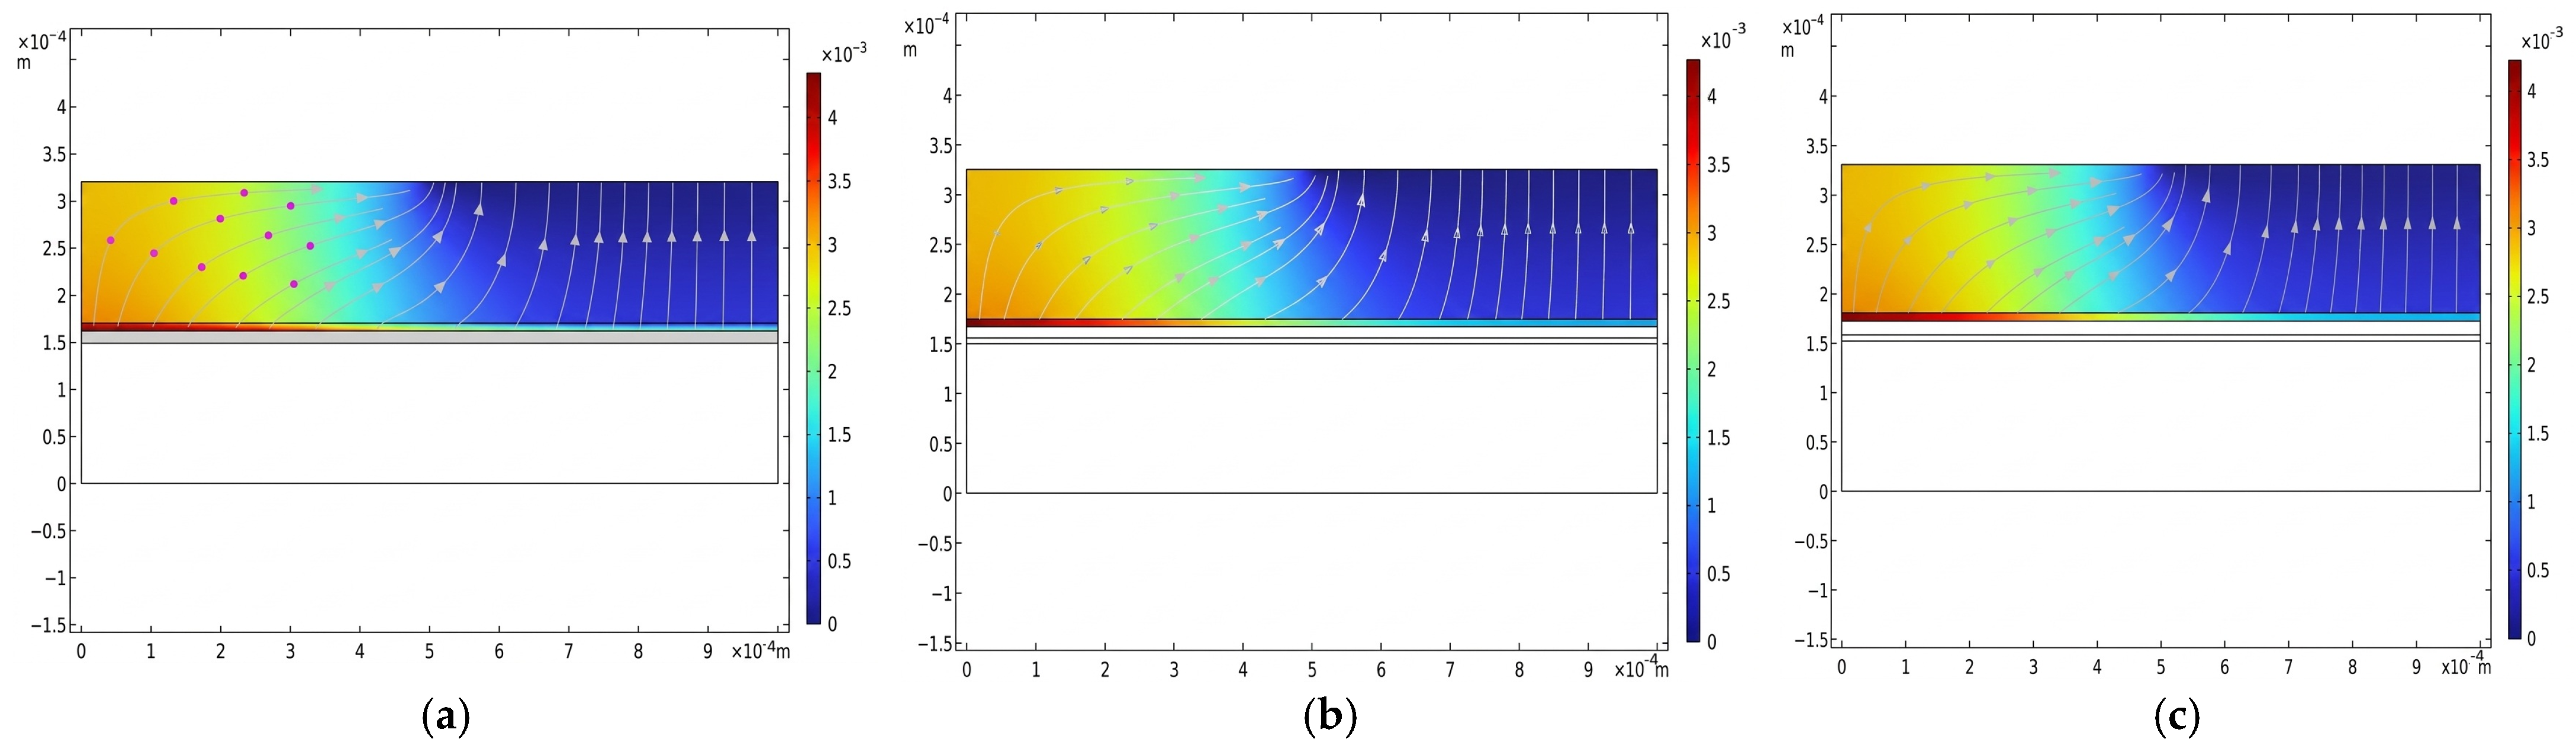
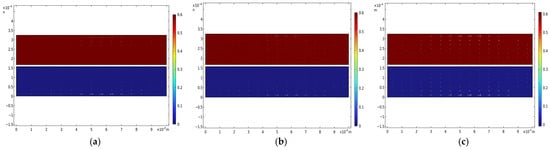
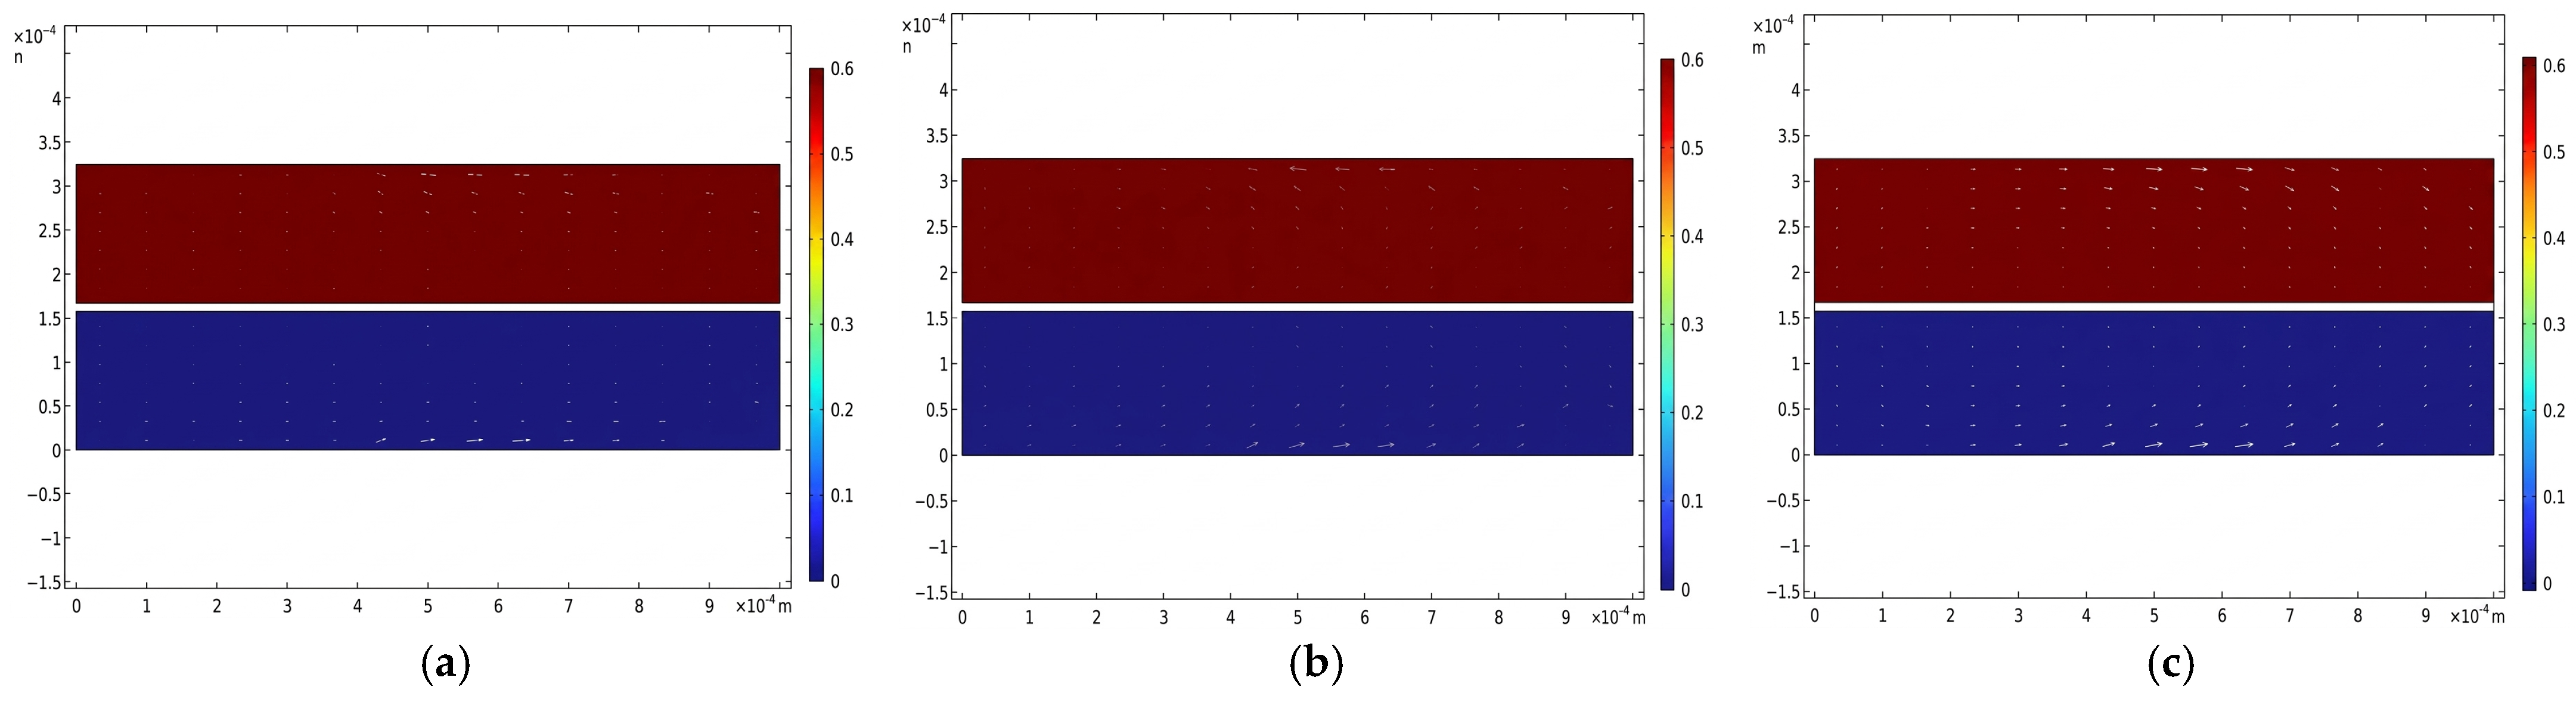
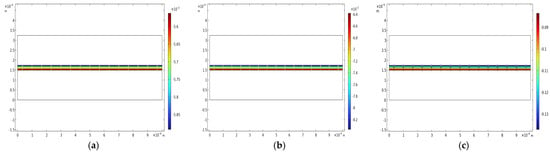
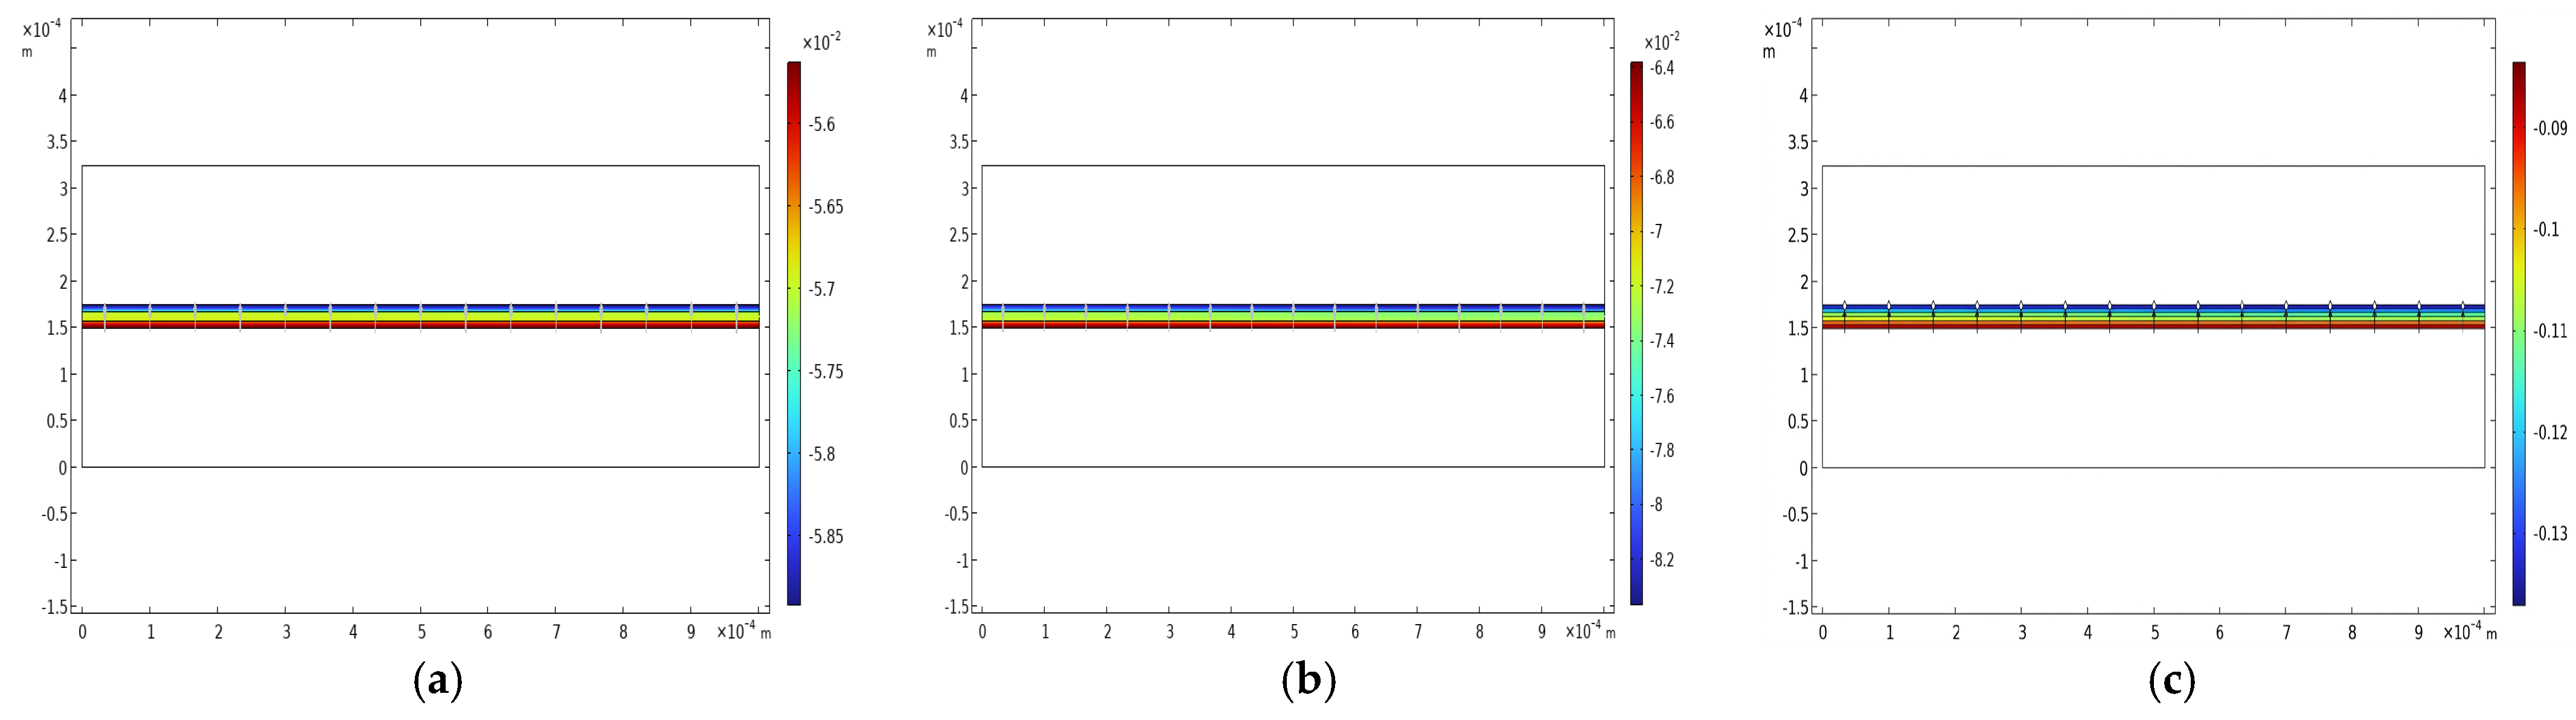
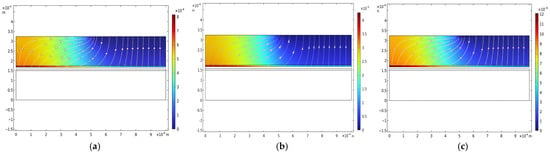
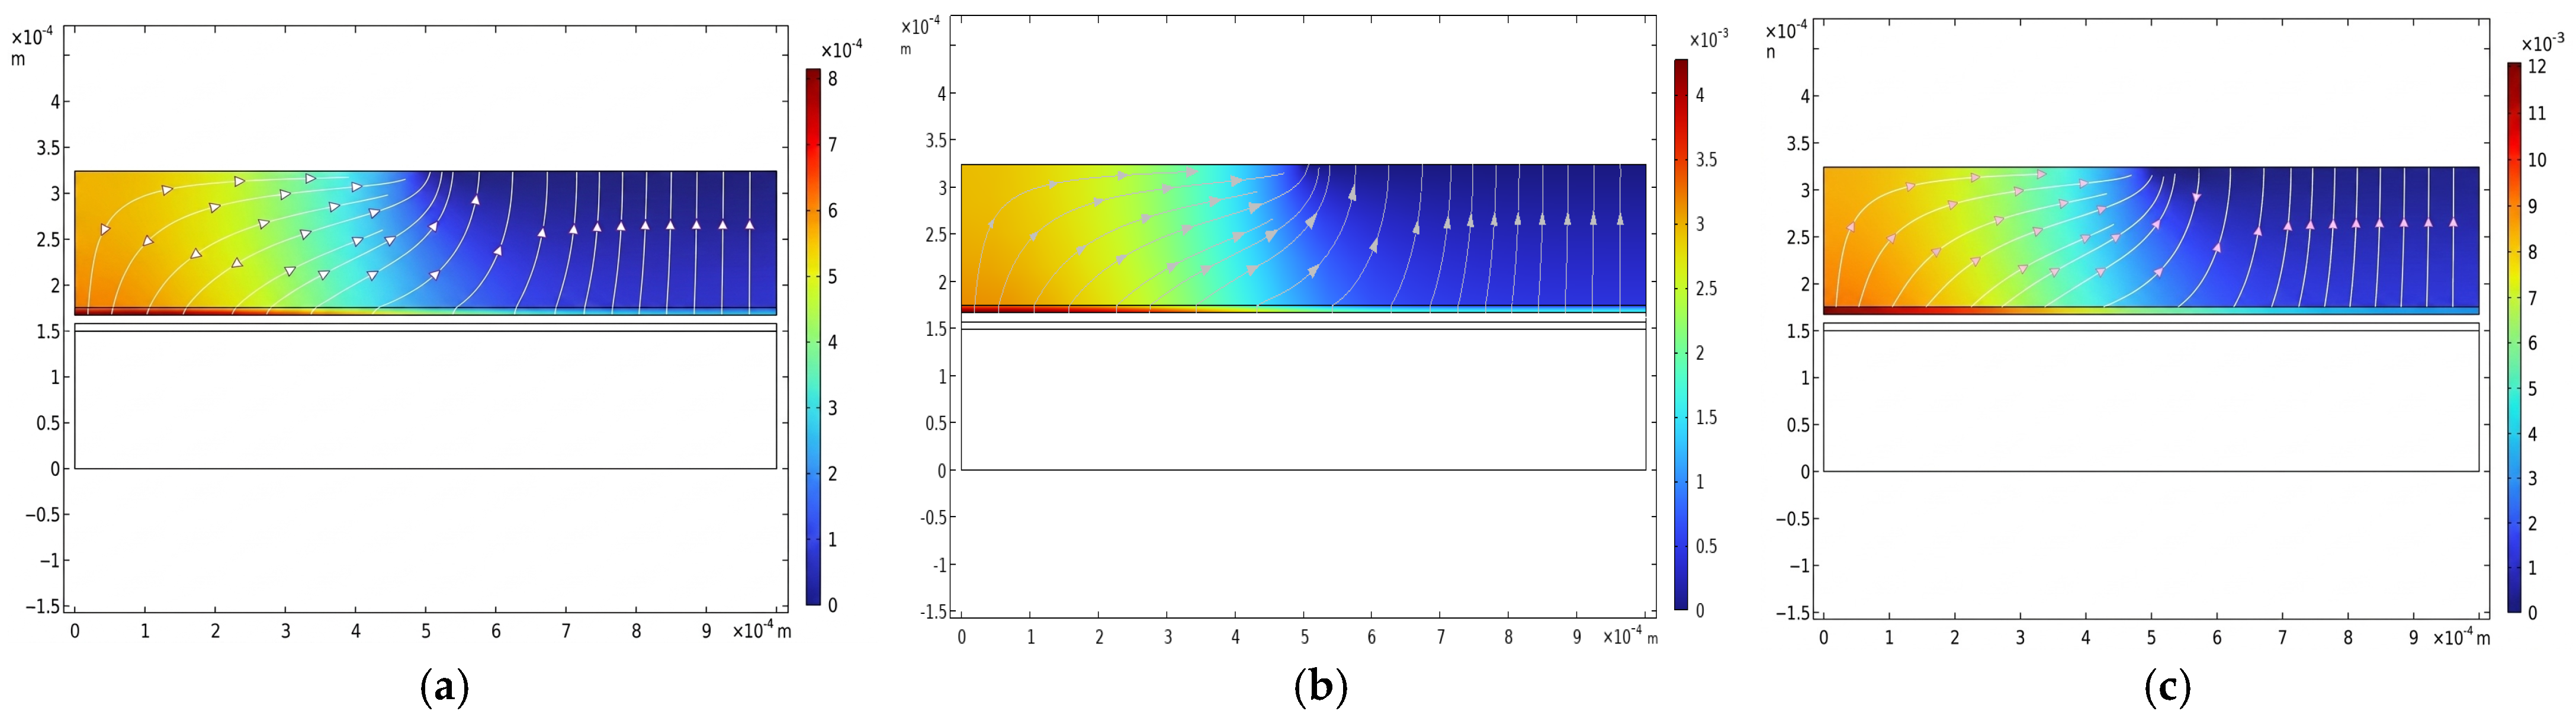
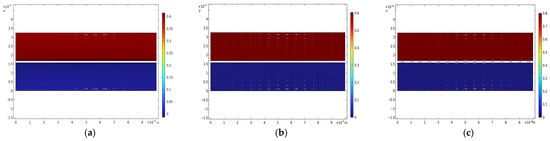
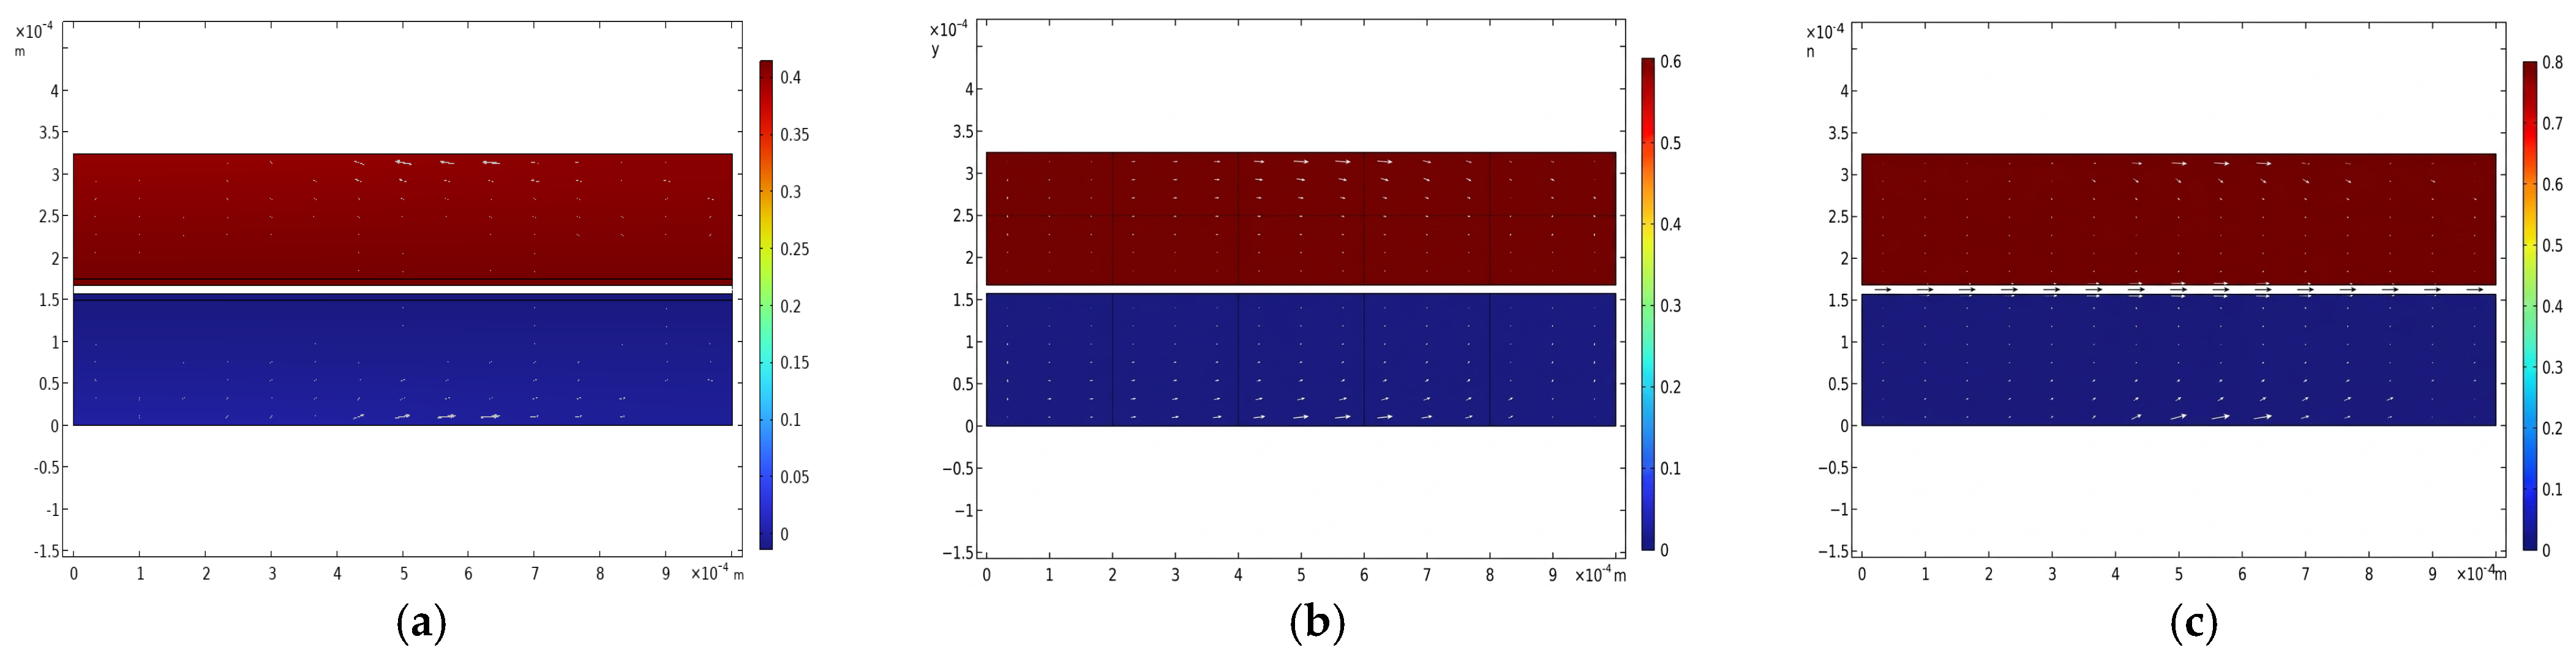
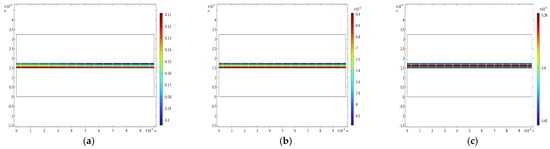
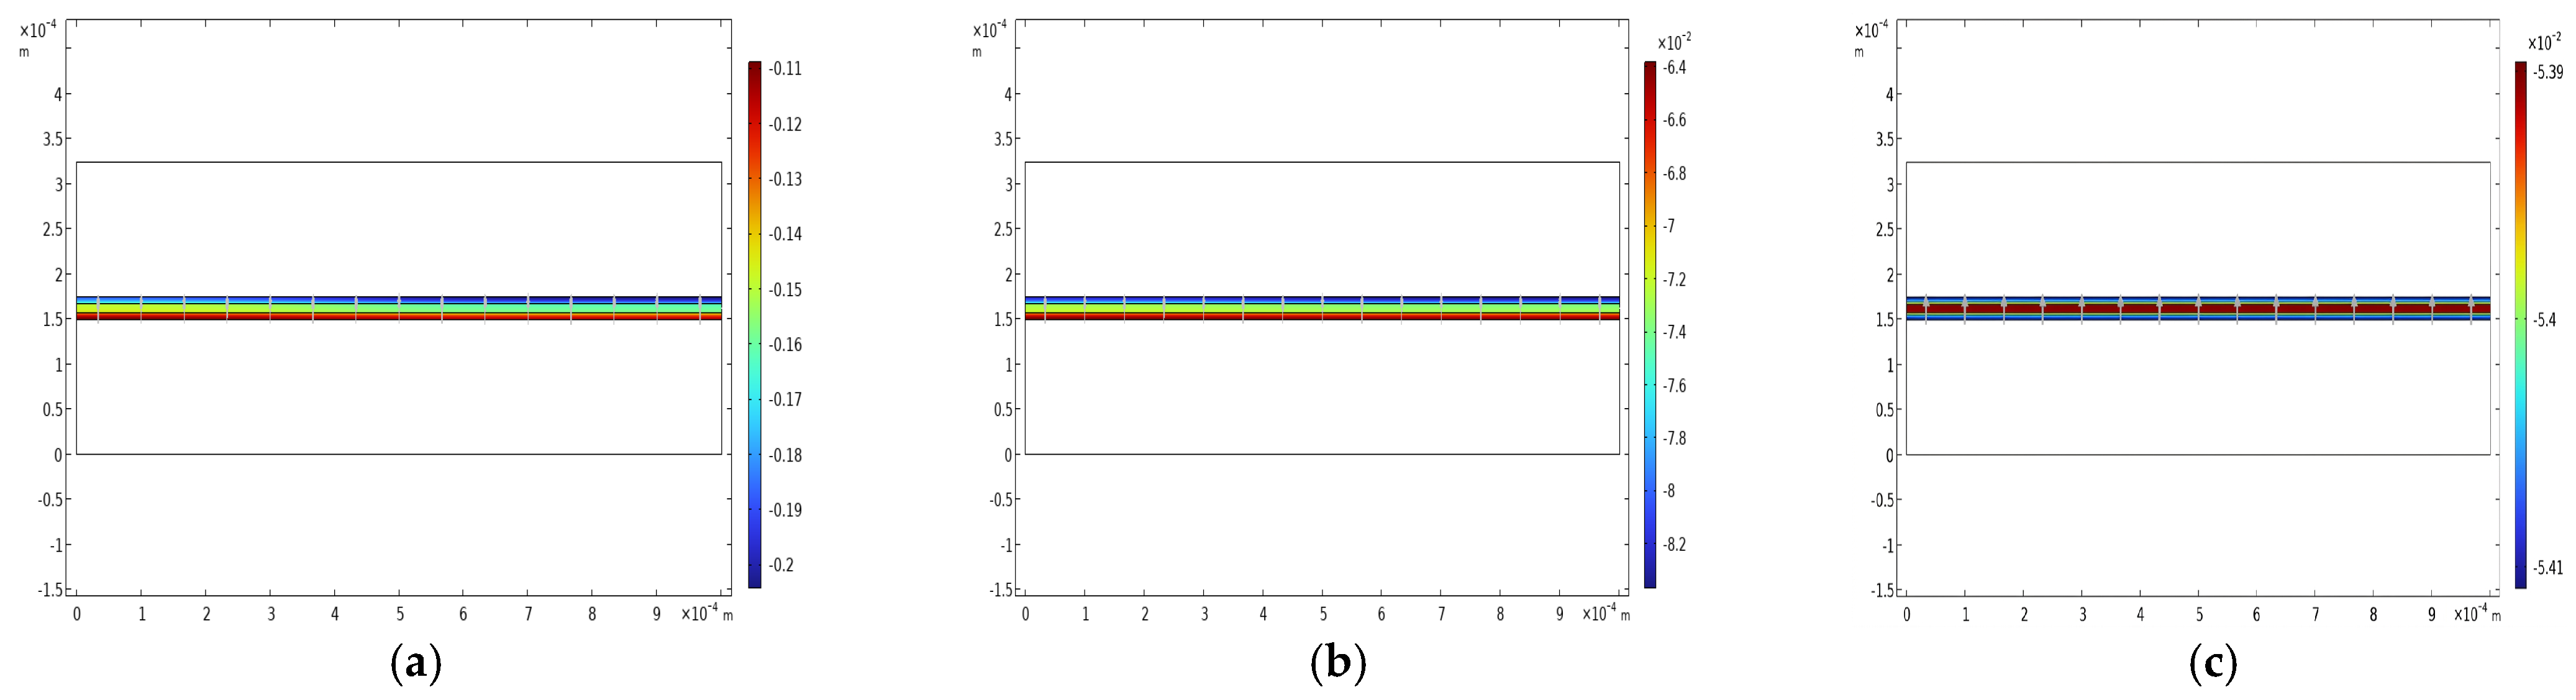
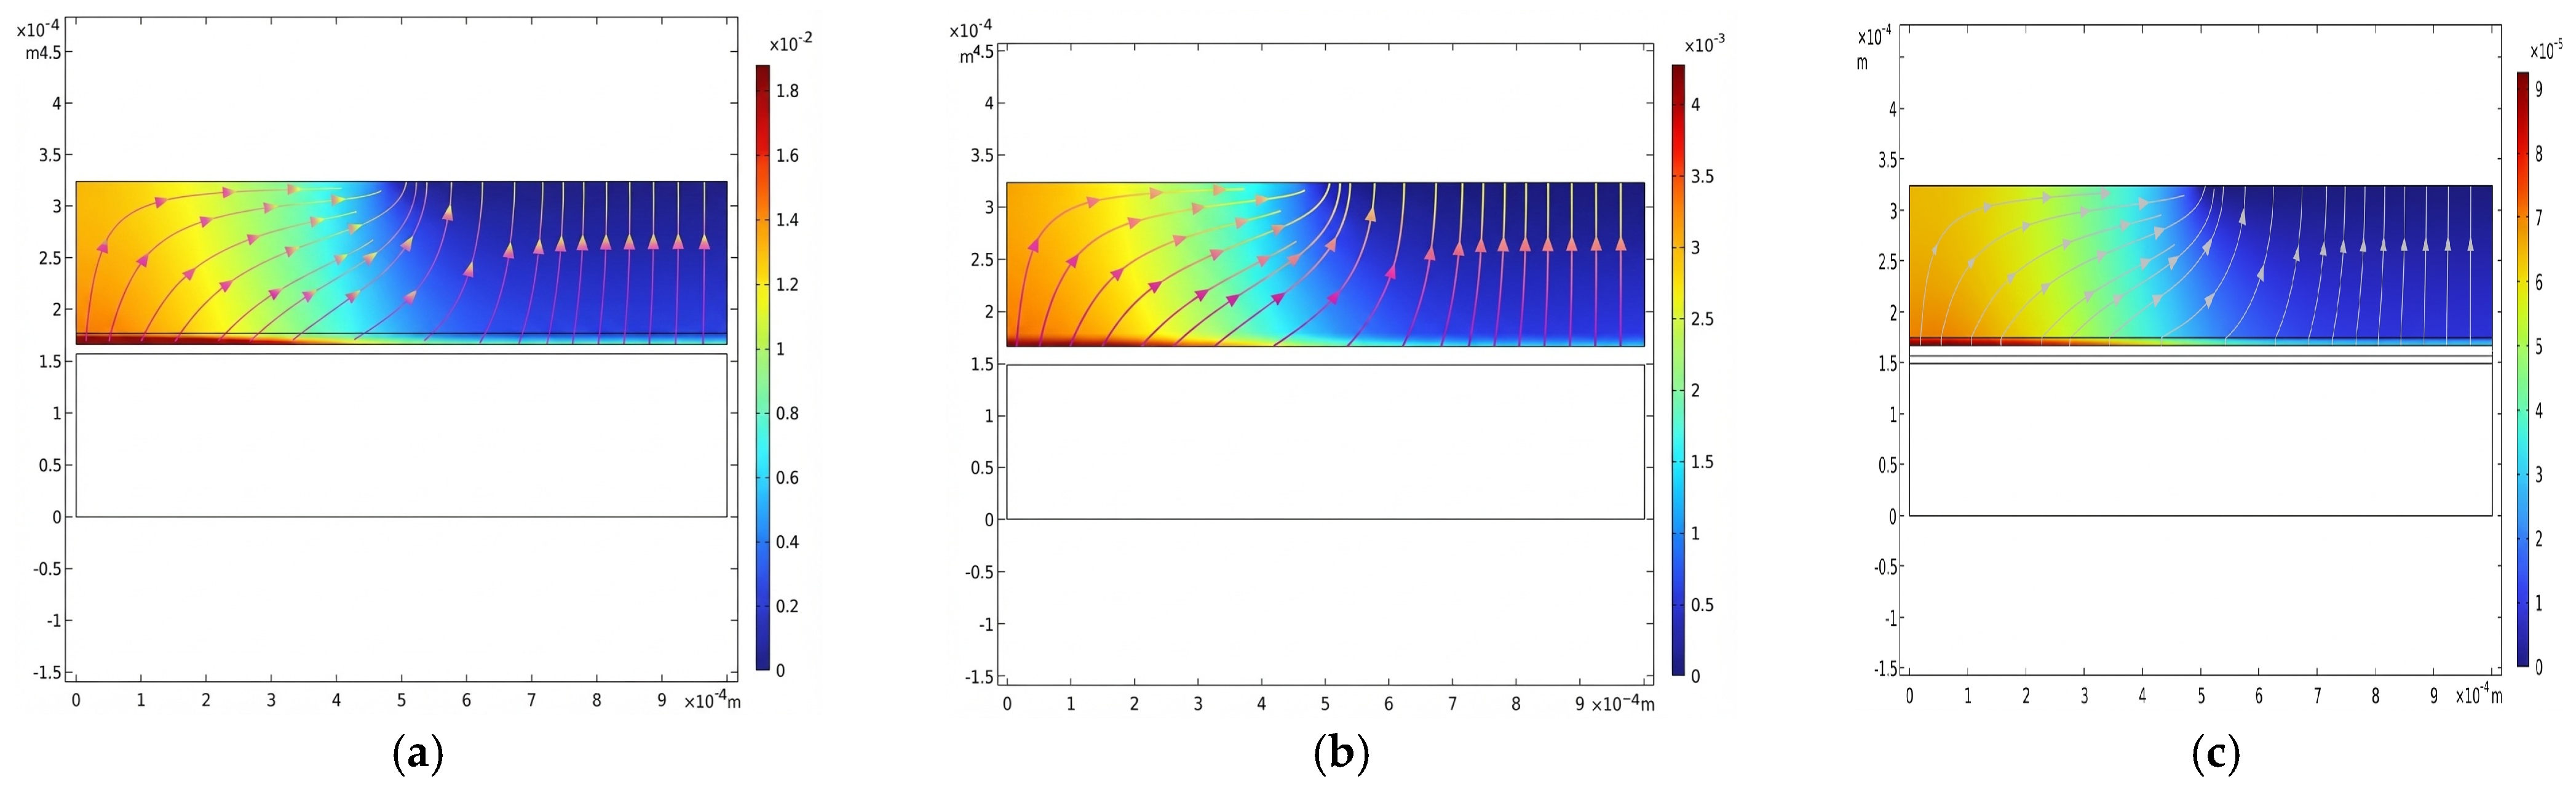

Disclaimer/Publisher’s Note: The statements, opinions and data contained in all publications are solely those of the individual author(s) and contributor(s) and not of MDPI and/or the editor(s). MDPI and/or the editor(s) disclaim responsibility for any injury to people or property resulting from any ideas, methods, instructions or products referred to in the content. |
© 2026 by the author. Licensee MDPI, Basel, Switzerland. This article is an open access article distributed under the terms and conditions of the Creative Commons Attribution (CC BY) license.