


Abstract
Accurate diagnosis of micro short-circuits (MSCs) is essential for ensuring the safety of lithium-ion batteries used in electric vertical take-off and landing (eVTOL) aircraft. Unlike conventional electric vehicles, eVTOL batteries normally operate under high-rate discharge conditions, where strong polarization and rapid voltage variations are apt to mask the weak signatures of MSCs. To address this challenge, this study proposes an MSC diagnosis method based on multiscale voltage residual analysis. A battery model is first established to characterize the normal response under high-rate discharge, and the discrepancy between the measured and estimated terminal voltages is used to construct the model residual. Features describing the overall voltage evolution, residual statistical distribution, and multiscale residual fluctuations are then extracted. Specifically, the shadow region integral area and voltage–capacity slope are used to characterize the global voltage trajectory, while the residual mean and kurtosis quantify the systematic deviation and non-Gaussian fluctuation of the residual. Wavelet decomposition is further applied to capture the low- and high-frequency residual characteristics. After feature reduction, eight representative features are retained to establish the diagnostic model. Experimental validation under high-rate discharge conditions demonstrates that the proposed method can effectively identify MSCs despite interference from abnormal aging, thereby reducing the false alarms caused by feature similarity. This study provides a reliable approach for micro short-circuit diagnosis of eVTOL lithium-ion batteries under strong polarization and highly dynamic operating conditions.
1. Introduction
Recently, the growing demand for green transportation and urban air mobility (UAM) has significantly accelerated the development of low-altitude aircraft. Among them, electric vertical take-off and landing (eVTOL) aircraft have emerged as some of the most representative and promising configurations. The battery system is a key component of eVTOL aircraft, directly affecting their power performance, flight range, and operational reliability. Owing to their high energy density, high power capability, and long cycle life, lithium-ion batteries (LIBs) are widely regarded as the primary power source for eVTOL aircraft [1,2,3]. Recent studies have also emphasized the combined influence of battery chemistry and operating conditions on electrochemical performance, aging, and thermal safety [4,5,6,7,8]. However, battery safety remains a major concern because LIBs are susceptible to thermal runaway triggered by various electrical, thermal, and mechanical faults.
Among various battery faults, a micro short-circuit (MSC) refers to a weak short-circuit condition characterized by a relatively high-resistance unintended conductive path and a small leakage current. Rather than specifying the physical location of the short circuit, the term “micro” primarily describes the weak severity and limited electrical manifestation of the fault. According to the location of the conductive path, an MSC may occur internally between the positive and negative electrodes inside the cell or externally through a high-resistance connection between the cell terminals. In both cases, the relatively large short-circuit resistance limits the leakage current, resulting in weak voltage deviations and gradual self-discharge that are considerably more difficult to detect than those of a severe short circuit. As the fault deteriorates and the equivalent short-circuit resistance decreases, the leakage current and associated Joule heating increase, potentially leading to more severe failure and thermal runaway [9,10].
Compared with conventional electric-vehicle and stationary battery applications, eVTOL batteries are subjected to higher rates and more rapidly varying power demands, producing stronger polarization and larger transient voltage fluctuations that can mask weak MSC signatures. In this study, the MSC scenario corresponds to a persistent high-resistance internal conductive path with a small leakage current, while the battery is subjected to a dynamic UAM discharge profile containing frequent current transitions and high-power pulses. Aging-related voltage deviations are additionally considered as a confounding condition because they may resemble MSC-induced changes [11,12,13]. These characteristics make early MSC diagnosis under eVTOL operation more challenging than under relatively mild or steady operating conditions.
Existing approaches for early online MSC diagnosis can be broadly classified as knowledge-based, signal-processing-based, model-based, and data-driven methods. These approaches focus, respectively, on fault knowledge representation and reasoning, diagnostic feature extraction from measurable signals, deviation analysis based on healthy battery models, and sample-driven nonlinear classification. Each category has distinct objectives, advantages, and applicable conditions.
Knowledge-based methods organize and reason over fault symptoms, causes, propagation pathways, and mitigation strategies using expert rules, fault knowledge graphs, digital battery passports, or probabilistic reasoning networks. They are suitable for multi-source fault-knowledge management, online retrieval, and decision support. Zhang et al. [14] developed a knowledge-graph and cloud-based inference framework for battery faults by integrating fault logs, reliability models, and online queries to support fault retrieval and reasoning. Ji and Li [15] further combined a digital battery passport, a knowledge graph, and a fuzzy Bayesian network to address uncertainty in power battery fault propagation. Overall, knowledge-based approaches improve the interpretability and traceability of fault knowledge, but their performance depends on the completeness of the knowledge base, rule quality, and expert experience. Because they do not usually extract weak MSC signatures directly from operating signals, they are more suitable as a fault-knowledge support layer than as a standalone solution for fault identification under dynamic conditions.
Signal-processing-based methods construct diagnostic indicators directly from measurable signals, such as voltage, current, temperature, capacity trajectories, and intercell differences, without requiring a complete battery model. Sun et al. [16] identified internal-short-circuit (ISC)-induced cell-voltage drops using relative entropy and Z-scores and combined them with a sliding window for online short-circuit detection in battery packs. Liu et al. [17] extracted the evolution of the cell charging voltage slope within a variable voltage window and developed a two-level diagnostic strategy for locating early ISC. Mao et al. [18] proposed an extremum sample-entropy method to diagnose minor short circuits in automotive battery modules with limited accessible signals. Li et al. [19] further detected MSC in energy-storage-station batteries using multivariate multiscale sample entropy of voltage, current, and temperature. These methods are computationally efficient; however, their decision boundaries commonly depend on a specific operating window, charging segment, cell consistency, and threshold setting. In highly dynamic applications such as eVTOL aircraft, load excitation, thermal state, SOC drift, and aging differences may jointly alter signal statistics, thereby increasing the risks of false alarms and missed detections.
Model-based methods rely on physical, electrochemical, or equivalent behavioral descriptions of batteries. Equivalent-circuit, electrochemical, electrothermal, and state-observer models are commonly used to predict the terminal voltage, internal states, or key parameters of a healthy battery, after which deviations between the measured and predicted responses are treated as fault indicators. Jia et al. [20] incorporated MSC-related states, hysteresis states, and voltage and surface-temperature observations into an extended Kalman filter (EKF) to achieve online ISC state estimation with low computational cost. Ma et al. [21] used a simplified pseudo-two-dimensional electrochemical model to identify the apparent diffusion coefficient and showed that this parameter remains sensitive to MSCs during battery aging. Hou et al. [22] further analyzed model-parameter responses to lithium-plating-induced ISC under different operating conditions, demonstrating that model parameters can enhance early fault observability. Zhang et al. [23] reduced estimation errors in the low-SOC range and the influence of short-circuit current using a health-difference feedback model and fuzzy Kalman filtering. Model-based methods provide clear physical interpretation by representing MSC as an abnormal input, leakage branch, or state deviation that is not captured by a healthy model. Their performance, however, depends on model structure, parameter-identification accuracy, assumptions regarding the fault branch, and the selected state variables; transfer across battery types, aging stages, and dynamic duty cycles still entails substantial calibration effort.
Data-driven methods use machine learning or deep learning models to learn nonlinear differences among multi-source signals. Jia and Xu [24] developed a convolutional neural network to estimate short-circuit resistance from short sequences of voltage, current, capacity, and energy. Qiao et al. [25] partitioned local voltage curves from incremental-capacity data and combined dynamic-time-warping features with gradient-boosted decision trees to detect and locate faulty cells in series-connected battery packs. Cai et al. [26] generated virtual features using a mechanism model and trained a Vision Transformer to alleviate the scarcity of real fault samples and label uncertainty. Although data-driven methods can represent complex nonlinear patterns and fuse multidimensional features, their reliability depends strongly on training-sample coverage, fault-label quality, and the rigor of cross-condition validation. When real fault samples are scarce, triggering mechanisms differ, or the distributions of aging and operating conditions are imbalanced, models may learn experimental conditions or sample-distribution differences rather than stable fault signatures. In addition, complex deep networks and long-sequence models usually require considerable computation and memory, and their deployment in resource-constrained, real-time airborne battery management systems (BMSs) should be evaluated cautiously.
Overall, existing MSC diagnostic approaches offer complementary advantages; however, it remains challenging to simultaneously achieve early sensitivity, physical interpretability, robustness under highly dynamic loads, and online feasibility. Signal-processing methods can be sensitive to operating conditions and threshold settings [16,17,18,19], model-based methods depend on model structure and parameter accuracy [20,21,22,23], and data-driven methods require sufficient sample coverage and cross-condition validation [24,25,26]. Existing UKF-based MSC methods generally use voltage residuals directly as diagnostic indicators, making weak fault signatures difficult to distinguish from voltage deviations caused by rapid load variations and battery aging. To address these limitations, this study develops a mechanism-guided, aging-aware diagnostic framework that transforms healthy-reference voltage residuals into a compact multidomain feature representation for weak MSC diagnosis under high-rate UAM conditions.
The main contributions of this study are as follows:
- (1)
- A mechanism-guided residual representation is developed for MSC diagnosis under high-rate dynamic operation. A healthy model and an unscented Kalman filter are employed to construct the normal voltage response under actual operating currents. The resulting voltage residual suppresses load-induced and polarization-related variations and provides a sensitive representation of weak MSC signatures.
- (2)
- Multidomain residual characterization and feature selection are developed for MSC diagnosis. The voltage residual is characterized using complementary electrochemical, time-domain statistical, and multiscale wavelet features. Recursive feature elimination is then applied to remove redundant information and obtain a compact feature subset with a favorable balance between diagnostic performance and computational complexity.
- (3)
- An aging-aware MSC diagnostic framework is established for high-rate UAM conditions. Battery aging is explicitly introduced as a confounding state, enabling the selected multidomain features to distinguish among healthy, aged, and early stage MSC conditions. The framework is further evaluated under different C-rates and with independent cross-battery MSC data to examine its robustness and generalization capability.
2. Methodology
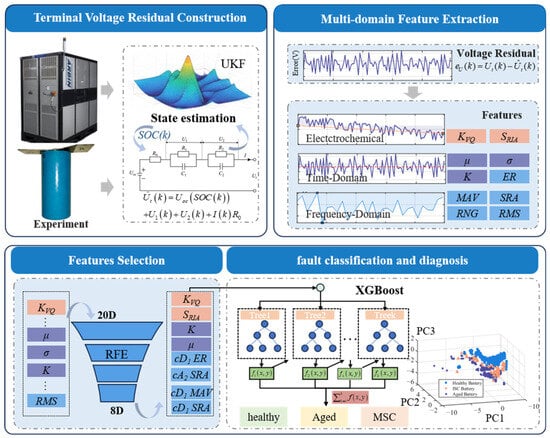
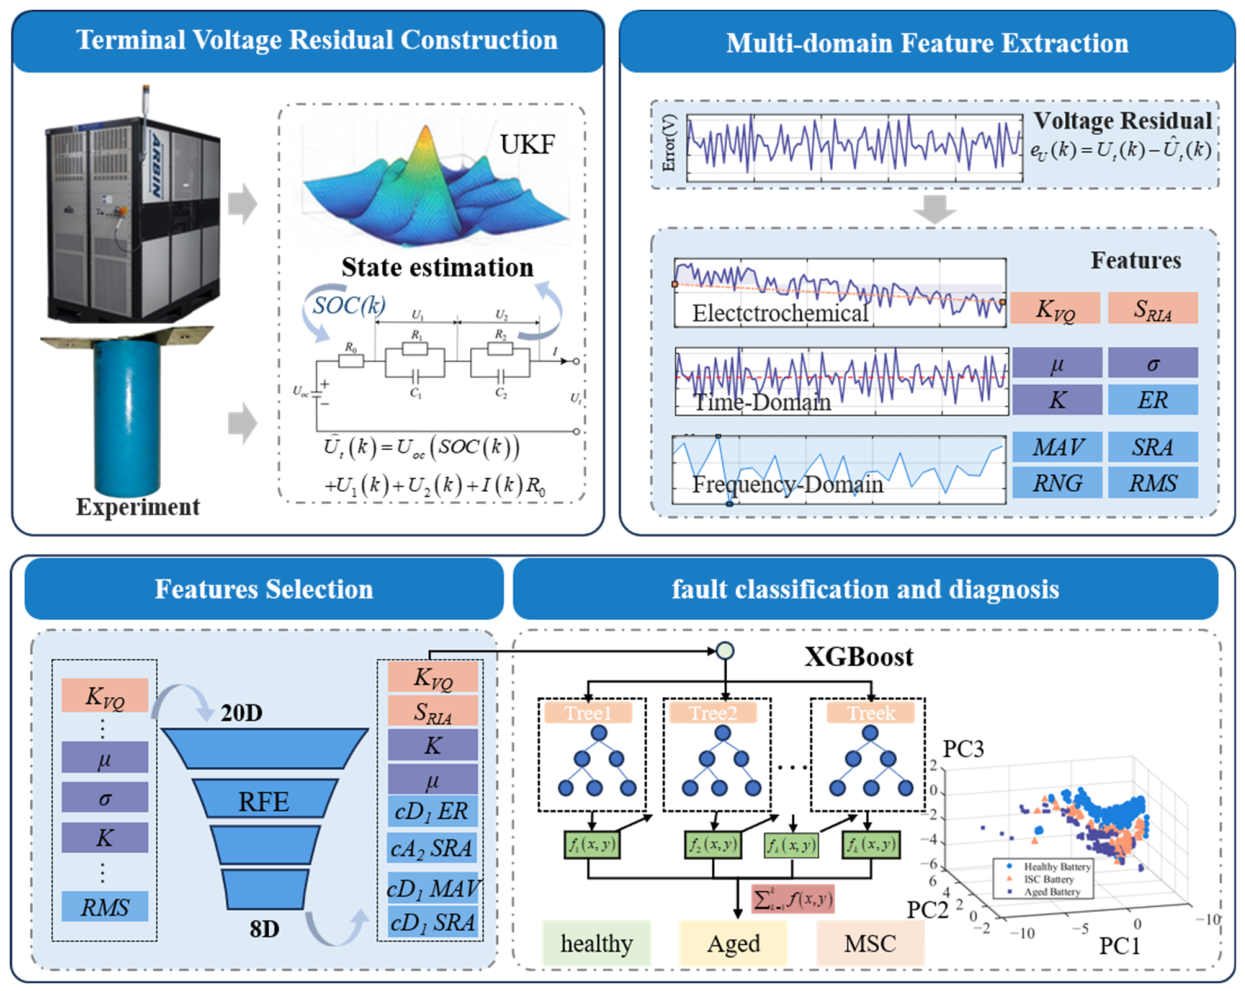
A model–data fusion framework is proposed for early MSC diagnosis of lithium-ion batteries, as illustrated in Figure 1. The measured terminal voltage and current are used as the framework inputs. First, a state observer combining a healthy second-order RC equivalent-circuit model with an unscented Kalman filter (UKF) is established to estimate the terminal voltage online.
Figure 1.
Overall framework of the proposed MSC diagnosis method. Arrows indicate the information flow, colors distinguish different feature categories, and the ellipsis denotes omitted features for compact presentation.
The voltage residual is then calculated as the difference between the measured and estimated terminal voltages, thereby isolating the voltage response that cannot be explained by the healthy battery model. Subsequently, features describing voltage evolution, residual statistical characteristics, and multiscale wavelet-domain characteristics are extracted to construct an initial 20-dimensional feature space. Recursive feature elimination (RFE) is then employed to remove redundant and operating-condition-sensitive features and to retain the most discriminative feature subset. Finally, the selected features are fed into an XGBoost classifier to distinguish healthy, aged, and early MSC states.
2.1. Construction of Terminal-Voltage Residuals
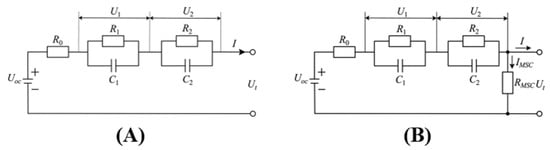
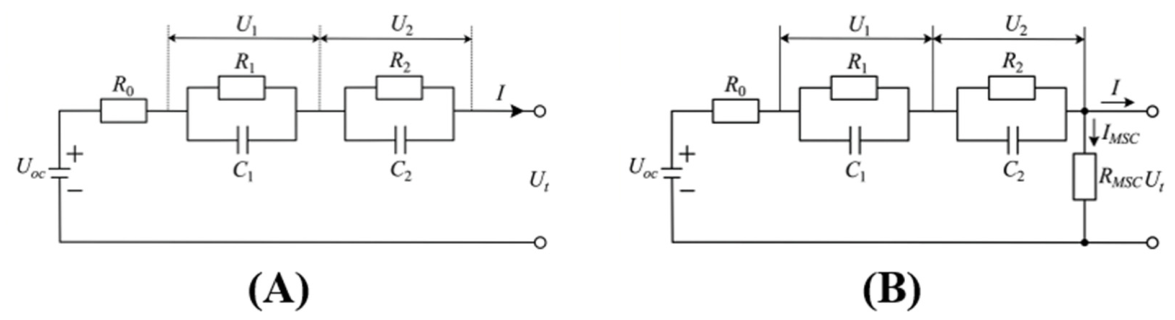
To balance dynamic representation and computational complexity, a second-order RC equivalent-circuit model (ECM) is adopted as the healthy-cell reference model, as shown in Figure 2A. Similar ECM structures have been widely used for lithium-ion battery modeling, parameter identification, and state estimation [27,28]. The model consists of an open-circuit voltage source Uoc, an ohmic resistance R0, and two RC polarization branches (R1, C1) and (R2, C2). The first and second RC branches represent relatively fast and slow polarization dynamics, respectively.
Figure 2.
Second-order RC equivalent-circuit representations: (A) healthy-reference ECM; (B) MSC equivalent model.
In this study, the measured-current convention defines charging current as positive and discharging current as negative. The predicted terminal voltage of the healthy-reference model is expressed as follows:
where I(k) is the measured terminal current, and U1(k) and U2(k) are the polarization voltages. For a sampling interval Δt, the two polarization states are updated as [27,28]
and the SOC is updated by ampere–hour integration as follows:
where Qn is the nominal capacity in Ah and η is the coulombic efficiency. Because I(k) < 0 during discharge under the adopted sign convention, Equation (3) produces the expected decrease in SOC.
The OCV–SOC relationship and the ECM parameters were experimentally characterized at room temperature before fault diagnosis. The OCV–SOC relationship was obtained from an OCV–SOC characterization test and fitted using an eighth-order polynomial:
For ECM parameterization, HPPC pulse tests were conducted at SOC levels from 100% to 0% at room temperature. At each SOC level, R0, R1, C1, R2, and C2 were identified from the corresponding current–voltage pulse response, following established ECM parameter-identification procedures [27,28]. The parameters identified at the different SOC levels were subsequently averaged to obtain a fixed healthy-reference parameter set. The resulting ECM parameters and OCV–SOC polynomial coefficients are summarized in Table 1.
Table 1.
Parameters of the healthy-reference ECM, OCV–SOC model, and UKF settings.
The same healthy-reference ECM and OCV–SOC relationship was used to generate the reference voltage for all diagnostic samples. In particular, the aged samples were not re-parameterized using an aging-specific ECM. This preserves aging-induced model mismatch in the voltage residual, allowing aging to be explicitly treated as a confounding condition in the subsequent MSC diagnosis.
To represent an MSC, an equivalent leakage resistance, RMSC, is introduced across the cell terminals, as illustrated in Figure 2B. The leakage-current magnitude is therefore determined by the terminal voltage as
where Ut(k) denotes the actual terminal voltage. Because IMSC represents an internal discharge current, the effective current governing the cell-state evolution becomes
under the adopted positive-charge/negative-discharge convention. Consequently, an MSC causes additional self-discharge and gradually alters the SOC and polarization trajectories. For an early MSC, however, the leakage current is much smaller than the high-rate external current of an eVTOL battery. Its instantaneous voltage effect can therefore be masked by the dominant ohmic and polarization responses. The persistent leakage nevertheless produces an accumulating deviation from the healthy-reference trajectory, motivating the use of model residuals rather than direct terminal-voltage deviations for early MSC diagnosis.
A UKF is therefore employed to estimate the healthy-reference battery states online. The state vector, model input, and measurement are defined as
and the nonlinear state-space model is written in compact form:
where wk and vk denote the process and measurement noise, respectively. Because of the nonlinear OCV–SOC relationship, the UKF propagates the state statistics through the nonlinear model using the unscented transformation. The standard sigma-point generation, time-update, and measurement-update procedures follow the established UKF formulation [29] and its application to battery-state estimation [30] and are therefore not repeated here.
To avoid confusion with the ECM resistances, the process- and measurement-noise covariances are denoted QUKF and RUKF, respectively. Both were fixed throughout all UKF runs rather than updated adaptively. The adopted values were QUKF = diag(2.721 × 10⁻⁹, 1.24 × 10⁻¹⁰, 9.02441443 × 10⁻⁴) for the state vector [SOC, U1, U2]T and RUKF = 3.9285982 × 10⁻⁵ for terminal-voltage measurement noise. These covariance values were obtained in a prior Bayesian-optimization step and were then kept unchanged for healthy, aged, and MSC samples. The unscented-transform scaling parameters were fixed at α = 1 × 10⁻³, β = 2, and κ = 0. The adopted UKF settings are also summarized in Table 1.
At each sampling instant, the UKF provides the predicted terminal voltage using the healthy-reference model. The terminal-voltage residual used in this study is defined as follows:
For a healthy battery, eU(k) mainly reflects measurement noise, parameter uncertainty, and unmodeled dynamics and generally remains within a limited range. For an MSC battery, the healthy-reference model does not account for the persistent internal leakage current. The resulting structural mismatch progressively alters the estimated SOC and polarization states, producing a systematic change in the voltage residual.
Under high-rate eVTOL operation, stronger ohmic and polarization responses can also increase normal model mismatch. Therefore, the effect of the discharge rate on the MSC residual must be examined before using the residual for fault-feature construction.
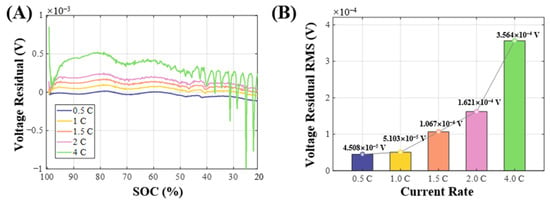
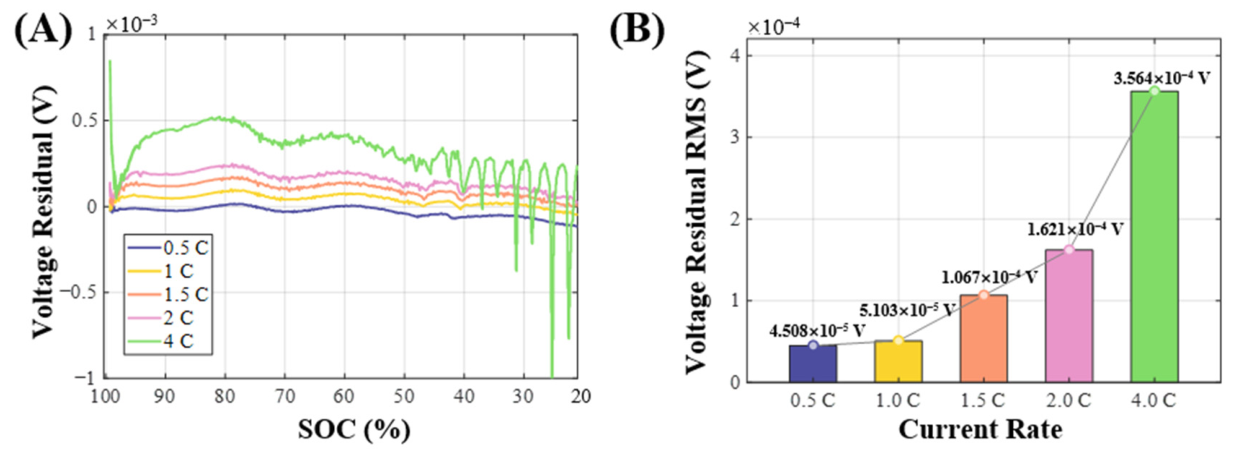
To investigate this effect, the terminal-voltage residuals were analyzed under different discharge rates. An equivalent short-circuit resistance of 6 Ω was selected as a representative MSC condition. Under the same short-circuit resistance, the battery was discharged at constant rates of 0.5 C, 1 C, 1.5 C, 2 C, and 4 C, respectively, from 100% SOC to the cutoff voltage. The measured current and voltage profiles at each discharge rate were then inputted into the established UKF observer. The residual between the predicted and measured terminal voltages was calculated to evaluate how the discharge rate affected the residual characteristics under the same MSC condition.
To quantify the variation in model-prediction error across discharge rates, the root mean square (RMS) of the terminal-voltage residual was used as the evaluation metric, defined as follows:
where N is the total number of sampling points during discharge. Here, RMS quantifies the overall magnitude of the terminal-voltage residual over the discharge process and is used only to compare the influence of the discharge rate under the same MSC condition. It is not employed as a threshold for judging model validity or for direct MSC detection. Because the residual has already been defined in Equation (9) as the difference between the measured and predicted terminal voltages, its RMS is equivalent to the conventional RMSE; therefore, an additional RMSE calculation is redundant.
Figure 3 shows the terminal-voltage residuals at different discharge rates. Figure 3A presents the dynamic evolution of residuals with SOC, and Figure 3B presents the corresponding RMS residuals. At the same external-short-circuit severity, all discharge rates show similar residual evolution; however, the overall residual magnitude increases progressively with the discharge rate. As the rate increases from 0.5 C to 4 C, the residual RMS rises from 4.508 × 10⁻⁵ V to 3.564 × 10⁻⁴ V, an increase of approximately 7.9 times. This result demonstrates a pronounced sensitivity of model-prediction error to the discharge rate.
Figure 3.
Sensitivity of terminal-voltage residuals to discharge rate under a 6-ohm external-short-circuit resistance: (A) residual trajectories versus SOC at different discharge rates; (B) RMS residuals as a function of discharge rate.
Under the same equivalent short-circuit resistance, the MSC leakage current remains approximately constant because the terminal voltage varies within a relatively limited range. As the discharge rate increases, however, the ohmic voltage drop and polarization responses become substantially stronger, resulting in larger load-induced fluctuations and model mismatch in the terminal-voltage residual. Consequently, although the MSC-related component remains present in the residual, its relative contribution decreases and may be masked by the dominant high-rate polarization response. Therefore, the UKF-generated voltage residual contains useful fault information but cannot be used directly as a reliable diagnostic indicator under high-rate operating conditions. To enhance the weak MSC signatures, voltage-evolution features, residual statistical features, and multiscale wavelet features are further extracted to construct a discriminative feature space for MSC classification.
2.2. Construction of Voltage-Evolution and Residual Features
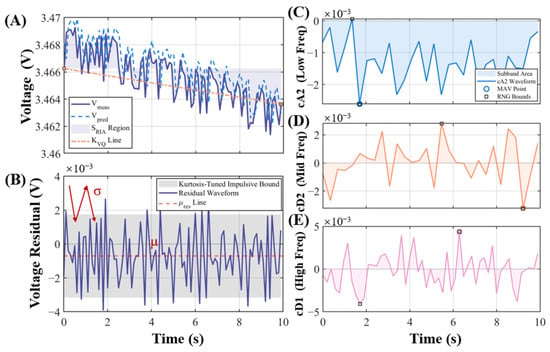
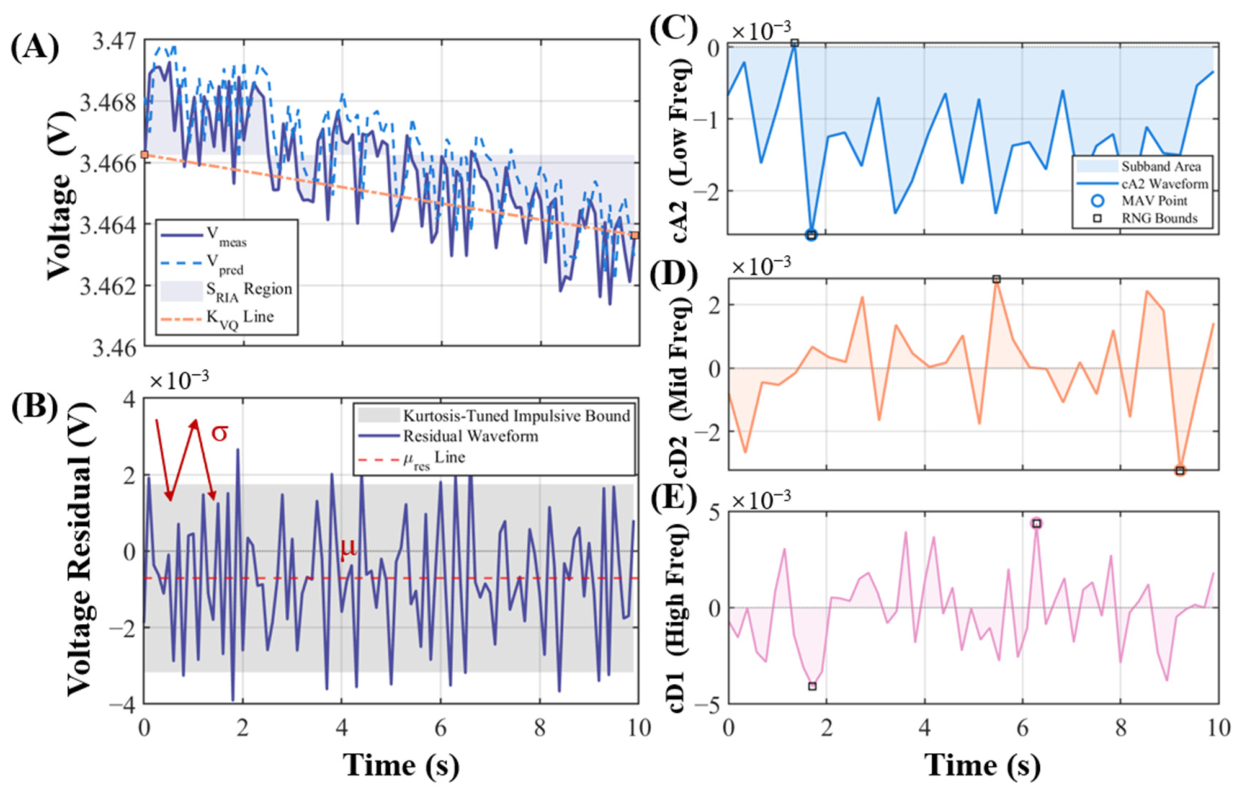
To characterize weak MSC signatures that are not sufficiently distinguishable in the raw terminal-voltage residual, the voltage and residual sequences are converted into a 20-dimensional multidomain feature representation. The representation combines electrochemical evolution, time-domain residual statistics, and multiscale wavelet information. Because SOC and polarization vary continuously during eVTOL operation, features are extracted from fixed sliding windows rather than from complete discharge cycles. A 60 s window with a 15 s step is used; at the 10 Hz sampling frequency, each window contains 600 samples. Figure 4 displays only a representative 10 s segment for waveform visualization, whereas all diagnostic features are calculated from the complete 60 s windows.
Figure 4.
Schematic of mechanism-informed multidomain feature extraction: (A) deviation between measured and predicted voltages within a sliding window; (B) terminal-voltage residuals and time-domain features; (C–E) wavelet multiband features. The red arrows and dashed red line in (B) indicate σ and μ, respectively. The blue, orange, and pink curves in (C–E) represent the cA2, cD2, and cD1 wavelet components, respectively; the marker definitions shown in (C) also apply to (D,E).
Aging and MSC produce different residual characteristics. Aging is mainly associated with the loss of lithium inventory (LLI) and loss of active material (LAM), which increase internal resistance, reduce available capacity, and intensify polarization. When the healthy-reference ECM is retained in the UKF, these changes mainly appear as a slowly varying residual bias and drift. In contrast, an MSC introduces a localized conductive path. Leakage-current fluctuations and local changes in the conductive path can produce transient voltage drops, spikes, and nonstationary residual fluctuations. A single statistical indicator is therefore insufficient to represent both aging-related drift and MSC-related transients, motivating the use of complementary features from different physical domains.
Two electrochemical features are first extracted from each window: the voltage–capacity slope (KVQ) and residual integrated area (SRIA). KVQ quantifies the voltage-change rate per unit of discharged capacity. Aging-related capacity loss and increased polarization cause a larger voltage drop for the same discharged capacity, while local MSC leakage can also perturb this slope. SRIA characterizes the accumulated voltage deviation within the window and is sensitive to increased polarization and additional energy dissipation. Together, KVQ and SRIA describe changes in the battery energy-release process at the window scale.
Three time-domain statistics are then calculated from the residual: the mean, standard deviation, and kurtosis. The mean reflects systematic model bias and is sensitive to the slow residual shift associated with aging. Standard deviation measures fluctuation intensity and increases when repeated MSC-related voltage disturbances occur. Kurtosis emphasizes impulsive high-amplitude events and therefore complements the mean and standard deviation in describing transient MSC behavior.
To separate slow residual drift from faster fault-related fluctuations, a two-level discrete wavelet transform (DWT) with the Daubechies-4 (db4) basis are applied to each residual window [31]. With a sampling frequency of 10 Hz, the Nyquist frequency is 5 Hz. Under the two-level dyadic decomposition, the nominal frequency ranges are 0–1.25 Hz for cA2, 1.25–2.5 Hz for cD2, and 2.5–5 Hz for cD1. Because the db4 analysis filters have finite transition bands, these intervals are interpreted as nominal rather than as ideal brick-wall frequency bands. The cA2 component mainly retains slowly varying trends and long-term model drift, while cD2 captures intermediate-frequency oscillations associated with intermittent leakage and dynamic recovery. The cD1 component emphasizes rapid fluctuations and transient spikes. This decomposition provides a direct multiscale description of the residual behavior relevant to aging and early MSC.
Five descriptive statistics are extracted from each of the three wavelet sub-bands: the energy ratio (ER), maximum absolute value (MAV), square-root amplitude (SRA), range (RNG), and root mean square (RMS). This yields 15 wavelet features. Combined with the two electrochemical features and three time-domain statistics, the complete feature vector contains 20 dimensions. The definitions and physical interpretations of all features are summarized in Table 2.
Table 2.
Definitions and physical interpretations of the extracted multidomain features.
Compared with direct discrimination using the raw terminal-voltage residual, the multidomain representation characterizes aging and MSC from electrochemical, statistical, and frequency-domain perspectives. These complementary descriptors provide physically interpretable inputs for subsequent feature selection and XGBoost classification.
2.3. Feature Selection and Classification Using XGBoost
The preceding section constructed an initial 20-dimensional feature space comprising voltage-evolution features, residual statistical features, and multiscale wavelet features. To reduce feature redundancy and improve model generalization, recursive feature elimination (RFE) is performed using XGBoost as the base estimator [32]. Features are ranked according to their importance and progressively removed, and the optimal subset is determined by considering both diagnostic performance and computational efficiency. The selected features are then input into the XGBoost classifier for MSC diagnosis, with aged batteries included as a confounding condition to evaluate the robustness of the proposed method against aging-induced interference. For the input feature vector,
The XGBoost model can be expressed as follows:
where fk(.) represents the kth decision tree and K is the number of trees.
The optimization objective consists of the empirical loss and model complexity, and is expressed as follows:
where l(.) is the classification-loss function, Ω(fk) is the tree-structure regularization term that constrains model complexity, and N is the number of training samples.
The dataset was divided into training and internal test sets at a ratio of 7:3. To prevent information leakage caused by overlapping sliding-window samples, data from the same battery test were assigned exclusively to either the training set or the internal test set. The class proportions were maintained as consistently as possible during the split. Only the training set was used for feature selection, hyperparameter optimization, and model development, whereas the internal test set was reserved for within-population performance evaluation. Cross-battery generalization was evaluated separately using the physically independent MSC Cell 2, as described in Section 3 and Section 4.4. Although the initial 20 features have clear physical meanings, some may contain redundant or weakly discriminative information. Recursive feature elimination (RFE) is therefore performed using XGBoost as the base estimator. Starting with the complete feature set, the classifier is trained and the importance of each feature is evaluated according to its contribution to decision-tree split gain. The least important feature is then removed, and the classifier is retrained using the remaining features. This procedure is repeated until all features are ranked. Let the current feature set be as follows:
At each iteration, the feature with the lowest importance is selected:
where I(fi) denotes the XGBoost importance of the ith feature. The feature set is then updated, and the classifier is retrained until all features have been ranked.
The number of retained features was not predetermined. During RFE, the classifier was retrained and evaluated at each retained-feature dimension. The smallest feature subset reaching the performance plateau was selected, so that additional features were retained only when they provided a meaningful improvement in diagnostic performance. MSC recall and the false-alarm behavior of aged batteries were also considered during this process. This criterion balances diagnostic performance with feature dimensionality and computational efficiency. Compared with filter-based methods that rank features independently using statistical correlation, XGBoost-based RFE considers feature interactions and their actual contribution to the diagnostic model. The XGBoost hyperparameters were optimized using group-aware cross-validation on the training data. For the final eight-dimensional classifier, the number of boosting trees was set to 260, with a learning rate of 0.12699 and a maximum tree depth of 9. The minimum child weight was 9.521, and the minimum loss reduction required for further partitioning was set to γ = 0.16051. The row and column subsampling ratios were 0.95258 and 0.60730, respectively. The L1 and L2 regularization coefficients were set to 0.03932 and 0.64014, respectively. The computational implementation was performed in MATLAB R2023b, and the XGBoost classifier was implemented using Python 3.11.15 and XGBoost 3.2.0. A fixed random seed of 2,108,030,390 was adopted to improve computational reproducibility.
3. Experiments and Dataset Construction
To evaluate the proposed method for early MSC diagnosis under high-rate dynamic operating conditions, an experimental dataset comprising healthy, MSC, and aged battery samples was constructed. The test object was an R46N36D high-energy-density lithium-ion cell with a nickel–cobalt–manganese (NCM) cathode, a silicon–carbon (Si–C) anode, and a nominal capacity of 37.1 Ah. Owing to its high specific energy and rate capability, this cell represents a potential power source for eVTOL applications. For clarity, the two cells used in the MSC experiments are hereafter denoted as MSC Cell 1 and MSC Cell 2. MSC Cell 1 was used to construct the primary MSC dataset, whereas MSC Cell 2 was reserved for independent cross-battery validation. Accordingly, the present experimental validation is limited to this specific NCM cell system, and its applicability to other battery chemistries, cell formats, nominal capacities, and operating temperatures remains to be verified.
To generate controllable MSC samples, a high-precision needle-penetration platform was used to establish a weak internal conductive path inside the cell. A steel needle with a diameter of 3 mm was slowly driven into the cell using a high-precision stepper motor, and the terminal voltage and internal impedance were monitored in real time. Once weak internal conduction indicating initial local contact was detected, penetration was stopped immediately and the needle position was maintained. The needle was not withdrawn after penetration but remained fixed inside the cell throughout all subsequent UAM cycling and data acquisition, so that the weak internal conductive path persisted during the entire test. This procedure limited further mechanical damage and prevented continued enlargement of the short-circuit region. A stable internal conductive path with a small leakage current was thereby established without triggering thermal runaway, enabling controlled generation of early MSC conditions.
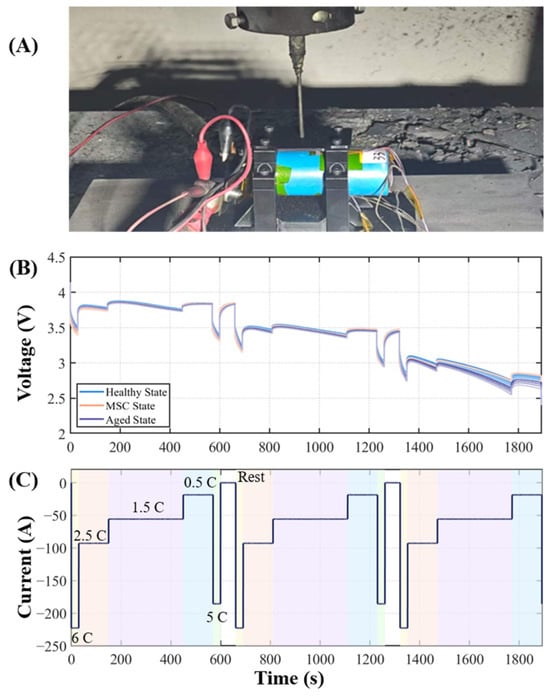
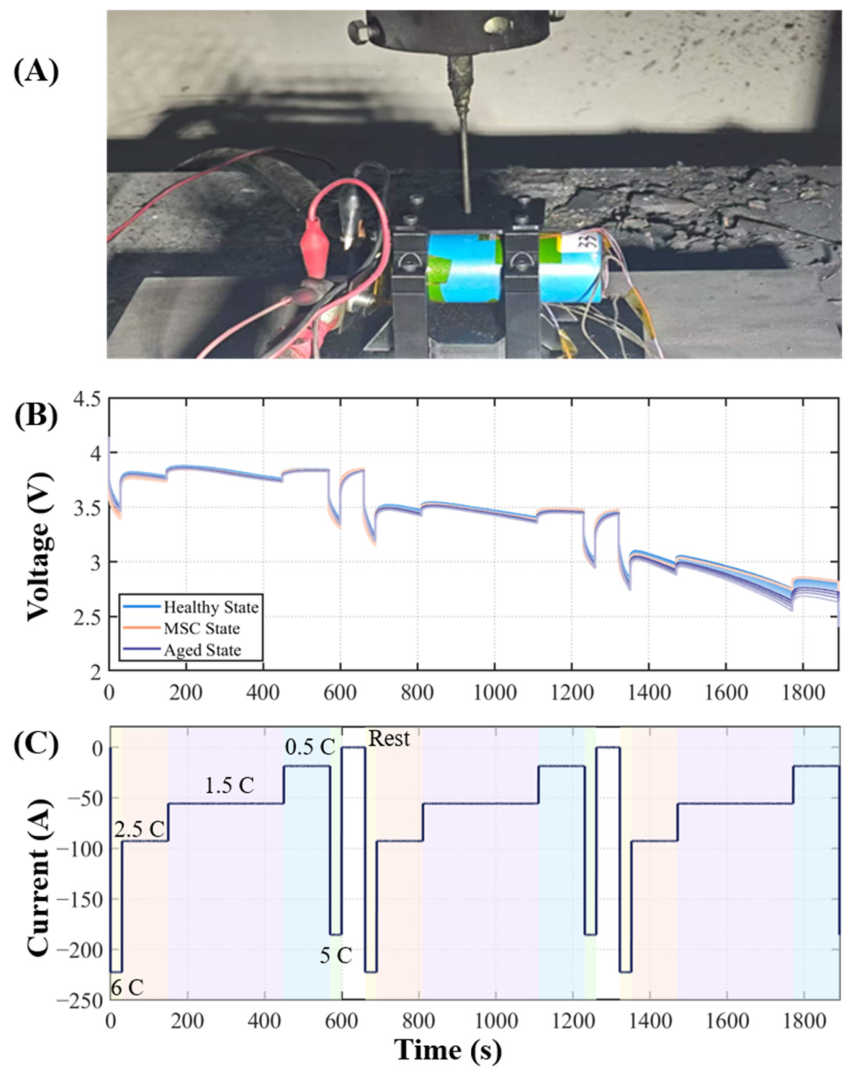
After MSC induction, six consecutive UAM dynamic cycles were applied to simulate the high-power operating conditions of eVTOL batteries. These six cycles were obtained from MSC Cell 1. MSC Cell 2 was subjected to the same needle-penetration procedure and UAM operating conditions as MSC Cell 1, and two additional UAM cycles were collected after MSC induction. The needle also remained fixed inside MSC Cell 2 throughout these two cycles. Figure 5 presents representative current and terminal-voltage profiles of the UAM discharge duty cycle. As shown in Figure 5B, the current exhibits continuous multilevel variations, including high-rate pulses of approximately 220 A and rapid transitions among different current plateaus. Correspondingly, the terminal voltage in Figure 5A exhibits repeated instantaneous drops, polarization recovery, and gradual decay. The eVTOL duty cycle induces stronger polarization and more rapid SOC evolution, causing voltage fluctuations and polarization-related model mismatch to increase substantially during high-rate operation. Consequently, the relative contribution of the MSC-related component to the terminal-voltage residual is weakened and may be obscured by the dominant dynamic response. The constructed dataset therefore provides a challenging experimental basis for evaluating whether the proposed method can identify weak MSC signatures under high-rate and aging-related interference.
Figure 5.
Experimental setup and response characteristics during UAM discharge duty-cycle testing: (A) photograph of the penetrated cell with the nail retained in place; (B) terminal-voltage response; (C) current excitation.
To evaluate the robustness of the proposed method against aging-induced interference, data from over-aged batteries were additionally included in the dataset. These samples exhibit pronounced capacity degradation and increased polarization, which may produce voltage characteristics like those caused by an MSCs and therefore increase the risk of false alarms. Terminal voltage and current were synchronously recorded at 10 Hz. The complete discharge stage of each cycle was segmented using a 60 s sliding window with a 15 s step for voltage-residual calculation and feature extraction. Following this procedure, 3804 samples were obtained, including 2206 healthy samples, 738 MSC samples, and 860 aged samples. The dataset was divided into 2663 training samples and 1141 test samples. The above 3804 samples constitute the primary dataset used for feature selection, model development, and the analyses presented in Section 4.1, Section 4.2 and Section 4.3. The data from MSC Cell 2 were excluded from this dataset and were not used for feature selection, model training, hyperparameter determination, or threshold calibration. Using the same 60 s window and 15 s step, the two UAM cycles of MSC Cell 2 yielded 246 additional MSC samples, which were retained exclusively for the independent cross-battery validation presented in Section 4.4.
4. Results and Analysis
4.1. Evaluation of Fault Diagnosis Performance
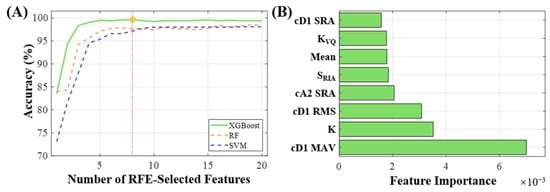
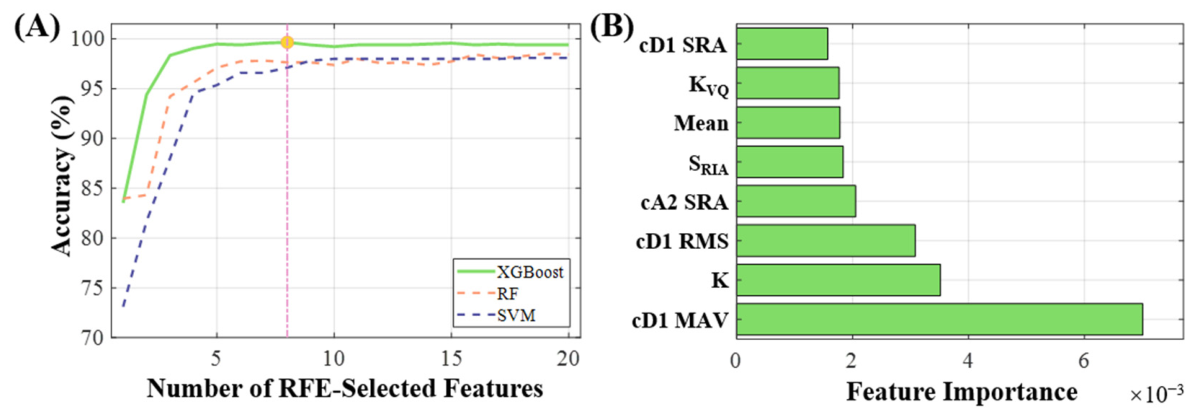
A 20-dimensional feature space was initially constructed by combining voltage-evolution, residual-statistical, and multiscale wavelet features. To determine an appropriate feature dimension, RFE was combined separately with XGBoost, RF, and SVM to progressively rank and eliminate features. Figure 6A shows the classification accuracy obtained with different numbers of retained features. For all three classifiers, the diagnostic performance improves rapidly as the feature dimension increases, indicating that the newly introduced features provide complementary fault information at the early stage of feature addition. For XGBoost, the classification accuracy increases rapidly as informative features are progressively retained and reaches 99.65% with eight features. Importantly, the number eight was not preset. As shown in Figure 6A, the seven-feature model is still located before the performance plateau, indicating that some complementary information has not yet been fully retained. In contrast, increasing the subset to ten or more features produces no evident improvement over the eight-feature model, indicating that the additional variables mainly introduce redundant information rather than an additional discriminative capability. Therefore, eight features represent the smallest subset that reaches the observed performance plateau and were selected as the optimal input for the subsequent MSC diagnostic model. Compared with RF and SVM, XGBoost achieves higher accuracy with fewer features, demonstrating its stronger ability to exploit the nonlinear relationships among the constructed features.
Figure 6.
Recursive feature elimination results: (A) classification accuracies of XGBoost, RF, and SVM with different numbers of selected features; (B) importance rankings of the optimal eight features selected by XGBoost. The vertical dashed line in (A) indicates the selected eight-feature subset.
Figure 6B presents the importance rankings of the eight retained features, including the cD1 root mean square (RMS), cD1 maximum absolute value (MAV), residual mean, residual kurtosis (K), residual integrated area (SRIA), voltage–capacity slope (KVQ), and the square-root amplitude (SRA) of cD1 and cA2. These features describe the voltage-evolution characteristics, residual distribution, and multiscale residual fluctuations from different perspectives. Their joint retention indicates that MSC signatures under high-rate discharge cannot be adequately represented by a single feature type. These complementary features jointly enhance the observability of weak MSC signatures that are otherwise masked by high-rate polarization and dynamic model mismatch.
To provide a more comprehensive evaluation beyond overall accuracy and confusion matrices, precision, recall, F1-score, Matthews correlation coefficient (MCC), Cohen’s Kappa, receiver operating characteristic area under the curve (ROC-AUC), and precision–recall area under the curve (PR-AUC) were further calculated. For the binary task, the MSC was treated as the positive class. For the three-class task, precision, recall, F1-score, ROC-AUC, and PR-AUC were calculated using a one-vs-rest strategy and macro-averaged across the healthy, MSC, and aged classes. Because adjacent 60 s samples have a 75% overlap, the corresponding confidence intervals were estimated using cycle-cluster bootstrap resampling, in which complete discharge cycles rather than individual overlapping windows were treated as the resampling units.
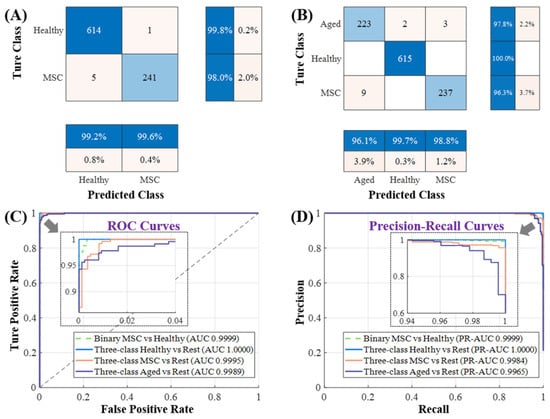
The evaluation results are shown in Figure 7 and Table 3. For the binary diagnostic task involving the healthy and MSC states, the model achieved an overall accuracy of 99.3%, with only a small number of MSC samples being misclassified as healthy. Specifically, only one healthy window was falsely identified as an MSC, whereas five MSC windows were missed, corresponding to an MSC recall of 97.97%, a specificity of 99.84%, a precision of 99.59%, and an F1-score of 98.77%. The MCC and Cohen’s Kappa were 0.9829 and 0.9828, respectively, indicating a high level of agreement between the predicted and true classes. The ROC-AUC and PR-AUC reached 0.9999 and 0.9999, respectively, further demonstrating strong healthy/MSC discrimination over a broad range of decision thresholds. The cycle-cluster bootstrap yielded a 95% confidence interval of 98.61–100.00% for the overall accuracy and 95.94–100.00% for the MSC recall. This indicates that the constructed residual-fusion features can effectively capture the anomalous responses induced by early stage MSCs.
Figure 7.
Diagnostic results of the proposed method: (A) confusion matrix for healthy/MSC binary classification; (B) confusion matrix for healthy/MSC/aged three-class classification; (C) ROC curves for the binary MSC-vs-healthy task and the three one-vs-rest classes in the three-class task; and (D) corresponding precision–recall curves.
Table 3.
Comprehensive diagnostic performance of the proposed method for binary and three-class classification tasks.
When the effect of aging was further considered, the three-state diagnostic accuracy remained at 98.71%, with class-wise recalls of 100.00%, 96.34%, and 97.81% for the healthy, MSC, and aged states, respectively. The corresponding macro-Precision, macro-Recall, and macro-F1-scores were 98.18%, 98.05%, and 98.11%, respectively. The multiclass MCC and Cohen’s Kappa reached 0.9781 and 0.9780, while the macro ROC-AUC and macro PR-AUC scores were 0.9995 and 0.9983, respectively. The 95% confidence intervals obtained by cycle-cluster bootstrapping were 98.36–99.07% for the overall accuracy and 97.59–98.64% for the macro-F1-score. Compared with the binary task, the MSC recall decreased slightly from 97.97% to 96.34%, confirming that the electrochemical degradation features induced by aging interfere with MSC diagnosis to some extent. Nevertheless, because the constructed feature space integrates high-frequency dynamic responses, low-frequency degradation trends, and electrochemical-state information, the model can effectively distinguish slow performance degradation caused by aging from local anomalous perturbations induced by MSCs. These results demonstrate that the proposed method can accurately identify early stage MSCs and is robust against aging interference, thereby enhancing the reliability of fault identification under complex operating conditions.
4.2. Contribution Analysis of the Optimal Feature Subset
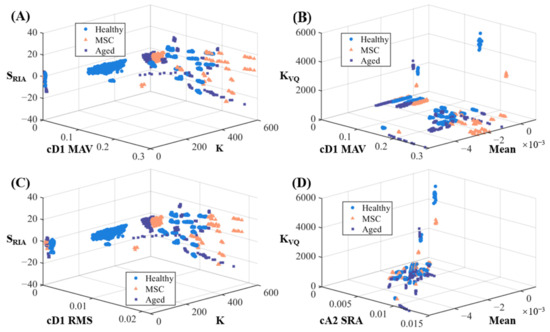
To further explain why the eight-dimensional feature space enables high-accuracy classification, different triplets of the eight features were visualized in three-dimensional space based on their importance ranking in Figure 6 and their respective feature categories. As shown in Figure 8, none of the four combinations—cD1 MAV–K–SRIA, cD1 MAV–Mean–KVQ, cD1 RMS–K–SRIA, and cA2 SRA–Mean–KVQ—yields completely independent clusters for the three states; some overlap remains between classes. This result indicates that any three features capture only partial information about the fault mechanisms and cannot fully describe the complex nonlinear relationships among healthy, aged, and MSC states, thus precluding complete separation in a low-dimensional space. In contrast, the eight-dimensional fusion feature space constructed in this study integrates information from different frequency bands, electrochemical-state information, and statistical features to describe fault evolution across multiple physical dimensions. This integration improves the separability of samples that overlap in low-dimensional spaces and enables XGBoost to establish more accurate and stable classification boundaries. These findings further indicate that high-dimensional, multidomain fusion features, rather than a single feature type, are essential for accurate MSC diagnosis under complex operating conditions.
Figure 8.
Distribution of battery-state clusters in three-dimensional spaces defined by different feature combinations: (A) cD1 MAV–K–SRIA; (B) cD1 MAV–Mean–KVQ; (C) cD1 RMS–K–SRIA; and (D) cA2 SRA–Mean–KVQ.
4.3. Diagnostic Applicability Under Different C-Rates
To assess the applicability of the proposed diagnostic method under different operating loads, this section examines the influence of the discharge C-rate on early MSC diagnostic performance. In practical operation, UAM power batteries undergo frequent high-power charge–discharge transitions, and their internal polarization levels and terminal-voltage responses differ markedly across C-rates. In particular, at high C-rates, intensified ohmic and concentration polarization can cause weak MSC-induced voltage anomalies to be more readily masked by normal operating fluctuations, thereby increasing the difficulty of fault identification. It is therefore necessary to validate the diagnostic stability and robustness of the proposed method against operating-condition interference across different C-rates.
The primary dataset was re-partitioned according to the discharge C-rate: data from the 0.5 C and 1.5 C conditions were assigned to the low-C-rate dataset, whereas data from the 2.5 C, 5 C, and 6 C conditions were assigned to the high-C-rate dataset. The sample composition of each C-rate-specific dataset is listed in Table 4. Because this section considers only sliding-window samples from constant-current discharge stages and excludes rest-stage data, the total number of samples at each C-rate differs slightly from that of the complete dataset reported in Section 3. Unlike the preceding analysis, which treated healthy, aged, and MSC samples as independent classes, the present section combines healthy and aged samples into a normal class and treats the MSC as the fault class in a binary diagnostic task. This labeling strategy better reflects practical engineering conditions, in which normally operating batteries can exhibit different levels of aging while the central task of the diagnostic system is to distinguish normal operation from MSC faults. Including aged samples in the normal class not only provides a more realistic operating environment but also tests whether the model can maintain stable MSC identification when apparently normal samples exhibit aging-related performance degradation.
Table 4.
Distribution of the fault diagnosis dataset across C-rate conditions.
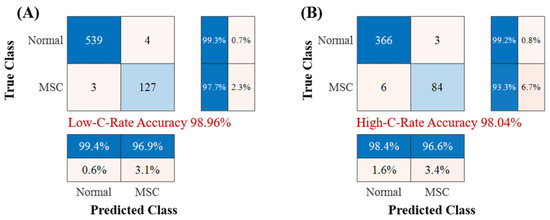
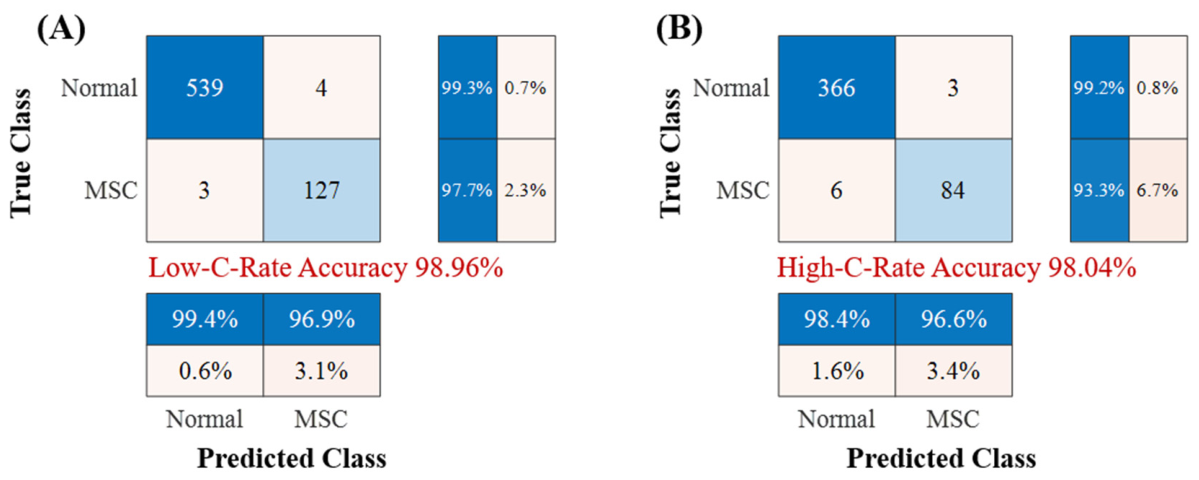
Based on these two C-rate-specific datasets, XGBoost diagnostic models were trained using the optimal eight-feature subset selected in Section 4.1, and the resulting confusion matrices are shown in Figure 9. The model maintained high diagnostic performance under both low- and high-C-rate conditions. At the low C-rate, 539 normal samples were correctly identified and only four were misclassified as MSCs, yielding a normal-class recall of 99.3%. Of the MSC samples, 127 were correctly identified and three were misclassified as normal, yielding an MSC recall of 97.7% and an overall classification accuracy of 98.96%. At the high C-rate, the normal-class and MSC recalls were 99.2% and 93.3%, respectively, and the overall classification accuracy was 98.04%. These results demonstrate that the model can effectively distinguish the normal class, including aged samples, from MSC faults under both C-rate conditions, although a moderate decrease in MSC sensitivity was observed at the high C-rate.
Figure 9.
Confusion matrices for the binary classification of normal and MSC samples under different C-rate conditions: (A) low C-rate; (B) high C-rate.
A comparison of the two C-rate conditions shows that MSC recall decreased from 97.7% to 93.3% at the high C-rate, while the missed-diagnosis rate increased from 2.3% to 6.7%. This result suggests that MSC diagnosis becomes more challenging under the examined high-C-rate operating conditions. This behavior is consistent with the intensified ohmic, charge-transfer, and concentration polarization under high-rate discharge, which increase terminal-voltage fluctuations and model mismatch and can partially mask weak MSC-induced anomalies. Nevertheless, the overall classification accuracy remained above 98% even at the high C-rate, indicating that the proposed multidomain feature representation retains good adaptability to C-rate variation.
Overall, the proposed method retains effective MSC discrimination across the examined C-rate conditions. Rather than directly classifying raw terminal-voltage signals, the framework first constructs model-based voltage residuals and then integrates electrochemical, statistical, and multiscale information to enhance MSC-related deviations while suppressing load-dependent polarization effects. Consequently, although high-rate operation causes a moderate reduction in MSC recall, the model maintains high overall diagnostic accuracy in the presence of both C-rate variation and aging-related interference.
4.4. Cross-Battery Validation, Benchmark Comparison, and Online Deployment Feasibility
To further evaluate the generalization capability of the proposed method, an independent cross-battery validation was conducted using MSC Cell 2, which was subjected to the same needle-penetration procedure and UAM operating conditions as MSC Cell 1 but was completely excluded from feature selection, model training, hyperparameter determination, and threshold calibration. This design, therefore, evaluates the transferability of MSC-related diagnostic signatures from MSC Cell 1 to the physically independent MSC Cell 2, rather than merely testing additional cycles from the same cell. Two representative anomaly detection frameworks were additionally implemented for comparison. Isolation Forest (IF) represents an unsupervised isolation-based diagnostic paradigm that has been applied to lithium-ion battery fault detection in combination with correlation, signal decomposition, and multidomain feature extraction [33,34]. LSTM-AE represents a sequence-reconstruction-based anomaly detection paradigm, in which deviations from the learned healthy temporal pattern are identified through increased reconstruction errors [35,36,37]. The three methods were evaluated using the same independent cross-battery MSC test source, while retaining the temporal processing requirements appropriate to each framework.
The cross-battery diagnostic results are summarized in Table 5. The proposed method achieved an overall accuracy of 98.83% and an MSC recall of 99.59%, outperforming IF (91.54% accuracy and 94.83% MSC recall) and LSTM-AE (92.11% accuracy and 81.82% MSC recall). The proposed method also maintained an F1-score of 98.00% and an MCC of 0.9720, indicating a more balanced trade-off between MSC detection and false-alarm suppression. The cycle-cluster bootstrap 95% confidence interval of its accuracy was 96.89–99.88%. Although LSTM-AE obtained a slightly higher ROC-AUC (0.9933) than the proposed method (0.9906), its lower MSC recall indicates that the strong global ranking of anomaly scores did not translate into equally high sensitivity at the selected operating threshold. For safety-oriented MSC monitoring, where missed faults are particularly undesirable, the higher recall of the proposed method is therefore more relevant to practical fault detection.
Table 5.
Cross-battery diagnostic performance of different MSC diagnosis methods.
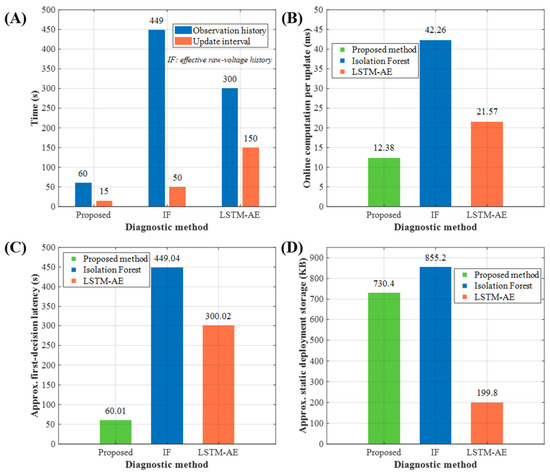
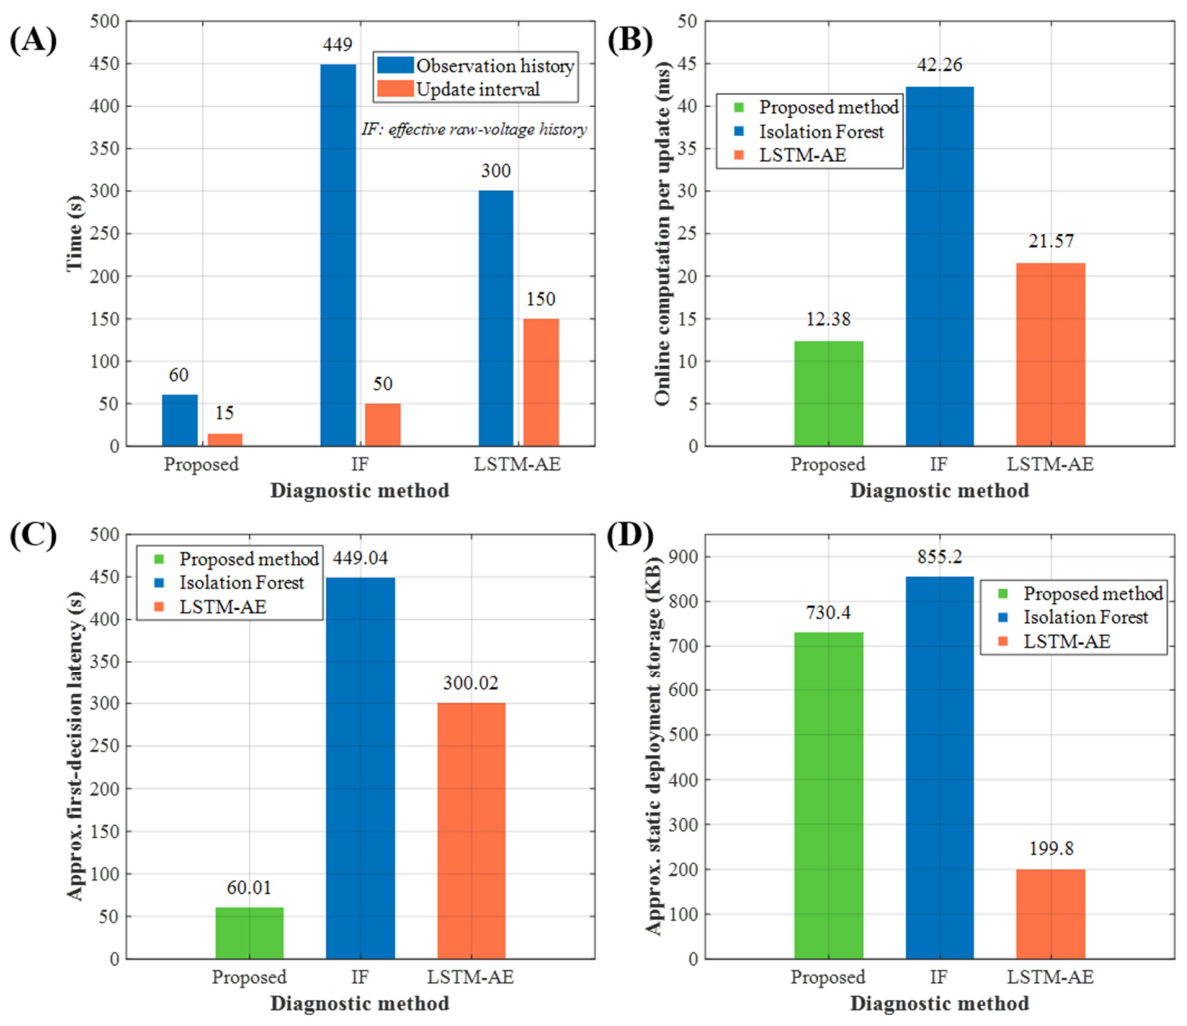
The performance differences are related to the diagnostic mechanisms of the three frameworks. IF identifies deviations from a learned healthy-reference distribution and is therefore sensitive not only to fault-induced changes but also to non-fault distribution shifts caused by battery-state evolution. LSTM-AE relies on temporal reconstruction errors and benefits from a relatively long sequence to accumulate weak deviations. In contrast, the proposed framework first suppresses the dominant healthy dynamic response through UKF-based voltage-residual construction and subsequently enhances MSC-related deviations using electrochemical, statistical, and multiscale features. Consequently, high MSC sensitivity can be obtained using a 60 s observation window with a 15 s update interval, compared with the 300/150 s configuration of LSTM-AE and the approximately 449 s effective raw-history requirement with a 50 s update interval for IF.
The computational and temporal characteristics of the three methods are compared in Figure 10 and Table 6. The proposed method required approximately 12.38 ms of online computation per diagnostic update, lower than LSTM-AE (21.57 ms) and IF (42.26 ms). For the proposed framework, this online computation comprised approximately 1.93 ms for UKF-based residual generation, 1.03 ms for multidomain feature extraction, and 9.42 ms for classifier inference per diagnostic update. More importantly, when the required observation history was included, the approximate first-decision latency was only 60.01 s, compared with 300.02 s for LSTM-AE and 449.04 s for IF. The proposed method can therefore provide an earlier initial diagnosis and subsequently refresh the diagnostic result every 15 s. Although its estimated static storage requirement (730.41 KB) was higher than that of LSTM-AE (199.81 KB), it remained below 1 MB, and its online computation occupied only approximately 0.083% of the available update interval on the test platform.
Figure 10.
Comparison of the computational burden and online deployment characteristics of the three MSC diagnostic methods: (A) observation-history requirement and diagnostic update interval; (B) online computation time per diagnostic update; (C) approximate first-decision latency considering both observation history and computation time; and (D) estimated static deployment storage. For the IF benchmark, the observation history denotes the effective raw-voltage history required after the preceding rolling-correlation operation.
Table 6.
Computational burden and online deployment characteristics of the three diagnostic methods.
Overall, the proposed method provides a favorable balance between cross-battery diagnostic performance and online response capability. Compared with the two representative anomaly detection benchmarks, it achieves higher MSC sensitivity and overall classification accuracy while requiring substantially less observation history and lower per-update computation times. These characteristics support its potential for real-time implementation in an onboard BMS. Nevertheless, the reported execution times were measured in MATLAB on a desktop computing platform and should be interpreted as relative computational comparisons; processor-specific execution time, fixed-point implementation, and memory utilization should be further verified on the target embedded BMS hardware.
5. Conclusions and Outlook
This study proposes a model–data fusion framework for early micro short-circuit (MSC) diagnosis of lithium-ion batteries under high-rate and highly dynamic eVTOL operating conditions. A healthy-reference terminal-voltage residual is constructed using a second-order equivalent-circuit model and UKF, followed by electrochemical, time-domain statistical, and multiscale wavelet feature extraction. Recursive feature elimination is then employed to obtain an eight-dimensional feature subset for XGBoost-based MSC diagnosis, with battery aging explicitly considered as a confounding condition. The proposed method demonstrates high diagnostic performance in the experimental dataset. For the healthy/MSC binary classification, the accuracy reached 99.30%, with an MSC recall of 97.97%, an F1-score of 98.77%, and an MCC of 0.9829. When aging was further included as an independent state, the three-class accuracy remained at 98.71%, with a macro-F1-score of 98.11% and an MCC of 0.9781, indicating that the multidomain residual features can distinguish MSC-related abnormalities from aging-induced deviations. Under different discharge-rate conditions, the overall accuracy was 98.96% at low C-rates and 98.04% at high C-rates, while MSC recall decreased moderately from 97.7% to 93.3%, showing that high-rate polarization increases diagnostic difficulty but does not eliminate effective MSC discrimination. Independent cross-battery validation using MSC Cell 2 further yielded an accuracy of 98.83%, an MSC recall of 99.59%, an F1-score of 98.00%, and an MCC of 0.9720, supporting cell-to-cell transferability within the investigated battery system. The proposed framework required approximately 12.38 ms of online computation per diagnostic update, with an approximate first-decision latency of 60.01 s and a 15 s update interval, indicating its potential for online BMS implementation. Nevertheless, the present validation is limited to a single NCM cell model from one manufacturer, and the cross-cell experiment evaluates transferability only among cells of the same chemistry and type. Further validation is therefore required to establish the applicability of the proposed framework across different chemistries, cell formats, capacities, manufacturers, production batches, and temperature ranges. In addition, the effects of practical uncertainties, including sensor noise, model parameter uncertainty, and SOC estimation errors, have not yet been systematically quantified. Future work will extend the validation to a broader range of cells and operating conditions, evaluate robustness against measurement and model uncertainties, and implement the complete diagnostic framework on embedded BMS hardware to further assess its real-time capability and engineering applicability.
Author Contributions
Conceptualization and Methodology: Z.C.; Software, Validation and Formal Analysis: P.S.; Data Curation: H.L.; Investigation (Experiments): M.J. Writing—original draft preparation: P.S. and H.L.; Writing—review and editing: Z.C. Supervision and project administration: Z.C. All authors have read and agreed to the published version of the manuscript.
Funding
This research was funded by the National Key Research and Development Program of China, grant number 2024YFB2505003.
Data Availability Statement
The experimental dataset, trained XGBoost model, and feature-extraction code supporting the findings of this study are available from the corresponding author upon reasonable request.
Conflicts of Interest
The authors declare no conflict of interest.
References
- Dixit, M. Balancing battery safety and performance for electric vertical takeoff and landing aircrafts. Device 2023, 1, 100172. [Google Scholar] [CrossRef] [Scilit]
- Dixit, M.; Bisht, A.; Essehli, R.; Amin, R.; Kweon, C.-B.M.; Belharouak, I. Lithium-ion battery power performance assessment for the climb step of an electric vertical takeoff and landing (eVTOL) application. ACS Energy Lett. 2024, 9, 934–940. [Google Scholar] [CrossRef] [Scilit] [PubMed]
- Goshtasbi, A.; Zhao, R.; Wang, R.; Han, S.; Ma, W.; Neubauer, J. Enhanced equivalent circuit model for high current discharge of lithium-ion batteries with application to electric vertical takeoff and landing aircraft. J. Power Sources 2024, 620, 235188. [Google Scholar] [CrossRef] [Scilit]
- Manfo, T.A.; Laaksonen, H. A comparative study of the modified high voltage olivine-phosphate LiMPO4 (M = Fe, Mn, Co, Ni) as promising cathode materials for next-generation rechargeable batteries. J. Energy Storage 2026, 160, 121797. [Google Scholar] [CrossRef] [Scilit]
- Liu, J.; Jin, X.; Zhang, H.; Zhao, K.; Wang, Z. Thermal runaway and combustion of LiFeO4 lithium-ion battery induced by electric-thermal coupling abuse. J. Energy Storage 2026, 141, 119271. [Google Scholar] [CrossRef] [Scilit]
- Liu, J.; Zhang, H.; Chun, E.; Jin, X.; Zhao, K.; Wang, Z. Combustion behavior and quantitative analysis of fire risk for lithium-ion batteries with different SOC. Appl. Therm. Eng. 2026, 288, 129613. [Google Scholar] [CrossRef] [Scilit]
- Liu, J.; Zhou, L.; Zhang, H.; Zhao, K.; Wang, Z. Aging and thermal behavior of lithium-ion battery under high charging current cycling. Therm. Sci. Eng. Prog. 2026, 69, 104466. [Google Scholar] [CrossRef] [Scilit]
- Liu, J.; Jin, X.; Guo, D.; Xiao, P.; Zhang, H.; Liu, J.; Wang, Z. Thermal runaway of 314 Ah lithium-ion battery under different external heating power and its prevention based on liquid thermal management. Appl. Therm. Eng. 2026, 303, 132307. [Google Scholar] [CrossRef] [Scilit]
- Zhang, G.; Wei, X.; Tang, X.; Zhu, J.; Chen, S.; Dai, H. Internal short circuit mechanisms, experimental approaches and detection methods of lithium-ion batteries for electric vehicles: A review. Renew. Sustain. Energy Rev. 2021, 141, 110790. [Google Scholar] [CrossRef] [Scilit]
- Huang, L.; Liu, L.; Lu, L.; Feng, X.; Han, X.; Li, W.; Zhang, M.; Li, D.; Liu, X.; Sauer, D.U.; et al. A review of the internal short circuit mechanism in lithium-ion batteries: Inducement, detection and prevention. Int. J. Energy Res. 2021, 45, 15797–15831. [Google Scholar] [CrossRef] [Scilit]
- Park, S.; Song, Y.; Kim, S.W. Simultaneous diagnosis of cell aging and internal short circuit faults in lithium-ion batteries using average leakage interval. Energy 2024, 290, 130220. [Google Scholar] [CrossRef] [Scilit]
- Chen, X.; Saeed, M.; Shen, J.; He, Y. Simultaneous quantitative detection of early internal short circuit and available capacity in lithium-ion batteries. Electrochim. Acta 2026, 570, 148924. [Google Scholar] [CrossRef] [Scilit]
- Shen, D.; Yang, D.; Lyu, C.; Hinds, G.; Wang, L.; Bai, M. Detection and quantitative diagnosis of micro-short-circuit faults in lithium-ion battery packs considering cell inconsistency. Green Energy Intell. Transp. 2023, 2, 100109. [Google Scholar] [CrossRef] [Scilit]
- Zhang, Z.; Sun, Y.; Zhang, L.; Cheng, H.; Cao, R.; Liu, X.; Yang, S. Enabling online search and fault inference for batteries based on knowledge graph. Batteries 2023, 9, 124. [Google Scholar] [CrossRef] [Scilit]
- Ji, T.; Li, J. A symmetric fault diagnosis method for power batteries based on digital battery passport and knowledge graph-fuzzy bayesian network. Symmetry 2026, 18, 857. [Google Scholar] [CrossRef] [Scilit]
- Sun, Z.; Wang, Z.; Chen, Y.; Liu, P.; Wang, S.; Zhang, Z.; Dorrell, D.G. Modified relative entropy-based lithium-ion battery pack online short-circuit detection for electric vehicle. IEEE Trans. Transp. Electrif. 2022, 8, 1710–1723. [Google Scholar] [CrossRef] [Scilit]
- Liu, Q.; Ma, J.; Zhao, X.; Zhang, K.; Meng, D.; Jiao, Z. Fault diagnosis of early internal short circuit for power battery systems based on the evolution of the cell charging voltage slope in variable voltage window. Appl. Energy 2024, 376, 124310. [Google Scholar] [CrossRef] [Scilit]
- Mao, Z.; Gu, X.; Li, J.; Liu, K.; Wang, T.; Shang, Y. An applicable minor short-circuit fault diagnosis method for automotive lithium-ion batteries based on extremum sample entropy. IEEE Trans. Power Electron. 2024, 39, 4636–4644. [Google Scholar] [CrossRef] [Scilit]
- Li, C.; Zeng, K.; Li, B.; Li, G.; Yang, H.; Li, S. Internal short-circuit fault diagnosis for batteries of energy storage stations based on multivariate multiscale sample entropy. IEEE Trans. Ind. Electron. 2025, 72, 2068–2077. [Google Scholar] [CrossRef] [Scilit]
- Jia, Y.; Brancato, L.; Giglio, M.; Cadini, F. Temperature enhanced early detection of internal short circuits in lithium-ion batteries using an extended Kalman filter. J. Power Sources 2024, 591, 233874. [Google Scholar] [CrossRef] [Scilit]
- Ma, R.; Deng, Y.; Wang, X. Simplified electrochemical model assisted detection of the early-stage internal short circuit through battery aging. J. Energy Storage 2023, 66, 107478. [Google Scholar] [CrossRef] [Scilit]
- Hou, L.; Dong, A.; Ma, R.; Lin, H.; Deng, Y. The sensitive detection of the early-stage internal short circuit triggered by lithium plating through the simplified electrochemical model at various working conditions. Energy 2024, 304, 132141. [Google Scholar] [CrossRef] [Scilit]
- Zhang, H.; Liu, Z.; Su, H. Fuzzy-Kalman-filter-based short-circuit fault diagnosis design for lithium-ion battery. IEEE Trans. Ind. Electron. 2024, 71, 2883–2892. [Google Scholar] [CrossRef] [Scilit]
- Jia, Y.; Xu, J. Data-driven short circuit resistance estimation in battery safety issues. J. Energy Chem. 2023, 79, 37–44. [Google Scholar] [CrossRef] [Scilit]
- Qiao, D.; Wei, X.; Jiang, B.; Fan, W.; Gong, H.; Lai, X.; Zheng, Y.; Dai, H. Data-driven fault diagnosis of internal short circuit for series-connected battery packs using partial voltage curves. IEEE Trans. Ind. Inform. 2024, 20, 6751–6761. [Google Scholar] [CrossRef] [Scilit]
- Cai, H.; Liu, X.; Sun, L.; Xu, Y.; Wang, Y.; Han, X.; Zheng, Y.; Sun, Y.; Ouyang, M. Battery internal short circuit diagnosis based on vision transformer without real data. Innov. Energy 2024, 1, 100041. [Google Scholar] [CrossRef] [Scilit]
- Plett, G.L. Extended Kalman filtering for battery management systems of LiPB-based HEV battery packs: Part 2. Modeling and identification. J. Power Sources 2004, 134, 262–276. [Google Scholar] [CrossRef] [Scilit]
- Hariharan, K.S.; Kumar, V.S. A nonlinear equivalent circuit model for lithium ion cells. J. Power Sources 2013, 222, 210–217. [Google Scholar] [CrossRef] [Scilit]
- Julier, S.J.; Uhlmann, J.K. Unscented filtering and nonlinear estimation. Proc. IEEE 2004, 92, 401–422. [Google Scholar] [CrossRef] [Scilit]
- Plett, G.L. Sigma-point Kalman filtering for battery management systems of LiPB-based HEV battery packs: Part 1: Introduction and state estimation. J. Power Sources 2006, 161, 1356–1368. [Google Scholar]
- Daubechies, I. Orthonormal bases of compactly supported wavelets. Commun. Pure Appl. Math. 1988, 41, 909–996. [Google Scholar] [CrossRef] [Scilit]
- Chen, T.; Guestrin, C. XGBoost: A scalable tree boosting system. In Proceedings of the 22nd ACM SIGKDD International Conference on Knowledge Discovery and Data Mining, San Francisco, CA, USA, 13–17 August 2016; pp. 785–794. [Google Scholar]
- Lv, L.; Zhu, L.; Gao, S.; Xiang, X.; Wang, L.; Chang, C.; Tian, A.; Jiang, J. Fault diagnosis method for lithium-ion batteries based on image features and improved isolated forests. Energy 2025, 338, 138849. [Google Scholar] [CrossRef] [Scilit]
- Jiang, J.; Li, T.; Chang, C.; Yang, C.; Liao, L. Fault diagnosis method for lithium-ion batteries in electric vehicles based on isolated forest algorithm. J. Energy Storage 2022, 50, 104177. [Google Scholar] [CrossRef] [Scilit]
- Zhao, H.; Zhang, C.; Liao, C.; Wang, L.; Liu, W.; Wang, L. Data-driven strategy: A robust battery anomaly detection method for short circuit fault based on mixed features and autoencoder. Appl. Energy 2025, 382, 125267. [Google Scholar] [CrossRef] [Scilit]
- Zhang, X.; Liu, P.; Lin, N.; Zhang, Z.; Wang, Z. A novel battery abnormality detection method using interpretable Autoencoder. Appl. Energy 2023, 330, 120312. [Google Scholar] [CrossRef] [Scilit]
- Liu, K.; Zhao, S.; Zhao, G.; Fang, J.; Ren, Y.; Peng, Q. Internal short-circuit diagnosis for lithium-ion batteries using autoencoder with temporal convolutional network and self-attention mechanism. Energy 2026, 347, 140225. [Google Scholar] [CrossRef] [Scilit]

Disclaimer/Publisher’s Note: The statements, opinions and data contained in all publications are solely those of the individual author(s) and contributor(s) and not of MDPI and/or the editor(s). MDPI and/or the editor(s) disclaim responsibility for any injury to people or property resulting from any ideas, methods, instructions or products referred to in the content. |
© 2026 by the authors. Licensee MDPI, Basel, Switzerland. This article is an open access article distributed under the terms and conditions of the Creative Commons Attribution (CC BY) license.