


Abstract
Deploying retired lithium-ion batteries in photovoltaic energy storage systems is a promising second-life application, but heterogeneous aging and internal inconsistencies can induce the barrel effect, reducing available capacity and accelerating pack degradation. Existing equalization methods mainly rely on internal battery states and often neglect external irradiance fluctuations. To address this issue, this study proposes an irradiance-aware adaptive fuzzy active equalization strategy based on a multichannel bidirectional flyback converter. A second-order RC equivalent circuit model with a fifth-order OCV–SOC mapping is established to describe the dynamic behavior of retired cells. Then, solar irradiance and its rate of change are introduced into a dual-input fuzzy controller to adaptively regulate the equalization duty cycle according to both SOC inconsistency and PV input fluctuation. A saturation function constrains the active duty cycle below 0.5 to maintain discontinuous conduction mode operation and avoid transformer core saturation. Simulation results under rapid cloud occlusion, stable high irradiance, and persistent weak light show that the proposed strategy reduces equalization time by 13.8%, 4.4%, and 8.4%, respectively, compared with SOC-only fuzzy control. Under a publicly measured irradiance condition, the proposed strategy achieves the shortest equalization time of 3267.4 s, reducing the time by 24.2%, 27.7%, 29.0%, and 32.9% compared with traditional threshold-based, SOC-only fuzzy, maximum–minimum SOC, and PID-based strategies, respectively.
1. Introduction
Driven by the global “dual carbon” goals and the rapid expansion of the new energy transportation industry, a large number of power lithium-ion batteries (such as 18650 ternary lithium batteries) are facing large-scale retirement [1]. Generally, when the capacity of a power battery drops below 80% of its rated value, it will no longer meet the usage requirements of vehicles; however, it still contains a huge amount of residual energy and retains a considerable cycle life [2]. Deploying these retired power batteries to support photovoltaic (PV) power generation environments can not only significantly reduce the cost of energy storage infrastructure but also maximize the full life-cycle value of the power batteries and promote recycling of resources [3,4,5]. According to recent research on the economic value of retired batteries, this approach is crucial for sustainable development [6,7]. However, after undergoing long-term complex operating conditions in vehicles, retired batteries exhibit significant individual differences in internal electrochemical polarization characteristics and capacity degradation, resulting in strong heterogeneous aging characteristics [8]. According to a recent comprehensive overview on second-life battery utilization, this severe heterogeneous aging poses critical challenges regarding battery pack inconsistency and thermal runaway risks [9]. During PV charge and discharge cycles, this inconsistency in internal states can easily trigger a severe “barrel effect”, causing specific single cells to prematurely reach the charge or discharge cutoff thresholds, thereby greatly limiting the available capacity and safe operating boundaries of the battery storage cluster [10].
To alleviate the inconsistency problem within battery packs, active balancing technology has become a prominent research hotspot in the field of battery management systems [11,12,13,14]. Unlike passive balancing, which dissipates excess energy through resistors, active balancing employs energy storage components to facilitate non-dissipative energy transfer between individual cells. Therefore, choosing active balancing can significantly enhance the comprehensive benefits of the battery clusters. As summarized in the review literature by Qi et al. [15], compared to the high heat generation of passive balancing, active balancing achieves non-dissipative energy transfer and has the significant advantages of low heat value and high energy utilization efficiency. Furthermore, the review by Feng et al. [16] further points out that active balancing can be monitored in real time and dynamically adjust the state of individual cells, which is crucial for optimizing the overall performance of the re-deployed battery system, extending the cycle life of the battery pack, and ensuring the safe and stable operation of the system. Compared with passive equalization, active equalization inevitably introduces additional hardware components, such as isolated transformers, MOSFETs, gate drivers, sensors, and control circuits. Therefore, its practical application requires a trade-off among hardware cost, system complexity, and energy-utilization benefits. Passive equalization dissipates excess energy as heat, which reduces usable capacity and increases local thermal stress. In contrast, active equalization transfers energy between cells and the battery pack, thereby reducing energy dissipation, mitigating the capacity limitation imposed by the weakest cell, and improving pack-level capacity utilization. These advantages are particularly relevant to second-life batteries with pronounced cell-to-cell inconsistency. However, whether the saved energy is sufficient to offset the additional hardware cost depends on the operating profile, equalization frequency, conversion efficiency, hardware cost, battery degradation, and service-life extension.
Therefore, although the proposed active equalization scheme has higher hardware complexity, it is more suitable for second-life PV storage applications where energy reuse and consistency maintenance are important. To fully leverage the advantages of non-dissipative energy transfer in active balancing, carefully selecting the underlying hardware topology for energy conversion is critical. Among various balancing topologies, the bidirectional flyback-based balancing topology can overcome the limitations of physical proximity and achieve direct energy scheduling from individual cells to the battery pack, thereby providing flexible dynamic equalization capability [17]. In recent years, many scholars have conducted in-depth research on this topology; for example, Qin et al. [18] developed an active equalization control system based on a bidirectional flyback DC–DC converter utilizing a “peak clipping and valley filling” strategy, which fully exploited the topology’s unique merit in breaking physical proximity constraints to achieve flexible, non-adjacent energy transfer between arbitrary cells. Wang et al. [19] designed an adaptive bidirectional flyback balancing topology introducing a single-winding bidirectional excitation mechanism; the entire circuit requires only one converter, achieving a balancing efficiency of over 95% while reducing hardware costs. Moreover, recent studies on multi-objective control strategies utilizing interleaved cascaded bidirectional flyback converters [20] further indicate that dynamically adjusting equalization currents can help improve usable capacity and shorten balancing time. Although the bidirectional flyback topology provides an efficient physical channel for energy transfer, the full release of its underlying hardware potential is highly dependent on the precise scheduling of the upper-layer control strategy.
Currently, active balancing algorithms for retired batteries mainly include rule-based control, model predictive control (MPC), and fuzzy logic control. Although Wu et al. [21] applied a rule-based control for retired battery consistency, its reliance on fixed voltage or SOC thresholds fails to accommodate the complex nonlinear polarization and heterogeneous aging of second-life batteries. To improve dynamic performance, model predictive control has been widely proposed to optimize energy transfer trajectories and handle multi-objective constraints by predicting future states [22]. Nevertheless, its practical implementation requires the battery management system to frequently perform online receding horizon optimization and iterative quadratic programming (QP) solving within each control cycle [23,24]. Such high-frequency online computational demands pose significant real-time execution challenges for low-cost embedded microcontrollers (MCUs), thereby, to some extent, constraining their widespread deployment in large-scale energy storage engineering. In contrast, fuzzy logic control has become a prominent research direction due to its high robustness in handling nonlinear systems and parameter uncertainties without requiring rigorous mathematical models. Its primary advantage lies in low computational complexity and exceptional flexibility, performing fuzzy reasoning based purely on heuristic expert rules. For instance, Chen and Lu et al. [25,26] developed a multi-layer fuzzy logic control scheme to simultaneously balance SOC and state of health (SOH), effectively handling internal parameter uncertainties. Recent investigations into SOC balancing schemes for retired non-equal capacity batteries under dynamic charging conditions further highlight the extreme complexity of balancing under non-ideal states, emphasizing the strict necessity for robust adaptive control [27].
In the context of PV energy storage, active equalization strategy design is important for managing the heterogeneous aging of retired batteries. Although fuzzy logic control has been widely used due to its robustness, most existing studies mainly rely on internal battery states, such as terminal voltage or State of Charge (SOC), as feedback variables [28]. However, PV charging is affected by highly dynamic and unpredictable irradiance fluctuations. If only internal battery states are considered, the real-time coupling between equalization behavior and external power variation may be insufficiently addressed [29]. For example, during rapid cloud occlusion, solar irradiance and external charging power may decrease sharply. Without irradiance perception, the controller may still generate relatively strong equalization commands based only on SOC inconsistency, causing the equalization current to approach or exceed the reduced charging current. This may lead to unintended energy transfer, additional switching losses, and increased thermal stress in retired battery packs [30].
To address these issues, this paper proposes an irradiance-aware adaptive fuzzy active equalization strategy. Solar irradiance and its rate of change are introduced as feed-forward variables and coupled with internal SOCs. Based on adaptive weight allocation, the proposed strategy adjusts the equalization intensity according to both SOC inconsistency and external PV input variation. This helps reduce unnecessary equalization under weak irradiance conditions and improves the matching between equalization action and available solar energy. The main contributions of this paper are summarized as follows:
- (1)
- Battery Modeling for Equalization Control: A second-order RC equivalent circuit model with a fifth-order OCV–SOC mapping is established to provide reliable state inputs for the subsequent equalization control simulation.
- (2)
- Irradiance-Aware Adaptive Fuzzy Strategy: Solar irradiance and its rate of change are introduced into the fuzzy control framework, enabling the equalization duty cycle to be adaptively adjusted according to both SOC inconsistency and PV power fluctuation.
- (3)
- Validation under Controlled and Measured Irradiance Conditions: The proposed strategy is evaluated under three controlled irradiance scenarios and one publicly measured irradiance condition. Comparative results with multiple baseline strategies show that the irradiance-aware mechanism shortens equalization time and improves adaptability to realistic PV input fluctuations.
2. Retired Battery Modeling and Parameter Identification
2.1. Experimental Testing Platform
To accurately characterize the degradation profiles and dynamic responses of retired batteries, a high-precision experimental platform was established [31]. All experiments were conducted within a controlled thermal environment at a constant 25 °C to mitigate the impact of ambient temperature fluctuations [32]. As illustrated in Figure 1, the platform comprises three primary modules: a battery cycler for precise current and voltage regulation, a programmable thermal chamber for temperature stabilization, and a host computer for test protocol scheduling and real-time data acquisition.
Figure 1.
Schematic diagram of the testing platform for retired lithium-ion batteries.
2.2. Characteristics Testing of Retired Batteries
Eight retired 18650 ternary lithium-ion cells with significant parametric inconsistencies were selected for investigation. Their nominal parameters are summarized in Table 1.
Table 1.
Nominal parameters of the experimental battery.
2.2.1. Static Capacity Calibration
To quantify the actual discharge capacity, a multi-step calibration protocol (0.2 C, 2.75 V–4.2 V) was conducted at 25 °C to strictly eliminate electrochemical polarization. This test cycle was repeated for three consecutive iterations to ensure both electrochemical and thermodynamic stability, with the transient profiles shown in Figure 2. The true available capacity is defined as the average of these three sequential ampere-hour discharges.
Figure 2.
The corresponding voltage and current dynamic response profiles during the three consecutive testing cycles.
The capacities recorded from the three 1C discharge tests, denoted as , , and were 2269.05 mAh, 2272.85 mAh, and 2276.87 mAh, respectively. Their average , calculated in Equation (1), represents the true available resting capacity of the cell.
Finally, the precise integration of the current in this discharge interval over time using the ampere-hour integration method yields the true available resting capacity of the retired battery cell.
2.2.2. Open-Circuit Voltage and State of Charge Mapping Test
The extraction of the OCV–SOC nonlinear mapping relationship employed an alternating pulse-rest test method based on discrete steps [33,34]. Starting with the battery fully discharged and sufficiently relaxed at 25 °C, a short-term charging pulse at a constant C-rate was applied using a high-precision testing system, causing the cell SOC to step strictly according to a set 5% or 10% increment [35]. After each pulse, the circuit was cut off, and the battery was forced into a deep dynamic relaxation phase for 2 to 4 h. When the terminal voltage change rate approached a minimum, internal thermodynamic equilibrium was assumed, and the terminal voltage was recorded as the true open-circuit voltage for that specific SOC node. This pulse-relaxation process was executed cyclically to traverse the entire 0% to 100% SOC range. Finally, the least squares method was used to perform a high-order polynomial fitting on all discrete coordinate nodes to construct a continuous OCV–SOC mapping function [36,37,38,39]. Through the above experimental steps, a set of corresponding data points between discrete battery SOC and OCV is shown in Table 2.
Table 2.
Correspondence between SOC and OCV.
Through the above experimental procedure, the voltage and current response profiles during the constant C-rate charging test are obtained, as shown in Figure 3. Based on the recorded relaxation voltages at different SOC points, the corresponding SOC–OCV data are summarized in Table 2. Then, polynomial regression with different orders was performed using the MATLAB R2023a curve fitting tool, and the comparison of the fitting curves is presented in Figure 4.
Figure 3.
Voltage and current change diagram of constant C–rate charging.
Figure 4.
Comparison of OCV–SOC fitting curves using polynomials of different orders.
To select the optimal polynomial degree, the model’s goodness-of-fit was comprehensively assessed using the coefficient of determination (denoted as ), the sum of squared errors (SSE), and the root mean square error (RMSE). A mathematically ideal fit is characterized by an value approaching 1 and minimizing values of SSE and RMSE toward 0. The corresponding statistical outcomes are summarized in Table 3.
Table 3.
Comparison of fitting evaluation parameters.
Balancing fitting accuracy and computational complexity, a 5th-order polynomial was selected to establish the OCV–SOC static mapping relationship, formulated in Equation (2):
The coefficients in Equation (2) were obtained by least-squares polynomial fitting based on the original OCV–SOC experimental data exported from the battery test system. It should be noted that these coefficients are numerical regression parameters rather than directly measured sensor values.
Given the pronounced polarization effects observed, a static model is inadequate for characterizing transient responses under complex dynamic operations. Thus, a high-fidelity dynamic equivalent model must be introduced for accurate state estimation.
2.3. Equivalent Circuit Modeling and Parameter Identification
2.3.1. Mathematical Modeling of the Second-Order RC Equivalent Circuit Model
To accurately depict the complex electrochemical impedance characteristics inside the retired battery, this paper constructed a second-order RC equivalent circuit topology [40,41]. As shown in Figure 5.
Figure 5.
State variables and polarity definitions of the second-order RC equivalent circuit.
This circuit consists of an ideal open-circuit voltage source , an Ohmic resistor capturing instantaneous voltage drops, and two series-connected parallel RC networks (, and , ). The first network simulates fast electrochemical polarization, while the second model simulates slow concentration polarization. According to Kirchhoff’s Voltage Law, the continuous-time domain terminal voltage is expressed in Equation (3):
Here, is the terminal voltage, I(t) is the load current (positive for charging, negative for discharging), and and are the dynamic polarization voltages. The state differential equations for the polarization capacitors are given by Equations (4) and (5):
The time constants are defined as = and = . Furthermore, the battery’s SOC trajectory is governed by the ampere-hour integration method in Equation (6):
where is the initial state, is the calibrated maximum capacity, and is the Coulombic efficiency.
For digital implementation in microcontrollers, this continuous-time state-space model must be discretized. Assuming a sampling period with a constant current during intervals, the recursive difference equations for the RC polarization voltages at step k are derived as Equations (7) and (8):
where and represent the voltage values across the fast polarization capacitor and the slow polarization capacitor at the k-th sampling instant, respectively. Combining these recursive formulas with Kirchhoff’s law, the discrete state-space observation equation becomes Equation (9):
This discretized model provides the mathematical framework for real-time dynamic parameter identification and accurate state tracking.
2.3.2. Offline Parameter Identification Experiment
To obtain key dynamic parameters such as Ohmic internal resistance, polarization internal resistance, and polarization capacitance in the second-order discrete state-space model, this paper adopts standard Hybrid Pulse Power Characterization (HPPC) tests to obtain the dynamic voltage response data of the battery at different states of charge [42], and performs offline parameter extraction combined with transient voltage jump and resting relaxation curves [43,44]. The specific testing steps for the HPPC test are as follows:
- (1)
- Charge the cell to 100% SOC at 25 °C and rest for 2 h.
- (2)
- Apply a 1C constant discharge current for 180 s (reducing SOC by 5%), followed by a 2 h rest.
- (3)
- This completes a single test cycle. Repeat step 2 twenty times until the discharge cut-off is reached, covering the full 100% to 0% SOC range.
The complete voltage and current profiles are illustrated in Figure 6a. Figure 6b presents a locally magnified view of a single pulse at SOC = 0.5. Key physical nodes include: before current application (Point A), instantaneous voltage drop (Point B), end of discharge (Point C), current removal (Point D), and end of relaxation (Point E).
Figure 6.
HPPC test results: (a) Overall voltage and current response profiles during the entire test; (b) Local enlarged view of a single pulse discharge cycle at SOC = 0.5.
Based on these characteristic points, the Ohmic resistance is calculated from the average vertical voltage jumps (A–B and C–D) as shown in Equation (10):
where represents the amplitude of the applied constant pulse current.
During the zero-input relaxation phase (D–E in Figure 6b), the terminal voltage exponentially recovers to . This is modeled by a bi-exponential function in Equation (11):
where is the steady-state open-circuit voltage after sufficient resting; and are the polarization voltages accumulated by the two RC networks at the instant the discharge ends, respectively; and are the fast and slow polarization time constants, respectively.
Using MATLAB’s nonlinear least squares algorithm, coefficients , , and are extracted from the D–E segment. The polarization parameters are then computed via Equation (12):
This rigorous procedure successfully extracted the true capacity, nonlinear OCV-SOC relationships, and transient second-order RC parameters, establishing a high-fidelity digital baseline for the subsequent simulation module.
2.4. Dynamic Validation of the Equivalent Circuit Model
The Dynamic Stress Test (DST) profile is employed in this study to further verify the accuracy and generalization performance of the second-order RC equivalent circuit model under complex dynamic conditions. Specifically, the measured current under the DST profile is fed into the model. Combined with the Ampere-hour integration method to update the State of Charge (SOC) in real time, the predicted terminal voltage is iteratively calculated using the discretized state equations. The comparison between the predicted and measured terminal voltages is illustrated in Figure 7.
Figure 7.
Comparison curves between predicted and measured terminal voltages under the DST profile (including local enlarged details).
As shown in Figure 7, the model voltage response is generally consistent with the measured voltage trend. The MAE and RMSE over the entire DST cycle are 11.29 mV and 13.60 mV, respectively, indicating acceptable overall tracking accuracy. However, a slight SOC-dependent voltage overestimation can be observed in the intervals adjacent to 4500–6000 s, although the prediction accuracy within this interval remains relatively high. This local bias is mainly caused by the mismatch between the offline HPPC–identified parameters and the highly dynamic DST current profile. Since the second-order RC model uses SOC-dependent parameters obtained from discrete pulse tests, it cannot fully capture nonlinear polarization, hysteresis, and diffusion effects under frequent current fluctuations. In addition, small OCV–SOC fitting and SOC update errors may be amplified in specific SOC regions. This issue can be further improved through segment-wise parameter correction, online parameter identification, or closed-loop SOC correction methods such as EKF or UKF. Nevertheless, the millivolt-level MAE and RMSE indicate that the present model is sufficiently accurate for the subsequent equalization-control simulation.
In this study, the SOC update is not based on nominal-capacity open-loop ampere-hour integration. Before simulation, the actual available capacity of the retired cell was calibrated through repeated capacity tests and used as the maximum capacity in the SOC update equation. The OCV–SOC mapping and second–order RC parameters were also obtained from retired-cell experiments, so the effects of capacity fade, internal resistance growth, and polarization characteristics are partially reflected in the model. Therefore, the mismatch–induced error between nominal parameters and retired-battery characteristics can be reduced within the limited equalization simulation interval.
Nevertheless, ampere-hour integration remains sensitive to initial SOC deviation and current measurement bias. Without correction, these errors may accumulate during long-term operation. Thus, the present model can provide acceptable state inputs and stable voltage outputs for equalization-control simulation, but it should not be regarded as a complete long-term online SOC estimator. For practical applications, closed-loop SOC correction methods, such as EKF, UKF, or adaptive filtering, should be introduced.
To further evaluate the generalization capability of the developed second-order RC model, the UDDS profile was introduced as an additional dynamic validation case after the DST. Compared with DST, UDDS contains more frequent current fluctuations, including variable discharge pulses, short charging periods, and voltage recovery processes. The measured UDDS current was used as the model input, and the simulated terminal voltage was compared with the experimental voltage. As shown in Figure 8, the model effectively tracks the overall voltage trend and captures transient voltage drops and recovery behaviors under UDDS excitation. The enlarged view further confirms the agreement between the simulated and experimental voltages, indicating that the identified ohmic resistance and polarization parameters can reasonably describe the dynamic response of the retired battery under complex operating conditions.
Figure 8.
Comparison between experimental and simulated terminal voltages under the UDDS profile with an enlarged view.
According to the error evaluation results, the mean absolute error and root mean square error under the UDDS profile are 8.39 mV and 10.65 mV, respectively. Compared with the DST profile, the UDDS profile exhibits more complex current variations, resulting in more significant polarization and transient recovery behaviors. Although the UDDS profile contains more frequent current variations than the DST profile, the MAE and RMSE remain at the millivolt level and are comparable to those obtained under the DST condition. These results indicate that the developed second-order RC equivalent circuit model can not only describe the dynamic voltage response under the DST condition but also maintain satisfactory voltage-tracking performance under the more complex UDDS condition, thereby providing a reliable model basis for subsequent SOC estimation and equalization-control simulation.
3. Equalization Circuit Analysis
This section thoroughly explores the working mechanism of the multi-channel bidirectional flyback equalization topology, reveals its physical bottlenecks under asymmetric charge and discharge states, and lays the hardware theoretical foundation for the subsequent design of the adaptive control strategy.
3.1. Working Mechanism of the Bidirectional Flyback Equalization Topology
To achieve efficient consistency management, a multi-channel independent bidirectional flyback converter is employed as the underlying equalization hardware. As illustrated in Figure 9, this topology utilizes the electromagnetic coupling of a high-frequency transformer to break the physical barriers of energy transfer between batteries, enabling direct energy interaction between any individual cell () and the entire series battery pack. The primary and secondary sides are controlled by N-channel power MOSFETs ( and ), respectively, with a transformer turns ratio defined as :.
Figure 9.
Topology of the bidirectional flyback circuit.
The bidirectional flyback architecture facilitates energy transfer in both “cell-to-pack” and “pack-to-cell” directions. Taking the discharge mode of a high-capacity cell in the battery pack as a representative case, to simplify the control loop and effectively prevent the transformer core from saturation, the system is set to operate constantly in Discontinuous Conduction Mode (DCM). In this theoretical derivation, the conduction voltage drops of the switches and diodes are ignored. Within one complete switching cycle , the synchronized control signals and the resulting current response profiles are depicted in Figure 10.
Figure 10.
Synchronized control signals and current response waveforms within one switching cycle.
To verify that the bidirectional flyback equalization circuit does not enter continuous conduction mode under the selected parameters, the simulated waveforms of the main switch driving signal, primary current, and secondary current are extracted, as shown in Figure 11. It can be observed that the primary current increases linearly from zero during the turn-on interval of the main switch. After the main switch is turned off, the primary current rapidly decreases to zero, while the secondary current appears and gradually decays. Before the next switching period begins, the secondary current has completely decreased to zero, and an obvious zero-current interval can be observed. This indicates that the energy stored in the magnetizing inductance is fully released within each switching period, satisfying the DCM criterion . Therefore, Figure 11 verifies from the perspective of simulated switching waveforms that the designed bidirectional flyback equalization converter operates stably in DCM, providing support for the subsequent derivation of the duty-cycle–equalization-current relationship and the control strategy design.
Figure 11.
Simulated verification waveforms of the bidirectional flyback equalization circuit under DCM operation: (a) main switch driving signal; (b) primary current; (c) secondary current.
Based on the dynamic responses shown in Figure 9, the switching cycle can be systematically divided into three distinct operating intervals, and the corresponding energy flow trajectories are presented in Figure 12a,b, respectively.
Figure 12.
Energy flow trajectories of the bidirectional flyback circuit. (a) Mode 1: primary energy storage. (b) Mode 2: secondary energy release.
In Mode 1, the primary side magnetizing energy storage interval [0, ], the system outputs a PWM signal with a duty cycle D to conduct while remains blocked. The individual cell Bi charges the magnetizing inductance through the primary coil. The voltage across the magnetizing inductor is expressed in Equation (13).
After the conduction time , the increment of the primary magnetizing current is given in Equation (14).
In Mode 2, Secondary side freewheeling energy release interval [, ]. is turned off. The energy stored in the magnetic core is released through the secondary coil, forcing the body diode of to conduct. The magnetic field energy is thus converted into electrical energy and transferred to the series battery pack . The discharging state of the inductance is described in Equation (15):
Based on the principle of inductor steady-state volt-second balance, the average voltage across the inductor over a complete switching period must be zero. Assuming the secondary freewheeling energy release time is , this is formulated in Equation (16):
In engineering applications, the average equalization currents extracted from the single cell is the core metric for evaluating equalization intensity. Based on the input energy equation, the average equalization current output by a single cell within one switching cycle is the ratio of the area of the primary current triangle to the period, which can be approximated as a function of the duty cycle D in Equation (17):
From the above mathematical derivation, once the underlying circuit parameters, such as the magnetizing inductance , switching period , and the transformer turns ratio : are determined, the magnitude of the target equalization current is essentially solely controlled by the PWM duty cycle D of the main switch.
For the flyback-based equalization structure used in the control verification, each equalization path is magnetically isolated through the flyback transformer, and the energy transfer between an individual cell and the battery pack is realized through the magnetizing inductance rather than a direct conductive path. Therefore, the common battery-pack bus mainly acts as an energy buffering node during cell-to-pack or pack-to-cell energy exchange, rather than forming a continuous circulating-current path among cells. In addition, the duty cycle is limited to be below the DCM boundary so that the magnetizing energy of each channel can be fully released within one switching period. This helps reduce residual energy accumulation and suppresses sustained current coupling among different equalization channels.
3.2. DCM Boundary Conditions and Duty Cycle Limiting Principles
To prevent the high-frequency transformer core from degrading into Continuous Conduction Mode (CCM) under continuous, high-intensity energy scheduling, the circuit must be strictly constrained to operate within the Discontinuous Conduction Mode (DCM) boundary. According to classic power electronics theory, the physical essence of maintaining DCM in a flyback converter requires that the secondary freewheeling time must be fully completed before the end of the current switching period, meaning the sum of the primary conduction time and the secondary discharge time cannot exceed the total switching cycle [45]. Combining this with the time conversion relationship derived from the inductor volt-second balance in Section 3.1 and eliminating the common period term , the generic boundary constraint expression for the maximum duty cycle under DCM operation can be directly derived as Equation (18):
To determine the absolute safe critical value of the duty cycle in practical operations, the voltage boundaries under the charging path must be introduced for verification. Since the system primarily operates in the charge equalization mode, the batteries remain at or above the platform voltage throughout the entire equalization cycle, eliminating the need to consider the extreme discharge cut-off state. When a single cell is at its nominal platform voltage () and the battery pack composed of 8 series-connected cells is also at its nominal platform voltage (), substituting these related data into the boundary constraint equation yields a maximum critical duty cycle of Even at the end of the charging phase, when the system reaches the charge cut-off peak (cell voltage ), the total pack voltage rises synchronously, keeping the voltage ratio constant. This mathematically demonstrates the scientific rationality and completeness of restricting the maximum active driving duty cycle strictly to this threshold.
4. Equalization Control Strategy Based on Adaptive Fuzzy Control
4.1. Selection and Analysis of Equalization Variables
To accurately characterize the internal inconsistency of the battery pack alongside external environmental fluctuations, the State of Charge (SOC) deviation, the solar irradiance, and its rate of change are extracted as the core input variables for the control system. Specifically, the framework utilizes an irradiance-aware structure where both the absolute irradiance level and its transient fluctuations are captured. First, to quantify the overall energy state of the system, the global average State of Charge () of the series battery pack is defined as the arithmetic mean of all individual cell SOC, which is mathematically formulated in Equation (19).
Based on this global reference, the absolute deviation between the target cell’s SOC and the global average is extracted as the first input variable,, to reflect the internal inconsistency. This relationship is expressed in Equation (20):
Simultaneously, to provide the balancing system with predictive environmental awareness and adapt to external variations, the transient change rate of light intensity is introduced as a feed-forward variable. This second input variable,, is defined as the derivative of light intensity (denoted as Irr) over time, as given in Equation (21):
where the physical unit of is defined as Watts per square meter per second (), which characterizes the dynamic gradient of the input power profile fed by the PV array under environmental mutations.
Since direct numerical differentiation of irradiance is sensitive to high-frequency noise, the irradiance change rate is calculated using a backward difference followed by a first-order low-pass filter. The specific formulas are given in Equations (22) and (23):
where is the sampling period, is the raw irradiance change rate, is the filtered irradiance change rate, and is the smoothing coefficient. The first-order filter has low computational cost and is suitable for BMS implementation. Although it introduces a small delay, the irradiance variation caused by cloud occlusion is much slower than the converter switching period; therefore, the delay has limited influence on the equalization decision.
4.2. Framework of the Adaptive Fuzzy Control Strategy
Because the dynamic battery equalization system under varying environmental conditions is a highly complex and non-linear model, an adaptive fuzzy control strategy is adopted. This approach efficiently coordinates multiple objectives without requiring an exact mathematical model.
The overall architecture of the proposed adaptive fuzzy controller comprises separate fuzzy controllers for the internal state (SOC) and external constraints (Irr), combined through an adaptive mechanism. The intricate structural relationships among these modules are systematically illustrated in Figure 13a. The specific execution logic of the entire equalization strategy is thoroughly detailed in the flowchart presented in Figure 13b. The system continuously monitors the cell SOC and light intensity, initiating active equalization whenever the maximum SOC difference meets or exceeds the 2% threshold and terminating when it drops below 0.2%.
Figure 13.
Framework and implementation logic of the adaptive equalization strategy: (a) schematic structure of the adaptive fuzzy controller; (b) flowchart of the active equalization strategy.
The balancing turn-on and turn-off thresholds are determined by the nonlinear polarization characteristics of retired battery cells and the typical 1–2% SOC estimation error in practical BMS applications. An excessively low turn-on threshold may cause false triggering and high-frequency start-stop oscillations of the power switches, especially when initial SOC deviation or current measurement noise is present. Therefore, a 2% turn-on threshold and a 0.2% turn-off threshold are adopted to form a 1.8% hysteresis band. This software deadband suppresses invalid switching actions caused by small SOC fluctuations while preserving the available capacity of the battery pack. In addition, the final duty-cycle command is generated through fuzzy inference and saturation limitation rather than direct hard switching, so the control output remains smooth and bounded under small measurement disturbances.
4.3. Design of the Fuzzy Controllers
4.3.1. Fuzzification and Membership Functions
In the fuzzification stage, the universes of discourse for all variables are established based on operational constraints. Specifically, the internal inputs is set to [0, 20], while the global average is bounded within [0, 100]. For the environmental variables, the irradiance is scaled within [300, 1000], and its transient change rate is mapped to [−50, 50] . Both output duty cycles, and are constrained within a normalized range of [0, 1]. To balance control resolution, computational efficiency, and rule-based complexity, all input and output variables are divided into five linguistic levels: VS, S, M, L, and VL, representing Very Small, Small, Medium, Large, and Very Large, respectively. This five-level classification can describe the variation trend of each variable from low to high, while avoiding a significant increase in the number of fuzzy rules.
Triangular membership functions are adopted in this study. This type of membership function has a simple structure and low computational cost, making it suitable for real-time equalization control. Meanwhile, a certain overlap is arranged between adjacent membership functions so that the input variables can smoothly transition between different linguistic levels. This helps avoid abrupt changes in the output duty cycle caused by small input fluctuations. Therefore, the proposed membership function design improves the continuity and stability of the fuzzy controller. The specific distributions of the membership functions are shown in Figure 14.
Figure 14.
Membership functions of the fuzzy controllers: (a,c,e) inputs and output for the SOC fuzzy controller; (b,d,f) inputs and output for the irradiance fuzzy control.
4.3.2. Fuzzy Control Rules and Defuzzification
The fuzzy rule base is designed according to the SOC inconsistency, the SOC safety boundary, and the photovoltaic input condition. For the SOC fuzzy controller, ΔSOC represents the inconsistency among cells, while SOC indicates whether the cell is close to the over-charge or over-discharge boundary. For the irradiance fuzzy controller, Irr represents the current photovoltaic input power, and reflects the supporting effect of irradiance variation on the equalization process. The rule design follows the principles below:
- (1)
- When ΔSOC is small, the battery pack has good consistency. Therefore, a small equalization duty cycle should be adopted to reduce unnecessary equalization actions and energy loss.
- (2)
- When ΔSOC increases, the SOC difference among cells becomes larger. Therefore, the equalization duty cycle should be increased to enhance the equalization current and accelerate SOC convergence.
- (3)
- When the cell SOC is in the medium range, the cell is far from the over-charge and over-discharge boundaries, and a relatively active equalization action can be adopted. When the SOC is too low or too high, the duty cycle should be reduced to avoid over-discharge, over-charge, or current impact.
- (4)
- When Irr is low, the photovoltaic input power is limited. The system should first ensure the main charging process and bus voltage stability, so the equalization duty cycle should remain small.
- (5)
- When Irr is high and is large, the photovoltaic side has sufficient power margin and favorable support for equalization. In this case, the duty cycle can be increased to make better use of the external photovoltaic energy and shorten the equalization time.
- (6)
- When is small, the irradiance condition provides insufficient support for equalization. Even if the instantaneous Irr is relatively high, the duty cycle should still be limited to avoid frequent current fluctuations caused by irradiance variation.
Therefore, based on these principles, the SOC fuzzy control rules and irradiance fuzzy control rules are established, as shown in Table 4 and Table 5, respectively.
Table 4.
SOC fuzzy control rules (Output:).
Table 5.
Irr fuzzy control rules (Output:).
Following the fuzzy inference, the linguistic results are converted back into crisp control signals using the centroid defuzzification method. This ensures smooth output transitions and is mathematically defined in Equation (24).
where denotes the crisp output obtained after defuzzification, is the output variable in the universe of discourse, represents the aggregated output membership function after fuzzy inference, and the integration is performed over the entire output universe of discourse. In this study, corresponds to the normalized duty-cycle command generated by the fuzzy controller.
The resulting 3D fuzzy control surfaces, which intuitively illustrate the non-linear mapping characteristics of the system across various operating conditions, are presented in Figure 15.
Figure 15.
Three–dimensional coordinate diagram of the fuzzy control: (a) SOC fuzzy control; (b) Irr fuzzy control.
4.4. Adaptive Duty Cycle Output and Weight Allocation
To achieve real-time energy matching with the available environmental power, an adaptive fuzzy mechanism is integrated to dynamically govern the influence of the internal and external controllers. The adaptive fuzzy controller utilizes the current Irradiance is set to [300, 1000], as its input to continuously adjust the output weighting coefficients and are set to [0, 1]. The logical rules governing this adaptive weight distribution, balancing the priority between internal SOC inconsistency and external solar volatility, are strictly tabulated in Table 6. The continuous dynamic trends of these weights are further plotted in the 2D line charts in Figure 16. Their membership functions are depicted in Figure 17.
Table 6.
Adaptive fuzzy control rules.
Figure 16.
Dynamic variation curves of the adaptive weighting coefficients with respect to irradiance: (a) weighting coefficient ; (b) weighting coefficient .
Figure 17.
Membership functions of the adaptive weighting coefficients: (a) Membership function for ; (b) Membership function for
It is worth noting that within the transition regions of PV irradiance (e.g., when Irr is classified as medium intensity “M”), the linear summation of the adaptive weights and may dynamically exceed unity. To counteract this and strictly guarantee that the multi-channel bidirectional flyback converter constantly operates in Discontinuous Conduction Mode (DCM), a mathematical saturation limiting function is implemented. This mechanism confines the final active driving duty cycle within the precise physical ceiling of 0.5, fundamentally eliminating the risk of core saturation in the high-frequency transformer. Benefiting from the continuous defuzzification rooted in the centroid method, the control output remains differentiable with bounded derivatives despite the non-linear truncation constraint. Consequently, this adaptive framework suppresses driving signal mutations and limit-cycle oscillations during sharp meteorological transitions, ensuring smooth switching operations for the hardware power devices.
Ultimately, the finalized target duty cycle and the active driving duty cycle dispatched to the switches are dually reconstructed by coupling the external irradiance feed-forward factor with the internal SOC fuzzy output, formulated as follows in Equations (25) and (26):
4.5. Stability Analysis of the Proposed Adaptive Fuzzy Equalization Strategy
To provide a concise theoretical justification for the proposed adaptive fuzzy equalization strategy, the averaged equalization dynamics are considered. The SOC deviation of the i-th cell is defined as Equation (27):
where is the average SOC of the battery pack. A quadratic Lyapunov function is selected to describe the overall deviation energy, which is expressed as Equation (28):
It is clear that , and only when all cells have the same SOC. Thus, can be used as a compact measure of pack inconsistency.
In the proposed strategy, the adaptive fuzzy mechanism only regulates the magnitude of the active equalization duty cycle, whereas the energy-transfer direction is determined by the SOC deviation. Therefore, the equalization-induced deviation dynamics can be represented as shown in Equation (29):
where denotes the SOC deviation variation rate caused by equalization, and represents the combined influence of capacity, circuit parameters, and conversion efficiency. Since is bounded, and are also bounded. Equation (27) indicates that the equalization action is always opposite to the SOC deviation direction, which is the key stability property of the controller.
Taking the time derivative of the Lyapunov function yields Equation (30):
Therefore, the SOC deviation energy is non-increasing under the proposed strategy, and the closed-loop equalization process is stable in the Lyapunov sense.
Since is negative semidefinite rather than negative definite, LaSalle’s invariance principle is further introduced to characterize the convergence boundary. Considering the 0.2% turn-off threshold adopted in this study, the practical invariant set is defined as shown in Equation (31):
where . When , the controller generates an effective duty cycle for the selected high-SOC and low-SOC cells, so the deviation energy continues to decrease. When enters , the equalization process is stopped according to the preset deadband. Hence, the largest invariant set of the closed-loop system is , and the SOC deviation finally converges to this set.
Consequently, the proposed adaptive fuzzy equalization strategy indicates that the SOC inconsistency can be gradually reduced and eventually bounded within the allowable engineering threshold. This result demonstrates practical stability and convergence of the proposed strategy, rather than strict zero-error asymptotic convergence.
5. Simulation Verification and Analysis
5.1. Simulation Platform Construction
To verify the effectiveness of the proposed adaptive fuzzy equalization strategy based on irradiance perception and SOC, an active equalization simulation platform for an eight-cell retired battery pack is established in MATLAB/Simulink. The platform mainly consists of an equivalent charging module, a second-order RC battery model module, a bidirectional flyback equalization topology module, an adaptive fuzzy control module, and an SOC display module. The bidirectional flyback equalization circuit is assembled using generic electrical component blocks in Simulink, including MOSFETs, diodes, transformer/coupled inductors, capacitors, resistors, and measurement blocks, rather than directly adopting a complete pre-defined flyback converter template. The control algorithm is implemented using MATLAB Function blocks and fuzzy-rule logic, and the duty-cycle output is constrained by the saturation function described in Section 4. Based on this platform, the SOC equalization process and control response characteristics of the retired battery pack can be analyzed under different irradiance input conditions. The simulation platform is shown in Figure 18.
Figure 18.
Simulation platform model of the active equalization system for retired battery packs.
The proposed multichannel bidirectional flyback equalization topology has a modular structure. Each cell is connected to the battery-pack bus through an independent isolated flyback equalization channel. Therefore, when the number of series-connected cells increases, the topology can be extended by increasing the number of equalization channels or by adopting a modular grouped configuration. In addition, the upper-layer control strategy mainly determines the equalization action according to the SOC deviation between each cell and the average SOC of the battery pack. Thus, the control logic does not depend on a fixed battery-pack structure. For an N-cell series-connected battery pack, the SOC deviation of each cell can be calculated separately, and the corresponding equalization channel can be selected according to the control priority. This indicates that the proposed topology and control strategy have the potential to be extended to larger-scale battery packs.
5.1.1. Mathematical Equivalent Modeling of the Charging Module
The front-end energy input stage of a photovoltaic energy storage system typically consists of a photovoltaic array and a DC–DC buck converter. However, in system-level closed-loop simulation studies, the high-frequency pulse switching actions of the buck converter generate complex electromagnetic harmonic interference. These high-frequency ripples easily undergo frequency coupling with the dynamic voltage and current characteristics of the bidirectional flyback equalization topology. This coupling effect introduces additional nonlinear noise and affects the regulation performance of the adaptive equalization strategy on battery state fluctuations.
Given that the maximum power point tracking process is not the core of the equalization logic in this study, a controlled current source is used to equivalently replace the charging unit to improve simulation efficiency and highlight the effectiveness of the equalization strategy. The generation logic of the charging current follows the power-voltage coupling principle, and the calculation method is shown in Equation (32).
Here considers the asymmetric delay characteristics of maximum power point tracking such as slow rise, fast fall, and non-Gaussian noise at cloud edges. is the real-time bus voltage of eight cells connected in series, which is physically equivalent to the series battery pack voltage derived in the hardware topology analysis. (Section 3.1).
5.1.2. Equalization Topology Parameters
The simulation circuit employs the bidirectional flyback converter topology described in Section 3, and its core electrical parameters are listed in Table 7.
Table 7.
Key electrical parameters of equalization topology.
5.2. Meteorological Working Condition Scenario Construction
To ensure that different equalization strategies can be compared under identical and reproducible input conditions, the controllable irradiance profiles in Scenarios 1–3 are generated with reference to the irradiance dynamic modeling method reported in Reference [46]. These mathematically generated irradiance profiles are used to evaluate the control response of the proposed strategy under predefined conditions, including rapid cloud occlusion, stable high irradiance, and persistent weak light. Three simulation scenarios are constructed as follows:
- (1)
- Scenario 1: Rapid Cloud Occlusion. This scenario simulates sharp fluctuations in irradiance. A double Logistic function is employed to model the occlusion troughs, as defined in Equation (33):
Figure 19.
Variation in irradiance in Scenario 1.
- (2)
- Scenario 2: Stable High Irradiance. This simulates clear-sky conditions with low-frequency atmospheric disturbances, modeled by Equation (34):
Figure 20.
Variation in irradiance in Scenario 2.
- (3)
- Scenario 3: Persistent Weak Light. This scenario simulates persistent weak-light or rainy conditions, as expressed in Equation (35):
Figure 21.
Variation in irradiance in Scenario 3.
5.3. Publicly Measured Irradiance Condition
As a supplementary validation scenario, publicly measured irradiance data from the NREL Measurement and Instrumentation Data Center, specifically the Solar Radiation Research Laboratory Baseline Measurement System, were introduced [47]. The data used in this section were not generated by the authors but obtained from the open-access NREL MIDC/SRRL database.
In this study, global horizontal irradiance was selected as the external input of the equivalent charging module. To match the MATLAB/Simulink simulation time scale, the raw data were processed by time-interval selection, outlier treatment, and resampling. Compared with the predefined irradiance profiles in Scenarios 1–3, the measured irradiance condition contains stronger randomness and non-periodic fluctuations, including rapid irradiance drops, recoveries, and irregular natural variations. Therefore, this scenario improves the realism of the validation and further evaluates the adaptability of the proposed irradiance-aware equalization strategy under realistic solar disturbance conditions. The processed measured irradiance profile is shown in Figure 22.
Figure 22.
Variation in publicly measured irradiance conditions.
5.4. Results and Comparative Analysis
Based on the irradiance profiles constructed in Section 5.2 and Section 5.3, this section verifies the proposed equalization strategy through simulation. Under three controlled meteorological scenarios, the SOC-only fuzzy strategy is used as the main benchmark to evaluate the effectiveness of introducing irradiance-aware variables. Under the publicly measured irradiance condition, multiple baseline strategies are further introduced to assess the adaptability of the proposed strategy under realistic PV input fluctuations.
5.4.1. Dynamic Response Characteristics of the Adaptive Perception Strategy
This section takes Scenario 1, namely the rapid cloud occlusion condition, as the research object to analyze the dynamic response of the internal control variables of the proposed adaptive strategy. Specifically, the SOC-related duty cycle component , the irradiance-related limiting component , and the final output duty cycle are compared, as shown in Figure 23.
Figure 23.
Dynamic response curves of internal control variables of the adaptive equalization controller.
As shown in Figure 23, at the initial stage of the simulation, remains at a relatively high level because there is obvious SOC inconsistency among the eight retired battery cells, indicating a strong equalization demand. When the simulation enters the cloud occlusion stage, the irradiance decreases rapidly, and decreases accordingly. As a result, limits the final output , reducing the equalization intensity as the external input becomes weaker.
This result indicates that the proposed strategy can adjust the equalization intensity according to irradiance variation and avoid excessive equalization actions under weak external input conditions. Meanwhile, the final output duty cycle is limited within a safe range, which helps ensure the stable operation of the bidirectional flyback equalization circuit.
5.4.2. Comparative Analysis Under the Controlled Meteorological Scenarios
To further verify the equalization performance of the proposed strategy under the three controlled meteorological scenarios, the proposed adaptive strategy is compared with the SOC-only fuzzy strategy. Both strategies are tested using the same eight-cell retired battery pack model and the same initial SOC inconsistency condition. The SOC-only fuzzy strategy adjusts the equalization action mainly according to the internal SOC deviation of the battery pack, while the proposed strategy further introduces irradiance perception information on the basis of SOC. The SOC equalization results under the three controlled meteorological scenarios are shown in Figure 24.
Figure 24.
Comparison of SOC equalization performance between the SOC-only fuzzy strategy and the proposed adaptive strategy: (b,d,f) SOC-only fuzzy strategy under Scenarios 1, 2, and 3; (a,c,e) proposed adaptive strategy under Scenarios 1, 2, and 3.
Although the percentage improvements in Table 8 are moderate, the additional complexity of the proposed strategy is mainly limited to the software control layer and does not require changes to the bidirectional flyback equalization topology. The added operations, including irradiance processing, change-rate calculation, fuzzy inference, and adaptive duty-cycle allocation, have relatively low computational cost. The limited improvement in Scenario 2 is reasonable because the stable high-irradiance input allows the SOC-only fuzzy strategy to operate smoothly. Therefore, the proposed method provides a practical trade-off between complexity and performance, and its advantage becomes more evident under realistic irradiance conditions.
Table 8.
Quantitative comparison of SOC equalization time under different meteorological scenarios.
5.4.3. Comparative Analysis Under the Publicly Measured Irradiance Condition
To further verify the adaptability of the proposed strategy under realistic irradiance fluctuations, comparative simulations are conducted under the publicly measured irradiance condition. In this section, five equalization strategies are selected for comparison, namely the traditional threshold-based strategy, the SOC-only fuzzy strategy, the maximum–minimum SOC equalization strategy, the PID–based SOC equalization strategy, and the proposed irradiance-aware adaptive fuzzy strategy. The maximum–minimum SOC strategy represents a typical extreme-value rule-based method, in which the cell with the largest SOC deviation is preferentially selected for equalization. The PID–based strategy uses the SOC deviation between each cell and the pack-average SOC as the control error, and its generated duty cycle is constrained by the same saturation limit to maintain the DCM operating condition. To ensure a fair comparison, all strategies are implemented using the same initial SOC distribution, publicly measured irradiance input, second-order RC battery model, bidirectional flyback equalization topology, start–stop thresholds, duty-cycle upper limit, and termination criterion.
As shown in Figure 25, all five equalization strategies can reduce the SOC inconsistency among the eight retired battery cells, but their convergence characteristics are clearly different. The traditional threshold-based strategy is limited by fixed start–stop thresholds, resulting in relatively discrete equalization actions. The SOC-only fuzzy strategy can continuously regulate the duty cycle according to SOC deviation, but it still lacks direct perception of external irradiance variations. The maximum–minimum SOC strategy has a simple control logic and directly acts on the cell with the largest SOC deviation, but its global coordination capability is limited. The PID–based strategy provides continuous feedback regulation based on SOC deviation, but it cannot adaptively adjust the equalization intensity according to PV input power fluctuations. In contrast, the proposed irradiance-aware adaptive fuzzy strategy considers SOC inconsistency, solar irradiance, and irradiance change rate simultaneously, enabling the equalization intensity to be dynamically adjusted according to the external energy input.
Figure 25.
Comparison of SOC equalization performance under the publicly measured irradiance condition: (a) traditional threshold-based strategy; (b) SOC-only fuzzy strategy; (c) maximum–minimum SOC equalization strategy; (d) PID–based SOC equalization strategy; (e) proposed irradiance-aware adaptive fuzzy strategy; (f) comparison of ΔSOC range evolution among the five strategies.
The quantitative results in Table 9 show that the proposed strategy achieves an equalization time of 3267.4 s under the publicly measured irradiance condition. Compared with the traditional threshold-based strategy and the SOC-only fuzzy strategy, the equalization time is reduced by 24.2% and 27.7%, respectively. After further introducing the maximum–minimum SOC strategy and the PID–based strategy, the proposed strategy still shows a shorter equalization time, with reductions of 29.0% and 32.9%, respectively. These results indicate that control methods relying only on fixed thresholds, SOC-only fuzzy reasoning, extreme-value selection, or PID feedback cannot fully adapt to realistic irradiance fluctuations, while incorporating irradiance and its rate of change improves the matching between the equalization process and external PV input.
Table 9.
Quantitative comparison of SOC equalization performance under the publicly measured irradiance condition.
6. Discussion and Conclusions
Theoretical Insights: This study addresses the complex challenge of coupling the internal aging heterogeneity of retired power batteries with the external energy volatility in photovoltaic (PV) storage applications by proposing a multidimensional adaptive fuzzy active equalization strategy. By integrating a high-fidelity equivalent battery model with a multi-channel bidirectional flyback converter, the proposed method bridges the gap between internal electrochemical states and external energy scheduling. The core innovation lies in the introduction of solar irradiance and its transient rate of change as feed-forward perceptual variables. Unlike traditional “SOC-only” control strategies or rule-based logic that rely purely on internal state feedback and suffer from severe lagging responses during sudden energy deficits (e.g., rapid cloud occlusion), our framework dynamically allocates weights between internal SOC deviations and external environmental conditions. This achieves an adaptive reconstruction of the target duty cycle, enabling the system to make proactive adjustments and effectively avoid inefficient, forced equalization when external energy is scarce.
Limitations and Future Work: Although the proposed framework demonstrates robust dynamic performance, acknowledging its intrinsic limitations is critical to defining its valid application scope. First and foremost, the validation of the proposed strategy currently relies entirely on software-level simulations. This idealized environment cannot fully replicate the complex electromagnetic interference (EMI), parasitic inductances, and non-linear power losses associated with the high-frequency switching transients of a physical bidirectional flyback converter. In real-world physical deployment, switching delays and dead times of power MOSFETs may trigger transient current ripples during rapid regulation, thereby affecting the timing response of the controller. These non-ideal hardware characteristics will be thoroughly investigated in a forthcoming hardware-in-the-loop (HIL) or experimental bench development.
In addition, the influence of sensor uncertainties on the proposed control performance has not been systematically evaluated in this study. In practical BMS applications, voltage and current measurement errors, SOC estimation deviations, and irradiance sensor noise may disturb the fuzzy controller inputs, thereby affecting the duty-cycle command and equalization timing. Although the adopted start-stop thresholds, software deadband, and duty-cycle saturation function can suppress false triggering caused by small disturbances to some extent, a quantitative robustness analysis under measurement errors is still required. Therefore, future work will conduct error-injection simulations and hardware-in-the-loop tests to evaluate SOC convergence, equalization time, and system reliability under non-ideal measurement conditions.
Second, the offline parameter identification and dynamic validations were conducted under a strictly controlled laboratory environment at 25 °C, which fails to capture the complex thermal gradients inherent in real-world PV storage applications. From an engineering thermodynamics standpoint, temperature fluctuations significantly alter the internal impedance dynamics of retired lithium-ion batteries. As the operating temperature rises under actual outdoor solar irradiation, the enhanced ionic conductivity within the cells typically causes a reduction in both the ohmic internal resistance and polarization resistance . Under such circumstances, the second-order RC equivalent circuit model—relying on static parameters calibrated at 25 °C—will inevitably introduce localized estimation bias into the real-time State of Charge (SOC) tracking. This parameter mismatch might introduce a steady-state error into the calculated SOC deviation . Consequently, during sharp meteorological transitions, this biased input will affect the adaptive fuzzy inference engine, triggering either over-regulated or delayed duty-cycle commands that degrade the dynamic response and overall equalization efficiency. To overcome these environmental constraints, future work will focus on establishing dynamic temperature compensation mechanisms and integrating the state of health (SOH) as multi-objective weighting factors to further exploit the energy potential of retired battery clusters.
Conclusions: The simulation results support three key findings. (1) High-Fidelity Digital Baseline: A second-order RC equivalent circuit model coupled with a fifth-order OCV–SOC mapping provides sufficient voltage-tracking accuracy for the subsequent equalization-control simulation. (2) Dual-Perception Proactive Regulation: Introducing solar irradiance and its transient rate of change as feed-forward variables enables proactive control, effectively suppressing ineffective forced equalization and unintended cell discharge cycles during dynamic energy troughs. (3) Quantifiable Efficiency Improvement: Compared with SOC-only fuzzy control, the proposed strategy reduces equalization time by 13.8%, 4.4%, and 8.4% under rapid cloud occlusion, stable high irradiance, and persistent weak light, respectively. Under the publicly measured irradiance condition, it achieves the shortest equalization time of 3267.4 s, reducing the time by 24.2%, 27.7%, 29.0%, and 32.9% compared with threshold-based, SOC-only fuzzy, maximum–minimum SOC, and PID–based strategies, respectively.
Author Contributions
Conceptualization, Y.J., H.W. and M.Z.; methodology, H.W. and Y.J.; software, R.L., Y.G. and J.C.; validation, R.L. and Y.G.; formal analysis, Y.J. and M.Z.; investigation, R.L. and J.C.; resources, H.W. and M.Z.; data curation, R.L. and J.C.; writing—original draft preparation, Y.J., R.L. and J.C.; writing—review and editing, H.W., M.Z. and J.L.; visualization, R.L. and Y.G.; supervision, H.W. and M.Z.; project administration, H.W. and Y.J.; funding acquisition, H.W., Y.J. and M.Z. All authors have read and agreed to the published version of the manuscript.
Funding
This research was funded by the Characteristic Innovation Project of Universities in Guangdong (No. 2024KTSCX031); the Zhaoqing University High-level Project Training Program Funding Project (No. GCCZK202414); Young Teachers’ Scientific Research Fund Project of Zhaoqing University (No. qn202528); The ESI Discipline Enhancement Program Funding Project of Zhaoqing University (Grant No. 202606).
Data Availability Statement
The original contributions presented in the study are included in the article; further inquiries can be directed to the corresponding author. The publicly measured irradiance data used as a supplementary validation scenario were obtained from the NREL Measurement and Instrumentation Data Center/Solar Radiation Research Laboratory Baseline Measurement System. The original irradiance dataset is publicly available from the NREL MIDC/SRRL database.
Acknowledgments
During the preparation of this manuscript, the authors used ChatGPT-5.3, OpenAI, for English language polishing and phrasing refinement. The tool was not used to generate scientific data, figures, tables, analysis, results, or conclusions. The authors have reviewed and edited the output and take full responsibility for the content of this publication.
Conflicts of Interest
The authors declare no potential conflicts of interest concerning this research, authorship, and/or publication of this article.
Abbreviations
The following abbreviations are used in this manuscript:
| BMS | Battery Management System |
| CCM | Continuous Conduction Mode |
| DCM | Discontinuous Conduction Mode |
| DST | Dynamic Stress Test |
| EMI | Electromagnetic Interference |
| HIL | Hardware-in-the-Loop |
| HPPC | Hybrid Pulse Power Characterization |
| MAE | Mean Absolute Error |
| MCU | Microcontroller Unit |
| MOSFET | Metal-Oxide-Semiconductor Field-Effect Transistor |
| MPC | Model Predictive Control |
| OCV | Open-Circuit Voltage |
| PV | Photovoltaic |
| PWM | Pulse Width Modulation |
| QP | Quadratic Programming |
| RC | Resistor-Capacitor |
| RMSE | Root Mean Square Error |
| SOC | State of Charge |
| SOH | State of Health |
| SSE | Sum of Squared Errors |
References
- Yu, R.; Cong, L.; Li, Y.; Ran, C.; Zhao, D.; Li, P. Prospects of Passenger Vehicles in China to Meet Dual Carbon Goals and Bottleneck of Critical Materials from a Fleet Evolution Perspective. World Electr. Veh. J. 2024, 15, 14. [Google Scholar] [CrossRef] [Scilit]
- Wang, N.; Garg, A.; Su, S.; Mou, J.; Gao, L.; Li, W. Echelon Utilization of Retired Power Lithium-Ion Batteries: Challenges and Prospects. Batteries 2022, 8, 96. [Google Scholar] [CrossRef] [Scilit]
- Pompodakis, E.E.; Karapidakis, E.S. From Automotive to Power Grids: How Much PV Capacity Can Be Unlocked from Retired Electric Vehicle Batteries? Energies 2026, 19, 98. [Google Scholar]
- Sarker, M.T.; Haram, M.H.S.M.; Shern, S.J.; Ramasamy, G.; Al Farid, F. Second-Life Electric Vehicle Batteries for Home Photovoltaic Systems: Transforming Energy Storage and Sustainability. Energies 2024, 17, 2345. [Google Scholar] [CrossRef] [Scilit]
- Charlangsut, N.; Rugthaicharoencheep, N. Enhancing Voltage and Power Stability in Distribution System with Photovoltaic from the Benefits of Battery Energy Storage. Energies 2025, 18, 577. [Google Scholar] [CrossRef] [Scilit]
- Gharebaghi, M.; Rezaei, O.; Li, C.; Wang, Z.; Tang, Y. A Survey on Using Second-Life Batteries in Stationary Energy Storage Applications. Energies 2025, 18, 42. [Google Scholar]
- Yuan, L.; Ji, T.; Zhang, L. Active Methods for the Equalization of a Serially Connected Lithium-Ion Battery Pack: A Review. Batteries 2024, 10, 239. [Google Scholar] [CrossRef] [Scilit]
- Wang, H.; Liu, R.; Guo, Y.; Liu, Y.; Chen, J.; Jiang, Y.; Li, J. Adaptive Dual-Anchor Fusion Framework for Robust SOC Estimation and SOH Soft-Sensing of Retired Batteries with Heterogeneous Aging. Batteries 2026, 12, 49. [Google Scholar] [CrossRef] [Scilit]
- Song, H.; Chen, H.; Wang, Y.; Sun, X.-E. An Overview About Second-Life Battery Utilization for Energy Storage: Key Challenges and Solutions. Energies 2024, 17, 6163. [Google Scholar] [CrossRef] [Scilit]
- Zhang, D.; Shafiullah, G.; Das, C.K.; Wong, K.W. Optimal Allocation of Battery Energy Storage Systems to Enhance System Performance and Reliability in Unbalanced Distribution Networks. Energies 2023, 16, 7127. [Google Scholar] [CrossRef] [Scilit]
- Tang, R.; Gu, Z.; Zhang, P.; Ning, S.; Jiang, C.; Li, Z. Equalization control of marine power lithium battery systems based on dynamic topology reconfiguration. J. Renew. Sustain. Energy 2026, 18, 025704. [Google Scholar] [CrossRef] [Scilit]
- Li, Y.; Yin, P.; Chen, J. Active Equalization of Lithium-Ion Battery Based on Reconfigurable Topology. Appl. Sci. 2023, 13, 1154. [Google Scholar] [CrossRef] [Scilit]
- Lee, J.E.; Won, J. Enhanced Coulomb Counting Method for SoC and SoH Estimation Based on Coulombic Efficiency. IEEE Access 2023, 11, 17621–17630. [Google Scholar] [CrossRef] [Scilit]
- Shang, Y.; Zhang, C.; Cui, N.; Guerrero, J.M. A Cell-to-Cell Battery Equalizer with Zero-Current Switching and Zero-Voltage Gap Based on Quasi-Resonant LC Converter and Boost Converter. IEEE Trans. Power Electron. 2014, 30, 3731–3747. [Google Scholar]
- Qi, J.; Xu, Y.; Chen, S.; Shen, J.; Yang, R.; Xu, H. A Comprehensive Review of Equalization Techniques for Reconfigured Second-Life Battery Systems. Batteries 2025, 11, 327. [Google Scholar] [CrossRef] [Scilit]
- Feng, F.; Hu, X.; Liu, J.; Lin, P.; Chen, B. A review of equalization strategies for series battery packs: Variables, objectives, and algorithms. Renew. Sustain. Energy Rev. 2019, 116, 109464. [Google Scholar] [CrossRef] [Scilit]
- Alvarez-Diazcomas, A.; Rodríguez-Reséndiz, J.; Carrillo-Serrano, R.V. An Improved Battery Equalizer with Reduced Number of Components Applied to Electric Vehicles. Batteries 2023, 9, 65. [Google Scholar] [CrossRef] [Scilit]
- Qin, D.; Qin, S.; Wang, T.; Wu, H.; Chen, J. Balanced Control System Based on Bidirectional Flyback DC Converter. Energies 2022, 15, 7226. [Google Scholar] [CrossRef] [Scilit]
- Wang, Y.; Liu, S.; Liu, H.; Li, X.; Zhang, Q.; Shang, Y. An Adaptive and Efficient Equalizer Based on Bidirectional Flyback Conversion. IEEE Trans. Power Electron. 2025, 40, 738–748. [Google Scholar] [CrossRef] [Scilit]
- Zhou, H.; Xie, Y.; Li, Z.; Hu, H.; Jing, H.; Zhang, L. Lithium-Ion Battery Pack Equalization: A Multi-Objective Control Strategy Using Interleaved Cascaded Bidirectional Flyback Converters. J. Renew. Sustain. Energy 2025, 17, 024101. [Google Scholar] [CrossRef] [Scilit]
- Wu, T.; Chen, L.; Xu, Y.; Zhang, X. Balancing Method of Retired Battery Pack Based on Variable Domain Fuzzy Control. J. Electrochem. Energy Convers. Storage 2023, 20, 041005. [Google Scholar] [CrossRef] [Scilit]
- Zhou, L.; Lai, X.; Li, B.; Yao, Y.; Yuan, M.; Weng, J.; Zheng, Y. State Estimation Models of Lithium-Ion Batteries for Battery Management System: Status, Challenges, and Future Trends. Batteries 2023, 9, 131. [Google Scholar] [CrossRef] [Scilit]
- Liang, G.; Rodriguez, E.; Farivar, G.; Nunes, E.; Konstantinou, G.; Townsend, C.D.; Pou, J.; Liu, Q. Model Predictive Control for Intersubmodule State-of-Charge Balancing in Cascaded H-Bridge Converter-Based Battery Energy Storage Systems. IEEE Trans. Ind. Electron. 2024, 71, 5777–5786. [Google Scholar] [CrossRef] [Scilit]
- Chen, J.; Behal, A.; Li, Z.; Li, C. Active Battery Cell Balancing by Real Time Model Predictive Control for Extending Electric Vehicle Driving Range. IEEE Trans. Autom. Sci. Eng. 2024, 21, 4003–4015. [Google Scholar] [CrossRef] [Scilit]
- Chen, Y.; Liu, S.; Cui, Y.; Zou, X.; Ouyang, S. An any-cell(s)-to-cell(s) equalization method with a single magnetic component for Lithium-ion battery pack. J. Energy Storage 2021, 33, 102071. [Google Scholar] [CrossRef] [Scilit]
- Lu, Z.; Wang, Q.; Xu, F.; Fan, M.; Peng, C.; Yan, S. Double-Layer SOC and SOH Equalization Scheme for LiFePO4 Battery Energy Storage System Using MAS Blackboard System. Energies 2023, 16, 5460. [Google Scholar] [CrossRef] [Scilit]
- Li, J.; Tian, L.; Liu, Y.; Han, R. Research on Active Equalization Strategy of Retired Batteries for Microgrid Energy Storage Systems. In Proceedings of the 2024 6th International Conference on Energy, Power and Grid (ICEPG), Guangzhou, China, 20–22 September 2024; pp. 50–53. [Google Scholar]
- Soyoye, B.D.; Bhattacharya, I.; Anthony Dhason, M.V.; Banik, T. State of Charge and State of Health Estimation in Electric Vehicles: Challenges, Approaches and Future Directions. Batteries 2025, 11, 32. [Google Scholar] [CrossRef] [Scilit]
- Gómez-González, M.; Tostado-Véliz, M.; Valverde, M.; Jurado, F. Optimal Design of Photovoltaic Domestic Installations Considering Second-Purpose Batteries. IEEE Access 2023, 11, 140126–140137. [Google Scholar] [CrossRef] [Scilit]
- Su, X.; Zou, G.; An, S.; Zou, H.; Wang, X. Research on Equalization Strategy of Lithium-Ion Battery Based on Temperature and SOC Adaptive Fuzzy Control. Energies 2025, 18, 581. [Google Scholar] [CrossRef] [Scilit]
- Xiong, R.; Wang, S.; Feng, F.; Yu, C.; Fan, Y.; Cao, W.; Fernandez, C. Co-Estimation of State-of-Charge and State-of-Health for High-Capacity Lithium-Ion Batteries. Batteries 2023, 9, 509. [Google Scholar] [CrossRef] [Scilit]
- Chen, B.-H.; Hsieh, C.-H.; Teng, L.-T.; Huang, C.-C. Experimental Study on Temperature Sensitivity of the State of Charge of Aluminum Battery Storage System. Energies 2023, 16, 4270. [Google Scholar] [CrossRef] [Scilit]
- Lee, S.; Lee, D. A Novel Battery State of Charge Estimation Based on Voltage Relaxation Curve. Batteries 2023, 9, 517. [Google Scholar] [CrossRef] [Scilit]
- Li, Z.; Chen, C.; Yang, R.; Li, H.; Xiong, R. Entropy-driven online open circuit voltage identification for precise state estimation in lithium-ion batteries. iScience 2025, 28, 113290. [Google Scholar] [CrossRef] [Scilit] [PubMed]
- Gonzalez-Saenz, J.; Becerra, V. Determination of Fast Battery-Charging Profiles Using an Electrochemical Model and a Direct Optimal Control Approach. Batteries 2024, 10, 2. [Google Scholar] [CrossRef]
- Hou, E.; Wang, Z.; Zhang, X.; Wang, Z.; Qiao, X.; Zhang, Y. Combined State of Charge and State of Energy Estimation for Echelon-Use Lithium-Ion Battery Based on Adaptive Extended Kalman Filter. Batteries 2023, 9, 362. [Google Scholar] [CrossRef] [Scilit]
- Wang, J.; Meng, J.; Peng, Q.; Liu, T.; Zeng, X.; Chen, G.; Li, Y. Lithium-Ion Battery State-of-Charge Estimation Using Electrochemical Model with Sensitive Parameters Adjustment. Batteries 2023, 9, 180. [Google Scholar] [CrossRef] [Scilit]
- Zhu, G.; Wu, O.; Wang, Q.; Kang, J.; Wang, J.V. The Modeling and SOC Estimation of a LiFePO4 Battery Considering the Relaxation and Overshoot of Polarization Voltage. Batteries 2023, 9, 369. [Google Scholar] [CrossRef] [Scilit]
- Saberi, S.; Abu Qahouq, J.A. A Model-Based Framework for Lithium-Ion Battery SoC Estimation Using a Tuning-Light Discrete-Time Sliding-Mode Observer. Modelling 2026, 7, 42. [Google Scholar] [CrossRef] [Scilit]
- Li, F.; Li, Z.; Zhang, Y.; Xu, G.; Wang, X.; Zhang, H. Analysis and Verification of Equivalent Circuit Model of Soft-Pack Lithium Batteries. Energies 2025, 18, 510. [Google Scholar] [CrossRef] [Scilit]
- Hu, X.; Li, S.; Peng, H. A comparative study of equivalent circuit models for Li-ion batteries. J. Power Sources 2012, 198, 359–367. [Google Scholar] [CrossRef] [Scilit]
- Białoń, T.; Niestrój, R.; Skarka, W.; Korski, W. HPPC Test Methodology Using LFP Battery Cell Identification Tests as an Example. Energies 2023, 16, 6239. [Google Scholar] [CrossRef] [Scilit]
- Grebtsov, D.K.; Druzhinin, A.A.; Sergeev, A.V. Excitation Pulse Influence on the Accuracy and Robustness of Equivalent Circuit Model Parameter Identification for Li-Ion Batteries. World Electr. Veh. J. 2026, 17, 38. [Google Scholar] [CrossRef] [Scilit]
- Li, W.; Xiong, Y.; Zhang, S.; Fan, X.; Wang, R.; Wong, P. A Novel Method of Parameter Identification for Lithium-Ion Batteries Based on Elite Opposition-Based Learning Snake Optimization. World Electr. Veh. J. 2025, 16, 268. [Google Scholar] [CrossRef] [Scilit]
- Erickson, R.W.; Maksimovic, D. Fundamentals of Power Electronics, 3rd ed.; Springer Nature: Cham, Switzerland, 2020. [Google Scholar]
- Ahmed, J.; Salam, Z. An improved perturb and observe (P&O) maximum power point tracking (MPPT) algorithm for higher efficiency. Appl. Energy 2015, 150, 97–108. [Google Scholar] [CrossRef] [Scilit]
- Stoffel, T.; Andreas, A. NREL Solar Radiation Research Laboratory (SRRL): Baseline Measurement System (BMS), Golden, Colorado; Dataset; National Renewable Energy Laboratory: Golden, CO, USA, 2015. [Google Scholar]
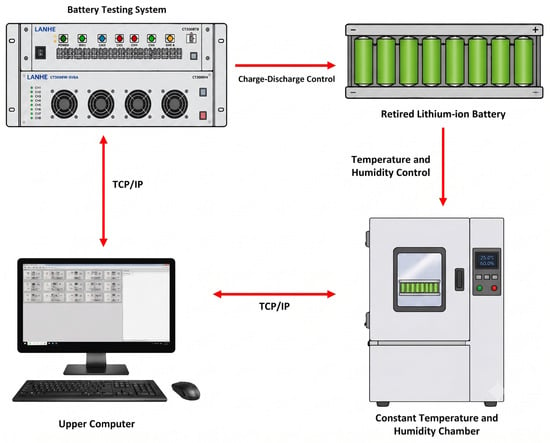
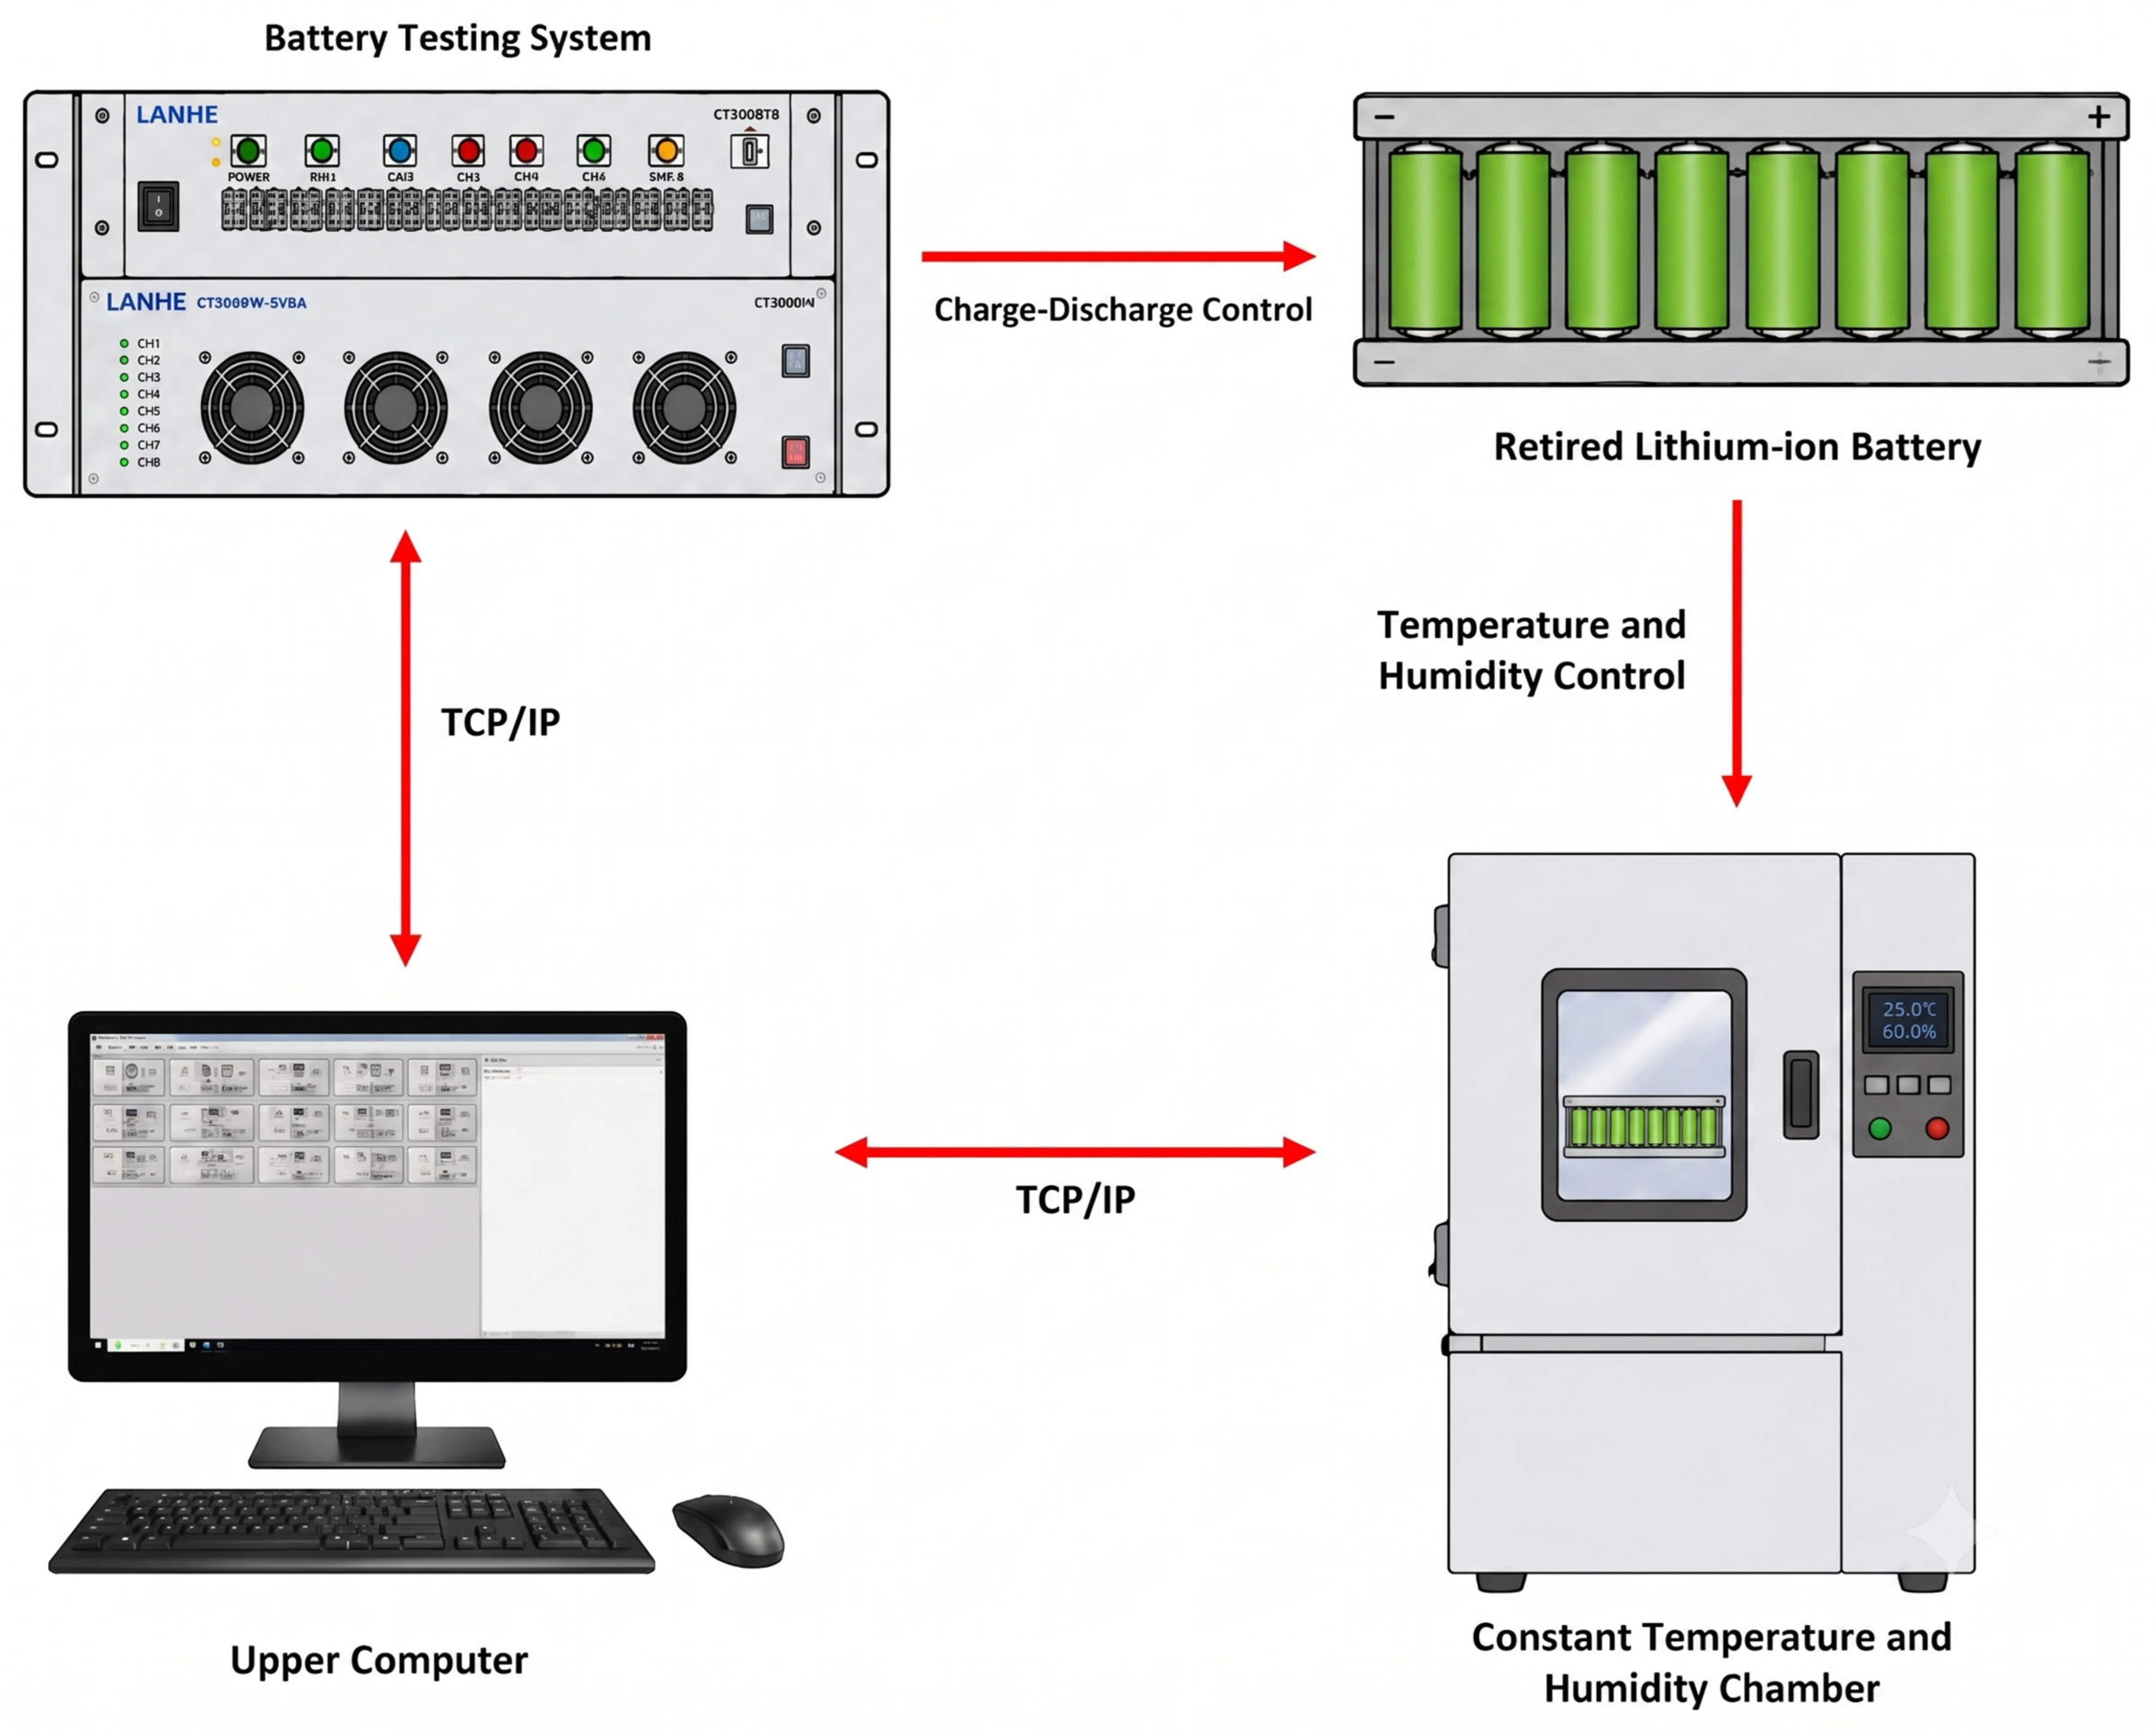
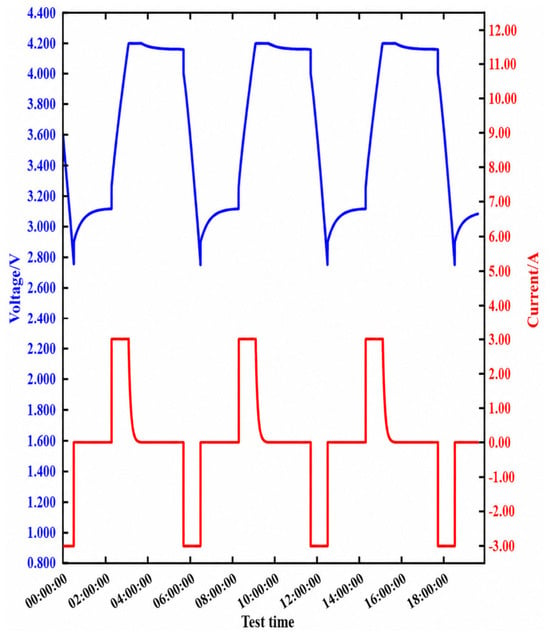
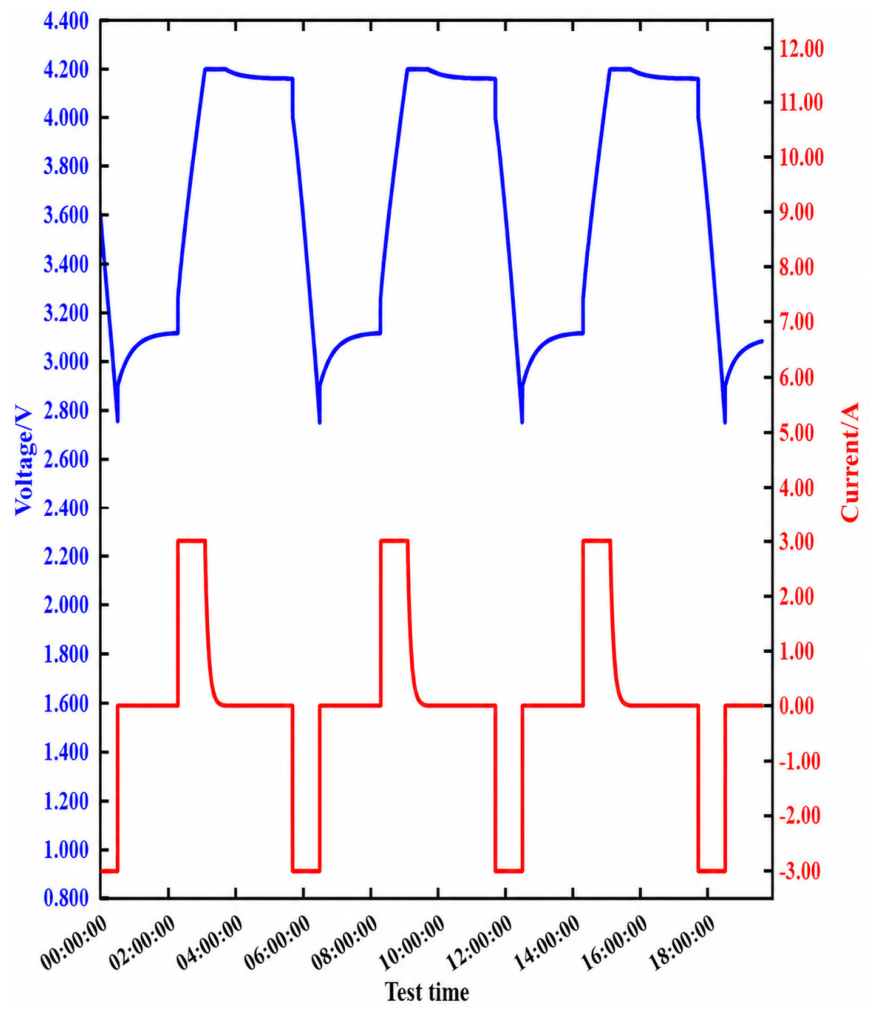
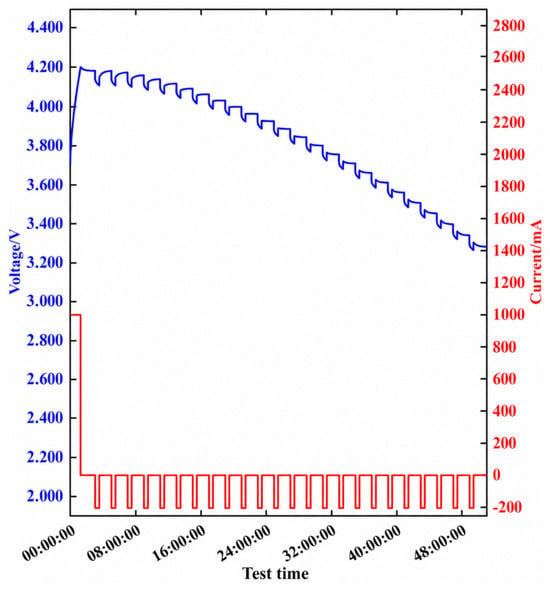
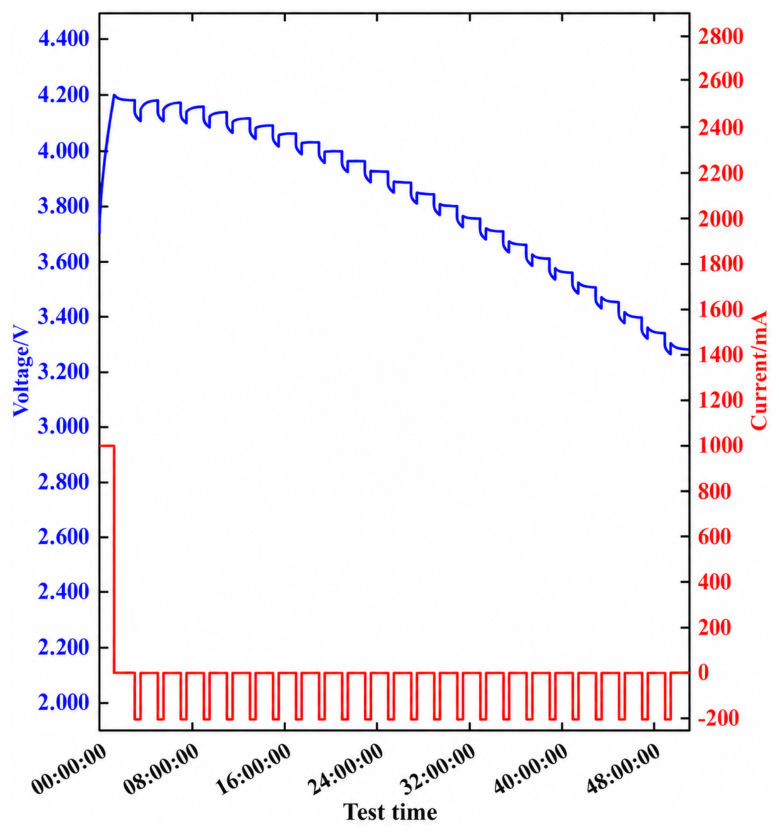
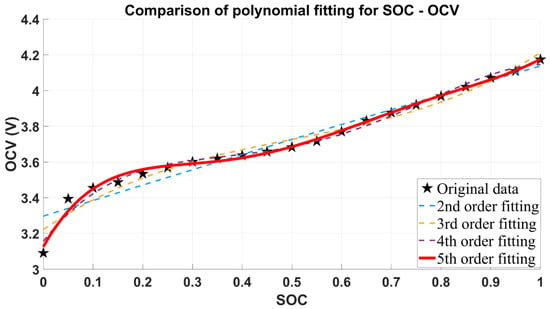
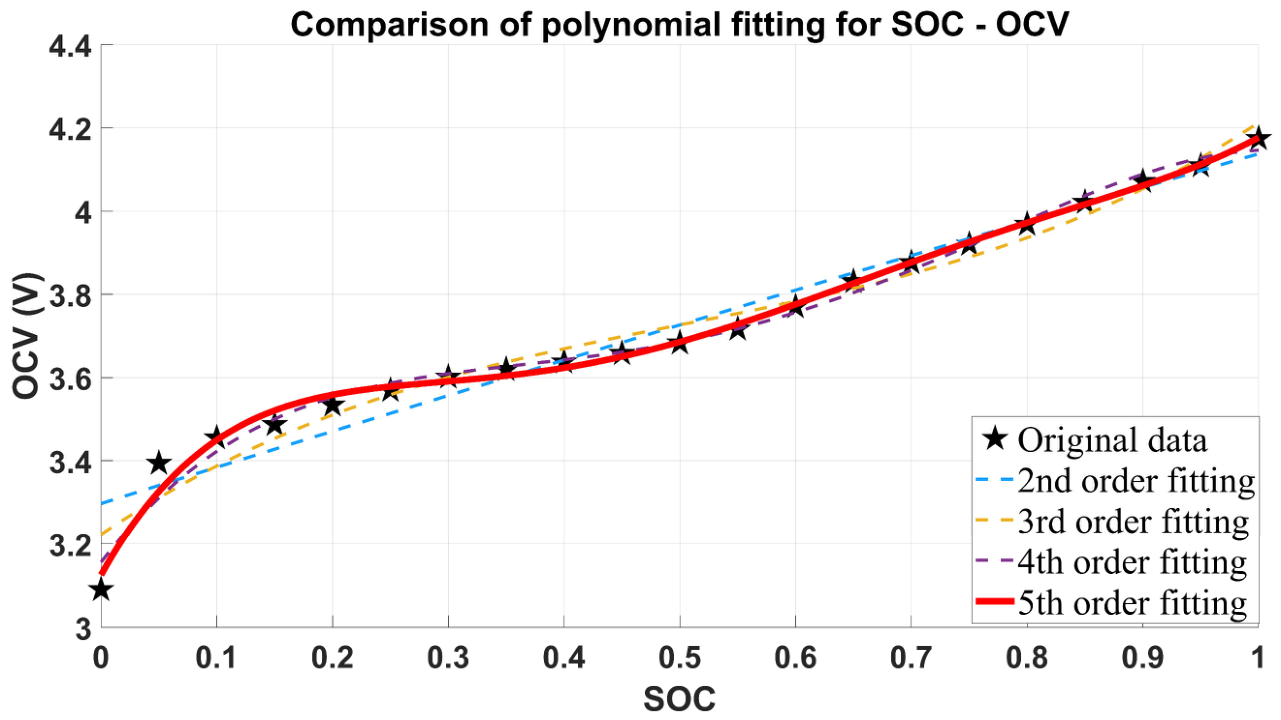
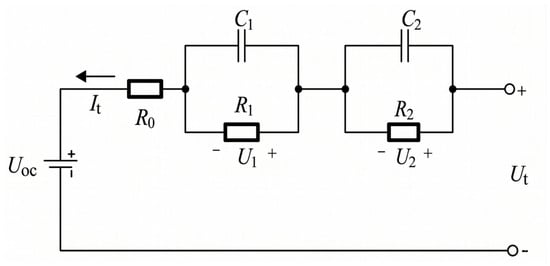
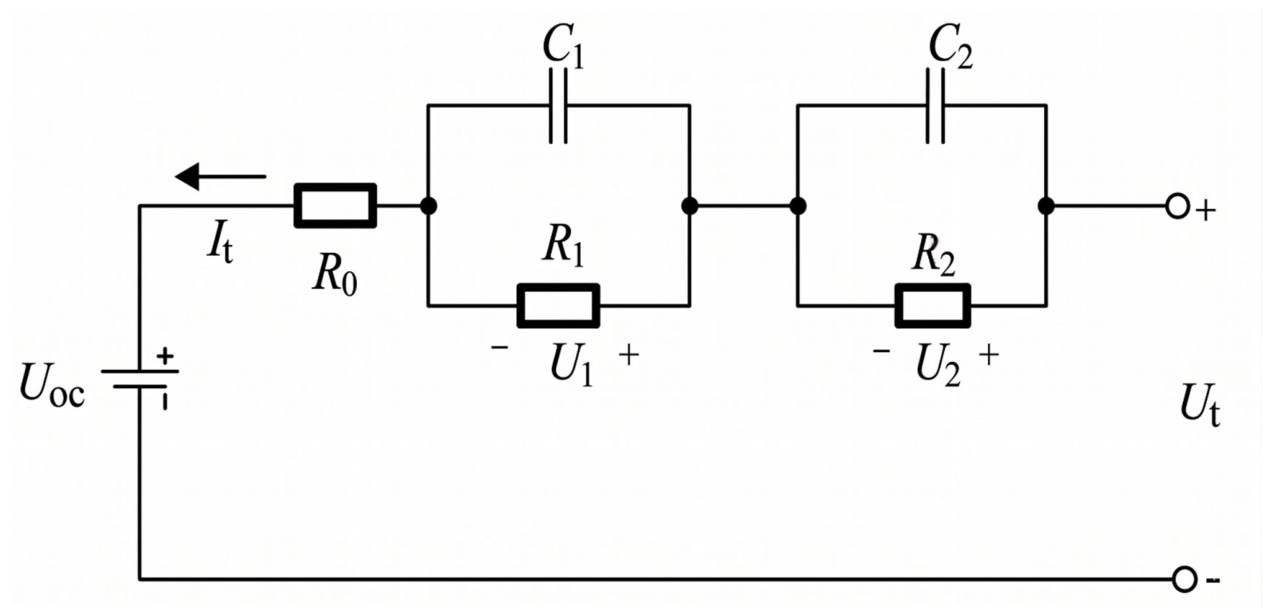
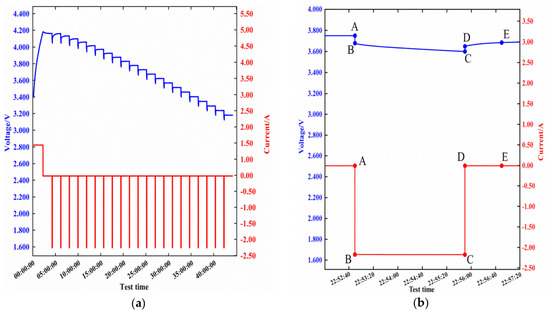
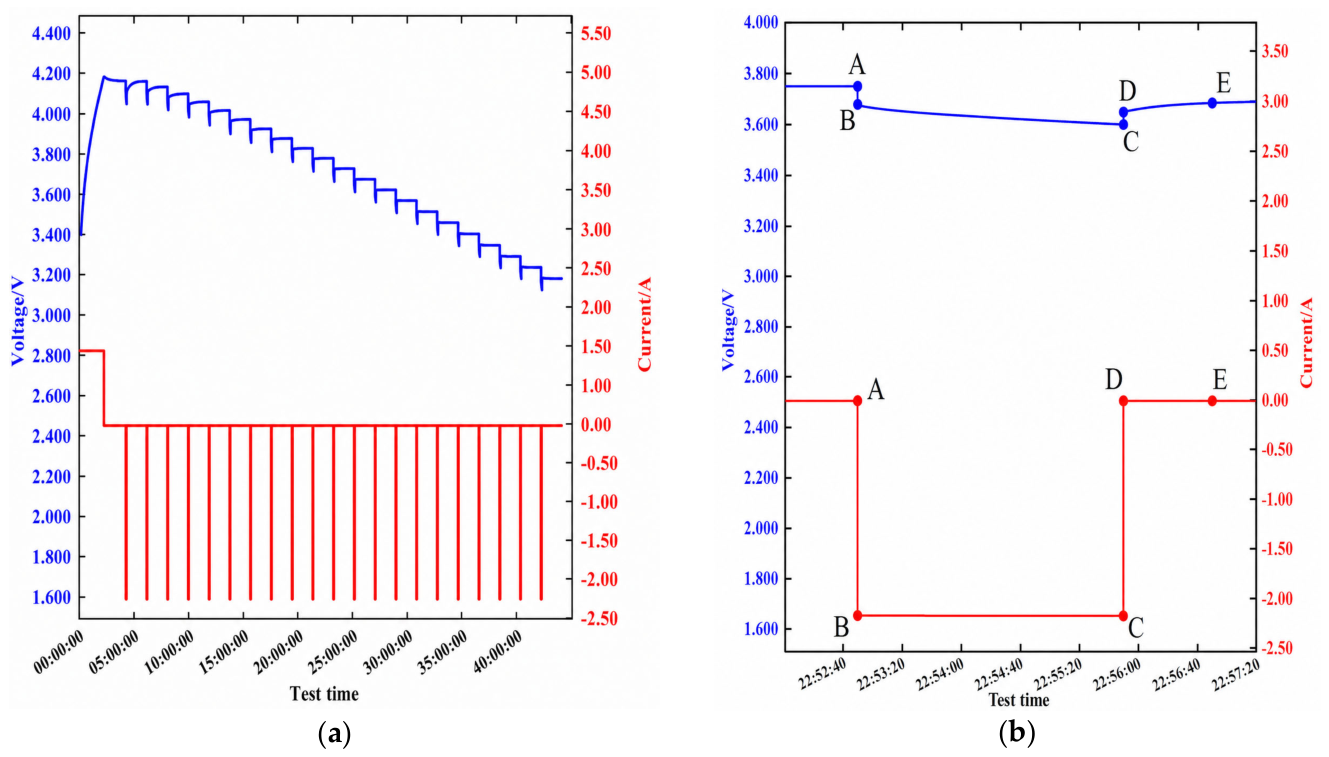
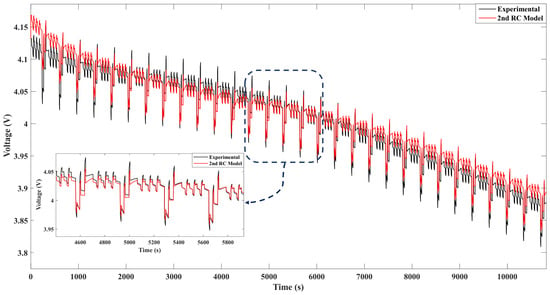
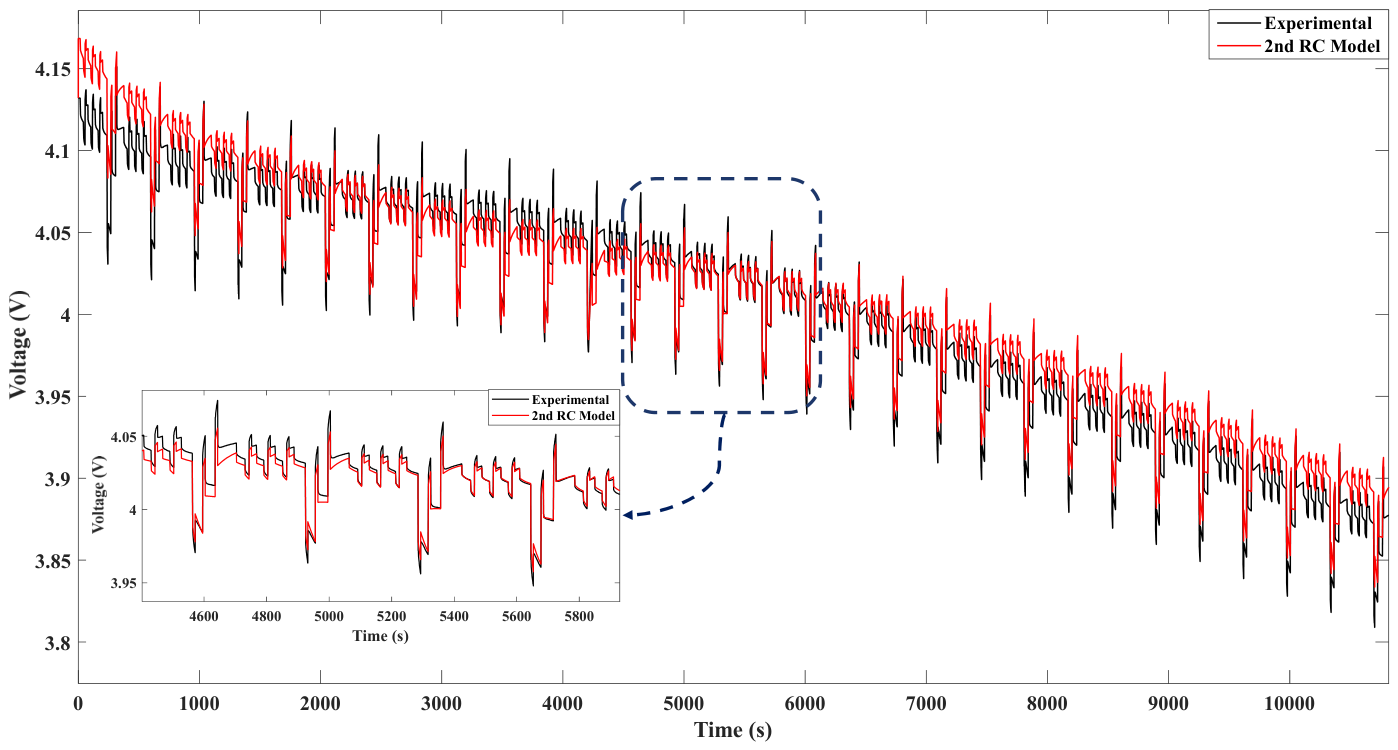
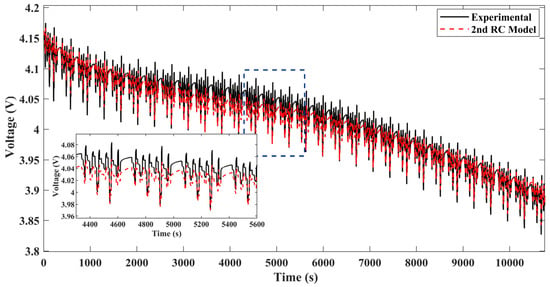
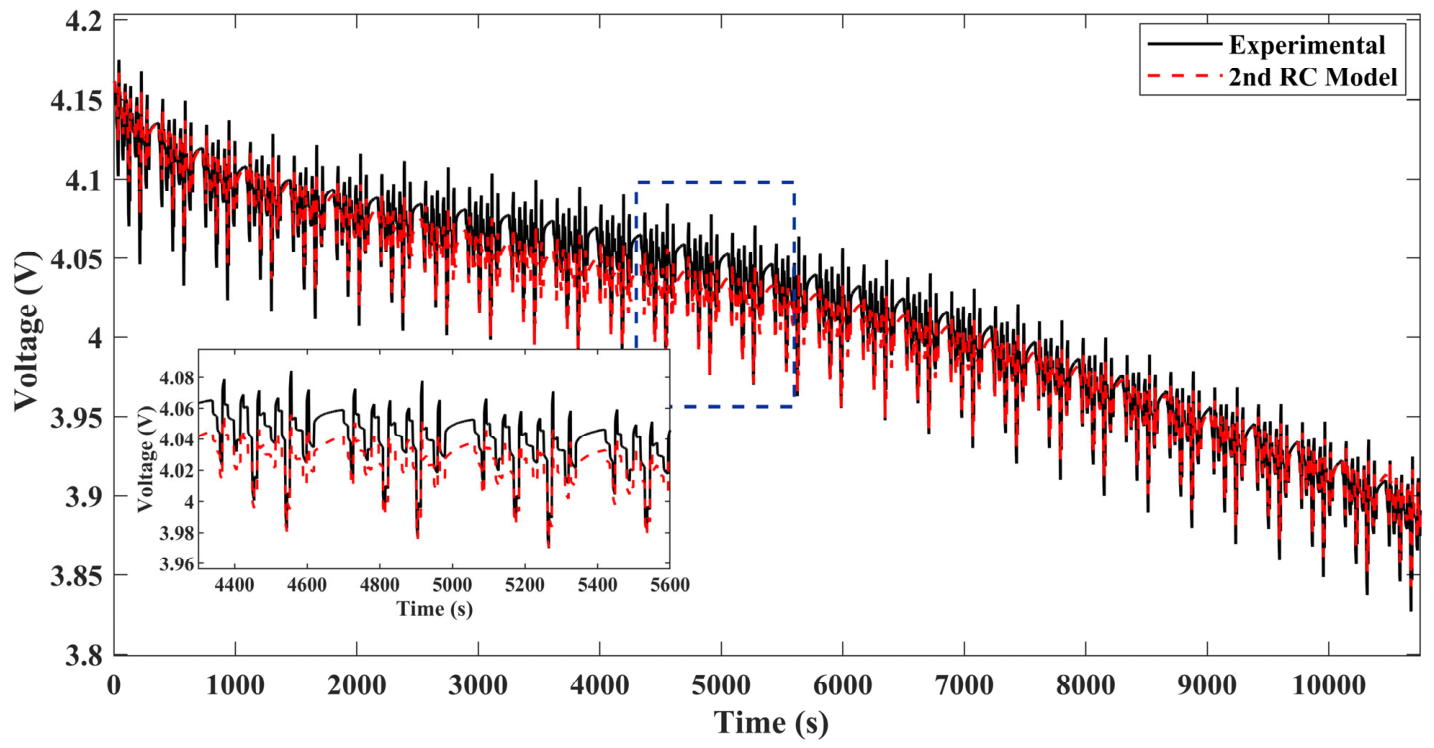
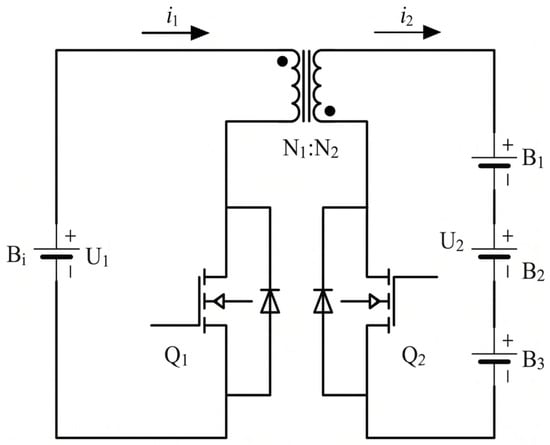
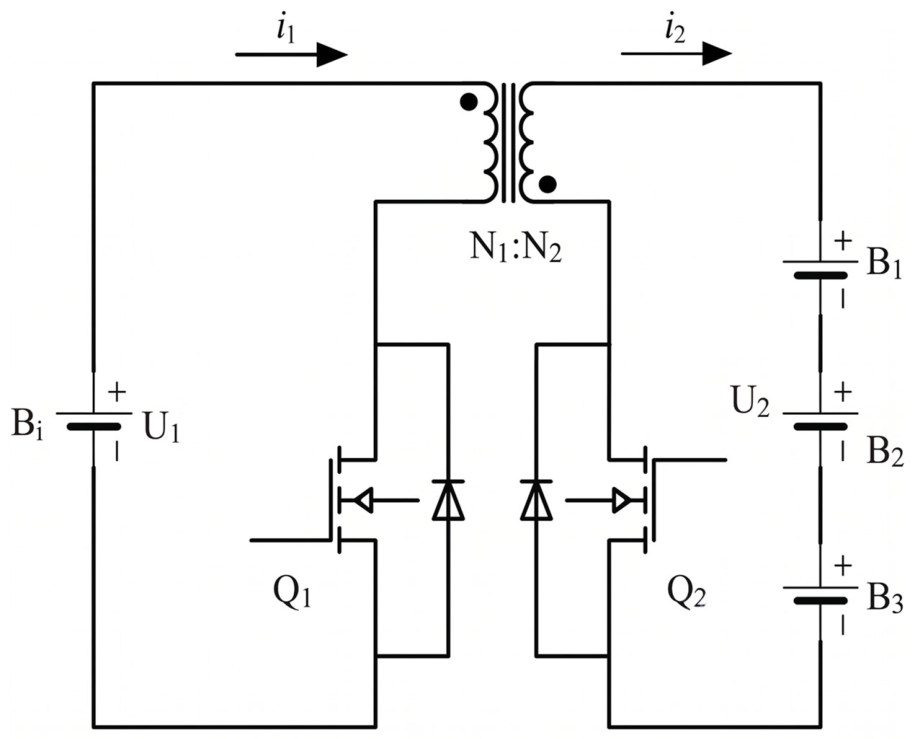
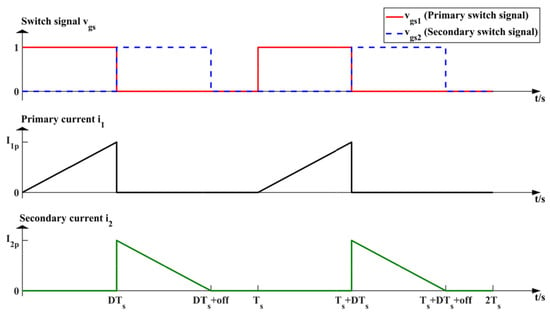
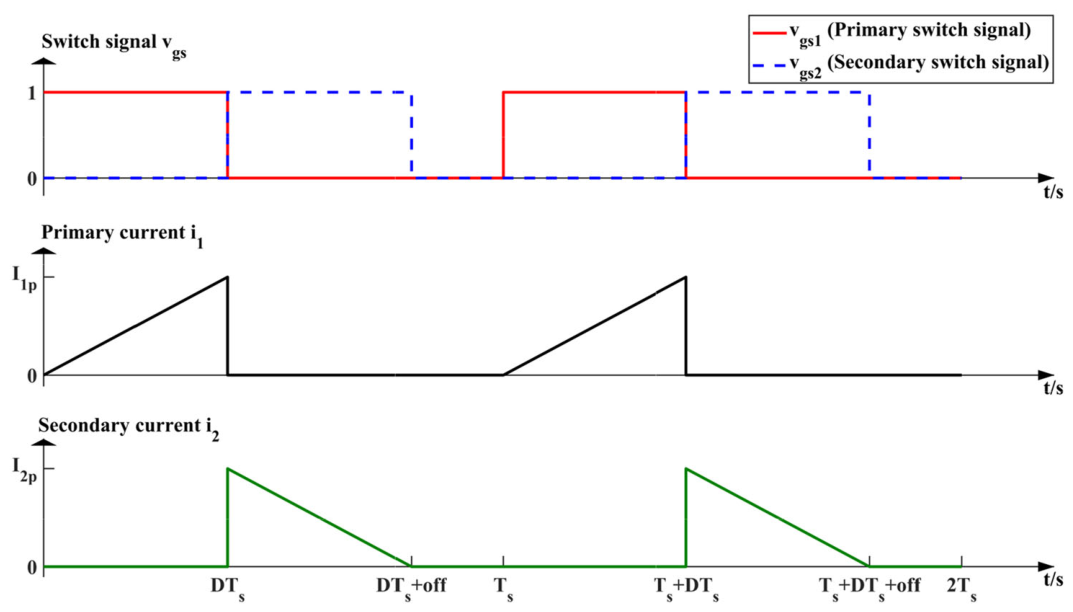
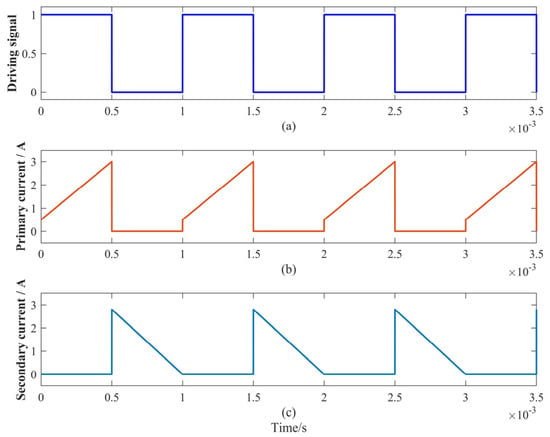
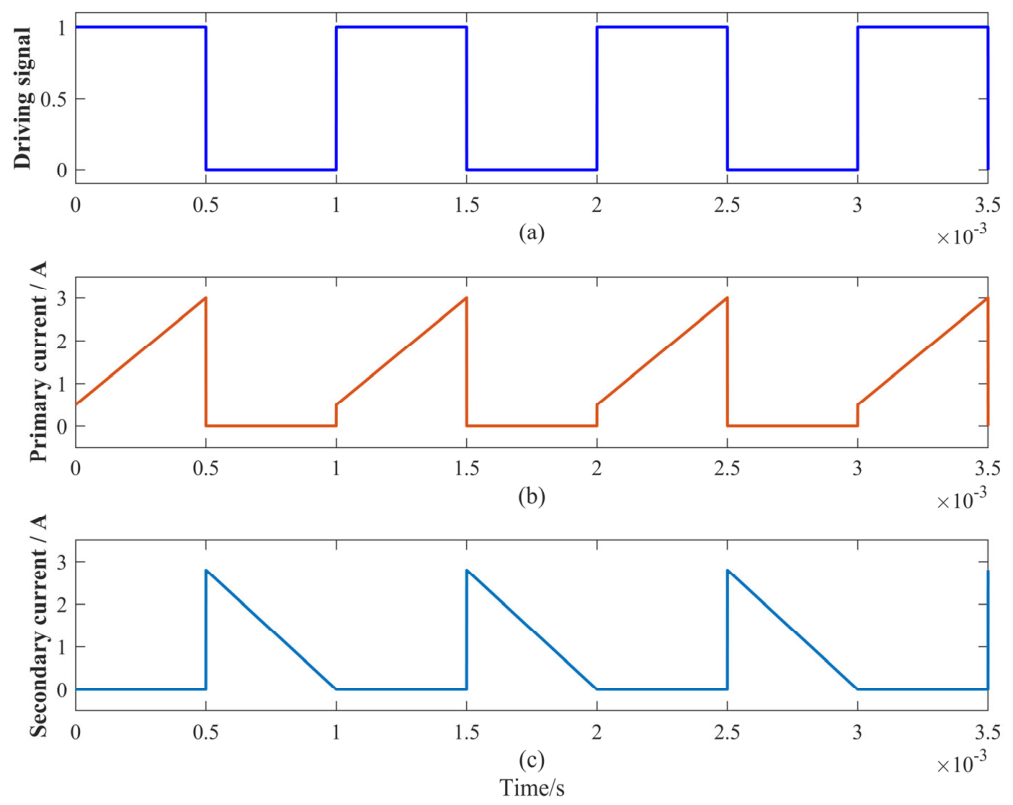
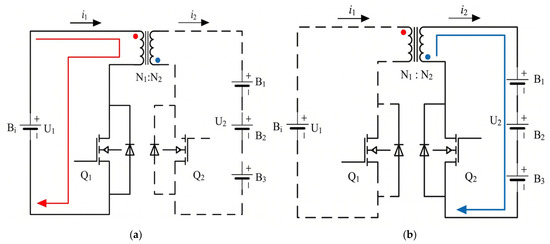
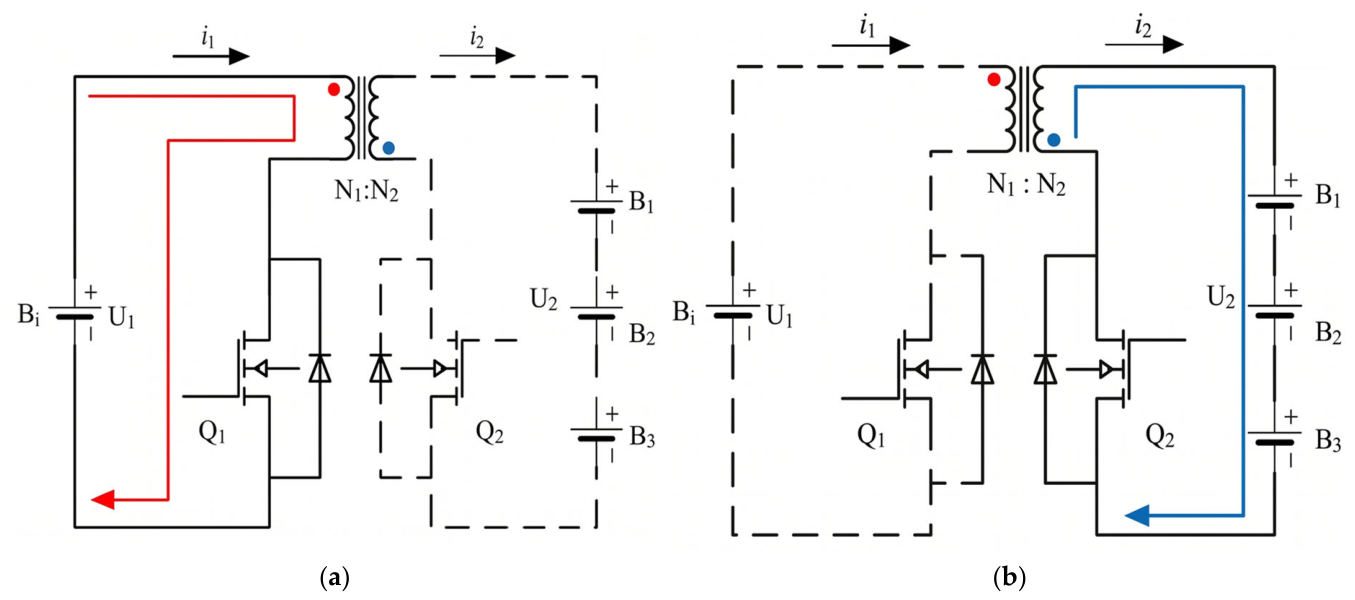
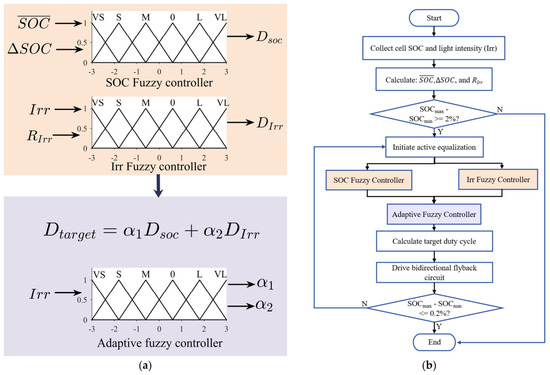
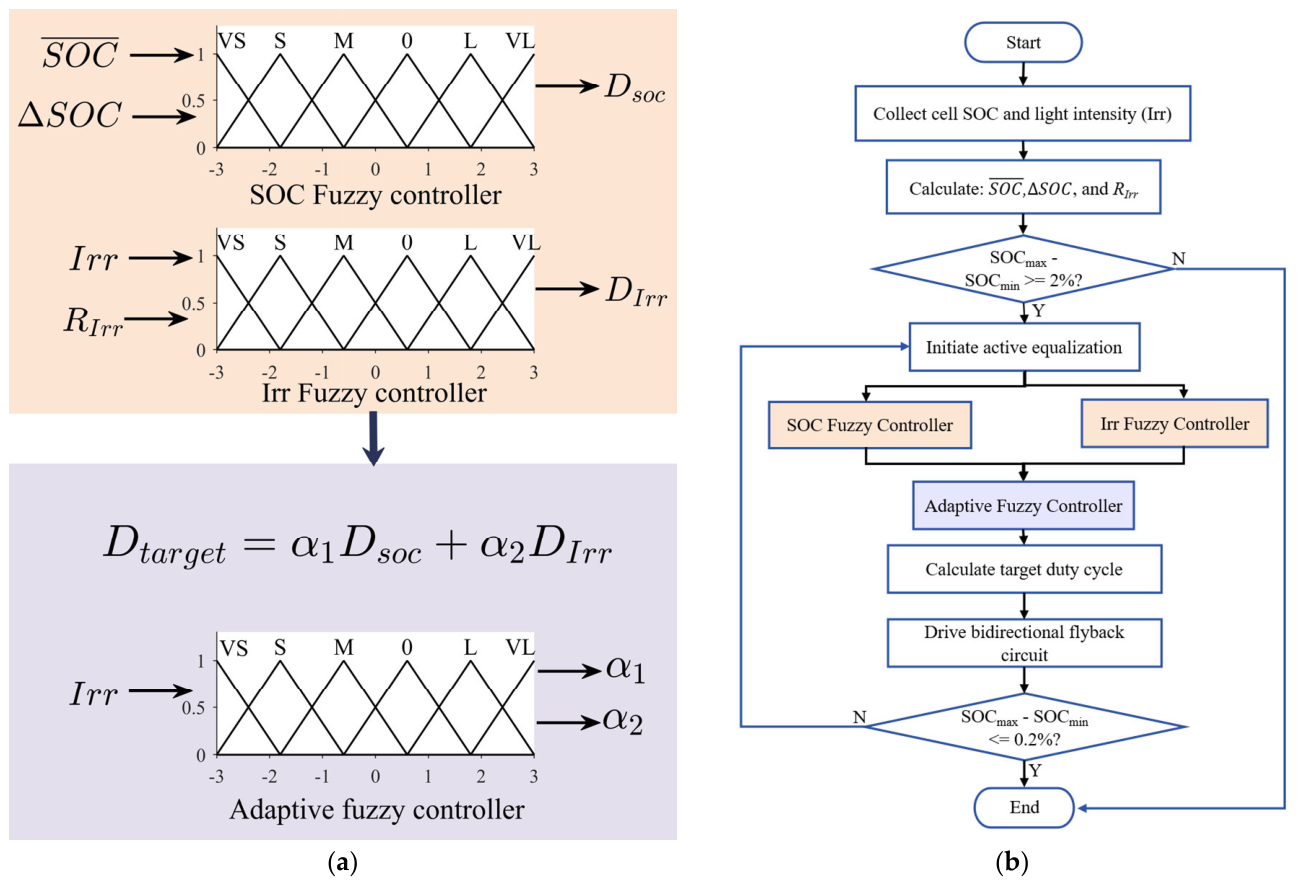
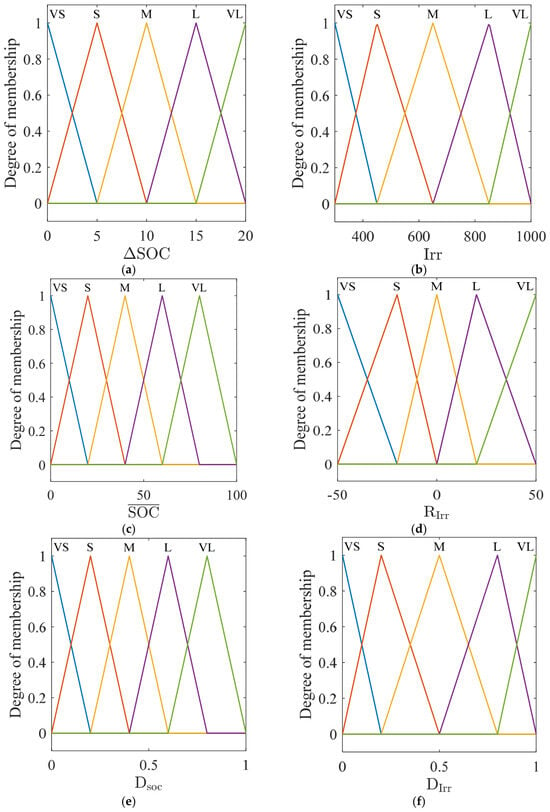
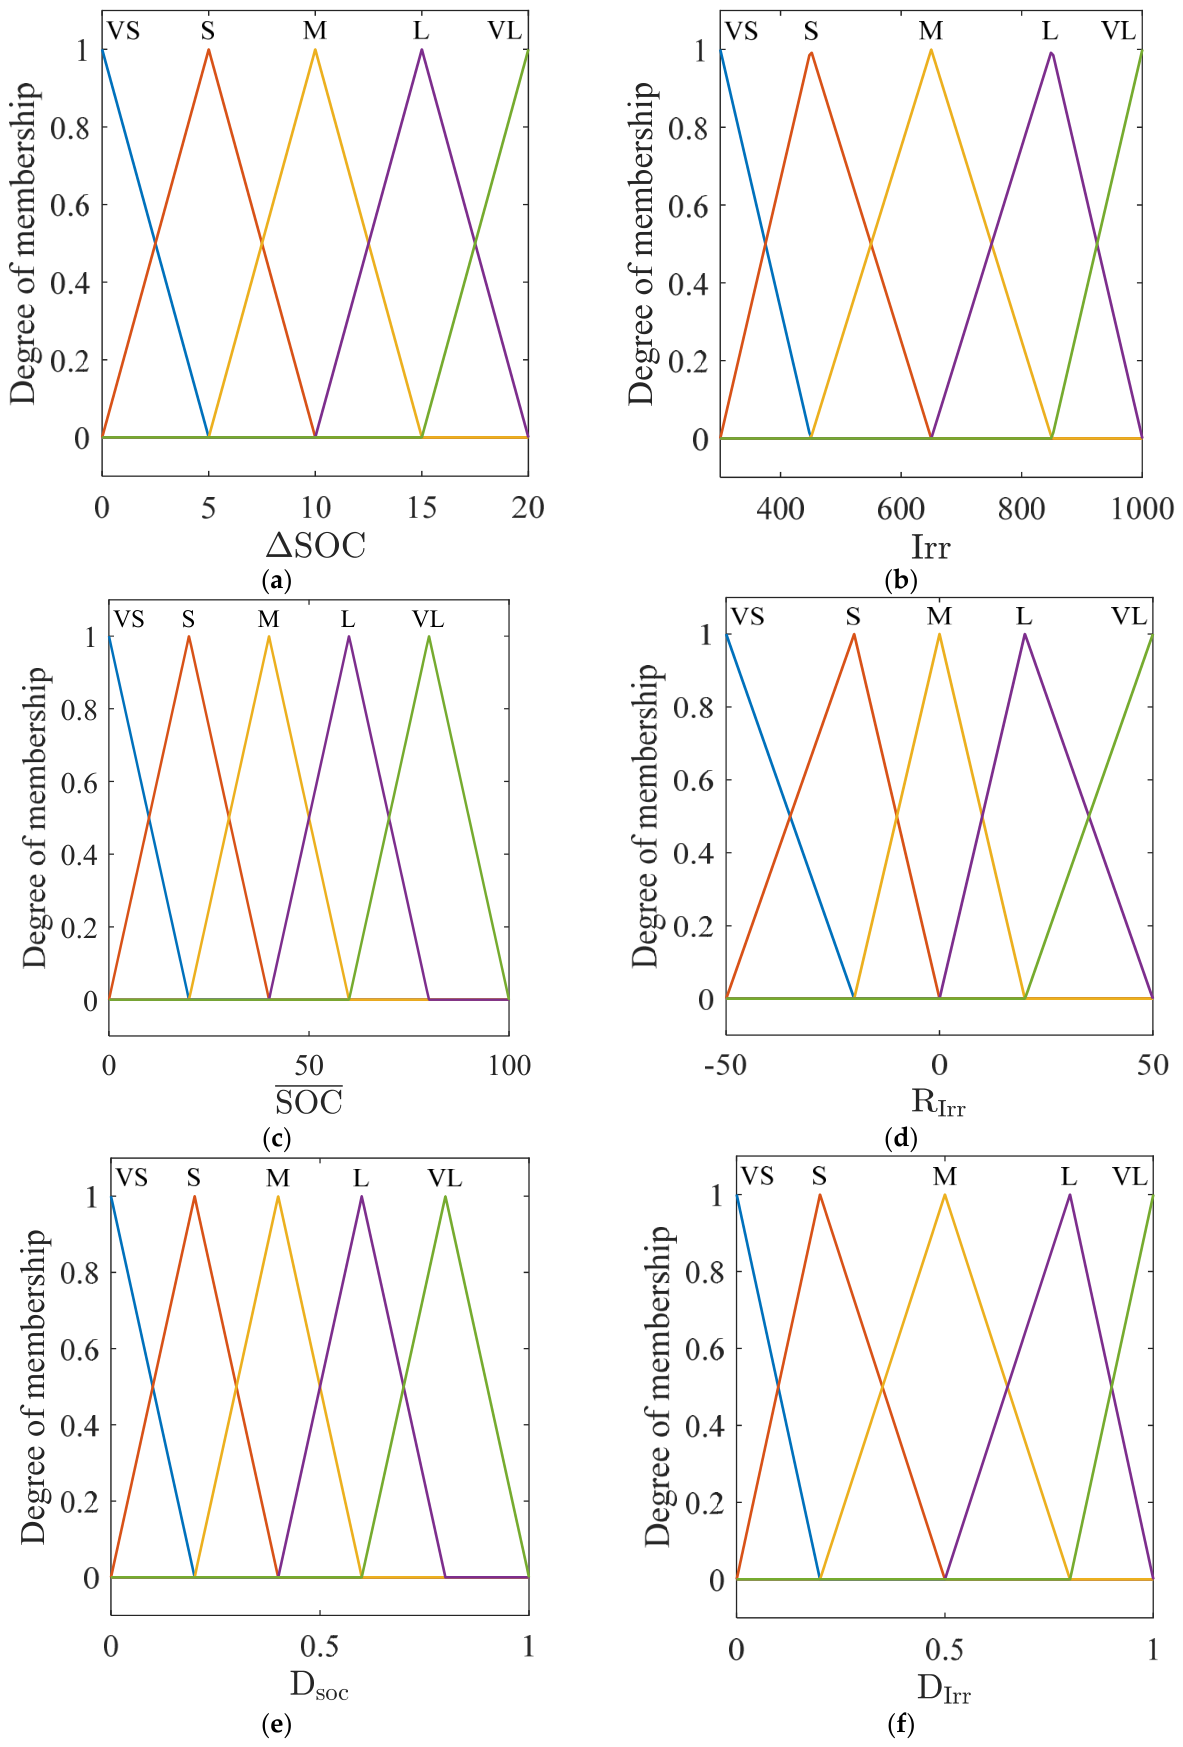
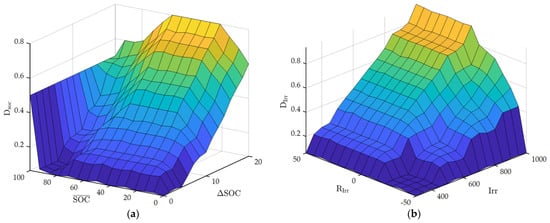
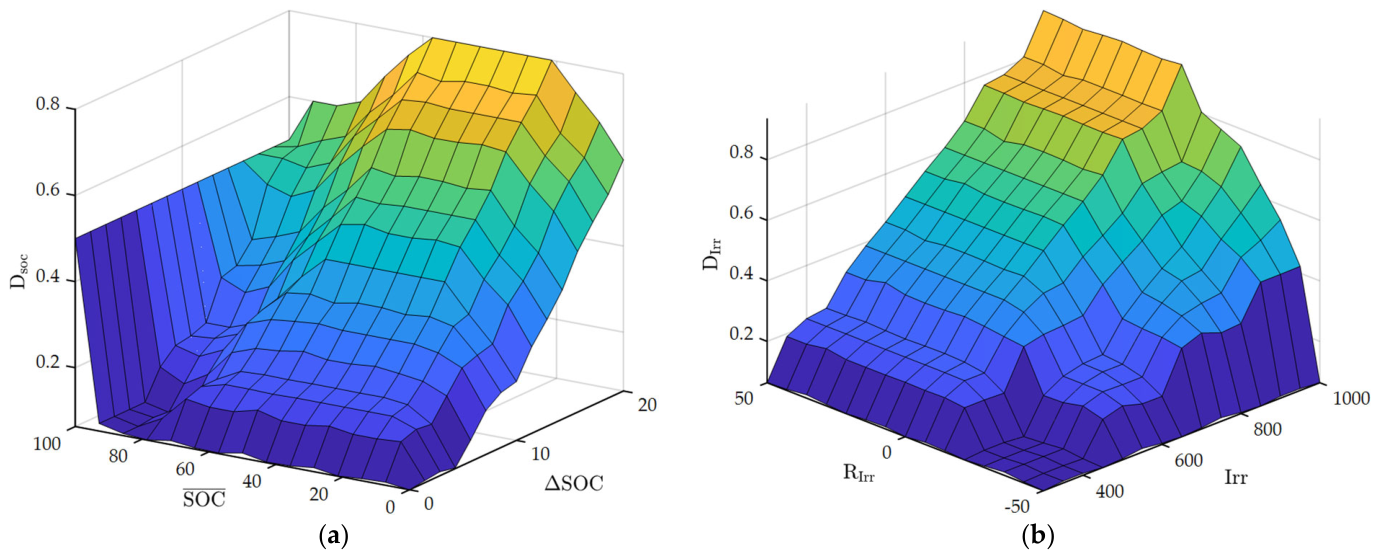
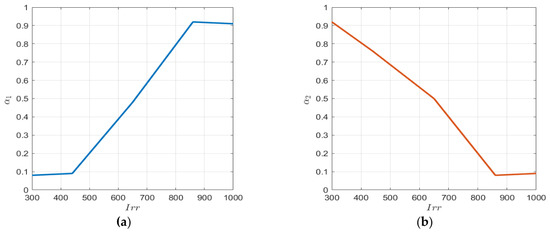
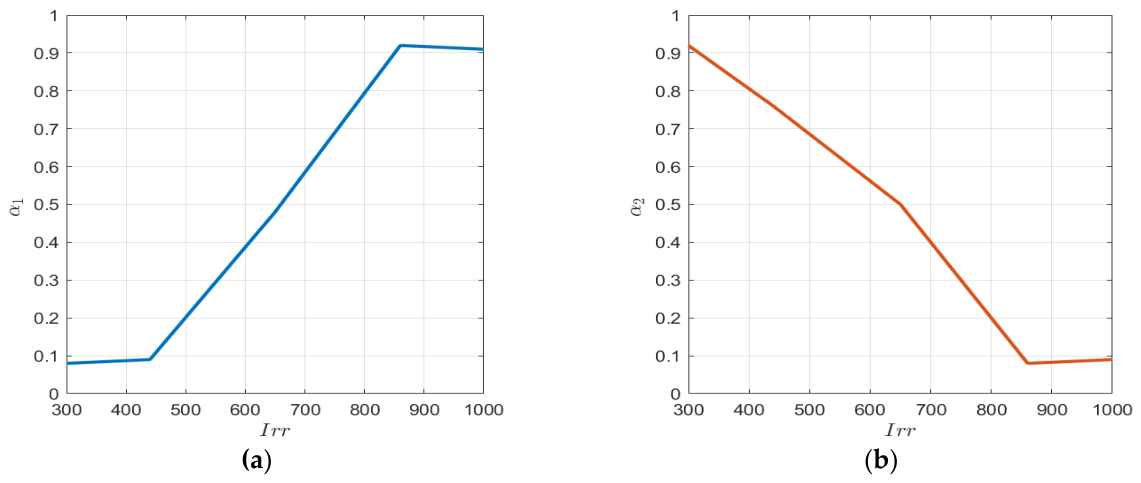
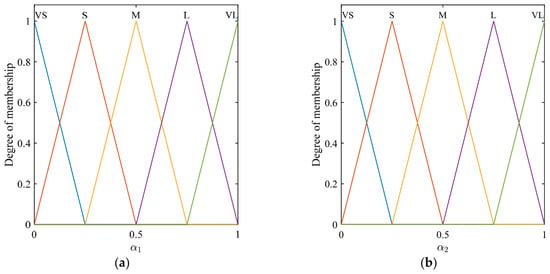
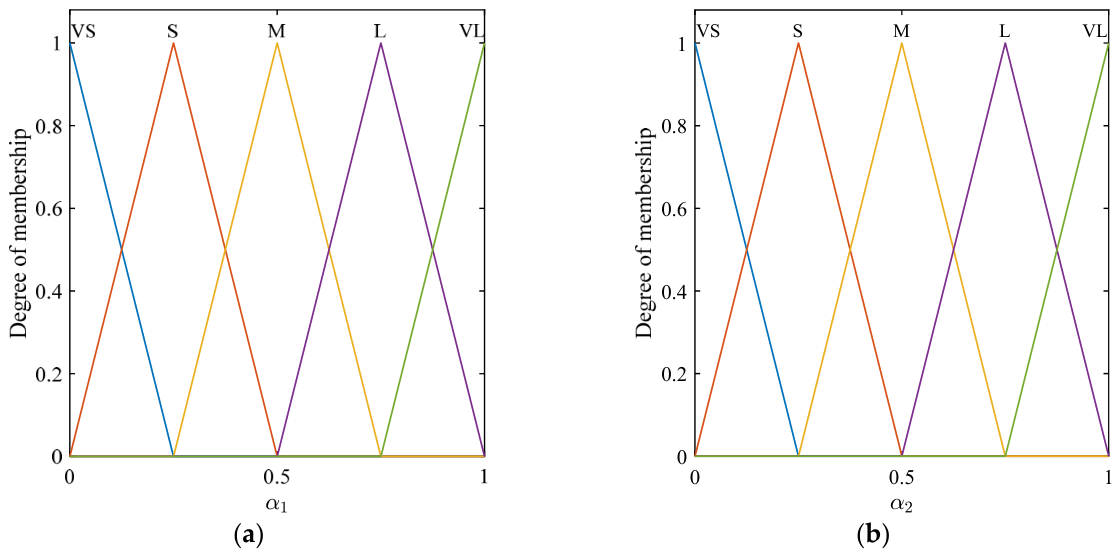
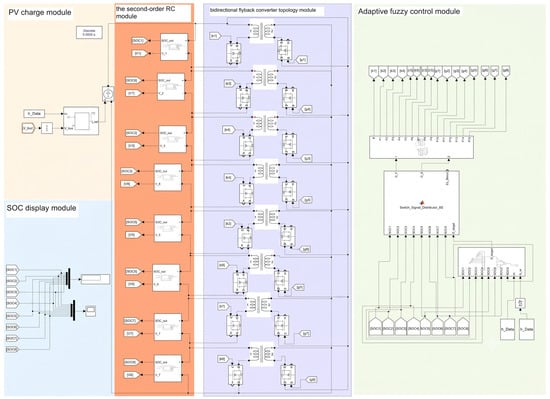
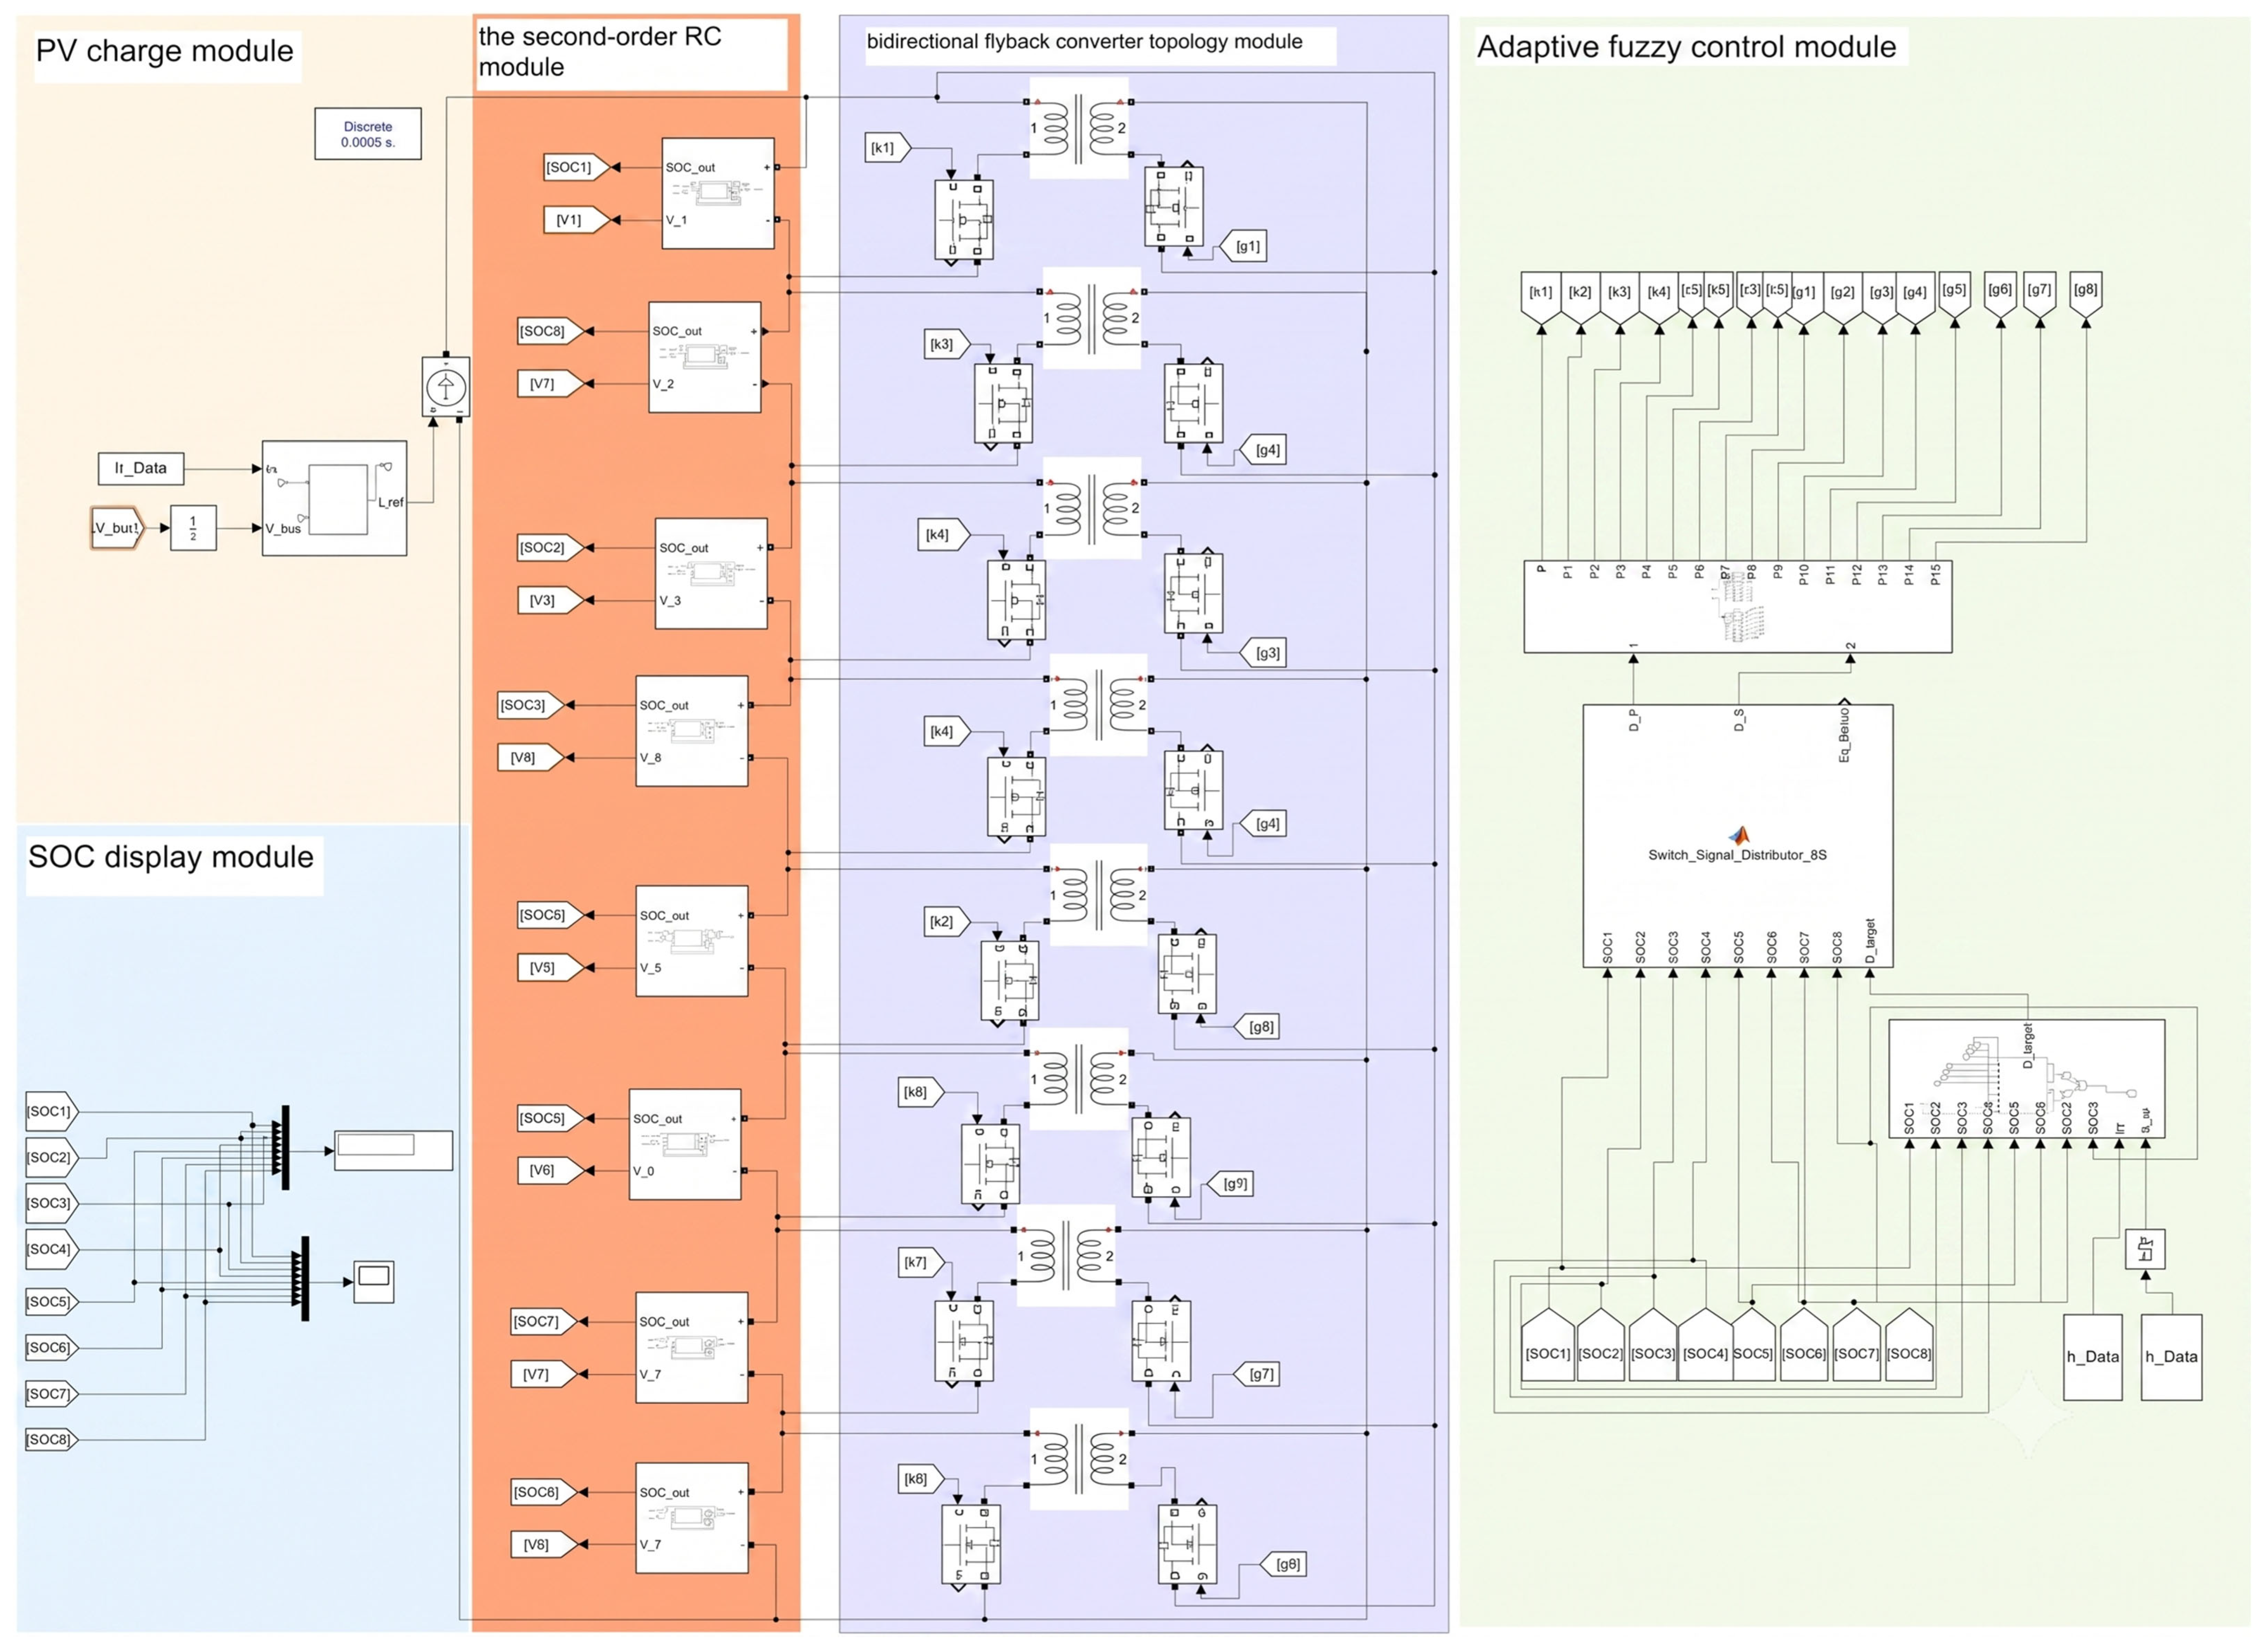
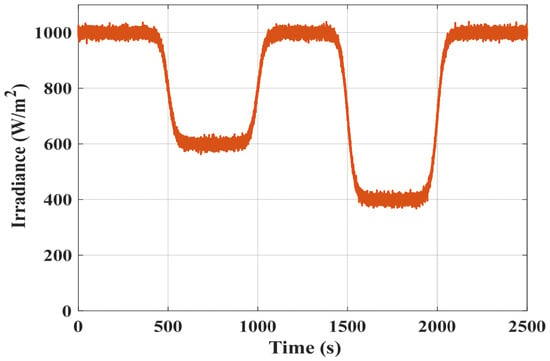
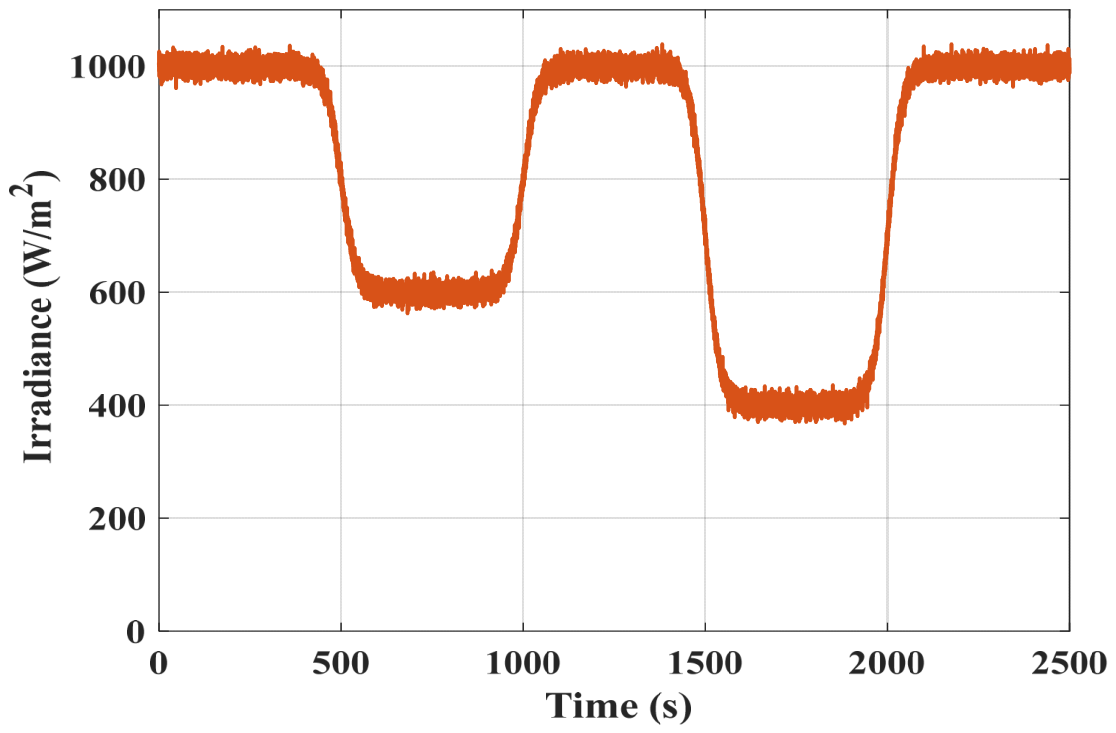
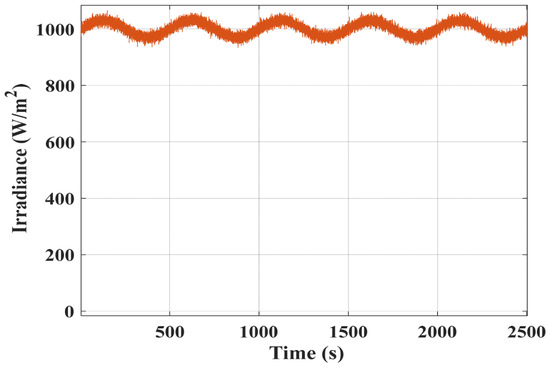
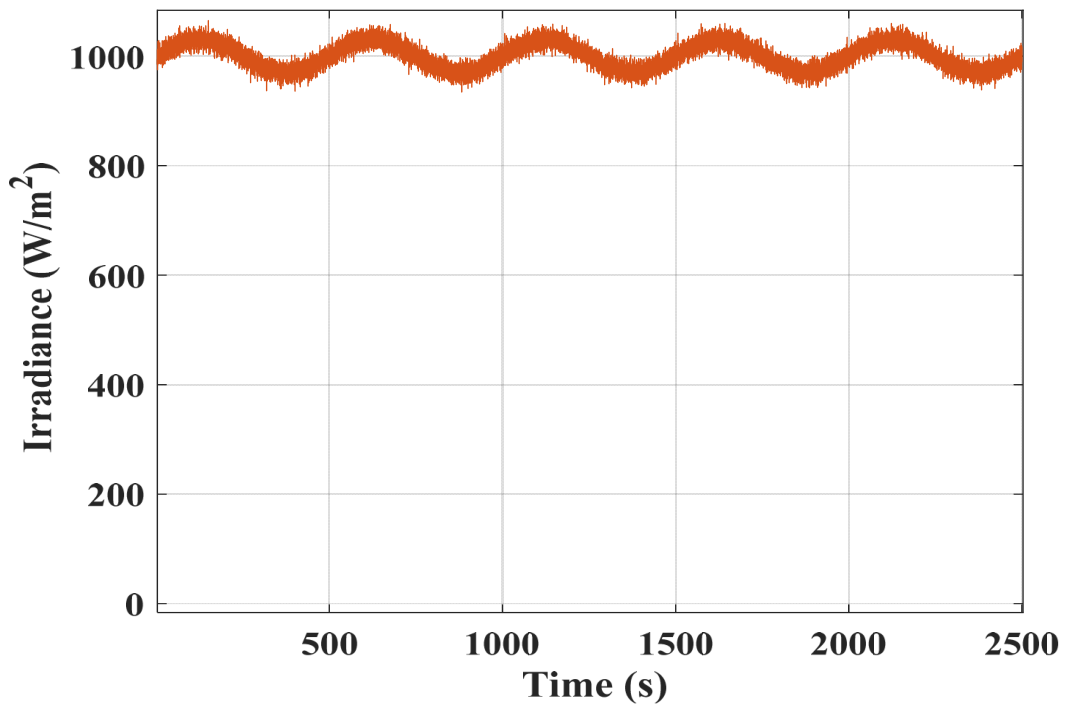
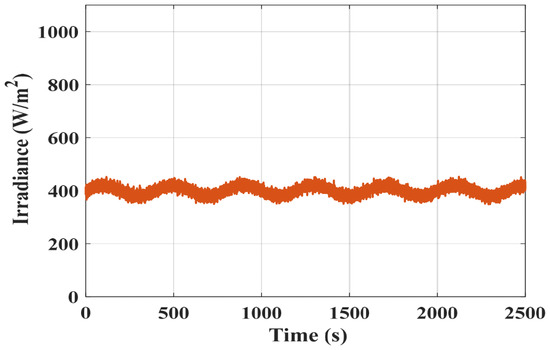
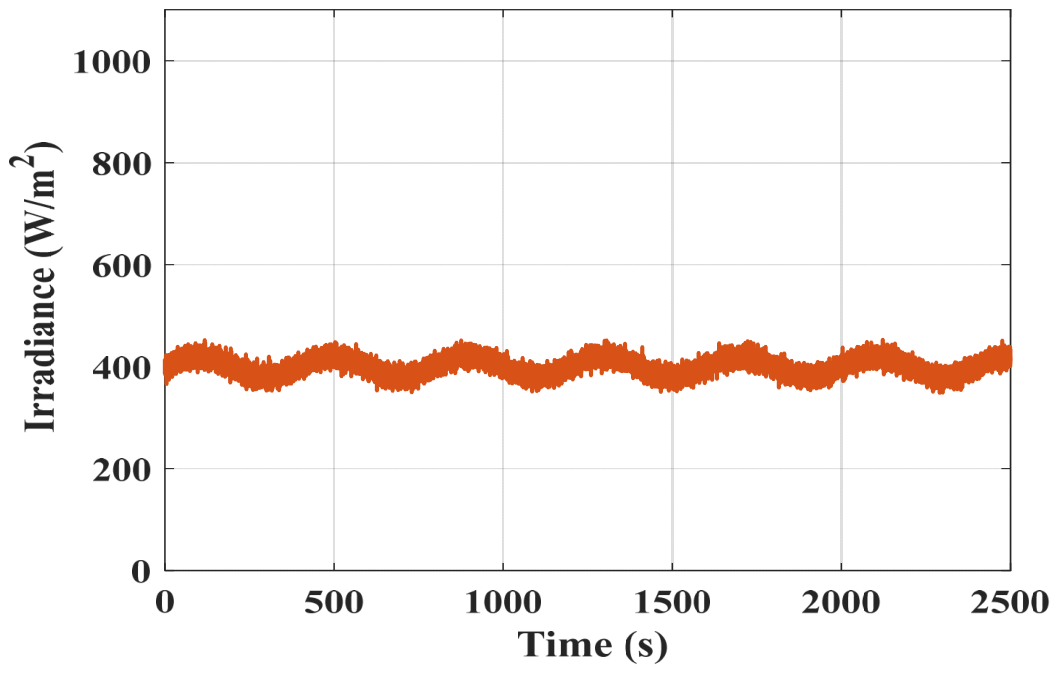
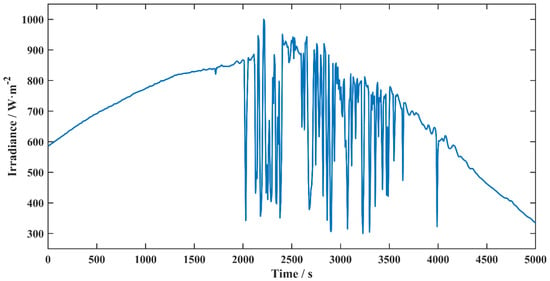
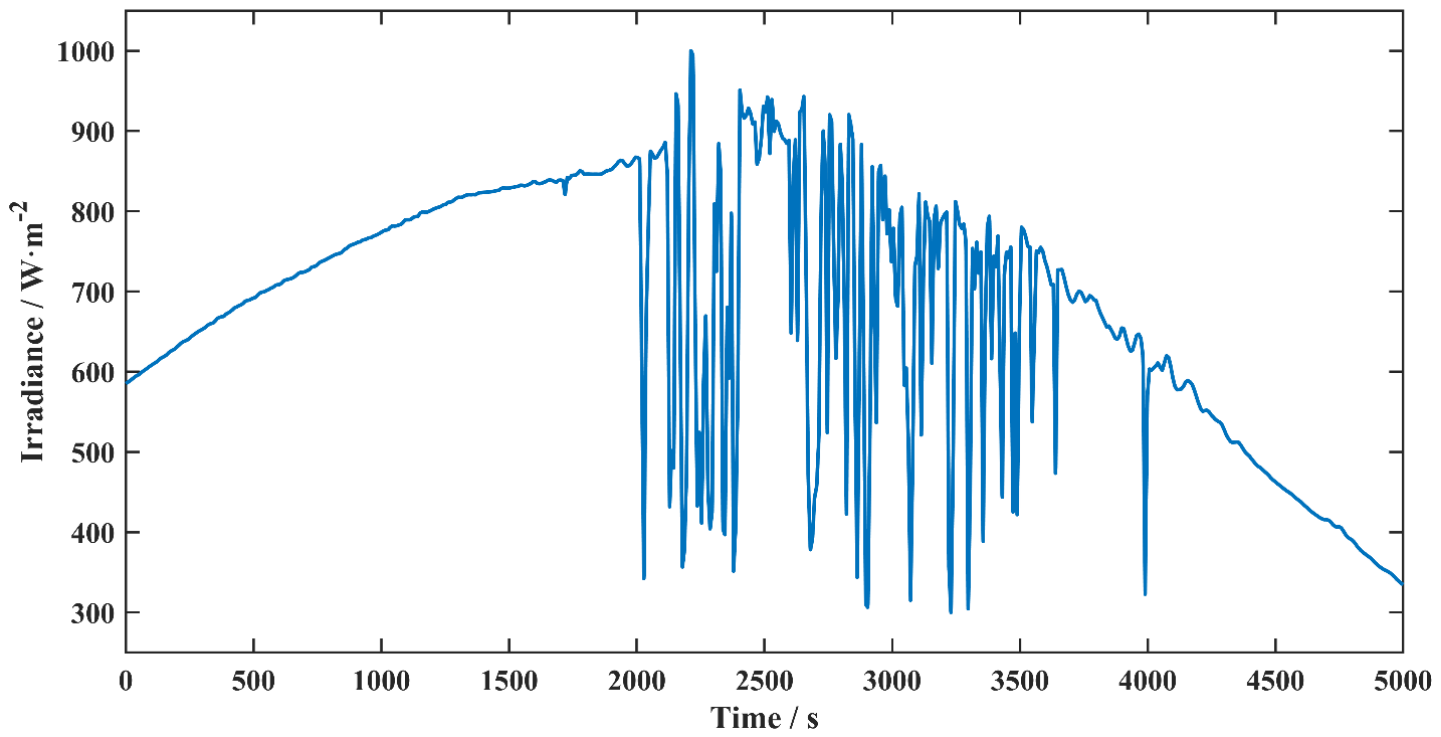
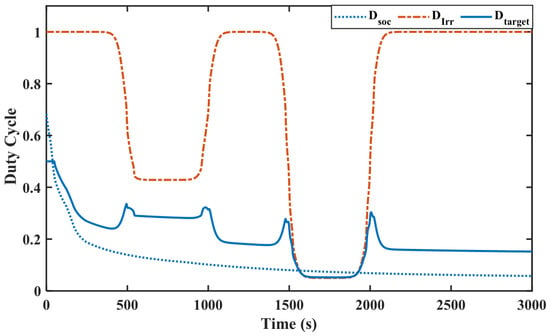
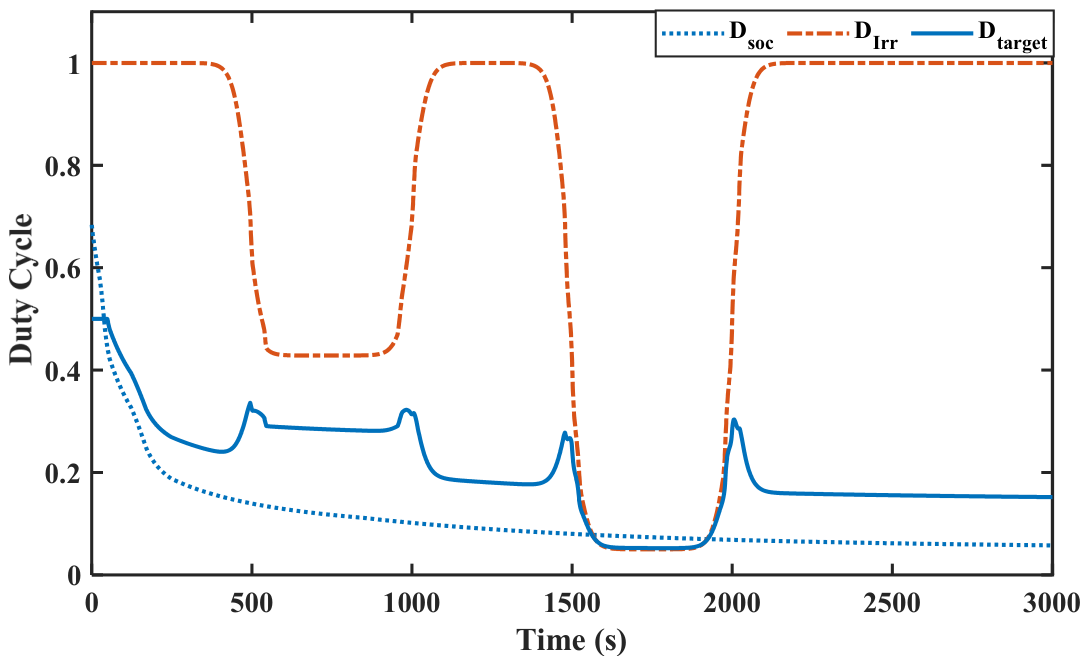
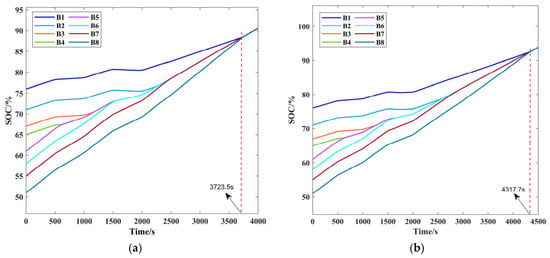
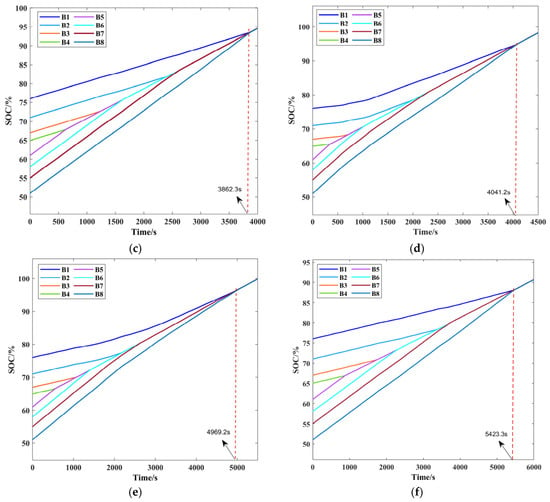
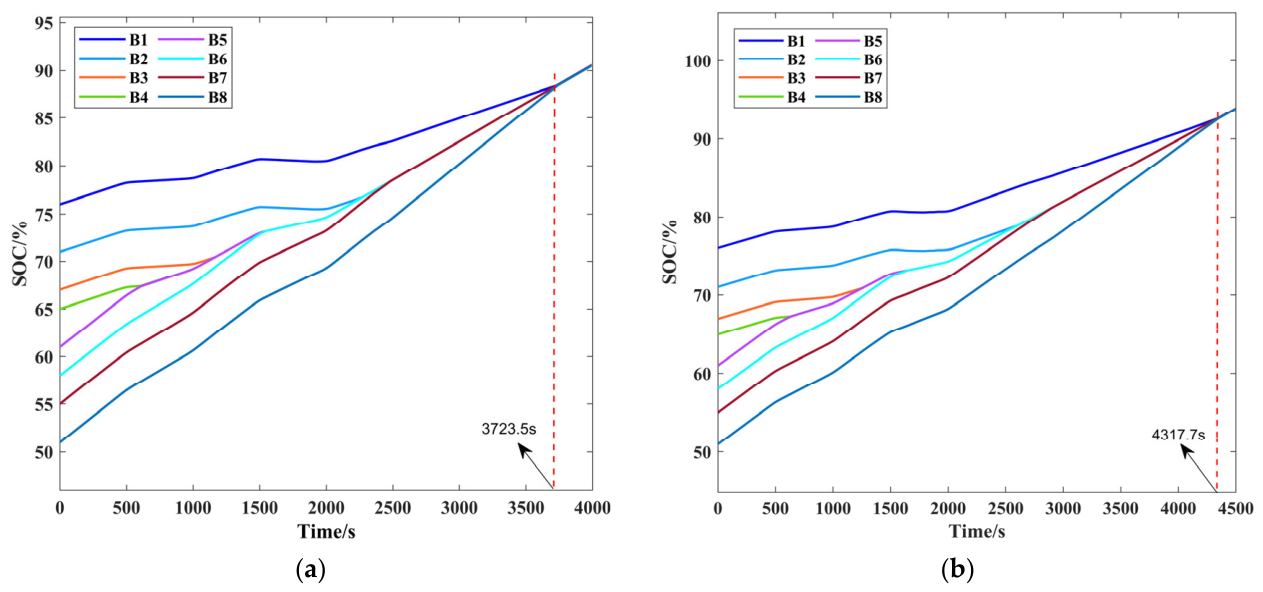
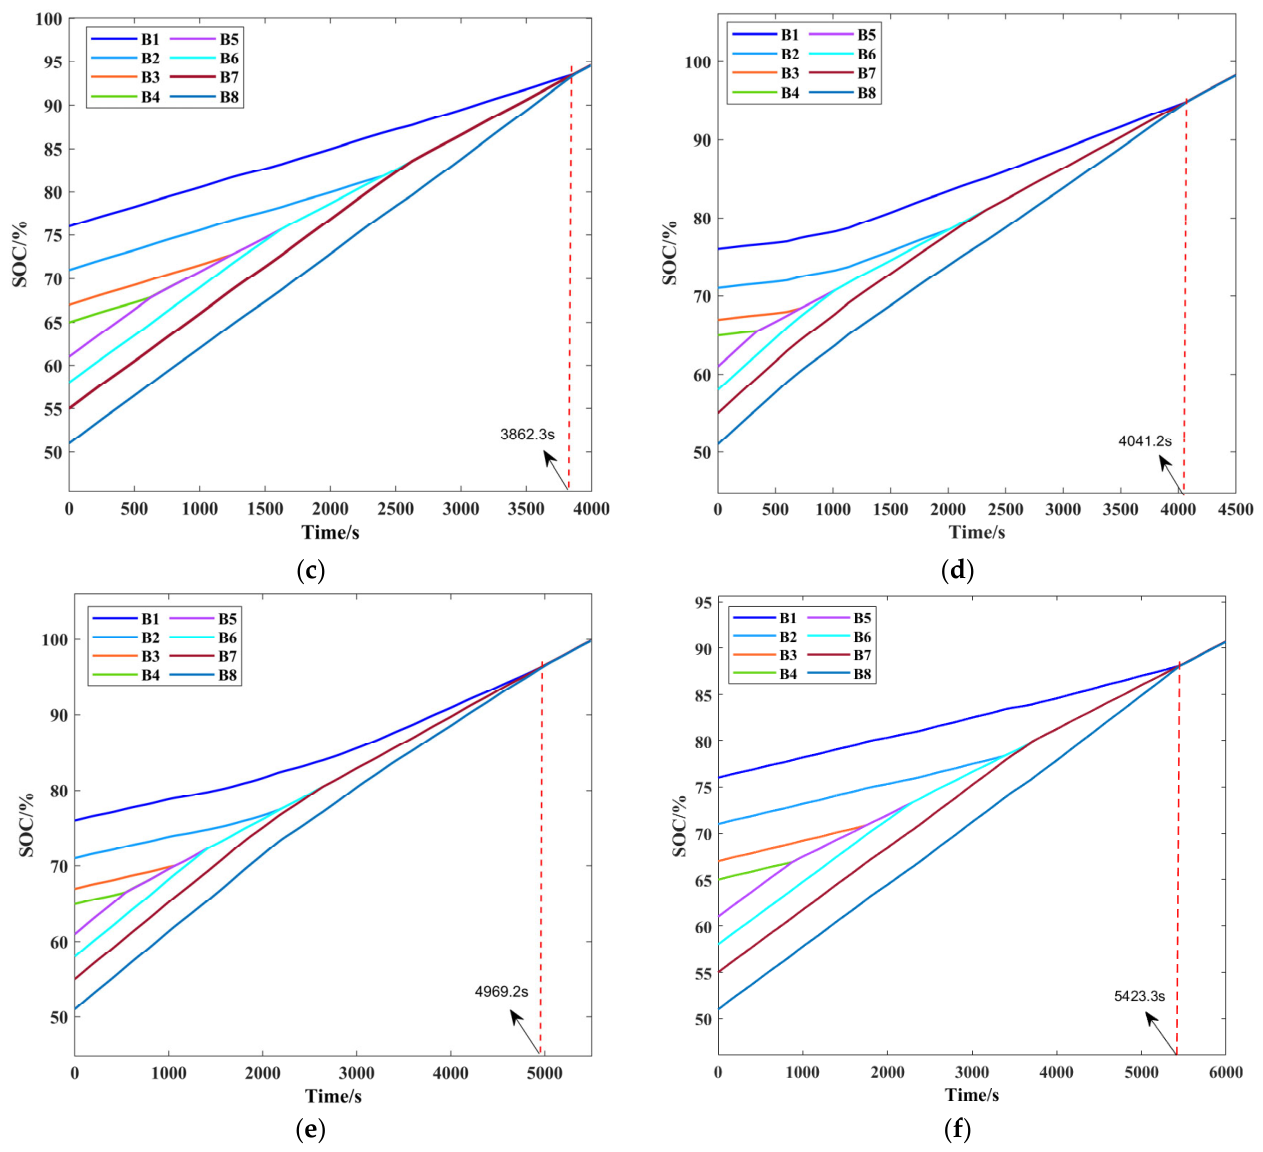
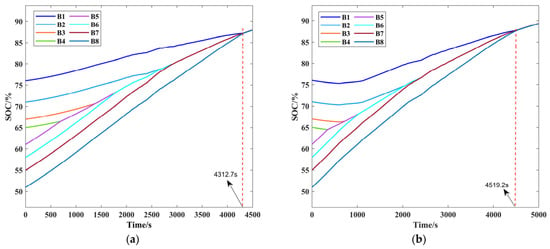
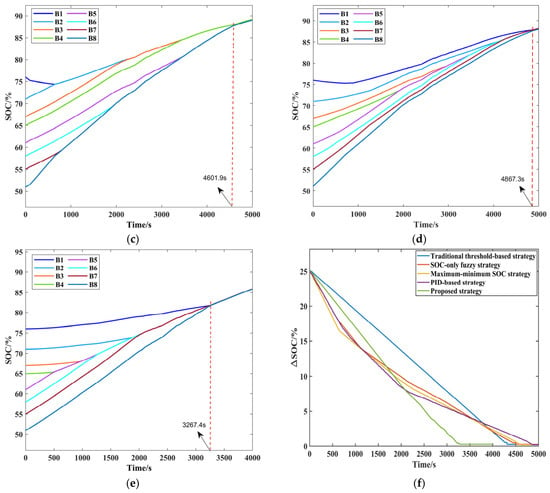
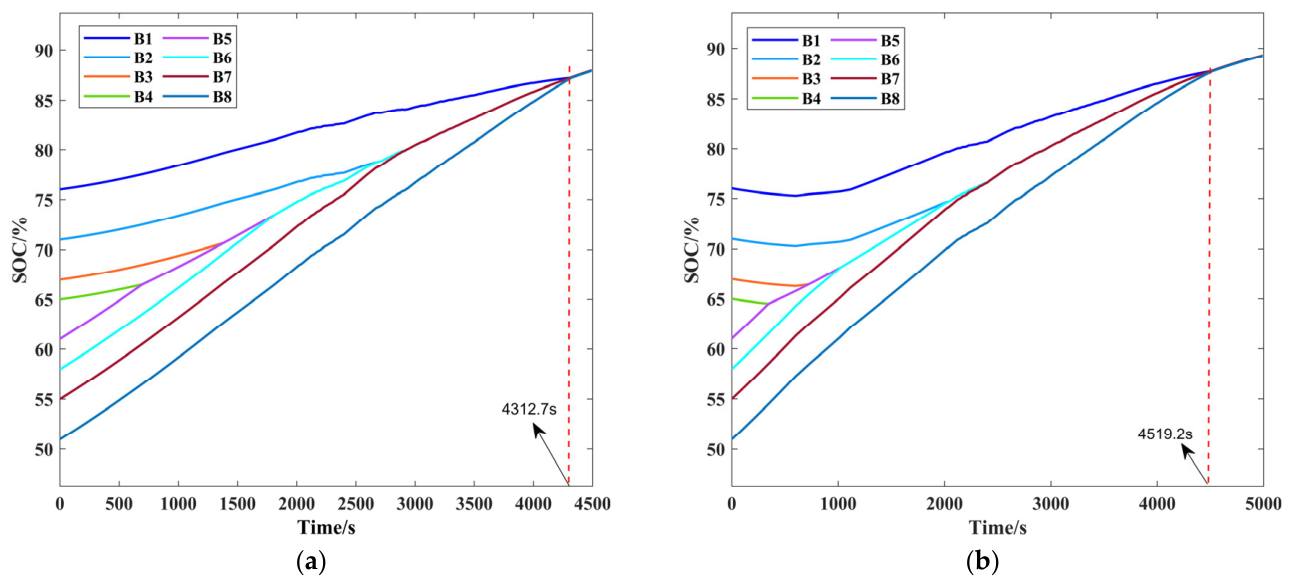
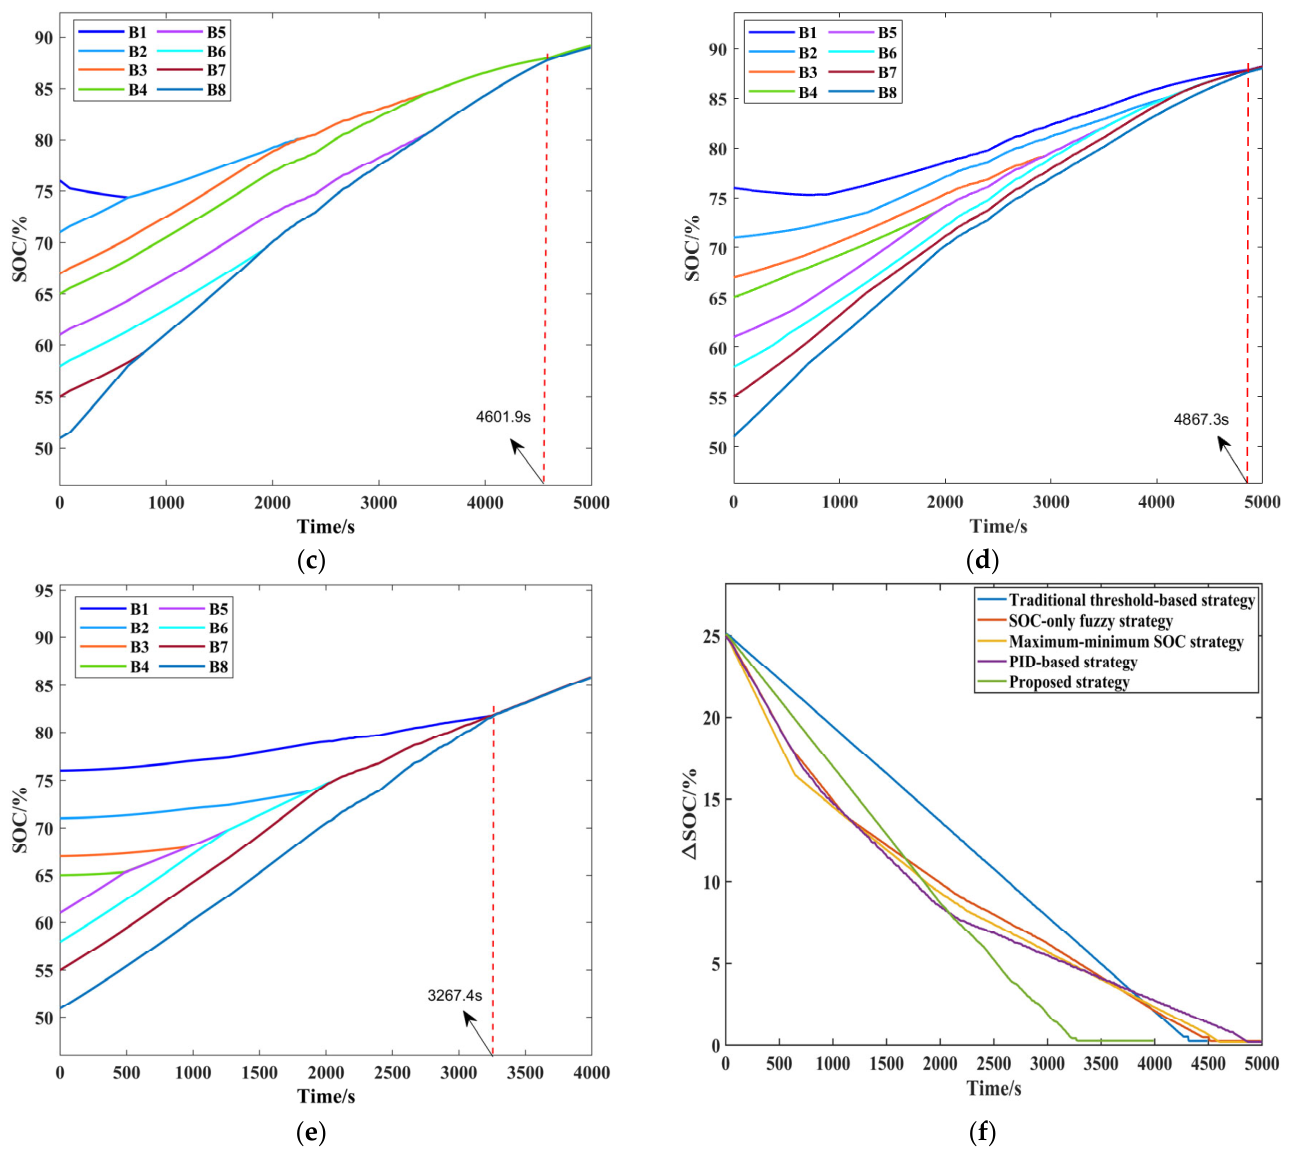

Disclaimer/Publisher’s Note: The statements, opinions and data contained in all publications are solely those of the individual author(s) and contributor(s) and not of MDPI and/or the editor(s). MDPI and/or the editor(s) disclaim responsibility for any injury to people or property resulting from any ideas, methods, instructions or products referred to in the content. |
© 2026 by the authors. Licensee MDPI, Basel, Switzerland. This article is an open access article distributed under the terms and conditions of the Creative Commons Attribution (CC BY) license.