Article

Multi-Scale Degradation Trend Perception for Voltage Degradation Prediction of Proton Exchange Membrane Fuel Cells


1
School of Electrical Engineering and Automation, Harbin Institute of Technology, Harbin 150001, China
2
State Grid Heilongjiang Electric Power Research Institute, Harbin 150030, China
3
School of Electrical Engineering, Yanshan University, Qinhuangdao 066004, China
4
Department of Electrochemical and Hydrogen Technologies, National Research Center “Kurchatov Institute”, Moscow 123182, Russia
5
Department of Chemistry and Electrochemical Energy, National Research University “Moscow Power Engineering Institute”, Moscow 111250, Russia
6
Laboratory for Aliphatic Organoboron Compounds, A.N. Nesmeyanov Institute of Organoelement Compounds of Russian Academy of Sciences, 28–1 Vavilova St., Moscow 119334, Russia
7
HySA Infrastructure Center of Competence, Faculty of Engineering, North-West University, Potchefstroom 2531, South Africa
8
Suzhou Research Institute, Harbin Institute of Technology, Suzhou 215104, China
*
Authors to whom correspondence should be addressed.
Batteries 2026, 12(7), 262; https://doi.org/10.3390/batteries12070262
Submission received: 17 June 2026 / Revised: 13 July 2026 / Accepted: 17 July 2026 / Published: 19 July 2026

Abstract

Precise prediction of voltage degradation is critical for the prognostics and health management of proton exchange membrane fuel cells (PEMFCs). The performance degradation of PEMFCs is governed by a complex coupling of multiple physicochemical mechanisms, including catalyst layer and proton exchange membrane degradation. Crucially, these internal degradation processes evolve across highly heterogeneous time scales, ranging from transient high-frequency fluctuations to low-frequency and long-term irreversible performance fade. Conventional predictive models, which typically rely on single-scale architectures or fixed receptive fields, are inherently ill-equipped to simultaneously decouple and capture these cross-scale temporal dynamics. To tackle this challenge, this paper innovatively proposes a multi-scale deep learning framework that integrates a multi-scale degradation trend perception module, a long short-term memory (LSTM)-based encoder–decoder architecture, and a multi-head attention mechanism. One-dimensional convolutional layers with different kernel sizes are employed to simultaneously extract local temporal features at multiple granularities, followed by the LSTM encoder–decoder to model long-range temporal dependencies, while the cross-attention mechanism dynamically allocates attention across the encoded context at each autoregressive decoding step. Experimental outcomes indicate that the proposed model realizes excellent predictive accuracy across five evaluation indices in comparison with standard baselines. In particular, the mean absolute percentage error (MAPE) reaches 1.6696%, and the maximum absolute percentage error (Max-APE) is strictly bounded within 5%, substantiating the reliability of the proposed framework for high precision and long-horizon health prognostics for PEMFCs.

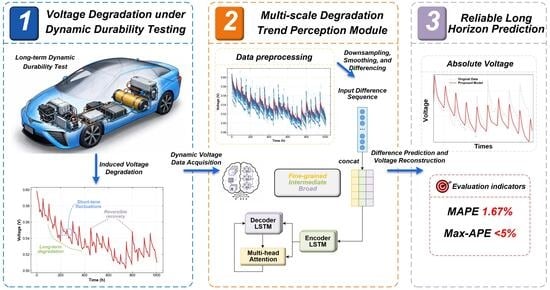
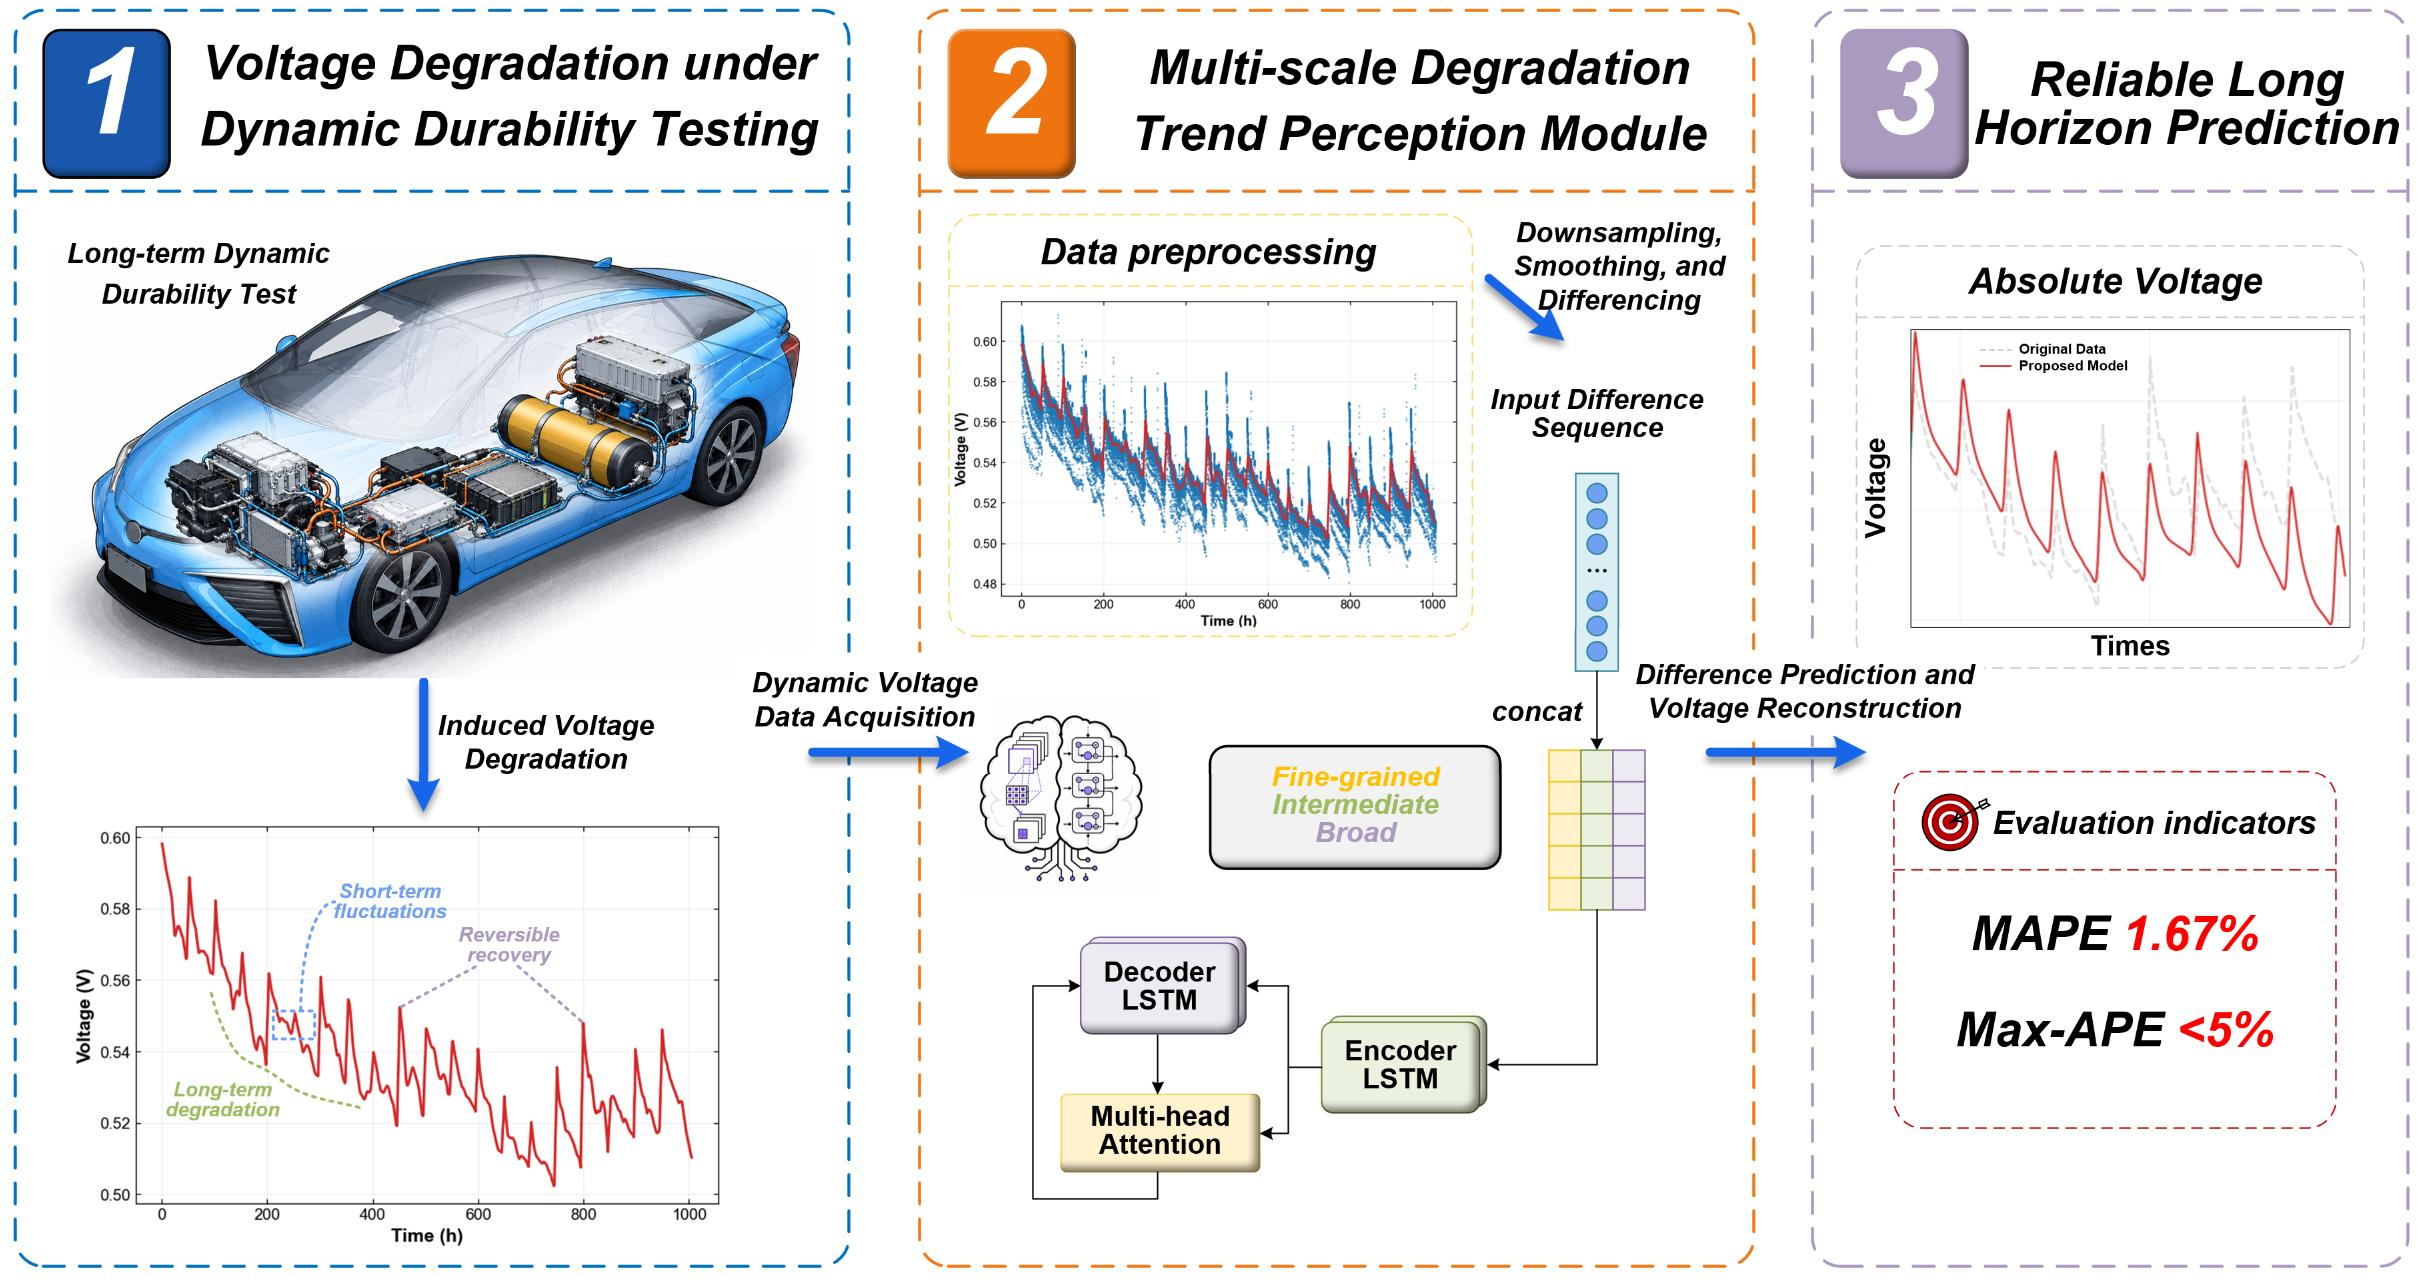
Graphical Abstract

1. Introduction

Proton exchange membrane fuel cells (PEMFCs) have stood out as one of the most promising clean energy conversion technologies, owing to their low operating temperature, rapid start-up capability, high power density, and zero local emissions [1,2]. A PEMFC is structurally characterized by the PEM separating the anode from the cathode [3]. Driven by the decarbonization of the transportation sector and decentralized energy supply, PEMFCs have evolved into a promising power source for passenger cars, heavy-duty vehicles, and stationary applications [4,5,6]. However, the long-term durability of PEMFCs remains a critical barrier to their widespread commercialization [7]. Electrochemical degradation mechanisms, including membrane aging, catalyst layer dissolution, and carbon support corrosion, lead to progressive performance deterioration over operational lifetimes [8,9,10], ultimately attaining the minimum threshold [11]. Consequently, accurate forecasting of the remaining useful life (RUL) and long-term degradation trajectory is paramount to condition monitoring and reliability assurance in practical fuel cell deployments [12,13].
Existing approaches to fuel cell degradation prediction can be sorted into data-driven, model-based, and hybrid methods [14,15]. Model-based methods construct physics-informed representations of degradation mechanisms, offering interpretability and extrapolation capability under well-characterized conditions [16]. For instance, Zhang et al. [17] proposed an innovative method built upon a semi-empirical model by introducing degradation models of a recovery factor and electrochemical surface area, which achieved accurate degradation trend prediction. Yang et al. [18] carried out health prediction built on the equivalent circuit model and electrochemical impedance spectroscopy (EIS). Messing et al. [19] established an empirical durability model by systematically decoupling the distinct degradation effects of start/stop and dynamic load cycles based on accelerated stress tests.
However, the complexity of multi-physics degradation processes makes it exceedingly challenging for analytical models to precisely extract long-term dynamic behaviors, particularly under volatile load profiles. By contrast, data-driven methods bypass the need for explicit mechanistic formulations by directly learning degradation patterns from historical operational data, thereby offering superior flexibility for practical applications [20,21,22].
Among data-driven methods, Tang et al. [23] integrated EIS with a gated recurrent unit, which provides a new paradigm for accurate and explainable PEMFC health prognostics. Lu et al. [24] took advantage of Bayesian optimization, enabling the prediction accuracy of the voltage trend to exceed 99%. Wu et al. [25] devised a time–frequency model, aiming to improve the accuracy of voltage decay prognosis across highly dynamic operational profiles, through the architectural fusion of 2D frequency-spectrum characteristics and 1D sequential memory mechanisms. Terrissa et al. [26] established a prognostic methodology centered on data-driven digital twin paradigms for the RUL prediction of PEMFCs. By leveraging stacked autoencoders to autonomously extract deep degradation features from limited non-linear operational profiles, this methodology successfully achieves high-accuracy health monitoring and robust aging trend projection.
The degradation of PEMFCs is attributed to the coupled evolution of multiple physicochemical mechanisms, including catalyst layer degradation, membrane aging, and electrochemical performance attenuation. These degradation phenomena exhibit pronounced temporal heterogeneity, characterized by the coexistence of short-term transient fluctuations and long-term irreversible degradation evolution across different temporal scales. Nevertheless, most existing prediction frameworks are predominantly developed based on single-scale learning paradigms or fixed receptive-field architectures, which limit their ability to effectively model the intrinsic cross-scale temporal dynamics governing PEMFC degradation processes.
To tackle these limitations, this paper develops an innovative data-driven multi-scale model for long-horizon voltage degradation prediction of PEMFCs. Empirical results verify that the predictive capability of the proposed model is considerably elevated. The primary merits of this research include:
  • An innovative deep learning architecture that intricately integrates a multi-scale degradation trend perception module is proposed by the integration of a long short-term memory (LSTM)-based encoder–decoder and a multi-head cross-attention mechanism.
  • The inherent limitations of conventional predictive models with fixed receptive fields are overcome, enabling the simultaneous capture of complex and multi-scale temporal dynamics inherent in voltage degradation.
  • Three parallel convolutional layers are designed to extract multi-scale local features from the voltage difference sequence, thereby capturing both short-term fluctuations and broader temporal patterns in the voltage response. By deploying varying kernel sizes, the model successfully decouples and extracts fine-grained short-term transient fluctuations and broader local degradation patterns. This strategy yields a comprehensively enriched and complementary feature representation before sequential modeling.
A multi-scale degradation trend perception module is developed to jointly extract fine-grained voltage fluctuations and broader local degradation patterns from the first-order voltage difference sequence. By integrating parallel convolutional branches with different receptive fields before temporal encoding, the proposed module overcomes the limitation of single-scale feature extraction and provides a more comprehensive representation of PEMFC degradation dynamics.
To facilitate a clear presentation, the subsequent text is partitioned into several segments. Section 2 details the experimental dataset and the dynamic load durability test. Section 3 delineates the proposed multi-scale degradation trend perception module and attention-based framework. Section 4 elaborates on the experimental verification, performance evaluation, and comparative analysis. Finally, Section 5 concludes this work and outlines future research directions.

2. Fuel Cell Dynamic Durability Test

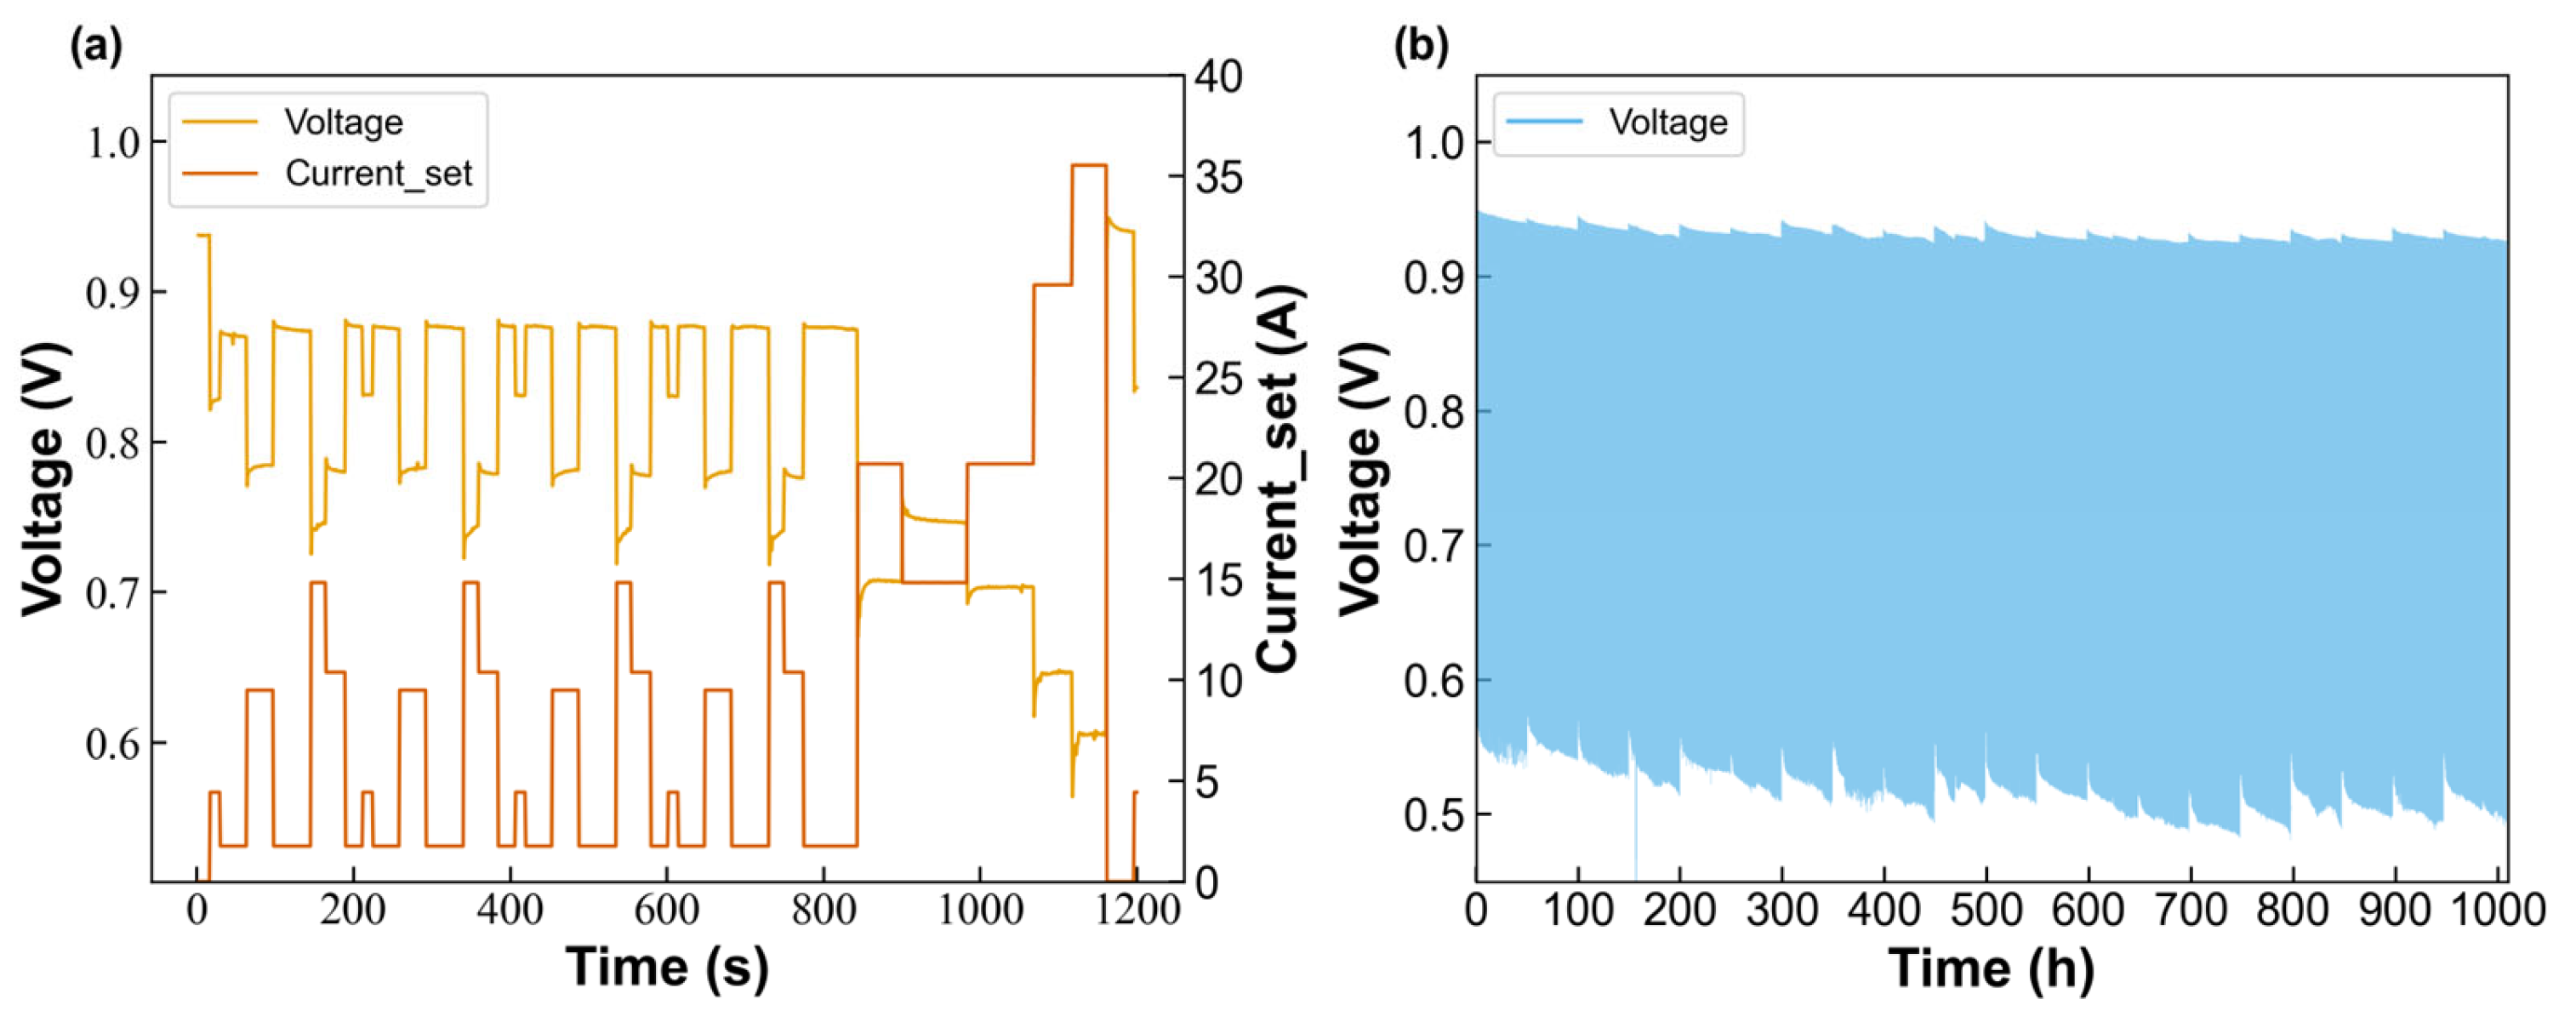
This study utilizes a long-term dynamic durability dataset of a single PEMFC, which was provided by the Clean Energy Automotive Engineering Center and College of Automotive and Energy Engineering of Tongji University [27,28]. The single PEMFC features a rated current of 35.6 A. To evaluate its durability, the European harmonized test protocol was introduced as an alternative testing framework. Under this protocol, the fuel cell dynamic load cycle (FC-DLC) was specifically developed based on the New European Driving Cycle (NEDC, ECE R15) to effectively simulate dynamic automotive operations. Figure 1a shows the current load level in the first 1200 s, alongside the measured output voltage values. The test procedure [29] includes one extra-urban driving cycle and four urban driving cycles. The complete durability dataset comprises a total of 3076 consecutive FC-DLC cycles, with each cycle lasting approximately 1180 s, accumulating approximately 1008 h. The complete output voltage during the test is shown in Figure 1b. All data preprocessing, model development, and numerical analyses were performed using Python version in PyCharm 2025.3 (JetBrains s.r.o., Prague, Czech Republic).
It should be noted that the current profile shown in Figure 1a was not directly used as an input variable of the proposed model. The current profile was used to describe the operating conditions of the PEMFC dynamic durability test. The original dataset was collected under variable operating conditions, during which the fuel cell experienced a large number of dynamic load cycles. Therefore, the degradation behavior contained in the voltage data was affected by the variable-load operating history.

3. Method

3.1. Model Architecture

PEMFC degradation is governed by the coupled evolution of multiple physicochemical processes, including catalyst layer deterioration, membrane aging, and electrochemical performance attenuation. These degradation dynamics exhibit significant temporal heterogeneity, where short-term transient fluctuations and long-term irreversible degradation evolution coexist across different temporal scales. To effectively characterize such multi-scale degradation behaviors, a multi-scale degradation evolution perception framework is developed to enhance the representation capability of heterogeneous temporal features.
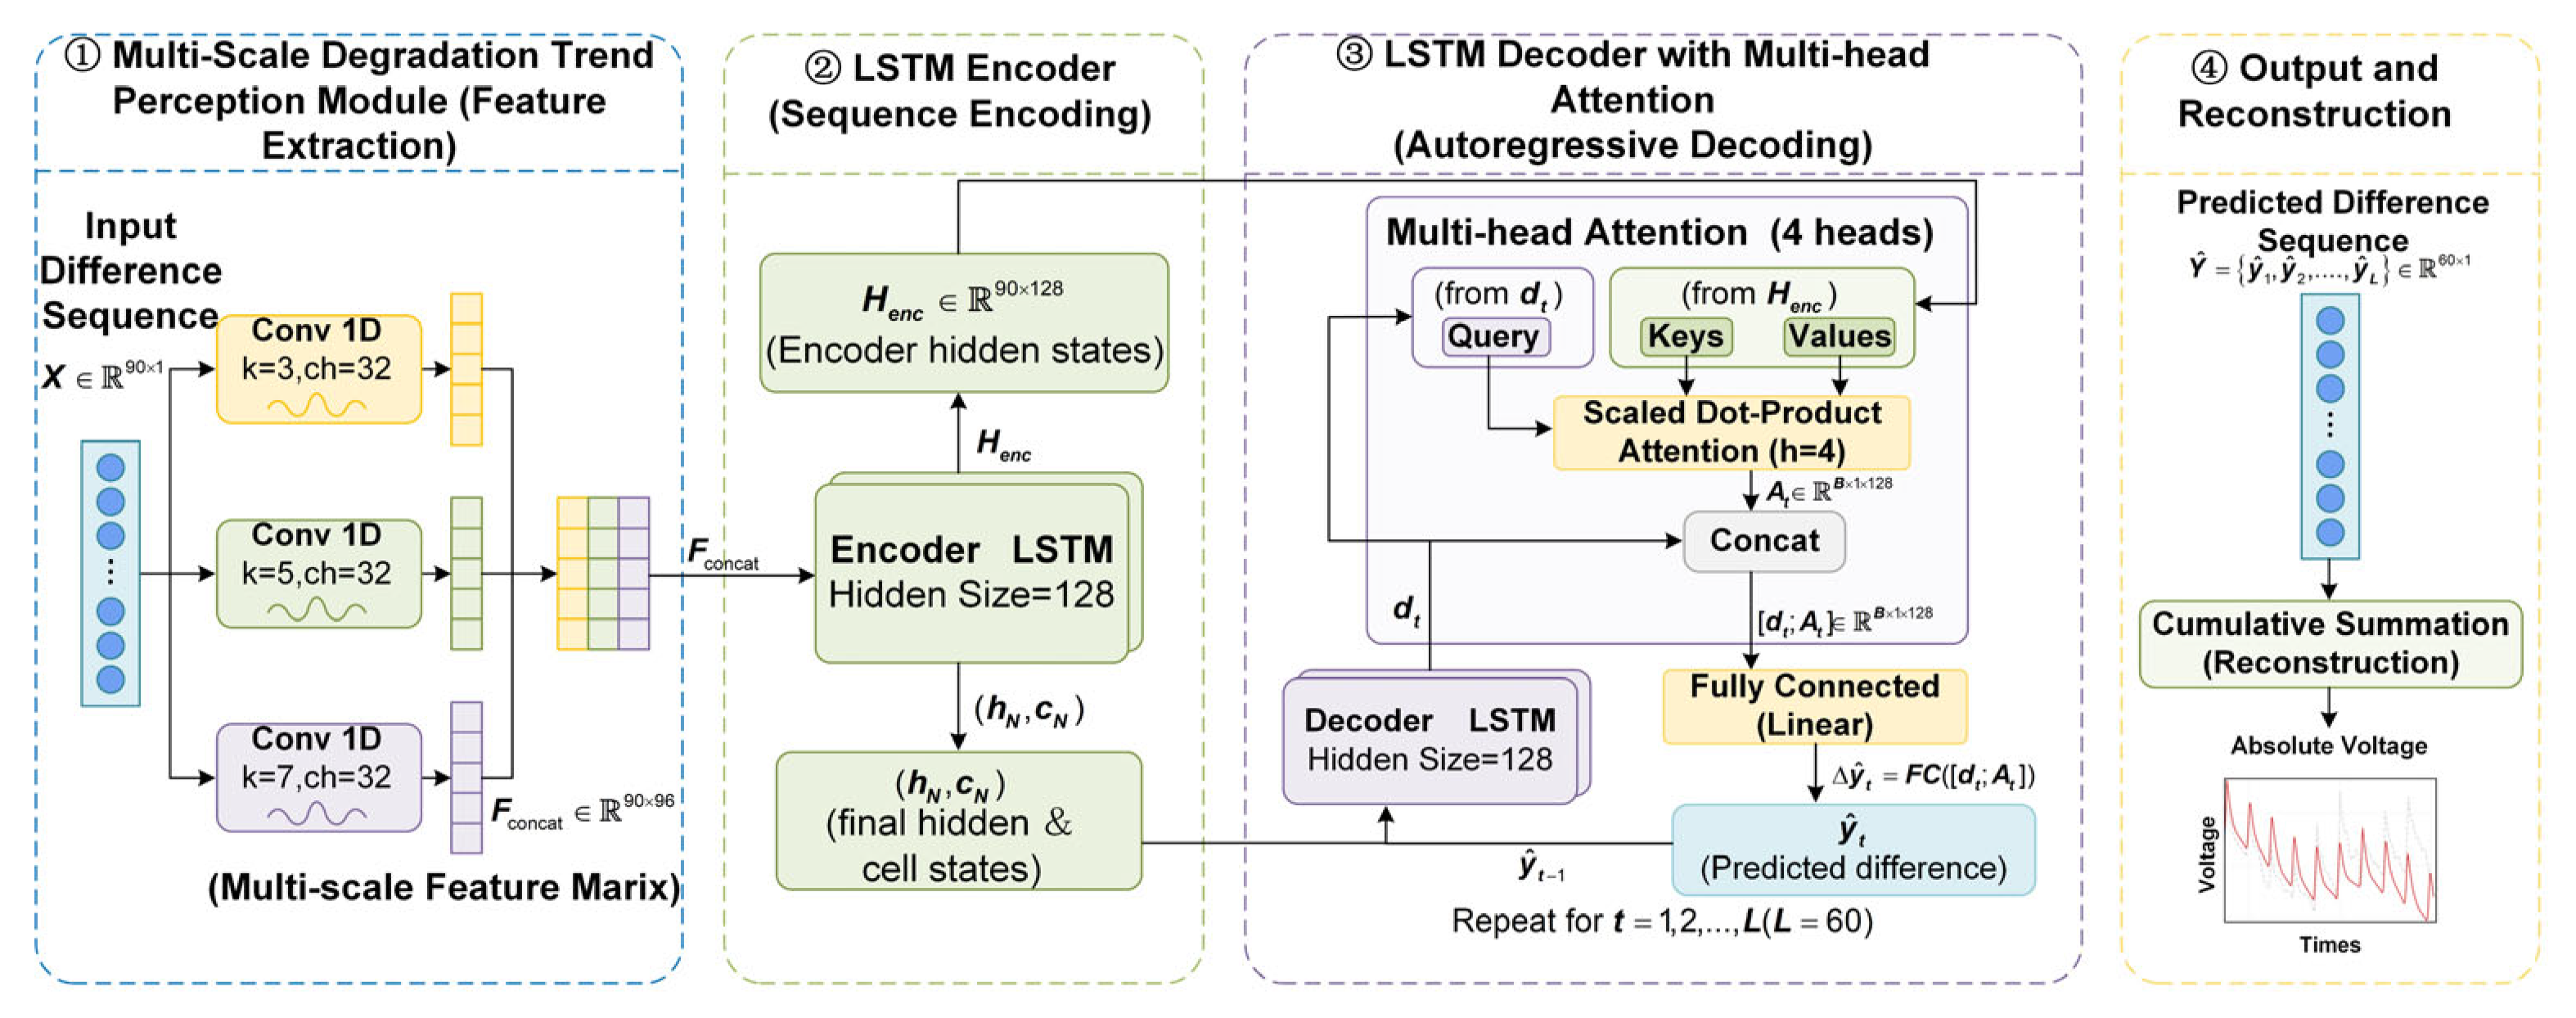
Figure 2 provides a detailed visualization of the proposed modeling paradigm. The model takes a difference sequence of length T = 90 as input, denoted as X R 90 × 1 , and produces a predicted difference sequence of length L = 60 as output, denoted as y ^ 1 , y ^ 2 , , y ^ L . To construct the input sequence for the proposed network, the measured fuel cell voltage was transformed into a first-order difference sequence. The first-order difference operation reduces the influence of the long-term voltage decay and emphasizes local voltage variations between adjacent time steps. As a result, this input sequence enables the corresponding scale of the network to focus on fluctuations, rather than being dominated by the absolute voltage drop caused by long-term degradation. The data flow proceeds through the following four stages: (i) feature extraction via parallel convolutional kernels, (ii) sequence encoding via LSTM, (iii) autoregressive prediction via cross-attention with decoder, and (iv) voltage reconstruction via predicted sequences.
Firstly, the input sequence X is simultaneously fed into three parallel convolutional layers with kernel sizes of 3, 5, and 7, each producing 32 feature channels. The outputs of the three convolutional branches are fused across the channel axis, thereby yielding a comprehensive multi-scale feature matrix F concat , which serves as the input to the encoder. Secondly, the feature matrix F concat is processed by a two-layer LSTM encoder with a hidden size of 128. The encoder sequentially processes all 90 timesteps and produces two outputs: the full encoder hidden state sequence H enc , which is later used as the key and value source in the attention mechanism, and the final hidden and cell states h N   c N , which are passed to the decoder as its initial states. Thirdly, the decoder is a two-layer LSTM with a hidden size of 128, initialized with h N c N from the encoder. The decoder operates autoregressively for L = 60 steps. At each step t , the decoder takes the previous prediction y ^ t 1 as the input and generates the hidden state d t . This hidden state simultaneously serves as the query to the attention mechanism, while the output of encoder H enc provides the key and value. It should be emphasized that the multi-head cross-attention is computed between the decoder hidden state and the encoder output sequence, rather than between different convolutional scales. Through scaled dot-product attention with four parallel heads, the attention output A t is computed, dynamically weighting the encoder context most relevant to the current prediction step. Finally, at each decoding step t , the hidden state d t of the decoder and the attention output A t are concatenated and then passed through a fully connected layer to generate the prediction result y ^ t . The predicted value y ^ t is subsequently fed back as the input to the decoder at the next step, forming a closed-loop autoregressive prediction process. The above-mentioned procedure is repeated for 60 steps, yielding the complete predicted difference sequence, which is finally reconstructed into the voltage prediction curve.
The multi-scale degradation trend perception module is designed according to the multi-scale temporal characteristics of the PEMFC voltage degradation signal. Conventional single-scale convolution can only extract local features within a fixed receptive field, which may be insufficient to simultaneously represent fine-grained voltage fluctuations and broader local degradation patterns. To overcome this limitation, three parallel one-dimensional convolutional branches are employed to process the voltage difference sequence.
The smaller receptive field emphasizes short-term and fine-grained variations, while the larger receptive fields capture progressively broader local temporal patterns. The outputs of the three branches are concatenated along the channel dimension to form a unified multi-scale feature representation before being fed into the LSTM encoder. In this way, the module provides the encoder with complementary degradation information at different temporal scales and enhances the ability of the model to perceive complex local evolution patterns in the voltage sequence.
To ensure the reproducibility of the proposed framework and achieve optimal predictive performance, the hyperparameter configuration of the network was systematically optimized. Hyperparameters govern the capacity, convergence rate, and generalization ability of the deep learning models, thereby dictating their ability to extract the complex dynamics of the PEMFCs. A comprehensive compilation of the finalized hyperparameter specifications and training environment configurations is meticulously detailed in Table 1.
The choice of the input and output window lengths was based on comparative experimental results. Several combinations of input and output window lengths were tested under the same data split, model structure, and training settings. The experimental results are shown in Table 2. Based on both the predicted voltage results and the evaluation indicators, the model achieved the best overall performance when the input window length was 90, and the output window length was 60. Therefore, the input and output window lengths were set to 90 and 60, respectively, in the proposed model.

3.2. Multi-Scale Degradation Trend Perception Module

The voltage degradation signal of a fuel cell exhibits complex temporal characteristics at multiple scales, including fine-grained local fluctuations in the voltage response that may be influenced by the variable-load operating history during the dynamic durability test, as well as broader temporal patterns associated with gradual performance degradation. A single convolutional kernel with a fixed receptive field is insufficient to capture such heterogeneous local temporal structures simultaneously. To address this limitation, a multi-scale degradation trend perception module is introduced to enrich the feature representation of the input sequence before sequential modeling, while long-term temporal dependencies are delegated to the subsequent LSTM encoder.
Specifically, three parallel convolutional layers are applied to the input sequence. The three kernel sizes correspond to different local receptive fields: the kernel of size 3 extracts fine-grained short-term fluctuations, the kernel of size 5 captures intermediate local variations, and the kernel of size 7 focuses on smoother and broader local patterns within the input window. Each convolutional layer produces 32 feature channels, and zero-padding is applied to ensure that the temporal dimension remains unchanged after convolution. The operation of each branch is defined as
F k = ReLU ( W k X + b k ) , k { 3 , 5 , 7 }
where X R T × 1 denotes the input difference sequence of length T , W k and b k are the learnable weight matrix and bias of the convolutional layer with kernel size k , denotes the convolution operation, and ReLU ( )   is the rectified linear unit activation function.
The outputs of the three channels are concatenated across a feature dimension to generate the unified multi-scale representation:
F concat = [ F 3 F 5 F 7 ] T × 96
where denotes concatenation along the channel dimension. This multi-scale design enables the model to simultaneously perceive local temporal structures at multiple granularities, providing richer and more complementary feature representations compared to a single-kernel approach. The resulting feature matrix F concat preserves the original temporal dimension while enriching each step with multi-scale feature information, and is subsequently fed into the encoder–decoder framework.

3.3. LSTM Encoder–Decoder with Attention Mechanism

The encoder and decoder in the proposed model are both built upon LSTM networks, which are tailored to track persistent time-series dynamics across historical sequences. Unlike standard recurrent neural networks (RNNs), LSTM introduces a gating mechanism to regulate information flow, effectively mitigating the vanishing gradient problem. At each step t , the LSTM unit updates its hidden state h t and cell state c t through three gates, defined as follows:
f t = σ W f [ h t 1 , x t ] + b f
i t = σ ( W i [ h t 1 , x t ] + b i )
c ˜ t = tanh ( W c [ h t 1 , x t ] + b c )
c t = f t c t 1 + i t c ˜ t
o t = σ ( W o [ h t 1 , x t ] + b o )
h t = o t tan h ( c t )
where σ ( ) denotes the sigmoid activation function, tanh ( ) denotes the hyperbolic tangent function, denotes the element-wise multiplication, and W f , W i , W c , W o and b f , b i , b c , b o are the learnable weight matrices and bias vectors of the respective gates.
To further enhance the capability of the decoder to dynamically focus on the most relevant temporal context from the encoder output at each prediction step, a cross-attention mechanism is incorporated. The hidden state of the decoder at each step serves as the query, while the complete encoder output sequence provides both the keys and values. The scaled dot-product attention is computed as
Attention ( Q , K , V ) = softmax ( Q K T d k ) V
where Q , K , and V denote the query, key, and value matrices, respectively, and d k denotes the dimension of the key vectors.
For the purpose of integrating feature standpoints across diverse analytical dimensions, multi-head attention with N h = 4 parallel attention heads is employed:
head i = Attention ( Q W i Q , K W i K , V W i V )
A t = MultiHead ( Q , K , V ) = Concat ( head 1 , , head h ) W o
where W i Q , W i K , W i V are the projection matrices for the i -th attention head, and W O is the output projection matrix.
The attention output A t is then concatenated with the hidden state of the decoder d t R d h , where d t denotes the hidden state of the decoder LSTM at prediction step t , and passed through a fully connected layer with learnable weight matrix W out and bias b out to obtain the prediction results at each step:
y ^ t = W out [ d t A t ] + b out
The predicted value y ^ t is fed back as the input to the next decoding step, forming a closed-loop autoregressive prediction process that is repeated for L steps, where L denotes the prediction horizon, yielding the complete predicted difference sequence y ^ 1 ,   y ^ 2 , , y ^ L .

3.4. Data Preprocessing

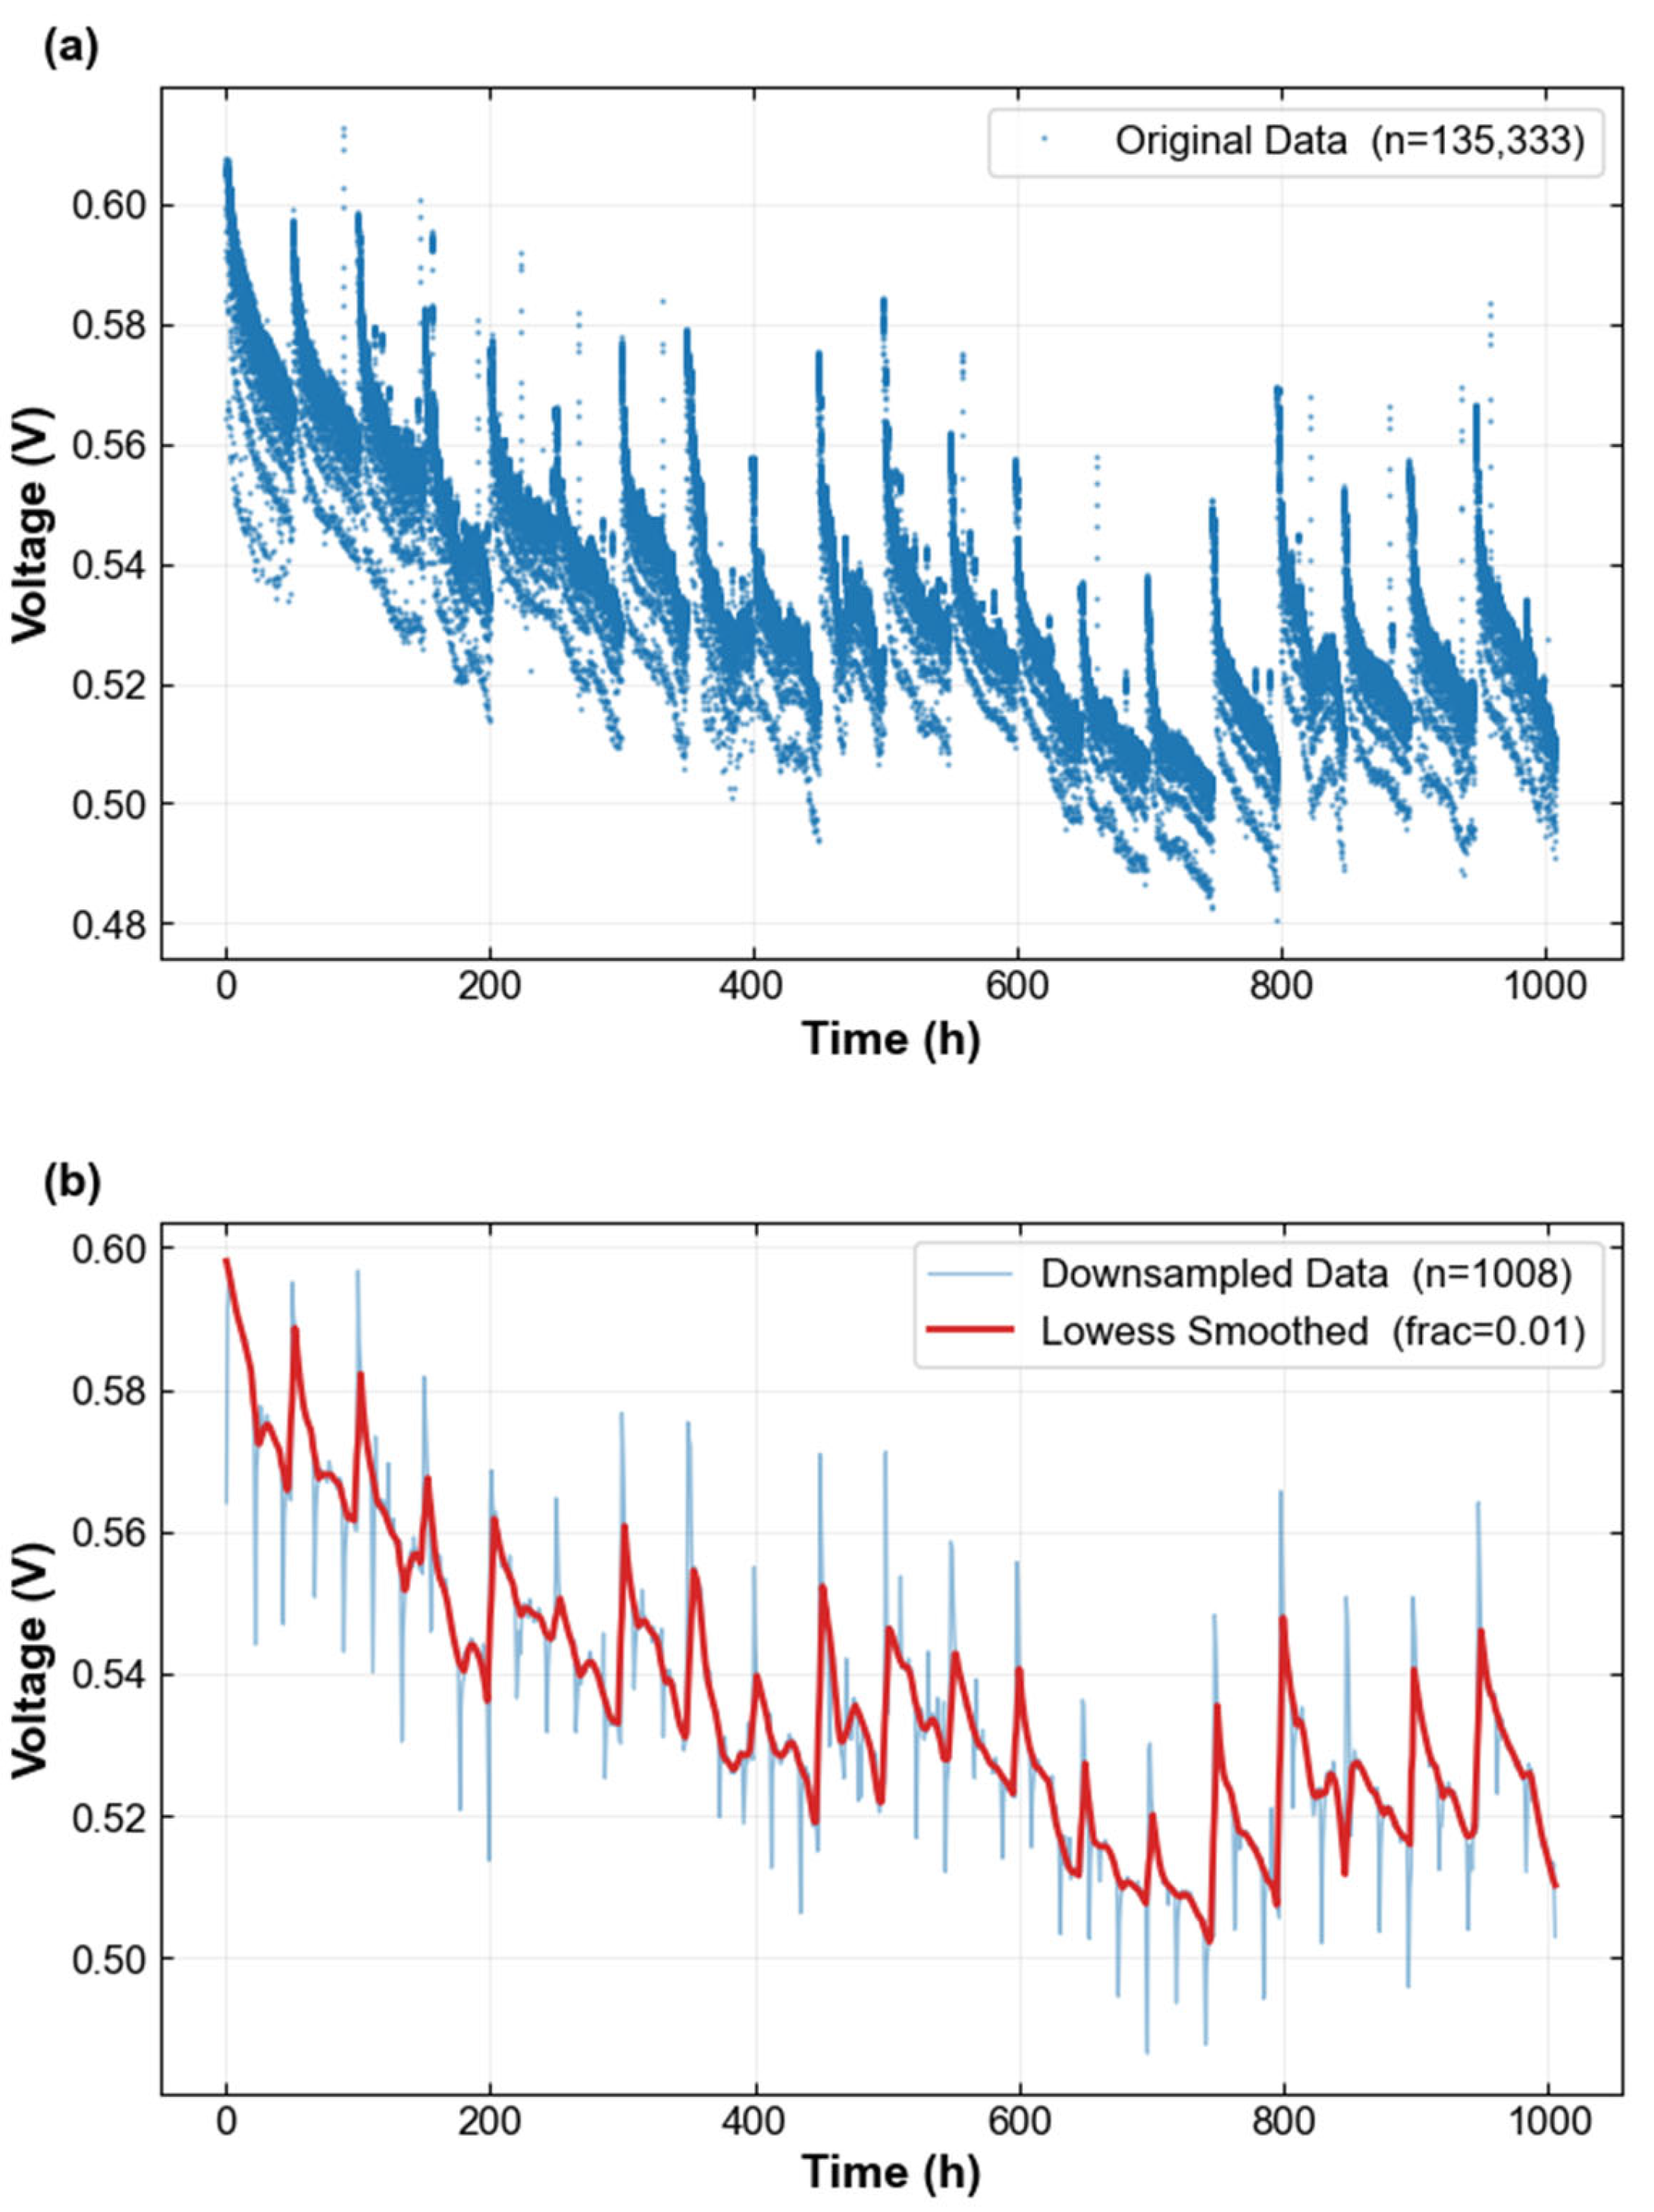
The raw experimental dataset comprised 20 data files collected from PEMFC operations in different operating conditions. In order to guarantee that the model was optimized exclusively on data representative of nominal operating conditions, a current-based filtering criterion was applied: only voltage measurements corresponding to a discharge current within the range of 35.5~35.6 A were retained, yielding a total of 135,333 valid data points. This filtering step eliminates measurements acquired under off-nominal current conditions, which may introduce inconsistent electrochemical dynamics and degrade model generalizability.
Since the output voltage of a PEMFC varies directly with the operating current, combining voltage values obtained at different current levels would introduce substantial load-dependent variations and obscure the long-term degradation trend. Therefore, the voltage within the current range of 35.5~35.6 A, corresponding to the rated operating current of the tested fuel cell stack, was extracted to construct the degradation sequence used in this study. This selection ensures that the voltage values at different aging stages are compared under approximately identical operating conditions, thereby reducing the direct influence of current variation and allowing the degradation-related voltage evolution to be identified more clearly.
To mitigate the effect of high-frequency measurement noise inherent in the raw voltage sequence, locally weighted scatterplot smoothing (LOWESS) is applied to the downsampled voltage series before the differential transformation. LOWESS is a non-parametric regression method that estimates the underlying smooth trend at each data point by fitting a weighted low-degree polynomial within a local neighborhood, without imposing any global functional form on the data. This property makes it particularly well-suited for electrochemical time series characterized by non-stationary dynamics and irregular noise distributions.
Formally, given the downsampled sequence t i , v i i = 1 n where n = 1008, the smoothed estimate v ^ i at each point t ^ i is obtained by minimizing the locally weighted sum of squared residuals:
v ^ i = arg min β j = 1 n w j ( t i ) v j k = 0 p β k ( t j t i ) k 2
where p denotes the polynomial degree and w j t i is the tricube kernel weight assigned to the j -th observation:
w j ( t i ) = 1 t j t i d i 3 3 1 t j t i d i
where d i represents the distance to the furthest point within the local window determined by bandwidth parameter f .
In this model, f is set to 0.01, meaning that each local regression is performed over a window encompassing 0.01 × 1008 = 10 neighboring points. This narrow bandwidth is deliberately chosen to preserve the macro-scale electrochemical degradation trend and the characteristic cyclic voltage fluctuations associated with operating cycles, while effectively suppressing stochastic measurement artifacts. To further enhance robustness against outliers, LOWESS employs iterative re-weighted least squares, in which residuals from each fitting iteration are used to construct bisquare robustness weights that progressively downweight anomalous observations in subsequent iterations. The resulting smoothed sequence serves as the input to the first-order differencing operation, ensuring that the differential increments fed into the model reflect the genuine electrochemical dynamics rather than measurement noise.
First-order differencing was then applied to the smoothed sequence to convert the non-stationary voltage series into an approximately stationary incremental series, improving the training-phase evolution dynamics and convergence smoothness within the structural network. Finally, the difference sequence was normalized to the interval [−1, 1] via min–max scaling fitted exclusively on the training partition, with the resulting scaling parameters applied to the validation, which can be calculated as
x scaled = 2 × x x min x max x min 1
where x max and x min denote the maximum and minimum values, x denotes the original value, and x scaled denotes the scaled value.
Since the model was trained on the voltage difference, the first 550 data points generated 549 first-order voltage difference values. Among these values, the first 440 values were used to construct the training samples, and the remaining 109 values were used as the validation interval for hyperparameter selection and early stopping. The test interval started after the 550th known voltage data point. During testing, the 550th voltage value was used as the initial value for voltage reconstruction, and the model recursively predicted the subsequent voltage differences.
To prevent information leakage, the normalization scaler was fitted only on the training subset of the voltage difference sequence and was then applied unchanged to the validation and test intervals. The true voltage data in the test interval were not used during model training, validation, early stopping, hyperparameter selection, or scaler fitting.

3.5. Evaluation Indicators of Results

To quantitatively assess the predictive performance of the developed algorithm regarding fuel cell degradation behaviors, five widely adopted statistical metrics are employed: root mean square error (RMSE), absolute percentage error (APE), normalized mean square error (NMSE), mean absolute percentage error (MAPE), and mean absolute error (MAE). The mathematical formulations of these metrics are defined as follows, where y ^ i and y i represent the predicted and experimental true voltage values at the i step, respectively.
RMSE = 1 n i = 1 n ( y i y ^ i ) 2
APE = y i y ^ i y i × 100 %
NMSE = i = 1 n ( y i y ^ i ) 2 i = 1 n ( y i y ¯ i ) 2
MAPE = 1 n i = 1 n y i y ^ i y i × 100 %
MAE = 1 n i = 1 n y i y ^ i
Each metric captures a distinct aspect of the accuracy and robustness of the model. Specifically, RMSE and MAE quantify the absolute errors in the same unit as the target variable. Due to its squaring mechanism, RMSE heavily penalizes larger deviations, making it highly sensitive to outliers, whereas MAE measures the average magnitude of absolute errors in a linear fashion, offering a more robust reflection of the central error tendency. To provide scale-independent assessments, APE and MAPE measure relative errors; APE evaluates the percentage discrepancy for individual data points, while MAPE aggregates these errors to reflect the overall percentage accuracy, facilitating straightforward comparisons across different data scales. Furthermore, NMSE normalizes the summation of squared residual deviations against the total variance of the observed data. This benchmarking standardizes the error, where a lower NMSE value indicates a substantial performance gain over a naive mean-based baseline predictor. Collectively, the simultaneous adoption of these absolute, relative, squared, and normalized error criteria ensures a comprehensive and multi-faceted validation of the model’s forecasting accuracy.

4. Results and Discussion

4.1. Data Visualization After Preprocessing

Figure 3 illustrates the voltage data after current-based filtering and the subsequent preprocessing pipeline. The upper panel (Figure 3a) presents the 135,333 raw voltage measurements retained under the nominal discharge current of 35.5~35.6 A, spanning approximately 1008 h of operation across 20 experimental files. The data exhibit a clear long-term degradation trend superimposed on periodic operating cycles, reflecting the progressive power fade of the PEMFC over its operational lifetime. The lower panel of Figure 3b displays the downsampled sequence (n = 1008) alongside the LOWESS-smoothed curve (frac = 0.01). The smoothed curve successfully captures the macroscopic degradation trajectory while effectively suppressing the high-frequency fluctuations and inter-cycle variability present in the raw signal, thereby providing a stable and noise-attenuated input for subsequent model training.

4.2. Multi-Scale Degradation Trend Perception Optimization Results

The first 550 h of the dataset were designated for model training, whereas the supplementary subset was used as the prediction set. To evaluate the model, a validation set was established, with the first 80% of the training set used for model training and the remaining 20% for error evaluation.
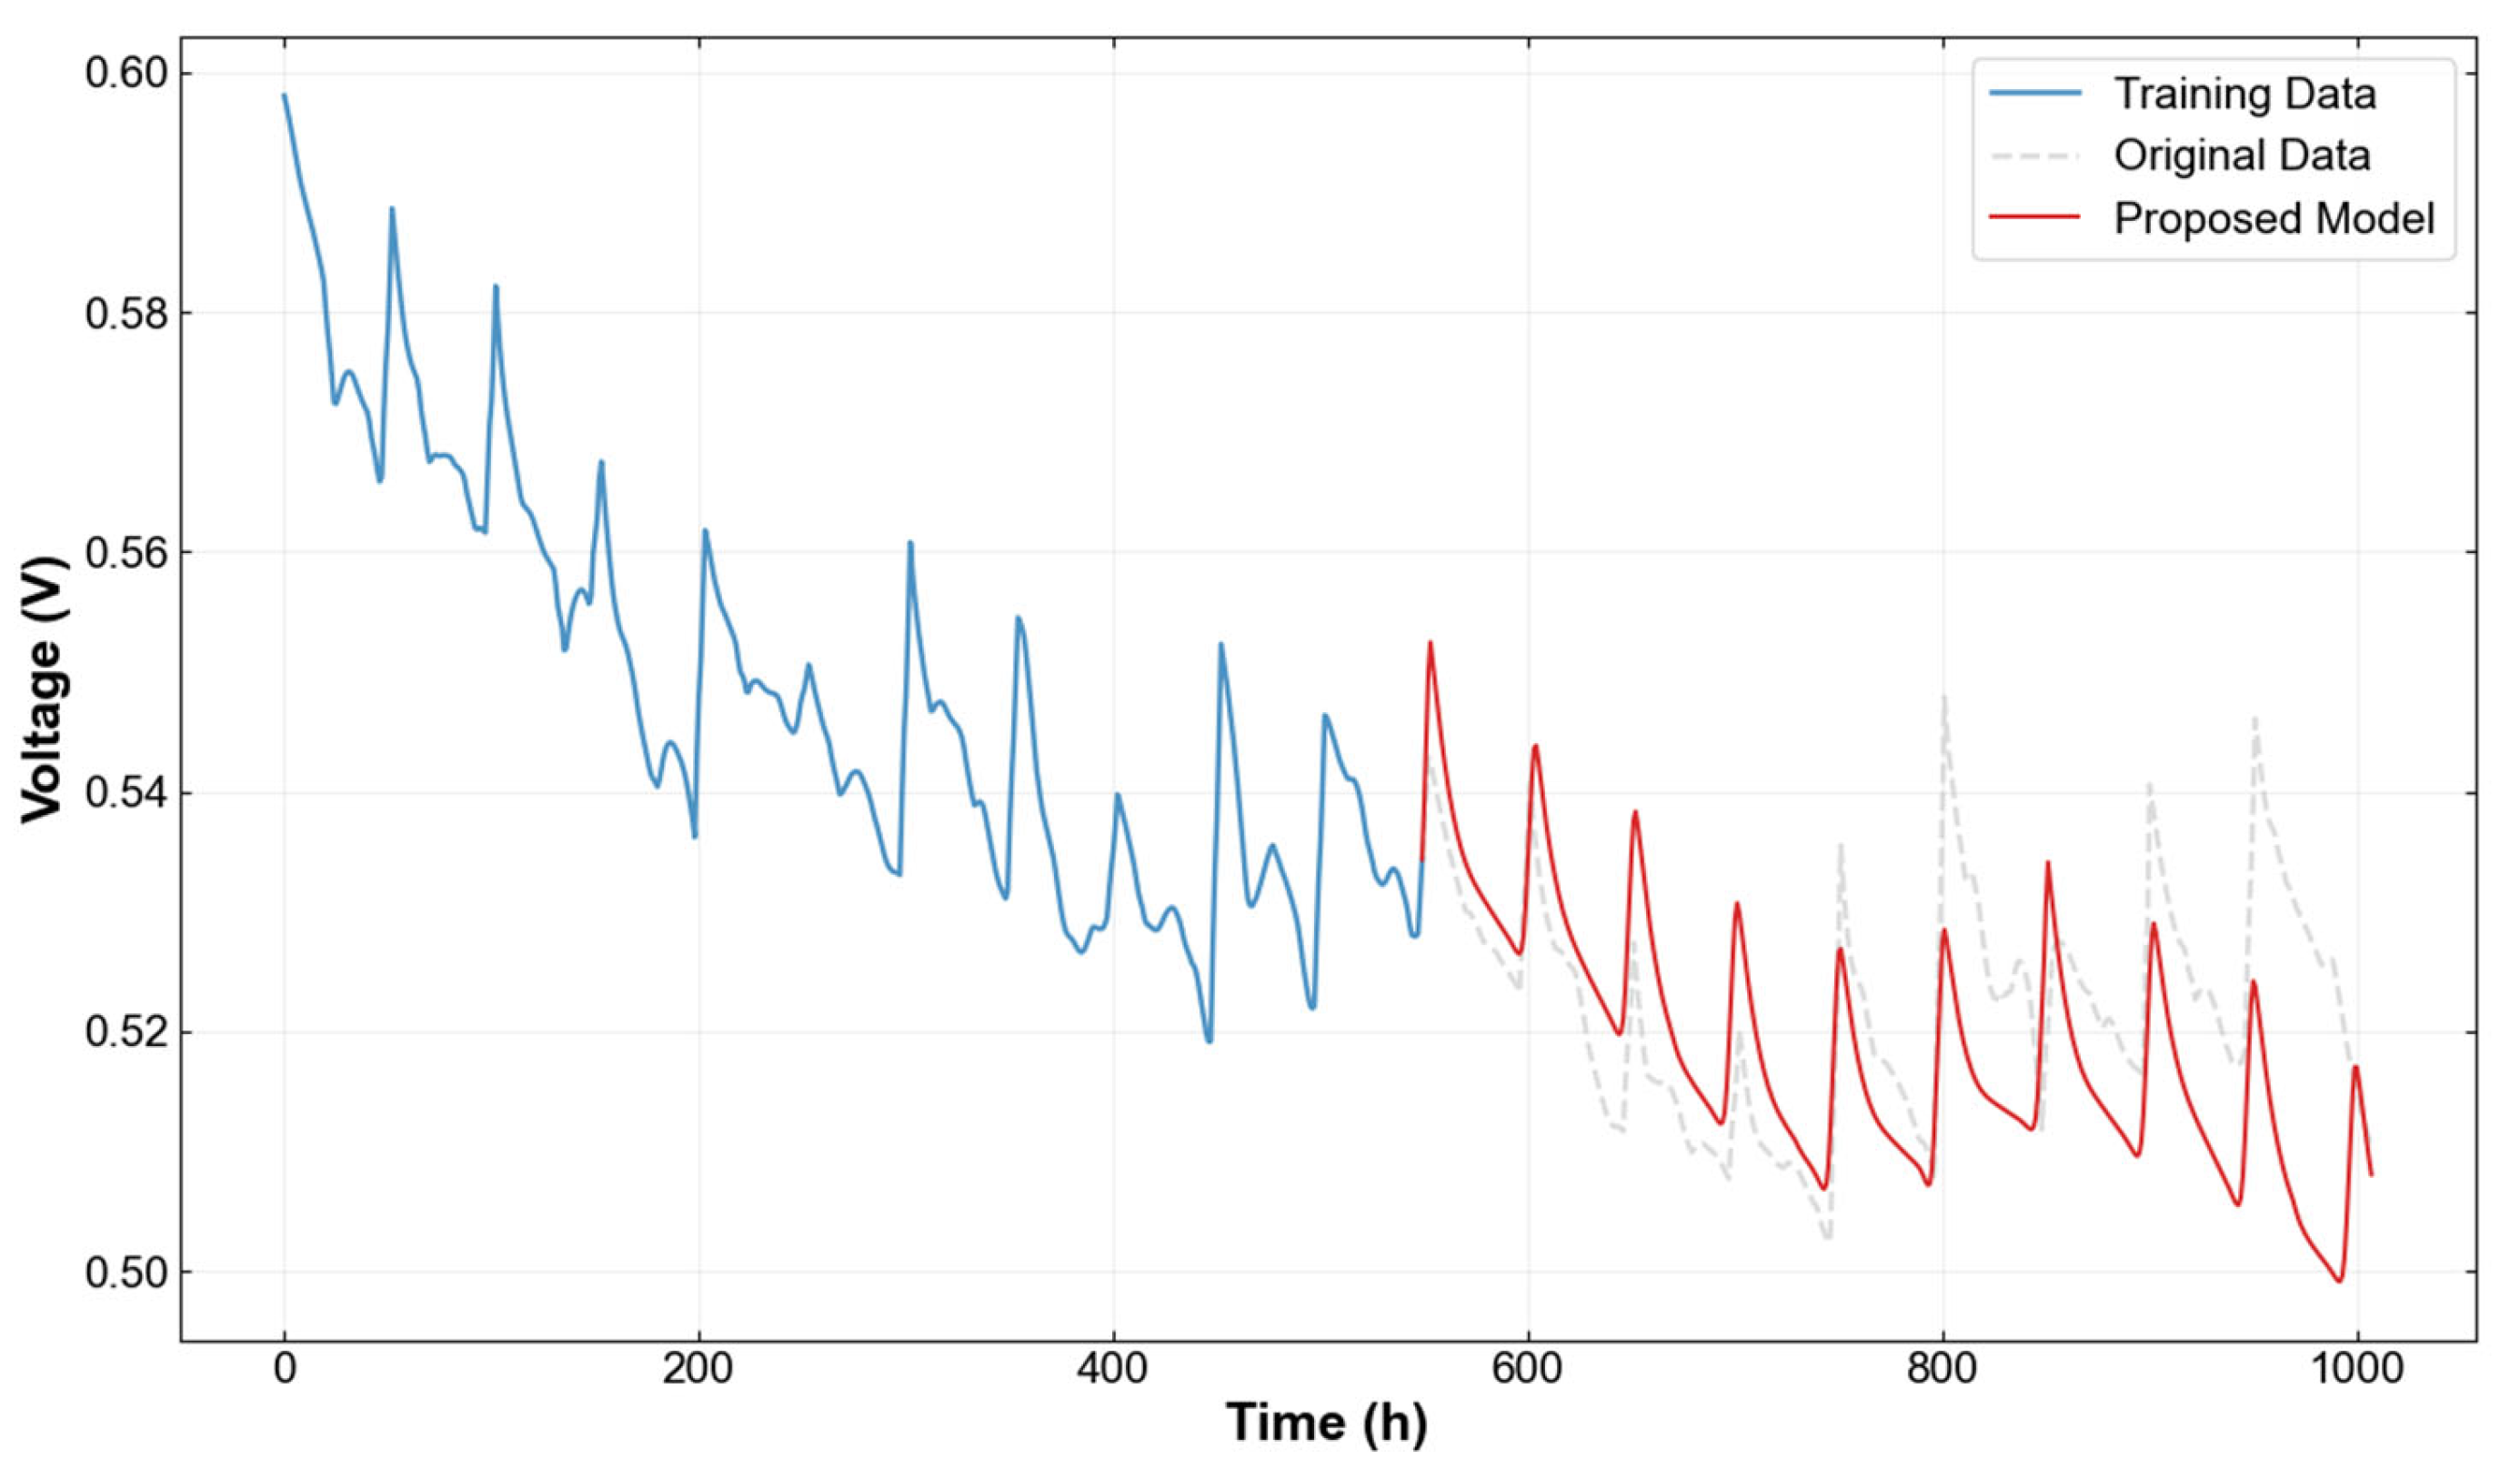
Figure 4 illustrates the voltage prediction results of the proposed model when a nominal current of 35.6 A is employed in the discharge dataset. The blue solid line represents the training data within the first 550 h, the gray dashed line corresponds to the original voltage signal in the test interval, and the red line tracks the predicted curve of the proposed model from 550 to 1008 h. The voltage exhibits a clear monotonic decreasing trend, reflecting the typical electrochemical degradation characteristics of fuel cells. Superimposed on this long-term degradation trend are periodic fluctuations of varying amplitudes, which are closely related to cyclic load variations during operation. Notably, the training data exhibit intermittent reversible voltage recovery, where the voltage temporarily rises above the overall degradation trend before decreasing again. Such reversible voltage recovery is a typical feature of PEMFCs and is generally attributed to membrane rehydration, localized regeneration of the catalyst layer, or temporary relief of mass transport limitations. The forecasting interval contains a pronounced voltage degradation trend and repeated local recovery and decay processes. Despite these changes, the predicted voltage remains generally consistent with the measured trajectory and captures the major periodic fluctuations. The result demonstrates that it can maintain satisfactory forecasting accuracy under changing degradation tendencies.
The proposed model effectively captures both the short-term dynamic fluctuations and long-term degradation trend of the voltage, owing to the complementary design of its two core components. The multi-scale degradation trend perception module extracts local temporal features at multiple granularities, enabling the model to perceive fine-grained short-term variations, while the LSTM encoder–decoder framework learns long-range temporal dependencies across the full sequence, capturing the overall degradation trajectory and acquiring the periodic reversible recovery patterns from the training data. Leveraging this joint learning capability, the reversible voltage recovery patterns observed in the training interval are effectively encoded into the representations of the model and subsequently reproduced in the prediction interval after 800 h. The quasi-periodic recovery events in the predicted curve exhibit a reasonable correspondence with the actual signal in both temporal location and amplitude.
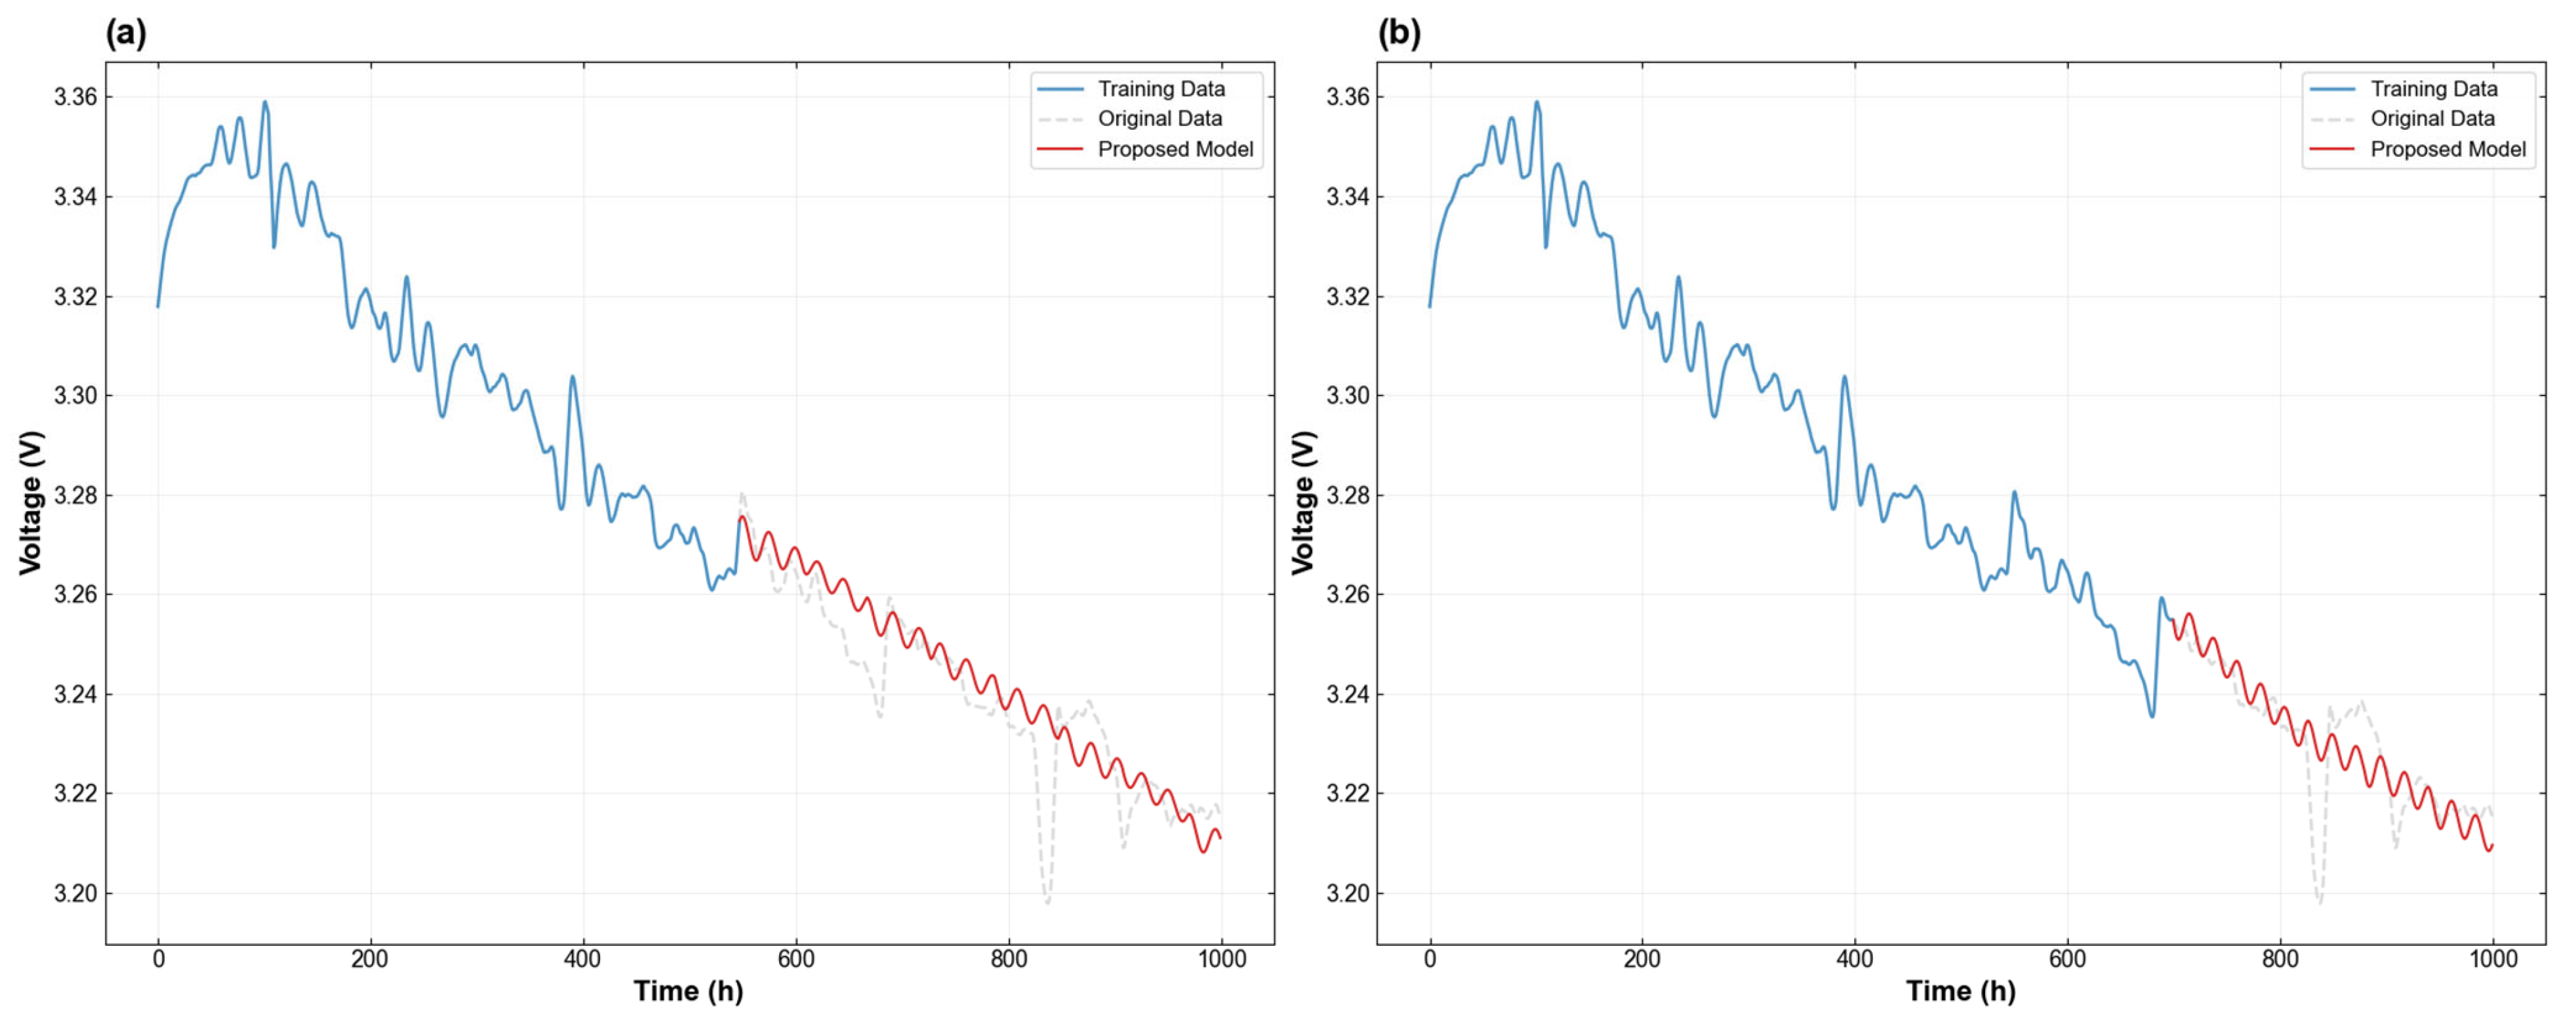
To further evaluate the effectiveness and generalization capability of the proposed model, an additional experiment was conducted using the fuel cell degradation dataset from the IEEE 2014 Data Challenge [30]. Since the latter portion of this dataset exhibits pronounced and irregular reversible voltage recovery, the first 1000 h of operating data were selected for model training and prediction. This setting was used to assess the capability of the proposed model to capture the long-term voltage degradation tendency of the fuel cell.
As shown in Figure 5a, the proposed model closely follows the overall voltage degradation trajectory of the additional dataset with the original split and captures the major temporal variations during the forecasting interval. The model achieves an MAE of 0.0061 V and an RMSE of 0.0087 V. The performance obtained on the additional dataset indicates that the proposed model can extract temporal degradation characteristics and is not restricted to the dataset used in the primary experiment. Nevertheless, differences in fuel cell stack configuration, operating conditions, sampling intervals, and measurement noise may affect the data distribution. Further multi-dataset and cross-condition validation will therefore be conducted in future work. Furthermore, as shown in Figure 5b, under the 5:2:3 train–validation–test partitioning strategy, the proposed model still achieved good prediction accuracy, indicating that its performance is not strongly dependent on the original data partitioning scheme.

4.3. Ablation Study

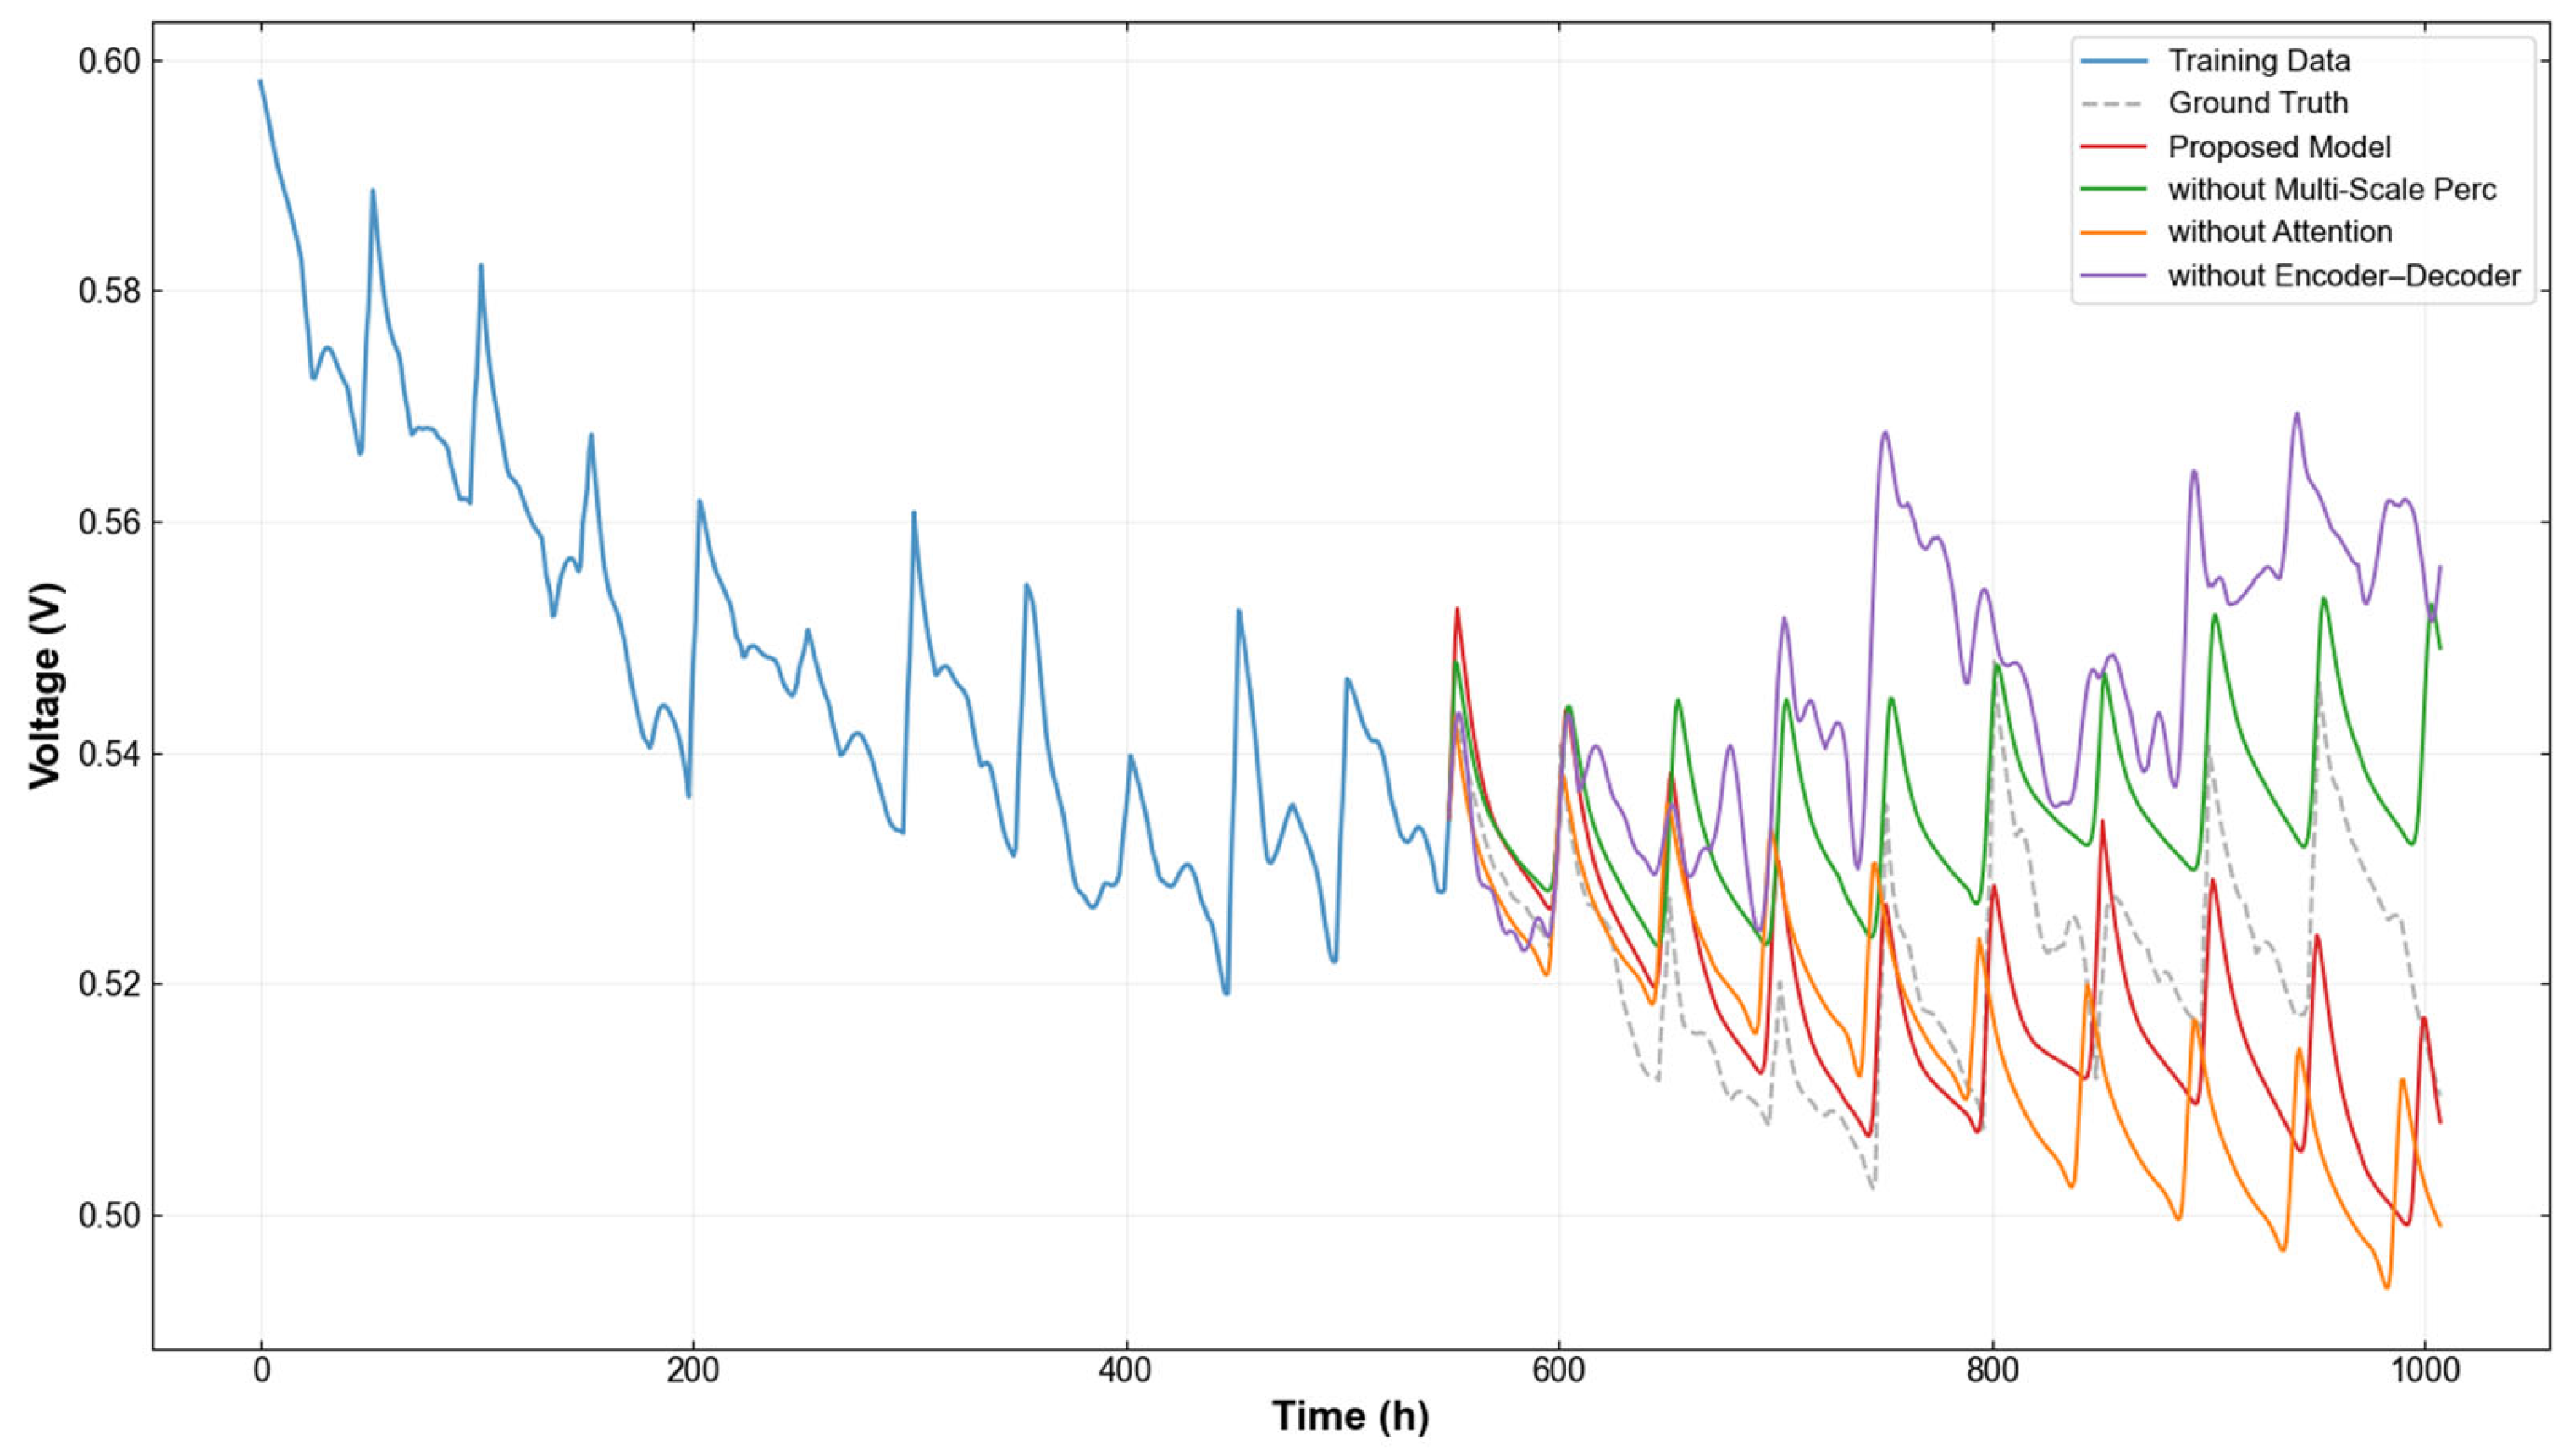
To systematically evaluate the specific impact of individual module designs on the predictive performance, a series of ablation experiments was conducted by selectively removing individual modules from the proposed model. Three degraded variants were constructed: (1) Without Multi-Scale Degradation Trend Perception, in which the multi-scale degradation trend perception module was replaced by a single-scale convolution with a kernel size of three; (2) Without Attention, in which the multi-head attention mechanism was removed, and the decoder output was directly mapped to predictions without cross-sequence context modeling; and (3) Without Encoder–Decoder, in which the autoregressive encoder–decoder architecture was replaced by a single LSTM that directly projects the final hidden state to the full prediction horizon. All other hyperparameters and training configurations were held constant across variants to ensure a fair comparison.
The prediction results of all variants are presented in Figure 6. The proposed full model achieves the closest agreement with the ground truth voltage degradation trajectory throughout the entire test horizon, accurately capturing both the short-term cyclic fluctuations and the long-term downward trend. In contrast, all ablated variants exhibit substantially degraded predictive performance.
Crucially, the indispensable role of the multi-scale feature extraction is substantiated by the performance of the Without Multi-Scale Perc variant (green), which exhibits a systematic positive bias relative to the ground truth, with predicted voltage values consistently elevated above the true degradation trajectory. While the cyclic oscillation pattern is partially preserved, the amplitude and phase of the predicted cycles progressively deviate from the reference, indicating that single-scale convolutional feature extraction fails to adequately resolve the multi-frequency temporal components embedded in the voltage signal. The inability to capture fine-grained local dynamics ultimately causes the model to underestimate the rate of long-term power fade and performance degradation.
The Without Attention variant (orange) tracks the overall downward degradation trend more closely than the Without Multi-Scale Perc variant. However, it exhibits pronounced amplitude amplification in the cyclic fluctuations, with valley voltages substantially lower than those observed in the ground truth. This over-oscillation behavior suggests that without the cross-attention mechanism to selectively integrate the complex encoder information, the decoder relies excessively on its internal recurrent state, leading to error accumulation and instability over extended prediction horizons.
The Without Encoder–Decoder variant (purple) displays the most severe divergence from the ground truth. The predicted curve maintains an anomalously elevated voltage level throughout the test horizon, failing to track the progressive degradation trend and exhibiting irregular oscillations inconsistent with the underlying electrochemical dynamics. This behavior confirms that direct multi-step projection from a single LSTM hidden state lacks the sequential inductive bias required for coherent long-horizon forecasting and that the autoregressive decoding mechanism is indispensable for generating physically plausible voltage trajectories.
Overall, the visual comparison corroborates the quantitative findings in Table 2, collectively establishing that the proposed full model, through the synergistic integration of the multi-scale degradation trend perception module, multi-head attention, and the autoregressive encoder–decoder structure, achieves superior predictive fidelity across both the macro-scale degradation trend and the micro-scale cyclic dynamics.
Table 3 explicitly delineates the performance fluctuations caused by the ablation study, which reports five evaluation metrics—MAE, RMSE, MAPE, NMSE, and Max-APE—across the proposed full model and three ablated variants. The formulated framework consistently demonstrates overwhelming superiority across the entire spectrum of evaluation criteria, featuring MAE of 0.0088 V, RMSE of 0.0108 V, MAPE of 1.6696%, NMSE of 1.3599, and Max-APE of 4.9637%, demonstrating its superior accuracy and robustness in long-horizon voltage degradation prediction.
The removal of the multi-scale degradation trend perception module (Without Multi-Scale Perc) leads to a notable degradation in predictive performance, with MAE increasing by 47.7% to 0.0130 V, RMSE rising to 0.0147 V, and MAPE increasing to 2.5096%. The Max-APE deteriorates substantially to 7.8331%, reflecting a loss of multi-frequency local feature extraction capability. These results confirm that convolutional kernels of varying receptive fields are essential for capturing the heterogeneous temporal patterns embedded in the voltage degradation sequence and that relying on a single-scale convolution is insufficient to characterize the complex dynamics of PEMFC aging.
The exclusion of the multi-head attention mechanism (Without Attention) yields MAE of 0.0128 V, RMSE of 0.0162 V, MAPE of 2.4381%, and Max-APE of 7.3397%, representing performance degradation across all metrics relative to the full model. The NMSE increases to 3.0716, indicating a significant reduction in the capability of the model to explain the variance of the true voltage trajectory. This demonstrates that the cross-attention mechanism between decoder hidden states and encoder context representations plays a critical role in maintaining temporal coherence over extended prediction horizons, enabling the model to selectively pay attention to the most informative historical states during autoregressive decoding.
The most severe performance degradation is observed upon the removal of the encoder–decoder architecture (Without Encoder–Decoder), with MAE rising to 0.0233 V, RMSE to 0.0267 V, MAPE to 4.4878%, NMSE to 8.2840, and Max-APE to 10.9179%. The NMSE value of 8.2840 indicates that the prediction capability of the model is substantially less representative of the underlying degradation dynamics than that of the full model, and the Max-APE of 10.9179% reflects large localized prediction errors that would be unacceptable in practical PEMFC management applications. These findings unequivocally establish that the autoregressive encoder–decoder structure is the most critical architectural component, as it provides the sequential inductive bias necessary for coherent multi-step prediction across long time horizons.
The evaluation indicators were calculated exclusively over the forecasting interval. The training and validation data were not included in the computation of the final evaluation results. Therefore, the early data do not directly inflate the reported forecasting accuracy.
Taken together, the ablation results provide strong empirical evidence that each architectural component contributes indispensably to the overall predictive capability of the proposed model. The progressive performance degradation observed upon removing each module confirms that the synergistic integration of multi-scale convolutional feature extraction, multi-head attention, and the encoder–decoder decoding paradigm is the key to achieving high-accuracy, long-horizon voltage degradation forecasting for the PEMFC. These findings collectively demonstrate that each component of the proposed architecture contributes meaningfully to predictive accuracy and that their integration yields a synergistic improvement that cannot be achieved by any single module in isolation.

4.4. Model Comparison

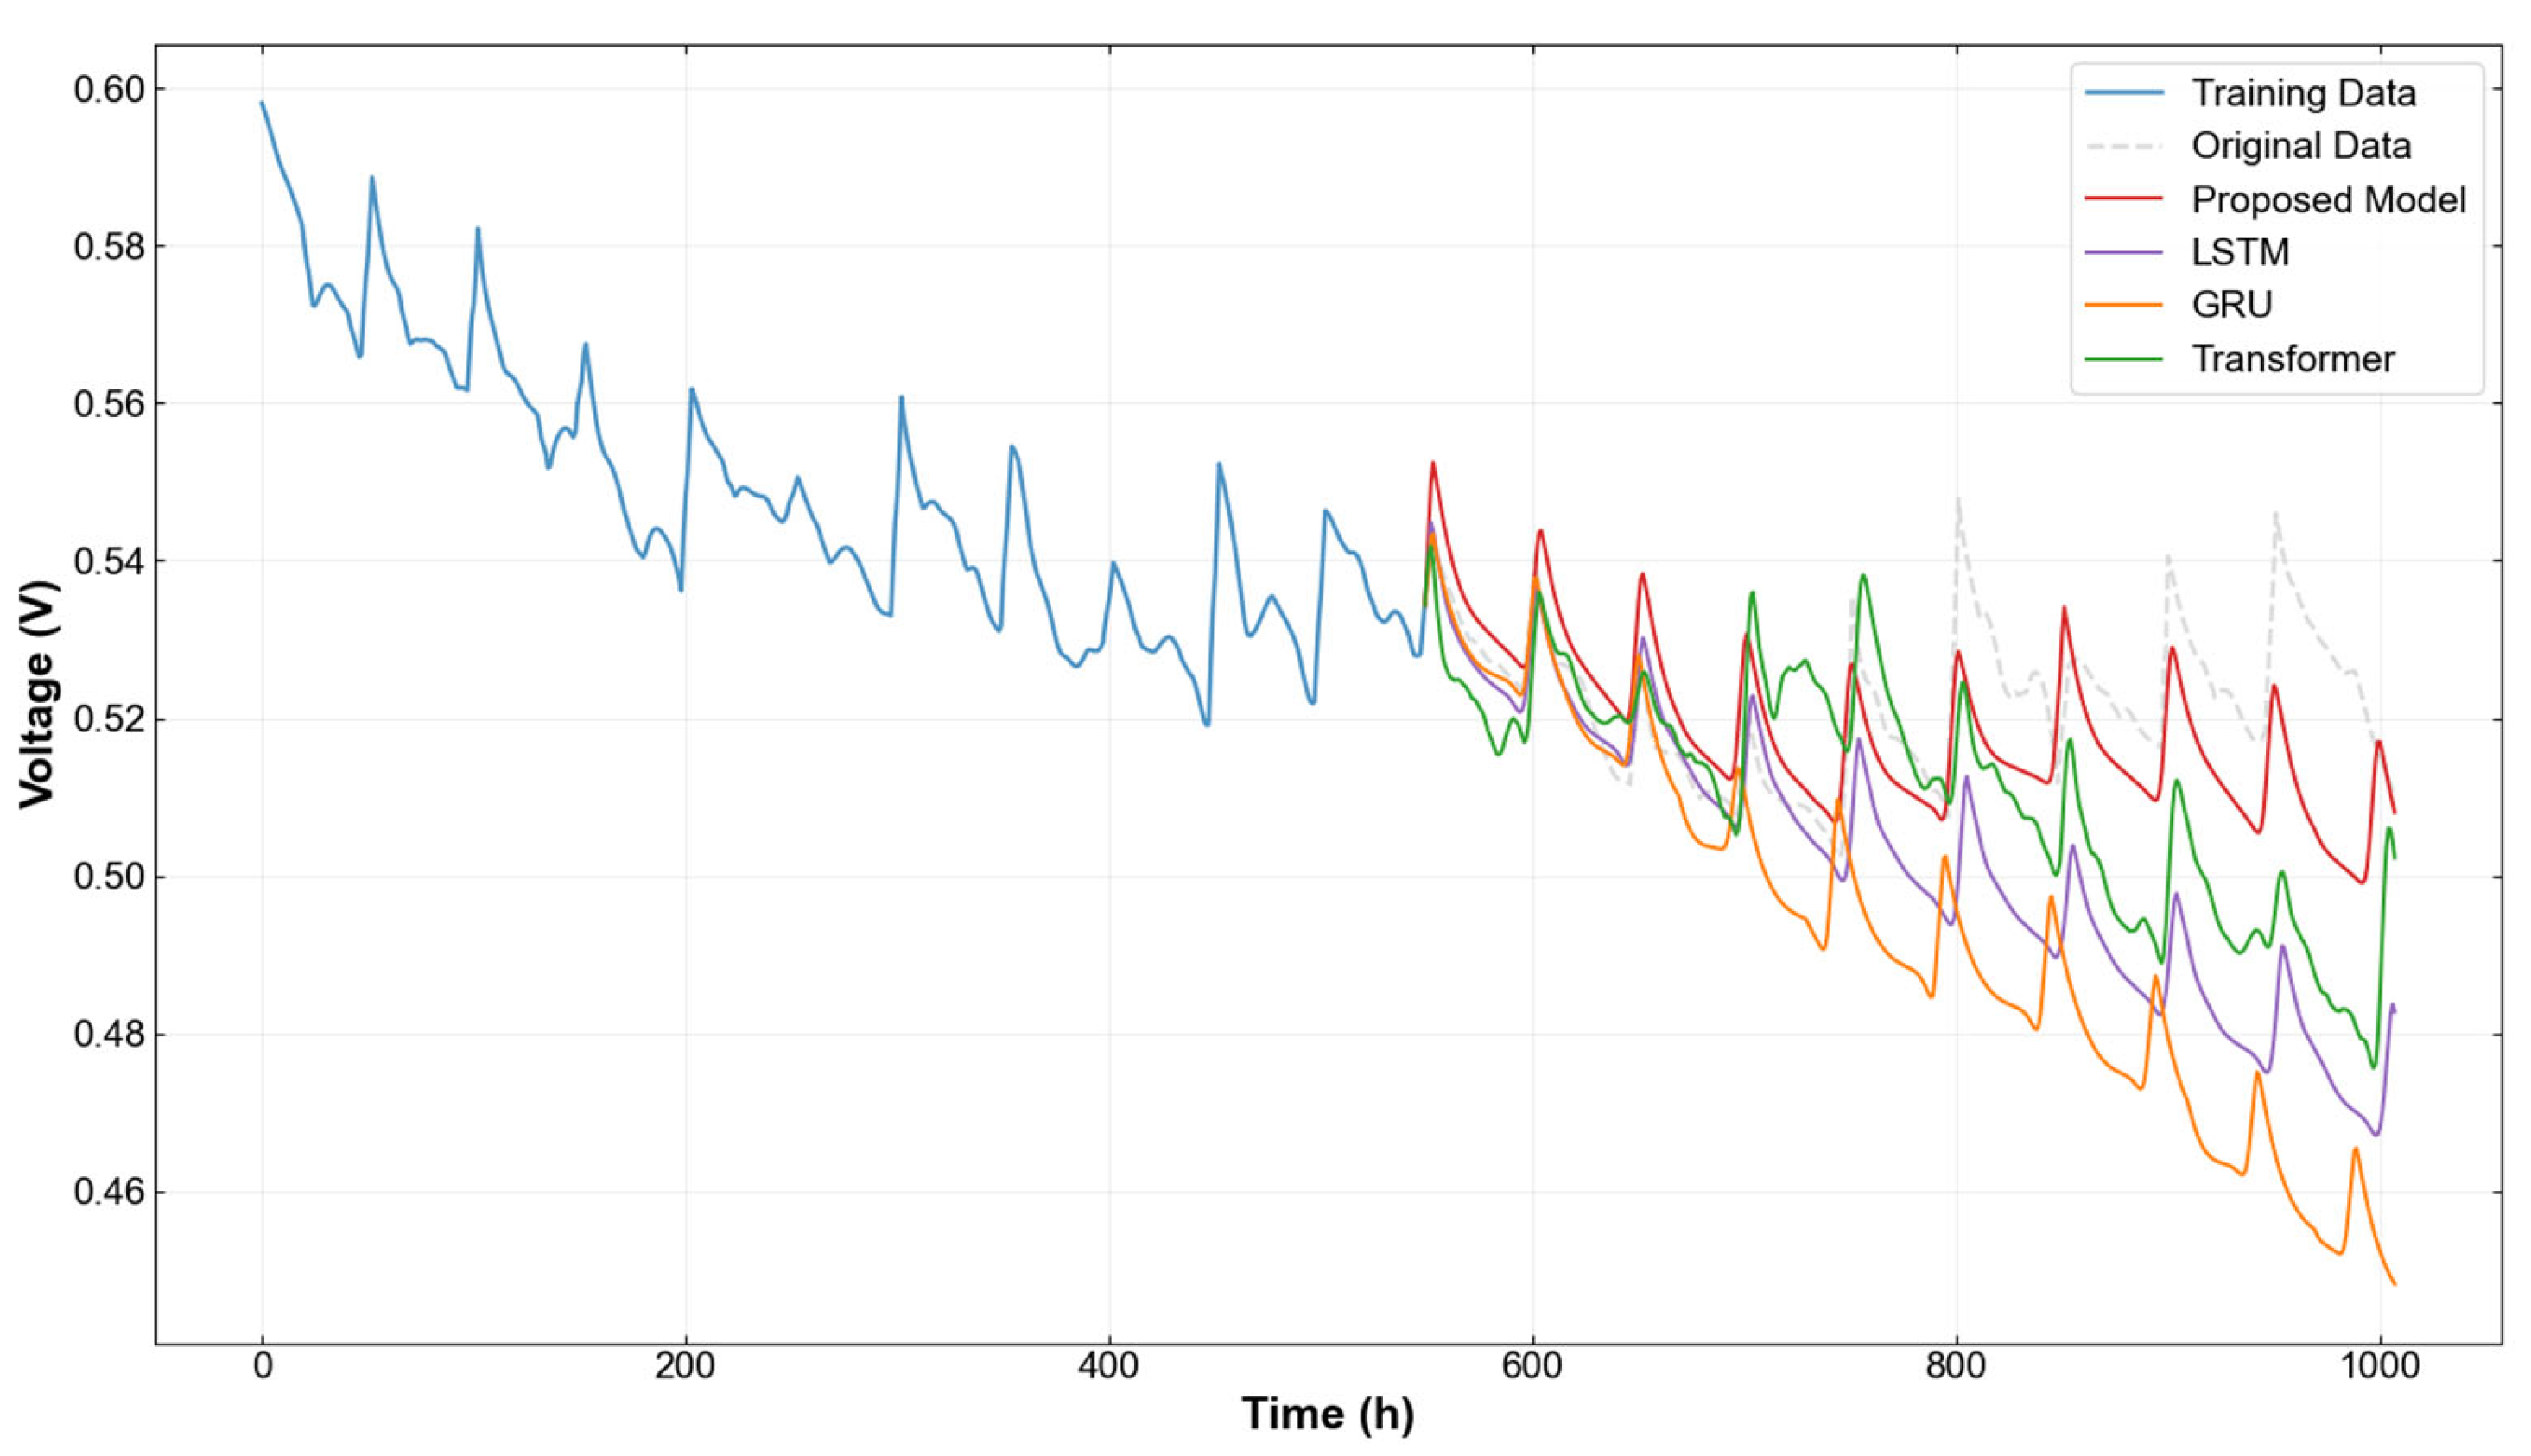
To evaluate the advantages of the proposed PEMFC lifetime prediction model, the forecasting results of various models, including LSTM, GRU, and Transformer, are compared, as illustrated in Figure 7. With the extension of the prediction horizon, the traditional recurrent neural network-based models LSTM and GRU suffer from severe error accumulation, leading to a significant underestimation of the actual voltage in the later prognostic stages. Although the Transformer model possesses a powerful self-attention mechanism, it exhibits instability and high variance when tracking the transient peak amplitudes of local fluctuations.
In contrast, by integrating multi-scale convolutions with an attention architecture, the proposed model successfully mitigates the degradation of long-term dependencies. Throughout the entire testing phase, the proposed model demonstrates the highest fidelity to the original data curve. Consequently, the proposed method yields the lowest absolute percentage error, exhibiting superior robustness and reliability for the long-term prediction of PEMFC health state.
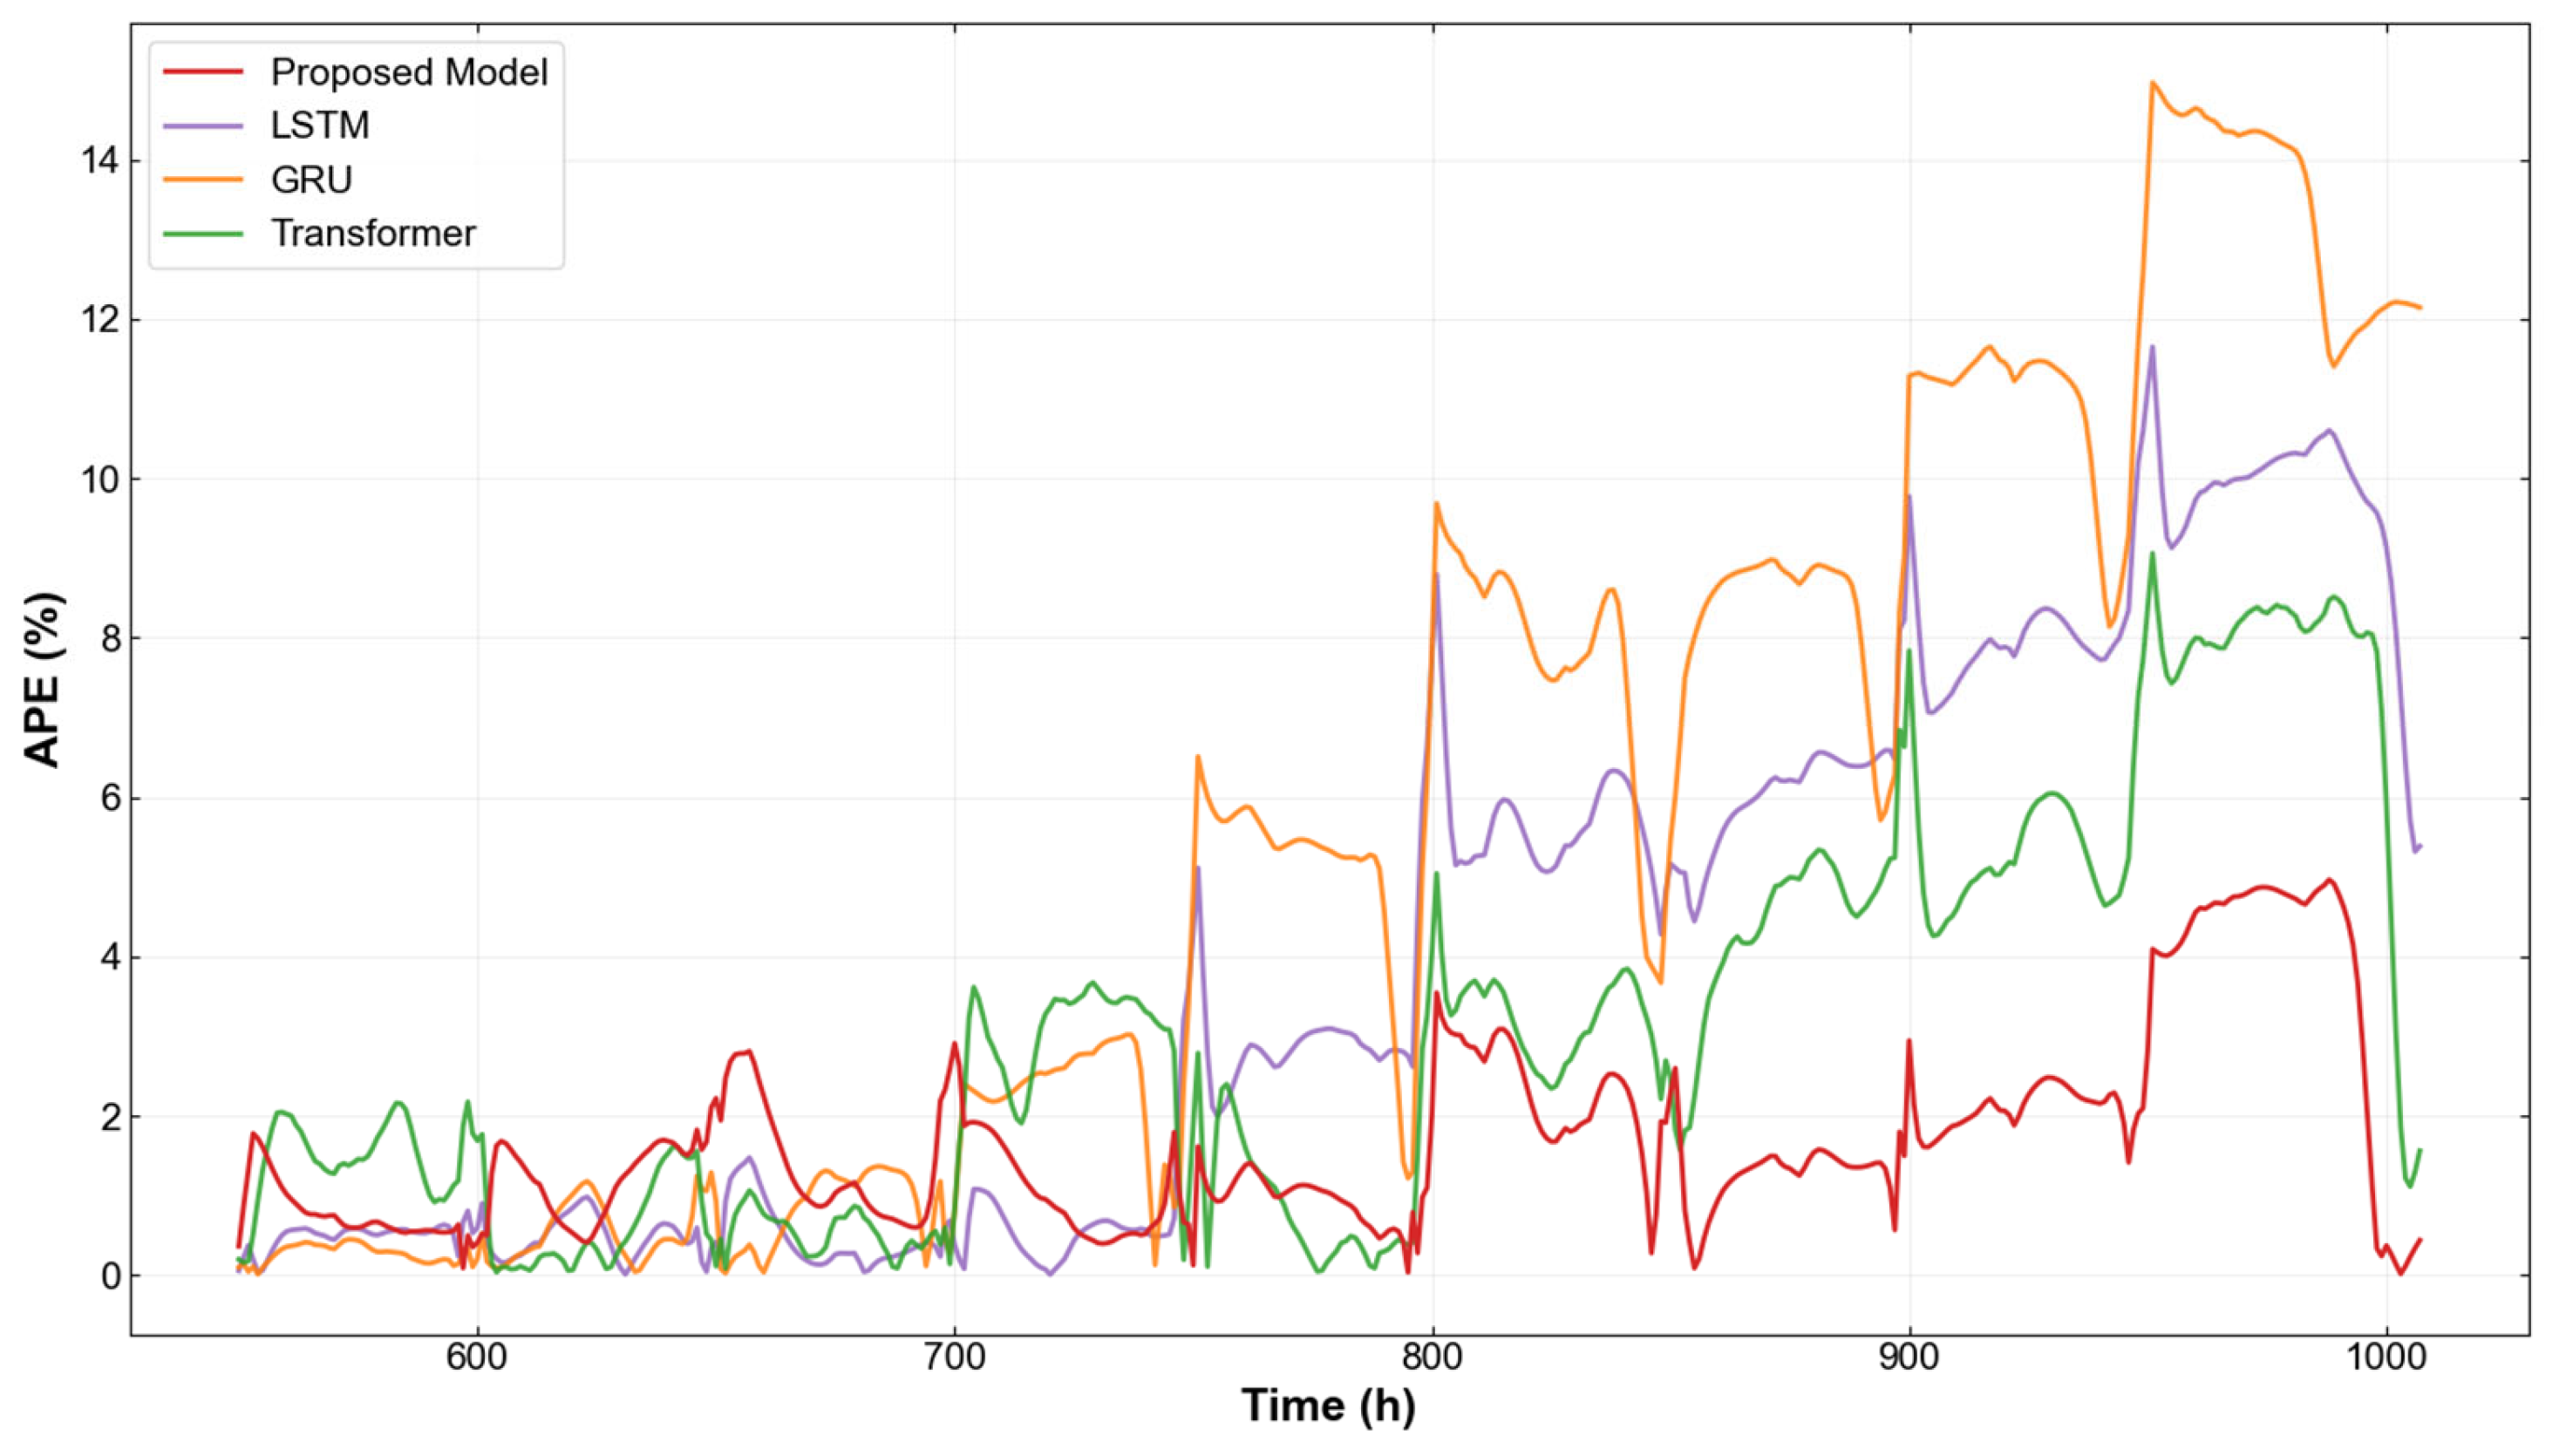
To further dissect the local prediction accuracy, the instantaneous APE profiles over the prognostic phase are explicitly plotted in Figure 8. The APE of the proposed model remains remarkably low and steady, consistently confined below 4.0% for the majority of the timeline and only reaching a minor peak of 4.9637% at the very end. The MAPE of the proposed model, representing the average profile of the APE, is recorded at a mere 1.6696%. Conversely, the benchmark models display severe error accumulation over time. Beyond 800 h, the APE of the Transformer fluctuates upward to around 8.0–9.0%, while the LSTM and GRU exhibit severe error divergence, peaking at 11.6493% and 14.9668%, respectively, near the end of the operational test.
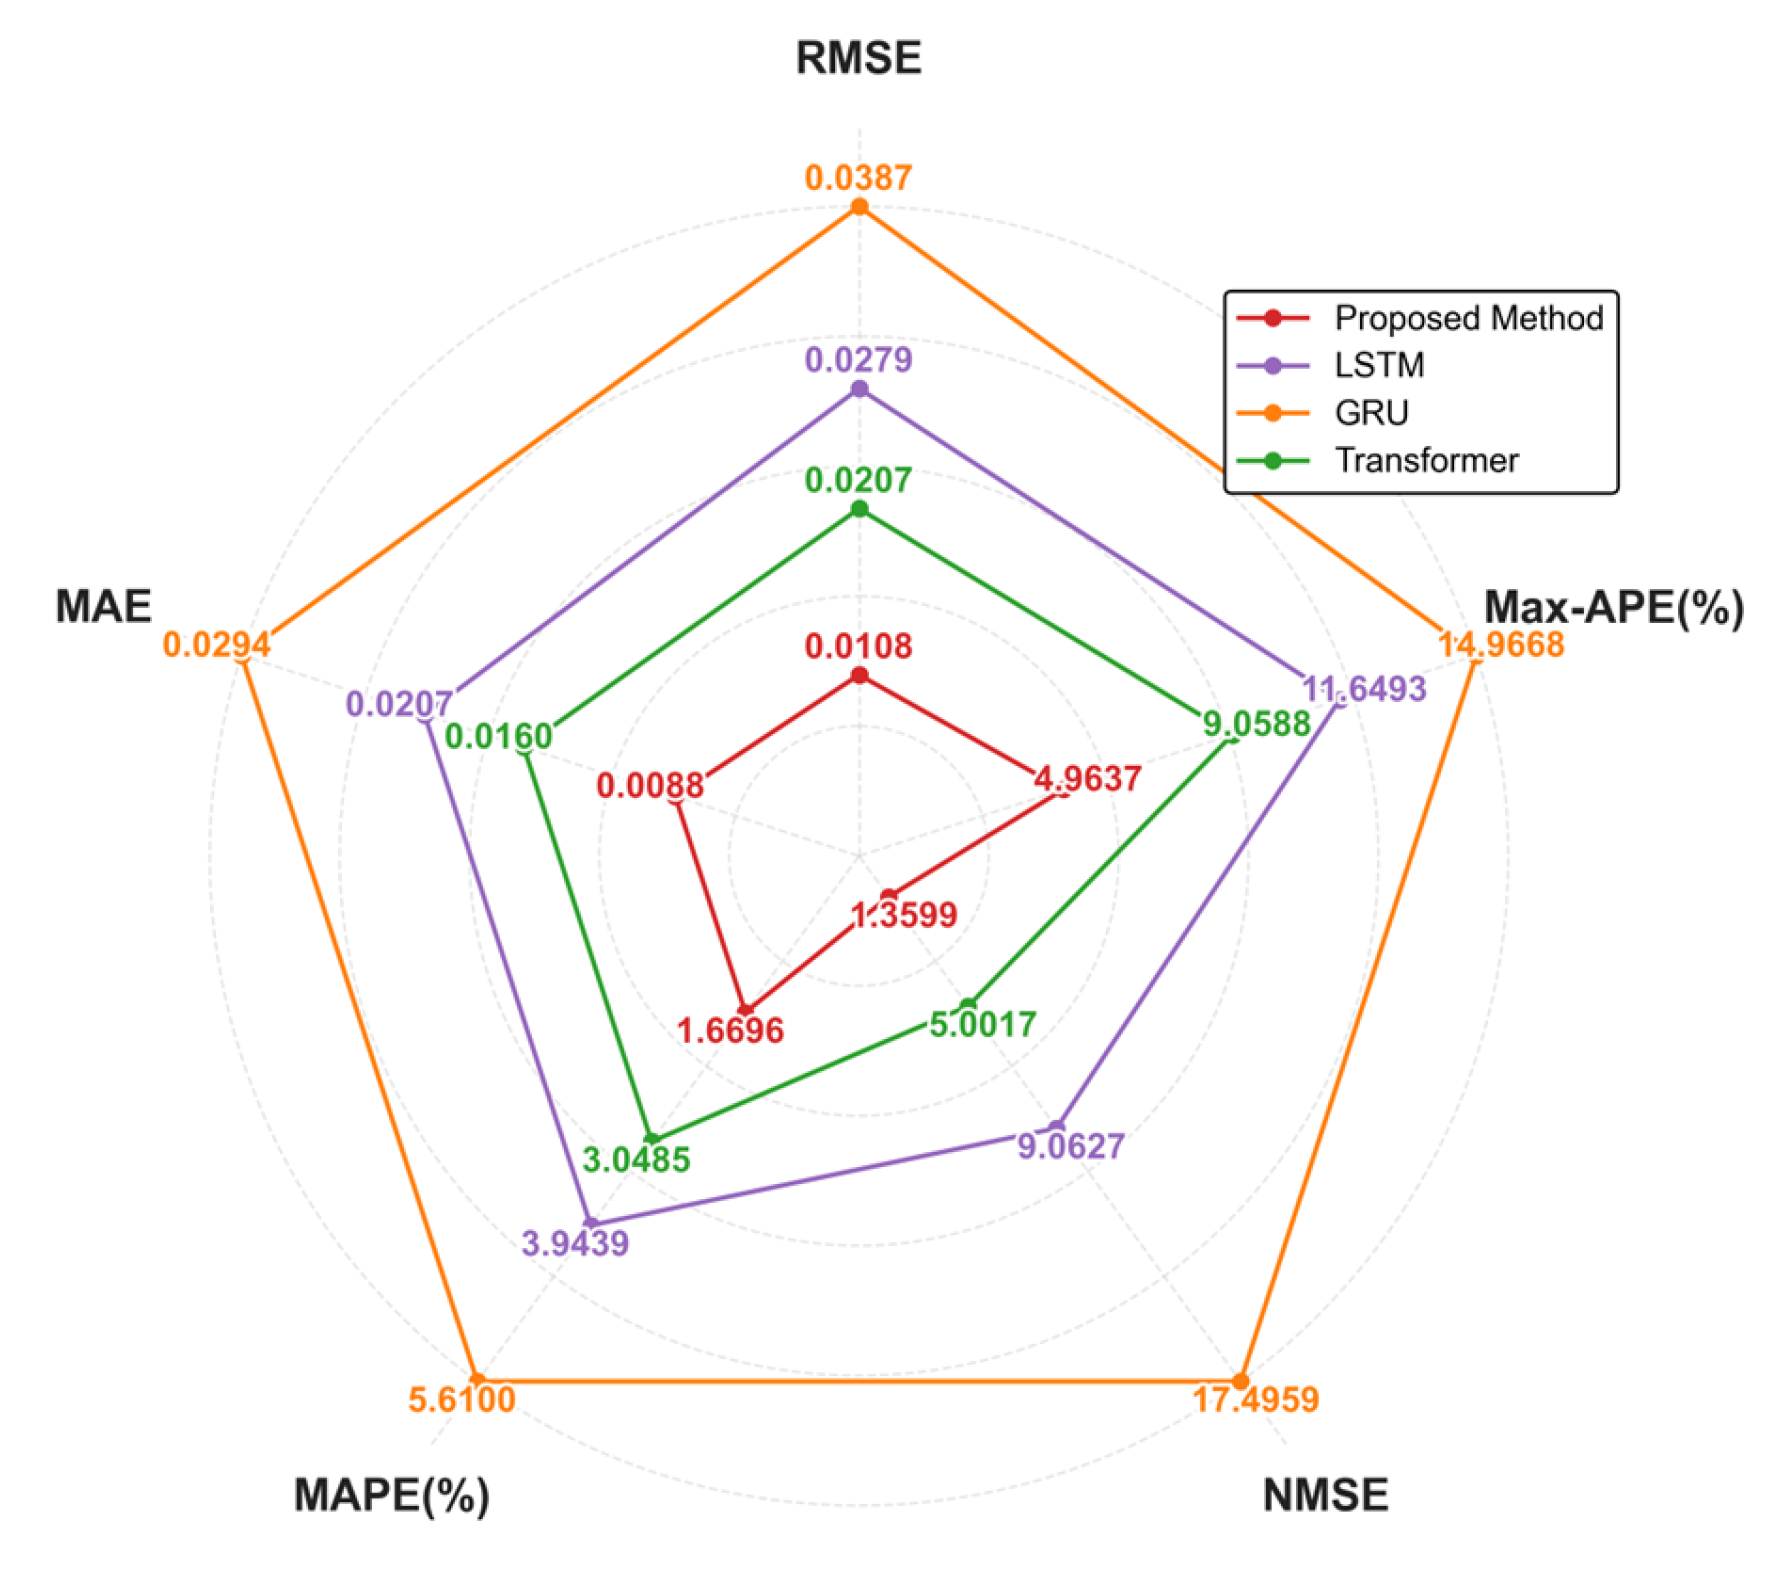
In order to comprehensively evaluate the prediction accuracy and robustness of the developed model, Figure 9 presents a comparative radar chart across five distinct error metrics, including RMSE, MAE, MAPE, NMSE, and Max-APE. In this visualization, a smaller geometric footprint of the enclosed polygon signifies a lower overall prediction error profile.
As illustrated, the proposed model occupies the innermost region, demonstrating absolute superiority across all evaluation criteria. Specifically, the model achieves the lowest RMSE and MAE, underlining its exceptional global fitting capability. Furthermore, the Max-APE of the proposed model is strictly confined to 4.9637%, which is substantially lower than that of the Transformer (9.0588%), LSTM (11.6493%), and GRU (14.9668%). This tight upper bound on peak error highlights the outstanding robustness of the model when coping with extreme transient fluctuations.
Compared with the standard recurrent networks LSTM and GRU, as well as the standalone Transformer architecture, the framework optimized by the multi-scale convolutional algorithm significantly minimizes the comprehensive forecasting errors. This demonstrates that the proposed methodology offers a highly reliable and consistent solution for high-precision, long-term prognostic forecasting of PEMFCs under complex time-series conditions.
To evaluate the computational costs and efficiency of the models, we compared the number of trainable parameters, floating-point operations (FLOPs), training time, and inference time under the same experimental settings. The detailed comparison results are presented in Table 4.
The proposed model requires 428.60 M FLOPs, which is higher than those required by the LSTM, GRU, and Transformer models. It also requires a total training time of 271.25 s over 80 epochs and an average of 3.39 s per epoch. In terms of inference efficiency, the proposed model requires 315.84 ms to complete the recursive prediction of 458 future data points. This value is higher than that of the baseline models, but the complete long-term forecast can still be generated within approximately 0.32 s.
Although the proposed model requires a longer training time, the total training duration of 271.25 s remains negligible compared with the 1008 h timescale of the degradation data. Therefore, the additional computational time is considered acceptable for practical applications. The proposed model provides a favorable balance between prediction performance and computational efficiency and demonstrates potential for practical PEMFC degradation-monitoring applications.

5. Conclusions

This paper presents a fuel cell voltage degradation prediction model that integrates multi-scale convolutional feature extraction, an LSTM-based encoder–decoder framework, and a cross-attention mechanism. The model is motivated by the complex temporal characteristics of the voltage signals of PEMFCs under long-term constant-current operation, which simultaneously exhibit fine-grained short-term fluctuations, periodic reversible recovery events, and a sustained long-term degradation trend that conventional single-architecture models struggle to capture jointly. Experimental validations explicitly verify that the proposed model establishes a clear performance margin across all evaluation metrics in comparison with the baseline models, including the standard LSTM, GRU, and Transformer. The results confirm that the integration of multi-scale local feature extraction and attention-augmented sequence-to-sequence modeling constitutes an effective strategy for long-horizon fuel cell voltage prediction. It should be acknowledged that the present study is limited to a single operating condition at 35.6 A constant current, and the generalizability of the proposed model across varying current loads, operating temperatures, humidity conditions, and fuel cell stack configurations remains to be systematically investigated. Future work will focus on extending the proposed framework to multi-condition and multi-dataset scenarios, incorporating transfer learning strategies to improve prediction robustness under diverse degradation modes, and further enhancing the interpretability and long-term reliability of the health state prediction of PEMFCs.

Author Contributions

Conceptualization, S.Z. and X.M.; data curation, S.Z., W.H., Z.S. and X.M.; formal analysis, S.Z., W.H., Z.S., K.Z. and J.M.; funding acquisition, C.S.; investigation, S.Z., K.Z., J.M. and X.M.; methodology, S.Z., W.H., K.Z., J.M. and X.M.; project administration, C.S.; resources, W.H., S.G. and C.S.; software, S.Z. and X.M.; supervision, C.S.; validation, S.Z., K.Z., J.M., S.G., and X.M.; visualization, S.Z., K.Z. and Z.S.; writing—original draft, S.Z. and C.S.; writing—review and editing, S.Z., W.H., S.G., C.S. and X.M. All authors have read and agreed to the published version of the manuscript.

Funding

This research was funded by the National Natural Science Foundation of China (Grant No. 52407239).

Data Availability Statement

The data presented in this study are available on request from the corresponding author, since the data are not publicly available due to privacy or ethical restrictions.

Acknowledgments

Formal analysis was carried out within the state assignment of NRC “Kurchatov Institute”.

Conflicts of Interest

Author Wenbo Hao was employed by the company State Grid Heilongjiang Electric Power Research Institute. The remaining authors declare that the research was conducted in the absence of any commercial or financial relationships that could be construed as a potential conflict of interest.

Abbreviations

The following abbreviations are used in this manuscript:
PEMFCProton exchange membrane fuel cell
LSTMLong short-term memory
MAPEMean absolute percentage error
Max-APEMaximum absolute percentage error
RULRemaining useful life
EISElectrochemical impedance spectroscopy
FC-DLCFuel cell dynamic load cycle
NEDCNew European Driving Cycle
LOWESSLocally weighted scatterplot smoothing
RMSERoot mean square error
APEAbsolute percentage error
MAEMean absolute error
RNNRecurrent neural network
FLOPFloating-point operation

References

  1. Jiao, K.; Xuan, J.; Du, Q.; Bao, Z.; Xie, B.; Wang, B.; Zhao, Y.; Fan, L.; Wang, H.; Hou, Z.; et al. Designing the next generation of proton-exchange membrane fuel cells. Nature 2021, 595, 361–369. [Google Scholar] [CrossRef] [PubMed]
  2. Staffell, I.; Scamman, D.; Abad, A.V.; Balcombe, P.; Dodds, P.E.; Ekins, P.; Shah, N.; Ward, K.R. The role of hydrogen and fuel cells in the global energy system. Energy Environ. Sci. 2019, 12, 463–491. [Google Scholar] [CrossRef]
  3. Li, X.; Ye, T.; Meng, X.; He, D.; Li, L.; Song, K.; Jiang, J.; Sun, C. Advances in the application of sulfonated poly(ether ether ketone) (speek) and its organic composite membranes for proton exchange membrane fuel cells (pemfcs). Polymers 2024, 16, 2840. [Google Scholar] [CrossRef] [PubMed]
  4. Cullen, D.A.; Neyerlin, K.C.; Ahluwalia, R.K.; Mukundan, R.; More, K.L.; Borup, R.L.; Weber, A.Z.; Myers, D.J.; Kusoglu, A. New roads and challenges for fuel cells in heavy-duty transportation. Nat. Energy 2021, 6, 462–474. [Google Scholar] [CrossRef]
  5. Jia, C.; Liu, W.; He, H.; Chau, K.T. Health-conscious energy management for fuel cell vehicles: An integrated thermal management strategy for cabin and energy source systems. Energy 2025, 333, 137330. [Google Scholar] [CrossRef]
  6. Mei, J.; Li, Z.; Song, K.; Meng, X.; Wu, H.; Tang, X.; Hasanien, H.M.; Li, Y.; Sun, C. Soh-disparity-aware energy management for multi-stack fuel cells using enhanced soft actor-critic reinforcement learning. IEEE Trans. Transp. Electrif. 2026; Early Access. [CrossRef]
  7. Lu, D.; Yi, F.; Hu, D.; Li, J.; Yang, Q.; Wang, J. Online optimization of energy management strategy for fcv control parameters considering dual power source lifespan decay synergy. Appl. Energy 2023, 348, 121516. [Google Scholar] [CrossRef]
  8. Zhang, X.; Chen, S.; Hong, J.; Yan, X.; Liu, X.; Yang, S. From degradation mechanisms to health management: Electrochemical impedance spectroscopy modeling for proton exchange membrane fuel cell systems. eTransportation 2026, 29, 100602. [Google Scholar] [CrossRef]
  9. Wallnöfer-Ogris, E.; Poimer, F.; Köll, R.; Macherhammer, M.; Trattner, A. Main degradation mechanisms of polymer electrolyte membrane fuel cell stacks—Mechanisms, influencing factors, consequences, and mitigation strategies. Int. J. Hydrogen Energy 2024, 50, 1159–1182. [Google Scholar] [CrossRef]
  10. Mamat, M.S.; Grigoriev, S.A.; Dzhus, K.A.; Grant, D.M.; Walker, G.S. The performance and degradation of pt electrocatalysts on novel carbon carriers for pemfc applications. Int. J. Hydrogen Energy 2010, 35, 7580–7587. [Google Scholar] [CrossRef]
  11. Meng, X.; Sun, C.; Mei, J.; Tang, X.; Hasanien, H.M.; Jiang, J.; Fan, F.; Song, K. Fuel cell life prediction considering the recovery phenomenon of reversible voltage loss. J. Power Sources 2025, 625, 235634. [Google Scholar] [CrossRef]
  12. Yu, X.; Yang, Y.; Xie, C.; Li, Y.; Zhao, B.; Zhang, L.; Song, J.; Deng, Z. Remaining-useful-lifetime prediction of proton exchange membrane fuel cell considering model uncertainty quantification on the full-time scale. IEEE Trans. Transp. Electrif. 2024, 10, 7443–7455. [Google Scholar] [CrossRef]
  13. Liu, C.; Chen, Y.; Xu, R.; Ruan, H.; Wang, C.; Li, X. Co-optimization of energy management and eco-driving considering fuel cell degradation via improved hierarchical model predictive control. Green Energy Intell. Transp. 2024, 3, 100176. [Google Scholar] [CrossRef]
  14. Hua, Z.; Zheng, Z.; Pahon, E.; Péra, M.; Gao, F. A review on lifetime prediction of proton exchange membrane fuel cells system. J. Power Sources 2022, 529, 231256. [Google Scholar] [CrossRef]
  15. Qasem, N.A.A. A recent overview of proton exchange membrane fuel cells: Fundamentals, applications, and advances. Appl. Therm. Eng. 2024, 252, 123746. [Google Scholar] [CrossRef]
  16. Nasser, B.; Tawalbeh, M.; Al-Othman, A.; Olabi, A.G. Advances in machine learning for the prediction of fuel cell membrane degradation. Renew. Sustain. Energy Rev. 2026, 226, 116235. [Google Scholar] [CrossRef]
  17. Ou, M.; Zhang, R.; Shao, Z.; Li, B.; Yang, D.; Ming, P.; Zhang, C. A novel approach based on semi-empirical model for degradation prediction of fuel cells. J. Power Sources 2021, 488, 229435. [Google Scholar] [CrossRef]
  18. Pan, R.; Yang, D.; Wang, Y.; Chen, Z. Health degradation assessment of proton exchange membrane fuel cell based on an analytical equivalent circuit model. Energy 2020, 207, 118185. [Google Scholar] [CrossRef]
  19. Messing, M.; Kjeang, E. Empirical modeling of cathode electrode durability in polymer electrolyte fuel cells. J. Power Sources 2020, 451, 227750. [Google Scholar] [CrossRef]
  20. Wu, H.; Fan, F.; Song, K.; Sun, C.; Li, Y.; Xie, C.; Meng, X.; Mei, J.; Chan, S.H. Reliable cross-domain lifetime prediction for fuel cells: A time-frequency fusion transfer learning architecture. Energy 2026, 344, 139854. [Google Scholar] [CrossRef]
  21. Zuo, J.; Steiner, N.Y.; Li, Z.; Hissel, D. Health management review for fuel cells: Focus on action phase. Renew. Sustain. Energy Rev. 2024, 201, 114613. [Google Scholar] [CrossRef]
  22. Huang, R.; Chen, Y.; Liu, C. Revealing state-feature dependencies in dynamic degradation: An exofeature-aware transformer for battery state-of-health prediction. IEEE Trans. Consum. Electron. 2026, 72, 719–730. [Google Scholar] [CrossRef]
  23. Tang, X.; Meng, X.; Liu, Z.; Miao, Y.; Hasanien, H.M.; Li, M.; Liu, J.; Sun, C. State of health estimation and degradation quantification of pemfcs using a dynamic coupling method of data-driven and electrochemical impedance. IEEE Trans. Transp. Electrif. 2026; Early Access. [CrossRef]
  24. Lu, Y.; Jiao, D.; Zhao, H.; Hou, Y.; Zheng, Y.; Yang, Q. Bayesian-lstm-transformer model for vehicle fuel cell life prediction. Int. J. Hydrogen Energy 2026, 202, 153045. [Google Scholar] [CrossRef]
  25. Wu, H.; Fan, F.; Hao, W.; Song, K.; Xue, R.; Jiang, J.; Sun, C.; Li, Y.; Xie, C.; Chan, S.H. Low-frequency consensus knowledge transfer in pem fuel cells for cross-domain online voltage degradation prediction. Green Energy Intell. Transp. 2026, 100405. [Google Scholar] [CrossRef]
  26. Meraghni, S.; Terrissa, L.S.; Yue, M.; Ma, J.; Jemei, S.; Zerhouni, N. A data-driven digital-twin prognostics method for proton exchange membrane fuel cell remaining useful life prediction. Int. J. Hydrogen Energy 2021, 46, 2555–2564. [Google Scholar] [CrossRef]
  27. Zuo, J.; Lv, H.; Zhou, D.; Xue, Q.; Jin, L.; Zhou, W.; Yang, D.; Zhang, C. Long-term dynamic durability test datasets for single proton exchange membrane fuel cell. Data Brief. 2021, 35, 106775. [Google Scholar] [CrossRef] [PubMed]
  28. Zuo, J.; Lv, H.; Zhou, D.; Xue, Q.; Jin, L.; Zhou, W.; Yang, D.; Zhang, C. Deep learning based prognostic framework towards proton exchange membrane fuel cell for automotive application. Appl. Energy 2021, 281, 115937. [Google Scholar] [CrossRef]
  29. Bloom, I.; Walker, L.K.; Basco, J.K.; Malkow, T.; Saturnio, A.; De Marco, G.; Tsotridis, G. A comparison of fuel cell testing protocols—A case study: Protocols used by the u.s. Department of energy, european union, international electrotechnical commission/fuel cell testing and standardization network, and fuel cell technical team. J. Power Sources 2013, 243, 451–457. [Google Scholar] [CrossRef]
  30. Gouriveau, R.; Hilairet, M.; Hissel, D.; Jemei, S.; Jouin, M.; Lechartier, E.; Morando, S.; Pahon, E.; Pera, M.C.; Zerhouni, N. IEEE phm 2014 data challenge: Outline, experiments, scoring of results, winners. In Proceedings of the IEEE Conference on Prognostics and Health Management, Cheney, WA, USA, 22–25 June 2014; pp. 1–6. [Google Scholar]
Figure 1. (a) Current load level and measured output voltage values in the first 1200 s. (b) Complete output voltage data for PEMFC during the long-term durability test.
Batteries 12 00262 g001
Figure 2. Architecture of the proposed multi-scale perception LSTM encoder–decoder with multi-head attention for the voltage prediction of PEMFCs.
Batteries 12 00262 g002
Figure 3. (a) Original voltage scatter plot under rated current; (b) downsampled and LOWESS-smoothed data.
Batteries 12 00262 g003
Figure 4. Proposed model prediction results on the dataset.
Batteries 12 00262 g004
Figure 5. Proposed model prediction results on an additional IEEE dataset: (a) original split; (b) 5:2:3 train–validation–test split.
Batteries 12 00262 g005
Figure 6. Prediction results of the proposed model and its ablation variants.
Batteries 12 00262 g006
Figure 7. Prediction results of performance degradation for different models.
Batteries 12 00262 g007
Figure 8. Prediction results of APE for different models.
Batteries 12 00262 g008
Figure 9. Radar chart of test data prediction error comparison.
Batteries 12 00262 g009
Table 1. Hyperparameter configuration table.
HyperparameterValueDescription
Target_samples1008Target sample size after downsampling
Train_cutoff550Training set cutoff index
Seq_len90Input sequence length
Pred_len60Prediction length
Hidden_size128LSTM hidden layer dimension
Patience40Patience for early stopping
Num_heads4Number of multi-head attention heads
Batch_size16Batch size
Epochs200Maximum number of training epochs
LR0.0008Initial learning rate
Num_Layers2Number of LSTM layers
Frac0.01Smoothing window fraction
Validation set ratio20%Split from the pre-cutoff training set
Normalization range[−1, 1]MinMaxScaler feature range
Dropout0.1Dropout rate
Conv channels32 × 3 = 9632 × 3 channels, concatenated across three scales
Conv Kernels[3, 5, 7]Kernel sizes for each convolution
Table 2. Comparison results of different input and output window lengths.
Input LengthOutput LengthMAE/VRMSE/V
60600.01370.0164
90300.00850.0109
90600.00880.0108
90900.00880.0118
120600.01880.0244
Table 3. Quantitative evaluation results of the ablation study.
ModelMAERMSEMAPENMSEMax-APE
Proposed0.00880.01081.66961.35994.9637
Without Multi-Scale Perc0.01300.01472.50962.52527.8331
Without Attention0.01280.01622.43813.07167.3397
Without Encoder–Decoder0.02330.02674.48788.284010.9179
Table 4. Comparison of computational costs and efficiency of the models.
ModelFLOPs/MEpochsTraining Time/sInference Time/ms
Proposed428.6080271.25315.84
LSTM59.15114157.20107.65
GRU44.3796119.80107.28
Transformer79.1110213.738.16
Disclaimer/Publisher’s Note: The statements, opinions and data contained in all publications are solely those of the individual author(s) and contributor(s) and not of MDPI and/or the editor(s). MDPI and/or the editor(s) disclaim responsibility for any injury to people or property resulting from any ideas, methods, instructions or products referred to in the content.