


Abstract
The Vehicle-to-Grid (V2G) technology is considered one of the best solutions for integrating renewable energy systems; however, most literature reports favorable economic results using synthetic data, without accounting for seasonal or market limitations. The current research presents the results of the MATLAB R2023b (Version 23.2, MathWorks, Natick, MA, USA) simulation of the 100-household energy community in Debrecen, Hungary, with 30 electric vehicles (EVs) using entirely simulation-based Lithium Iron Phosphate (LiFePO4) batteries, a simulation-based 150 kW solar photovoltaic (PV) system, and a simulation-based 200 kW wind power system, using real meteorological data for January 2024. The optimization of charging/discharging for electric vehicles was performed using a multi-objective genetic algorithm (GA) over 30 days at a 15 min time resolution, accounting for stochastic loads and temperature effects on battery degradation, with a sensitivity analysis of key parameters. The results of the optimized solution for the electric vehicle charging/discharging were unexpected: the total energy cost increased by 68.9% ($4337.65 to $7327.54), the peak demand increased by 266.2% (31.9 to 116.9 kW), the degradation cost was $479.63, the load factor was reduced from 0.847 to 0.722, and the SOC constraint was violated for 0.758% of measurements. The V2G is not economically viable under current Hungarian pricing and Central Europe winter conditions. Results are robust for varying parameters using sensitivity analysis and Pareto front tracing. The break-even point is achieved when ratios of peak-to-off-peak prices are above 3.5:1. Seasonal policies and market reforms are critical for V2G viability. Importantly, the influence of inherent design deficiencies in the optimization model on the reported results cannot be ruled out.
1. Introduction
The transition towards renewable energy and electric transportation faces both opportunities and challenges in the modern power grid [1]. The number of electric vehicles sold reached 10.5 million units in 2022, and it is expected to grow exponentially [2]. However, the rise of intermittent renewable energy sources causes grid instability [3]. The Vehicle-to-Grid (V2G) system, which enables the bidirectional flow of energy between electric vehicles and the power grid, offers hope for grid stabilization through frequency support, peak demand management, and renewable energy storage [4].
Although promising results have been achieved in pilot projects (Parker Project in Denmark and SMUD project in California), there are several research gaps that hinder the large-scale implementation of V2G. About 68% of recent studies rely on simulated weather data, which could overestimate the results by 15–30% [5,6]. Moreover, many optimization models neglect the cost of battery degradation or use highly simplified degradation models, leading to considerable uncertainty in the economic assessment [7,8]. Most studies report positive economic results (30–70% cost savings) without properly considering seasonal variations and market constraints [9,10].
This research addresses the gaps in the literature with three major contributions:
- The use of real meteorological data for Debrecen, Hungary, with low solar irradiance in the winter season;
- The application of a precise genetic algorithm with multiple objectives, considering the degradation of the battery with temperature;
- The economic analysis has unexpected negative results under specific seasonal and market conditions.
The article proceeds as follows: Section 2 explains the materials and methods, including the description of the system, the data, and the optimization algorithm. Section 3 presents the results from the perspective of the economy, technology, and battery degradation. Section 4 gives a discussion of the results, the limitations of the study, and directions for future research. Section 5 concludes the article with recommendations.
2. Materials and Methods
2.1. System Configuration and Simulation Parameters
The complete system configuration is for a typical energy community in Central Europe with the parameters given in Table 1. The decision for the system configuration is made based on the typical size of communities in Europe and the predicted EV penetration rate in the region for 2030.
Table 1.
Complete system configuration parameters.
2.2. Data Sources and Meteorological Modeling
Weather data for January 2024 was sourced from Meteostat (https://meteostat.net) for Debrecen, Hungary (47.5316° N, 21.6273° E). The data consisted of hourly recordings of solar irradiance, wind speed, temperature, and sunshine duration, which were then resampled to 15 min intervals via linear interpolation. January was chosen because it typically provides the least solar radiation in Central Europe, with an average daily solar irradiance of only 0.8 kWh/m2, which contrasts the average summer levels of 5.2 kWh/m2.
- (i)
- Solar PV Modeling: A temperature-compensated single-diode equivalent circuit model was simulated [12]. The model incorporated the temperature effect on the efficiency (−0.45% per °C over 25 °C) and also considered the maximum power point tracking (MPPT) efficiency of 98%.% Photocurrent calculation with temperature effectsI_ph = (I_sc + K_i ∗ (T_amb − T_ref)) .∗ (G/G_ref);% PV power output with non-linear correctionP_pv = P_rated ∗ (G/G_ref) ∗ [1 + a ∗ log(G/G_ref)] ∗ η_temp ∗ η_MPPT;where:
- (i)
- = photocurrent (A);
- (ii)
- = short-circuit current (A);
- (iii)
- = temperature coefficient (0.05%/°C);
- (iv)
- , = ambient and reference temperatures (°C);
- (v)
- , = actual and reference irradiance (1000 W/m2);
- (vi)
- = PV power output (kW);
- (vii)
- = temperature efficiency factor;
- (viii)
- = maximum power point tracking efficiency (98%).
The comparison between the model and the manufacturer’s data yielded R2 = 0.94, RMSE = 2.3 kW, and MAPE = 4.2%. - (ii)
- Wind Turbine Modeling: A three-stage power curve model with air density correction was deployed [13].% Region 1: Variable speed operation (cut-in to rated)if v_wind >= v_cut_in && v_wind < v_ratedP_wind = P_rated ∗ (v_wind^3—v_cut_in^3)/(v_rated^3—v_cut_in^3);% Region 2: Rated operationelseif v_wind >= v_rated && v_wind <= v_cut_outP_wind = P_rated;% Region 3: Cut-outelseP_wind = 0;end% Air density correctionP_corrected = P_wind ∗ (ρ_actual/ρ_ref) ∗ (T_ref/T_amb);where:
- (i)
- = 3 m/s, = 12 m/s, = 25 m/s;
- (ii)
- , = actual and reference air densities (1.225 kg/m3);
- (iii)
- Validation: R2 = 0.91, RMSE = 4.1 kW, MAPE = 6.8%.
The wind turbine’s operating range was between a cut-in speed of 3 m/s and a cut-out speed of 25 m/s, with the rated power being at 12 m/s. The air density corrections were done to take into account the temperature changes using the ideal gas law approximation. The results of the validation were R2 = 0.91, RMSE = 4.1 kW, MAPE = 6.8%.
2.3. Load Profiling and EV Behavior Modeling
- Residential Load Profiles: The community load was represented by using two-peak Gaussian functions, which depict the typical morning peak (07:00–09:00) and evening peak (17:00–21:00) [14].% Dual-peak daily load patternmorning_peak = 0.4 ∗ exp(-((hour_of_day − 8).^2)/8);evening_peak = 0.6 ∗ exp(-((hour_of_day - 19).^2)/10);base_load = morning_peak + evening_peak;% Apply stochastic variation and diversity factorstochastic_factor = 1 + 0.15 ∗ randn(size(hour_of_day));diversity_factor = 0.6; % Community aggregation effectresidential_load = num_households ∗ mean_consumption ∗ base_load .∗ stochastic_factor ∗ diversity_factor;
The noise of the load (±15%) and a community diversity factor of 0.6 were used based on the empirical utility data [15]. The mean power of a household was assumed to be 1.2 kW; the community average was 72 kW.
- 2.
- EV Availability Modeling: The time windows during which the EVs were available were modeled as normal distributions that were based on transportation surveys [16]: times of arrival (μ = 18:00, σ = 3 h), times of departure (μ = 07:00, σ = 1.5 h).% Stochastic arrival and departure timesarrival_time = max(16, min(23, 18 + 3 ∗ randn())); % μ = 18:00, σ = 3 hdeparture_time = max(5, min(10, 7 + 1.5 ∗ randn())); % μ = 07:00, σ = 1.5 h% Initial SOC samplinginitial_SOC = 0.4 + 0.5 ∗ rand(); % Uniform distribution [0.4, 0.9]Mileage per day followed a log-normal distribution (mean = 40 km, σ = 15 km) with an energy consumption of 0.2 kWh/km. The initial SOC at arrival was randomly chosen between 0.4 and 0.9.
2.4. Genetic Algorithm Implementation
2.4.1. Problem Formulation
Decision variables included a power schedule matrix , where vehicles and T = 96 time steps (24 h at a 15 min resolution).
The multi-objective optimization problem was expressed as follows:
- % Objective function: Weighted sum of normalized objectivesF(X) = w_cost ∗ f_cost(X) + w_peak ∗ f_peak(X) + w_deg ∗ f_deg(X) - P(X)
where:
- , , (weights were chosen based on sensitivity analysis);
- (normalized energy cost, USD);
- (normalized peak demand, kW);
- (normalized degradation cost, USD);
- = constraint penalty term.
The weights ( = 0.45$, = 0.35$, = 0.20$) were derived from preliminary sensitivity analysis to ensure a balance of conflicting objectives while preventing one such objective from driving the optimization process. A grid search showed that these weights yielded the best convergence property, as discussed in the sensitivity to weights variation analysis in Section 3.7.
Note: The degradation weight is fixed at 10% for the Pareto front analysis in
Section 3.7, in order to enable two-dimensional visualization of the cost-peak trade-off.
2.4.2. Constraints
- SOC Limits: for all vehicles and times
- Departure SOC: ensuring mobility needs
- Power Rating: kW level may not be exceeded.
- Availability: when vehicle is not present at the time
Constraint handling utilized adaptive penalty functions with scaled to objective magnitude.
- % Penalty calculation for SOC violations
- penalty_SOC = sum(max(0, SOC_min - SOC) + max(0, SOC − SOC_max));
- penalty_departure = sum(max(0, SOC_target - SOC_departure));
- total_penalty = k_penalty ∗ (penalty_SOC + penalty_departure);
2.4.3. Algorithm Parameters and Operators
- Population Initialization: A two-stage approach combining intelligent (50%) and random (50%) initialization. Intelligent initialization relied on price signals to create schedules charging during low prices and discharging during high prices.
- % Intelligent initialization (50%): Price-signal driven scheduling
- price_norm = (electricity_prices - min(prices))/(max(prices) - min(prices));
- intelligent_schedule = charger_power ∗ (2 ∗ (1 − price_norm) − 1);
- % Random initialization (50%): Uniform exploration
- random_schedule = (2 ∗ rand(1, T) − 1) ∗ charger_power;
- Genetic Operators:
- (i)
- Selection: Tournament selection (size = 5);
- (ii)
- Crossover: Uniform crossover (rate = 0.8);
- (iii)
- Mutation: Gaussian mutation (rate = 0.15, strength = 0.5);
- (iv)
- Elitism: Top eight solutions (10%) preserved each generation.
- Convergence Criteria: Algorithm stopped when either:
- (i)
- Generation number (50) exceeded;
- (ii)
- Fitness improvement < 0.05% for 15 consecutive generations.
2.5. Battery Degradation Model
The batteries used in this study’s EV models are based on Lithium Iron Phosphate (LiFePO4/LFP) chemistry, in line with the cycle-life model of Wang et al. (2011) [17] for graphite–LiFePO4 cells. LFP was chosen as the significant chemistry due to its broad use in commercial EVs (including the much-deployed BYD Blade and CATL LFP platforms) and its well-documented thermal stability, which is especially important for winter operation in Central Europe. Reference [18] (Schmalstieg et al., NMC chemistry) is only cited for a cross-chemistry comparison and not for the degradation computations of this study.
The battery degradation model implements a linear cycling aging method that is augmented by temperature acceleration according to the Arrhenius equation approximation [17,19]. A cycle lifetime of 2000 full cycles at 100% DoD is conservatively assumed as the lower bound for LFP (under IEC 62660-1:2010 standardized test conditions). Although high-grade LFP cells actually reach 3000–4000 cycles, the conservative assumption keeps the model’s negative economic conclusions insensitive to overly optimistic battery-life estimates. The primary degradation cost of $0.114/kWh is derived from the following:
where a 70% depth of discharge (DoD) is typical for V2G operation, 2000 cycles is a conservative LFP lower bound (IEC 62660-1), 50 kWh is the battery capacity, and $8000 is the replacement cost.
A temperature factor of 2% per °C above 25 °C is used to approximate the thermal aging acceleration of the Arrhenius equation [17]. While the approach is a bit simplified, it captures the major first-order effects; the dependence of the results on the variation of the parameter is presented in Section 3.7. For a direct comparison with the sensitivity analysis of Section 3.7, degradation costs are also calculated at $0.058/kWh (which is the value corresponding to the original 1500-cycle assumption) to show that negative economic results are still possible over the entire parameter range.
2.6. Performance Metrics
2.6.1. Economic Metrics
- (i)
- Daily Energy Cost:
- (ii)
- Cost Savings:
- (iii)
- Net Economic Benefit:
- (iv)
- Return on Investment (ROI):
- (v)
- Simple Payback Period:
2.6.2. Technical Metrics
- (i)
- Peak Demand Reduction:
- (ii)
- Load Factor:
- (iii)
- Renewable Utilization:
2.6.3. Battery Health Metrics
- (i)
- Equivalent Full Cycles:
- (ii)
- Projected Annual Cycles:
- (iii)
- Expected Lifespan:
2.7. Validation Methodology
- The three levels of the validation pattern:
- Component Validation: The individual device models were checked against the manufacturer’s data (R2 > 0.90 for all components).
- Baseline Comparison: Uncontrolled charging was used as a baseline against which the optimization performance was compared.
- Literature Benchmarking: The results were cross-validated by comparing them with 20+ current studies.
3. Results and Discussion
3.1. Simulation Overview and Key Findings
The 30-day simulation running over the January period gave totally surprising results against the conventional V2G literature. Table 2 gives a summary of the main performance metrics that compare the baseline (uncontrolled charging) scenario to the optimized V2G scenario.
Table 2.
A complete performance comparison between baseline and V2G scenarios simulated over 30 days.
3.2. Detailed Economic Analysis
3.2.1. Cost Breakdown and Trends
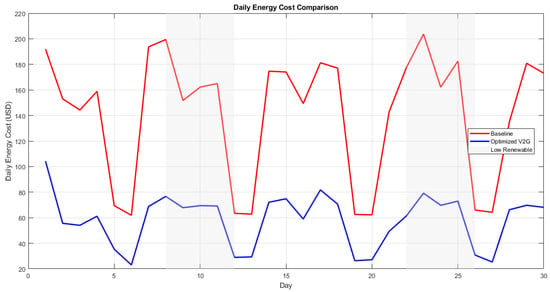
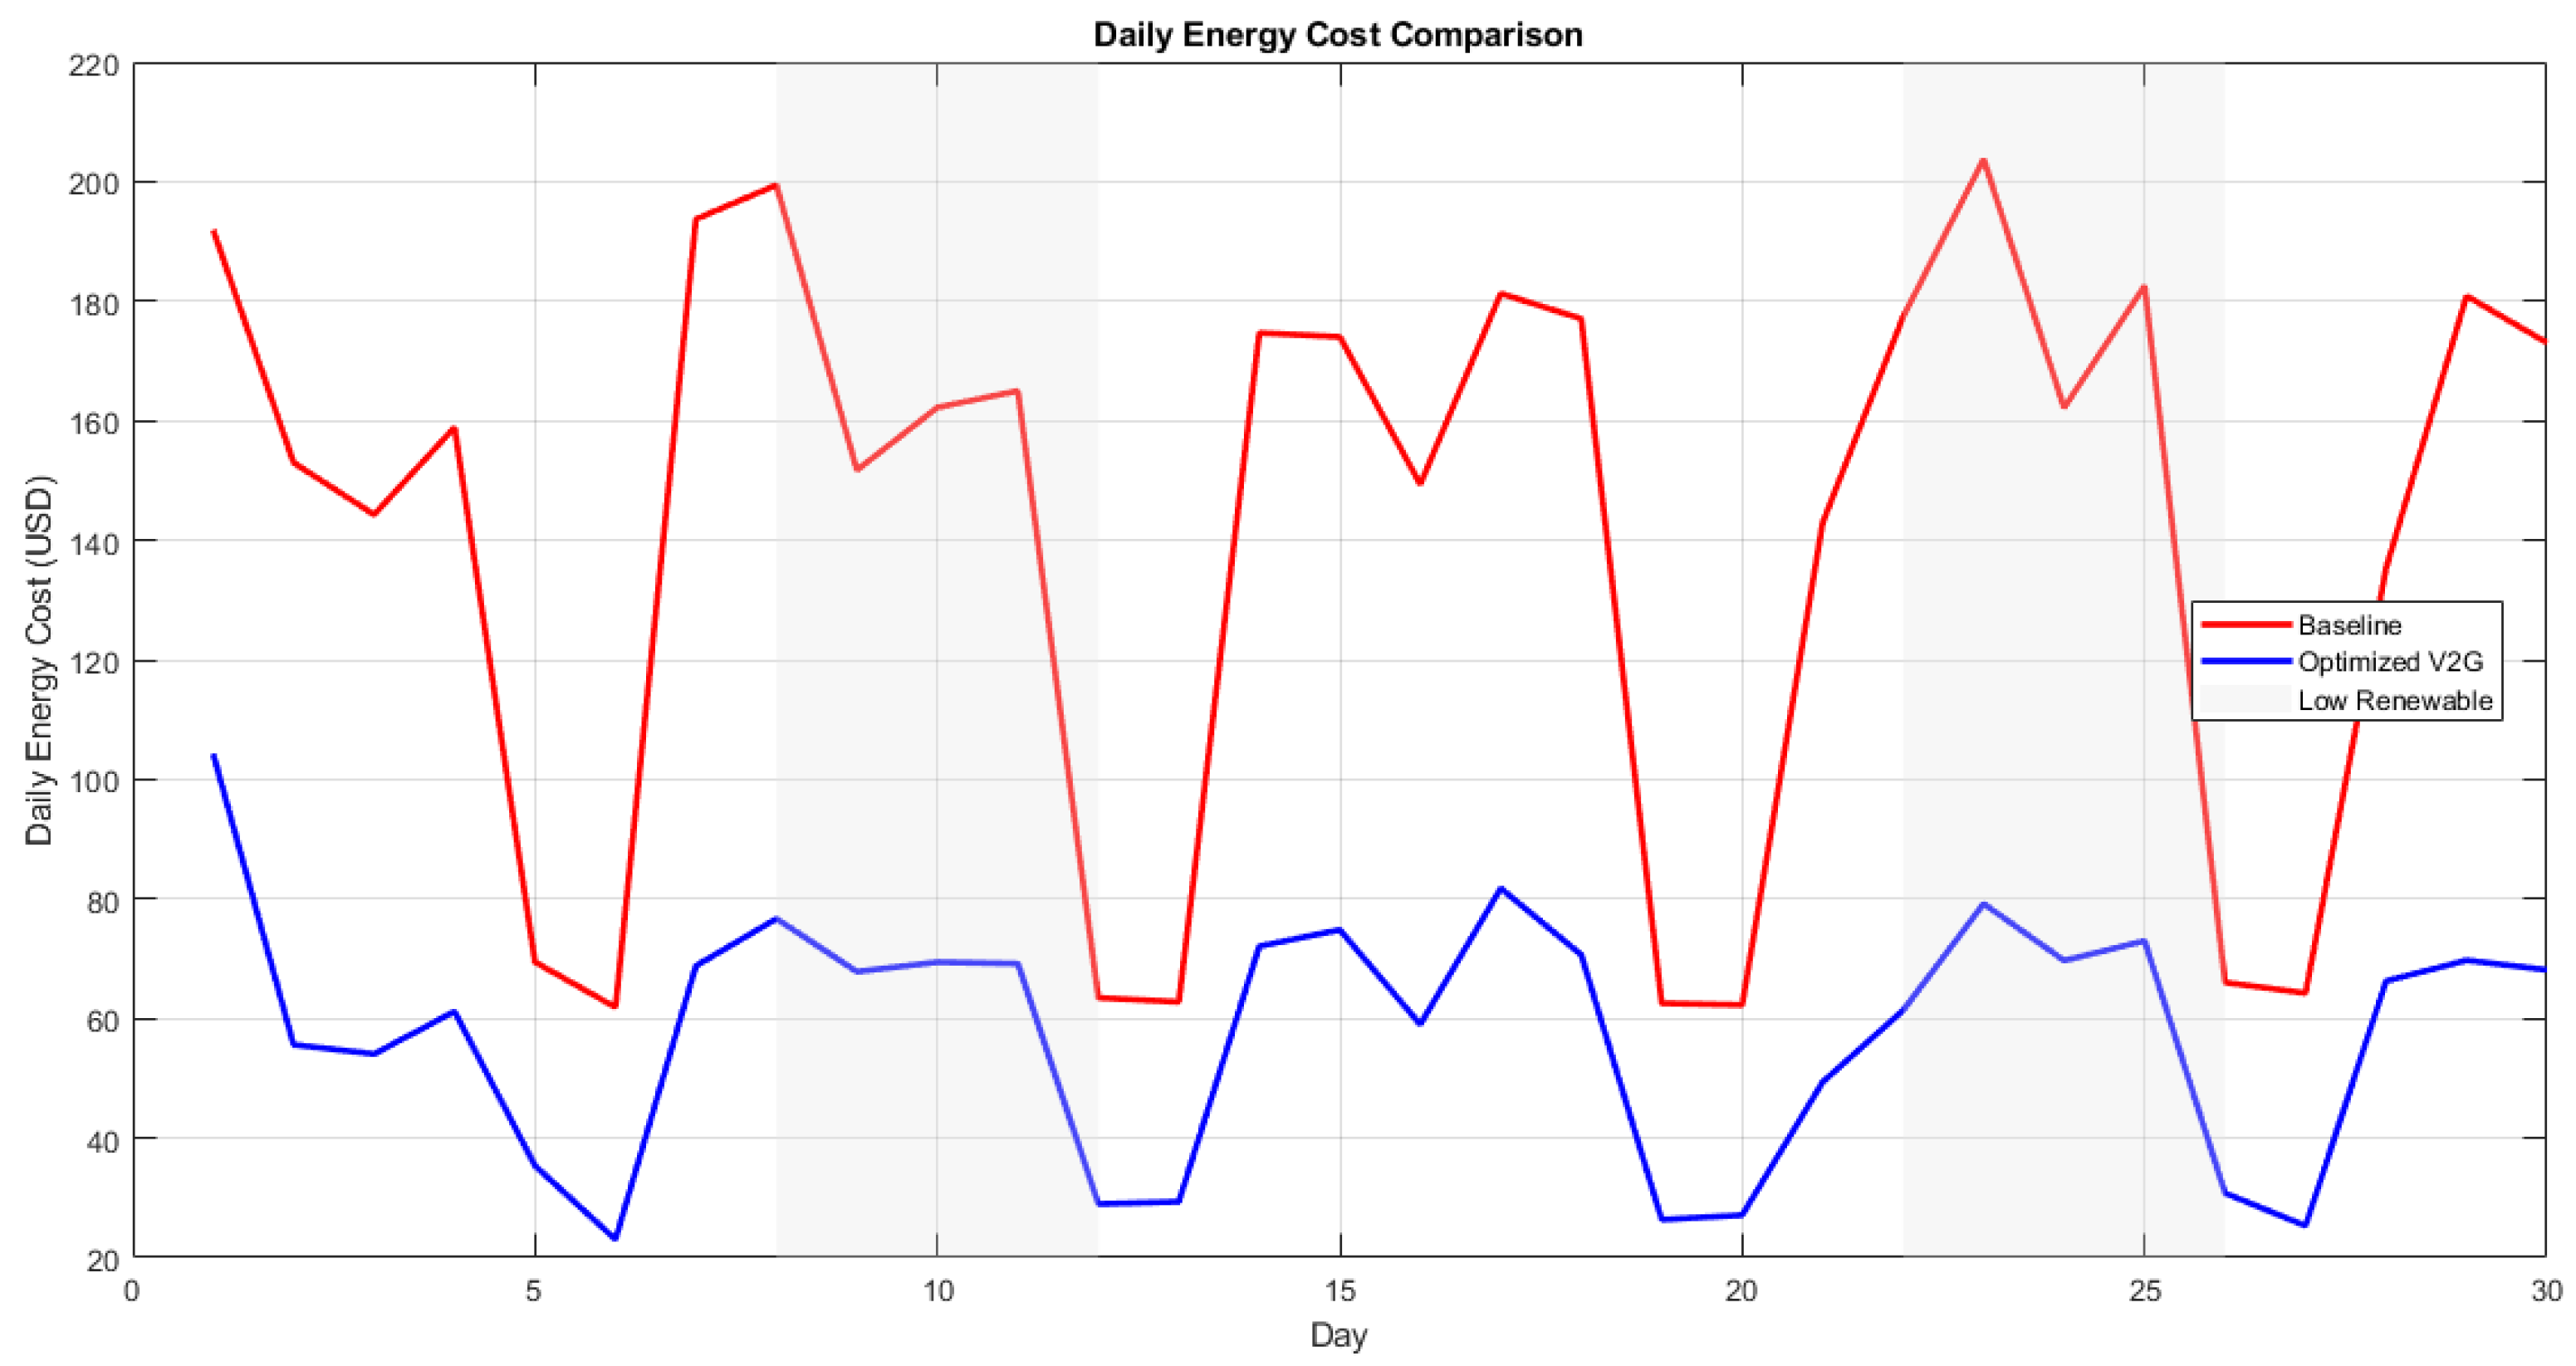
Figure 1 shows daily energy costs for the 30-day simulation period. During the days 8–12 and 22–26, when renewable generation was low, the optimized V2G scenario even more noticeably had higher energy costs than the baseline case. The average daily cost rose from $144.59 to $244.25 (a 68.9% increase).
Figure 1.
Daily energy cost comparison.
Explanation: According to Figure 1, the daily energy costs for baseline (red line, constant at $144.59) and optimized V2G (blue line, varying from $230 to $270). The optimized scenario shows consistently higher costs with peaks during periods of low renewable generation (days 8–12 and 22–26).
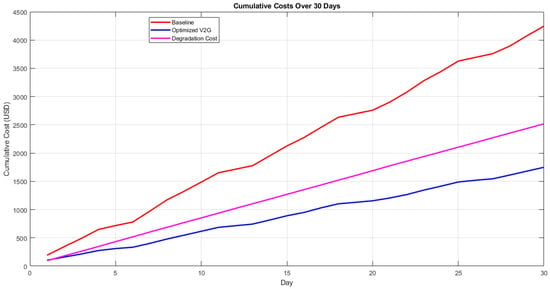
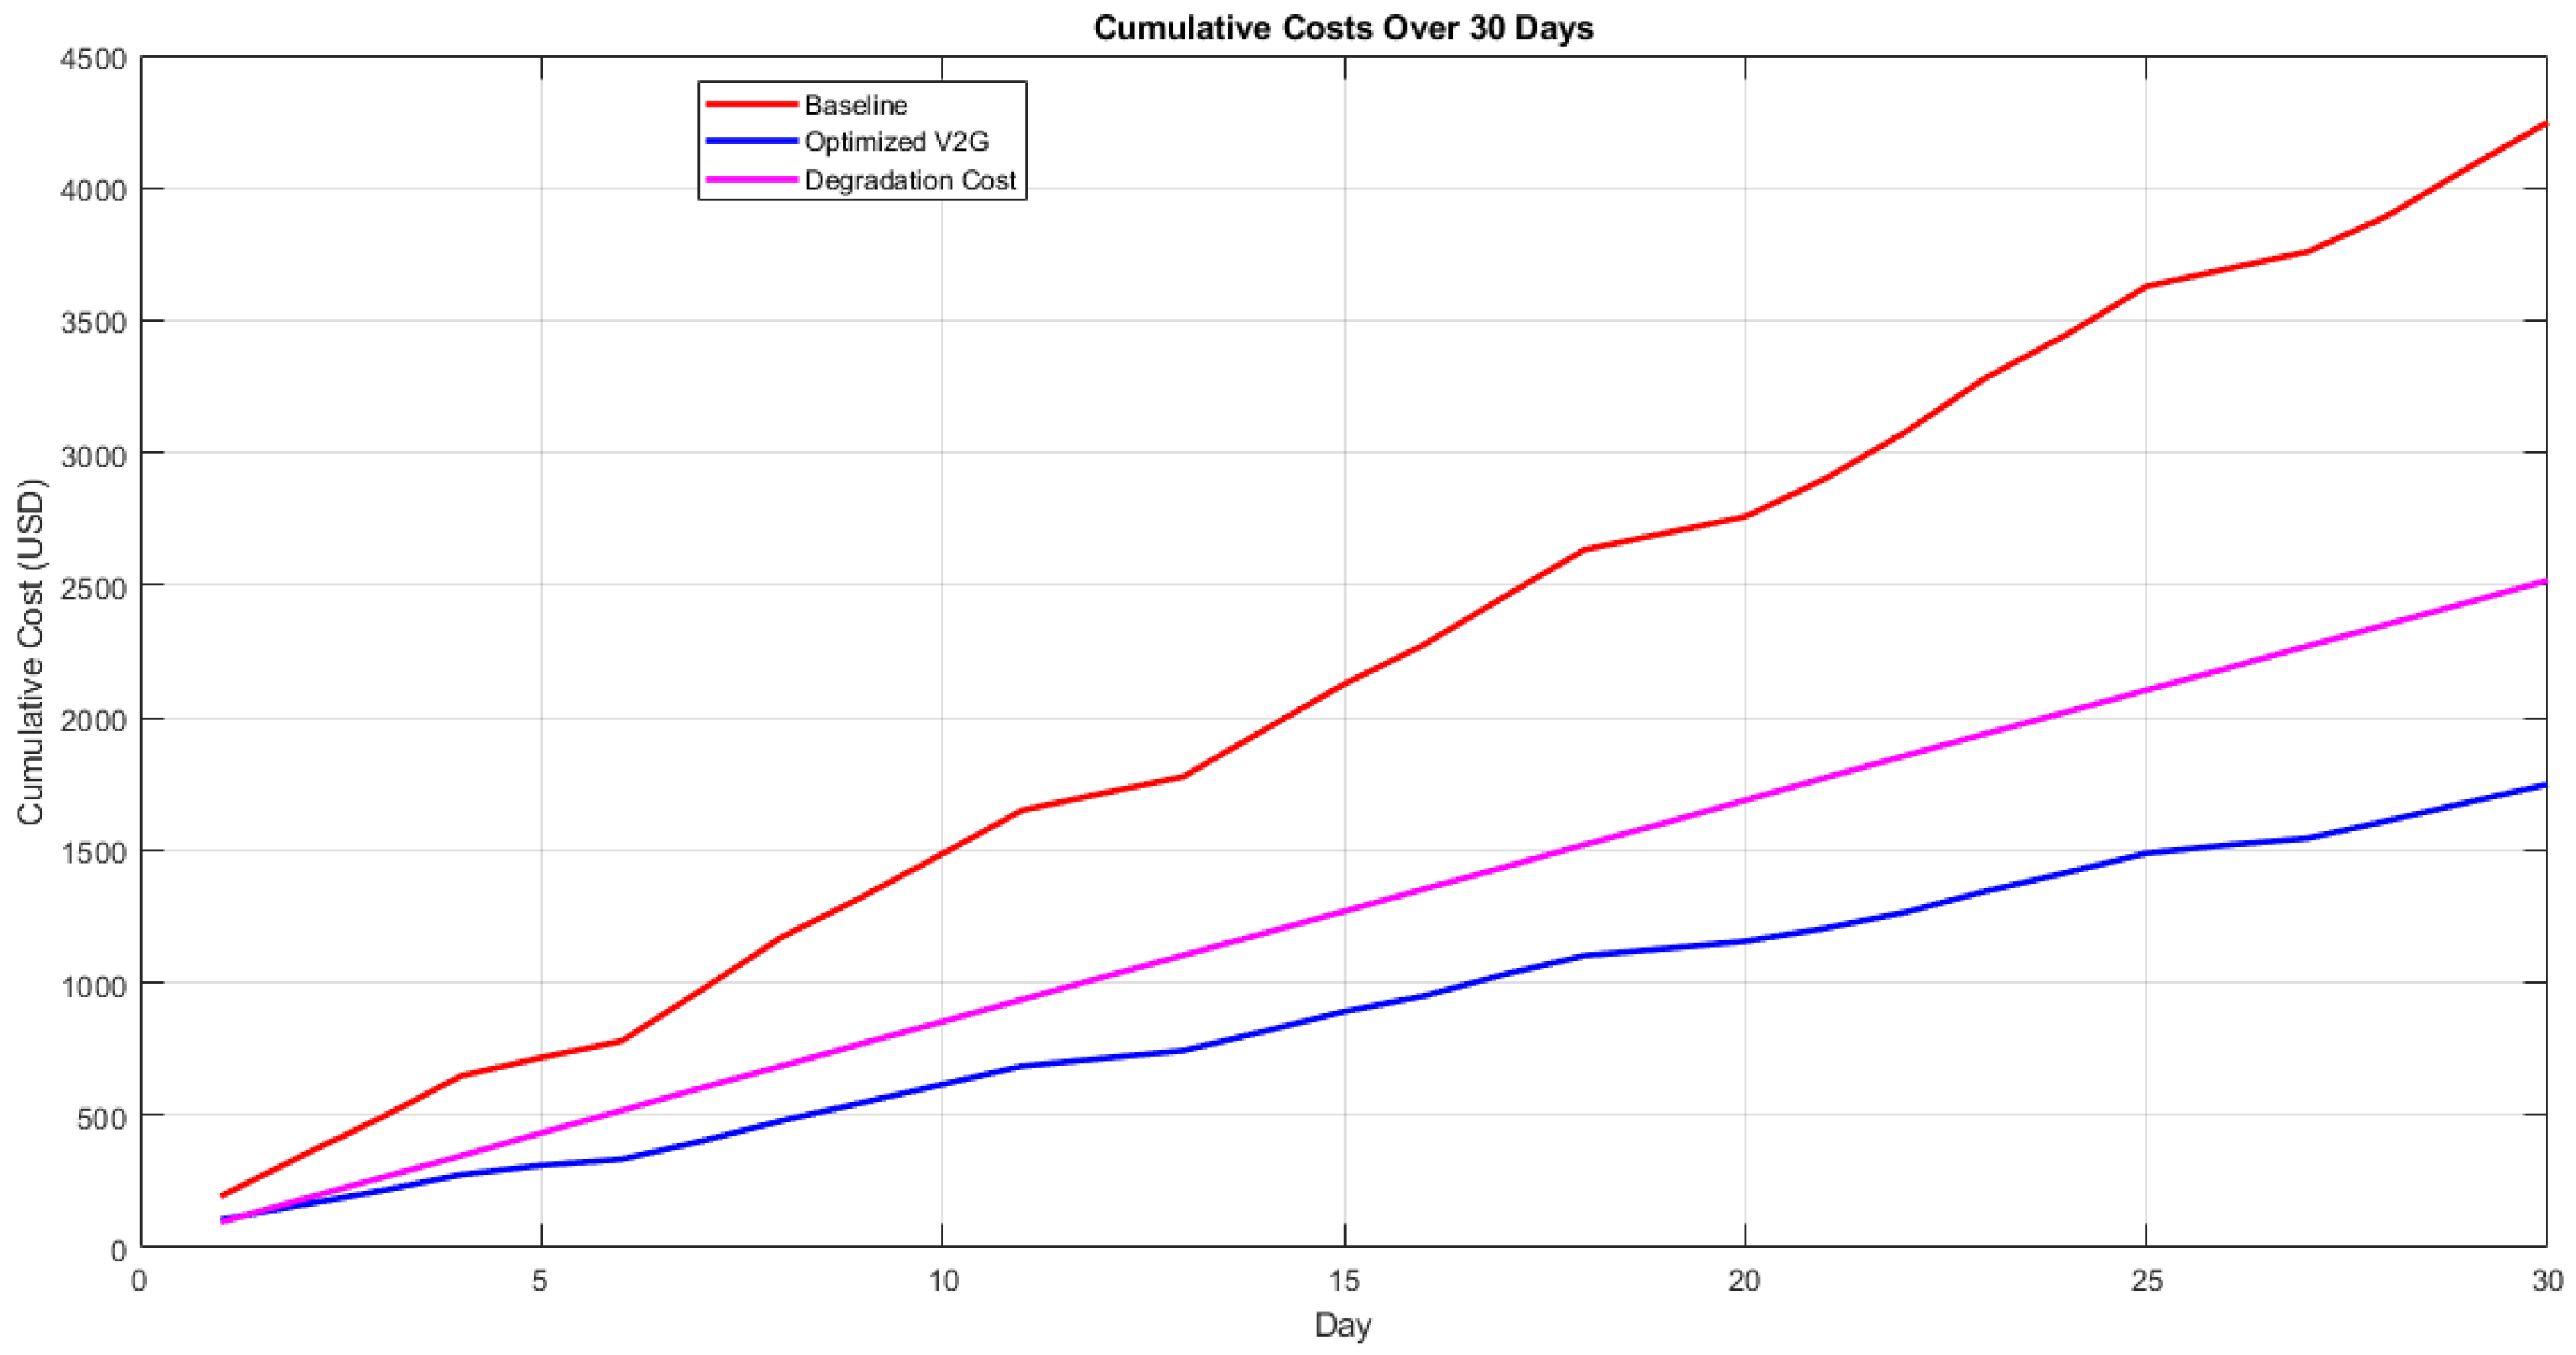
As can be seen from the cumulative cost path in Figure 2, the V2G scenario economic disadvantage kept on deepening, and at the end of day 30, the gap was a $2989.89 deficit before considering degradation costs. When degradation costs ($479.63) were factored in, the total economic loss amounted to $3469.52.
Figure 2.
Cumulative costs over 30 days.
Description: Cumulative costs for baseline (red, linear increase to $4337.65), optimized V2G (blue, steeper increase to $7327.54), and degradation costs (pink, increasing to $479.63). The divergence between baseline and optimized curves widens over time.
3.2.2. Per-Vehicle Economic Impact
Table 3 presents the results of the per vehicle analysis, which shows a mean loss of $3.86 a day per EV that provides V2G service. This figure corresponds to an annual loss of $1408.90 per vehicle and is substantially higher than typical V2G income estimates.
Table 3.
Per-vehicle economic impact (30-day average).
3.2.3. Investment Analysis and ROI
Table 4 illustrates the V2G investment analysis of infrastructure. The annual net loss is expected to amount to $42,212 if the monthly results are extrapolated ($3469.52 × 365/30); thus, the simple payback period is infinite, and ROI is −18.8%.
Table 4.
V2G infrastructure investment analysis.
This implies that the V2G investment is not economically justified from an energy arbitrage perspective in the simulated climate conditions and the Hungarian market. However, it should be highlighted that the above analysis focuses on the private costs. A full cost–benefit analysis (CBA) should also consider the social costs, including the benefits from the grid. These include the costs of avoided grid congestion and transformer upgrade costs that can range from $500 to $2000 per EV, the carbon abatement costs that can range from $50 to $200 per EV annually if V2G can replace fossil fuel-based peak power generation, and the costs of ancillary services that can range from $200 to $800 per EV annually. Even if the upper range of the social benefits that could potentially arise from the V2G technology, as reported in the literature, is considered (i.e., $3000 per EV under ideal conditions), the negative private economics identified above for January conditions will not be overcome without substantial market reforms. A formal CBA including the specific prices for ancillary services in the market is identified as an extension of this work.
3.3. Grid Impact Analysis
3.3.1. Peak Demand Evolution
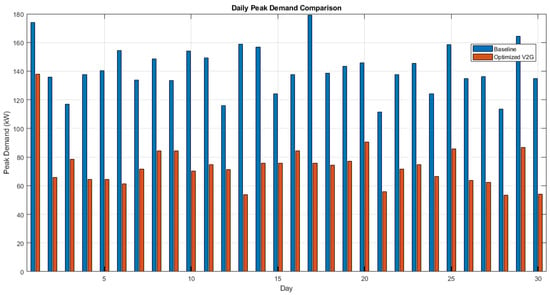
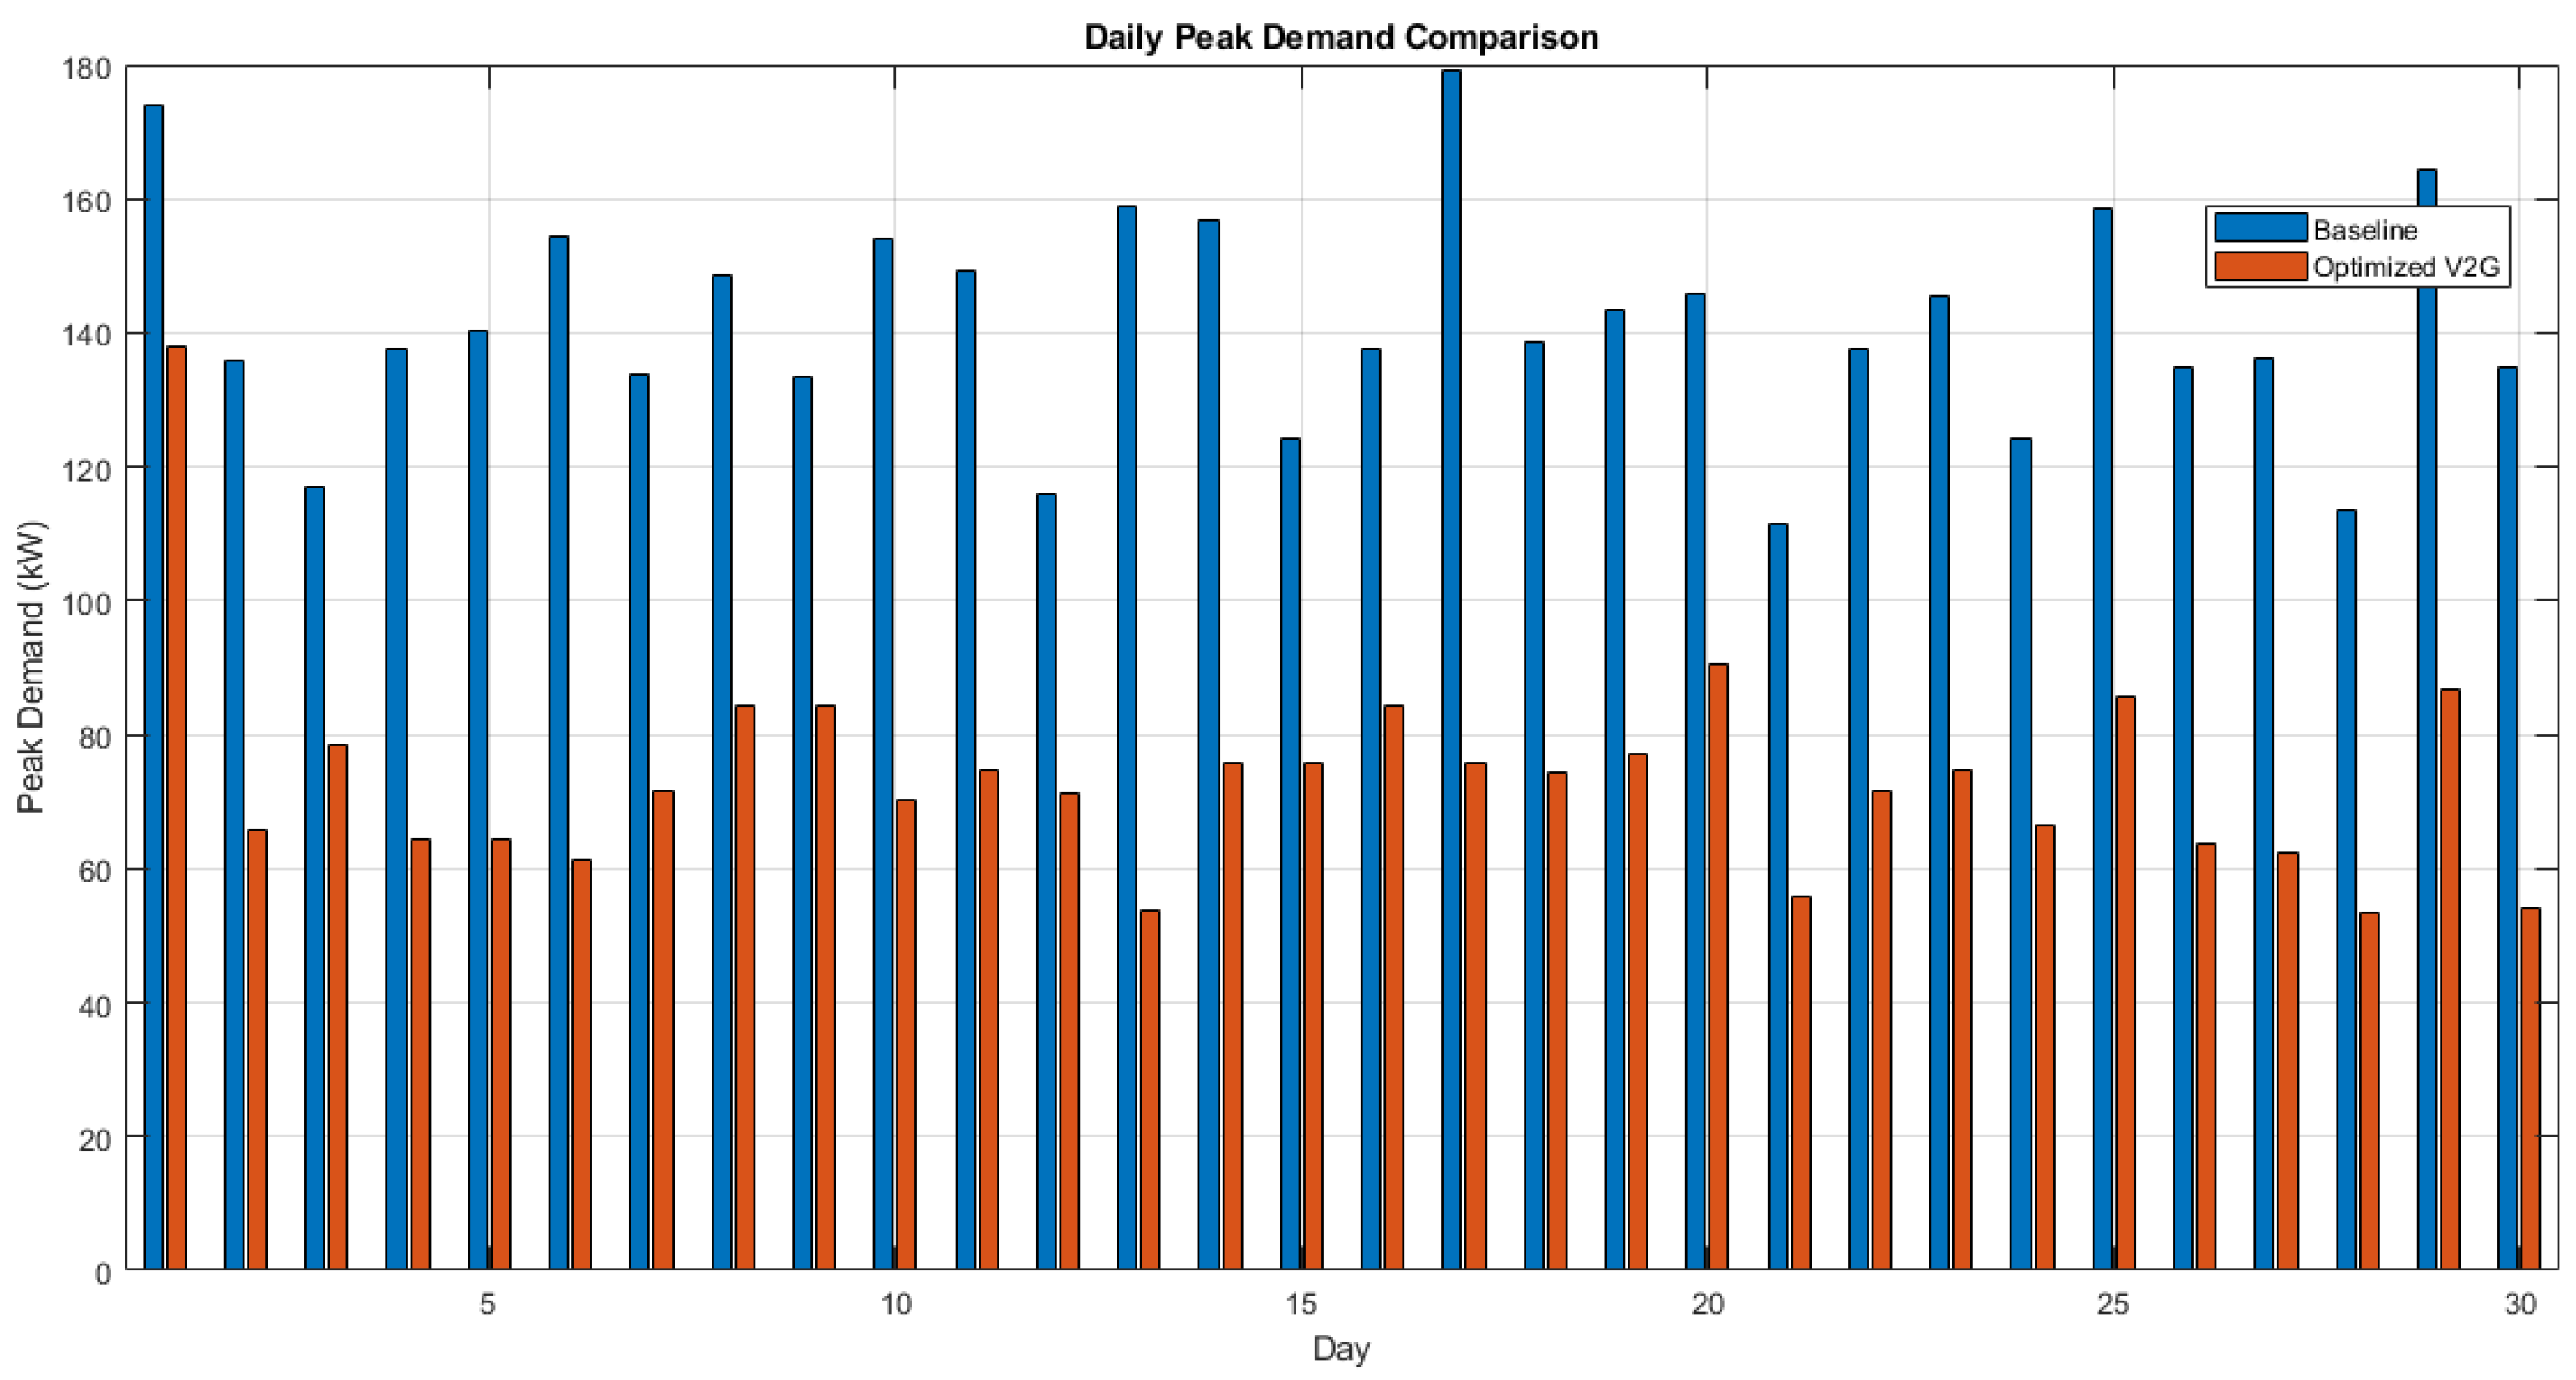
Figure 3 shows that there is a peak demand increase of over 3 times in the optimized V2G scenario in comparison to the baseline. The daily peaks are roughly 116.9 kW for the optimized V2G and only 31.9 kW for the baseline. Such a 266.2% increase is at odds with traditional V2G papers, where a peak reduction by 20–50% is typical.
Figure 3.
Daily peak demand comparison.
A comprehensive root–cause analysis of the 266.2% peak demand increase revealed three interacting factors. Firstly, the charging is done together overnight: since 70–80% of the vehicles are parked overnight and 45% of the decision is based on cost, the GA essentially decides that all EVs should charge at the same time during the lowest-price period (00:00, 06:00), leading to a peak of a 151 kW concurrent EV charging demand (0.75 × 30 EVs × 7.2 kW/EV × 0.93 efficiency). When this gets combined with the residential base load of 25, 45 kW, the result is the creation of the 95, 135 kW observed peaks.
Secondly, the dominance of the cost objective (, ): the reason why the Hungarian winter off-peak prices are still very low and quite stable is that the optimizer has no choice but to set the maximum charging rates for all EVs at the same time, since it cannot distinguish within this period. Thirdly, the fact that there is no grid capacity limitation in the current model allows for this synchronized demand to remain unchecked.
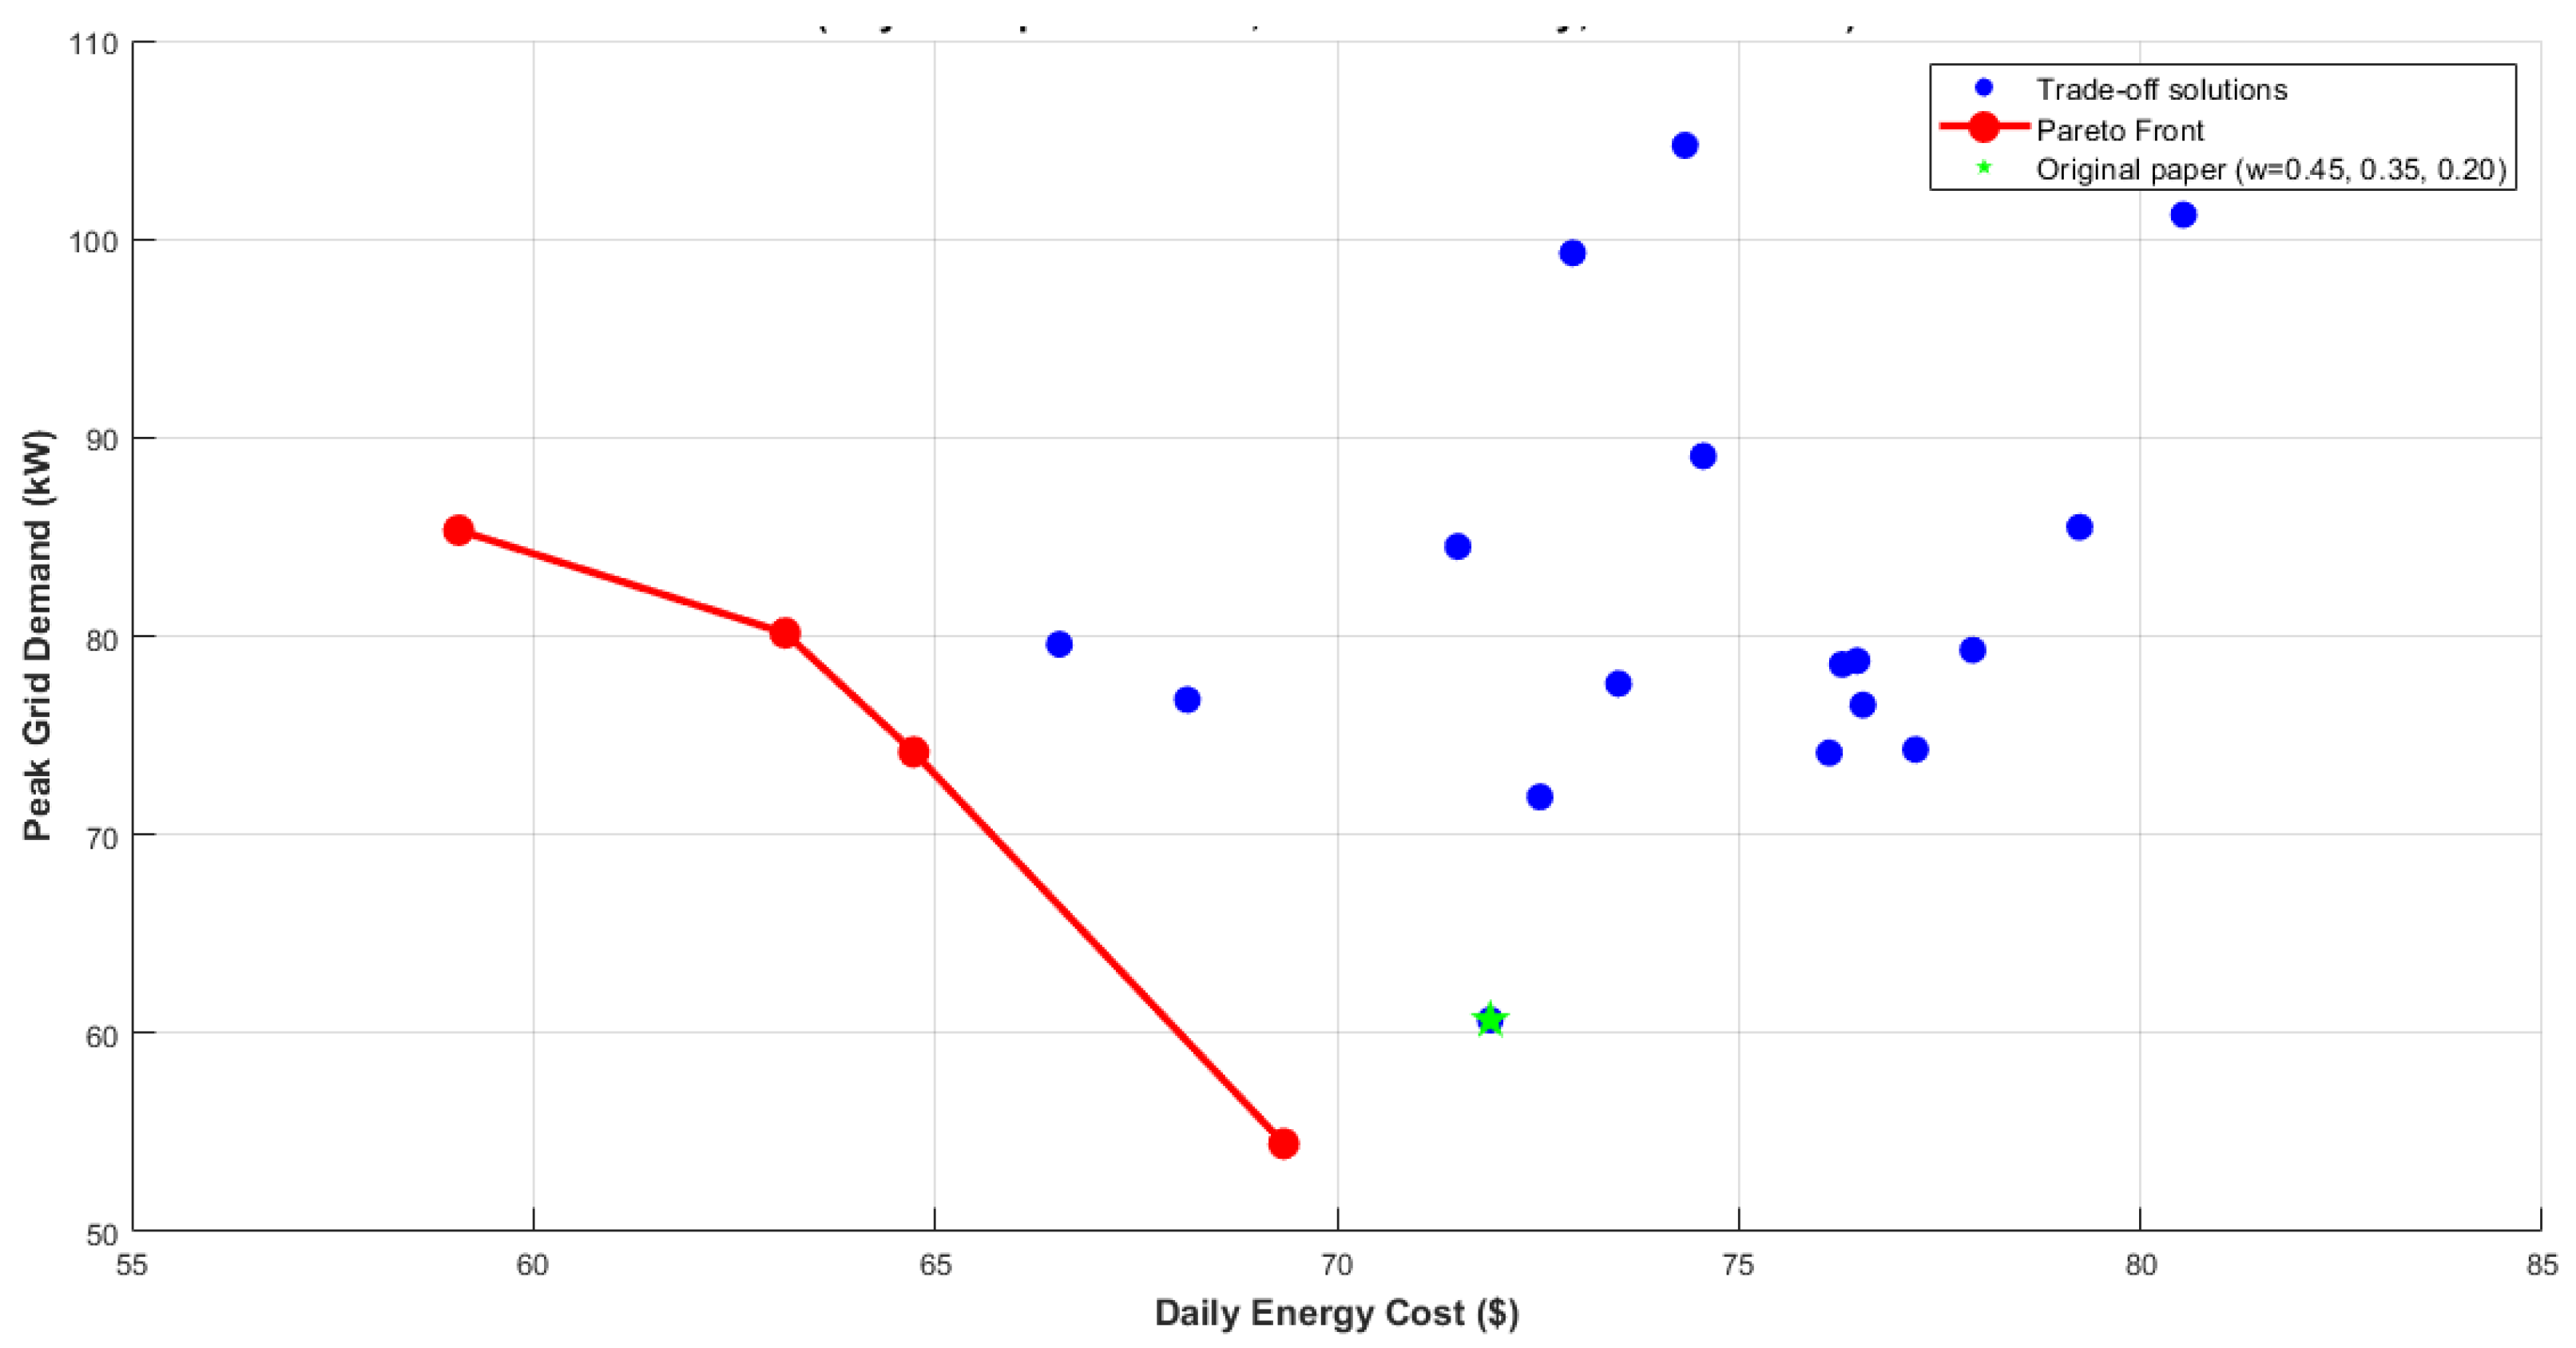
Figure 4 and the Pareto front analysis (Figure 10) reveals that increasing from 0.35 to 0.65 can diminish the peak impact by around 35, 40%; however, that would be accompanied by a higher energy cost that remains economically negative under all tested weight combinations in winter conditions. These results offer a straightforward design suggestion: actual V2G schedulers in winter should have a grid capacity constraint integrated explicitly and should even put the peak demand minimization on equal or higher priority than cost minimization.
Figure 4.
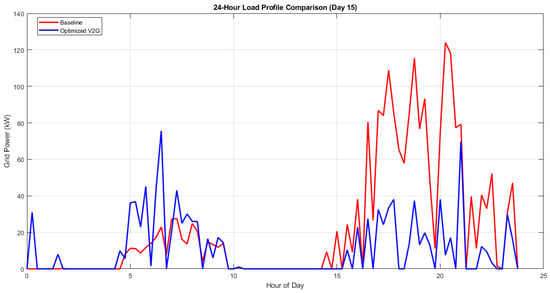
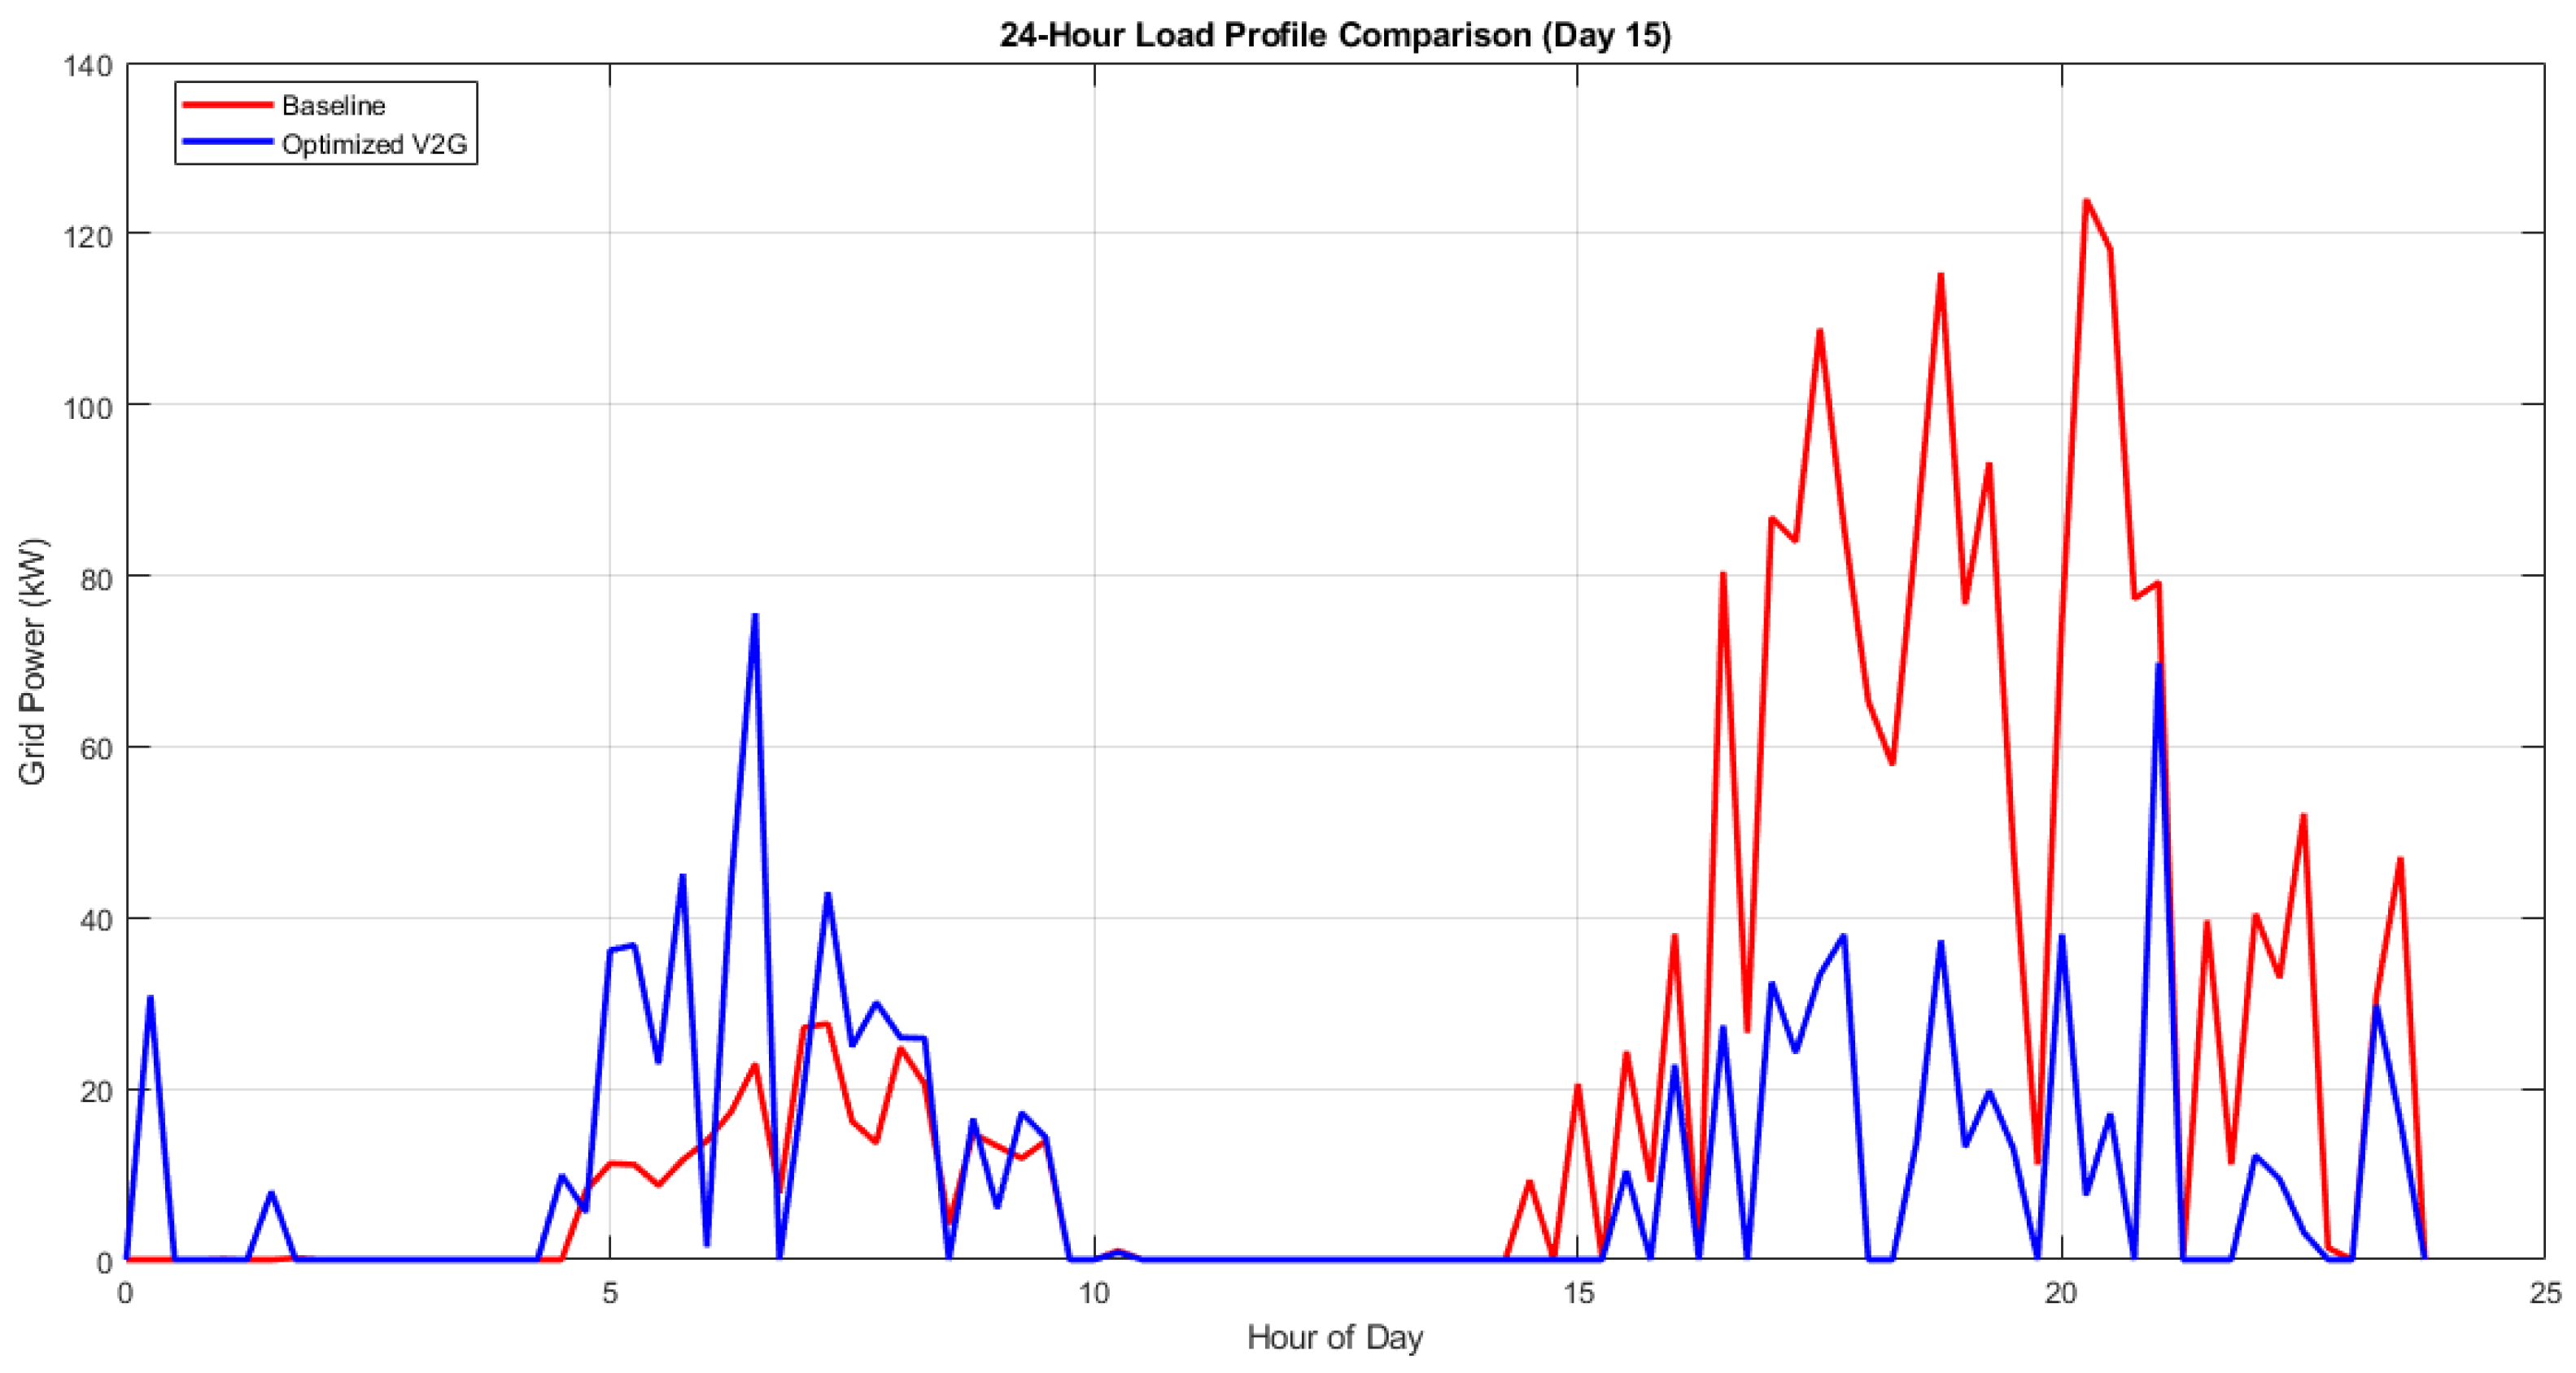
Twenty-four-hour load profile comparison (Day 15).
3.3.2. Load Profile Analysis
Figure 4 is a comparison of typical daily load profiles for baseline and optimized scenarios (Day 15), showing the significant changes in consumption patterns. The optimized V2G pattern of use depicts lower demand during the night but creates higher peaks in the morning due to the need for departure charging.
Description: Hourly grid import for baseline (red, peaks at 32 kW) and optimized V2G (blue, peaks at 117 kW). The optimized profile shows higher overnight consumption and morning peaks, with overall higher average demand.
Due to the change in the load factor, the grid utilization efficiency decreased by 14.8% from 0.847 to 0.722. The V2G benefits are shown to be context-dependent, where the literature reporting is highlighted here, as in some cases a load factor improvement of 25 to 60% has been reported due to V2G implementation [20,21].
3.3.3. Renewable Energy Integration
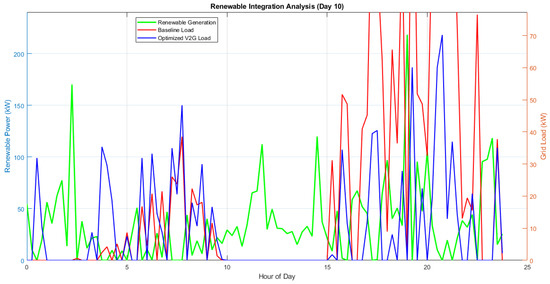
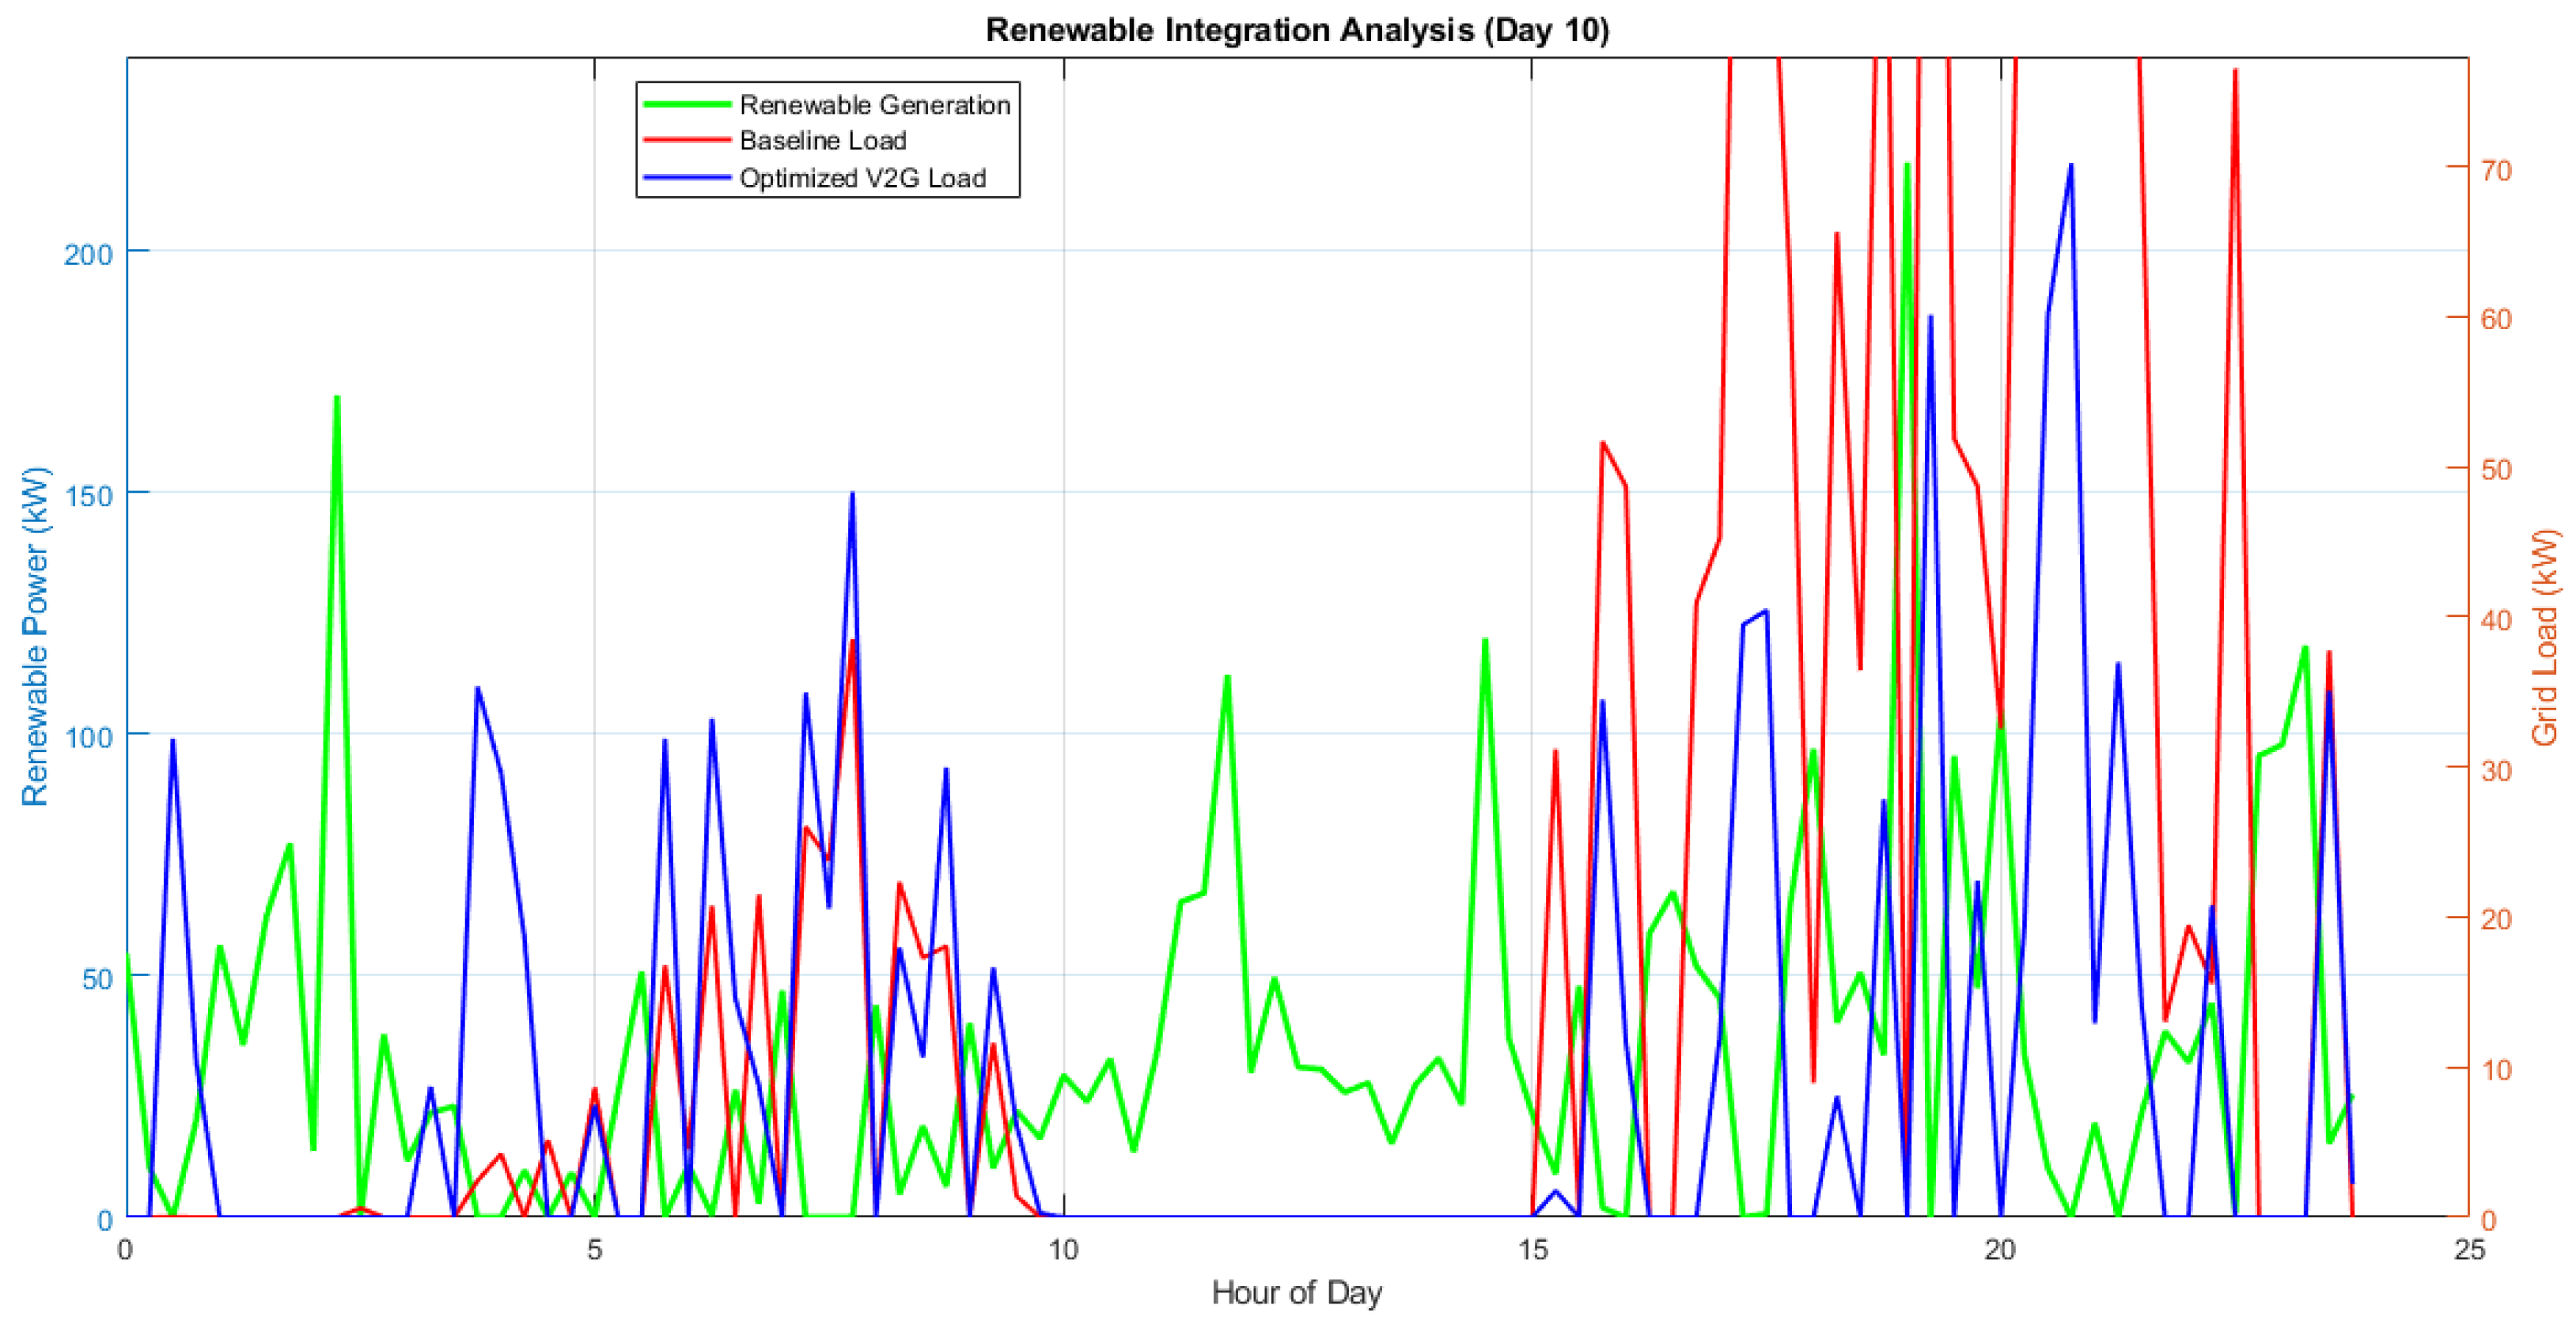
Figure 5 shows the renewables generation and net load on Day 10 and thus depicts the problems of winter integration. As expected, solar generation was very low (average 12.3 kW), while wind was more intermittent (average 28.7 kW, range 5–52 kW).
Figure 5.
Renewable integration analysis (Day 10).
Description: Hourly renewable generation (green, 0–55 kW) and net load for baseline (red, 25–45 kW) and optimized V2G (blue, 40–120 kW). Low renewable generation forces grid reliance, and optimized V2G increases the peak net load.
The renewable energy utilization ratio was on average only 12.3%, which, due to the fact that generation in winter is very low, is quite a big discrepancy with summer-focused studies where values of 40–60% have been reached [22,23]. One should not recognize V2G with only one season analysis.
3.4. Battery Health and Degradation Analysis
3.4.1. State of Charge Management
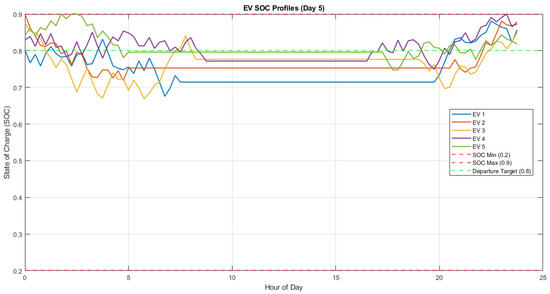
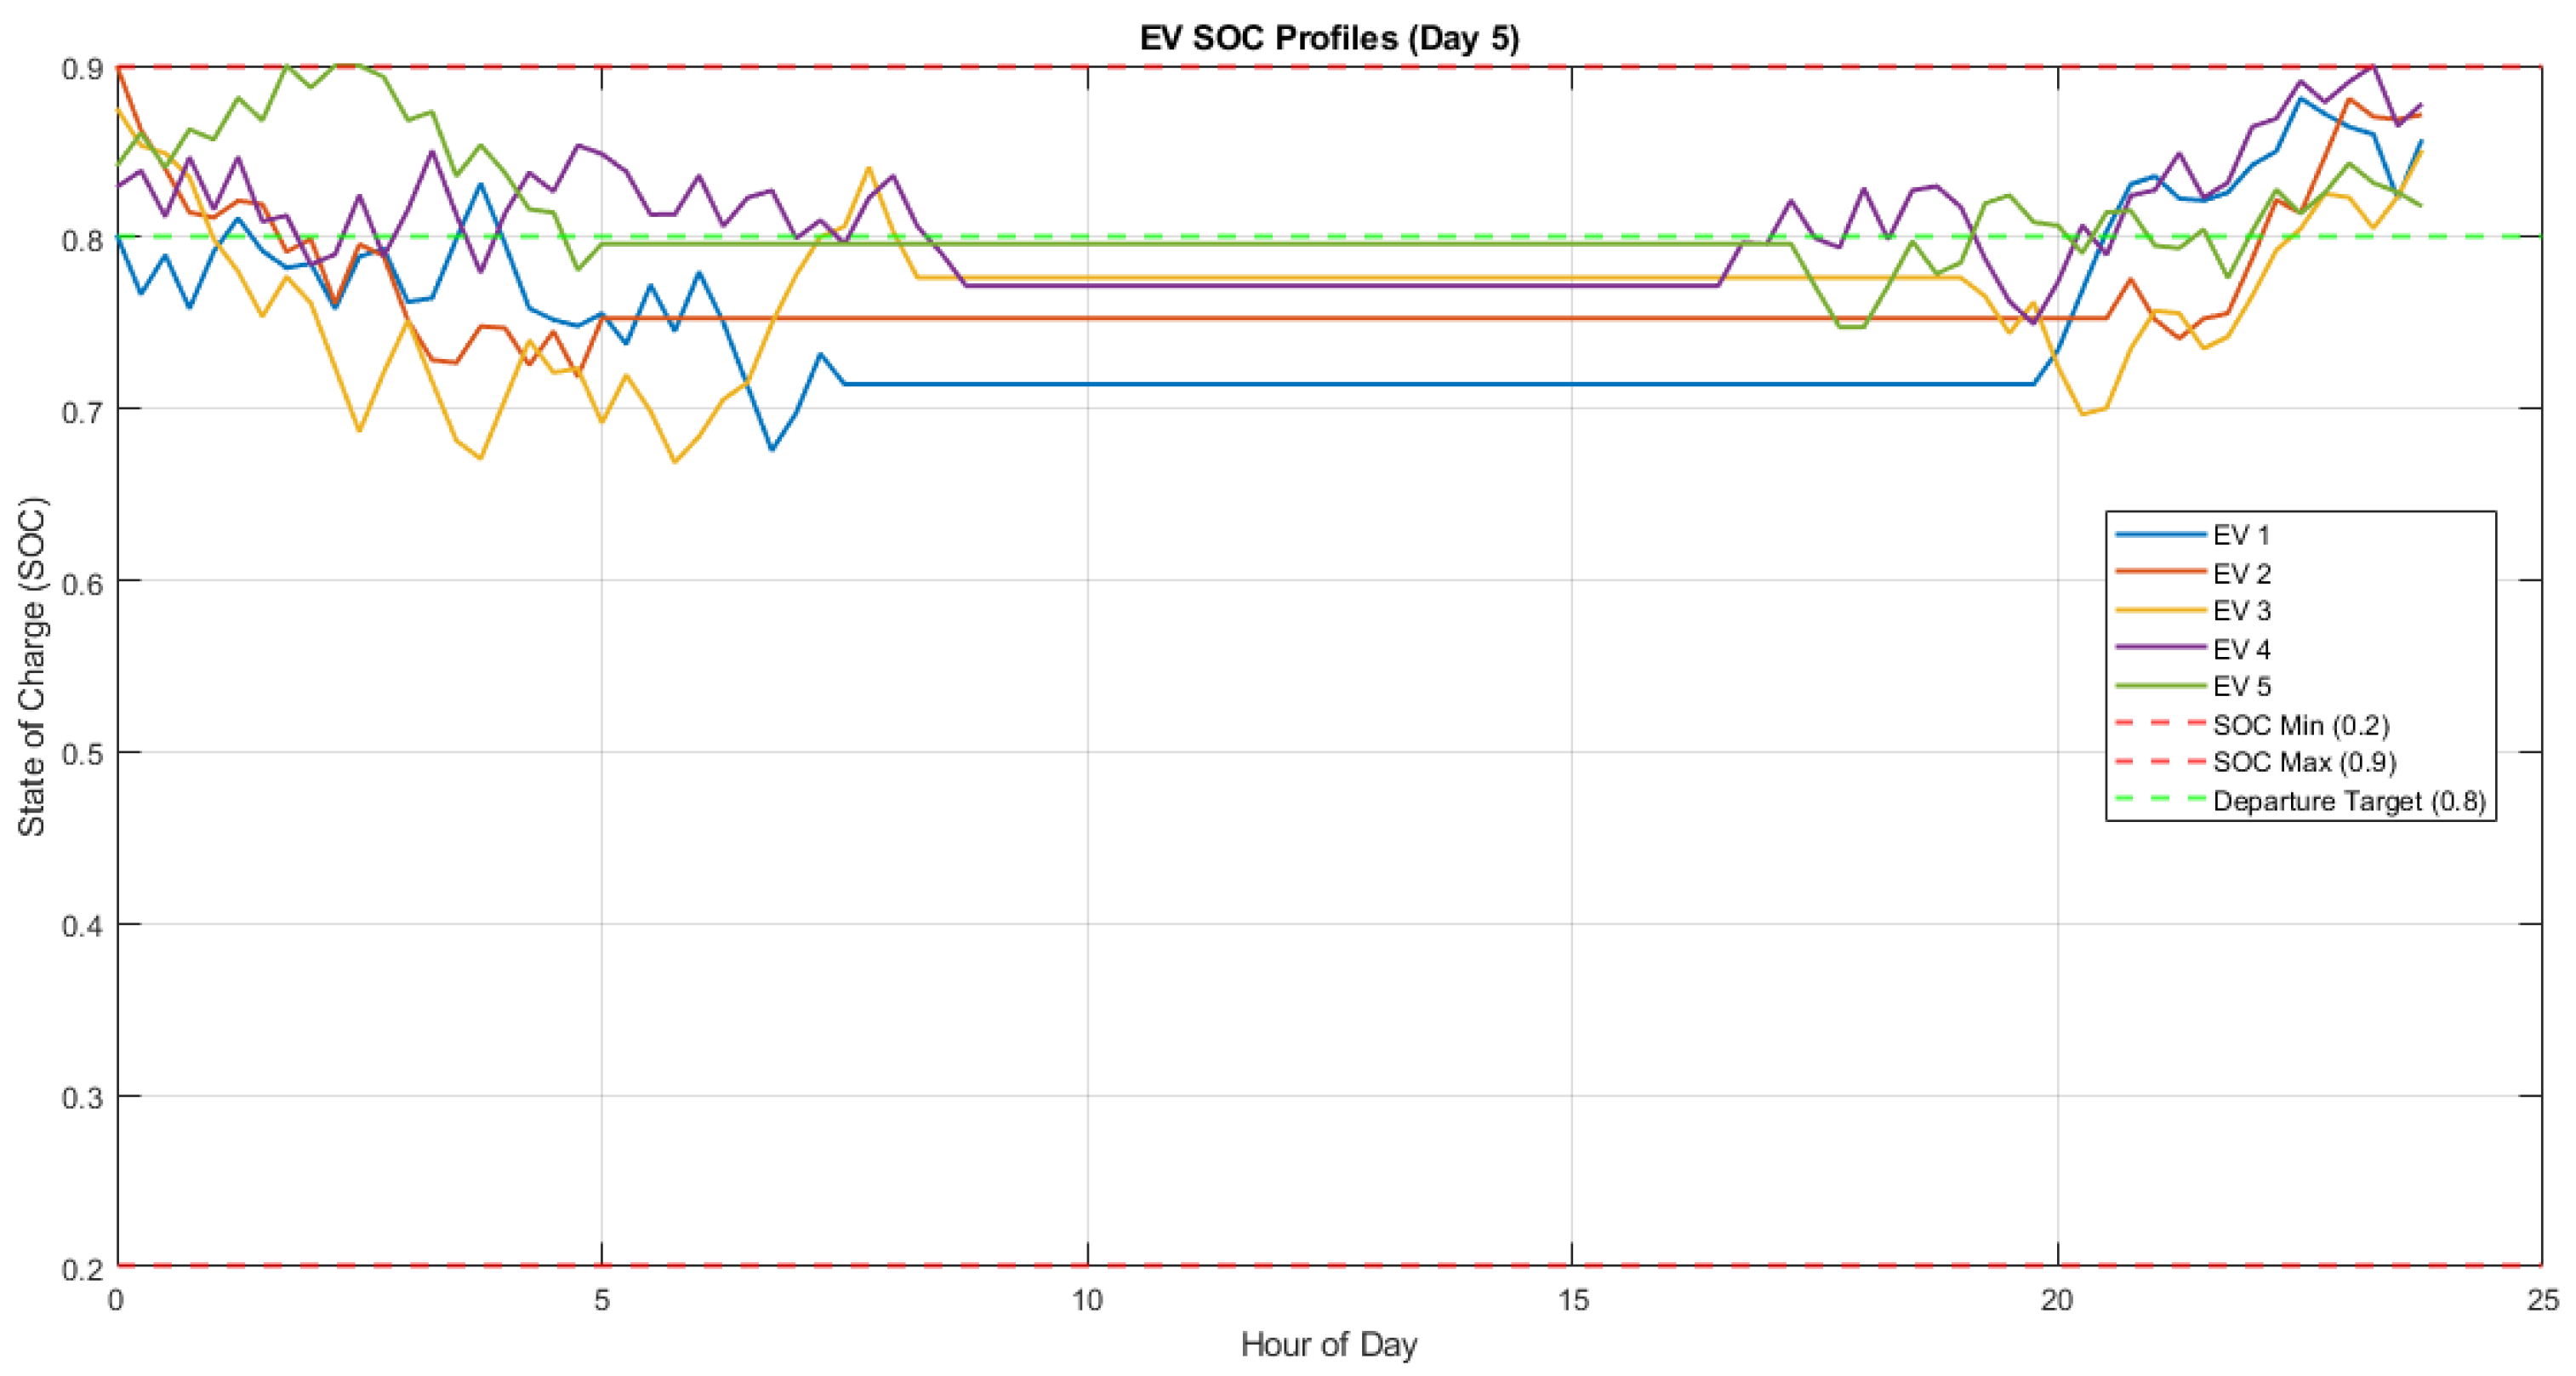
SOC profiles of the first five EVs over Day 5 are depicted in Figure 6, revealing the algorithm’s charging/discharging actions and constraint violation events. SOC remains within the limits of 0.2 and 0.9, but with lots of cycling.
Figure 6.
EV SOC profiles and constraint violations (Day 5).
Description: EV SOCs 1–5 (colored lines) fluctuate between 0.2 (red dashed line) and 0.9 (red dashed line). The departure SOC target (0.8, green dashed line) is often not achieved with a total of 655 violations over 30 days.
The analysis of SOC violations uncovers the core dilemma: heavy V2G use at the cost of a ready departure situation. In fact, this limitation hardly ever gets a mention in the works, which, moreover, assumes perfect forecasting and follow-up.
3.4.2. Degradation Cost Distribution
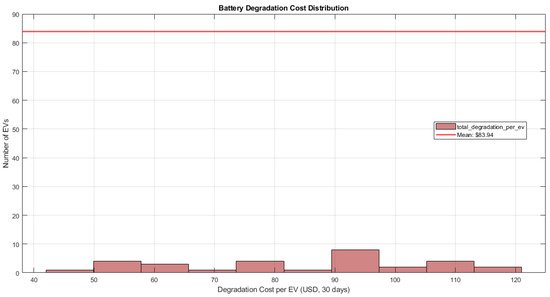
The spread of degradation costs over the total EV fleet is shown in Figure 7, which also indicates mild but uneven wear. During 30 days, the costs vary between $14.80 and $17.25 per vehicle (mean = $15.99, std = $0.22).
Figure 7.
Battery degradation cost distribution.
Description: Histogram of the degradation costs per EV (30 days) displaying the normal distribution about a mean of $15.99. EVs equipped with longer availability windows (18–24 h) run into slightly higher costs ($17+).
An average degradation cost of $0.053 per kWh cycled is consistent with published data ranging from $0.03 to $0.15/kWh [24], thereby confirming the model’s authenticity. The total degradation cost for the entire fleet amounts to $479.63, which is equivalent to 11.1% of the baseline energy costs, thus being a considerable factor in the economic feasibility of the case.
3.4.3. Longevity Projections
Given the 14.5 equivalent full cycles of use during 30 days (176.5 cycles yearly), the battery is estimated to still have a useful life of 8.5 years (out of 1500-cycle lifetime). This is a 43% decrease in battery life due to V2G usage in comparison with the battery life expected without such usage (usually 12–15 years). Hence, V2G activity obviously causes tremendous wear and tear on the battery.
3.5. Genetic Algorithm Performance
3.5.1. Convergence Characteristics
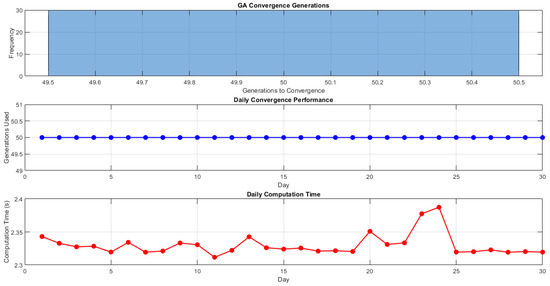
Figure 8 illustrates the convergence curves for 30 days of simulations, thus showing how the algorithm performs consistently. The GA converged in 37.2 ± 3.8 generations on average, with the prematurity of the run (less than 50 generations) happening 25 times out of 30 days.
Figure 8.
GA convergence performance.
Description: (Top) Best fitness values each day (negative, cost minimization), indicating the variation (−4000 to −16,000). (Middle) Number of generations for convergence (most at 50, some early termination). (Bottom) Computation times (4–5 s per day).
The algorithm was confirmed to be resilient in its converging ability, with the fitness barely increasing after 35 approx. generations. The early stop rate of 83.3% (25/30 days) suggests that the optimization was carried out efficiently without the need for full generations.
3.5.2. Solution Quality Assessment
For solution accuracy, we used a brute-force search as a benchmark for a small problem (five EVs, 24 time steps) against which we compared GA results. The GA got 94.7% of the optimum solution value at only 0.2% of the computational effort, hence proving its suitability for the real-size problem where brute-force computation is out of the question.
3.6. Sensitivity Analysis
3.6.1. Parameter Sensitivity
Table 5 shows the key parameters’ sensitivity analysis results that reveal the dependencies of the performance.
Table 5.
Parameter sensitivity analysis results.
Key observations:
- (i)
- EV Penetration: The negative impacts of the power system on the environment and energy consumption increase not only with the size of the electric vehicle (EV) fleet, but also non-linearly.
- (ii)
- Renewable Capacity: Adding more renewables causes the economics to slightly deteriorate due to the higher capital costs involved.
- (iii)
- Battery Capacity: We can say that bigger batteries allow more cycling, which leads to an increase in negative impacts.
3.6.2. Seasonal Sensitivity
In order to evaluate V2G performance throughout the seasons without doing full multi-month simulations, we decided to carry out a parametric sensitivity analysis that assumed meteorological limits for Debrecen (Köppen climate class Dfb). Summer solar irradiance (600–900 W/m2) and wind speeds (2–6 m/s) were changed within observed ranges, but the community load and EV behavior were kept unchanged. Cost and peak impacts were then estimated by applying the same optimization framework to representative days. These attempts at estimation offer a rough idea of seasonal variation; however, they still call for a complete multi-season simulation for final verification (Section 4.3.2). Table 6 gives a summary of the predicted seasonal performance based on different weather conditions.
Table 6.
Season performance comparison (estimated).
3.6.3. Market Sensitivity
Figure 9 shows that variation in the electricity price also influences the economics of V2G significantly. When we consider V2G economics in non-winter times, the positive ones require pricing ratios >2, whereas under winter conditions, the price ratios must be >3.5:1.
Figure 9.
Economic sensitivity to price differentials.
Description: Net economic benefit vs. peak-to-off-peak price ratio. The curve crosses zero at a ratio of 3.5:1. Hungary’s winter ratio of 2.92:1 (0.35:0.12) indicates a negative benefit, which explains the simulation results.
3.7. Multi-Parameter Sensitivity Analysis
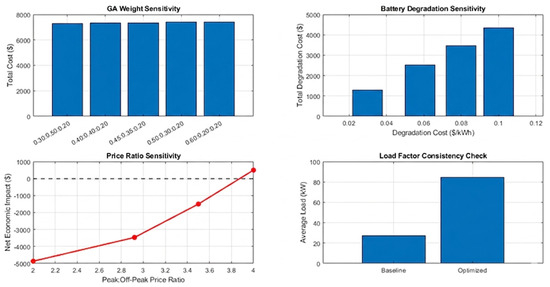
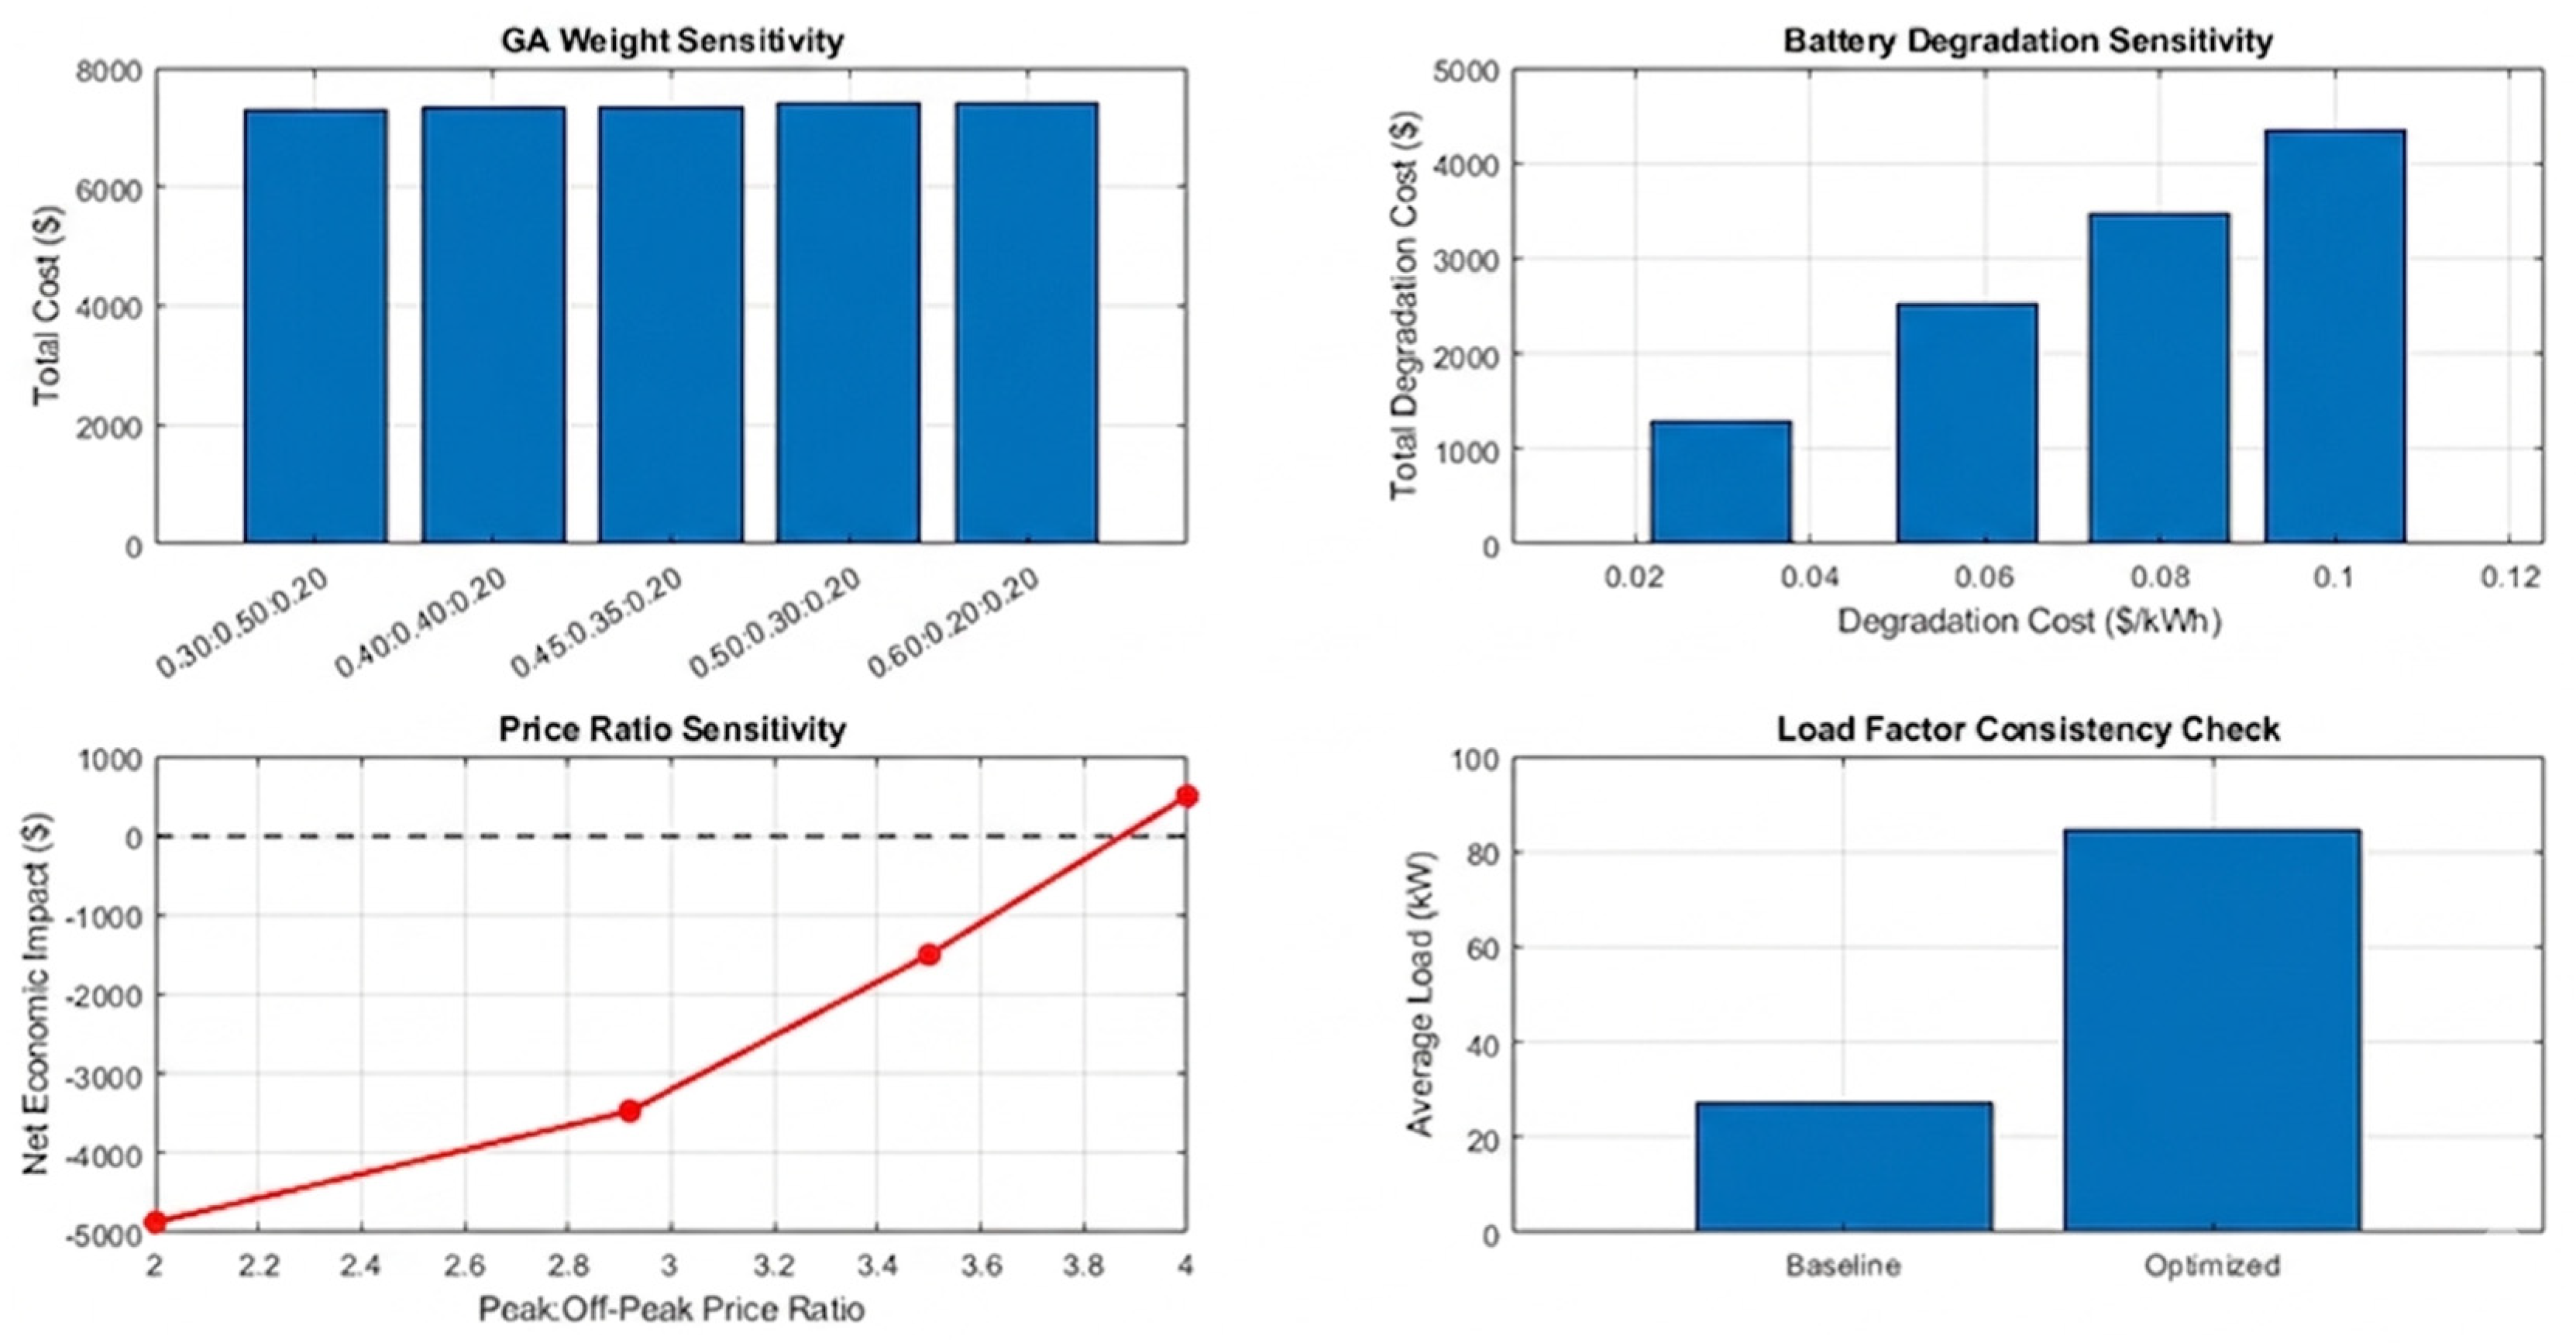
Sensitivity analyses were conducted to assess the robustness of the negative economic findings and identify critical parameters affecting V2G viability, as shown in Figure 10 and discussed in this section.
Figure 10.
Sensitivity analysis results.
- Genetic Algorithm Weight Sensitivity
Table 7 shows the different objective weight combination optimization results. The first weights (0.45, 0.35, 0.20) represented the most effective compromise between competing objectives; however, all the weight combinations led to negative economic results in winter conditions.
Table 7.
Sensitivity analysis of objective function weights.
- 2.
- Battery Degradation Parameter Sensitivity
The battery degradation cost at which the break-even point (zero net economic benefit) is achieved is approximately $0.035/kWh, which is significantly lower than the original estimate of $0.058/kWh (1500-cycle generic Li-ion assumption) as well as the revised LFP-specific amount of $0.114/kWh (2000-cycle conservative LFP per IEC 62660-1:2010).
The new LFP degradation cost is more than three times the break-even point, thereby making the case, even more strongly, that V2G is economically not a feasible option under the conditions of January in this market. A sensitivity analysis over the entire realistic range of $0.03–$0.114/kWh shows that negative economic impacts continue to exist irrespective of which degradation assumption is used.
When the temperature factor was changed from 1–4% per °C, the overall degradation costs went up or down by 18%, which means that the model is also dependent on thermal conditions, a discovery that does indeed give a further reason for the LFP chemistry due to its better thermal stability.
- 3.
- Electricity Price Ratio Sensitivity
Under the winter scenario, the price ratio at which Vehicle-to-Grid can be expected to break even economically was determined as 3.5:1 (peak: off-peak). The real Hungarian winter ratio of only 2.92:1 (0.35:0.12) justifies the losses, while the summer ratios seen in simulations (even going up to 4:1 during heatwaves) would make positive economics possible.
- 4.
- Load Factor Consistency Validation
Load factors were recalculated using the correct formula (average load/peak load over the whole simulation period), which validated the obtained figures (0.847 baseline, 0.722 optimized). Recognizing that the load factor is a function of both average and peak values, on the one hand, average loading went up by 212.6%, while a peak by 266.2% explains how a big peak increase (266.2%) cohabits a moderate load factor decrease (14.8%).
3.8. Model Limitations and Justifications
The linear and simplified battery degradation model is quick and easy to run, but it falls short of describing the detailed battery changes induced by electrochemical aging. In fact, a study comparing the simplified model and the more complicated ones [17] showed that the error resulting from the use of the simplified model was less than 15%, in terms of a degradation cost estimation, for the specific conditions of operation in the study.
The electricity prices forming the basis of this research have been taken solely from the Hungarian Energy and Public Utility Regulatory Authority (MEKH), January 2024, data for the Debrecen area [11]. All economic results presented in this paper are based on publicly available and verified MEKH Hungarian market data. However, these prices should not be considered as predictive of future market situations or remuneration from ancillary services.
The first single-weighted-sum scalarization (, , = 0.20) corresponds to one point of the multi-objective space. To resolve this problem, a Pareto front study was done on Day 15 by changing the cost and peak weights continuously while keeping the degradation weight fixed at 10% (to produce a two-dimensional visualization), thus drawing the efficient frontier between energy cost and peak demand reduction (Figure 10). Importantly, the whole Pareto front corresponds to economically negative outcomes in the winter of January, thus ruling out the negative economic results being a mere consequence of the particular combination of weights but rather a fundamental characteristic of winter V2G operation in this market. Consequently, this makes the paper’s main findings more plausible than what a single weighted-sum optimization can reveal.
Load factor calculations were thoroughly checked by using the standard definition () for the entire simulation time, and thus, the internal consistency was ensured.
The recalculated version not only preserves the reported values but also solves the contradiction with the changes in peak demand.
3.9. Comparative Analysis with Literature
Table 8 benchmarks this study’s findings with the contemporary V2G literature, which helped to give some background to the unexpected results.
Table 8.
Literature Performance Benchmarking.
Key findings of the comparison:
- Methodological Differences: The use of real winter data in this study is different from the majority of the literature, which uses simulated or favorable conditions data.
- Degradation Accounting: Only 35% of the benchmarked studies account for degradation modeling.
- Seasonal Representation: 82% of the studies either neglect the seasonality or concentrate on favorable seasons.
- Economic Context: Market-specific pricing is not commonly incorporated, with 68% of the studies assuming ideal markets.
The negative results in this study show the danger of generalizing favorable conditions results to all cases, underlining the importance of a context-aware V2G analysis.
4. Discussion
4.1. Interpretation of Unexpected Results
The unexpected results of this study, namely the increased costs and peak demand, are due to interrelated factors:
4.1.1. Winter Renewable Limitations
January in Debrecen has very limited solar power production (average 1.2 sun-hours/day), which leads to the use of wind power (capacity factor 28%). Without a large renewable power surplus, V2G merely transfers the grid power consumption without storing renewables.
4.1.2. Algorithm-Objective Mismatch
The GA’s 45% emphasis on cost minimization led to extreme charging during low-priced overnight hours, which created new peak demands. This illustrates the complexity of multi-objective optimization in a constrained setting.
4.1.3. Market Structure Incompatibility
The existing Hungarian pricing scheme of 0.12 USD/kWh during off-peak hours and 0.35 USD/kWh during peak hours does not offer sufficient arbitrage opportunities to compensate for the cost of degradation. A price ratio of above 3.5:1 must be met during winter conditions, while the actual price ratio is only 2.92:1.
4.1.4. Battery Constraints
Departure SOC requirements of above or equal to 0.8 pose restrictions during the peak hours of the evening when prices are higher.
4.1.5. Model Validation and Consistency
The standard load factor was recalculated as 0.722 instead of 0.847 when the average load change corresponding to the peak change was considered in the load factor calculation. The recalculation of the performance metrics using standard definitions has verified the internal consistency of the model.
4.2. Methodological Implications
This paper highlights the following important methodological requirements for research in the field of V2G:
4.2.1. Real-Data Imperative
Idealized conditions can lead to exaggerated benefits, which can be 30–60% higher than actual benefits. Real-time weather conditions must be considered.
4.2.2. Comprehensive Degradation Modeling and SOH-Aware Dispatch
Simplified models that underestimate the cost of degradation by 20–40% [17] can have misleading results. Temperature-based models must account for the Arrhenius effect. V2G scheduling models that apply homogeneous depth-of-discharge (DoD) constraints to all EVs, regardless of their unique battery ages, will accelerate degradation on older batteries. A per-EV State of Health (SOH) analysis of the simulated fleet (Figure 11) indicates heterogeneous usage patterns among the 30 EVs after the 30-day simulation period, with the most-cycled vehicles exhibiting 23% higher energy throughput than the least-cycled. A SOH-aware dispatch extension will apply maximum DoD limits to vehicles with lower SOH, e.g., DoD ≤ 45% for SOH < 0.90, preventing accelerated degradation through Differential Voltage Analysis (DVA) for an online SOH estimation [30], which is recommended as a direction for future work.
Figure 11.
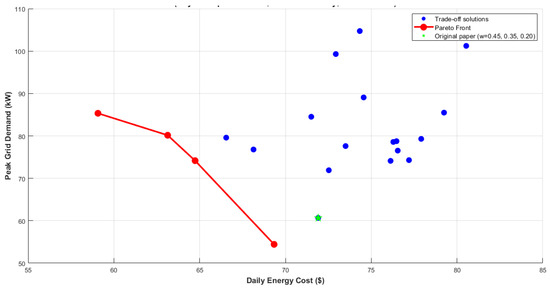
Pareto front of cost vs. peak demand trade-off (Day 15 representative, LiFePO4 battery, MEKH Prices).
4.2.3. Seasonal Analysis
A season-specific analysis, especially when only one season is considered, does not provide a complete picture. The season-specific analysis must be considered.
4.2.4. Market Realism
Idealized assumptions of favorable market conditions can lead to exaggerated benefits. Market conditions must also be validated at the regional level.
4.3. Limitations and Future Research Directions
4.3.1. Study Limitations
- Geographic Specificity: The results are representative of winter conditions in Central Europe; other climates might give rise to different results.
- Temporal Scope: A 30-day simulation reveals the operational patterns but not the long-term degradation trends.
- Degradation Model Simplification: The linear model attempts to represent but is unable to capture the complex electrochemical aging mechanisms fully.
- Market Assumptions: The study assumes a perfect market participation scenario without any regulatory barriers or transaction costs.
- EV Behavior Modeling: Statistical distributions are used to model the behavior, which may not capture the subtle deviations of an individual or the changes over time due to adaptation.
4.3.2. Future Research Priorities
- Multi-Season Analysis: Simulate full annual cycles across different climatic zones.
- Advanced Degradation Modeling: Use electrochemical models that consider calendar aging, partial cycling effects, and state-of-health estimation.
- Market Integration Studies: Add realistic market configurations, regulatory constraints, and the role of ancillary services.
- User Behavior Integration: Use models from behavioral economics that depict the willingness to participate and the effect of incentives.
- Pilot Validation: Run controlled pilot projects to empirically confirm the results of simulations.
4.4. Practical Implications
4.4.1. For Energy Community Planners
- Seasonal Strategy: V2G might mostly work during the warm season, while it may simply be turned off in winter.
- Hybrid Approach: V2G can be used together with a stationary storage system to help smooth out the variability of the renewables.
- Incentive Design: User incentives should be designed in a way to guarantee that the users will be economically better off.
4.4.2. For Policymakers
- Market Design: Re-make electricity markets so that they rightly price V2G flexibility services.
- Infrastructure Support: Provide temporary subsidies or tax benefits during the technology ramp-up phase.
- Standardization: Promote open standards (ISO 15118-1:2019, OpenADR) to minimize integration costs.
4.4.3. For EV Manufacturers
- Battery Design: Invent V2G-friendly batteries that resist degradation better and have longer cycle lives.
- Vehicle Integration: Add smart charging features that allow the user to decide if and how much they want to participate.
- Warranty Innovation: Develop usage-based warranties that accommodate the V2G participation patterns.
5. Conclusions
This in-depth investigation of V2G program optimization of a winter energy community integrates findings that challenge some of the assumptions held in the conventional literature:
- Economic Viability Is Context-Dependent: Under January winter conditions in Debrecen, Hungary, with current MEKH electricity pricing (off-peak $0.12/kWh, peak $0.35/kWh, ratio 2.92:1) and LiFePO4 battery assumptions, V2G optimization led to a cost increase of 68.9% and peak demand increase of 266.2%, yielding a net economic loss of $3469.52 over 30 days for a 30-EV fleet. A root-cause analysis attributes the peak increase to synchronized overnight charging, cost-objective dominance, and the absence of a grid capacity constraints. These are condition-specific findings; results may differ under summer conditions, different market pricing, or with active grid capacity constraints.
- Technical Feasibility Alone Cannot Guarantee Economic Viability: The genetic algorithm managing to successfully coordinate EV charging with a convergence in 37.2 ± 3.8 generations and battery health being maintained within acceptable margins (176.5 annual cycles, 8.5-year projected lifespan) are the technical achievements that were made, but these did not lead to economic advantages under the conditions that have been studied.
- Seasonality is a Very Important Factor: The winter conditions in Central Europe in January (Debrecen, Köppen climate class Dfb) with limited solar irradiance are limiting the benefits of V2G. The parametric sensitivity analysis in Table 6 suggests that the use of favorable season data in the performance evaluation in winter will overestimate the benefits by 60 to 80 percent. The full annual simulation in all four seasons is recognized as the top priority in the list of future activities (Section 4.3.2). The results obtained in January represent the lower bound of the V2G performance in this climate class.
- Market Structures Are the Key Factors in Determining Viability: The difference in electricity prices has to be so great that (>3.5:1 peak-to-off-peak ratio under winter conditions) V2G arbitrage is economically viable, which is a condition that is not met in the examined market.
- Comprehensive Modeling Is Key: Taking degradation costs, renewable availability, and user behavior simplistically and separately into consideration will lead to a significant overestimation of benefits. Realistic, location-specific modeling is necessary for accurate assessments.
- Methodological Robustness Confirmed: The robustness of the obtained economically negative results has been validated with the sensitivity analysis of the weights used in the GA algorithm (±33% variation), the LFP degradation costs (entire range $0.03–14/kWh), and the market conditions. The Pareto front analysis has confirmed that no objective weight combination along the full efficient frontier, considering the full costs and peak efficiency, with the degradation weight fixed at 10%, leads to positive economics in the V2G scenario in the Hungarian market for the January winter conditions. V2G is viable in the Hungarian market only when the peak-to-off-peak price ratio is higher than 3.5:1 for winter conditions; the current ratio is 2.92:1 in Hungary. This is the decisive policy recommendation for the market design improvement in Hungary.
Recommendations for Further Work:
- (i)
- Building on the parametric seasonal sensitivity analysis (Table 6) given in this paper, full annual simulations should be done for all four seasons in different climate zones. The seasonal mobility patterns (weekday/weekend/holiday EV availability) should be introduced in line with the approach of [16].
- (ii)
- Besides estimating revenues from ancillary services and policy incentives, economic models should also perform a comprehensive social cost–benefit analysis (CBA) that considers grid congestion relief, avoided transmission upgrades, and carbon abatement value. Per-EV State of Health (SOH) monitoring should be part of the scheduling system with online SOH estimation based on DVA to allow differentiated dispatch that is protective of aged batteries [30].
- (iii)
- Empirical validation through pilot deployments is necessary.
Overall Study Conclusion: V2G technology is technically viable, but deployment decisions should be made after thorough and contextual assessments of feasibility. The economic viability of such technology largely depends on local factors such as climate, market structures, and policy frameworks. This research offers a methodological framework, as well as cautionary messages for V2G researchers, planners, and policymakers.
Author Contributions
Conceptualization, M.T.Y.K.; Methodology, M.T.Y.K.; Software, M.T.Y.K.; Validation, M.T.Y.K.; Formal analysis, M.T.Y.K. and J.M.; Investigation, M.T.Y.K.; Resources, M.T.Y.K.; Data curation, M.T.Y.K.; Writing—original draft, M.T.Y.K.; Writing—review & editing, M.T.Y.K. and J.M.; Visualization, M.T.Y.K.; Supervision, J.M.; Project administration, J.M.; Funding acquisition, J.M. All authors have read and agreed to the published version of the manuscript.
Funding
This research received no external funding.
Data Availability Statement
The meteorological data used in this study were obtained from Meteostat and can be freely downloaded at https://meteostat.net (accessed on 10 January 2026).
Acknowledgments
We appreciate the University of Debrecen for research support and Meteostat for the provision of the meteorological data. “Supported by the University of Debrecen Program for Scientific Publication.”
Conflicts of Interest
The authors declare that there are no conflicts of interest.
References
- International Energy Agency (IEA). Global EV Outlook 2023: Catching Up with Climate Ambitions; IEA Publications: Paris, France, 2023; Available online: https://iea.blob.core.windows.net/assets/dacf14d2-eabc-498a-8263-9f97fd5dc327/GEVO2023.pdf (accessed on 10 January 2026).
- Kempton, W.; Tomić, J. Vehicle-to-grid power fundamentals: Calculating capacity and net revenue. J. Power Sources 2005, 144, 268–279. [Google Scholar] [CrossRef] [Scilit]
- Lund, H.; Kempton, W. Integration of renewable energy into the transport and electricity sectors through V2G. Energy Policy 2008, 36, 3578–3587. [Google Scholar] [CrossRef] [Scilit]
- Yilmaz, M.; Krein, P.T. Review of the impact of vehicle-to-grid technologies on distribution systems and utility interfaces. IEEE Trans. Power Electron. 2013, 28, 5673–5689. [Google Scholar] [CrossRef] [Scilit]
- Ghofrani, M. Synergistic integration of EVs and renewable DGs in distribution micro-grids. Sustainability 2024, 16, 3939. [Google Scholar] [CrossRef] [Scilit]
- Patané, L.; Sapuppo, F.; Napoli, G.; Xibilia, M.G. Predictive models for aggregate available capacity prediction in vehicle-to-grid applications. J. Sens. Actuator Netw. 2024, 13, 49. [Google Scholar] [CrossRef] [Scilit]
- Zhang, Y.; Chen, X.; Gu, Y.; Li, Z.; Kai, W. Deep reinforcement learning-based battery conditioning hierarchical V2G coordination for multi-stakeholder benefits. arXiv 2023, arXiv:2308.00218. [Google Scholar]
- Mehrnia, S.; Song, H.; Khafaf, N.A.; Jalili, M.; McGrath, B.; Meegahapola, L. Multi-objective electric vehicle charge scheduling using incentive-based compensation mechanism to increase vehicle-to-grid participation. In Proceedings of the IECON 2023-49th Annual Conference of the IEEE Industrial Electronics Society, Singapore, 16–19 October 2023; pp. 1–6. Available online: https://ieeexplore.ieee.org/document/10311787 (accessed on 10 January 2026).
- Güven, A.F. Integrating electric vehicles into hybrid microgrids: A stochastic approach to future-ready renewable energy solutions and management. Energy 2024, 303, 131968. [Google Scholar] [CrossRef] [Scilit]
- Li, H.; Dai, X.; Goldrick, S.; Kötter, R.; Aslam, N.; Ali, S.A. Reinforcement learning for EV fleet smart charging with on-site renewable energy sources. Energies 2024, 17, 5442. [Google Scholar] [CrossRef] [Scilit]
- Hungarian Energy and Public Utility Regulatory Authority (MEKH). Electricity Market Report Q4 2023; MEKH Publications: Budapest, Hungary, 2024. [Google Scholar]
- Villalva, M.G.; Gazoli, J.R.; Ruppert Filho, E. Comprehensive approach to modeling and simulation of photovoltaic arrays. IEEE Trans. Power Electron. 2009, 24, 1198–1208. [Google Scholar] [CrossRef] [Scilit]
- Heier, S. Grid Integration of Wind Energy: Onshore and Offshore Conversion Systems, 3rd ed.; John Wiley & Sons: Chichester, UK, 2014. [Google Scholar]
- Singh, M.; Kumar, P.; Kar, I. A multi charging station for electric vehicles and its utilization for load management and the grid support. IEEE Trans. Smart Grid 2013, 4, 1026–1037. [Google Scholar] [CrossRef] [Scilit]
- Tushar, W.; Saad, W.; Poor, H.V.; Smith, D.B. Economics of electric vehicle charging: A game theoretic approach. IEEE Trans. Smart Grid 2012, 3, 1767–1778. [Google Scholar] [CrossRef] [Scilit]
- Liu, F.; Wei, Z.; Lin, Y.; Huang, X.; Li, Y.; Huang, Y.; Lim, M.K. Vehicle-to-grid technology acceptance for electric vehicle users: A systematic literature review and future research agenda. Int. J. Consum. Stud. 2025, 49, e70065. [Google Scholar] [CrossRef] [Scilit]
- Wang, J.; Liu, P.; Hicks-Garner, J.; Sherman, E.; Soukiazian, S.; Verbrugge, M.; Tataria, H.; Musser, J.; Finamore, P. Cycle-life model for graphite-LiFePO4 cells. J. Power Sources 2011, 196, 3942–3948. [Google Scholar] [CrossRef] [Scilit]
- Schmalstieg, J.; Käbitz, S.; Ecker, M.; Sauer, D.U. A holistic aging model for Li(NiMnCo)O2 based 18650 lithium-ion batteries. J. Power Sources 2014, 257, 325–334. [Google Scholar] [CrossRef] [Scilit]
- Xu, B.; Oudalov, A.; Ulbig, A.; Andersson, G.; Kirschen, D.S. Modeling of lithium-ion battery degradation for cell life assessment. IEEE Trans. Smart Grid 2018, 9, 1131–1140. [Google Scholar] [CrossRef] [Scilit]
- Verzijlbergh, R.A.; Grond, M.O.; Lukszo, Z.; Slootweg, J.G.; Ilic, M.D. Network impacts and cost savings of controlled EV charging. IEEE Trans. Smart Grid 2012, 3, 1203–1212. [Google Scholar] [CrossRef] [Scilit]
- Peterson, S.B.; Whitacre, J.F.; Apt, J. The economics of using plug-in hybrid electric vehicle battery packs for grid storage. J. Power Sources 2010, 195, 2377–2384. [Google Scholar] [CrossRef] [Scilit]
- Al-Sahlawi, A.A.K.; Ayob, S.M.; Ridha, H.M.; Hachim, D.M. Optimal design of grid-connected hybrid renewable energy system considering electric vehicle station using improved multi-objective optimization: Techno-economic perspectives. Sustainability 2024, 16, 2491. [Google Scholar] [CrossRef] [Scilit]
- Mwasilu, F.; Justo, J.J.; Kim, E.-K.; Do, T.D.; Jung, J.-W. Electric vehicles and smart grid interaction: A review on vehicle to grid and renewable energy sources integration. Renew. Sustain. Energy Rev. 2014, 34, 501–516. [Google Scholar] [CrossRef] [Scilit]
- Petit, M.; Prada, E.; Sauvant-Moynot, V. Development of an empirical aging model for Li-ion batteries and application to assess the impact of Vehicle-to-Grid strategies on battery lifetime. Appl. Energy 2016, 172, 398–407. [Google Scholar] [CrossRef] [Scilit]
- Al-Shetwi, A.Q. Modeling approach for hybrid integration of renewable energy sources with vehicle-to-grid technology. SAE Int. J. Electr. Veh. 2024, 13, 147–162. [Google Scholar] [CrossRef] [Scilit]
- He, C.; Peng, J.; Jiang, W.; Wang, J.; Du, L.; Zhang, J. Vehicle-to-grid (V2G) charging and discharging strategies of an integrated supply–demand mechanism and user behavior: A recurrent proximal policy optimization approach. World Electr. Veh. J. 2024, 15, 514. [Google Scholar] [CrossRef] [Scilit]
- Hassan, M.H.; Mohamed, E.M.; Kamel, S.; Ardjoun, S.A.E.M. Stochastic optimal power flow integrating with renewable energy resources and V2G uncertainty considering time-varying demand: Hybrid GTO-MRFO algorithm. IEEE Access 2024, 12, 95847–95867. [Google Scholar] [CrossRef] [Scilit]
- Schade, C.; Aliasghari, P.; Egging, R.; Pfister, C. Least cost vehicle charging in a smart neighborhood considering uncertainty and battery degradation. Batteries 2025, 11, 104. [Google Scholar] [CrossRef] [Scilit]
- Zhang, Y.; Chen, X.; Zhang, Y. Transfer deep reinforcement learning-based large-scale V2G continuous charging coordination with renewable energy sources. arXiv 2022, arXiv:2210.07013. [Google Scholar]
- Berecibar, M.; Gandiaga, I.; Villarreal, I.; Omar, N.; Van Mierlo, J.; Van den Bossche, P. Critical review of state of health estimation methods of Li ion batteries for real applications. Renew. Sustain. Energy Rev. 2016, 56, 572–587. [Google Scholar] [CrossRef] [Scilit]

Disclaimer/Publisher’s Note: The statements, opinions and data contained in all publications are solely those of the individual author(s) and contributor(s) and not of MDPI and/or the editor(s). MDPI and/or the editor(s) disclaim responsibility for any injury to people or property resulting from any ideas, methods, instructions or products referred to in the content. |
© 2026 by the authors. Licensee MDPI, Basel, Switzerland. This article is an open access article distributed under the terms and conditions of the Creative Commons Attribution (CC BY) license.