


Abstract
This study uses electrochemical impedance spectroscopy (EIS) to investigate coupled effects of mechanical deformation depth and size on impedance responses of large-format prismatic lithium-ion batteries (LIBs). Stepwise out-of-plane deformations were applied using hemispherical impactors of two different diameters (30 mm and 180 mm), representing localized and global mechanical loading while maintaining consistent contact conditions. Cells were deformed to 25%, 50%, 75%, and 95% of the internal short-circuit deformation depth, with EIS measurements conducted at each level. Relative changes of measured impedance parameters and fitted equivalent circuit model (ECM) parameters were analyzed. Results show that localized deformation decreases charge transfer resistance ΔR1 up to 8.0% and total impedance ΔZ up to 1.6%, indicating enhanced charge mobility due to internal structural damage. In contrast, global compression increases ohmic resistance ΔR0 up to 2.1% and ΔZ up to 2.0%, likely due to reduced separator porosity. Phase angle ΔPhase showed opposite trends under localized and global loading, reflecting different capacitive responses. These results reveal that deformation depth and size significantly influence EIS measurements, with non-linear interactions and transition points indicative of irreversible damage. These results support the use of EIS as a non-destructive diagnostic tool for identifying mechanical damage in LIBs.
1. Introduction
Lithium-ion batteries (LIBs) are widely used as energy storage systems (ESSs) in electric vehicles (EVs) due to their high energy density and long cycle life [1,2,3,4]. However, they present serious challenges when it comes to safety monitoring, particularly in scenarios involving a mechanical load (e.g., a crash). In the case of any collision or crash, the battery pack may undergo structural deformation, that mechanically deforms the individual battery cells within the pack. Such a deformation of a battery cell can easily lead to an internal short circuit (ISC) and possibly escalate to the highly critical safety hazard of a thermal runaway (TR) [5,6]. Preventing this scenario is very important for ensuring the safety and reliability of LIBs in EVs. Therefore, the detection of such safety-critical scenarios is very important.
Currently, the battery management system (BMS) is responsible for determining the battery state, detecting faults and potential failures in EVs. However, its effectiveness in detecting the status of the battery during safety-relevant scenarios has limitations, as it relies mainly on the monitoring of a battery’s voltage, temperature, and current [4,7,8,9]. Consequently, different mechanical deformation states of battery cells, caused by collision or crash, often go undetected, as these types of structural changes do not necessarily produce changes in the monitored signals. This is not only relevant for batteries of EVs, which are often discarded once visibly deformed, but even more for micro-mobility and handheld devices, where mechanical deformation poses a significant safety risk.
To overcome this, electrochemical impedance spectroscopy (EIS) could become a suitable tool for detecting safety-relevant cell changes by providing deeper insights into the cells’ material properties and electrochemical behavior [4,10,11]. This non-destructive method is highly sensitive to various influencing factors, like state of charge (SOC) [11,12,13], state of health (SOH) [14,15], and temperature [16,17,18]. Moreover, research has demonstrated its ability to assess mechanical loads on battery cells, which may arise during a collision or crash [19,20,21].
Liu et al. analyzed the effects of mechanical deformation on 18650 cells through EIS measurements. The results showed that the ohmic resistance increased significantly with the increase in deformation, while the increase in solid electrolyte interface (SEI), charge transfer, and diffusion resistance remained relatively small [22]. Similarly, Li et al. observed that the bending of prismatic cells resulted in an increased ohmic resistance, whereas the charge transfer resistance increased moderately in three-point bending tests [23]. Xiao et al. demonstrated a correlation between mechanical deformation and the electrochemical behavior of prismatic cells, noting an increase in ohmic and charge transfer resistance while subjected to in-plane deformation at 0% SOC [24]. Furthermore, Spielbauer et al. conducted stepwise mechanical deformation on 18650 cells with different impactor geometries. The results revealed that small, localized deformation did not affect the EIS measurement, although large-area deformation did result in increased ohmic resistance, suggesting a size-dependent mechanical failure behavior. These changes became more pronounced at higher SOC levels [25].
While these studies illustrate the sensitivity of EIS to assess mechanical damages in LIBs, important knowledge gaps remain. Most existing work focuses on small-format cells or investigate either deformation depth or loading configuration separately. As a result, the combined effects of deformation size and depth, particularly in large-format automotive cells, are poorly understood. This limits insight into how distinct mechanical failure modes perform locally or global loading influence the electrochemical behavior and the risk of an ISC in LIBs.
This study addresses these gaps by systematically investigating the coupled effects of deformation depth and size on the EIS response of commercial large-format prismatic LIBs. Stepwise out-of-plane deformations are applied using hemispherical impactors of two different diameters, representing localized and global mechanical loading while maintaining consistent contact conditions. EIS measurements are performed at multiple deformation levels (25%, 50%, 75%, and 95% of the internal short-circuit deformation depth), and the analysis focuses on relative changes in both measured impedance parameters and fitted equivalent circuit model (ECM) parameters.
This enables the identification and comparison of distinct electrochemically relevant failure pathways associated with local and global mechanical loading in large-format LIBs. The results improve the understanding of how different mechanical loading conditions affect the electrochemical response of damaged cells. Furthermore, these findings offer practical guidance for early detection of mechanical damage and assessment of ISC risk in automotive battery applications.
2. Materials and Methods
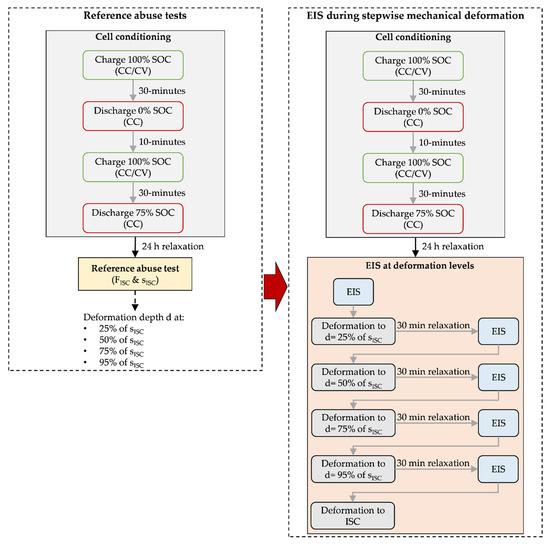
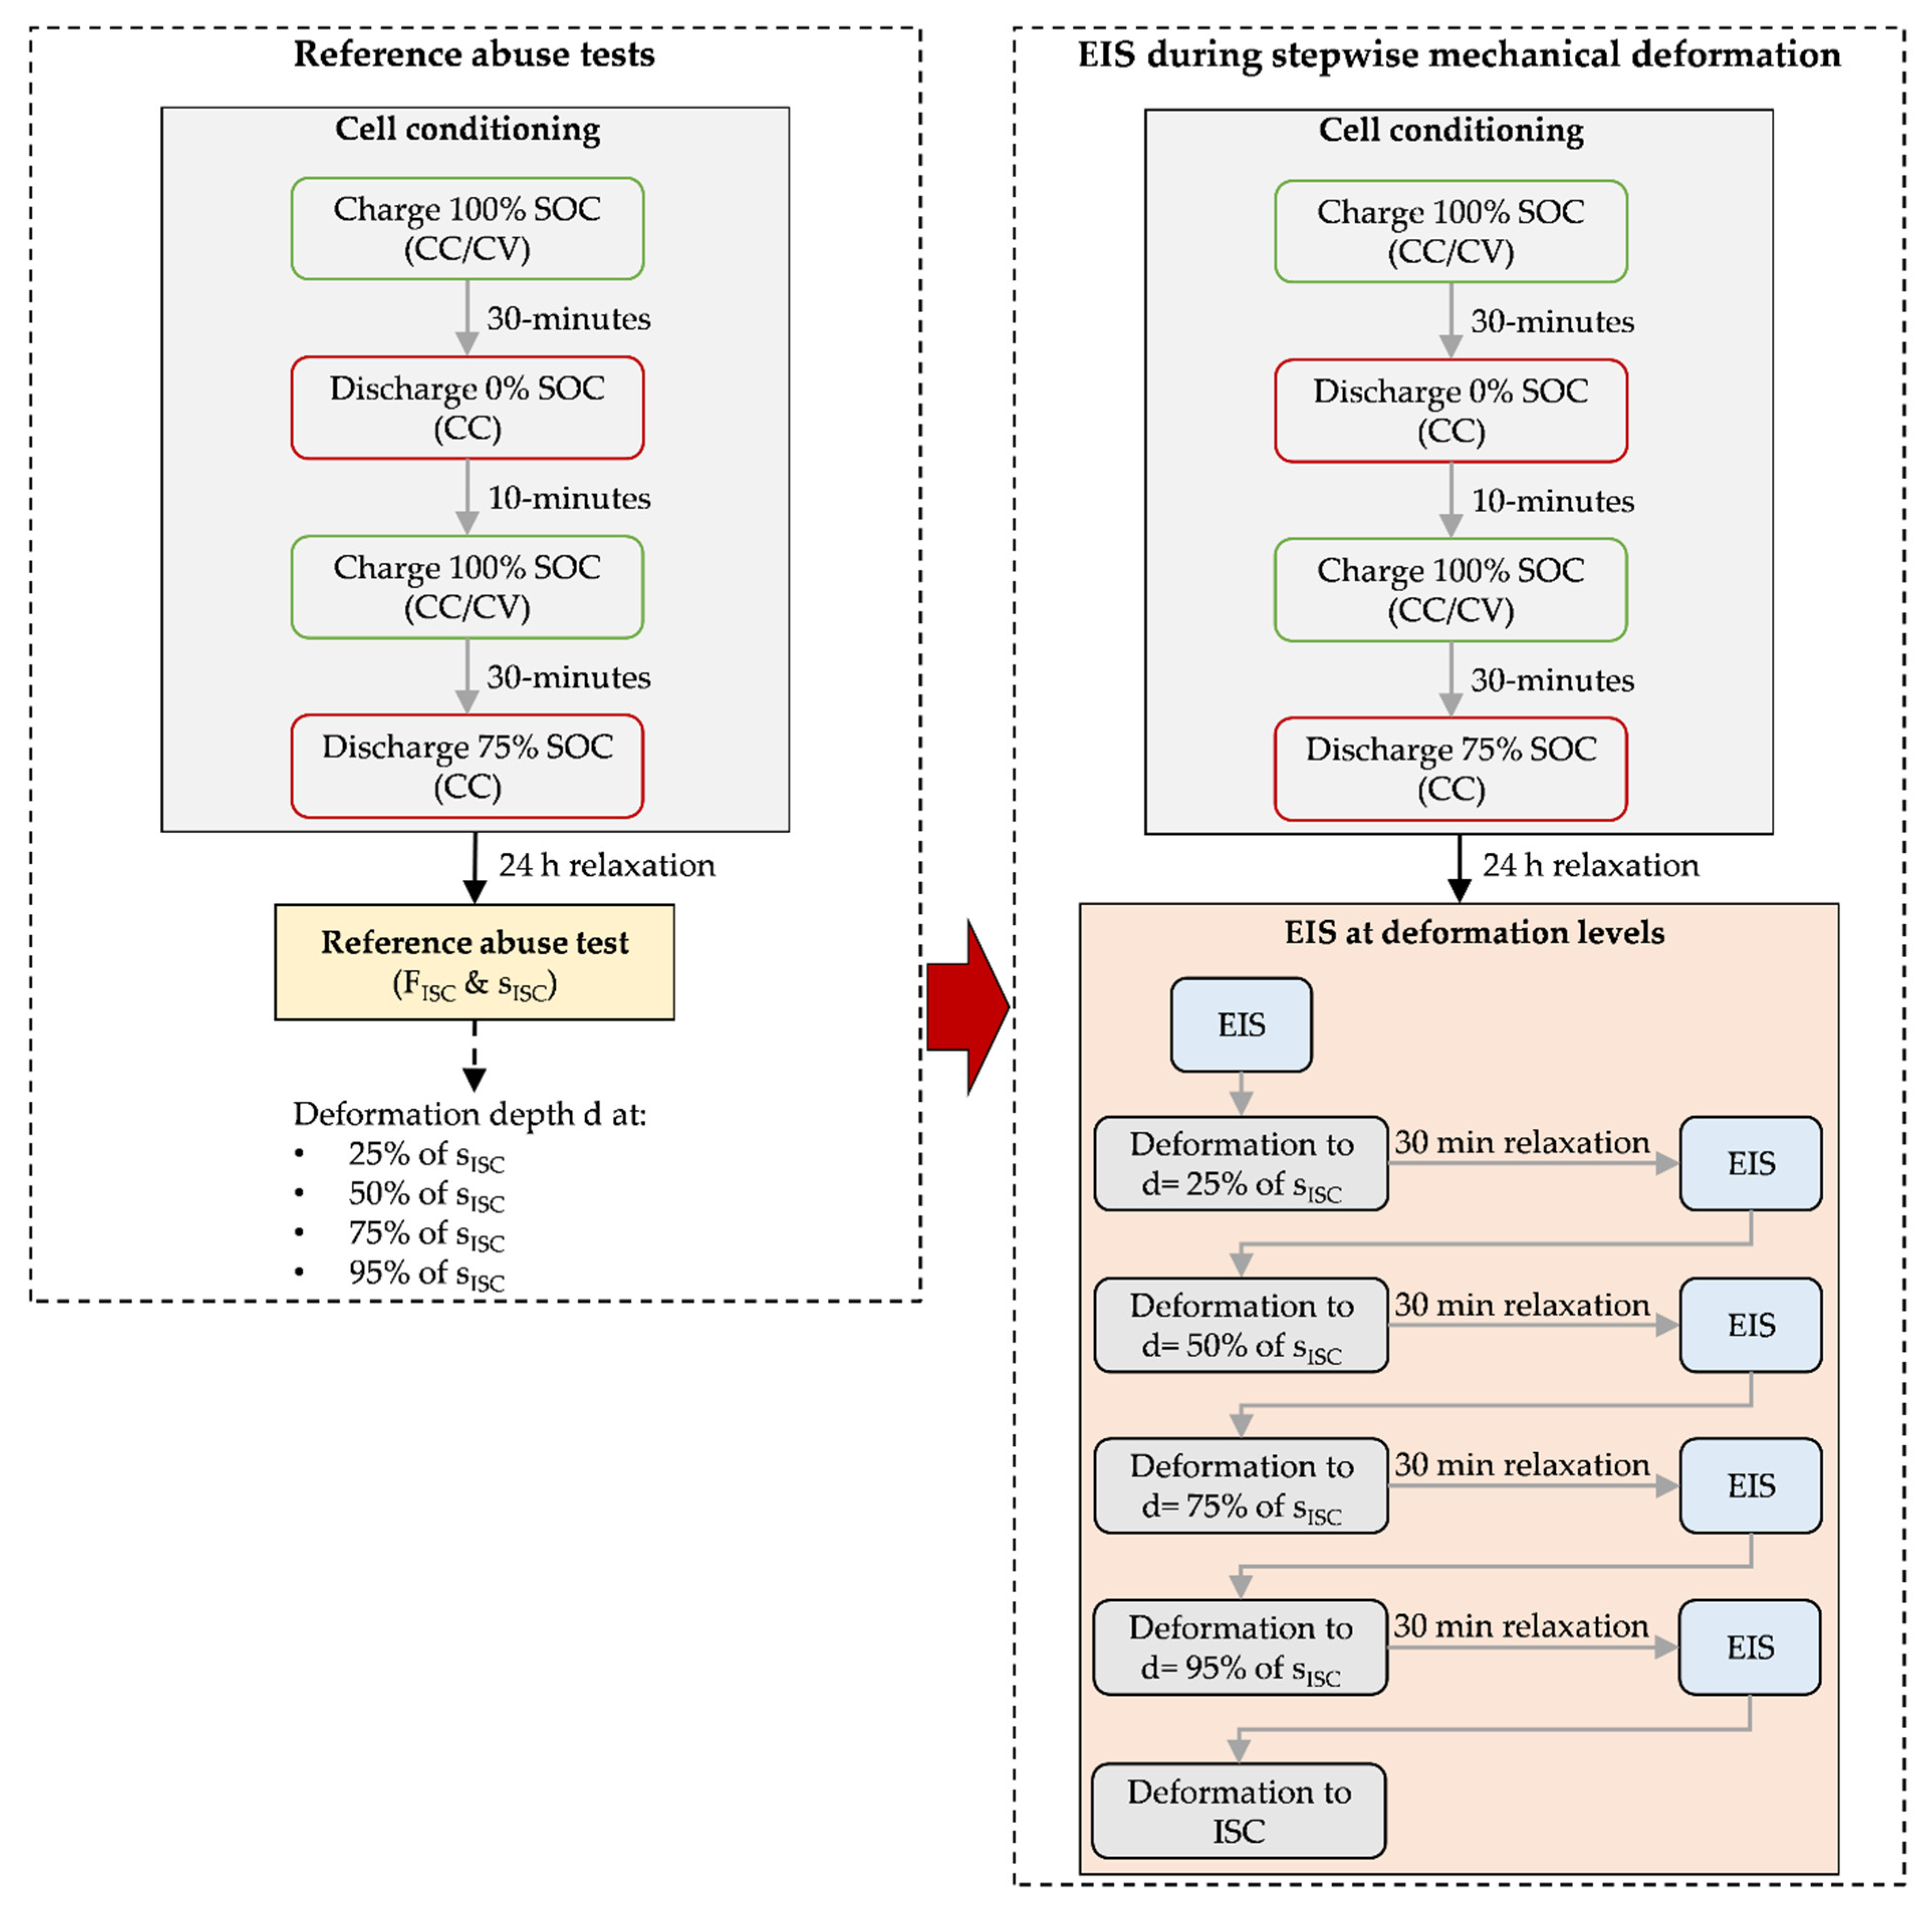
The experimental procedure of this study is divided into two phases, illustrated in Figure 1. In the first phase, reference abuse tests are performed on cells at 75% SOC using two hemispherical impactors with diameters of 30 mm and 180 mm. These reference abuse tests evaluate the cells’ safety limits in terms of internal short-circuit deformation depth and force . Based on the determined , the different deformation levels of 25%, 50%, 75%, and 95% of are calculated as input for the second phase of the experimental procedure. In the second phase, EIS measurements during stepwise mechanical deformation are performed. Again, two hemispherical impactors with a diameter of 30 mm and 180 mm are used. Five cells at 75% SOC are then tested under each condition to assess the influence of both mechanical deformation depth and size on the EIS measurement.
Figure 1.
Flow chart of the two-phase experimental procedure.
2.1. Specimen
For this study, 75 Ah prismatic cells with a nominal voltage of 3.72 V and a gravimetric energy density of 220 Wh/kg are used. The cells have a nickel–manganese–cobalt (NMC) cathode and a graphite anode. Each cell consists of two separate jelly rolls, each composed of one anode sheet, one cathode sheet, and two separator sheets, wrapped in polymer film and housed in an aluminum casing with a thickness of 0.7 mm. The cells have a weight of 1.22 kg ± 0.05 kg and dimensions of 22.8 × 220.6 × 105.4 mm. All cells are unused and have experienced no electrochemical cycling prior to this study. The selected cell type represents a high-energy prismatic format commonly used in automotive applications.
To prepare the cells within the experimental phases, each cell underwent a defined four-step conditioning procedure using a bi-directional power supply (EA PSB 9060 120 3U); see Figure 1. First, the cells are charged to 100% SOC using a constant current/constant voltage (CC/CV) protocol. During the CC phase, a charging rate of 1C (75 A) is applied until the upper cut-off voltage of 4.35 V is reached. Upon reaching this voltage, the cells are charged in the CV phase with a cut-off current of C/20 = 3.75 A, followed by a 30 min relaxation period. In the second step, the cells are discharged to 0% SOC using a CC protocol with a discharge rate of 1C until the lower cut-off voltage of 2.8 V is reached, followed by a 10 min relaxation period. In the third step, the cells are charged to 100% SOC, following the same procedure as in the first step including the 30 min relaxation period at the end. Finally, the cells are discharged to 75% SOC using coulomb counting. This specific SOC is chosen for all further experiments in both phases, as it lies within the mid-SOC range where EIS measurements are known to be relatively stable and reproducible [11], and it also represents a safety-relevant operating point with a higher risk of thermal runaway compared to lower SOC levels [26].
2.2. Reference Abuse Tests
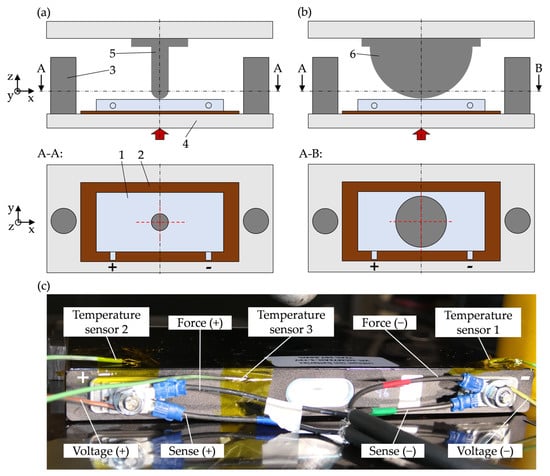
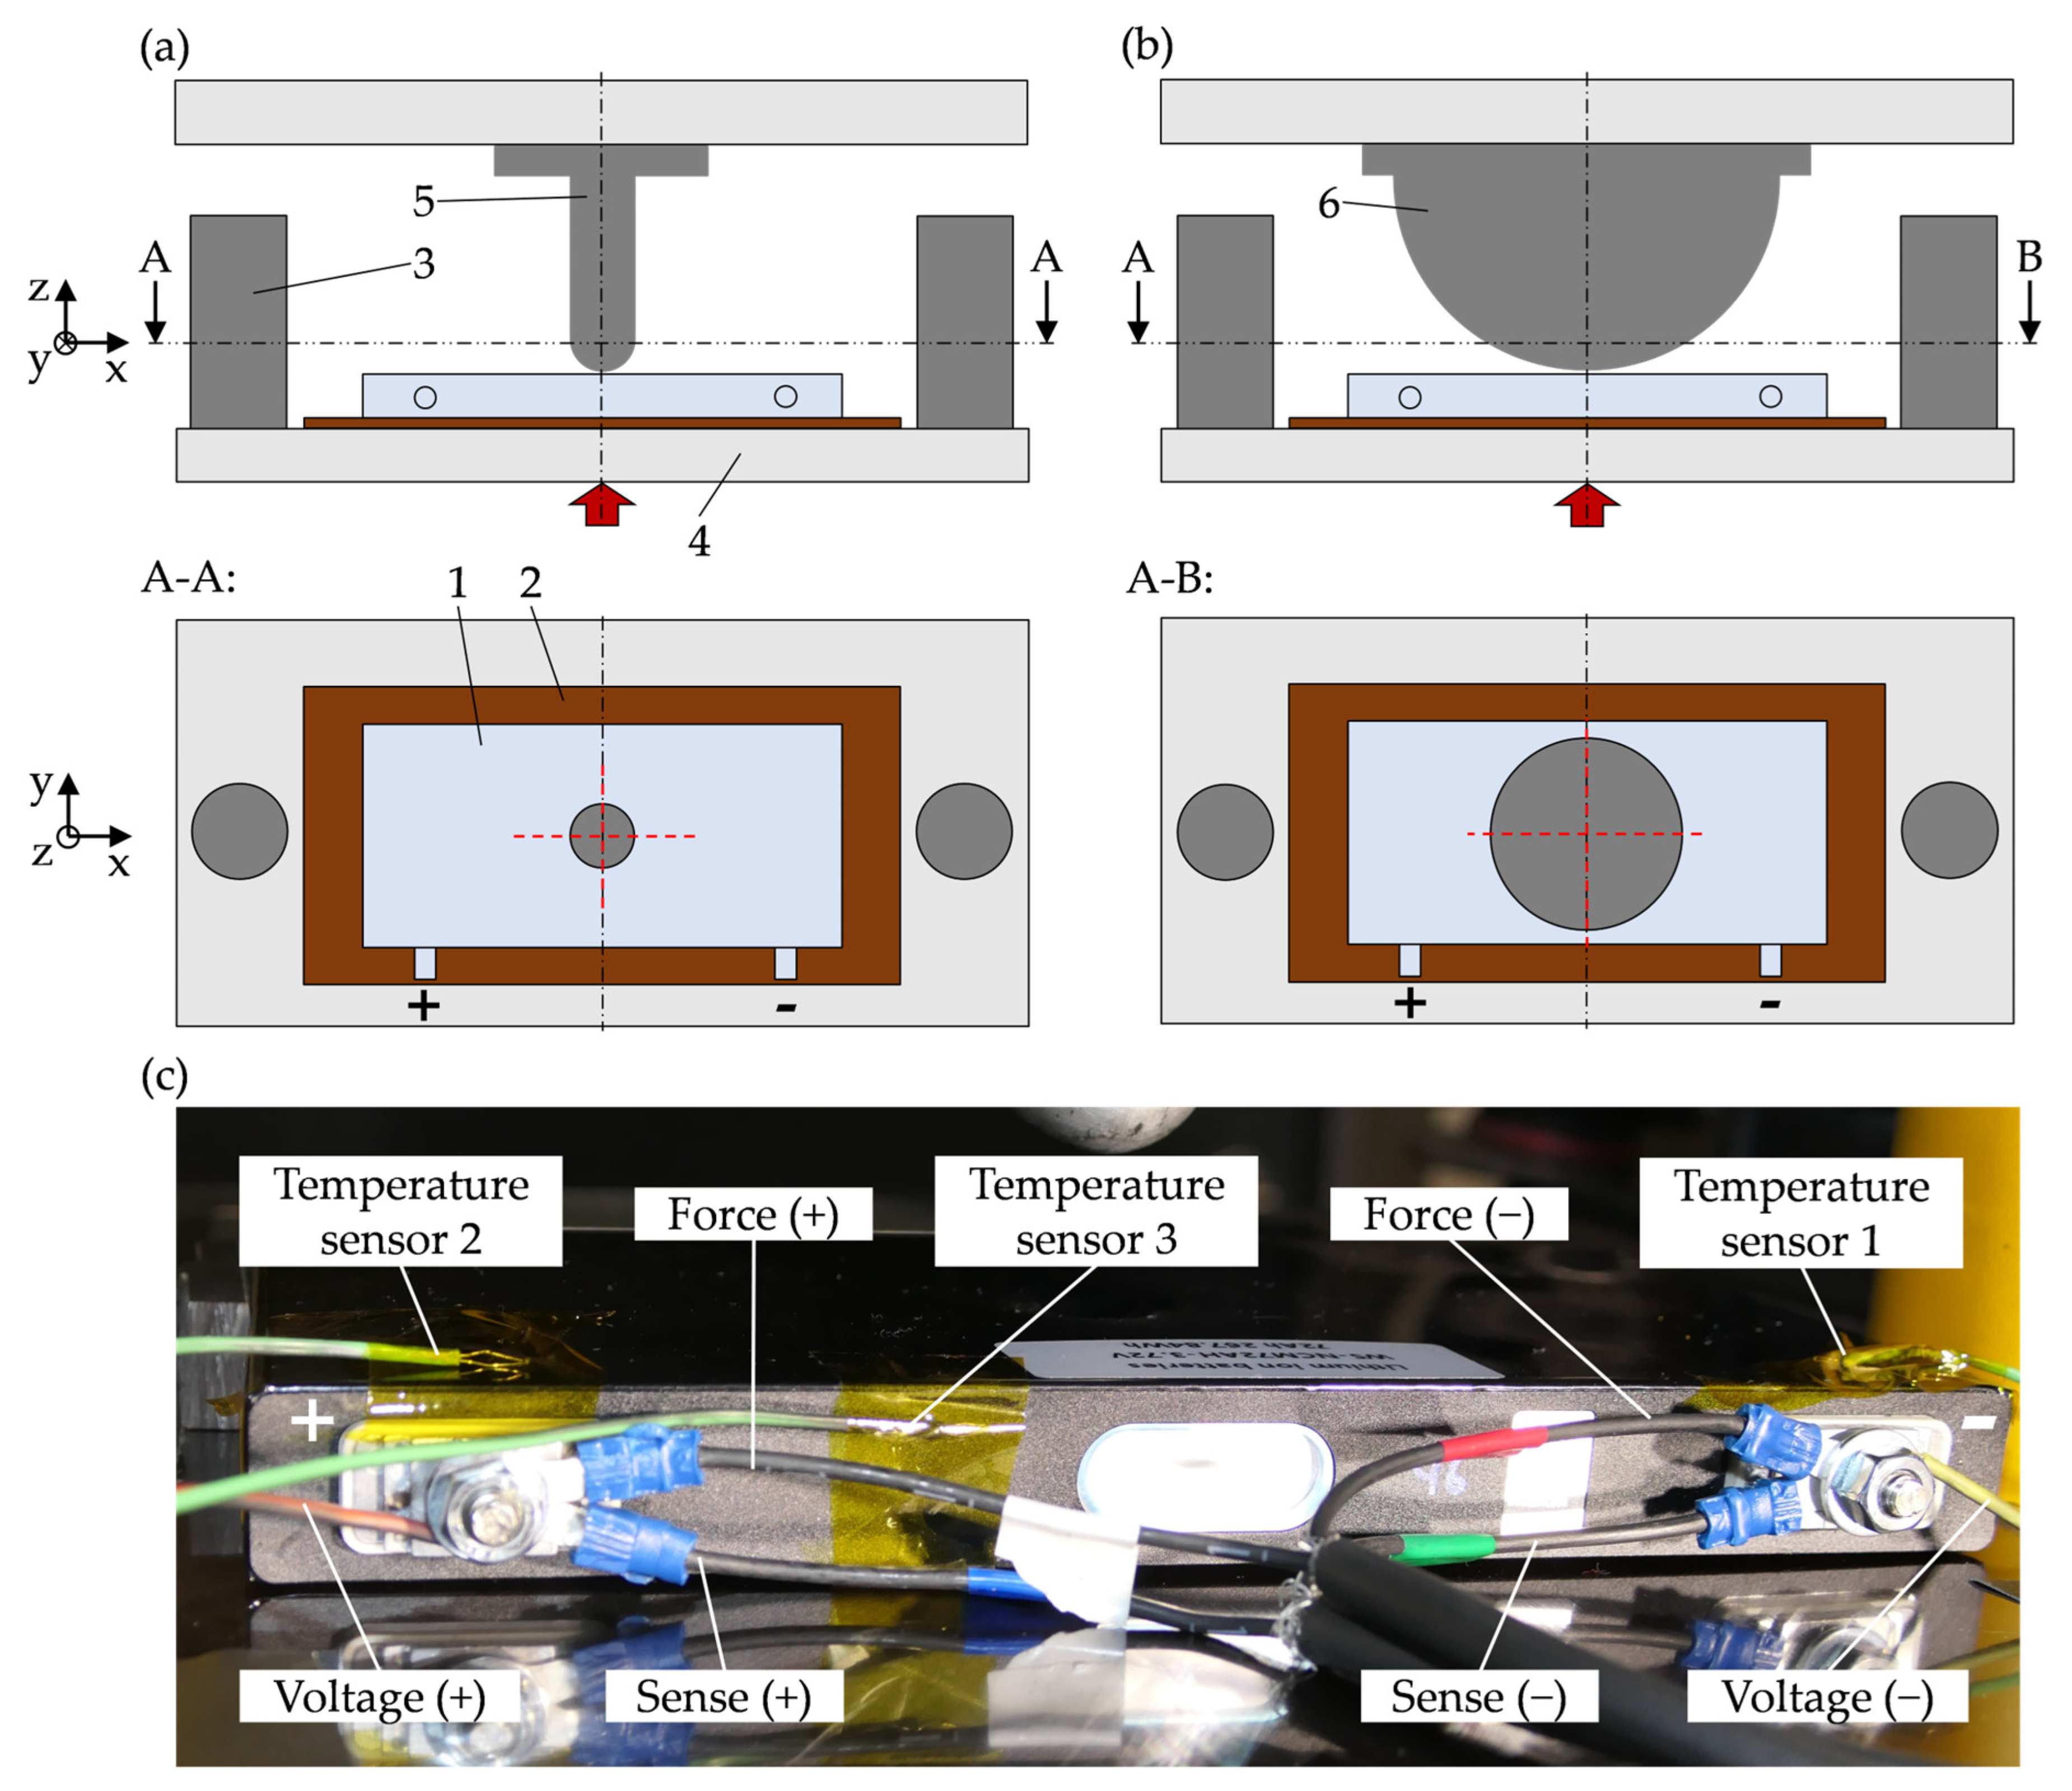
The reference abuse tests are performed using the hydraulic press described by Kovachev et al. [27], which is equipped with two hemispherical impactors with diameters of 30 mm and 180 mm. Figure 2a,b show the test setup for each impactor configuration with the cell placed on a 3 mm Pertinax plate and the cell tabs oriented in the positive y-direction. Following the cell conditioning, each cell is relaxed for 24 h prior to the abuse test to enable comparable cell conditions. During testing, the cell is deformed with an impactor speed of 0.1 mm/s at its center until an ISC and subsequent TR occur. This is repeated for three cells in each impactor configuration and the deformation depth and force at the ISC are evaluated for each cell. A voltage drop of 0.1 V is used to evaluate the ISC [28]. The minimum deformation depth at the ISC across all tested cells and impactor configurations, denoted as , is used as a unified baseline to calculate the deformation levels of 25%, 50%, 75%, and 95% of for the second experimental phase. The deformation depth is kept constant for both impactor sizes to ensure comparable damage levels, as the force response varies with the impactor orientation.
Figure 2.
(a) Test setup with the hemispherical impactor d = 30 mm (5): front view (above) and top view (bottom) with the cell (1), 3 mm Pertinax plate (2), adjustable distance screws (3), and bottom plate (4); (b) test setup with the hemispherical impactor d = 180 mm (6): front view (above) and top view (bottom); (c) cable setup for EIS measurements during stepwise deformation tests.
2.3. EIS During Local Stepwise Mechanical Deformation
The tests are conducted using the same hydraulic press in two different hemispherical impactor setups, one with a diameter of 30 mm and another with diameter of 180 mm, as shown in Figure 2a,b. In each setup, the cell is positioned on a 3 mm Pertinax plate with its tabs oriented in a negative y-direction. Five cells are tested in each setup configuration, and deformation is applied at the center of the cell at a speed of 0.1 mm/s. The defined deformation depths are reached using adjustable distance screws within the hydraulic press, providing an accuracy of ±0.05 mm. Following the cell conditioning, each cell is relaxed for 24 h prior to the test procedure of this section to enable comparable cell conditions. The test procedure consists of six steps, beginning with an initial EIS measurement of the undeformed cell. This is followed by five local stepwise deformations (25%, 50%, 75%, and 95% of ) and corresponding EIS measurement at each deformation level, as illustrated in Figure 1. Following each deformation step, the impactor returns to a reference position (mechanical unloading of cell), and an EIS measurement is conducted 30 min after each deformation on the unloaded cell. This waiting period is implemented to allow mechanical relaxation of the components, ensuring that the EIS measurement primarily captures damage-related effects. After the final EIS measurement at 95% of , the cell is deformed until ISC occurs.
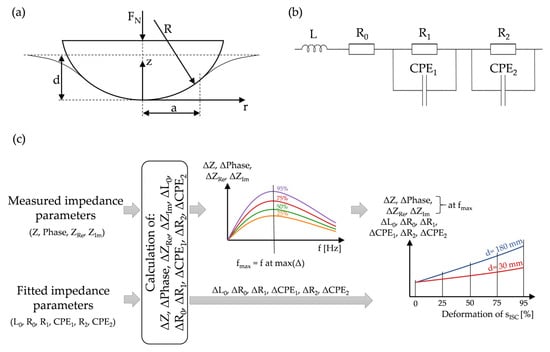
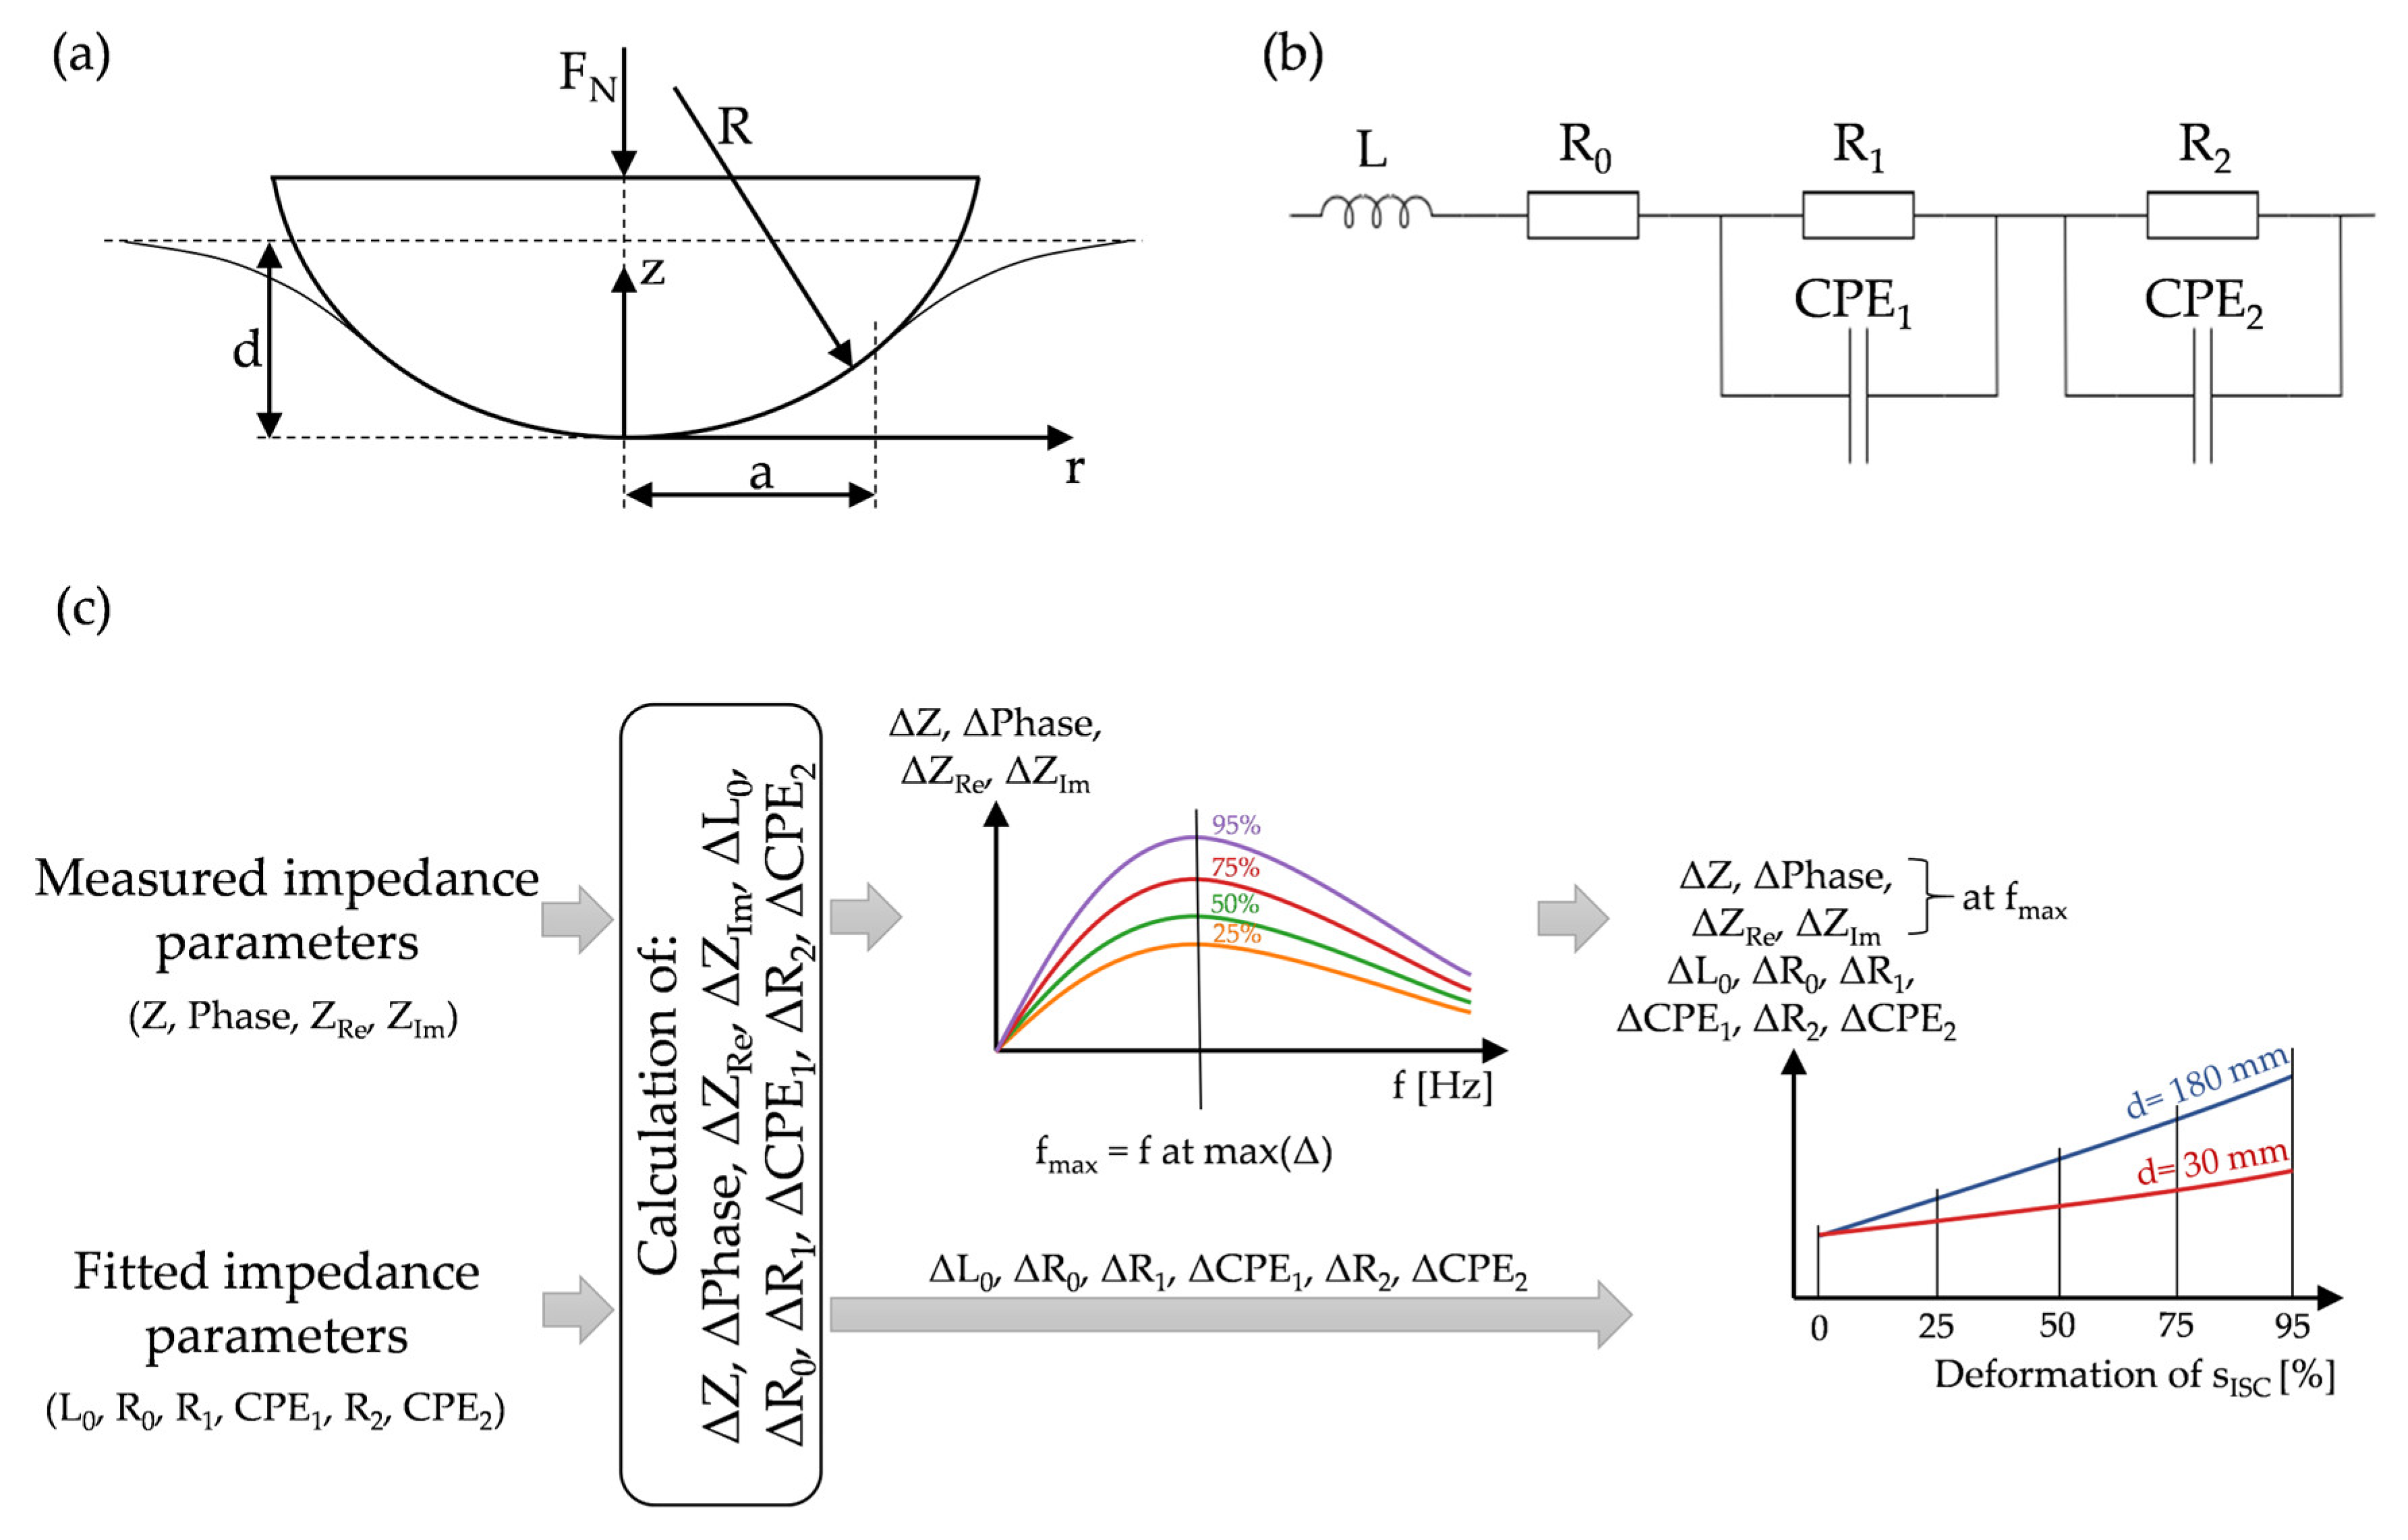
To estimate the mechanical stresses generated during the out-of-plane stepwise deformation of the cell by the hemispherical impactors, the contact interaction is described using Hertzian contact theory. The local shape of the impactor in the contact region is approximated by a parabolic profile, see Figure 3a, consistent with assumptions of the Hertzian analysis [29]. Assuming frictionless and quasi-static contact between the impactor and cell, the normal force is related to the deformation depth by Equation (1a), where denotes the impactor radius and denotes the effective modulus. This equation enables the calculation of for each configuration. For each deformation level and impactor size, the average pressure and the maximum normal stress in the contact area are calculated using Equation (1b,c), respectively. Due to the layered structure of the large-format prismatic cells, these calculations should be interpreted as an estimation. They are intended primarily to enable a relative comparison of the load values at specific deformation levels between the two impactor sizes.
Figure 3.
(a) Contact definition during normal indentation by a parabolic indenter; (b) equivalent circuit model (ECM) of the cell, with the following elements representing the cell behavior: L0—inductance, R0—ohmic resistance, R1—charge transfer resistance, CPE1—double layer capacity, R2—diffusion resistance, CPE2—diffusion capacity; (c) stepwise analyzation procedure for both measured and fitted impedance parameters.
Equation (1a–c). Calculation of , normal stress , and average pressure using Hertzian contact theory [29].
2.4. EIS Measurements
All EIS measurements are performed using a Zahner Zennium Pro (Zahner-Elektrik GmbH & Co. KG, Kronach, Germany) with a frequency range of 10 mHz to 100 kHz and a current amplitude of 2 A. Galvanostatic excitation is chosen because the investigated high-energy prismatic cells have a low internal resistance, ensuring reliable voltage signals across the full frequency range while avoiding additional polarization effects. Prior to each measurement, the cells are allowed to relax until a stable open-circuit voltage is reached, as illustrated in Figure 1. The measurements are conducted under open-circuit conditions without any applied DC load, using a small-signal AC current excitation around the equilibrium potential. The investigated battery cell has an internal resistance of approximately 600 µΩ, placing the measurement well within the low-impedance regime (<10 mΩ), for which galvanostatic excitation is recommended. Based on manufacturer specifications and comparative performance data (25 µΩ resistor measured at 1 A), the expected impedance accuracy in this range is typically better than ±2%, and is estimated at around ±1% due to the increased amplitude and higher signal-to-noise ratio [30]. For each tested cell, twisted force and sense cables are screwed onto the cell tabs with a torque of 2 Nm and are fixed in place throughout the entire test procedure, as illustrated in Figure 2c. All tests are conducted at ambient temperature under controlled laboratory conditions with a temperature variation of ±1 °C, which is measured with two Typ K thermocouples on the cell surface above the cell tabs.
2.5. EIS Data Analyzation
First, EIS measurements obtained at different mechanical deformation depths and sizes are qualitatively compared using Nyquist plots. To quantitatively investigate the effect of deformation depth and size on EIS measurements, both measured impedance parameters and impedance parameters derived from a fitted equivalent circuit model (ECM) are analyzed.
Among the measured impedance parameters, the impedance (Z), phase angle, real part (ZRe), and imaginary part of the impedance (ZIm) are evaluated. For the fitted impedance parameters, comparisons are made based on the ECM components, as seen in Figure 3b. The components represent the inductance (L0), ohmic resistance (R0), charge transfer resistance (R1), double layer capacity (CPE1), diffusion resistance (R2), and diffusion capacity (CPE2). A constant phase element (CPE) is used to model the double layer capacity and diffusion capacity. The open source software of Zahner [31] is used to fit the ECM and represent the overall cell behavior with a fitting error below 0.41%.
The variation of each measured and fitted impedance parameter (Z, phase angle, ZRe, ZIm, L0, R0, R1, CPE1, R2, CPE2) across different deformation levels is quantified using Equation (2). As an example, the calculation is shown for the phase angle. In this context, ΔPhase represents the relative change at a given deformation level, in reference to the undeformed cell, which corresponds to 0% deformation of .
Equation (2) demonstrates the relative change of impedance parameters with respect to the undeformed state. The equation is shown using the phase angle as an example, but it is applied to all other measured and fitted impedance parameters (Z, ZRe, ZIm, L0, R0, R1, CPE1, R2, CPE2).
The stepwise analyzation procedure for each measured and fitted impedance parameter is illustrated in Figure 3c. The whole approach is chosen in addition to Nyquist plots, as Nyquist plots do not provide any information about the time domain [25]. Moreover, focusing on relative impedance parameter changes at specific frequencies offers a more practical and efficient method of identifying cell changes, as it avoids reliance on absolute values and significantly reduces computational time.
First, the relative changes of the fitted impedance parameters (ΔL0, ΔR0, ΔR1, ΔCPE1, ΔR2, ΔCPE2) are evaluated for both impactor sizes. For each parameter, the arithmetic mean across all tested cells in each impactor configuration is calculated and plotted against the deformation of .
To enable a consistent comparison with the relative changes of the measured impedance parameters (ΔZ, ΔPhase, ΔZRe, and ΔZIm), a specific frequency fmax is identified for each measured parameter, representing the frequency at which the relative change reaches its maximum. In addition, for each parameter, the arithmetic mean of the identified fmax values is calculated across all tested cells. Only values within the frequency range of 10 mHz to 1000 Hz are considered for this analysis, as higher frequencies are dominated by inductive effects and are therefore excluded.
3. Results
3.1. Reference Abuse Tests
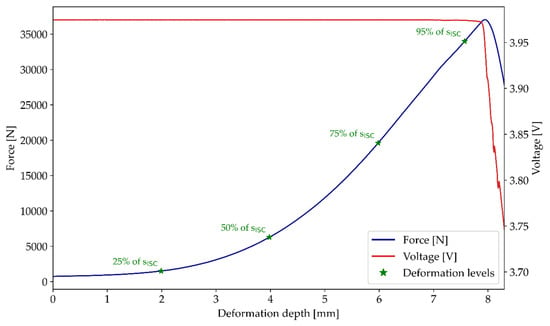
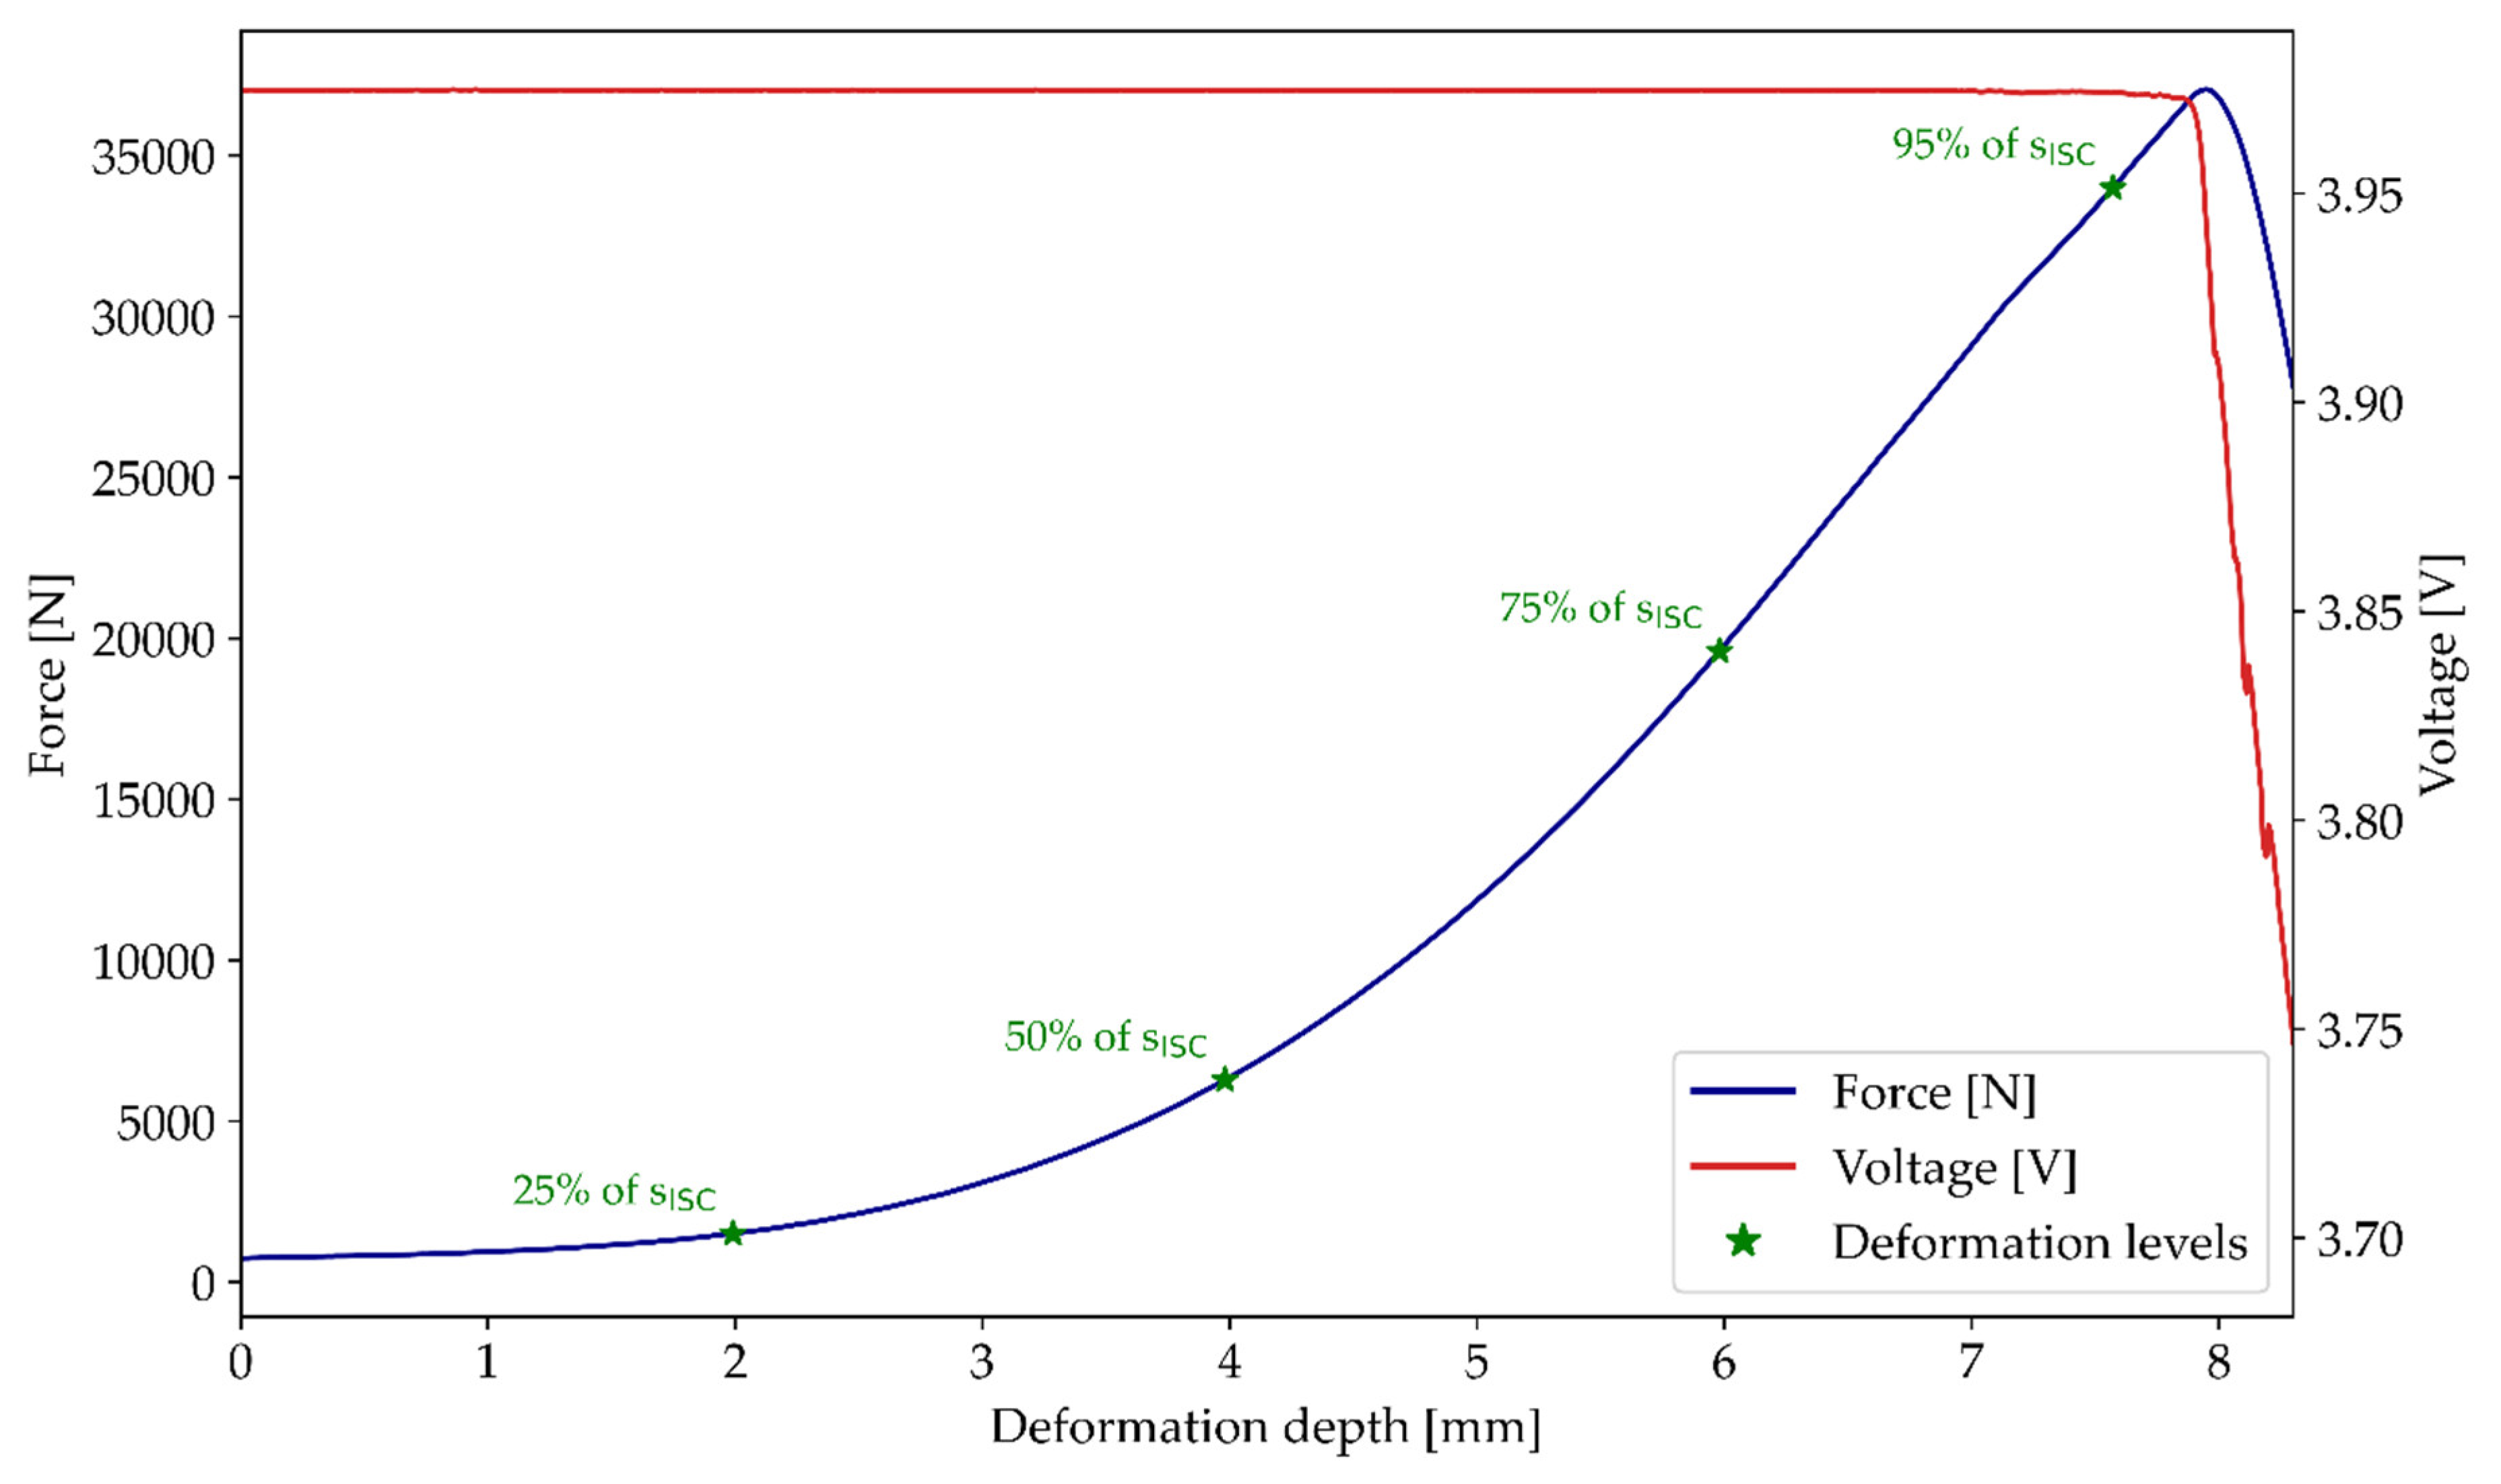
Figure 4 presents the average force-deformation depth and voltage curve from the three tested cells for the smaller impactor (30 mm diameter). The minimum deformation depth and force at which the ISC occurred across all tested cells and both impactor configurations, denoted as and , is 7.97 mm and 36,580 N, respectively. In the following, is used as a calculation basis for the different deformation levels (25%, 50%, 75%, and 95% of ). The corresponding deformation depths d and the associated normal forces for each deformation level are summarized in Table 1. The impactor with a diameter of 180 mm exhibits significantly higher across all deformation levels compared to the impactor with a diameter of 30 mm. Despite this, the calculated and are of similar magnitude for both impactor sizes.
Figure 4.
Average force-deformation depth and voltage curve from the three tested cells for the smaller impactor (30 mm diameter) with marked deformation levels.
Table 1.
Calculated deformation depth , normal force , average pressure , and maximum normal stress at each deformation level for both impactor sizes.
3.2. EIS During Stepwise Mechanical Deformation
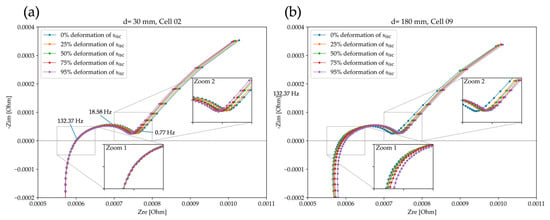
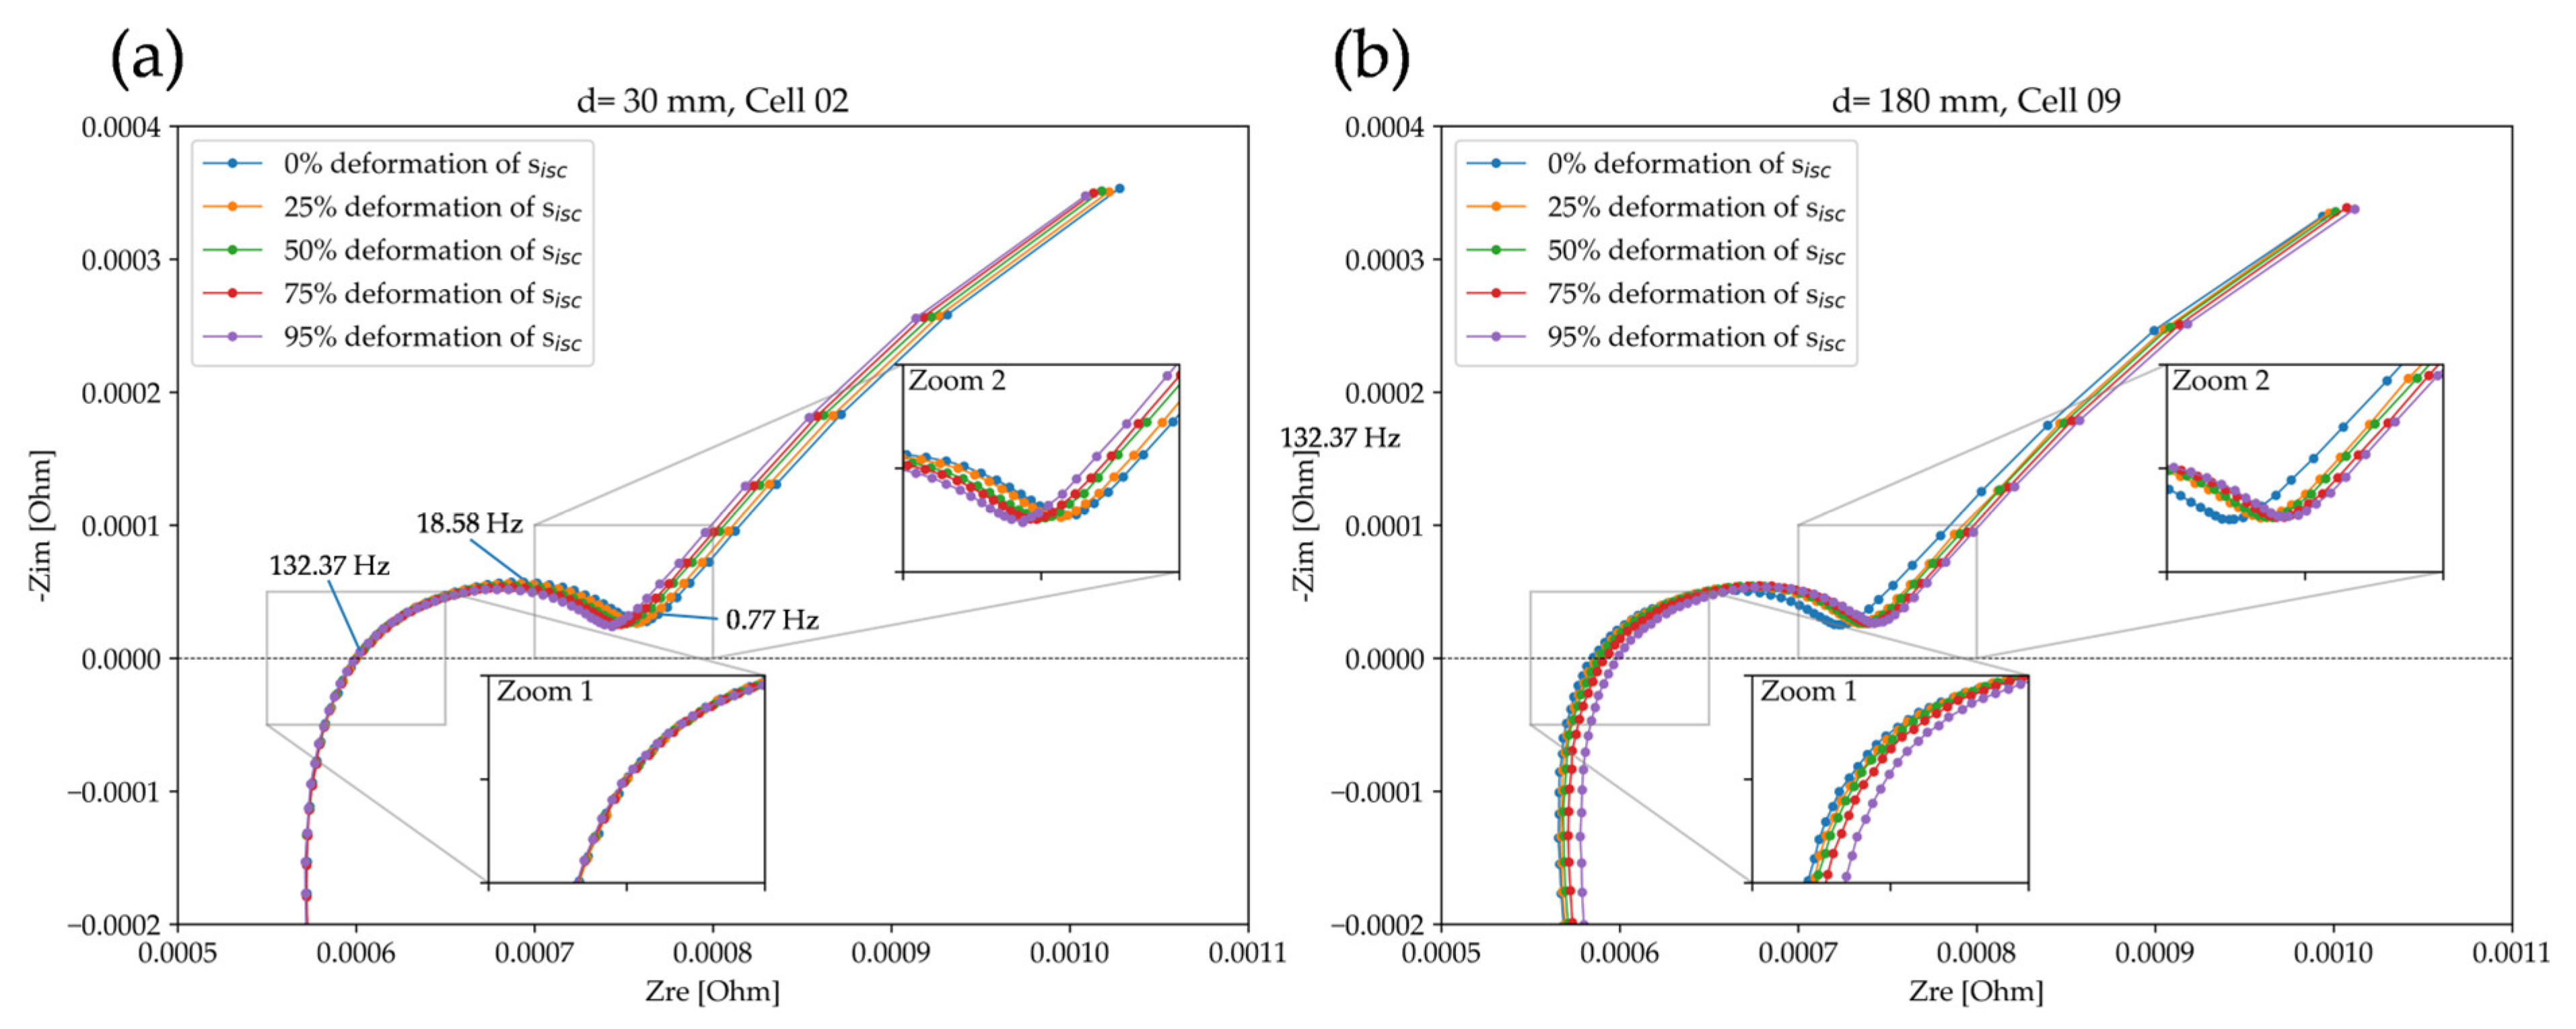
Figure 5a presents the Nyquist plots for a single cell subjected to stepwise mechanical deformation using the smaller impactor, whereas Figure 5b shows the corresponding results for the test with the bigger impactor. The frequency range shown in these plots spans from 10 mHz to 1 kHz, while higher frequencies are excluded due to dominant inductive effects. Nyquist plots for additional tested cells are provided in Appendix A.
Figure 5.
Nyquist plots (0.01 Hz to 1000 Hz) obtained from EIS measurements conducted at each deformation level during stepwise deformation tests. Results provided for two cells using different impactors: (a) d = 30 mm, (b) d = 180 mm.
All Nyquist plots exhibit a similar shape (characterized by a prominent semicircle in the high- to mid-frequency region of 1 Hz to 1 kHz), which is associated with the charge transfer process [32]. The semicircle is followed by a slightly curved diffusion tail in the low-frequency region of 10 mHz to 1 Hz, representing the diffusion behavior [32]. For visual comparison, the ohmic resistance is approximated by the real part (Zre) at the zero crossing of the imaginary part (-Zim).
For the smaller impactor with a 30 mm diameter, the ohmic resistance remains constant across the different deformation levels, as highlighted in Zoom 1 of Figure 5a, indicating stable contact conditions. The charge transfer resistance decreases with increasing deformation, as seen in Zoom 2 of Figure 5a. In contrast, for the bigger impactor with a diameter of 180 mm, an increase in ohmic resistance is observed with increasing deformation level, as illustrated in Zoom 1 of Figure 5b. Additionally, differences in the semicircle diameters are visible in Zoom 2 of Figure 5b. However, based on visual inspection alone, it is not possible to clearly discern whether these variations are due to the overall rightward shift or if they reflect a change in charge transfer resistance.
3.2.1. Measured Impedance Parameter Correlation with Deformation Depth and Size
Table 2 summarizes the specific frequency values at which each measured impedance parameter (ΔZ, ΔPhase, ΔZRe, ΔZIm) reaches its maximum relative change across the different deformation levels and impactor sizes. To avoid interpolation, the EIS measurement raw data frequency fmax,raw closest to the corresponding calculated frequency fmax is used for the ongoing analysis. The fmax,raw points are marked in the Nyquist plot, as seen in Figure 5a.
Table 2.
Calculated frequency fmax versus raw data frequency fmax,raw for each measured impedance parameter.
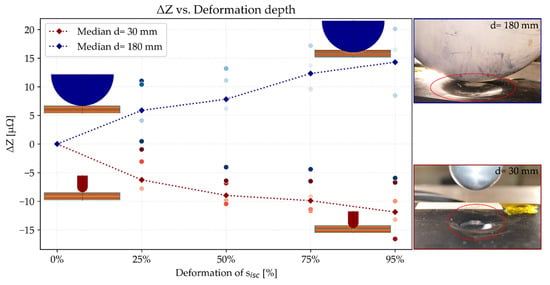
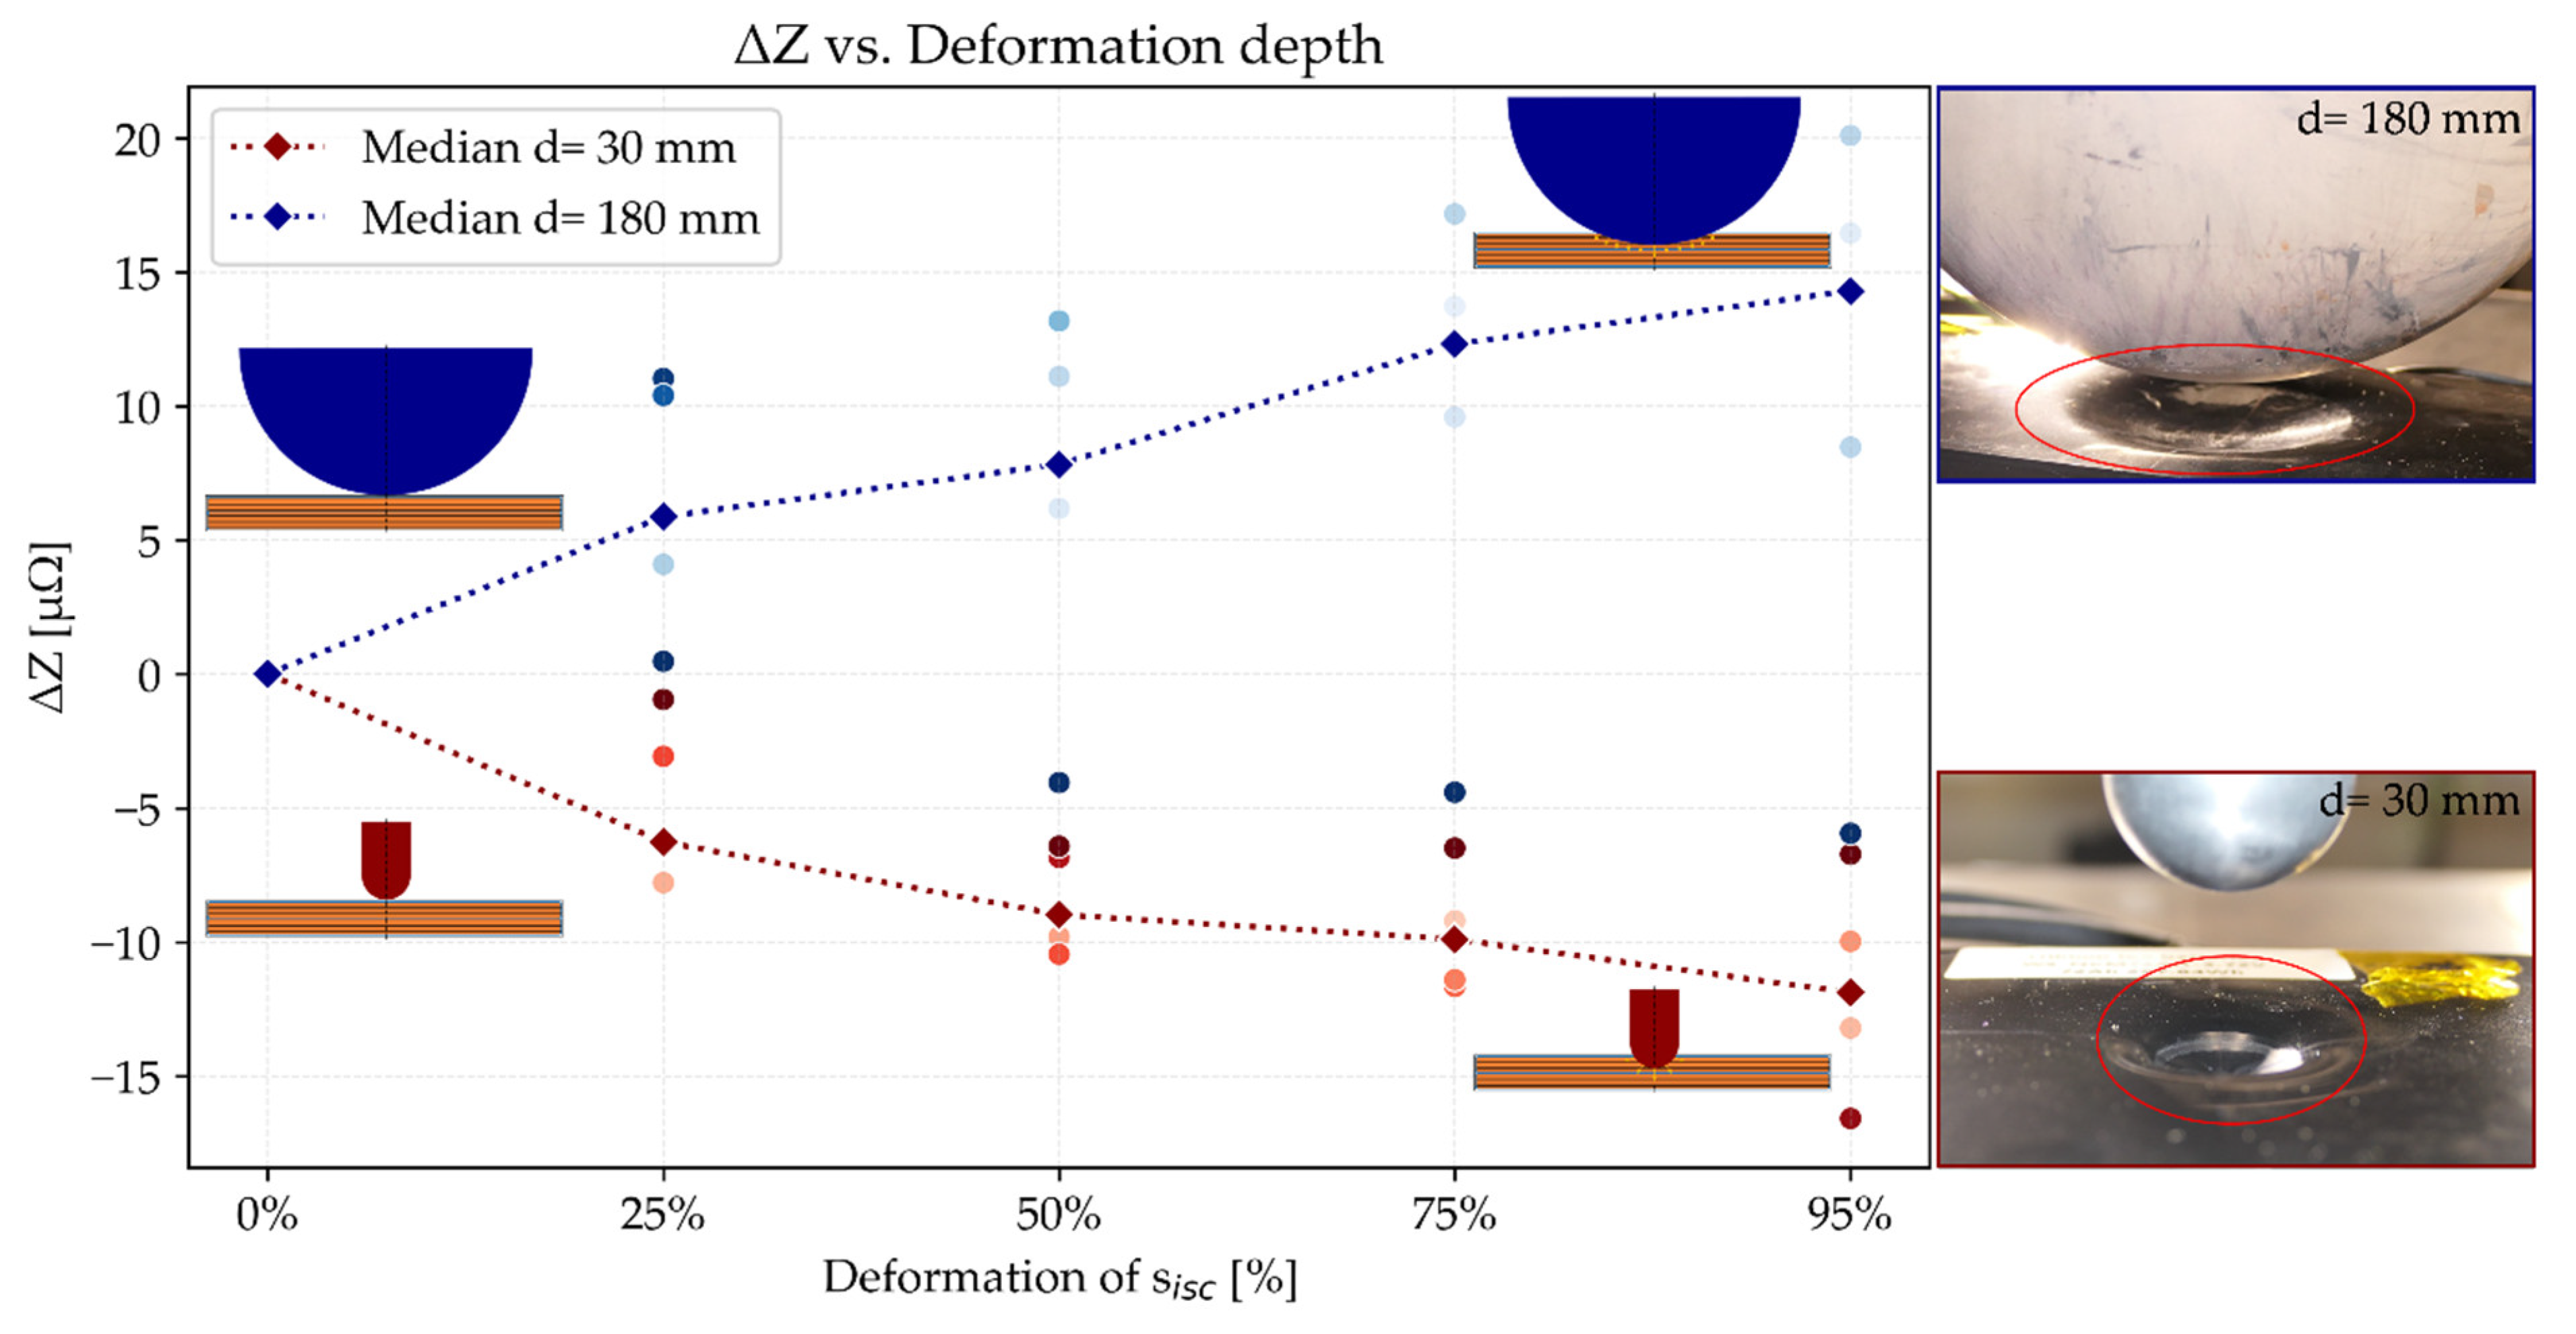
The variation in ΔZ across different deformation levels exhibits distinct trends depending on the impactor size, as illustrated in Figure 6. The dotted lines indicate the median ΔZ value for each impactor size across the five tested cells, while the colored dots represent the individual test results. Corresponding relative changes in ΔZ for each deformation level and size are summarized in Table 3. For the smaller impactor with a diameter of 30 mm, ΔZ decreases with increasing deformation level. The largest decrease of 12 µΩ is observed at 95% deformation of , which corresponds to a 1.605% reduction relative to the undeformed cell. In contrast, the larger impactor with a diameter of 180 mm shows an increasing ΔZ for increasing deformation levels. At 95% deformation, the maximum increase in ΔZ is 14 µΩ, representing a 2.014% rise.
Figure 6.
ΔZ [μΩ] at a raw data frequency fmax,raw of 0.77 Hz for different deformation of [%]. Results are plotted for two hemispherical impactor sizes (blue and red color) and five tested cells (points).
Table 3.
Relative changes in the measured impedance parameters for each deformation level and size.
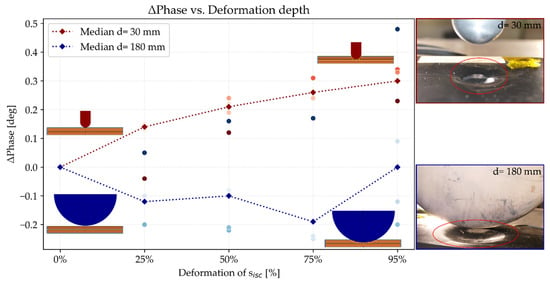
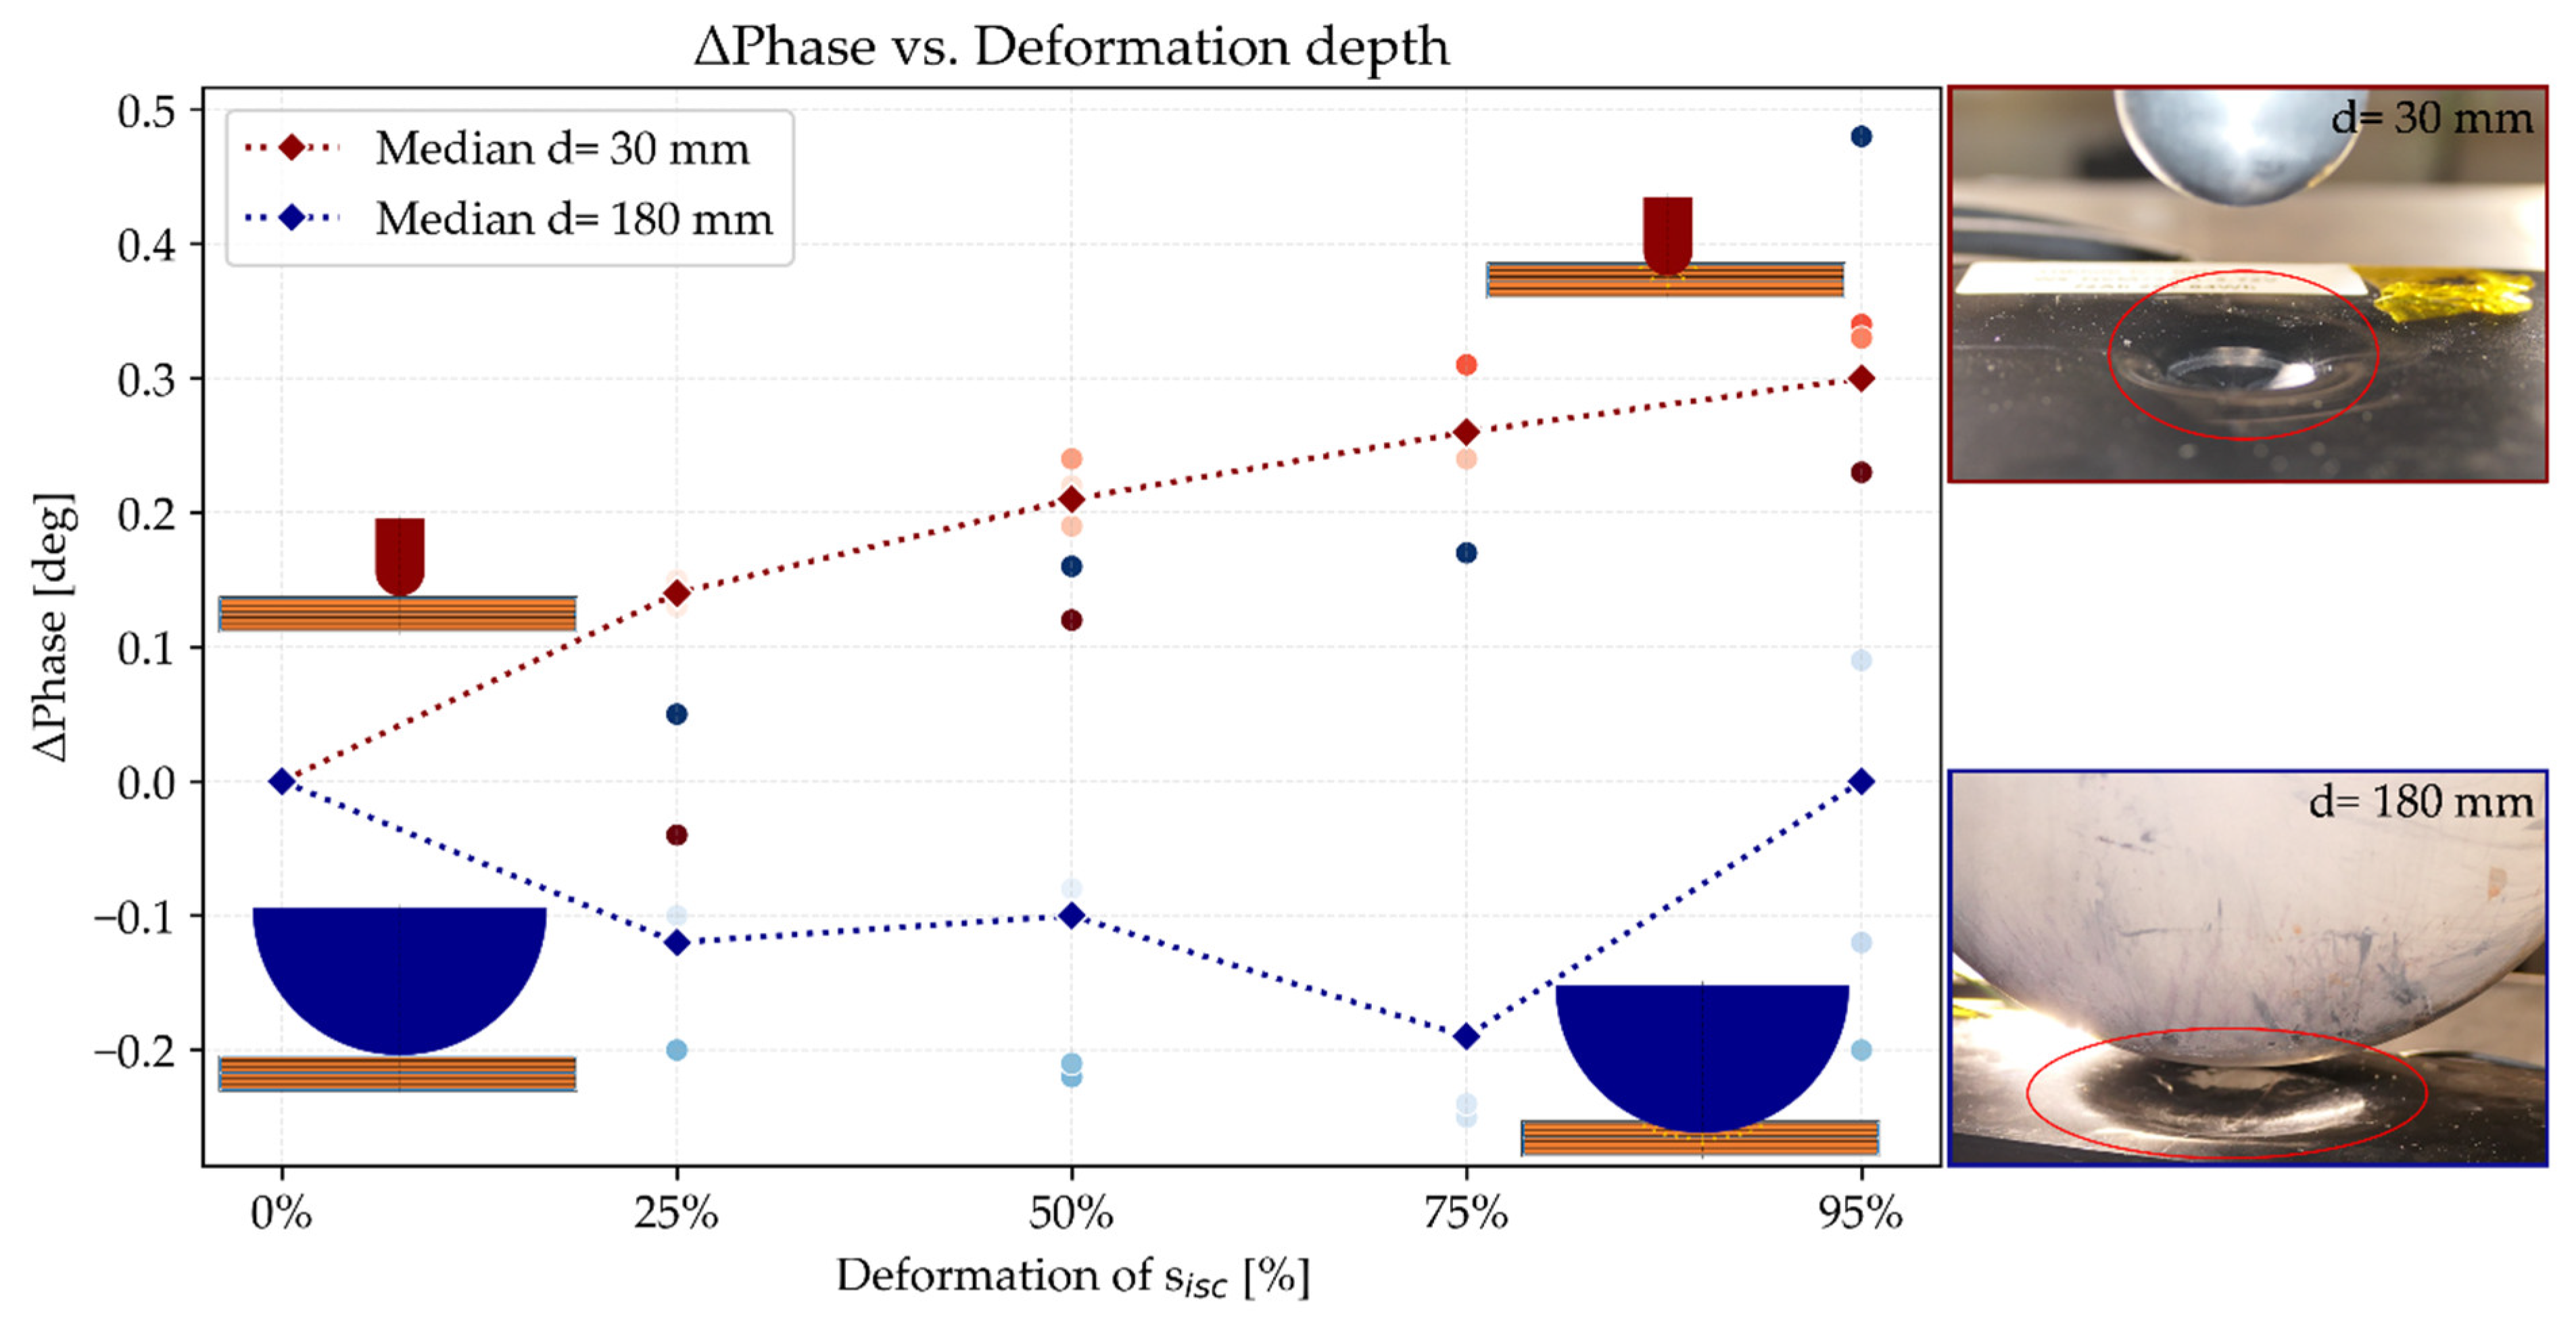
Figure 7 illustrates the variation in ΔPhase across different deformation levels of two impactor sizes. The dotted lines indicate the median ΔPhase value for each impactor size across the five tested cells, while the colored dots represent the individual test results. The corresponding relative changes in ΔPhase for each deformation level and size are listed in Table 3. For the smaller impactor, ΔPhase increases progressively with increasing deformation depth. The maximum increase of 0.3° is observed at 95% deformation of , corresponding to a 44.118% rise compared to the undeformed cell. In contrast, the lager impactor shows a non-monotonic trend. ΔPhase initially decreases by approximately 0.1°, and reaches a maximum decrease of 0.2° at around 75% deformation of . The maximum decrease of ΔPhase at 75% of corresponds to a 21.552% reduction relative to the undeformed cell. Beyond this point, the median ΔPhase at 95% deformation of increases in comparison to the one at 75% deformation of .
Figure 7.
ΔPhase [deg] at a raw data frequency fmax,raw of 132.37 Hz for different deformation of [%]. Results are plotted for two hemispherical impactor sizes (blue and red color) and five tested cells (points).
With the exception of a single outlier (smallest thickness after charging to the specific test SOC of 75%), which was observed for the larger impactor, all tested cells consistently follow the same ΔZ and ΔPhase trend associated with their respective deformation depth and size. Their reproducible pattern indicates that the changes can be attributed to the mechanical loads acting on the cell. In addition to the results presented for ΔZ and ΔPhase, the other measured impedance parameters, ΔZRe and ΔZIm, are derived quantities from the presented data. Consequently, they are not discussed further in this section, and the relevant data can be found in Appendix A.
3.2.2. Fitted Impedance Parameter Correlation with Deformation Depth and Size
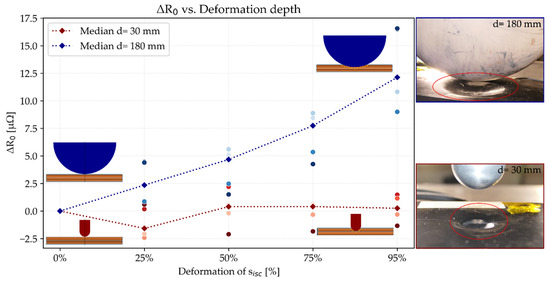
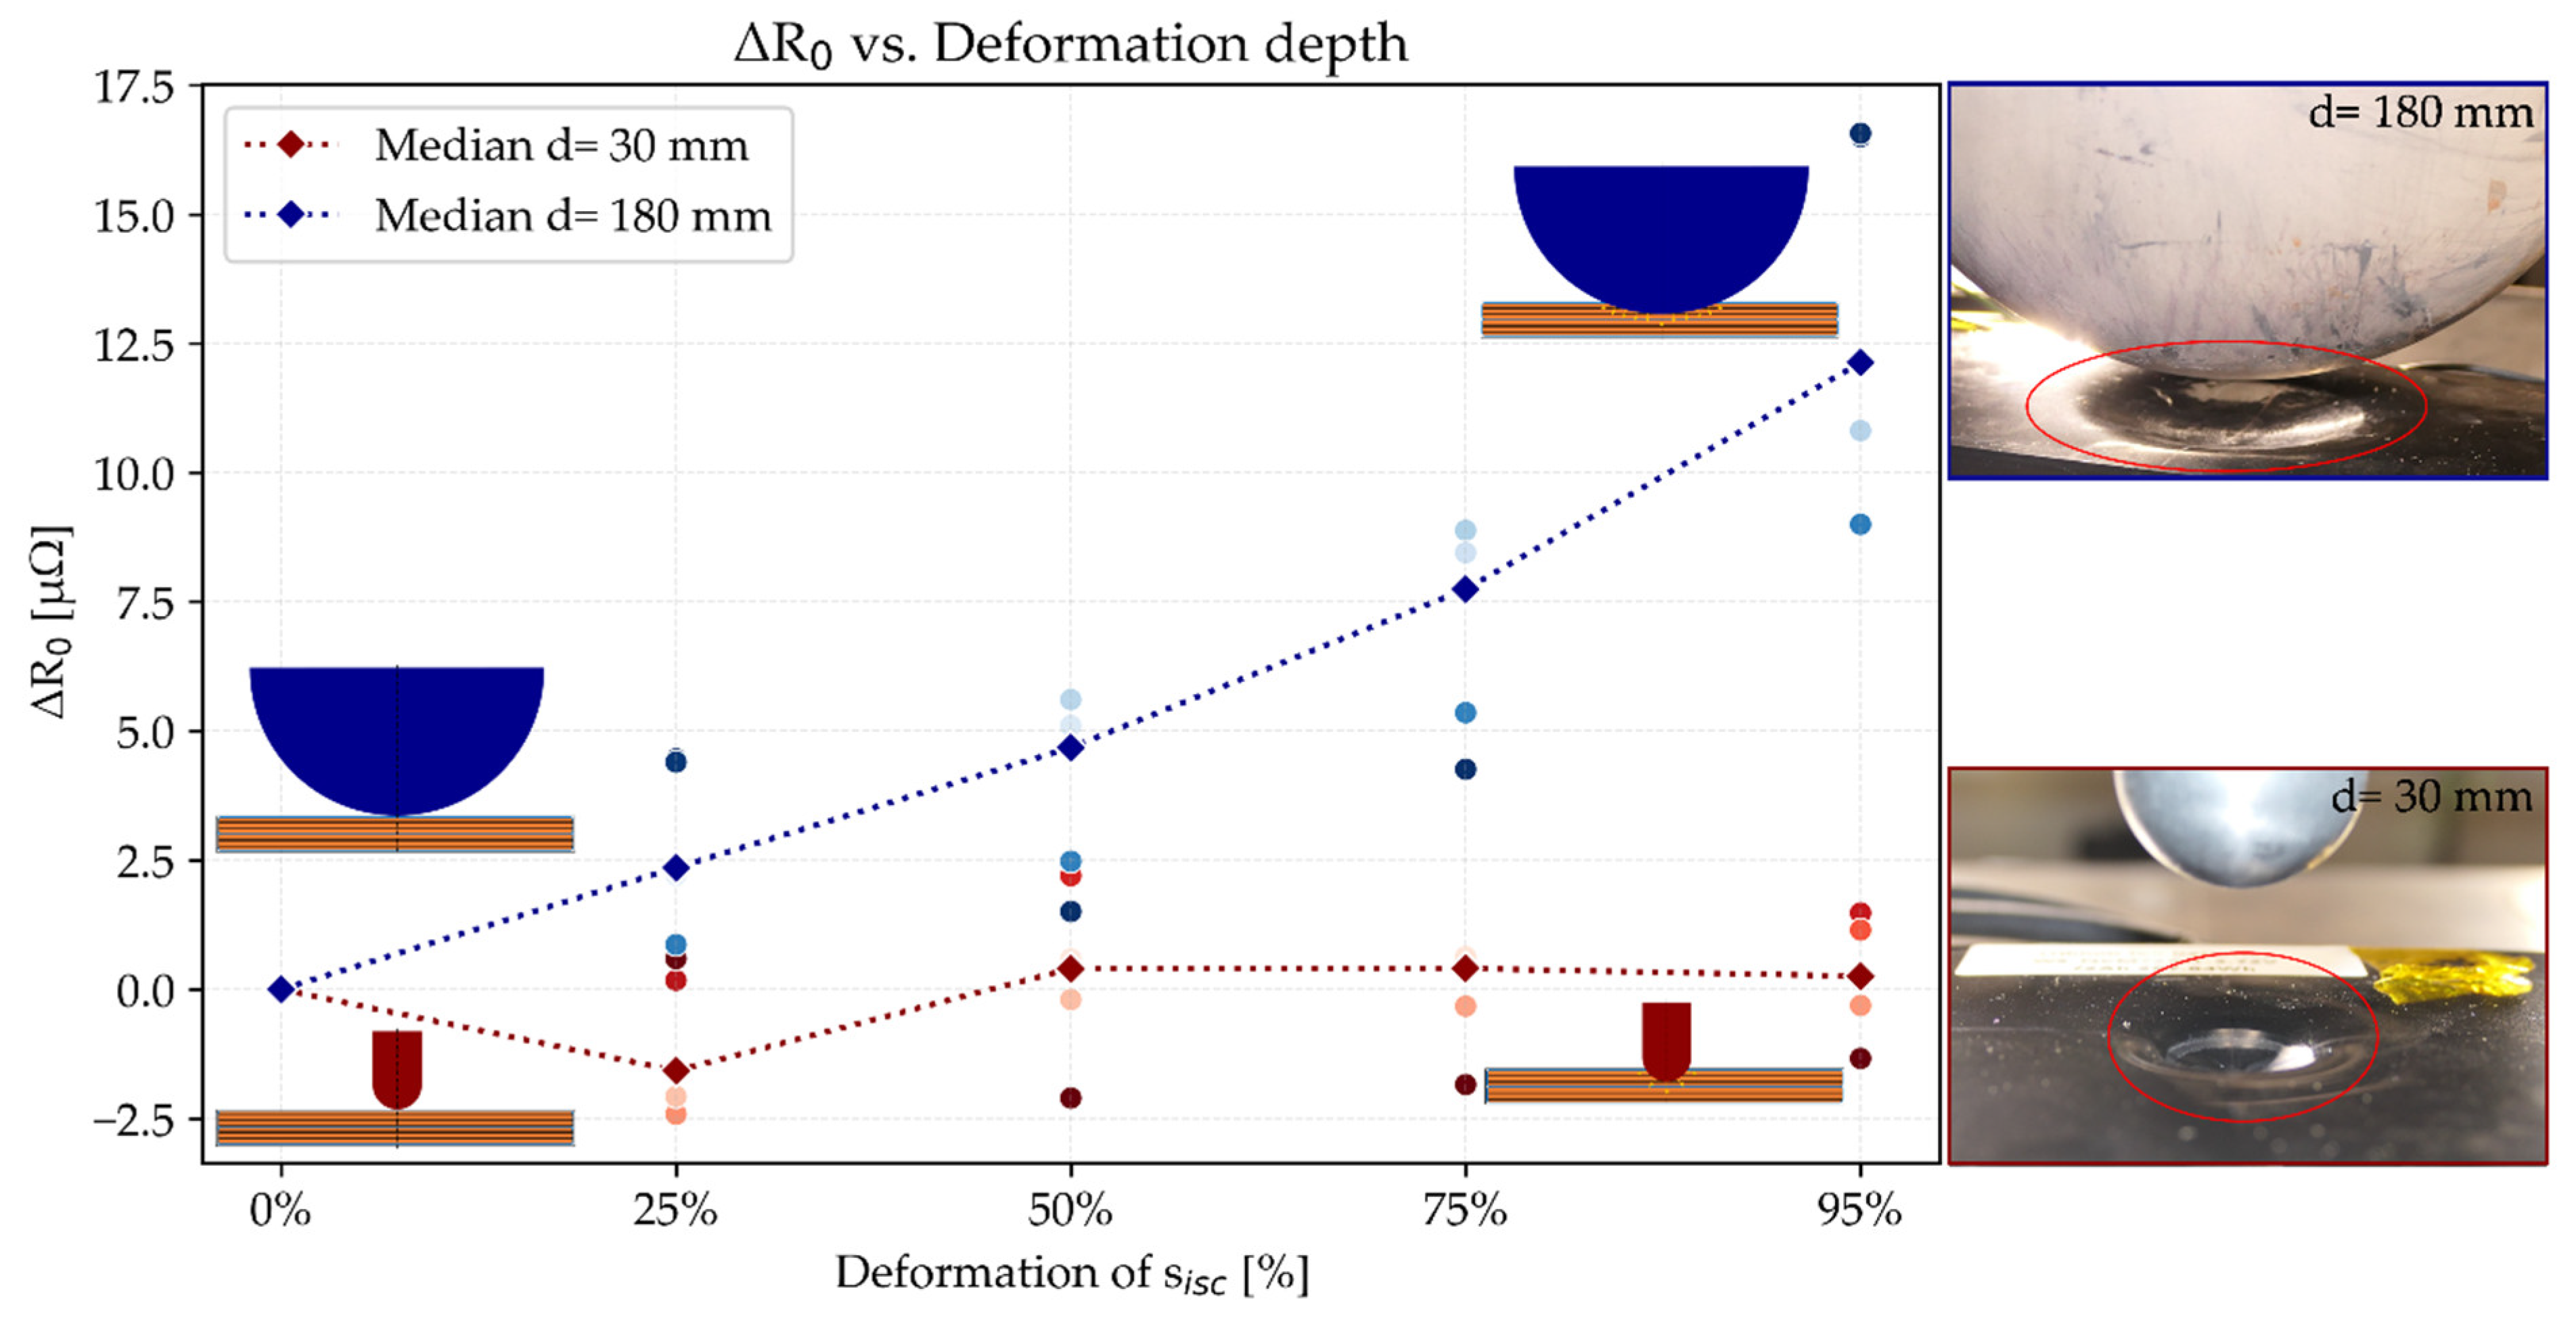
Figure 8 shows the variation in ΔR0 as a function of deformation levels for two impactors. The dotted lines indicate the median ΔR0 value for each impactor size across the five tested cells, while the colored dots represent the individual test results. The corresponding relative changes in ΔR0 are summarized in Table 4. For the smaller impactor, ΔR0 remains largely unaffected across all deformation levels, with relative changes below 0.274%. In contrast, the larger impactor shows a steady increase in ΔR0 with an increasing deformation level. The maximum change is observed at 95% deformation of , with an increase of approximately 12.4 µΩ, which corresponds to a 2.104% rise compared to the undeformed cell. All tested cells follow the same ΔR0 trend associated with their respective deformation depth and size.
Figure 8.
ΔR0 [μΩ] of fitted R0 values for different deformation of [%]. Results are plotted for two hemispherical impactor sizes (blue and red color) and five tested cells (points).
Table 4.
Relative changes in the fitted impedance parameters for each deformation level and size.
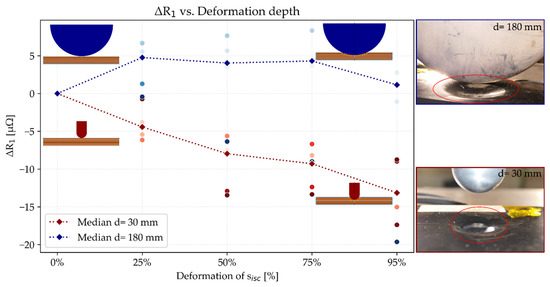
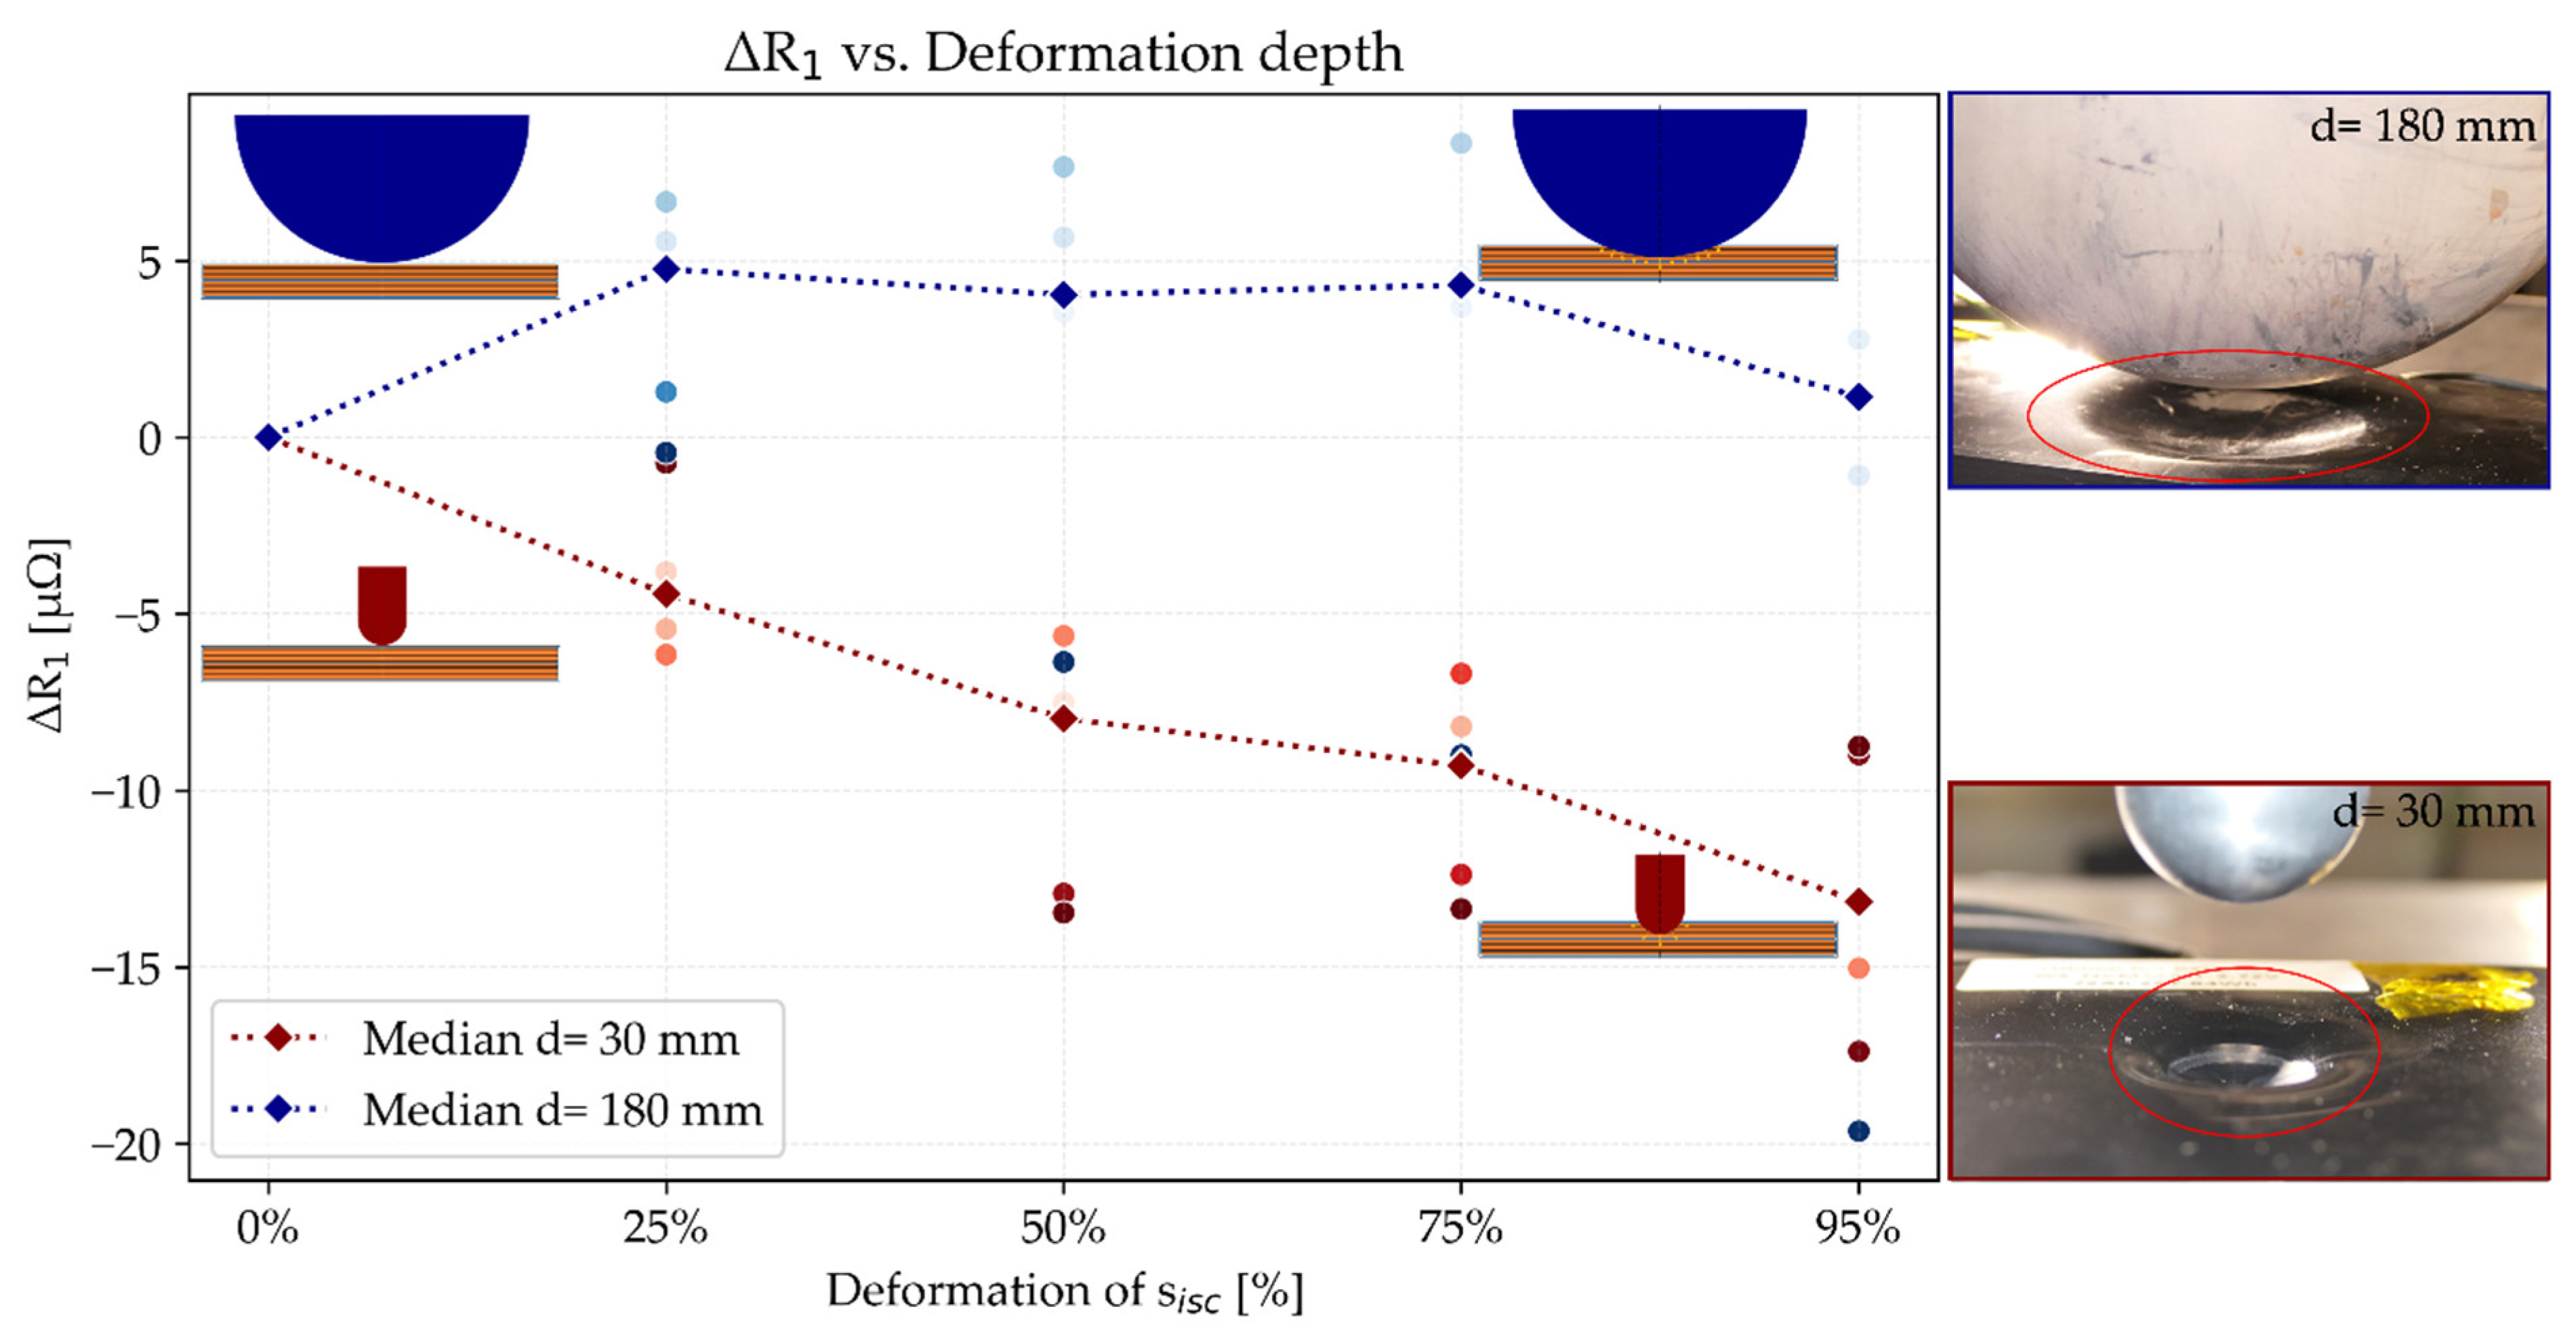
Depending on the impactor size, the variation of ΔR1 across different deformation levels shows distinct trends, as shown in Figure 9. The dotted lines indicate the median ΔR1 value for each impactor size across the five tested cells, while the colored dots represent the individual test results. The corresponding relative changes in ΔR1 for each deformation level and size are summarized in Table 4. For the smaller impactor, ΔR1 decreases in an approximately linear fashion with the increasing deformation level. The largest decrease is observed at 95% deformation of , with a reduction of about 13 µΩ, which corresponds to a relative change of 8.005% compared to the undeformed cell. In contrast, the larger impactor causes an initial 5 µΩ increase in ΔR1 for 25% deformation of , which represents a relative change of 3.402%. Between 25% and 75% deformation of , ΔR1 remains relatively constant. A decrease is again observed for 95% deformation of . Overall, the trends are consistent across all tested cells, with the exception of one outlier.
Figure 9.
ΔR1 [μΩ] of fitted R1 values for different deformation of [%]. Results are plotted for two hemispherical impactor sizes (blue and red color) and five tested cells (points).
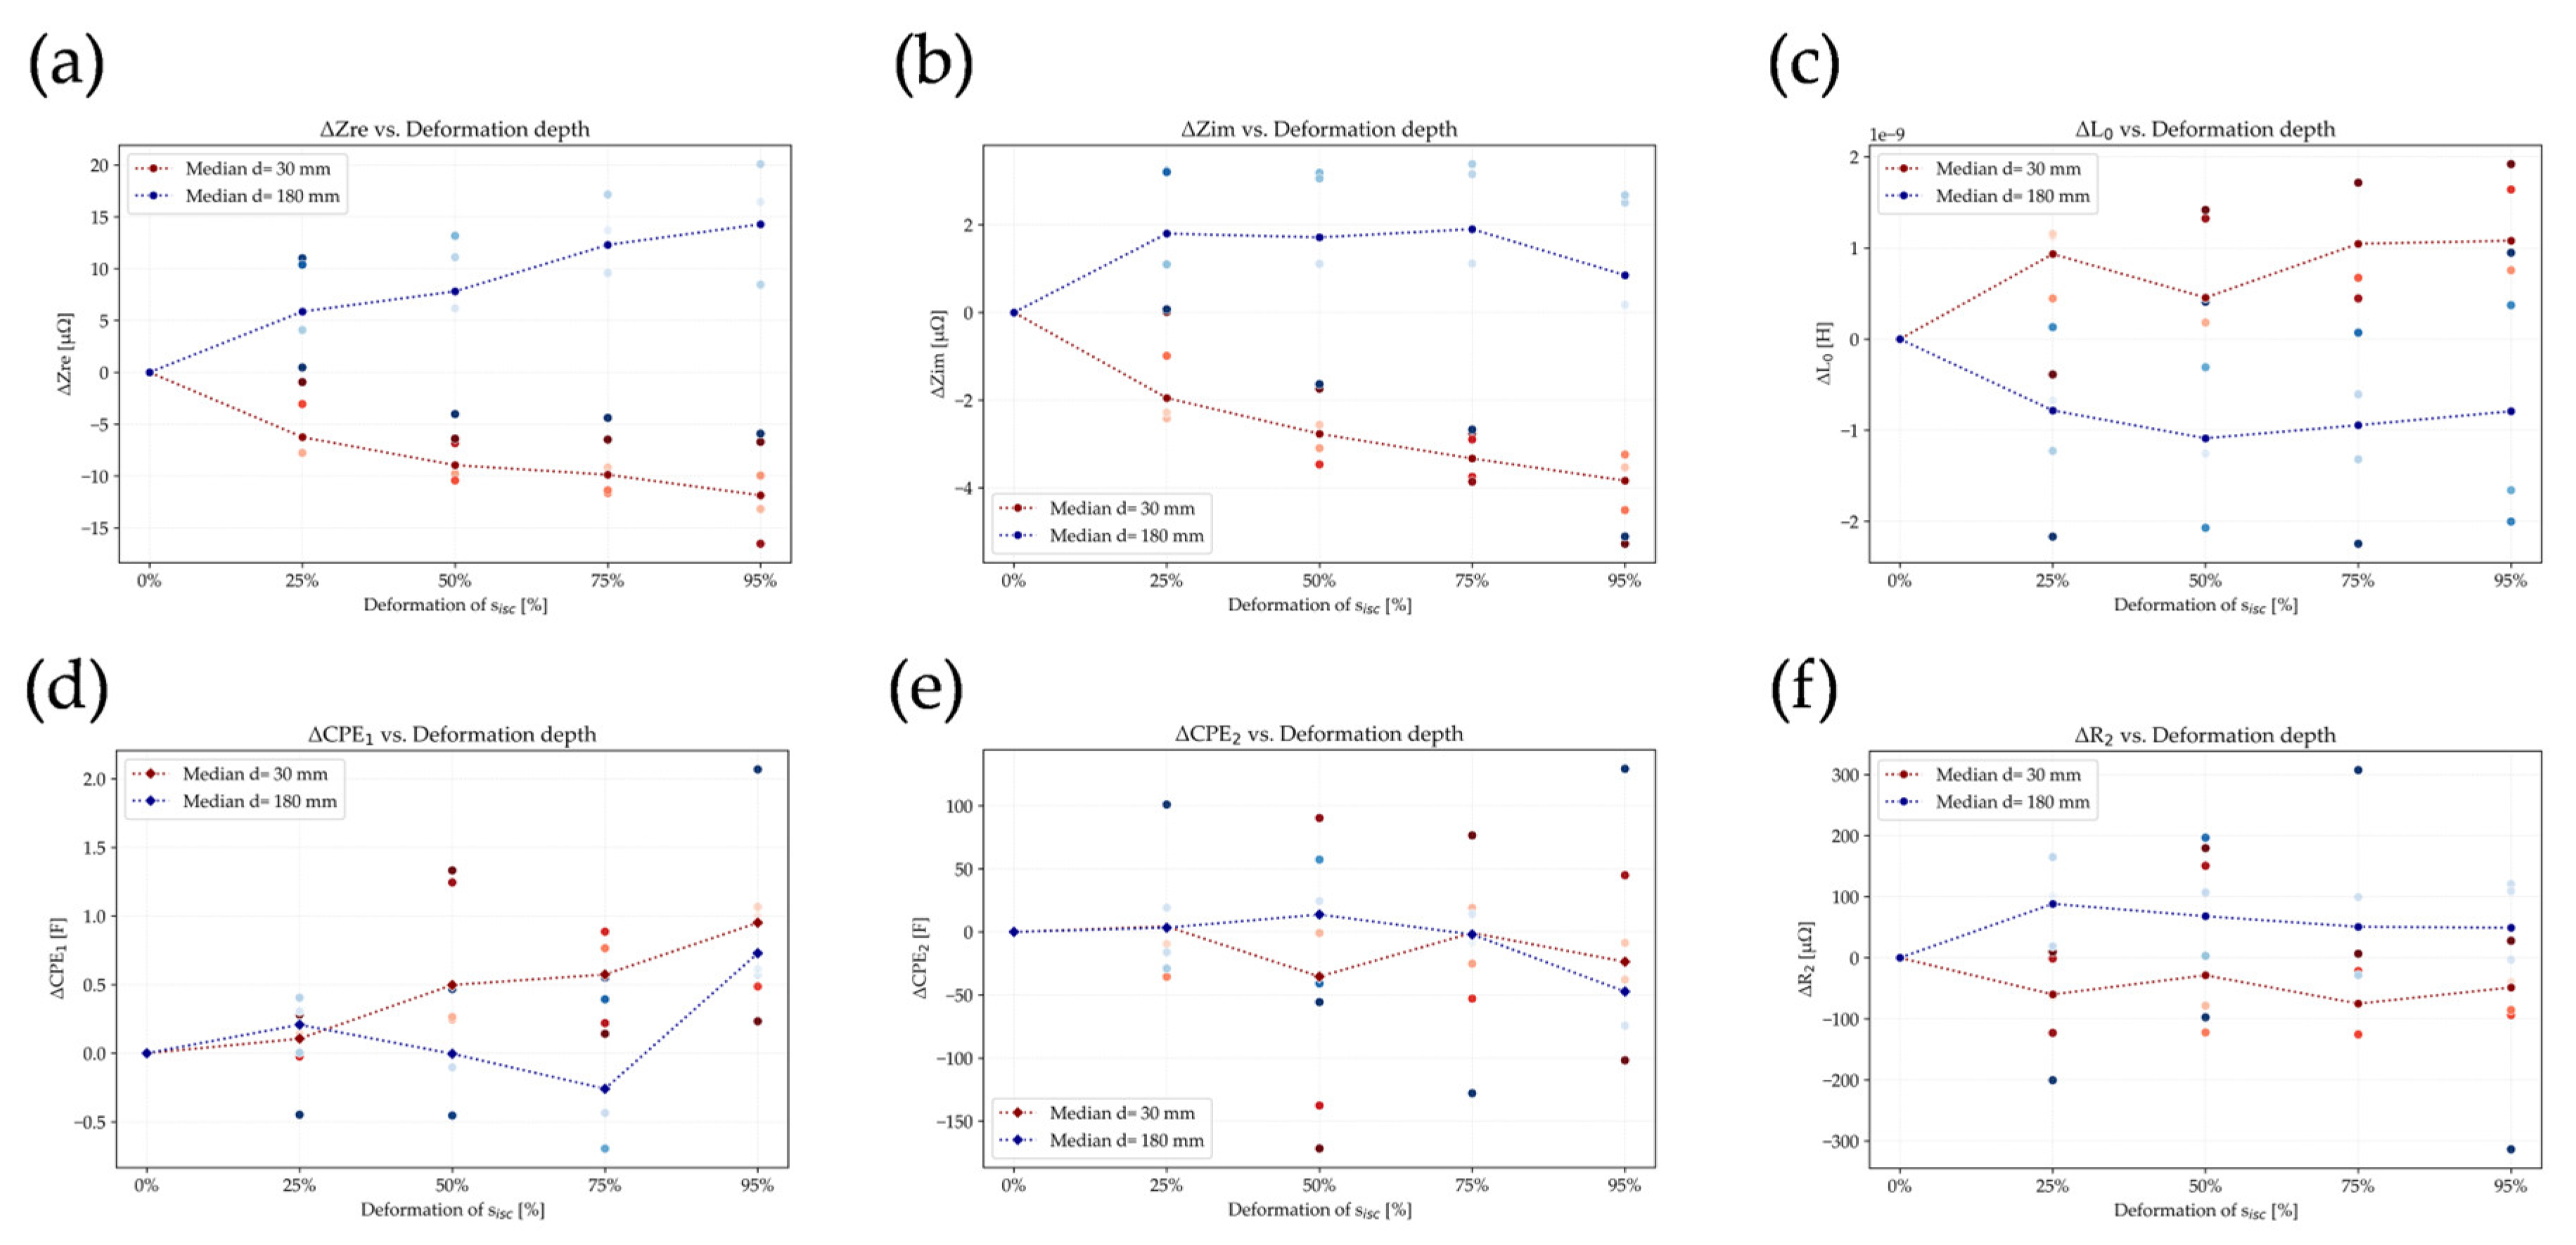
With the exception of a single outlier, which was observed for the larger impactor, all tested cells consistently follow the same ΔR1 and ΔR0 trend associated with their respective deformation depth and size. Their reproducible pattern indicates that the changes can be attributed to the mechanical loads acting on the cell. In addition to the results presented, the other fitted impedance (ΔL0, ΔCPE1, ΔR2, ΔCPE2) parameters show only slight variations in relation to deformation depth and size, and they do not exhibit a consistent trend. Consequently, they are not discussed further in this section, and the relevant data can be found in Appendix A.
4. Discussion
4.1. Effect of Mechanical Deformation Size on Impedance Parameters
The deformation size plays a crucial role in determining the mechanical stress distribution within the cell. The smaller impactor with a diameter of 30 mm creates highly localized stress directly beneath the impact point, which is likely to result in punctures of the separator, cracking of the active materials, and localized delamination [33]. These localized damage mechanisms can disrupt the internal structure of the battery cell, potentially leading to soft short circuits and contributing to the observed decrease in the charge transfer resistance ΔR1 and the impedance ΔZ [25,34,35]. Additionally, localized isolation of active material may increase capacitive contributions, as reflected by the increase in phase angle ΔPhase [36].
In contrast, the larger impactor with a diameter of 180 mm applies a broader, more uniform mechanical load distribution that compresses the cell components globally without directly puncturing the separator [37]. The global deformation can reduce the separator porosity, thereby hindering ionic transport [25,38,39,40,41,42]. Additionally, uniform deformation can cause widespread damage to the solid electrolyte interphase (SEI), which hinders ionic transport and charge transfer kinetics [38,39]. Consequently, an increase in the ohmic resistance ΔR0, the charge transfer resistance ΔR1, and the impedance ΔZ is observed for the large impactor. The more resistive behavior at moderate deformation levels is reflected by the decrease in the phase angle ΔPhase, which increases again at high deformation levels due to emerging internal damage and local isolation [36].
4.2. Effect of Mechanical Deformation Depth on Impedance Parameters
Regardless of the deformation size, increasing deformation depth amplifies the observed electrochemical effects. For the smaller impactor with a diameter of 30 mm, increasing deformation depths further enhances localized damage, resulting in a continuous decrease in its impedance ΔZ and the charge transfer resistance ΔR1. These changes are consistent with progressive degradation of the internal structure and the occurrence of soft short circuits [25,34].
For the larger impactor with a diameter of 180 mm, increasing deformation depth leads to a progressive rise in the ohmic resistance ΔR0 and the total impedance ΔZ. This suggests that compression-related effects, such as reduced separator porosity and hindered ionic transport, become dominant as the overall structure of the cell becomes compromised [25,38,39,40,41,42]. Beyond a certain deformation level, the increase in impedance parameters becomes more pronounced, suggesting a mechanical threshold beyond which permanent structural changes are induced.
4.3. Combined Effect of Mechanical Deformation Depth and Size
When considering both deformation depth and size, complex and non-linear interactions emerge. The smaller impactor with a diameter of 30 mm exhibits strong effects at low deformation levels due to localized mechanical damage, while the larger impactor with a diameter of 180 mm requires higher deformation depths to produce comparable impedance changes. These results imply the existence of a transitional point or critical deformation regime where the impedance behavior shifts from being dominated by localized effects (soft short circuits and cracking) to global effects (compression and ionic transport limitation). Importantly, there is likely a transition point at which the trend in ΔZ changes from decreasing to increasing. Without such a transition, ΔZ would be expected to reach zero at a certain deformation size, which is physically implausible.
4.4. Evaluation of Sensitive Impedance Parameters
Among the impedance parameters investigated, some demonstrate a particular effectiveness in detecting and distinguishing the effects of mechanical loadings on battery cells:
- ΔR1: This impedance parameter is highly sensitive to localized damage and soft short circuits. It is useful for identifying changes in charge transfer pathways caused by mechanical stress.
- ΔR0: It is particularly well-suited for detecting global structural changes, especially reductions in separator porosity and ionic conductivity caused by large-scale compression.
- ΔPhase: Changes in phase angle reflect the shifts in capacitive behavior. This impedance parameter is sensitive to electrical isolation effects, changes in SEI integrity, and internal structural degradation.
- ΔZ: This impedance parameter integrates the cumulative effects of all damage mechanisms and serves as a robust indicator of the overall cell condition, but is less specific in identifying the exact cause.
5. Conclusions
This study presents a systematic investigation into the coupled effects of both deformation depth and size on the electrochemical impedance behavior of large-format prismatic lithium-ion batteries (LIBs). Stepwise out-of-plane deformations are applied using hemispherical impactors with diameters of 30 mm and 180 mm, representing localized and global mechanical loading while maintaining consistent contact conditions. This was conducted for a wide range of deformation levels up to 95% of the internal short-circuit deformation depth, where relative changes in both measured impedance parameters and fitted equivalent circuit model (ECM) parameters were determined.
Key findings show that relative changes in the total impedance ΔZ and the charge transfer resistance ΔR1 decrease up to 1.6% and 8.0%, respectively, for local deformations with the smaller 30 mm diameter impactor. This indicates soft short circuits or localized electrode damage that enhances charge mobility. In contrast, ΔZ increased by 2.0% and the ohmic resistance ΔR0 increased by 2.1% due to global deformations induced by the larger 180 mm diameter impactor. This increase in both impedance parameters is attributed to reduced separator porosity and hindered ionic transport. Additionally, the phase angle ΔPhase showed opposing trends for the two impactors, with local deformations leading to a 44.1% increase, while global deformations led to a 21.6% decrease. This further highlights the distinct capacity responses under different mechanical load conditions.
The consistent and reproducible behavior of these impedance parameters changes across five tested cells (per configuration) highlights the reliability of electrochemical impedance spectroscopy (EIS) in capturing subtle but significant electrochemical changes due to mechanical damage. Notably, the interaction between deformation depth and size was non-linear, revealing a transition regime where impedance changes shifted from a reduction to an increase. This shift likely marks the onset of irreversible structural degradation.
This work presents a novel methodology and dataset to support an understanding of how mechanical loading influences the internal state of LIBs from an impedance perspective. The methodology supports the feasibility of using EIS as a non-destructive diagnostic tool to distinguish between local and global mechanical damage mechanisms in crash-relevant scenarios. These insights are essential for the future integration of EIS-based safety monitoring in battery management systems (BMS). At the same time, however, this raises new challenges for application outside of the laboratory. These challenges include temperature, state of charge (SOC), state of health (SOH), and interference with other electronic devices in electric vehicles (EVs).
Further research should focus on the EIS monitoring of mechanically damaged cells, with the aim of incorporating these findings into predictive safety estimators. Investigating the differences in EIS measurements of batteries deformed by different impactors would be especially valuable in this context, as it could reveal critical information about failure modes and sensor sensitivity under varying mechanical impacts.
Author Contributions
C.D.: writing—original draft, visualization, methodology, investigation, formal analysis, conceptualization; J.Y.: writing—review and editing; M.S.: writing—review and editing; P.H.: funding acquisition, writing—review and editing, conceptualization, supervision; C.E.: writing—review and editing, supervision. All authors have read and agreed to the published version of the manuscript.
Funding
This work originates from the research project NEMO. The NEMO project is funded by the European Union under the Horizon Europe programme (Grant Agreement No. 101102944).
Data Availability Statement
The datasets generated during this study are publicly available on Zenodo [https://doi.org/10.5281/zenodo.18213931].
Acknowledgments
The authors thank the consortium members of the NEMO project for their valuable input to this work.
Conflicts of Interest
The authors declare that they have no known competing financial interests or personal relationships that could have appeared to influence the work reported in this paper.
Abbreviations
| BMS | Battery Management System |
| CC/CV | Constant Current/Constant Voltage |
| ECM | Equivalent Circuit Model |
| EIS | Electrochemical Impedance Spectroscopy |
| ESS | Energy Storage System |
| EV | Electric Vehicle |
| ISC | Internal Short Circuit |
| LIB | Lithium-ion Battery |
| SEI | Solid Electrolyte Interface |
| SOC | State of Charge |
| SOH | State of Health |
| TR | Thermal Runaway |
Appendix A
Figure A1.
Nyquist plots (0.01 Hz to 1000 Hz) obtained from EIS measurements conducted at each deformation level during stepwise deformation tests. Results provided for all cells using different impactors: (a–d) d = 30 mm, (e–h) d = 180 mm.
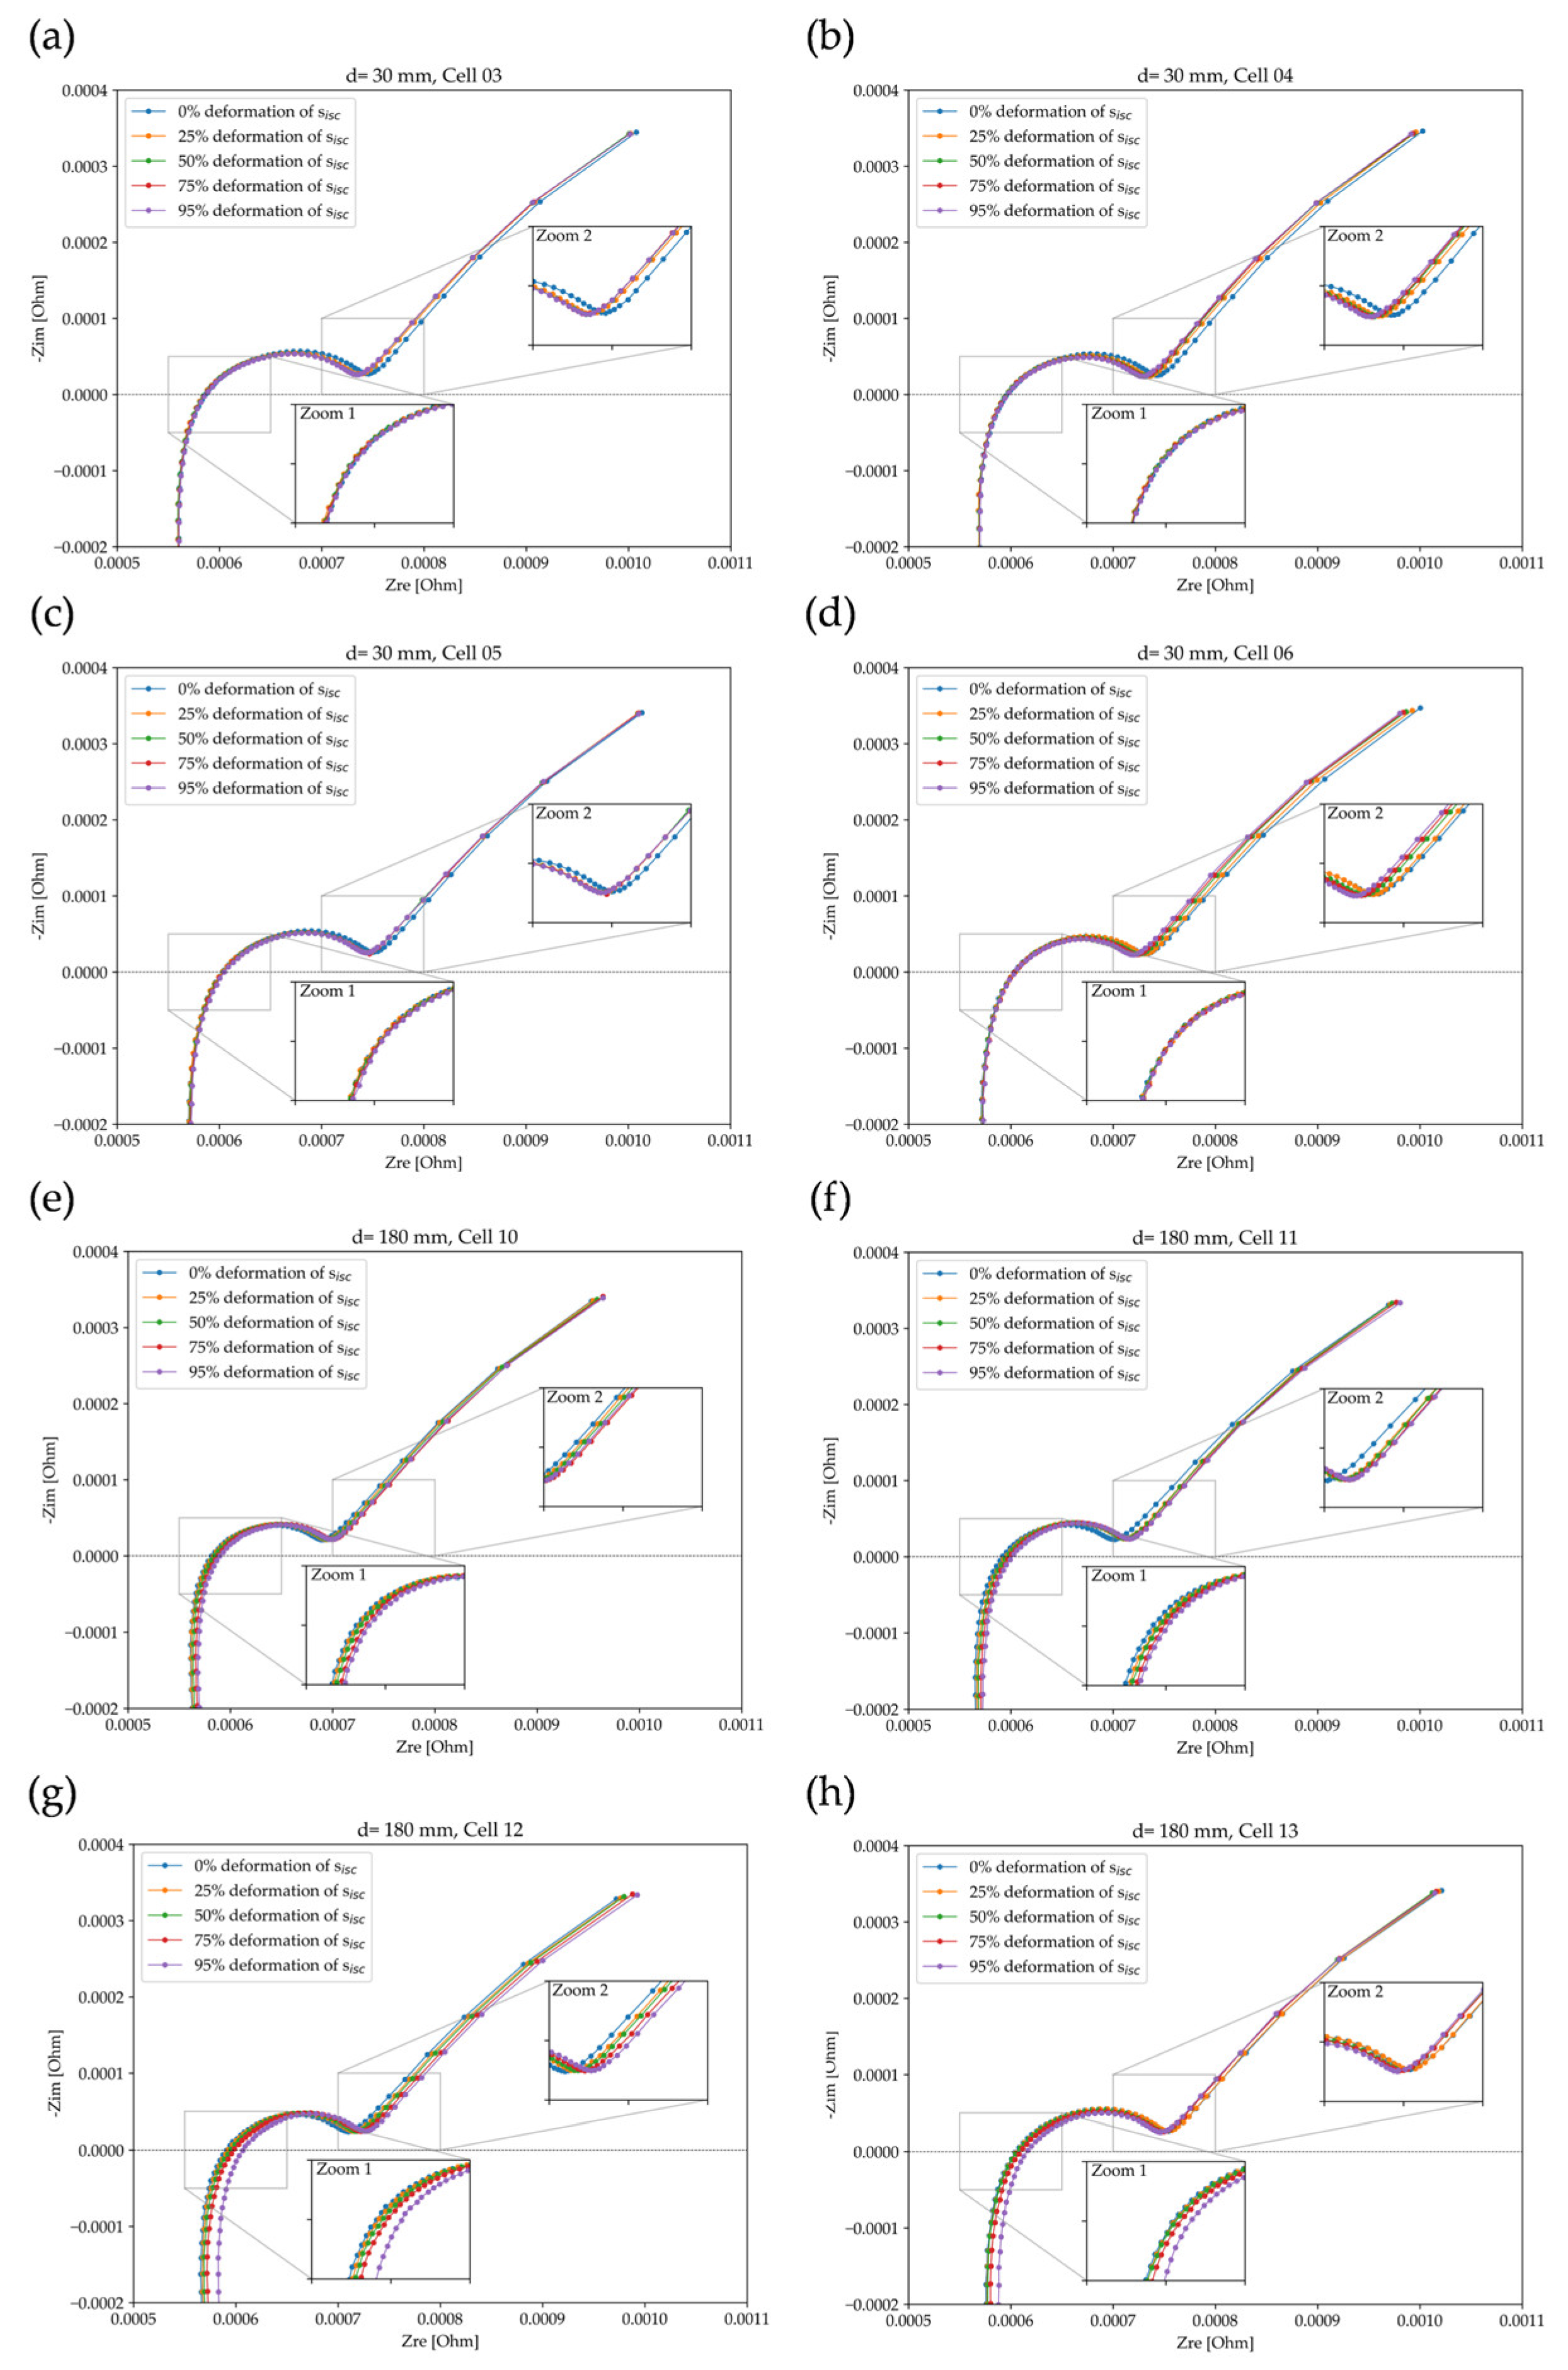
Figure A2.
Variation in the measured and fitted impedance parameters across different deformation levels of for two impactor sizes: (a) ΔZre, (b) ΔZim, (c) ΔL0, (d) ΔCPE1, (e) ΔCPE2, (f) ΔR2. Results are plotted for two hemispherical impactor sizes (blue and red color) and five tested cells (points).
References
- Batteries for Electric Vehicles. Available online: https://afdc.energy.gov/vehicles/electric-batteries (accessed on 1 August 2025).
- Camargos, P.H.; dos Santos, P.H.J.; dos Santos, I.R.; Ribeiro, G.S.; Caetano, R.E. Perspectives on Li-ion battery categories for electric vehicle applications: A review of state of the art. Int. J. Energy Res. 2022, 46, 19258–19268. [Google Scholar] [CrossRef] [Scilit]
- Khan, N.; Ooi, C.A.; Alturki, A.; Amir, M.; Shreasth; Alharbi, T. A critical review of battery cell balancing techniques, optimal design, converter topologies, and performance evaluation for optimizing storage system in electric vehicles. Energy Rep. 2024, 11, 4999–5032. [Google Scholar] [CrossRef] [Scilit]
- Du, X.; Meng, J.; Amirat, Y.; Gao, F.; Benbouzid, M. Exploring impedance spectrum for lithium-ion batteries diagnosis and prognosis: A comprehensive review. J. Energy Chem. 2024, 95, 464–483. [Google Scholar] [CrossRef] [Scilit]
- Feng, X.; Ouyang, M.; Liu, X.; Lu, L.; Xia, Y.; He, X. Thermal runaway mechanism of lithium ion battery for electric vehicles: A review. Energy Storage Mater. 2018, 10, 246–267. [Google Scholar] [CrossRef] [Scilit]
- Wang, H.; Lara-Curzio, E.; Rule, E.T.; Winchester, C.S. Mechanical abuse simulation and thermal runaway risks of large-format Li-ion batteries. J. Power Sources 2017, 342, 913–920. [Google Scholar] [CrossRef] [Scilit]
- Hossain Lipu, M.S.; Hannan, M.A.; Karim, T.F.; Hussain, A.; Saad, M.H.M.; Ayob, A.; Miah, M.S.; Indra Mahlia, T.M. Intelligent algorithms and control strategies for battery management system in electric vehicles: Progress, challenges and future outlook. J. Clean. Prod. 2021, 292, 126044. [Google Scholar] [CrossRef] [Scilit]
- Lu, L.; Han, X.; Li, J.; Hua, J.; Ouyang, M. A review on the key issues for lithium-ion battery management in electric vehicles. J. Power Sources 2013, 226, 272–288. [Google Scholar] [CrossRef] [Scilit]
- Jiang, M.; Li, D.; Li, Z.; Chen, Z.; Yan, Q.; Lin, F.; Yu, C.; Jiang, B.; Wei, X.; Yan, W.; et al. Advances in battery state estimation of battery management system in electric vehicles. J. Power Sources 2024, 612, 234781. [Google Scholar] [CrossRef] [Scilit]
- Iurilli, P.; Brivio, C.; Wood, V. On the use of electrochemical impedance spectroscopy to characterize and model the aging phenomena of lithium-ion batteries: A critical review. J. Power Sources 2021, 505, 229860. [Google Scholar] [CrossRef] [Scilit]
- Waag, W.; Käbitz, S.; Sauer, D.U. Experimental investigation of the lithium-ion battery impedance characteristic at various conditions and aging states and its influence on the application. Appl. Energy 2013, 102, 885–897. [Google Scholar] [CrossRef] [Scilit]
- Shu, X.; Yang, W.; Yang, B.; Wei, K.; Punyawudho, K.; Liu, C. Research on EIS characterization and internal morphological changes of LIBs during degradation process. Eng. Fail. Anal. 2024, 155, 107764. [Google Scholar] [CrossRef] [Scilit]
- Buchicchio, E.; de Angelis, A.; Santoni, F.; Carbone, P.; Bianconi, F.; Smeraldi, F. Battery SOC estimation from EIS data based on machine learning and equivalent circuit model. Energy 2023, 283, 128461. [Google Scholar] [CrossRef] [Scilit]
- Li, C.; Yang, L.; Li, Q.; Zhang, Q.; Zhou, Z.; Meng, Y.; Zhao, X.; Wang, L.; Zhang, S.; Li, Y.; et al. SOH estimation method for lithium-ion batteries based on an improved equivalent circuit model via electrochemical impedance spectroscopy. J. Energy Storage 2024, 86, 111167. [Google Scholar] [CrossRef] [Scilit]
- Dong, M.; Li, X.; Yang, Z.; Chang, Y.; Liu, W.; Luo, Y.; Lei, W.; Ren, M.; Zhang, C. State of health (SOH) assessment for LIBs based on characteristic electrochemical impedance. J. Power Sources 2024, 603, 234386. [Google Scholar] [CrossRef] [Scilit]
- Inui, Y.; Hirayama, S.; Tanaka, T. Temperature dependence of impedance spectrum of charge-transfer processes in lithium-ion batteries with nickel-manganese-cobalt cathode and graphite anode. J. Energy Storage 2021, 44, 103390. [Google Scholar] [CrossRef] [Scilit]
- Ma, J.; Wang, H.; Zheng, C.; Tao, Z.; Fu, Y.; Bai, H.; Xiao, H. Effects of Temperature on the parameters of the Electrochemical Impedance Spectroscopy for Lithium-Ion Batteries. Phys. Conf. Ser. 2023, 2557, 12028. [Google Scholar] [CrossRef] [Scilit]
- Schinagl, M.; Fasching, M.; Höschele, P.; Ellersdorfer, C. Impact of temperature on Li-ion battery impedance and compensation strategies. J. Power Sources 2025, 649, 237478. [Google Scholar] [CrossRef] [Scilit]
- Du, X.; Hu, Y.; Choe, S.-Y.; Garrick, T.R.; Fernandez, M.A. Characterization and analysis of the effect of pressure on the performance of a large format NMC/C lithium-ion battery. J. Power Sources 2023, 573, 233117. [Google Scholar] [CrossRef] [Scilit]
- Drießen, C.; Michelini, E.; Moser, J.; Höschele, P. Sensitivity of electrochemical impedance parameters for detecting changes in lithium-ion batteries due to acceleration shocks and local mechanical deformations. J. Power Sources 2025, 648, 237308. [Google Scholar] [CrossRef] [Scilit]
- Ellersdorfer, C.; Höschele, P.; Heider, E.; Kovachev, G.; Gstrein, G. Safety Assessment of High Dynamic Pre-Loaded Lithium Ion Pouch Cells. Batteries 2023, 9, 71. [Google Scholar] [CrossRef] [Scilit]
- Liu, J.; Ma, Z.; Guo, Z.; Zhao, W.; Wang, S.; Zhao, H.; Ren, L. Experimental investigation on mechanical-electrochemical coupling properties of cylindrical lithium-ion batteries. Energy 2024, 293, 130536. [Google Scholar] [CrossRef] [Scilit]
- Li, W.; Xing, B.; Watkins, T.R.; Xia, Y.; Wang, H.; Zhu, J. Damage of prismatic lithium-ion cells subject to bending: Test, model, and detection. EcoMat 2022, 4, e12257. [Google Scholar] [CrossRef] [Scilit]
- Xiao, F.; Xing, B.; Kong, L.; Xia, Y. Impedance-based diagnosis of internal mechanical damage for large-format lithium-ion batteries. Energy 2021, 230, 120855. [Google Scholar] [CrossRef] [Scilit]
- Spielbauer, M.; Berg, P.; Ringat, M.; Bohlen, O.; Jossen, A. Experimental study of the impedance behavior of 18650 lithium-ion battery cells under deforming mechanical abuse. J. Energy Storage 2019, 26, 101039. [Google Scholar] [CrossRef] [Scilit]
- Zhu, X.; Sun, Z.; Wang, Z.; Wang, H.; Lin, N.; Shan, C. Thermal runaway in commercial lithium-ion cells under overheating condition and the safety assessment method: Effects of SoCs, cathode materials and packaging forms. J. Energy Storage 2023, 68, 107768. [Google Scholar] [CrossRef] [Scilit]
- Kovachev, G.; Ellersdorfer, C.; Gstrein, G.; Hanzu, I.; Wilkening, H.M.R.; Werling, T.; Schauwecker, F.; Sinz, W. Safety assessment of electrically cycled cells at high temperatures under mechanical crush loads. eTransportation 2020, 6, 100087. [Google Scholar] [CrossRef] [Scilit]
- Liu, B.; Jia, Y.; Yuan, C.; Wang, L.; Gao, X.; Yin, S.; Xu, J. Safety issues and mechanisms of lithium-ion battery cell upon mechanical abusive loading: A review. Energy Storage Mater. 2020, 24, 85–112. [Google Scholar] [CrossRef] [Scilit]
- Popov, V.L.; Heß, M.; Willert, E. Handbook of Contact Mechanics; Springer: Berlin/Heidelberg, Germany, 2019. [Google Scholar]
- Zahner-Elektrik GmbH & Co. KG ZENNIUM PRO–The All-Purpose Potentiostat: Precision in Electrochemistry, Kronach, Germany, Datasheet. Available online: https://zahner.de/products-details/potentiostats/zennium-pro (accessed on 1 August 2025).
- Krapp, M. Zahner-Analysis-Python. 2024. Available online: https://github.com/Zahner-elektrik/Zahner-Analysis-Python (accessed on 22 June 2025).
- Mei, B.-A.; Munteshari, O.; Lau, J.; Dunn, B.; Pilon, L. Physical Interpretations of Nyquist Plots for EDLC Electrodes and Devices. J. Phys. Chem. C 2018, 122, 194–206. [Google Scholar] [CrossRef] [Scilit]
- Chung, S.H.; Tancogne-Dejean, T.; Zhu, J.; Luo, H.; Wierzbicki, T. Failure in lithium-ion batteries under transverse indentation loading. J. Power Sources 2018, 389, 148–159. [Google Scholar] [CrossRef] [Scilit]
- Zhang, X.; Sahraei, E.; Wang, K. Li-ion Battery Separators, Mechanical Integrity and Failure Mechanisms Leading to Soft and Hard Internal Shorts. Sci. Rep. 2016, 6, 32578. [Google Scholar] [CrossRef] [Scilit]
- Menkin, S.; Fritzke, J.B.; Larner, R.; de Leeuw, C.; Choi, Y.; Gunnarsdóttir, A.B.; Grey, C.P. Insights into soft short circuit-based degradation of lithium metal batteries. Faraday Discuss. 2024, 248, 277–297. [Google Scholar] [CrossRef] [Scilit] [PubMed]
- Laschuk, N.O.; Easton, E.B.; Zenkina, O.V. Reducing the resistance for the use of electrochemical impedance spectroscopy analysis in materials chemistry. RSC Adv. 2021, 11, 27925–27936. [Google Scholar] [CrossRef] [Scilit]
- Zhang, X.; Sahraei, E.; Wang, K. Deformation and failure characteristics of four types of lithium-ion battery separators. J. Power Sources 2016, 327, 693–701. [Google Scholar] [CrossRef] [Scilit]
- Cannarella, J.; Arnold, C.B. Ion transport restriction in mechanically strained separator membranes. J. Power Sources 2013, 226, 149–155. [Google Scholar] [CrossRef] [Scilit]
- Sauerteig, D.; Hanselmann, N.; Arzberger, A.; Reinshagen, H.; Ivanov, S.; Bund, A. Electrochemical-mechanical coupled modeling and parameterization of swelling and ionic transport in lithium-ion batteries. J. Power Sources 2018, 378, 235–247. [Google Scholar] [CrossRef] [Scilit]
- Li, R.; Li, W.; Singh, A.; Ren, D.; Hou, Z.; Ouyang, M. Effect of external pressure and internal stress on battery performance and lifespan. Energy Storage Mater. 2022, 52, 395–429. [Google Scholar] [CrossRef] [Scilit]
- Thangavel, N.K.; Mundhe, S.; Islam, M.M.; Newaz, G.; Arava, L.M.R. Probing of Internal Short Circuit in Lithium-Ion Pouch Cells by Electrochemical Impedance Spectroscopy under Mechanical Abusive Conditions. J. Electrochem. Soc. 2020, 167, 160553. [Google Scholar] [CrossRef] [Scilit]
- Barai, A.; Tangirala, R.; Uddin, K.; Chevalier, J.; Guo, Y.; McGordon, A.; Jennings, P. The effect of external compressive loads on the cycle lifetime of lithium-ion pouch cells. J. Energy Storage 2017, 13, 211–219. [Google Scholar] [CrossRef] [Scilit]

Disclaimer/Publisher’s Note: The statements, opinions and data contained in all publications are solely those of the individual author(s) and contributor(s) and not of MDPI and/or the editor(s). MDPI and/or the editor(s) disclaim responsibility for any injury to people or property resulting from any ideas, methods, instructions or products referred to in the content. |
© 2026 by the authors. Licensee MDPI, Basel, Switzerland. This article is an open access article distributed under the terms and conditions of the Creative Commons Attribution (CC BY) license.