Abstract
The widespread adoption of electric mobility has accelerated decarbonization in transportation applications, increasing the reliance on lithium-ion batteries (Li-IBs) in electric vehicles (EVs) and energy storage systems. To analyze battery risk under different combinations of ambient temperature, discharge C-rate, and state-of-charge (SoC) windows, this study experimentally investigates power fade (PF) and capacity fade (CF) as degradation-based risk indicators. In addition to experimental observations, degradation conditions reported in previous studies are considered to identify reliable and unreliable operating zones. Several variables, including operating temperature, current rate, and SoC, influence the short- and long-term performance of Li-IBs in EV applications and should be evaluated from a safety perspective. Under combined thermal and electrical operating conditions, battery degradation progresses, associated with reductions in usable energy and power, increased internal heat generation, and increased safety risks. Due to the nonlinear behavior of Li-IBs, conventional risk models may not always fully represent battery performance; therefore, qualitative analysis and risk assessment are employed. Aging is monitored using discharge capacity, discharge energy, power rating, internal resistance, and open-circuit voltage within the proposed framework. The experimental results show that operational risk increases under high discharge C-rates combined with low ambient temperature. Discharging at 0.2 C at 25 °C with an SoC of 80% is identified as a critical operating scenario within the investigated conditions, as it results in both CF and PF. In contrast, Li-IB safety is not significantly affected under CF conditions at 4 C and 3 C at 10 °C at the same SoC level, nor under PF conditions at 0.2 C at 10 °C with SoC levels of 80% and 50%. The multi-indicator risk assessment combines individual indicators to compare operating conditions in terms of associated safety risk. Finally, the results confirm that relying on a single performance indicator tends to underestimate degradation, while a combined multi-indicator approach provides a better representation of Li-IB performance over battery lifetime.
1. Introduction
1.1. Background and Motivation
Lithium-ion batteries (Li-IBs) are one of the dominant electrochemical energy storage (ES) technologies in a wide range of engineering applications, including transportation represented by electric vehicles (EVs), stationary ES systems, renewable energy integration, and portable electronic devices, driven by their high volumetric energy density, relatively long cycle life, and good efficiency compared with alternative battery technologies [1,2]. In electric mobility applications, Li-IBs are a critical component, as they directly clarify vehicle driving range, power capability, operational reliability, and safety. At present, Li-IBs still remain highly sensitive to operating conditions despite the continuous progress in cell materials design and manufacturing processes. Experimental studies have shown that parameters such as operating temperature, current rate, and state-of-charge (SoC) strongly affect both short-term performance and long-term behavior.
Batteries are subjected to combined thermal and electrical stresses that accelerate degradation processes under realistic duty cycles, which result in a reduction in usable energy and power capability. As degradation progresses, internal resistance (Rint) and internal heat generation increase, and safety margins are gradually reduced, which limits system reliability and operational lifetime [3,4]. Fortunately, the recent literature emphasizes that battery failure events are rarely instantaneous. Instead, failures are preceded by long periods of progressive degradation that grow throughout the battery’s lifetime.
Menye et al. in [5] demonstrated that aging-driven mechanisms accumulate gradually and increase the probability of functional failure or thermal runaway under opposing operating conditions; this suggests that battery safety assessment should account for degradation-driven risk evolution during normal operation, rather than relying on single-stressor-based scenarios. These findings underscore the importance of degradation-aware assessment frameworks, which are particularly relevant for electric mobility applications, where batteries are expected to operate reliably over long lifetimes under variable thermal and electrical loading conditions.
1.2. Related Works on Degradation Mechanisms and Indicators
Li-IBs have been extensively investigated for degradation, as the effects of degradation impact the performance as well as the reliability of the batteries. One of the studies on the degradation of Li-IBs was conducted by Vetter et al. [3], which identified that the degradation of batteries is either calendar-type or cycling-type degradation. Moreover, the study identified that capacity fade (CF) as well as the rise in the Rint of batteries is mainly due to the loss of lithium as well as the degradation of the active materials of the electrodes, and that degradation occurs in the initial stage of the battery operation, and progresses, and at high temperatures, the decay is accelerated. In automotive applications, Barré et al. [6] emphasized that in real driving cycles, batteries are subjected to widely fluctuating temperatures, current, and state-of-charge (SoC) conditions, where more than one degradation process can be triggered at the same time. They highlighted that degradation characteristics reported in simplified testing cycles may not necessarily be a true reflection of practical degradation, where estimating state-of-health (SoH) needs more than just performance characteristics. The results from the post-mortem tests further highlighted the correlation between the indicators of macroscopic degradation and internal damage. In Waldmann et al. [7], aging tests and analysis showed that cells showing a comparable level of CF may provide a different level of internal damage, including differences in electrode material damage, loss of lithium inventory, and solid electrolyte interphase. This finding could be a concern from safety considerations, since it suggests that CF alone may not be a reliable unique indicator for the level of degradation.
Thermal effects are also important in the investigation of degradation, in which the operational and storage temperature environment could control the performance degradation, lifetime evolution, and safety behavior of Li-IBs. Bandhauer et al. indicated that high and non-uniform temperatures increase the rate of parasitic reactions and degradation and reduce the thermal safety margins [8], in which this work explored temperature as an important factor in determining degradation rates within the cells. Relating to safety considerations, it is important to note that Feng et al. in [9] showed the level at which the threshold of thermal runaway degradation could be decreased by degradation associated with material and structural changes in the cell structure. The low-temperature environment also brings other degradation hazards. It has been observed in experimental studies that the usage of batteries at a low temperature and with a high current rate facilitates the growth of lithium plating on the anode surface; hence, the loss of cyclic lithium and the problem of internal short circuits may happen, but not in an immediate manner [6,8,10]. Table 1 illustrates a representation of temperature-driven degradation pathways in Li-IBs reported in the literature, together with their indicators and associated risks, as summarized in [11].

Table 1.
Temperature-driven degradation mechanisms in Li-IBs [11].
The effects of high electric stress due to high charging and discharging currents add to the degradation process. Keil and Jossen [12] demonstrated that an aggressive cycling protocol, particularly with a high SoC and higher temperatures, can lead to significant capacity reduction and increased ohmic resistance. Schmalstieg et al. extended this concept into a set of empirical aging formulas that explain capacity decay and increases in ohmic resistance as a function of current throughput, temperature, and applied current [13], which provides a quantitative framework for assessing degradation under real operating conditions where capacity loss and resistance increase are observed as functions of time and charge throughput throughout the tests. Additionally, electrothermal joint effects are evident at high C rates. According to Yang et al., high current conditions have been shown to be associated with temperature distributions and hot spots inside Li-IBs, which can trigger non-homogeneous degradation mechanisms [10]. The findings above clearly indicate that temperature, current rate, and SoC should be evaluated simultaneously to analyze their effects on degradation mechanisms.
Recent state-of-the-art reviews have integrated these results into a common framework on degradation and failure. The study by Menye et al. [5] examined the mechanisms of degradation and failure of Li-IBs, making it clear that mechanisms such as loss of active lithium, electrode decomposition, decomposition of the electrolyte, Rint increase, and electrochemical imbalance due to aging operate as precursors to failure and thermal runaways [1]. This study further supports the theory that the risk of battery failure progresses gradually due to the accumulation of damage, rather than occurring suddenly due to misuse.
Performance-based metrics, particularly discharge capacity and power capability, are widely used to quantify degradation in Li-IBs, in which CF and PF are usually measured with the help of these performance metrics. CF is an indicator of the loss of useful capacity, while PF is an indicator of the loss of current supply capability due to the degradation of the battery. Such metrics are widely used owing to their relevance and ease of measurement [1,11]. In this regard, for EV applications, Ali et al. in [11] have established that CF and PF are the most essential reliability markers used at the pack and fleet levels because they have direct effects on driving ranges, dynamics, and availability. They also indicated that these reliability markers are highly dependent on operating stress variables such as temperature, current rate, and depth of discharge (DoD).
Other studies have demonstrated that capacity and power indicators alone do not fully represent battery condition, particularly during early stages of aging.
It was noted that the increase in the Rint affects the early aging behavior and is important for the determination of power capabilities and internal heating [14]. The studies of Berecibar et al. and Hu et al. also reinforced the viewpoint that various indicators provide distinct information about the degradation of the battery, so using a single indicator may misinterpret the status of the battery, especially when taking into account early, mid, or late degradation periods [15,16]. This is why many researchers have proposed hybrid indicators that comprise capacity indicators, resistance indicators, and electrochemical indicators.
Open-circuit voltage (OCV) characteristics can provide much more information on electrochemical stability as well as the state of the electrodes. Farmann et al. [17] presented the impact of calendar and cycle aging under operating conditions and found that realistic lifetime prediction requires knowledge of their mutual effect. Degradations of OCV-based characteristics could thus indicate qualitative electrochemical imbalances or late stages of degradation when analyzed with other indicators [18].
Many research works have addressed the safety and degradation behavior of Li-IBs in order to clarify the origins of battery-related risks [4,19]. Among the proposed approaches, fault tree analysis (FTA) has been employed to systematically illustrate the relationships between degradation phenomena, mechanisms, modes, and their resulting impact on battery performance and output characteristics [4]. It is now well known that battery aging arises from the combined action of thermal, electrical, mechanical, and chemical processes within the cell. On this basis, failure mode, mechanisms, and effects analysis (FMMEA) has been introduced as a structured framework to classify degradation pathways and failure conditions in Li-IBs [20]. Previous studies have also identified several dominant stress factors that accelerate battery deterioration, including high charge and discharge currents, elevated and low operating temperatures, overcharge, and over-discharge conditions [21,22]. To support risk identification, several studies have examined degradation-related indicators, including CF and degradation phenomena commonly associated with SEI evolution, as proxies for battery health and safety risk [23]. Advanced diagnostic techniques, such as electrochemical impedance spectroscopy and time-domain risk analysis, have also been employed to capture degradation-induced changes in battery behavior. Within this broader context, FMMEA has been further evaluated as an effective battery risk assessment tool, and comprehensive investigations have addressed multiple failure modes and their implications for battery safety and health [22,24,25].
Building upon these degradation-oriented studies, increasing attention has been directed toward risk and reliability (R&R) assessment frameworks that explicitly account for aging evolution with the need for dynamic risk assessment approaches for lithium-ion batteries, since both aging mechanisms and operating conditions change continuously over time, or case-dependent, and that at the system level, incorporating degradation models into optimization frameworks leads to more conservative operating strategies, enhanced reliability [26], and improved lifetime cost performance [27,28,29]. However, one should differentiate between the reliability assessment framework for Li-IBs at the cell and pack levels, as presented in Figure 1 [25].
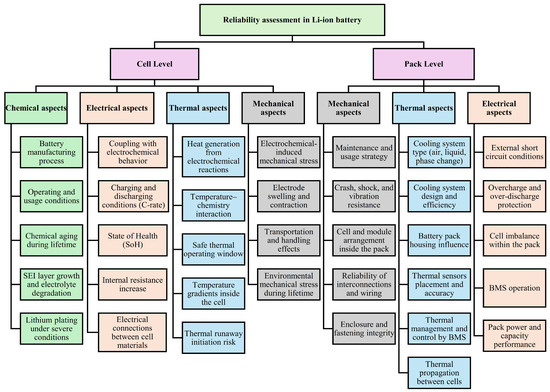
Figure 1.
Reliability assessment framework for Li-IBs at the cell and pack levels.
From the collective findings of these studies, it becomes evident that an accurate assessment of Li-IBs risk requires: (i) appropriate selection of risk indicators and their relationship to underlying degradation mechanisms; (ii) application of multiple degradation conditions, such as varying temperatures and C-rates, to reflect realistic operating scenarios; and (iii) explicit consideration of battery risk as a time-dependent process. Table 2 summarizes the common degradation-based risk indicators, with their physical interpretation, sensitivity to aging stages, and relevance to battery safety and reliability. While most existing studies still emphasize CF as the primary indicator of degradation, PF represents an equally important dimension that must be evaluated throughout the battery lifetime. Consequently, the limited coverage of combined degradation conditions and multi-indicator perspectives in previous research restricts the completeness of current Li-IB risk assessments, particularly for highly nonlinear operating conditions.
Table 2.
Common risk indicators used for Li-IBs degradation and reliability assessment.
1.3. Objectives, Contributions, and Paper Organization
This study contributes to the understanding of the degradation-driven risk and reliability behavior of Li-IBs with an indicators-based assessment that was applied to lithium nickel-manganese-cobalt (NMC) cells via the evaluation of battery risk over lifetime under both thermal and electrical operating conditions.
The major contributions in this work can be summarized as follows:
- Experimental investigation of different ambient temperatures, discharge C-rates, and levels of SoC is provided to represent different operating conditions during normal operation.
- Using several degradation indicators for battery risk and reliability behavior assessment: CF, PF, Rint change that covers early, mid, and late degradation stages. These indicators, obtained from the hybrid pulse power characterization (HPPC) tests and OCV variation, are jointly analyzed to characterize the degradation progression over time.
- The proposed analysis combines different indicators to provide a more representative description of battery condition compared to approaches based on a single performance indicator.
- The study combines degradation indicators with a qualitative risk analysis framework that enables comparison among different degradation conditions for highlighting influences due to temperature and discharge current on degradation severity and risks, thus allowing the identification of operating conditions associated with higher risk levels.
- We indicated experimentally that low-temperature operation with high discharge C-rate operational modes can lead to increased degradation under elevated risks in battery lifetime.
- As per the literature, the obtained results confirm that CF alone is not an adequate marker of the degradation state of Li-IBs, at least in the early and intermediate aging stages. PF and Rint evolution provide greater visibility into additional degradation behavior, which is closely related to degradation. This confirms that the proposed multi-indicator qualitative assessment provides a broader basis for evaluating Li-IBs’ risk and reliability under different degradation conditions, including realistic thermal and electrical stresses.
This paper is structured as follows: Section 2 discusses the proposed risk analysis framework in terms of its requirements, test protocols, and workflow. Section 3 presents the evaluation of the findings through three distinct assessment strategies: (i) risk analysis of CF in the degradation conditions, (ii) risk analysis of PF under the degradation conditions, and (iii) OCV under the degradation conditions. Finally, Section 4 discusses the conclusion and future work.
2. Materials and Methods
2.1. Requirements
This work proposes a qualitative risk analysis framework for evaluating risk in NMC Li-IBs. The assessment is conducted over the battery’s lifetime under different degradation conditions and is based on a set of pre-defined risk indicators. Commercial cylindrical lithium-ion cells (INR18650 HG2, 3000 mAh, nominal voltage 3.6 V, NMC chemistry) manufactured by LG Chem (Seoul, Republic of Korea) were used in this study. The overall workflow of the risk analysis methodology for NMC Li-IBs is depicted in Figure 2 [30]. In this study, the standard charge/discharge test protocol (TPC) refers to constant-current charging to an upper cut-off voltage of 4.2 V followed by constant-current discharge to a lower cut-off voltage of 2.4 V, with a 30 min rest period between charge and discharge steps; each step is terminated upon reaching the specified voltage limit. Three main degradation conditions are considered within the proposed risk analysis:
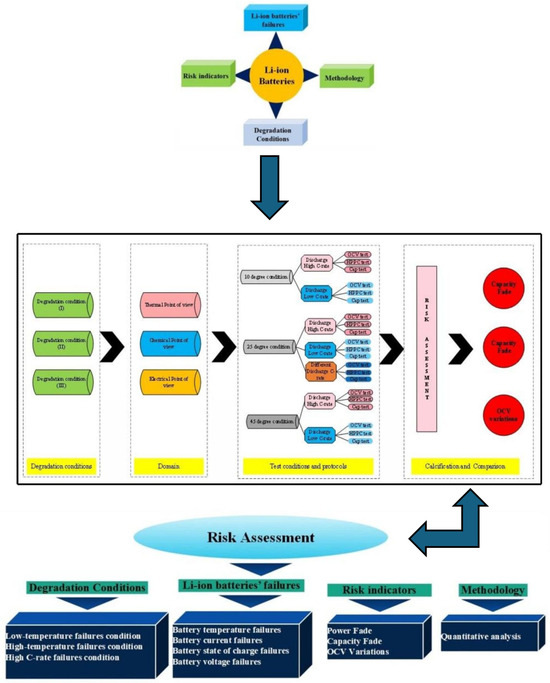
Figure 2.
The flow of the risk assessment methodology proposed in this study is adapted from the framework presented in [30].
- The first condition involves battery operation at different ambient temperatures, 25 °C, 45 °C, and 10 °C, under standard charge/discharge test protocols (TPCs);
- The second condition is conducted at a standard ambient temperature while applying different discharge current TPCs under standard charging conditions;
- The third condition considers operation at a standard temperature under combined standard charging and varying discharge current protocols to evaluate battery performance under these conditions.
In the data analysis stage, the battery behavior derived from CF, PF, and OCV variation is analyzed. These indicators are used to identify operating conditions that contribute to increased risk over the NMC Li-IB lifetime. Based on the results, the regions associated with maximum risk during battery operation are determined.
The risk analysis procedure adopted in this study includes the following main aspects:
- Before testing, the battery is subjected to several charge and discharge cycles to establish the initial SoC and stabilize electrochemical behavior by initiating lithium-ion and electron transport.
- The available discharge capacity is measured after every three cycles of the capacity test, resulting in 50 measurement points over the course of the test.
- OCV measurements are used to investigate the voltage behavior of the battery and to examine the relationship between OCV and the SoC. All voltage and OCV measurements were performed using the same battery cycler and data-acquisition system throughout the experimental campaign. Periodic calibration checks were conducted in accordance with the manufacturer’s specifications to ensure measurement consistency and to minimize potential measurement drift over the extended testing duration (>150 days). Accordingly, the reported voltage- and OCV-based indicators reflect the electrochemical evolution of the cells rather than instrumentation-related effects.
- The HPPC test is employed to evaluate Rint and resistance evolution by applying a predefined sequence of discharge and charge current pulses. The HPPC pulse sequence parameters and test conditions follow the ISO 12405-12 standard [31]. All resistance measurements were performed using the same pulse-based procedure at identical diagnostic points to ensure consistency across operating conditions. The reported resistance values therefore correspond to time–domain HPPC-derived indicators rather than frequency–domain impedance measurements.
2.2. Test Protocol Flow
For the NMC 3 Ah LG (18650HG2) cylindrical cell, three standard risk-oriented TPCs are implemented based on predefined degradation conditions. The detailed workflow of the proposed methodology is illustrated in Figure 3, which examines how potential failures develop, identifies their underlying causes, classifies the associated failure modes, and evaluates how these failures influence PF and CF, widely recognized indicators for assessing NMC Li-IBs risk.
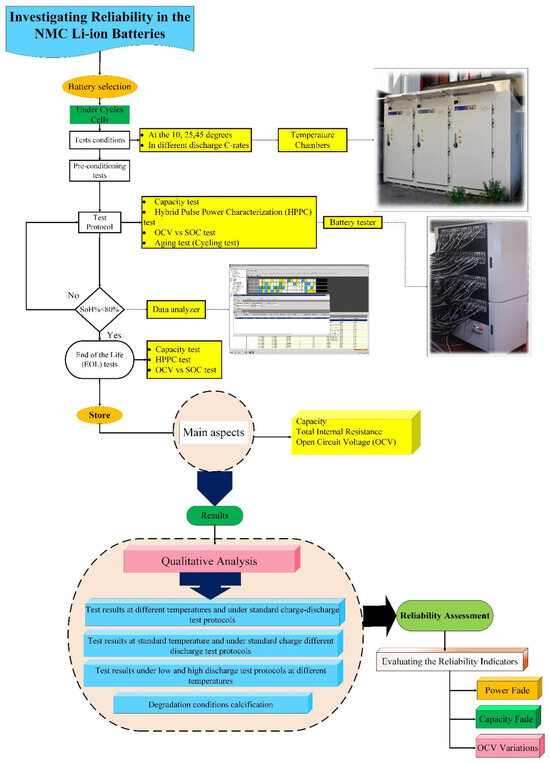
Figure 3.
Workflow of the proposed method for assessing NMC Li-IB risk, adapted from [30].
As shown in Figure 3, the qualitative analysis follows a physics-of-failure (PoF) perspective, prioritizing the failure mechanisms that contribute most significantly to battery degradation behavior [30]. This approach supports the identification of high-risk failure mechanisms and provides a basis for developing precautionary actions. When ranking failure mechanisms, it is necessary to consider individual mechanisms and also their interactions, because Li-IBs are subjected to multiple operational and environmental stresses throughout their lifetime. Under such conditions, several failure mechanisms may coexist; however, as discussed in the literature, studies have shown that a limited number of dominant mechanisms are responsible for the majority of lithium-ion cell failures [30,32].
In this work, an analysis is conducted to assess the risk of NMC Li-IBs using the proposed degradation indicators, to identify operating conditions that lead to increased or reduced risk as the battery ages.
The workflow of the risk analysis adopted in this study is further detailed in Figure 3. Three degradation scenarios are considered within the qualitative assessment. Then, to evaluate battery performance across these scenarios, three ambient temperatures are selected and incorporated into the investigation. High-priority failure mechanisms identified through the qualitative analysis reflect the combined influence of operational stress, environmental conditions, and electrical loading on battery behavior.
In this study, a reference condition corresponding to 25 °C and a standard C-rate is used as a baseline for comparison purposes with other degradation scenarios. The main objective of the qualitative assessment is to compare NMC Li-IBs’ performance under different degradation conditions using risk indicators expressed in percentages. For each checkup point, the maximum contribution of each indicator is evaluated to determine the corresponding risk level. In this study, checkup points correspond to periodic diagnostic evaluations conducted at fixed cycling intervals throughout battery life. In addition, the variation in each risk indicator across all degradation conditions is examined over the battery lifetime.
PF and CF are analyzed at state-of-charge levels of 80%, 50%, and 20% to capture their evolution under different operating states. The test matrix includes different discharge C-rates at 25 °C, as well as low and high discharge C-rates at 10 °C and 45 °C. Standard charge and discharge TPCs are applied at 10 °C, 25 °C, and 45 °C to ensure degradation scenarios are consistently compared. In the workflow, a total of 18 cells is considered, with two cells allocated to each degradation condition. The test matrix records the cell identification number, assigned degradation condition, BoL information, and the corresponding cycling protocol. For each cycling condition, parameters such as depth of discharge, ambient temperature, discharge C-rate, charge C-rate, and storage conditions after end-of-life (EoL) are documented. The EoL condition is defined based on capacity degradation under the specified operating conditions. In addition, BoL measurements include pre-conditioning data, OCV, HPPC results, and initial capacity values. The batteries are cycled and evaluated from a time-domain perspective, and a series of periodic checkups is conducted to track the evolution of battery condition under the specified degradation conditions. Figure 4 shows the battery test setup procedure in terms of the equipment in this study and the adopted risk analysis procedure.
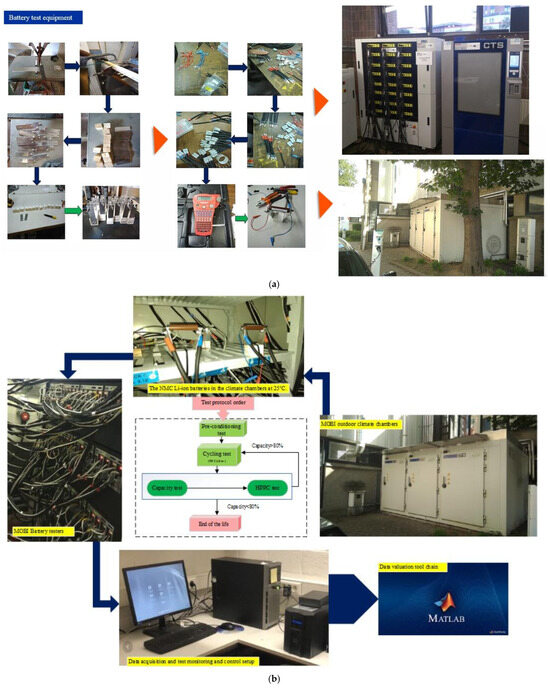
Figure 4.
Battery test setup procedure: (a) equipment, and (b) the risk analysis procedure, adapted from [30].
Periodic checkups are conducted every 100 charge/discharge cycles throughout the battery’s lifetime. At each checkup point, capacity tests, OCV measurements, and HPPC-based diagnostics are performed using identical procedures to ensure consistent tracking of degradation evolution. The EoL condition is defined based on capacity degradation without extrapolation beyond the experimentally achieved cycles. Accordingly, the analysis focuses on comparative degradation trends and risk evolution across operating conditions rather than absolute lifetime prediction.
2.3. HPPC-Based Resistance and Power Indicator Extraction
The internal resistance and pulse-based power indicators used in this study are extracted from the HPPC tests conducted at predefined diagnostic points during the cycling campaign. The HPPC pulse sequence and test conditions follow the ISO 12405-12 standard [31], and all measurements are performed using the same pulse-based procedure to ensure consistency across operating conditions [25].
The internal resistance is evaluated based on the instantaneous voltage response of the cell to an applied current pulse. Mathematically, is calculated as in (1):
where is the terminal voltage measured during the current pulse, is the open-circuit voltage immediately prior to pulse application, and is the applied pulse current. This approach yields time-domain, pulse-based resistance values. In addition to internal resistance, pulse-based power indicators are derived to characterize the evolution of power capability. The discharge and regenerative pulse power densities are calculated as:
where and denote the terminal voltage at the end of the discharge and regenerative pulses, respectively, and and represent the applied current magnitudes during the corresponding pulses. The resistance values associated with discharge and regenerative pulses are extracted at each diagnostic point using the same methodology.
All resistance and pulse power indicators reported in this study are; therefore, derived consistently from HPPC-based time–domain measurements and are used as comparative indicators to assess PF and degradation-related risk evolution under different operating conditions.
2.4. Risk Definition and Contribution Evaluation
Risk analysis points correspond to a selected subset of these checkup points and were used for contribution analysis and probability evaluation within the proposed risk-assessment framework. These points were selected to represent distinct stages of aging based on observable changes in degradation trends and in the evolution of risk indicators.
As mentioned earlier, diagnostic checkups were conducted at regular intervals of every 100 charge/discharge cycles. Therefore, the actual cycle number corresponding to each selected risk analysis point can be directly determined from the checkup index. For example, under the 25 °C operating condition, the 15th risk analysis point corresponds to 1500 completed charge–discharge cycles. EoL condition was defined based on capacity degradation under the specified operating conditions. Under the 25 °C reference condition, the measured discharge capacity at EoL was approximately 2900 mAh.
In this study, the risk contribution ratio is calculated using a percentage-based normalization of the selected degradation indicators across all compared operating conditions at the same risk analysis point, consistent with the qualitative and comparative nature of the proposed risk assessment framework. At each selected risk analysis point, the contribution of a given operating condition to a specific degradation indicator (capacity, OCV, or internal resistance) is calculated as a percentage of the total indicator magnitude across all compared conditions, according to (4):
where represents the risk contribution ratio of the operating condition for indicator at risk point , and denotes the corresponding indicator value. At each risk point, the operating condition exhibiting the highest percentage contribution is identified as the dominant contributor. The probability distributions presented in the manuscript are empirical frequency-based distributions, obtained by counting the frequency with which each operating condition represents the maximum contributor across all selected risk analysis points. The normalization reference corresponds to the nominal operating condition specified in the cell datasheet (1 C charge, 1 C discharge, and 25 °C), which is used consistently as a baseline for comparison. Normalization by cumulative equivalent throughput was not applied, as the objective of this study is comparative risk ranking across operating conditions rather than absolute lifetime prediction.
3. Assessment of the Findings
3.1. The First Assessment: Risk Analysis of CF in the Degradation Conditions
Figure 5 illustrates the contribution rate of each tested battery to CF under different degradation conditions. The analysis focuses on battery operation at different ambient temperatures under standard charge/discharge TPCs to describe how CF evolves when moving from one degradation condition to another throughout the NMC Li-IB lifetime. For this analysis, seven checkup points are defined, while six risk points are selected in accordance with the adopted risk-point definition to evaluate the contribution of degradation indicators.
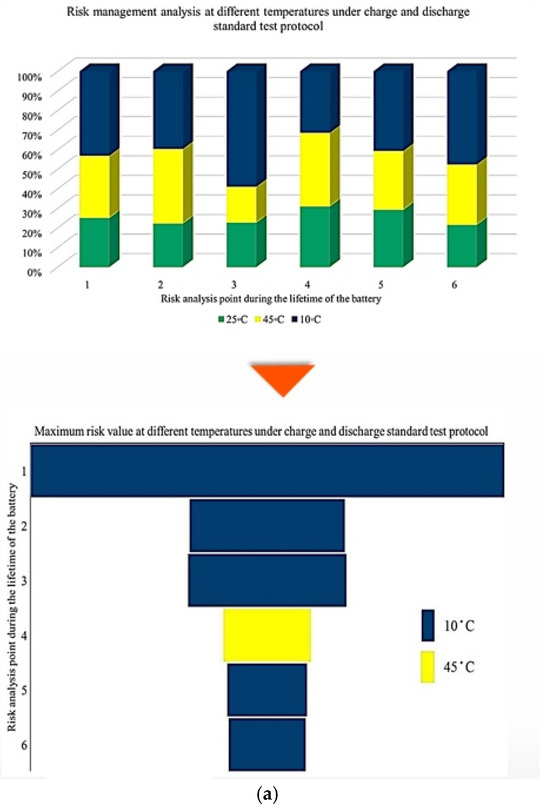
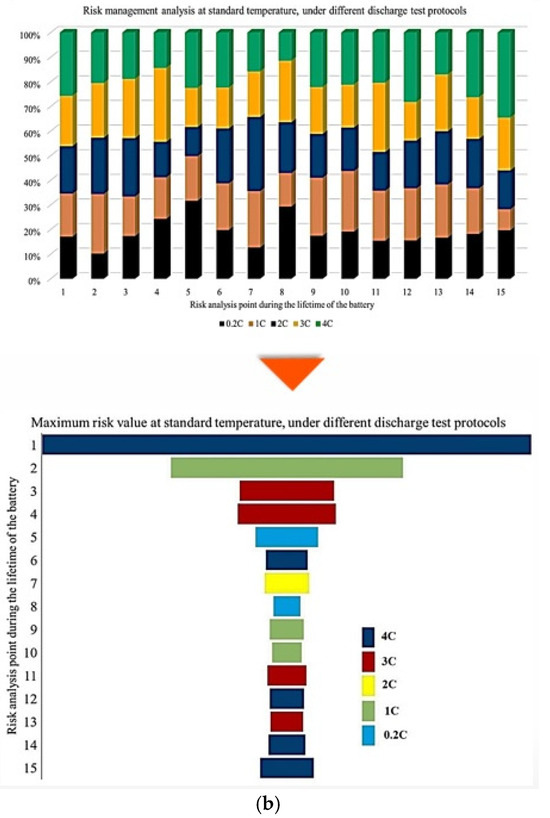
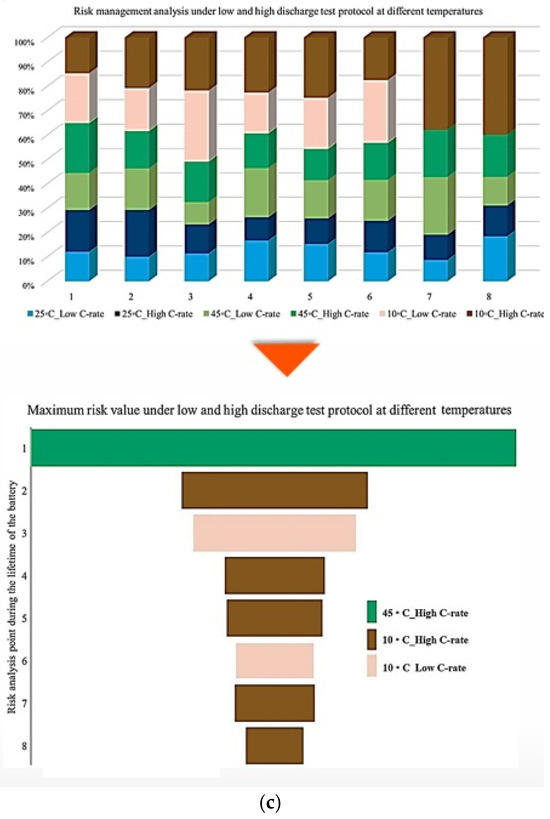
Figure 5.
CF analysis in different conditions at different temperatures: (a) charge/discharge standard TPC, (b) different discharge TPCs, and (c) low and high discharge TPCs, adapted from [30].
The results indicate that the maximum contribution of CF during battery lifetime occurs at different stages depending on the operating temperature, where at 10 °C, the maximum contribution reaches approximately 60% at the 3rd risk analysis point, at 45 °C, the highest contribution of about 35% occurs at the second and fourth points. At 25 °C, the maximum contribution is around 30% at the 4th risk analysis point. At low temperature, 10 °C, a high risk level is observed during the early and intermediate stages of battery life, which can be attributed to the accelerated degradation of active materials, particularly lithium plating. After this stage, the battery behavior becomes relatively more stable; however, toward EOL, accumulated electrochemical damage leads to a renewed increase in CF risk, resulting in the highest risk level at the final stage. Further, the important thing is to identify which degradation condition contributes most significantly to the maximum risk at each risk point; therefore, the highest CF contribution among all conditions is selected as the maximum risk value for that point. This comparison is illustrated in Figure 5, which shows the risk checkpoints and their corresponding intensity levels.
For example, at the first risk point, the highest risk contribution is associated with operation at 10 °C. Examination of the overall trend reveals that low temperatures (10 °C) contribute the most to maximum risk at most stages, followed by high temperatures (45 °C). This confirms that both low and high thermal stresses play a key role in accelerating capacity degradation over the lifetime of NMC Li-IBs. Another aspect of the risk analysis concerns the frequency with which each degradation condition contributes to the maximum risk across all risk points, and this is evaluated by counting the number of occurrences in which a specific condition exhibits the highest contribution to CF. The probability distribution of maximum risk contributions under different temperatures, expressed as percentages, is depicted in Figure 5.
In this representation, the length of each bar corresponds to the relative contribution of a given degradation condition to the overall maximum risk. The results demonstrate that the highest probability of maximum CF risk occurs at 10 °C, and that battery operation at 25 °C under standard charge/discharge conditions exhibits a lower risk over time. This means that moderate temperature operation provides improved reliability, while operation at low temperature leads to a higher level of degradation. The analysis further confirms that battery operation at 25 °C and 10 °C represents relatively more and less reliable conditions, respectively, when evaluated from a long-term CF standpoint. Also, CF is analyzed under standard temperature conditions with varying discharge C-rates. The results show that the maximum contribution of CF over battery lifetime occurs at different risk points for different discharge rates, in which CF contributions of approximately 40% at the fifth point for C/5, 20% at the second point for 1 C, 10% at the tenth point for 2 C, 25% at the seventh point for 3 C, and 35% at the tenth point for 4 C are noted. In this case, 15 risk points are considered, corresponding to 5 discharge-rate scenarios. The trend suggests that higher discharge currents lead to increased risk levels, due to elevated Rint and enhanced heat generation. For the 4 C condition, a high risk of power and capacity loss is observed during early cycling, then followed by fluctuations through battery life, and culminating in the highest risk at the end of life, and the C/5 condition also exhibits the most stable behavior, with minimal volatility across the battery lifetime. Despite its stability, the sustained operation at C/5 can still contribute significantly to degradation over long periods, highlighting that low discharge rates alone do not guarantee minimal risk. Thermal effects and cumulative heat generation must also be considered. It should be noted that, in this study, stability is defined as the overall consistency of degradation behavior evaluated using the combined evolution of CF, internal resistance, and OCV-based indicators, rather than the minimum variation in a single degradation metric. Accordingly, localized fluctuations observed in individual indicators do not contradict a condition being classified as stable when no systematic or accelerating degradation trend is identified across the combined indicators. The probability analysis further shows that the highest risk contribution under standard temperature conditions occurs for the 4 C discharge rate during early battery life. High discharge currents accelerate structural degradation of electrode materials and promote deformation of lithium storage networks. Additionally, early-cycle degradation behavior observed at high discharge rates may be associated with degradation phenomena commonly linked to SEI evolution, as reported in the literature, while localized heating and mechanical stress under high current conditions are known to exacerbate degradation. High discharge currents are known to impose increased electrochemical and mechanical stress on electrode materials, which can accelerate degradation processes reported in the literature. In this study, early-cycle degradation trends observed under high C-rate operation may be associated with degradation phenomena commonly linked to SEI-related effects, as well as increased interfacial stress arising from localized heating and mechanical loading, as widely discussed in previous studies. Figure 5 further illustrates CF behavior under combined temperature and discharge-rate conditions, showing that the highest CF contributions over battery lifetime occur for operating scenarios involving low temperature and high discharge current, particularly at 10 °C with high C-rate operation. From a qualitative perspective, such operating conditions are consistent with advanced degradation pathways reported in the literature, including lithium plating at the anode, SEI-related degradation, and structural disordering of electrode materials. In contrast, when evaluated from a multi-indicator perspective, the 25 °C/4 C condition exhibits comparatively stable behavior after the initial cycling stages, despite localized variations in individual CF-related risk contributions.
Figure 6 presents the probability of maximum risk occurrence for each degradation condition under standard charging and varying discharge rates at different temperatures. The results show that the highest probability of CF risk occurs at 10 °C with high discharge current, followed by 10 °C with low discharge current, and that the operation at 25 °C exhibits negligible participation in maximum risk across the examined stages. Also, high-temperature conditions (45 °C), particularly at high discharge rates, tend to contribute to risk reduction relative to low-temperature cases. Accordingly, the results of Assessment 1 show that degradation mechanisms contributing to CF, such as loss of cyclable lithium, degradation of active cathode material, and degradation of active anode material, are most pronounced under low-temperature and high-current conditions. These findings underscore the role of combined thermal and electrical stress in driving capacity degradation and enhancing battery risk management.
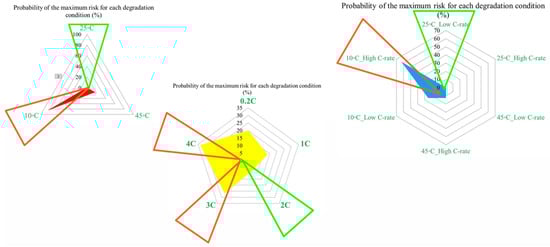
Figure 6.
CF risk assessment in the degradation conditions investigated.
3.2. The Second Assessment: Risk Analysis of the Total Internal Resistance Under the Degradation Conditions
Figure 7 illustrates the contribution of each battery to the change in the Rint at different ambient temperatures under standard charge/discharge TPCs, assessed at three SoC levels, to describe how Rint changes with temperature and cycling conditions as the battery transitions from one condition to another over its lifetime. It should be noted that in this study, all discussions of heat generation or thermal stress are inferred indirectly from the evolution of internal resistance and operating conditions, rather than from direct thermal measurements. Thus, based on the results provided in Figure 7, the highest contribution to PF associated with Rint evolution during the battery lifetime at 10 °C, 45 °C, and 25 °C reaches 20% at the 1st and 2nd risk analysis points, 50% at the 3rd point, and 25% at the 1st and 2nd points, respectively, and when considering the 50% SoC level, the maximum contribution to power fade during battery life at 10 °C, 45 °C, and 25 °C is observed to be 60% at the 2nd point, 80% at the 6th point, and 80% at the 2nd risk analysis point, respectively. However, at a lower SoC level of 20%, the influence of Rint increase on PF becomes more evident. In particular, the maximum contribution at 10 °C, 45 °C, and 25 °C reaches 80% at the 2nd point, 80% at the 3rd point, and 40% at the 5th risk analysis point, respectively. Thus, operation at 10 °C exhibits the highest participation in risk development, exceeding other temperature conditions by approximately 80% and 50% at different SoC levels.
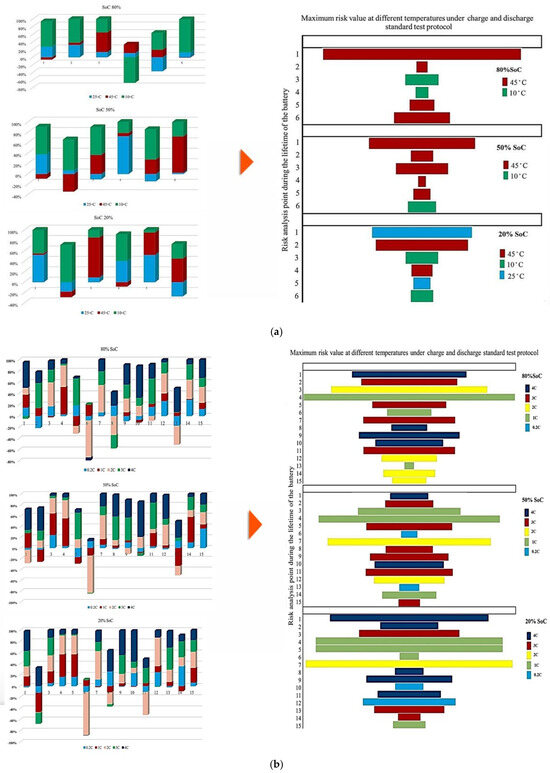
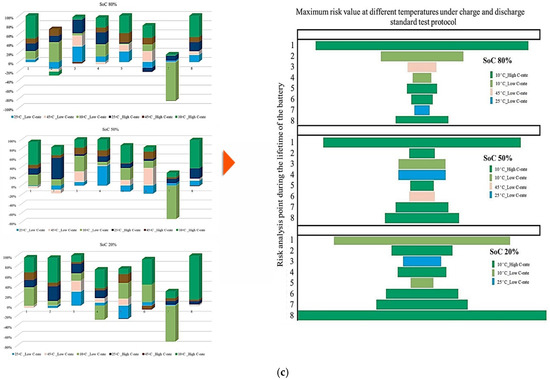
Figure 7.
PF analysis in different conditions at different SoCs: (a) charge/discharge standard TPC, (b) different discharge test protocols, and (c) at combined different temperatures and high and low discharge TPCs, adapted from [30].
In addition, at 20% SoC, the influence of high temperature (45 °C) on increasing risk and reducing battery reliability is more significant than that noted for other operating conditions over the battery lifetime.
Figure 7 also presents the probability distribution of the maximum risk associated with each degradation condition at different operating temperatures under different charge/discharge TPCs, evaluated from the perspective of PF. The figure is divided into three sections corresponding to the SoC levels investigated. At 80% and 50% SoC, the highest risk values are observed at 45 °C compared with the other temperature conditions. At 20% SoC, the maximum risk shifts to the case with 25 °C, and it is also clear that at both 80% and 50% SoC, the 25 °C condition has no contribution to the maximum risk values. A closer examination of the results indicates that the likelihood of elevated risk increases around the knee region of the battery capacity curve.
This performance suggests that power degradation may occur prominently in this region across different temperatures, although the severity of the effect varies with conditions. In addition, battery cycling under both high and low temperature environments contributes significantly to accelerated cell damage, in which these thermal stresses have a main role in increasing internal electrical resistance, slowing reaction kinetics, and promoting the loss of active electrode materials.
Figure 7 illustrates the contribution of each battery to Rint change under standard charge conditions, considering different TPCs and three SoC levels, and the results reflect how Rint changes over battery lifetime when operating conditions transit from one state to another. The contribution to PF associated with Rint increase during the battery lifetime at C/2, 1 C, 2 C, 3 C, and 4 C reaches 20% at the 12th and 14th points, 50% at the 4th and 7th points, 40% at the 2nd, 5th, and 11th points, and 45% at the 10th risk analysis point, respectively. When the SoC is fixed at 50%, the maximum contribution of PF occurs at 20% (14th point), 45% (4th point), 50% (7th point), 40% (2nd, 5th, and 11th points), and 50% (11th point) for C/2, 1 C, 2 C, 3 C, and 4 C, respectively. At 20% SoC, the corresponding maximum contributions are observed as 30% (14th point), 40% (5th point), 50% (7th point), 40% (13th point), and 60% (10th point). Considering the evolution of risk trends in this section, discharge at C/5 shows more stable behavior at 50% SoC compared with 80% and 20% SoC conditions. However, the most obvious variations in Rint-related risk are associated with the 2 C condition throughout the testing period.
Additionally, Figure 7 illustrates the contribution of each battery under standard charge conditions with low and high discharge currents at various temperatures, considering three SoC levels to capture how Rint develops over battery lifetime as operating conditions change. From the results, the contribution to PF associated with Rint increase during battery lifetime under 25 °C/Low C-rate, 25 °C/High C-rate, 45 °C/Low C-rate, 45 °C/High C-rate, 10 °C/Low C-rate, and 10 °C/High C-rate reaches 30% at the 3rd point, 20% at the 3rd and 4th points, 20% at the 3rd and 6th points, 20% at the 5th point, 40% at the 2nd point, and 50% at the 1st risk analysis point, respectively. When the SoC is fixed at 50%, the maximum contribution of PF is observed as 40% at the 4th point, 50% at the 2nd point, 40% at the 6th point, 10% at the 6th point, 50% at the 8th point, and 50% at the 1st and 8th risk analysis points for the same temperature and discharge-rate combinations. At 20% SoC, the corresponding maximum contributions increase to 20% at the 3rd point, 30% at the 2nd point, 20% at the 3rd point, 10% at the 5th point, 40% at the 1st and 6th points, and 90% at the 8th risk analysis point. The most significant contribution to PF is associated with the 10 °C/high C-rate condition. In contrast, the lowest participation in PF-related risk is consistently noted at 25 °C over the battery lifetime.
It is also evident that the changes in maximum risk at 10 °C occur more abruptly than under other operating conditions, indicating a stronger sensitivity of Rint increase to low-temperature operation. The probability of maximum risk occurrence for each degradation condition at 80%, 50%, and 20% SoC under low and high discharge currents is also given in Figure 6. The analysis shows that the highest risk at both 80% and 50% SoC is dominated by the 10 °C/high C-rate condition, while at 20% SoC, the second highest risk corresponds to the 10 °C/low C-rate case. These results validate that low-temperature operation represents the most critical condition in terms of PF risk for the investigated NMC Li-IBs. Moreover, no maximum-risk contribution is observed for the 25 °C and 45 °C/high C-rate cases at 80% and 50% SoC, nor for the 25 °C case and both 45 °C discharge conditions at 20% SoC.
Figure 8 presents the probability of the maximum PF-related risk under different degradation conditions, and it is divided into 4 subfigures to highlight the influence of temperature, discharge current, and SoC on risks. Figure 8a illustrates the impact of the ambient temperature under standard charge/discharge conditions, in which the results indicate that the distribution of maximum risk varies across SoC levels, with temperature shaping the risk profile. Figure 8b examines temperature-dependent risk behavior by highlighting the interaction between temperature and SoC. The probability of elevated risk differs between high and low SoC regions, which validates that temperature sensitivity is not uniform throughout the battery operating window. The impact of discharge C-rate at standard temperature is also shown in Figure 8c, in which the results show that higher C-rates are generally associated with increased PF risk, particularly at lower SoC levels, and that moderate discharge rates exhibit stable behavior, while extreme currents accelerate risk accumulation. Finally, Figure 8d combines the effects of temperature and discharge rate to highlight that low temperature combined with high C-rate produces the highest probability of maximum risk. Hence, the battery risk is strongly affected by the interaction between SoC, discharge current, and temperature. High and low SoC regions, when combined with high current or extreme temperatures, are associated with operating conditions known in the literature to exacerbate interfacial degradation, electrolyte degradation, and structural disordering, thereby contributing to accelerated PF.
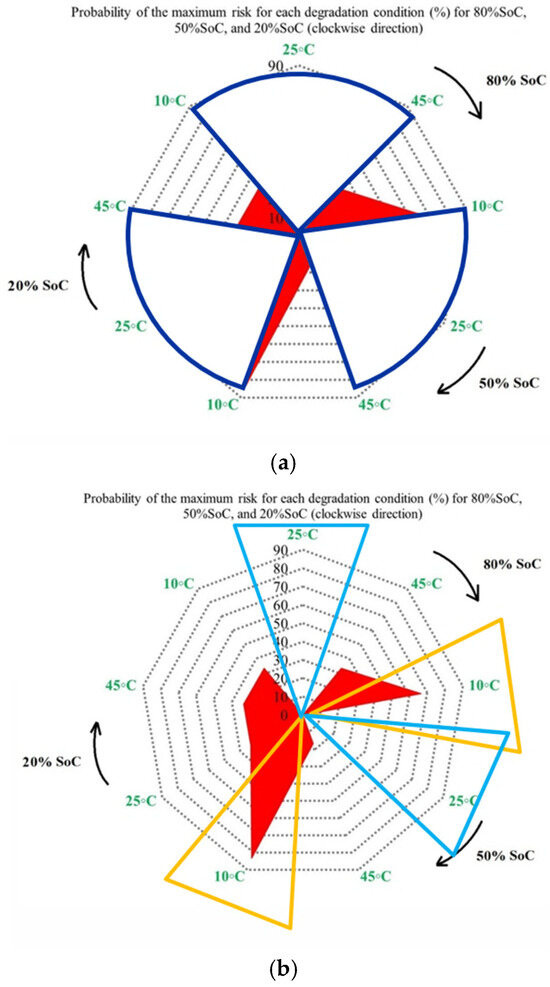
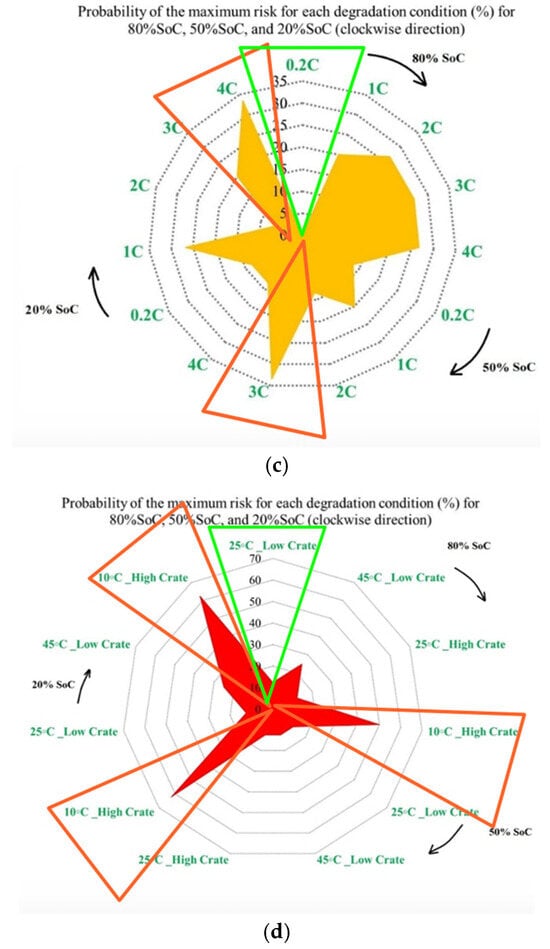
Figure 8.
PF risk assessment under different degradation conditions: (a) at different temperatures under standard charge/discharge TPCs, evaluated at different SoC levels, (b) at different temperatures under standard charge/discharge TPCs, (c) at standard temperature under standard charge conditions with different discharge C-rates, and (d) under combined thermal and electrical stress.
3.3. The Third Assessment: OCV Under the Degradation Conditions
In Figure 9, the contribution of each battery to OCV variation under different degradation conditions is shown. The analysis is performed at three SoC levels, and the results reflect the evolution of OCV-related risk over the battery lifetime. In Figure 9, it is clarified how strongly OCV variation contributes to degradation over the battery’s life. Figure 9a illustrates the OCV contribution at the three temperatures selected in this study under standard charge/discharge conditions, and the results show that the highest OCV-related risk appears at 45 °C and 10 °C, particularly at mid- and late-life inspection points, and at 25 °C, the contribution remains limited, indicating a more stable electrochemical equilibrium, which confirms that temperature extremes accelerate voltage instability, especially at reduced SoC levels. Figure 9b shows this contribution at standard temperature for different discharge C-rates, in which high C-rates, 3 C and 4 C, exhibit obvious OCV fluctuations, especially at 20% SoC, where the electrochemical system becomes more sensitive to polarization effects. However, C/2 and 1 C reveal smaller contributions, indicating reduced voltage instability over time. Then, Figure 9c presents OCV variation under low and high discharge C-rates at different temperatures, in which the most severe OCV deviations are observed at low temperature combined with high C-rate, followed by high temperature/high C-rate conditions. These operating routines, characterized by increased OCV variability, are associated with conditions that may induce higher electrochemical stress and irreversible energy losses, which have been widely reported in the literature to correlate with degradation phenomena such as loss of cyclable lithium, SEI-related effects, and electrolyte decomposition.
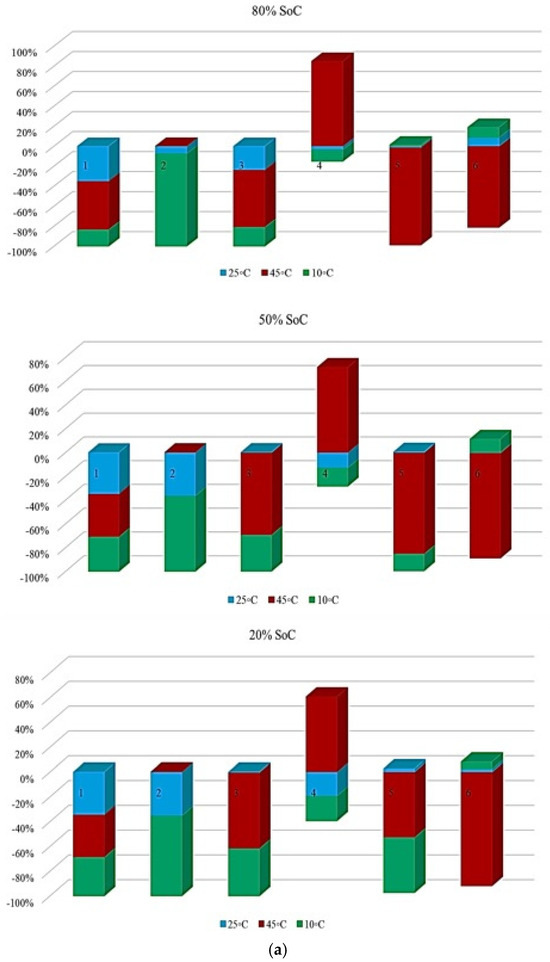
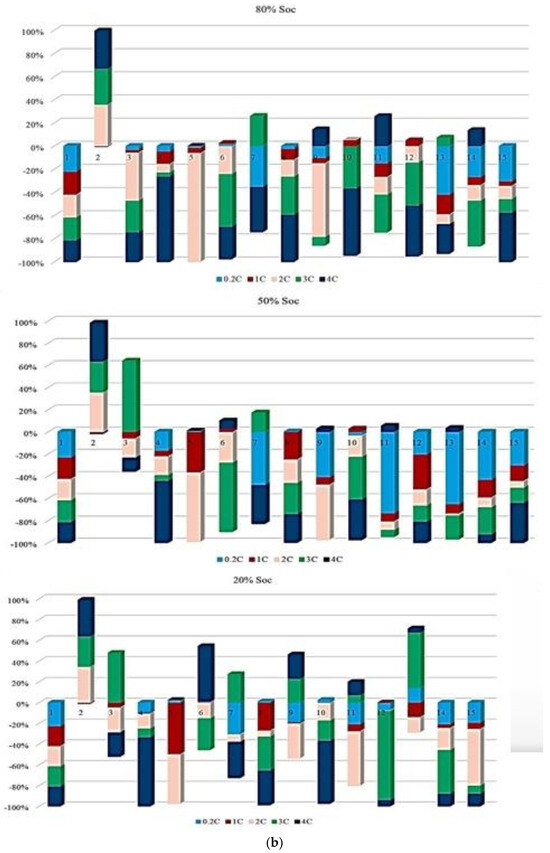
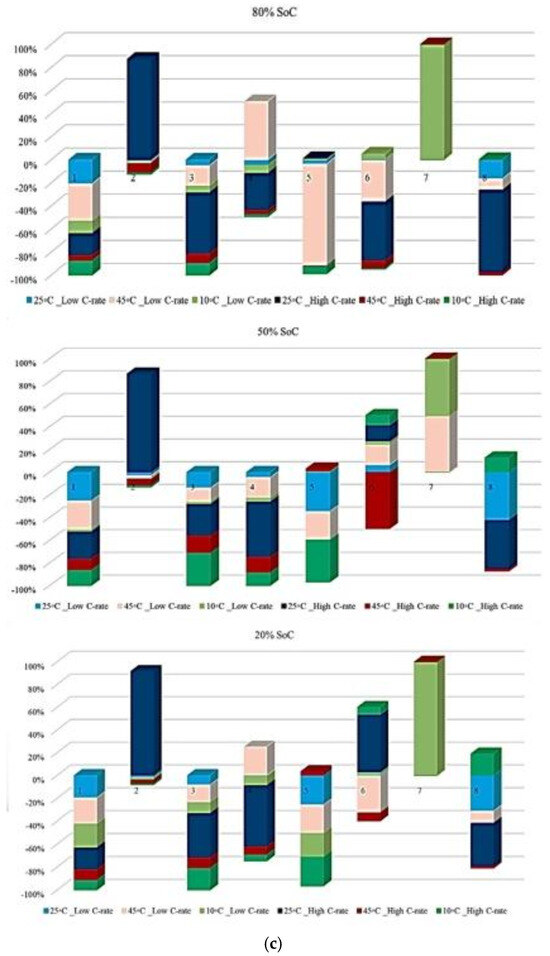
Figure 9.
OCV risk analysis under different degradation conditions: (a) effect of temperature under standard charge/discharge TPCs, (b) effect of discharge C-rate at standard temperature, and (c) combined effect of temperature and discharge C-rate, adapted from [30].
Furthermore, Figure 10 completes the analysis by presenting the probability of maximum OCV variation-related risk for each degradation condition at 80%, 50%, and 20% SoC. Unlike capacity and power indicators, OCV behavior is linked to electrochemical balance inside the cell; therefore, its interpretation is dependent on operating conditions, in which Figure 10a shows that the highest probability of maximum OCV variation occurs at 45 °C, particularly at 50%, mid-range, SoC, while 25 °C consistently exhibits the lowest probability across all SoC levels, and this means a lower susceptibility to electrochemical imbalance. This indicates that elevated temperatures increase the possibility of voltage instability during operation. As before, Figure 10b shows OCV risk assessment at different temperatures under standard charge/discharge TPCs. Figure 10c focuses on the combined thermal and electrical stress by comparing low and high discharge C-rates at different temperatures. The highest risk probability is observed under high C-rate operation in the low temperature case (10 °C/high C-rate across all SoC levels), then by high temperature/high C-rate conditions. However, 25 °C with low C-rate operation shows the most reliable operating window, particularly at 20% SoC. Thus, low temperatures with limited reaction kinetics and high C-rate combinations represent the most critical operating region for OCV stability. Further, Figure 10d summarizes the combined influence of temperature, discharge current, and SoC on OCV-based risk to highlight both the most susceptible and the most reliable operating zones. High-risk regions are primarily associated with high discharge currents combined with temperature extremes, especially at low SoC, where OCV fluctuations are most pronounced, and the lowest risk is observed at moderate temperature of 25 °C, low discharge current, and mid-range SoC, which together provide the most stable operating window.
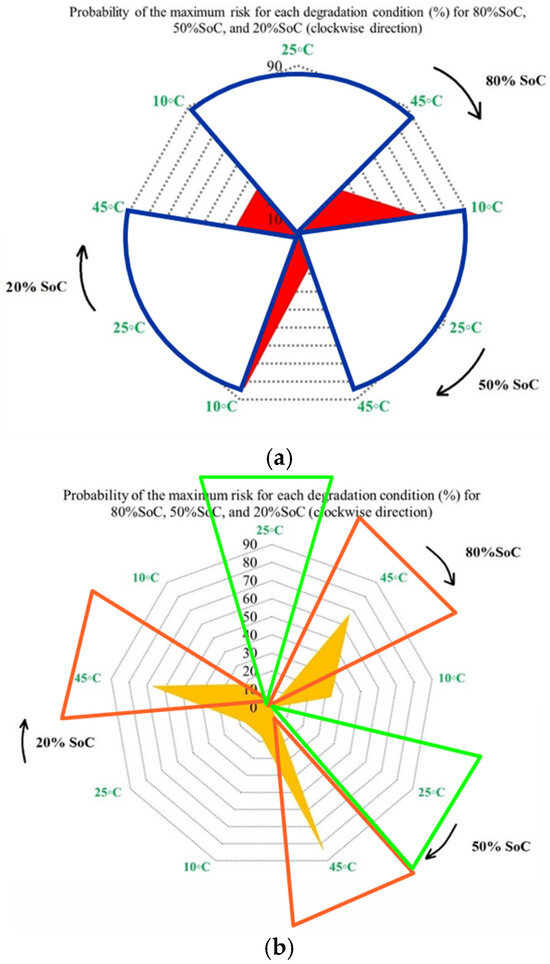
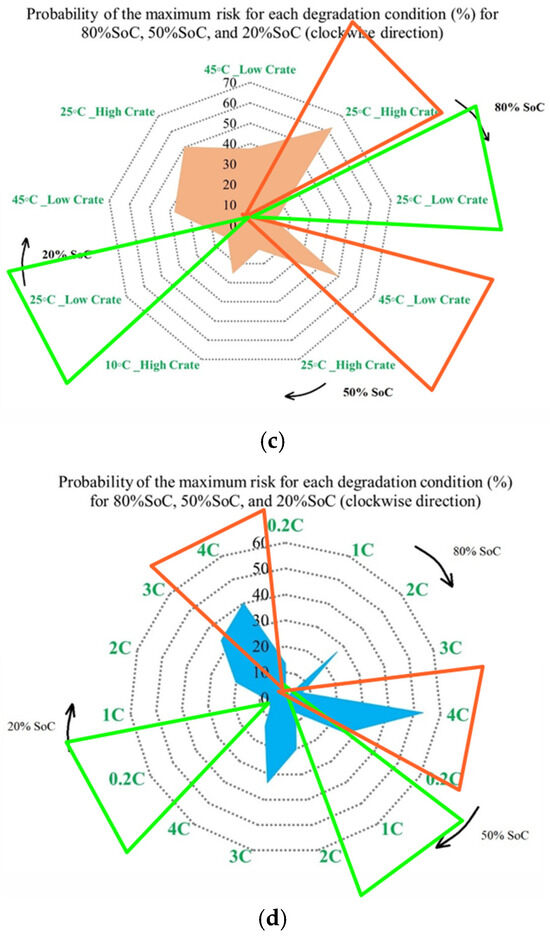
Figure 10.
OCV risk assessment under different degradation conditions: (a) at different temperatures under standard charge/discharge TPCs evaluated at three SoC levels, (b) at different temperatures under standard charge/discharge TPCs, (c) with low and high discharge C-rates at different temperatures, and (d) under combined temperature/C-rate/SoC effects.
To generalize, from the obtained results, the OCV behavior changes rapidly when multiple degradation stresses act simultaneously, and its evolution is more nonlinear than that of CF or PF. Although variations in OCV cannot be translated directly into energy or power loss, they remain helpful in highlighting unstable operating regions and identifying advanced degradation conditions.
4. Conclusions
This study proposed and applied a degradation-aware risk assessment framework for NMC Li-IBs. CF, PF, and OCV variations have been taken as the main degradation indicators. Different combinations of ambient temperatures, discharge C-rates, and SoCs windows are considered. In general, the analysis demonstrated that battery risk evolves over the lifetime and is more affected by operating conditions. According to the CF analysis, the risk of degradation associated with low-temperature and high-temperature operation was higher than that for moderate-temperature operation. The capacity-based risk in the early and knee regions of the battery life cycle under low-temperature operation stemmed primarily from the effects of Li plating and the loss of available cyclable Li. Moderate temperature operation around 25 °C offered the least risk, with stable capacity performance. However, PF exhibited higher sensitivity to discharge current and combined thermal/electrical stress than CF. High discharge C-rates, under low-temperature conditions, significantly increased power-related risk due to accelerated resistance growth and internal heat generation.
Although increased current at low temperature temporarily altered resistance behavior, this effect did not mitigate long-term degradation and reliability loss. Mid-range SoC and low-to-moderate discharge currents provided the most stable power performance over battery life. Also, OCV variation is a highly sensitive indicator of degradation-driven instability. While OCV does not directly quantify energy or power capability, its strong response to combined stress conditions enabled the identification of unstable operating regions and advanced degradation stages that were not always apparent from capacity or power indicators alone. The combined assessment confirmed that battery risk is not affected by temperature, discharge current, or SoC individually, but by their interaction. The highest-risk operating zones were associated with temperature extremes combined with high discharge currents and extreme SoC levels. In contrast, the most reliable operating region was consistently found at moderate temperature, mid-range SoC, and low-to-moderate discharge rates.
One limitation of the present study is that thermal behavior and internal heat generation were not measured directly using thermal imaging, embedded thermocouples, or coupled electro-thermal modeling. Instead, thermal effects were inferred qualitatively from the evolution of internal resistance, operating temperature, and discharge current, which are well-established contributors to irreversible Joule heating. This indirect interpretation is consistent with electro-thermal coupled modeling studies reported in the literature, where resistance growth and polarization losses are identified as dominant sources of heat generation during battery operation and aging (e.g., Pang et al. in [33]). While such models provide detailed temperature field estimation, the present work intentionally adopts a degradation-aware, indicator-based risk assessment framework rather than a fully coupled thermal model. Future work will integrate direct thermal measurements or electro-thermal modeling to further enhance the quantification of temperature-related degradation risks.
Beyond the specific findings of this study, the results offer a broader insight into the evolution of Li-IB risk. Based on the experience gained in this work, battery degradation and the progression of risk between safe and unsafe operating regions do not follow binary behavior. Instead, multi-indicator and degradation-aware approaches provide a more realistic assessment of NMC Li-IB risk than conventional single-indicator-based methods, such as CF or PF alone. In the context of sustainable energy systems and electric power systems, Li-IBs play a critical role as energy storage components, particularly in electric mobility applications. Battery degradation directly affects system reliability and safety and has broader sustainability implications, as reduced battery lifetime may lead to increased material consumption, higher energy demand for manufacturing, and increased waste generation. Therefore, the development of degradation-aware risk assessment approaches is essential. Future extensions of the proposed framework will enable translation of the present findings to pack-level reliability and safety assessment by accounting for charging-related stressors and cell-to-cell variability. Such advancements will further enhance the integration of degradation knowledge into risk analysis for improving the safety, reliability, and lifetime control of NMC Li-IBs in electric mobility and energy storage systems under diverse operating conditions.
Author Contributions
Conceptualization, F.H.G. and S.A.A.; methodology, F.H.G.; software, F.H.G.; validation, Z.M.A., F.A. and F.H.G.; formal analysis, F.H.G.; investigation, S.A.A.; resources, F.H.G.; data curation, F.H.G.; writing—original draft preparation, F.H.G.; writing—review and editing, S.A.A.; visualization, F.A.; supervision, Z.M.A.; project administration, Z.M.A.; funding acquisition, F.A. All authors have read and agreed to the published version of the manuscript.
Funding
The authors extend their appreciation to Prince Sattam bin Abdulaziz University for funding this research work through the project number (PSAU/2025/01/33896).
Institutional Review Board Statement
Not applicable.
Data Availability Statement
All relevant data are within the manuscript.
Acknowledgments
The authors extend their appreciation to Prince Sattam bin Abdulaziz University.
Conflicts of Interest
Author Foad H. Gandoman was employed by the company Reliability & Safety Technical Center (RSTER). The remaining authors declare that the research was conducted in the absence of any commercial or financial relationships that could be construed as a potential conflict of interest.
References
- Gandoman, F.H.; Jaguemont, J.; Goutam, S.; Gopalakrishnan, R.; Firouz, Y.; Kalogiannis, T.; Omar, N.; Van Mierlo, J. Concept of reliability and safety assessment of lithium-ion batteries in electric vehicles: Basics, progress, and challenges. Appl. Energy 2019, 251, 113343. [Google Scholar] [CrossRef]
- Mahdy, A.; Abdel Aleem, S.H.E.; Hasanien, H.M. A novel maximum energy extraction strategy using lithium-ion batteries for Archimedes wave swing wave energy conversion systems. Renew. Energy 2026, 256, 124664. [Google Scholar] [CrossRef]
- Vetter, J.; Novák, P.; Wagner, M.R.; Veit, C.; Möller, K.-C.; Besenhard, J.O.; Winter, M.; Wohlfahrt-Mehrens, M.; Vogler, C.; Hammouche, A. Ageing mechanisms in lithium-ion batteries. J. Power Sources 2005, 147, 269–281. [Google Scholar] [CrossRef]
- Levy, S.C. Safety and reliability considerations for lithium batteries. J. Power Sources 1997, 68, 75–77. [Google Scholar] [CrossRef]
- Menye, J.S.; Camara, M.-B.; Dakyo, B. Lithium Battery Degradation and Failure Mechanisms: A State-of-the-Art Review. Energies 2025, 18, 342. [Google Scholar] [CrossRef]
- Barré, A.; Deguilhem, B.; Grolleau, S.; Gérard, M.; Suard, F.; Riu, D. A review on lithium-ion battery ageing mechanisms and estimations for automotive applications. J. Power Sources 2013, 241, 680–689. [Google Scholar] [CrossRef]
- Waldmann, T.; Hogg, B.-I.; Wohlfahrt-Mehrens, M. Li plating as unwanted side reaction in commercial Li-ion cells—A review. J. Power Sources 2018, 384, 107–124. [Google Scholar] [CrossRef]
- Bandhauer, T.M.; Garimella, S.; Fuller, T.F. A Critical Review of Thermal Issues in Lithium-Ion Batteries. J. Electrochem. Soc. 2011, 158, R1. [Google Scholar] [CrossRef]
- Feng, X.; Ouyang, M.; Liu, X.; Lu, L.; Xia, Y.; He, X. Thermal runaway mechanism of lithium ion battery for electric vehicles: A review. Energy Storage Mater. 2018, 10, 246–267. [Google Scholar] [CrossRef]
- Yang, X.-G.; Wang, C.-Y. Understanding the trilemma of fast charging, energy density and cycle life of lithium-ion batteries. J. Power Sources 2018, 402, 489–498. [Google Scholar] [CrossRef]
- Ali, Z.M.; Calasan, M.; Gandoman, F.H.; Jurado, F.; Abdel Aleem, S.H.E. Review of batteries reliability in electric vehicle and E-mobility applications. Ain Shams Eng. J. 2024, 15, 102442. [Google Scholar] [CrossRef]
- Keil, P.; Schuster, S.F.; Wilhelm, J.; Travi, J.; Hauser, A.; Karl, R.C.; Jossen, A. Calendar Aging of Lithium-Ion Batteries. J. Electrochem. Soc. 2016, 163, A1872. [Google Scholar] [CrossRef]
- Schmalstieg, J.; Käbitz, S.; Ecker, M.; Sauer, D.U. A holistic aging model for Li(NiMnCo)O2 based 18650 lithium-ion batteries. J. Power Sources 2014, 257, 325–334. [Google Scholar] [CrossRef]
- Waag, W.; Fleischer, C.; Sauer, D.U. Critical review of the methods for monitoring of lithium-ion batteries in electric and hybrid vehicles. J. Power Sources 2014, 258, 321–339. [Google Scholar] [CrossRef]
- Berecibar, M.; Gandiaga, I.; Villarreal, I.; Omar, N.; Van Mierlo, J.; Van den Bossche, P. Critical review of state of health estimation methods of Li-ion batteries for real applications. Renew. Sustain. Energy Rev. 2016, 56, 572–587. [Google Scholar] [CrossRef]
- Hu, X.; Li, S.; Peng, H. A comparative study of equivalent circuit models for Li-ion batteries. J. Power Sources 2012, 198, 359–367. [Google Scholar] [CrossRef]
- Farmann, A.; Waag, W.; Marongiu, A.; Sauer, D.U. Critical review of on-board capacity estimation techniques for lithium-ion batteries in electric and hybrid electric vehicles. J. Power Sources 2015, 281, 114–130. [Google Scholar] [CrossRef]
- Gandoman, F.H.; Behi, H.; Berecibar, M.; Jaguemont, J.; Aleem, S.H.E.A.; Behi, M.; Van Mierlo, J. Chapter 16—Reliability evaluation of Li-ion batteries for electric vehicles applications from the thermal perspectives. In Uncertainties in Modern Power Systems; Zobaa, A.F., Abdel Aleem, S.H.E., Eds.; Academic Press: Amsterdam, The Netherlands, 2021; pp. 563–587. [Google Scholar] [CrossRef]
- Chung, S.H.; Tancogne-Dejean, T.; Zhu, J.; Luo, H.; Wierzbicki, T. Failure in lithium-ion batteries under transverse indentation loading. J. Power Sources 2018, 389, 148–159. [Google Scholar] [CrossRef]
- Hendricks, C.; Williard, N.; Mathew, S.; Pecht, M. A failure modes, mechanisms, and effects analysis (FMMEA) of lithium-ion batteries. J. Power Sources 2015, 297, 113–120. [Google Scholar] [CrossRef]
- Collong, S.; Kouta, R. Fault tree analysis of proton exchange membrane fuel cell system safety. Int. J. Hydrogen Energy 2015, 40, 8248–8260. [Google Scholar] [CrossRef]
- Mertens, A.; Vinke, I.C.; Tempel, H.; Kungl, H.; de Haart, L.G.J.; Eichel, R.-A.; Granwehr, J. Quantitative Analysis of Time-Domain Supported Electrochemical Impedance Spectroscopy Data of Li-Ion Batteries: Reliable Activation Energy Determination at Low Frequencies. J. Electrochem. Soc. 2016, 163, H521–H527. [Google Scholar] [CrossRef]
- Gao, Y.; Zhang, X.; Yang, J.; Guo, B.; Zhou, X. A novel model for lithium-ion battery aging quantitative analysis based on pseudo two-dimension expressions. Int. J. Electrochem. Sci. 2019, 14, 3180–3203. [Google Scholar] [CrossRef] [PubMed]
- Bubbico, R.; Greco, V.; Menale, C. Hazardous scenarios identification for Li-ion secondary batteries. Saf. Sci. 2018, 108, 72–88. [Google Scholar] [CrossRef]
- Gandoman, F.H.; Ahmed, E.M.; Ali, Z.M.; Berecibar, M.; Zobaa, A.F.; Abdel Aleem, S.H.E. Reliability evaluation of lithium-ion batteries for e-mobility applications from practical and technical perspectives: A case study. Sustainability 2021, 13, 11688. [Google Scholar] [CrossRef]
- Navamani, D.J.; Sathik, J.M.; Lavanya, A.; Almakhles, D.; Ali, Z.M.; Aleem, S.H.E.A. Reliability Prediction and Assessment Models for Power Components: A Comparative Analysis. Arch. Comput. Methods Eng. 2023, 30, 497–520. [Google Scholar] [CrossRef]
- Lee, J.-O.; Kim, Y.-S. Novel battery degradation cost formulation for optimal scheduling of battery energy storage systems. Int. J. Electr. Power Energy Syst. 2022, 137, 107795. [Google Scholar] [CrossRef]
- Safavi, V.; Vaniar, A.M.; Bazmohammadi, N.; Vasquez, J.C.; Keysan, O.; Guerrero, J.M. A battery degradation-aware energy management system for agricultural microgrids. J. Energy Storage 2025, 108, 115059. [Google Scholar] [CrossRef]
- Collath, N.; Tepe, B.; Englberger, S.; Jossen, A.; Hesse, H. Aging aware operation of lithium-ion battery energy storage systems: A review. J. Energy Storage 2022, 55, 105634. [Google Scholar] [CrossRef]
- Gandoman, F.H. Battery Modelling and Energy Management of the Electric Vehicles and Renewable Energy Resources. Ph.D. Thesis, Vrije Universiteit Brussel, Brussels, Belgium, 2021. [Google Scholar]
- ISO 12405-12; Electrically Propelled Road Vehicles—Test Specification for Lithium-Ion Battery Packs and Systems—Part 12: Hybrid Pulse Power Characterization (HPPC). International Organization for Standardization (ISO): Geneva, Switzerland, 2012.
- Zhang, J.; Lee, J. A review on prognostics and health monitoring of Li-ion battery. J. Power Sources 2011, 196, 6007–6014. [Google Scholar] [CrossRef]
- Pang, H.; Yan, X.; Jiang, N.; Fan, G.; Du, J.; Lin, G. Towards co-estimation of lithium-ion battery state of charge and state of temperature using a thermal-coupled extended single-particle model. Energy 2025, 326, 136186. [Google Scholar] [CrossRef]


Disclaimer/Publisher’s Note: The statements, opinions and data contained in all publications are solely those of the individual author(s) and contributor(s) and not of MDPI and/or the editor(s). MDPI and/or the editor(s) disclaim responsibility for any injury to people or property resulting from any ideas, methods, instructions or products referred to in the content. |
© 2026 by the authors. Licensee MDPI, Basel, Switzerland. This article is an open access article distributed under the terms and conditions of the Creative Commons Attribution (CC BY) license.