


Abstract
Component calorimetry is widely used to assess the thermal stability of lithium-ion battery cathode materials, yet it remains unclear which material-scale descriptors retain consistent relationships with whole-cell self-heating kinetics across independent datasets and test protocols. Here, raw accelerating rate calorimetry (ARC) and thermogravimetric/differential scanning calorimetry (TGA/DSC) data for lithium cobalt oxide (LCO), lithium iron phosphate (LFP), and nickel–cobalt–aluminum oxide (NCA) cells were reanalyzed using a physics-guided event framework. Cathode decomposition onset, event-specific apparent exothermic energy, and associated mass loss were compared with the maximum whole-cell self-heating rate. In the Sandia dataset, cathode onset and event-specific exothermic energy showed large matched-state-of-charge correlations with whole-cell self-heating kinetics (r = −0.983 and 0.980, respectively). In an independently generated dataset, the cathode–electrolyte onset relationship was substantially weaker (r = −0.376), whereas cathode–electrolyte reaction enthalpy retained a large association (r = 0.886). Rank-based sensitivity analysis preserved this contrast, whereas leave-one-chemistry-out stress tests were unstable for all three Sandia linear models, indicating that the strong within-dataset associations did not extrapolate reliably to an unseen chemistry. Because the two heat-release metrics were obtained under different sample configurations and calorimetric protocols, the cross-study comparison is interpreted at the descriptor-class level rather than as direct metric equivalence. Across the two conventional lithium-ion datasets examined, cathode-associated exothermic magnitude showed greater cross-dataset consistency than onset temperature alone. However, neither descriptor supported a universal chemistry-independent scaling law, indicating that component-to-cell relationships remain dependent on experimental protocol, electrode interactions, cell architecture, and battery platform.
1. Introduction
Thermal runaway (TR) in lithium-ion batteries develops through a sequence of coupled exothermic reactions involving the solid–electrolyte interphase, anode–electrolyte system, separator, cathode, and electrolyte [1,2,3]. Because these processes interact, whole-cell behavior cannot be inferred from a single isolated component or characteristic temperature (T) [4,5,6]. This creates a scale-translation problem in battery safety: material-level calorimetry resolves local thermal events, whereas intact-cell calorimetry captures the integrated response of the complete electrochemical and thermal system.
Cathode chemistry is especially important at high temperature. Delithiated layered oxides such as lithium cobalt oxide (LCO), lithium nickel cobalt aluminum oxide (NCA), and Ni-rich NCM undergo structural reconstruction and oxygen loss during heating, and the released reactive oxygen can accelerate electrolyte oxidation and heat generation [7,8,9]. In contrast, the stable polyanionic framework and strong P–O covalent bonding of lithium iron phosphate (LFP) stabilize the oxygen sublattice, suppress oxygen release, and confer superior thermal stability [10,11,12]. These chemistry-dependent differences are well established; the unresolved issue is how reliably component-scale descriptors translate to whole-cell runaway kinetics.
Differential scanning calorimetry (DSC) and thermogravimetric analysis (TGA) are widely used to quantify component-level onset or peak temperatures, heat-flow features, reaction enthalpy, and mass change, whereas accelerating rate calorimetry (ARC) measures self-heating of an intact cell under near-adiabatic conditions [13,14,15]. Previous studies have combined these methods to relate whole-cell heating-rate features to reactions of individual components, compare chemistries, and examine inter-electrode crosstalk [16,17,18]. More recent work has emphasized standardized calorimetric datasets, data-driven analysis of cathode thermochemical properties, and laboratory-scale full-cell safety screening [19,20,21,22].
Barkholtz et al. [23] performed one of the most systematic component-to-cell comparisons for LCO-, LFP-, and NCA-based commercial cells across state of charge (SOC) using whole-cell ARC together with TGA, DSC, and temperature-resolved X-ray diffraction. Their study established strong chemistry- and SOC-dependent differences in whole-cell runaway kinetics and linked cathode destabilization to the severe stage of runaway. Zheng et al. [17] similarly matched component DSC features to changes in whole-cell ARC heating rate, while Kvasha et al. [24] compared ARC behavior with harvested-electrode DSC for NCA/graphite, LFP/graphite, and NCA/LTO cells. These studies established the mechanistic value of component calorimetry, but their component-to-cell relationships were interpreted primarily within each experimental dataset.
A key complication is that DSC descriptors depend on test protocol. Published cathode DSC data vary with sample preparation, electrolyte content, heating rate, pan or crucible configuration, and gas retention, affecting measured onset, peak shape, and heat release [20,21]. An explainable-machine-learning analysis of published DSC measurements likewise found that intrinsic material properties mainly govern reaction initiation, whereas sample and test conditions exert greater influence on heat-release kinetics [22]. A strong relationship observed in one calorimetric dataset therefore cannot be assumed to represent a protocol- and chemistry-independent scaling law.
Data-driven methods have also improved prediction of material-scale thermal descriptors. High-throughput DSC combined with machine learning, for example, has been used to predict peak temperature, heat release, and peak heat flow of high-nickel cathodes from composition and SOC [25]. These approaches are useful for material screening, but their prediction targets remain component-level calorimetric metrics rather than whole-cell maximum self-heating rate (HRmax). Conversely, recent small-cell ARC methods reduce the material and cell-size requirements for full-cell safety testing [19], but do not establish which component-scale descriptor remains consistent when the dataset or calorimetric protocol changes.
The component-to-cell scale-translation problem has remained active in recent battery-safety research. Since 2020, studies have combined component DSC with whole-cell ARC across multiple commercial chemistries [26], used DSC-derived reaction kinetics together with full-cell ARC and thermal-abuse modeling to resolve electrode crosstalk [16], related harvested positive-electrode DSC/TGA behavior to nail-penetration resistance in automotive prismatic cells [27], developed multilayer DSC approaches to bridge material reactions toward larger cell-stack behavior [28], and directly compared small-scale DSC diagnostics with full-cell ARC in anode-free lithium-metal systems [18]. These studies use different cell chemistries, sample preparations, and whole-cell endpoints, but collectively show that translating small-scale calorimetry to practical cell-level safety behavior remains a current methodological challenge.
Here, we test whether commonly used component-calorimetry descriptors retain a consistent relationship with maximum whole-cell HR across two independently generated datasets. Unlike previous ARC/DSC comparisons that primarily interpreted component-to-cell relationships within individual experimental datasets, the present study explicitly distinguishes within-dataset association from cross-dataset consistency and further examines whether apparently strong descriptor–response relationships remain stable under chemistry-level extrapolation. Raw Sandia ARC and TGA/DSC data were reprocessed to obtain physics-guided onset, event-specific apparent exothermic energy, and event-associated mass loss. Within-dataset associations were examined using matched-SOC centering and rank-based sensitivity analysis, while comparison with the independently generated Kvasha dataset and leave-one-chemistry-out stress testing were used to assess cross-study consistency and extrapolation stability. The aim was not to reproduce the established LFP/LCO/NCA safety ranking, but to determine whether onset temperature or cathode-associated exothermic magnitude is more consistent across datasets and whether either supports a chemistry-independent material-to-cell relationship. The resulting framework therefore shifts the emphasis from identifying strong correlations within a single dataset to testing the limits of their transfer across chemistries and experimental contexts.
2. Materials and Methods
2.1. Study Design and Data Sources
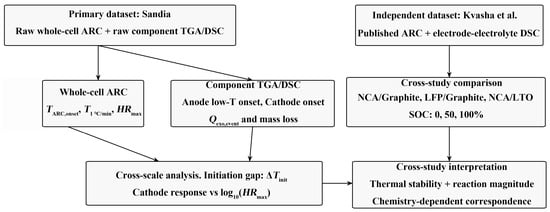
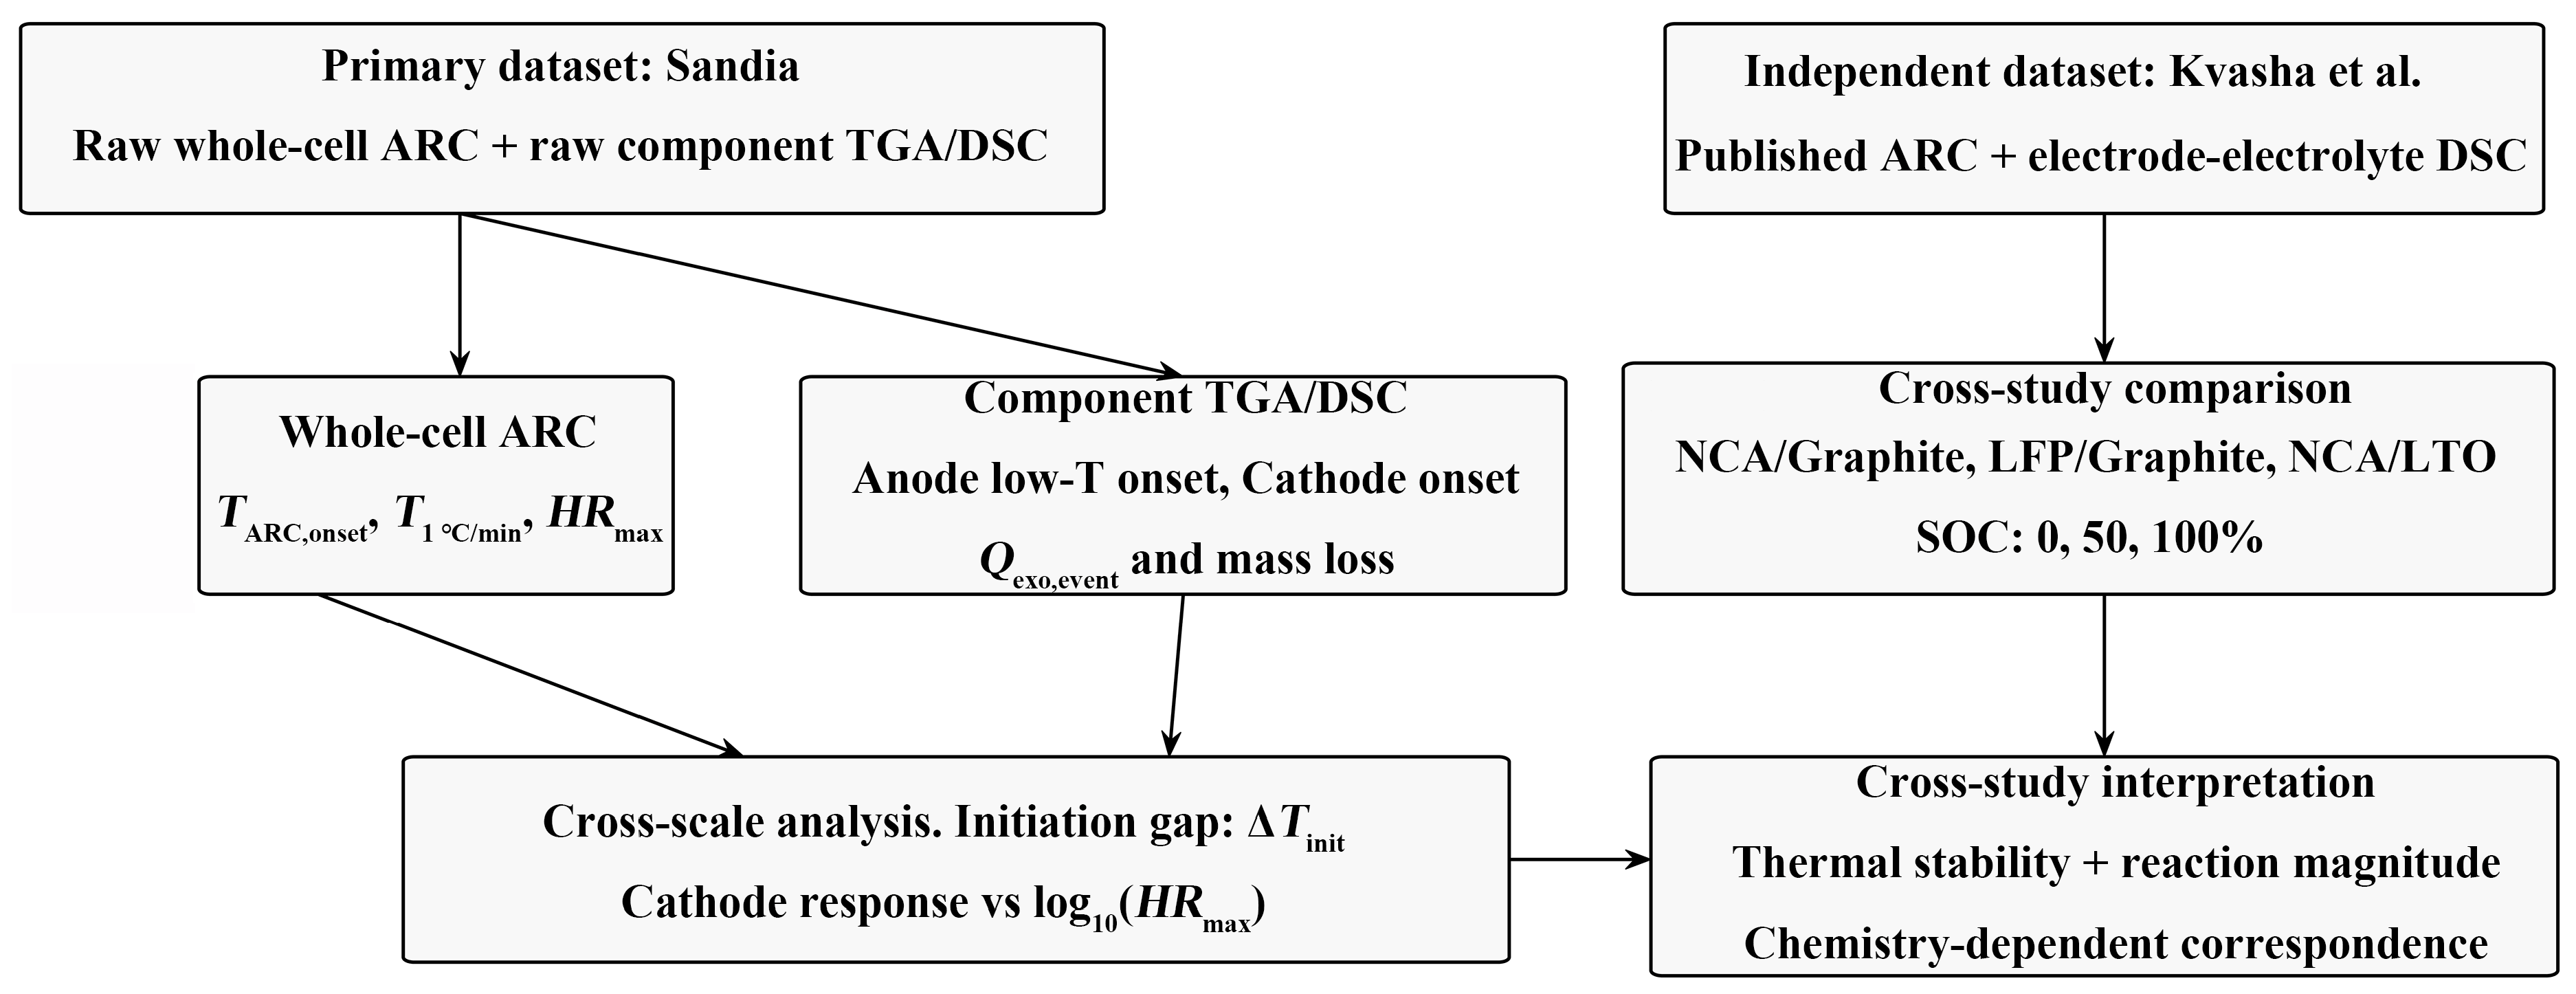
The study used a two-stage design. The Sandia dataset associated with Barkholtz et al. [23] served as the primary dataset because matched raw whole-cell ARC and component-level TGA/DSC data were available across several cathode chemistries and SOC values. The independently generated dataset reported by Kvasha et al. [24] was used for cross-study comparison. Table 1 summarizes the datasets and their analytical roles, while Figure 1 illustrates the overall study design and cross-scale analytical framework. Sandia ARC and TGA/DSC datasets were used for the primary analysis, whereas published ARC and electrode–electrolyte DSC data from Kvasha et al. were included for cross-study comparison. Because the calorimetric protocols differed between studies, absolute heat-release values were interpreted only within each study.
Table 1.
Datasets, experimental scope, and analytical roles used in the cross-scale analysis.
Figure 1.
Study design and cross-scale analytical framework.
2.2. Sandia Data Processing and Cross-Scale Descriptor Extraction
Processed whole-cell exotherm traces from ES-ARC or EV-ARC workbooks were used to extract three quantities: self-heating onset temperature, the temperature at which the heating rate first reached 1 °C·min−1, and HRmax. ARC onset was taken as the first valid point of the processed exotherm segment. The 1 °C·min−1 threshold temperature was obtained by linear interpolation across the first upward crossing, and HRmax was the maximum of the processed heating-rate trace.
The extraction was checked against values reported by Barkholtz et al. [23]. Mean absolute deviations were 0.073 °C for ARC onset, 0.141 °C for the 1 °C·min−1 threshold temperature, and 0.030 °C·min−1 for HRmax. Because HRmax spanned several orders of magnitude, the cell-level kinetic metric used in the cross-scale analyses was transformed according to Equation (1). To keep the logarithm dimensionless, HRmax was normalized by 1 °C·min−1.
The Sandia thermal-analysis files were generated with a NETZSCH STA 449 F1 instrument (NETZSCH-Gerätebau GmbH, Selb, Germany). File metadata indicated a nominal heating rate of 15 K·min−1, alumina DSC/TG pans, and an exothermic signal direction of EXO = −1. Only the primary heating branch was retained; cooling segments and duplicate temperature points were excluded. Separate event-identification procedures were used for low-temperature anode reactions and high-temperature cathode decomposition.
For negative electrodes, the target was the earliest sustained low-temperature exothermic deviation rather than the dominant peak. The search was restricted to 50–180 °C. After interpolation and mild moving-average smoothing, the DSC derivative was calculated. The earliest sustained negative derivative departure from baseline was identified, followed by the local leading-edge inflection; the intersection of the local tangent and baseline defined the anode DSC onset. Conditions without a qualifying low-temperature exotherm were retained as missing rather than assigned an artificial onset.
For positive electrodes, the analysis targeted the primary decomposition event relevant to TR. Search intervals of 180–380 °C for LCO and NCA and 450–600 °C for LFP were used to exclude unrelated high-temperature secondary events. The leading-edge inflection of the strongest qualifying event was identified, and the tangent–baseline intersection defined the cathode decomposition onset. Accordingly, the extracted cathode DSC onset should be interpreted as an operational marker of the leading edge of the selected thermal event under the specified DSC protocol, rather than as a unique intrinsic reaction temperature or the temperature at which the cathode necessarily initiates whole-cell thermal runaway. To assess the robustness of the predefined event-search windows, the extraction was repeated using narrower intervals of 200–360 °C for LCO/NCA and 470–580 °C for LFP and wider intervals of 160–400 °C for LCO/NCA and 430–620 °C for LFP, while all other event-identification and processing procedures were kept unchanged. Event identity, cathode onset, event-specific apparent exothermic energy, and event-associated mass loss were then compared across the three window settings.
The trailing edge of the same cathode event was then used to define an event endset. A local event baseline was fitted using pre-event and post-event baseline regions surrounding the selected cathode event. A trailing inflection and tangent were identified; when their intersection with the fitted baseline was not physically valid, a sustained return toward the baseline was used instead. Qexo,event was calculated by integrating only the exothermic deviation of the measured DSC signal from this fitted baseline between the extracted onset and endset, as defined by Equation (2). The baseline construction and integrated event area are illustrated explicitly in Figure S2.
In Equation (2), q(T) and qbase(T) are the measured and baseline DSC signals, respectively, expressed in mW·mg−1, and β is the heating rate in K·s−1. Because 1 mW·mg−1 equals 1 W·g−1, the integrated quantity is expressed in J·g−1. It is reported as an apparent event-specific exothermic energy rather than an intrinsic thermodynamic enthalpy because it depends on the DSC configuration and event definition. Event-associated TGA mass loss was calculated using Equation (3). In Equation (3), m(T) is the normalized TGA mass expressed in %, so Δmevent is reported as mass loss (%). Extraction transparency and quality control are provided in the Supplementary Information: Figure S1 shows the physics-guided onset extraction across chemistry/SOC conditions, Figure S2 shows representative cathode event windows, and Table S1 lists the onset, peak, endset, integration result, endset method, and QC status for all nine charged cathode conditions.
where m(T) denotes the normalized TGA mass, and Δmevent represents the mass loss associated with the cathode thermal event between Tonset and Tendset.
Δmevent = m(Tonset) − m(Tendset)
The material-to-cell initiation gap, defined by Equation (4), was used to compare low-temperature anode instability with whole-cell self-heating onset.
where TARC,onset is the whole-cell ARC self-heating onset temperature and TDSC,onset(anode) is the low-temperature anode DSC onset. ΔTinit therefore represents the temperature gap between component-level anode instability and detectable whole-cell self-heating.
ΔTinit = TARC,onset − TDSC,onset(anode)
Cathode DSC onset, Qexo,event, and Δmevent were compared with the cell-level kinetic metric S defined by Equation (1). The cathode analysis was restricted to charged conditions because the 0% SOC cathode datasets did not consistently contain a comparable TR-relevant event within the predefined chemistry-specific windows.
2.3. Independent Dataset and Statistical Analysis
The independently generated dataset reported by Kvasha et al. [24] provided the cross-study comparison. It included NCA/graphite (Cell A), LFP/graphite (Cell B), and NCA/LTO (Cell C) cells at 0%, 50%, and 100% SOC. Whole-cell ARC results included self-heating onset, HRmax, and final adiabatic temperature. For the present analysis, positive-electrode–electrolyte and negative-electrode–electrolyte DSC onset temperatures and reaction enthalpies were taken directly from Tables 4–6 of the original study [24]; no curve digitization was required. The reported reaction enthalpies are normalized to the mass of the solid electrode material [24]. These ΔH values are not physically identical to the event-specific Qexo,event extracted from the Sandia cathode traces. Accordingly, the cross-study analysis tests consistency of the broader descriptor class of cathode-associated exothermic magnitude, not numerical equivalence of the two calorimetric metrics.
In the Kvasha protocol, harvested electrodes were mixed with LP30 electrolyte at a 2:1 solid-to-electrolyte mass ratio, sealed in high-pressure stainless-steel DSC capsules with gold covers, and heated from 30 to 350 °C at 5 °C·min−1 [24]. Because this protocol differs substantially from the Sandia measurements, absolute Sandia Qexo,event and Kvasha ΔH values were not pooled in a single regression.
All statistical analyses were prespecified as descriptive association analyses rather than inferential hypothesis tests because the number of chemistry–SOC conditions was small and repeated SOC observations within a given commercial cell family were not independent experimental replicates. Accordingly, the reported sample sizes refer to chemistry–SOC conditions rather than independent observations, and no inferential p-values were calculated. Pearson correlation coefficients were used to summarize the direction and strength of linear descriptor–response correspondence with the dimensionless whole-cell self-heating metric S defined by Equation (1).
In this study, “whole-cell self-heating kinetics” refers specifically to HRmax, which was selected as the primary cell-level response because it provides a continuous kinetic descriptor available in both analyzed datasets and permits direct comparison across charged conditions; it should not be interpreted as a comprehensive measure of fire, gas, pressure, total-energy, or final-temperature severity. To reduce the overall SOC effect when comparing chemistries, matched-SOC centering was applied using Equation (5) for the material descriptor and Equation (6) for the cell-level metric.
In Equations (5) and (6), xc,s and yc,s denote the material-scale descriptor and corresponding whole-cell metric, respectively, for chemistry c at SOC level s. The quantities and are the mean descriptor and whole-cell values, respectively, calculated across all chemistries available at the same SOC level. Thus, and represent chemistry-specific deviations from the corresponding SOC-level means. Correlation between the centered variables was used descriptively to examine cross-chemistry correspondence after removal of the common SOC-level shift. This transformation does not create independent observations, remove chemistry clustering, establish causality, or constitute a conventional covariate-adjusted estimate. SOC-centering was performed separately within each dataset because the available SOC grids and experimental protocols differed. Within-chemistry centering was also examined as an additional sensitivity analysis.
Spearman rank correlations were additionally calculated to assess whether the qualitative conclusions depended on linear scaling or were disproportionately influenced by extreme values. Sensitivity to the choice of whole-cell response scale was further examined by repeating the matched-SOC analysis using square-root-transformed and untransformed HRmax, in addition to the primary logarithmic response defined by Equation (1). Huber M-estimation was also applied to the SOC-centered standardized variables under the primary logarithmic response as an outlier-resistant sensitivity analysis. Consistency in the direction and overall interpretation of the associations across Pearson, rank-based, alternative-response-scale, and robust-regression analyses was interpreted as qualitative robustness rather than statistical significance. These sensitivity analyses were not used for inferential model comparison. Leave-one-condition-out, leave-one-SOC-out, and leave-one-chemistry-out linear-model evaluations were used separately as extrapolation stress tests and were not interpreted as stable estimates of out-of-sample predictive performance.
3. Results and Discussion
3.1. Whole-Cell and Component-Level Thermal Response
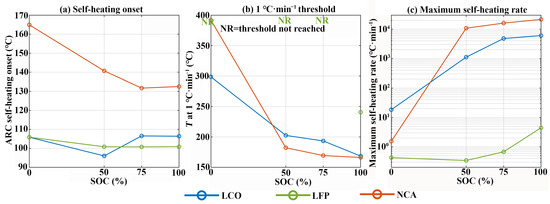
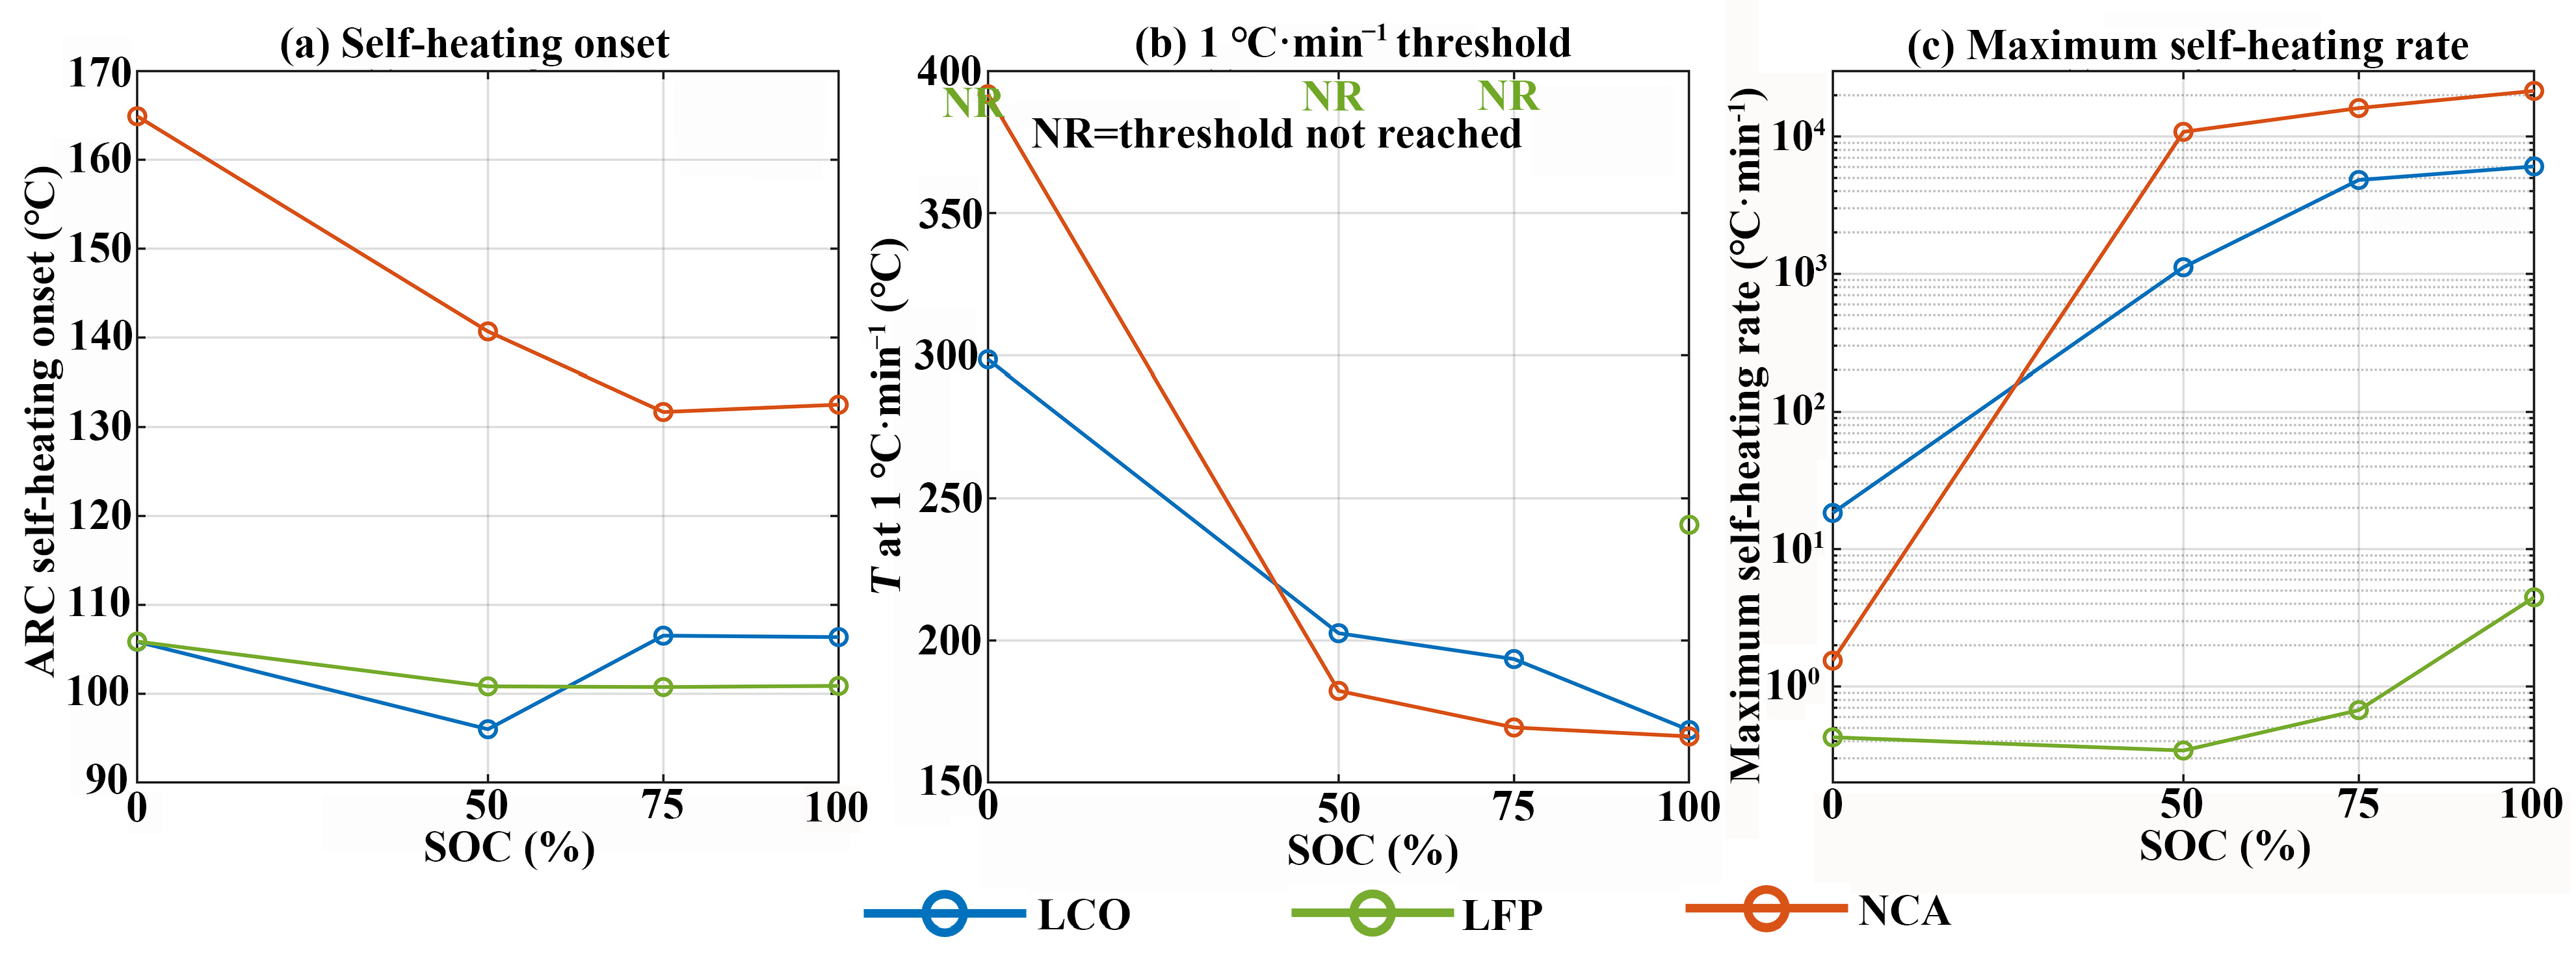
The ARC data showed strong chemistry- and SOC-dependent differences in whole-cell self-heating kinetics (Figure 2). For LCO, HRmax increased from 18.36 °C·min−1 at 0% SOC to 1116.88, 4822.30, and 6053.53 °C·min−1 at 50%, 75%, and 100% SOC, respectively. NCA showed a stronger response, rising from 1.54 °C·min−1 at 0% SOC to 10,810.30 °C·min−1 at 50% SOC and 21,480.45 °C·min−1 at 100% SOC. LFP remained much lower across the SOC range, with HRmax below 5 °C·min−1. Several LFP conditions did not reach the 1 °C·min−1 threshold shown in Figure 2b. Therefore, the primary continuous outcome is described throughout as whole-cell self-heating kinetics rather than assuming that every condition reached the same TR regime.
Figure 2.
Chemistry- and SOC-dependent whole-cell thermal response from ARC measurements. (a) ARC self-heating onset temperature. (b) Temperature at which the HR first reached 1 °C·min−1; NR indicates that the threshold was not reached. (c) HRmax on a logarithmic scale.
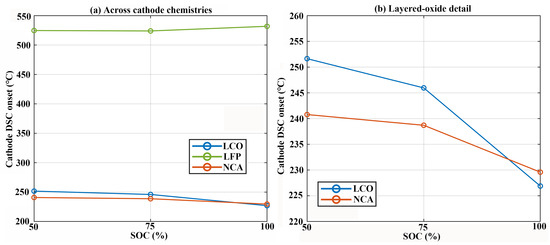
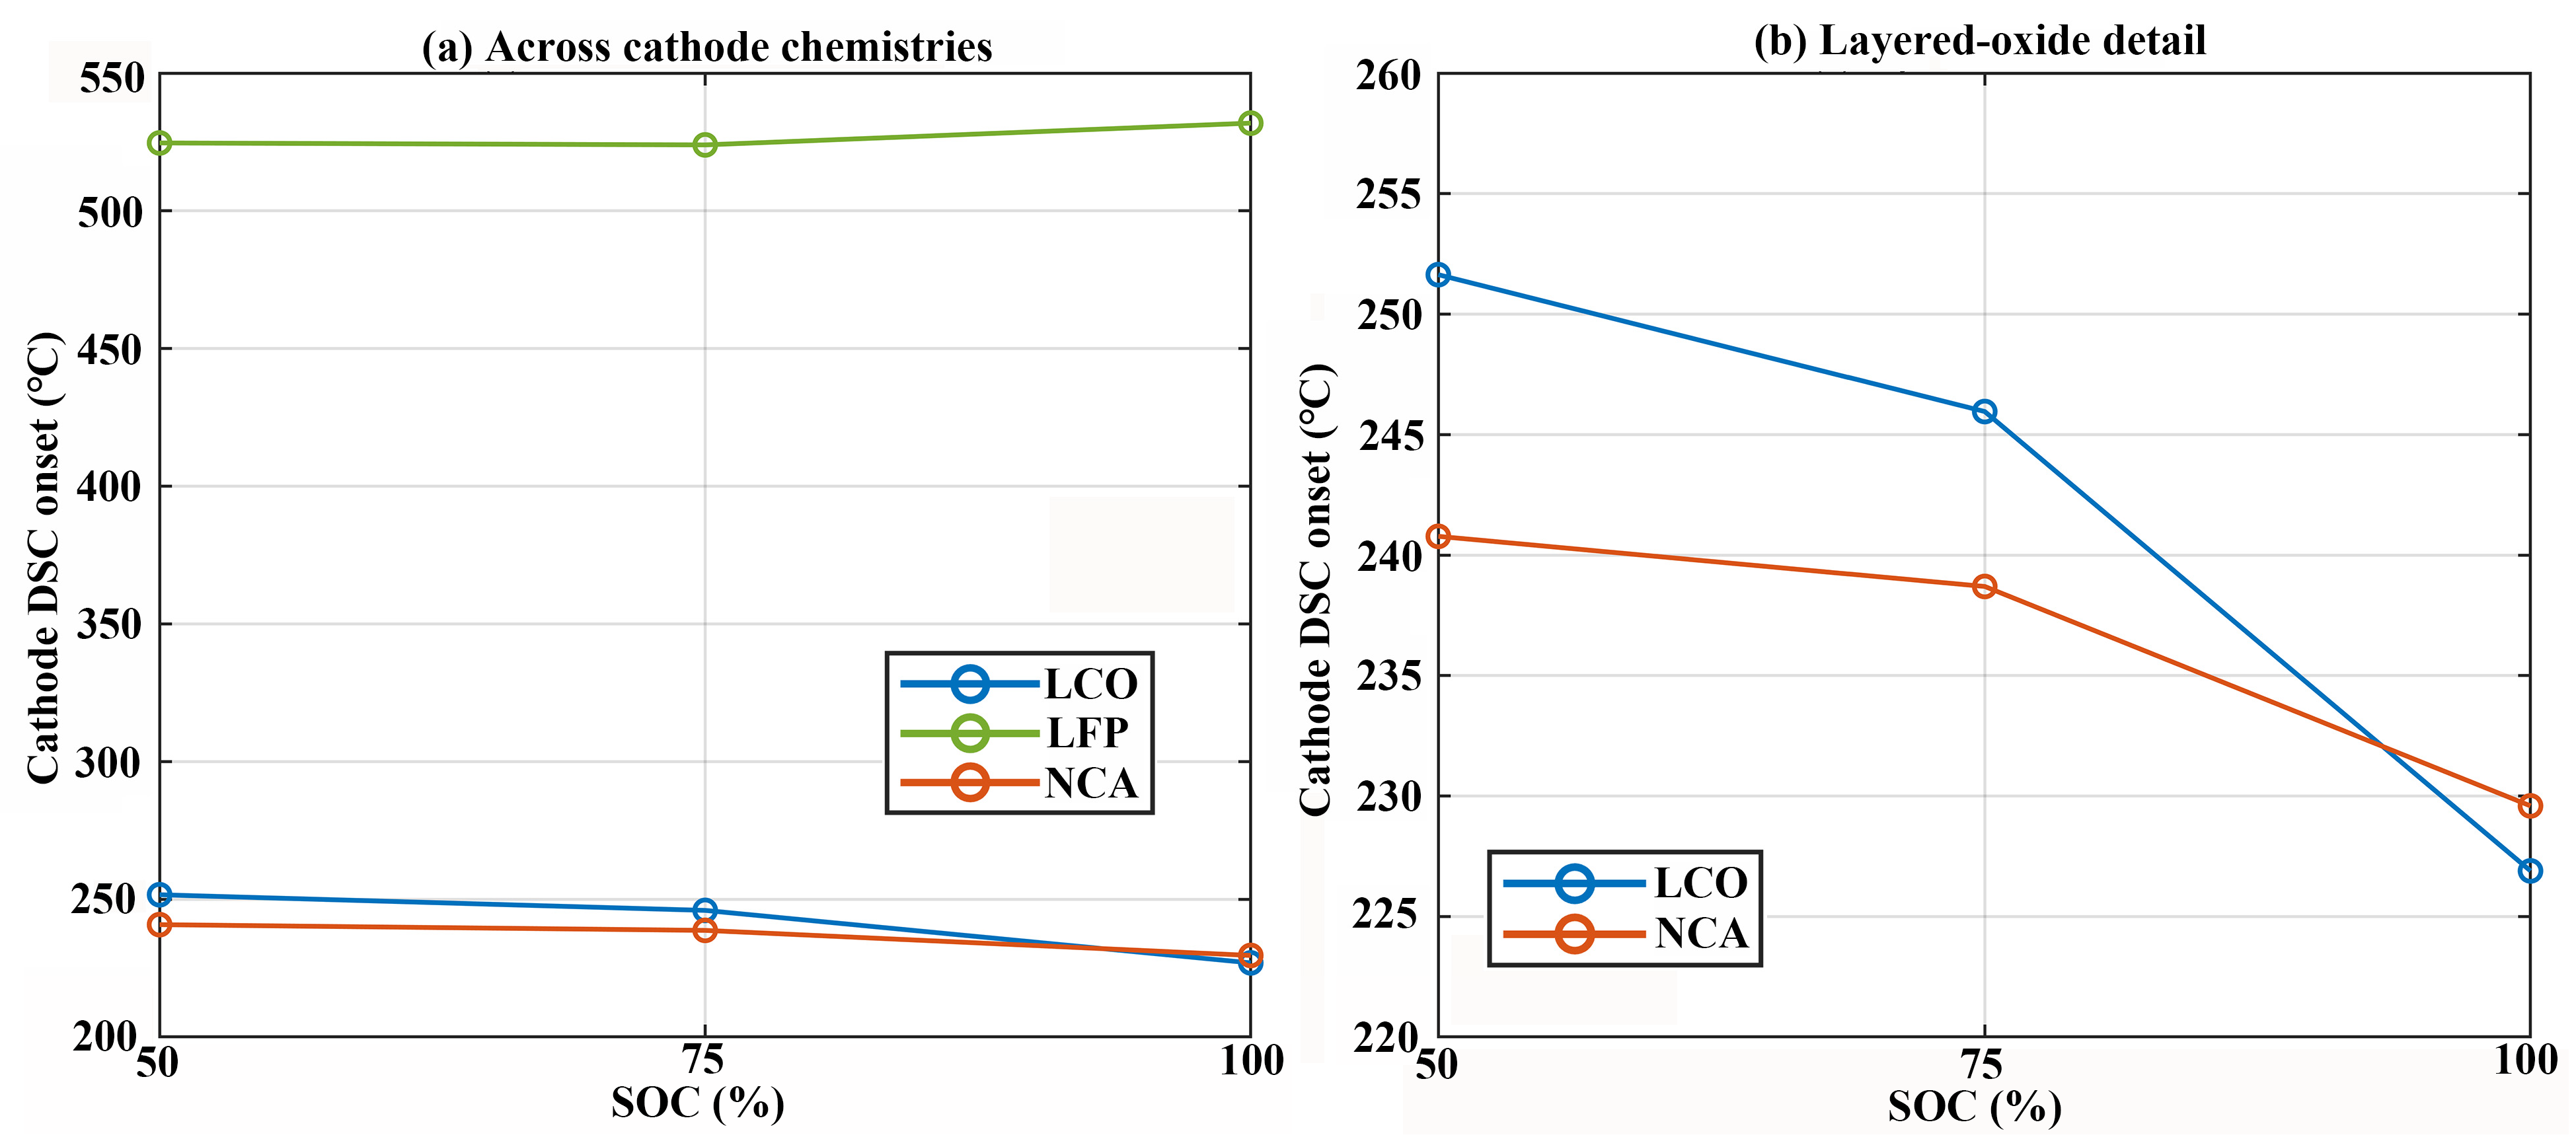
Cathode DSC onset also differed sharply by chemistry (Figure 3). For charged LCO electrodes, the primary decomposition onset decreased from about 251.6 °C at 50% SOC to 226.9 °C at 100% SOC; NCA decreased from about 240.8 to 229.6 °C. LFP remained much more stable, with onset temperatures of approximately 524–532 °C across the charged states. The gap between LFP and the layered oxides therefore exceeded 250 °C.
Figure 3.
SOC-dependent cathode thermal stability from DSC measurements. (a) LCO, LFP, and NCA over the full temperature range. (b) Enlarged view of the layered-oxide cathodes, LCO and NCA.
The separation between LFP and the layered oxides is consistent with their distinct crystal chemistry. Upon heating, highly delithiated layered oxides undergo transition-metal migration, lattice-oxygen release, and progressive reconstruction from layered to spinel- and rock-salt-like structures, whereas the strongly bonded polyanionic phosphate framework of LFP substantially suppresses oxygen evolution and confers greater thermal stability [29,30,31]. The crossover at 100% SOC is consistent with the increased instability of highly delithiated LCO: extensive Li removal destabilizes the Co–O layered framework, promotes phase reconstruction and lattice-oxygen release, and can therefore shift the first major exothermic event to lower temperature. Under the present DSC protocol, this high-delithiation effect was sufficient for the LCO onset (226.9 °C) to fall slightly below that of NCA (229.6 °C) [23,32]. The LCO–NCA comparison provides a particularly clear counterexample to a simple onset-based scaling relationship. At 100% SOC, the extracted cathode onsets differed by only 2.70 °C (226.89 °C for LCO versus 229.59 °C for NCA), whereas the corresponding HRmax values differed by approximately 3.55-fold (6053.53 versus 21,480.45 °C·min−1). Thus, similar cathode-event onset temperatures can coexist with markedly different whole-cell self-heating intensities. This quantitative contrast demonstrates that cathode onset temperature alone is insufficient to characterize the magnitude of the subsequent cell-level thermal response. Accordingly, the observed association between cathode onset and HRmax should be interpreted as cross-condition correspondence rather than evidence that onset temperature causally determines whole-cell self-heating kinetics [32,33].
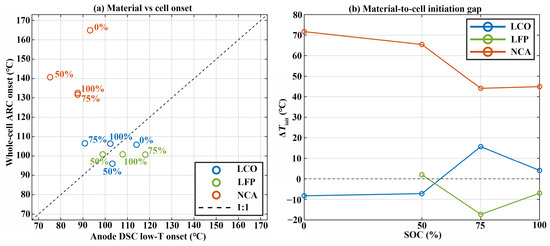
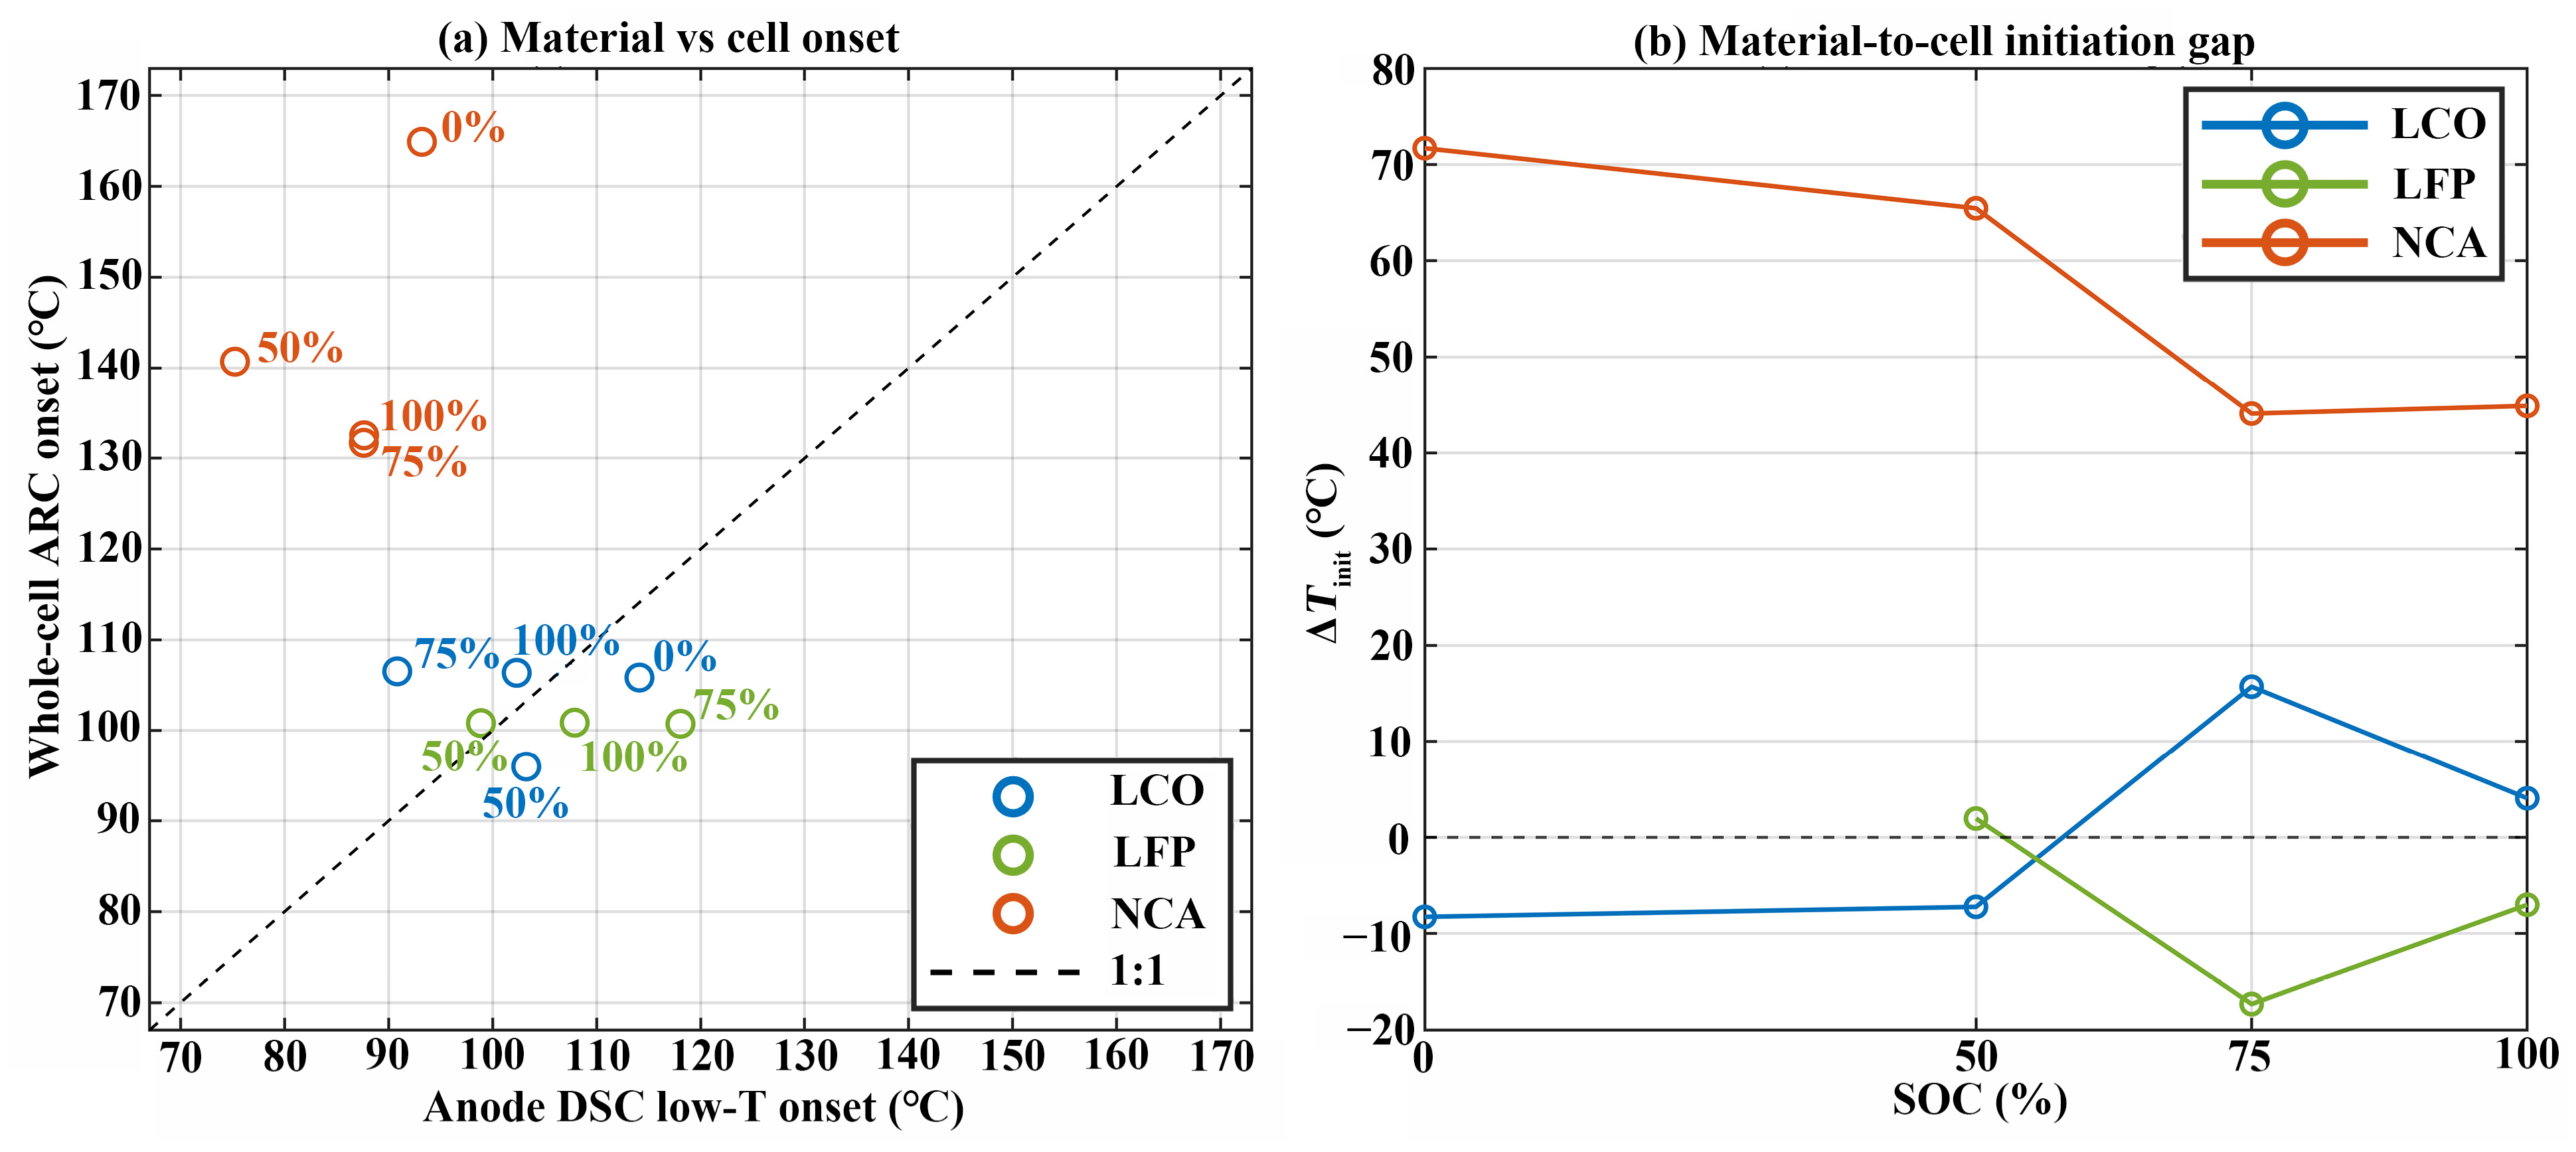
The initiation gap defined by Equation (4) was used to compare low-temperature anode DSC onset with whole-cell ARC onset (Figure 4). No common component-to-cell offset was evident. For NCA at 50%, 75%, and 100% SOC, anode DSC onset occurred at approximately 75.2, 87.6, and 87.7 °C, whereas the corresponding ARC onsets were 140.7, 131.7, and 132.5 °C. The resulting ΔTinit values were about 65, 44, and 45 °C, respectively. For LCO, ΔTinit showed a non-monotonic pattern, changing from approximately −7 °C at 50% SOC to +15 °C at 75% SOC and then to about +4 °C at 100% SOC. Because the LCO whole-cell ARC onset changed little between 75% and 100% SOC (106.53 versus 106.36 °C), the 75% feature is primarily associated with a lower extracted low-temperature anode DSC onset rather than with the high-temperature cathode decomposition event. The available data do not, however, allow this shift to be assigned specifically to SEI decomposition rather than to another anode–electrolyte process.
Figure 4.
Material-to-cell initiation relationship. (a) Anode DSC onset versus whole-cell ARC onset; the dashed line denotes equality. (b) Material-to-cell initiation gap, ΔTinit, versus SOC.
This offset is expected because isolated DSC and intact-cell ARC use different samples, heating histories, and operational definitions of onset. DSC detects reactions in a small externally heated specimen, whereas ARC records self-heating of the complete cell once the instrument’s detection criterion is met under near-adiabatic conditions. Electrode–electrolyte interactions and inter-electrode crosstalk can also change the reaction sequence and heat release relative to isolated components [16,17], and DSC onset itself depends on heating rate and crucible configuration [21]. Kvasha et al. [24] likewise found no direct mapping between separated-component DSC onset and whole-cell ARC onset. Component onset should therefore be treated as an operational, context-dependent descriptor rather than a fixed proxy for whole-cell initiation. In particular, the cathode DSC onset used here identifies the leading edge of a selected exothermic event under a prescribed heating program and sample configuration. It does not identify a unique microscopic reaction threshold, nor does temporal or statistical correspondence with whole-cell ARC behavior demonstrate that this cathode event causally triggers the subsequent cell-level response.
3.2. Cathode Descriptor Associations and Transferability
The Sandia dataset was used to compare two complementary cathode descriptors: the temperature at which the primary decomposition event begins and the magnitude of that event. These quantities describe different aspects of thermal instability, and literature-scale analyses likewise distinguish reaction initiation from heat-release characteristics [20,21,22,25]. Cathode onset, event-specific apparent exothermic energy, and event-associated mass loss were extracted from the same raw traces, allowing their cell-level associations to be compared on a common basis. Event-associated mass loss was treated as a secondary within-Sandia descriptor of the mass change accompanying the selected cathode thermal event; because no directly comparable event-matched mass-loss metric was available in the Kvasha dataset, it was not used as a primary cross-dataset transferability descriptor. Table 2 summarizes the charged-state metrics.
Table 2.
Key charged-state Sandia cross-scale metrics used for the cathode kinetic analysis.
Sensitivity analysis of the predefined chemistry-specific event-search windows showed that all nine charged chemistry–SOC conditions retained the same primary cathode event under both narrower and wider search intervals. Consequently, the extracted cathode onset temperatures, event-specific apparent exothermic energies, and event-associated mass losses were unchanged across the three window settings. The corresponding matched-SOC correlations also remained unchanged at r = −0.983 for cathode onset and r = 0.980 for Qexo,event (Table S4). These results indicate that the principal Sandia associations were not sensitive to reasonable perturbations of the predefined event-search boundaries.
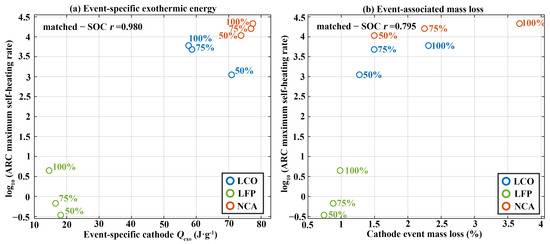
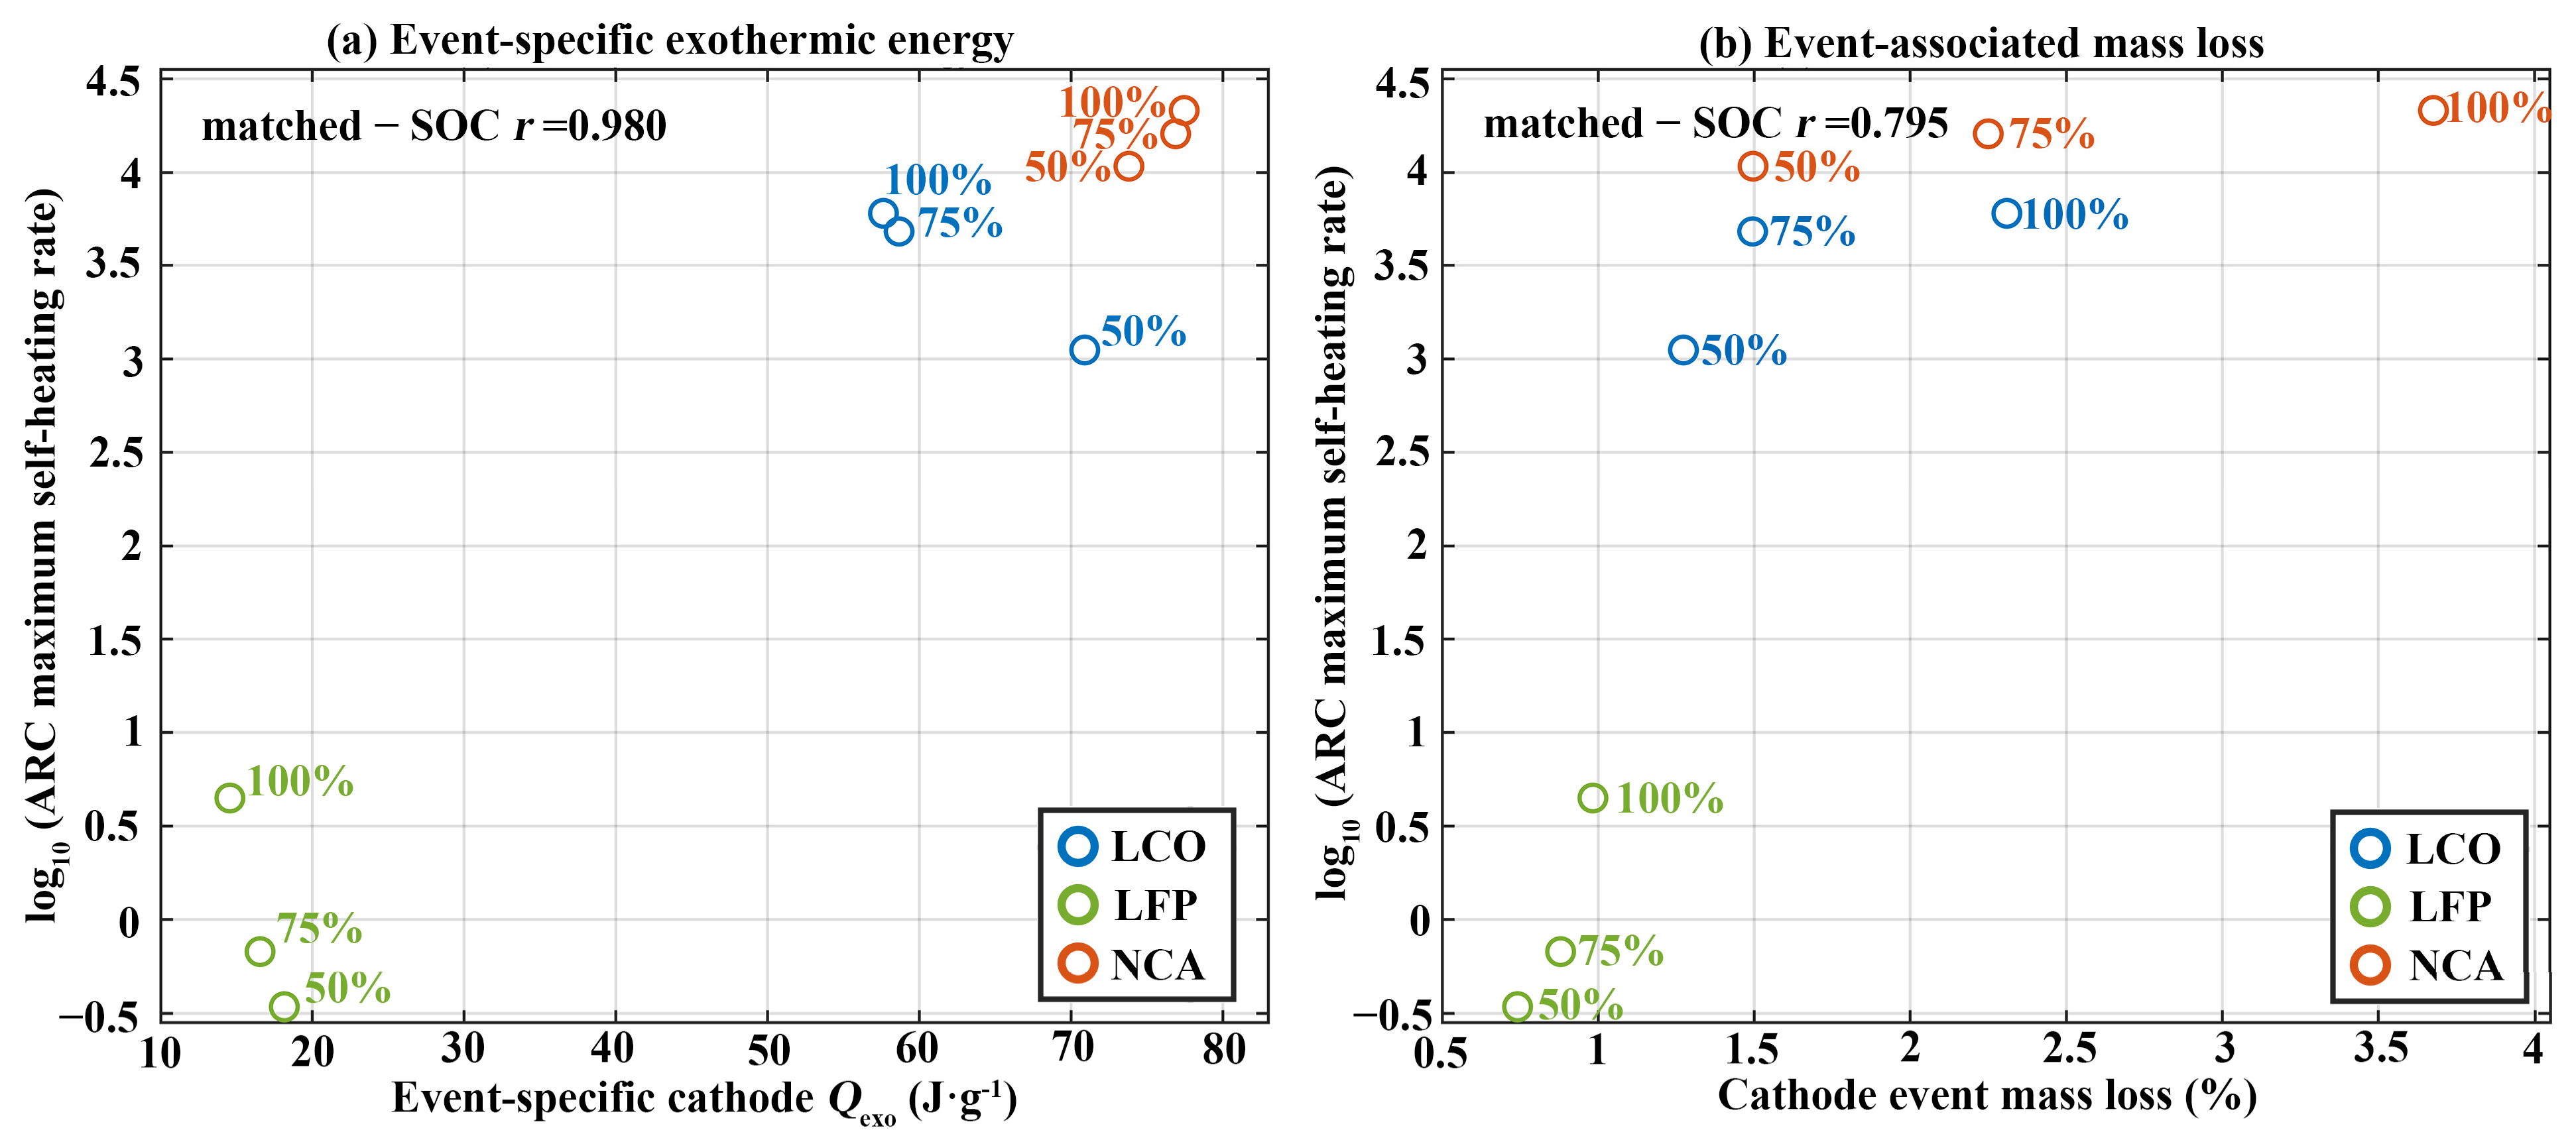
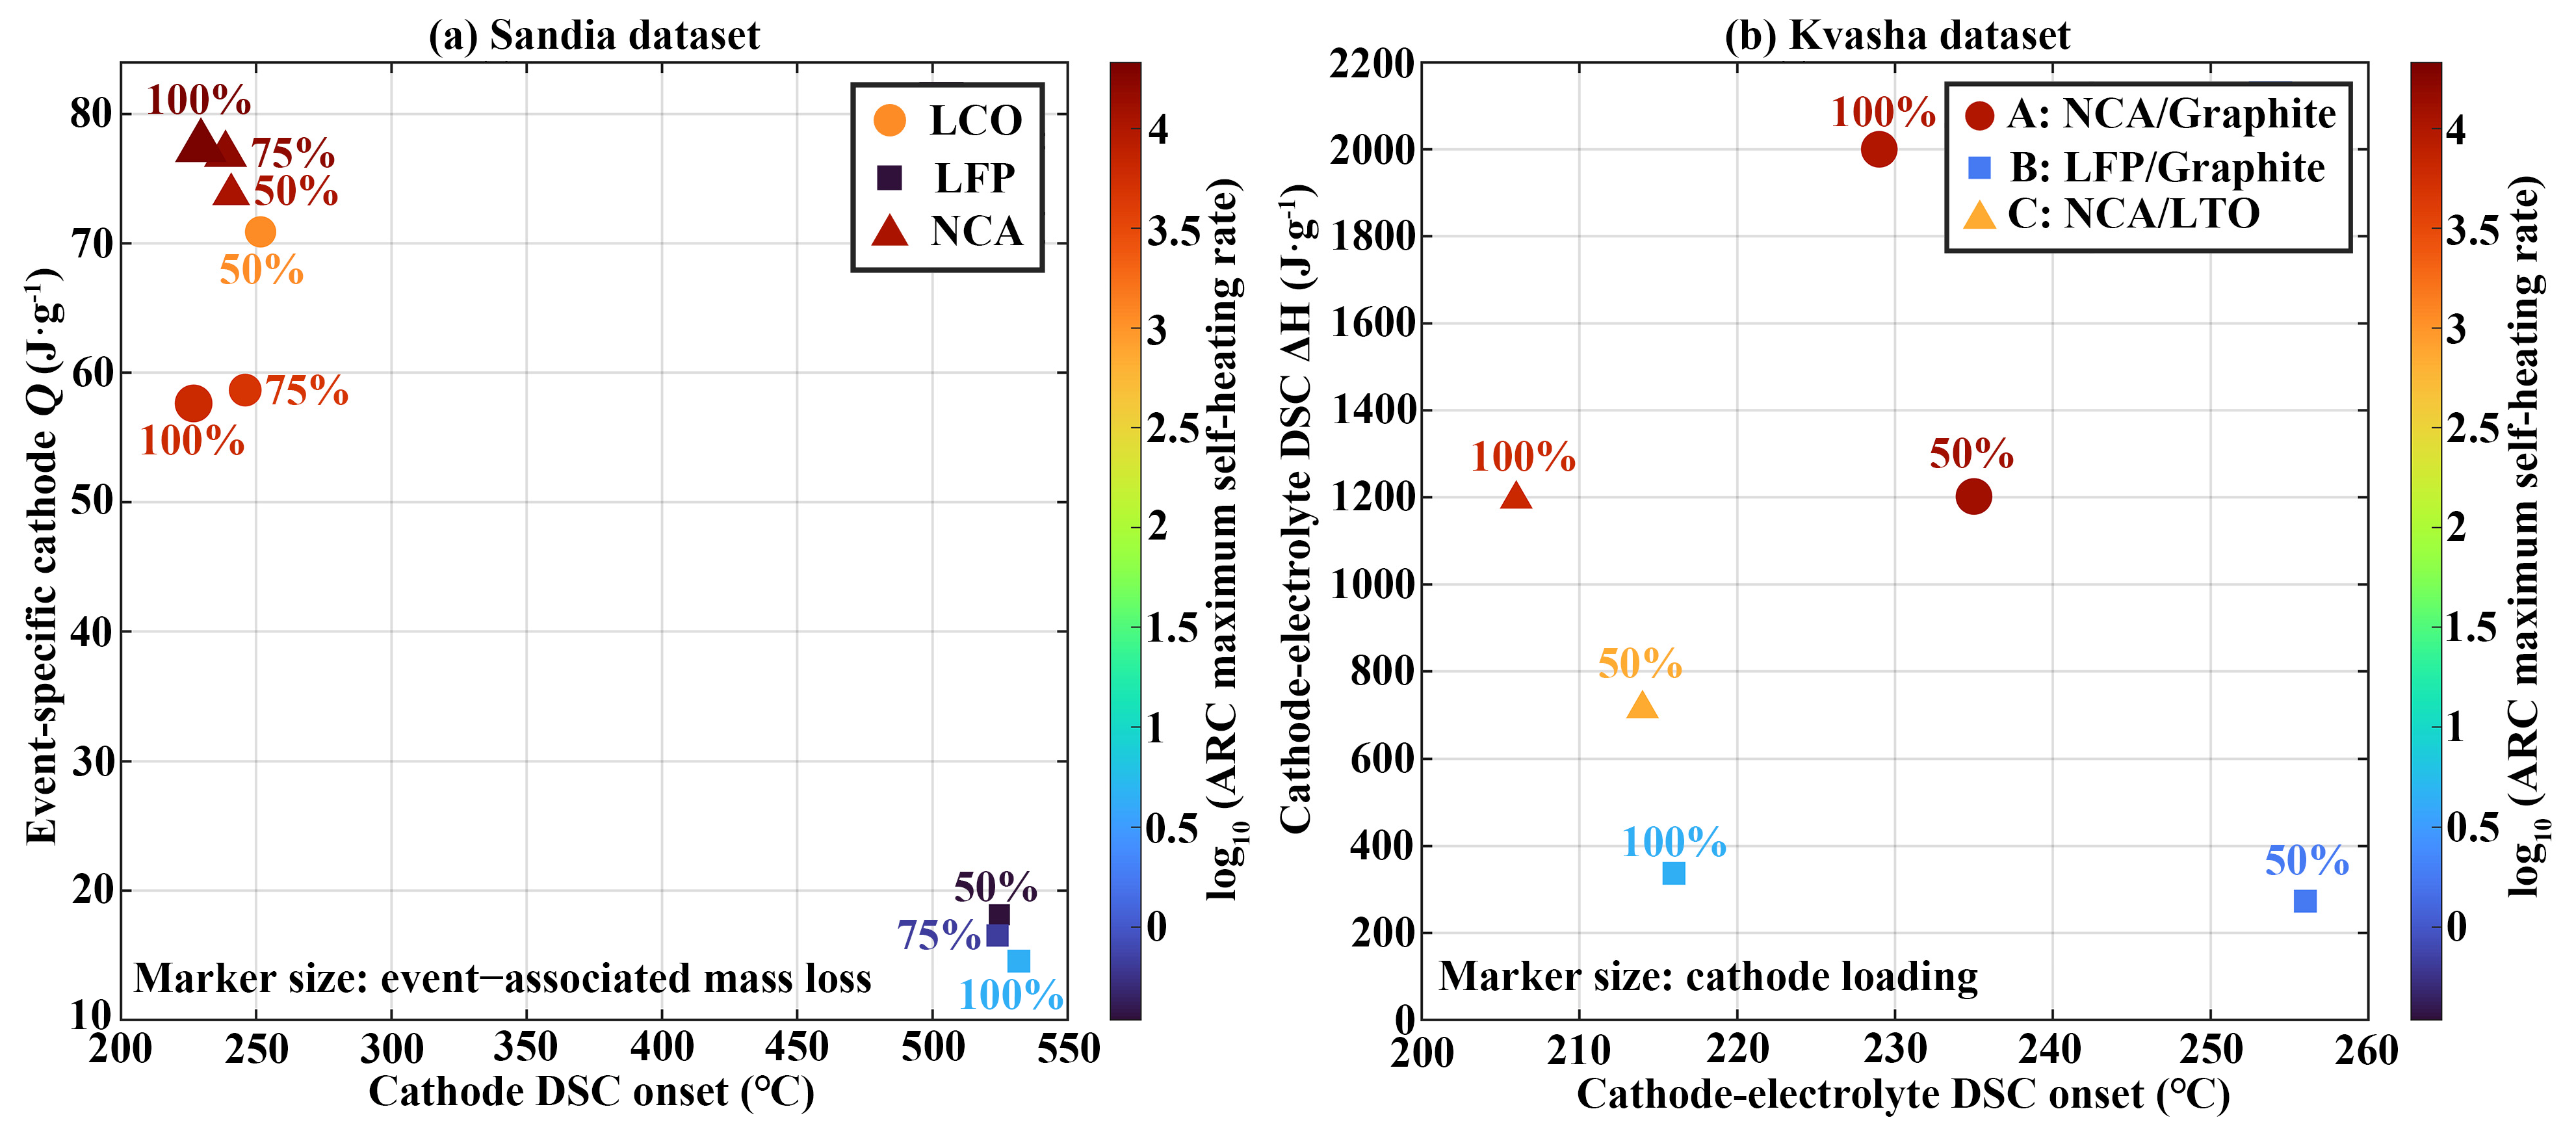
Both onset temperature and reaction magnitude showed clear chemistry-level separation (Figure 5). LFP Qexo,event values were approximately 18.1, 16.5, and 14.6 J·g−1 at 50%, 75%, and 100% SOC, respectively. LCO values were 70.9, 58.7, and 57.6 J·g−1, and NCA values were 73.8, 76.9, and 77.4 J·g−1. Event-associated mass loss showed a similar pattern: NCA increased from about 1.50% at 50% SOC to 3.68% at 100% SOC, whereas LFP remained below 1%. LFP was therefore distinguished not only by its high decomposition temperature but also by a weaker thermal event within the Sandia protocol.
Figure 5.
Cathode reaction magnitude and whole-cell self-heating kinetics in the Sandia dataset. (a) Event-specific apparent exothermic energy versus S from Equation (1). (b) Event-associated cathode mass loss versus S. Matched-SOC Pearson correlations are shown in each panel.
Within the nine charged Sandia conditions, both cathode descriptors had large Pearson coefficients with S. Cathode onset gave pooled and matched-SOC values of r = −0.975 and −0.983, while Qexo,event gave r = 0.954 and 0.980. These coefficients are descriptive summaries of chemistry–SOC conditions, not estimates from nine independent replicates. Accordingly, differences between correlation coefficients are interpreted descriptively and are not presented as formal statistical comparisons between competing descriptors. Moreover, these associations should not be interpreted as evidence that either cathode descriptor causally determines whole-cell HRmax. Rank-based sensitivity analysis supported the same qualitative pattern: matched-SOC Spearman ρ was −0.733 for cathode onset and 0.833 for Qexo,event (Table S2). The descriptor–response pattern was also preserved when the whole-cell response scale was changed. Using , the matched-SOC Pearson coefficients were r = −0.851 for cathode onset and r = 0.919 for Qexo,event; using untransformed HRmax, the corresponding values were −0.684 and 0.810. Thus, although the absolute coefficient magnitudes depended on response scaling, the direction and qualitative interpretation of both associations were preserved. Huber M-estimation applied to the SOC-centered standardized variables under the primary logarithmic response likewise retained a negative onset relationship and a positive reaction-magnitude relationship (Table S5). Together, the rank-based, alternative-response-scale, and robust-regression analyses indicate that the principal qualitative conclusions are not specific to the logarithmic transformation or disproportionately driven by extreme observations. Table 3 summarizes the primary Pearson association results.
Table 3.
Cross-scale descriptor association summary.
This robustness should not, however, be interpreted as evidence of a universal within-chemistry scaling relationship. The large coefficients are driven in part by separation among chemistries: a descriptor may discriminate effectively between broad chemistry classes without providing a monotonic or proportional relationship within a given chemistry as SOC changes. For example, in LCO, Qexo,event decreased from 50% to 100% SOC while HRmax increased substantially. Chemistry-specific trajectories therefore cannot be assumed to follow the pooled cross-chemistry trend. Matched-SOC centering reduces the common SOC-level shift across chemistries, but it does not remove repeated-measures structure or chemistry clustering and does not convert the available conditions into independent replicates. Accordingly, the large pooled and SOC-centered coefficients are best interpreted as evidence of between-chemistry discrimination within the present dataset rather than as evidence of a universal within-chemistry scaling law. Because measured DSC heat release is additionally sensitive to electrolyte content, heating rate, and containment conditions [32,34], a single material-level descriptor should not be assumed to uniquely determine the whole-cell thermal response of a given cell design [35].
The leave-one-chemistry-out stress test provided a direct check of this limitation. Evaluation was unstable for all three Sandia linear models, indicating that relationships that appear strong when all chemistries are represented do not extrapolate reliably when an entire chemistry family is withheld. Because only three chemistry families were available, the detailed leave-one-condition, leave-one-SOC, and leave-one-chemistry RMSE values are reported in Supplementary Table S3 rather than treated as primary performance estimates. This distinction is important as machine-learning models increasingly achieve accurate prediction of cathode-level DSC metrics across compositional spaces [22,25]; however, such material-level predictive accuracy does not by itself establish transferable prediction of intact-cell self-heating kinetics, which additionally depend on coupled reaction kinetics, thermal transport, geometry, and boundary conditions [36,37].
3.3. Cross-Dataset Consistency and Implications
Cross-dataset consistency was examined using the independently generated Kvasha dataset as an external consistency test rather than as a formal validation dataset. The dataset includes NCA/graphite, LFP/graphite, and NCA/LTO cells measured by ARC together with electrode–electrolyte DSC at 0%, 50%, and 100% SOC [24]. Because the Kvasha and Sandia datasets differ in cell configuration, sample composition, electrolyte content, containment, heating rate, and calorimetric protocol, the comparison was intended only to assess whether the direction and relative strength of material-to-cell associations persisted under heterogeneous experimental conditions. Accordingly, the Kvasha dataset should not be interpreted as a matched-design replication, quantitative external validation, or evidence of predictive transferability; the latter would require prospective validation under harmonized measurement conditions.
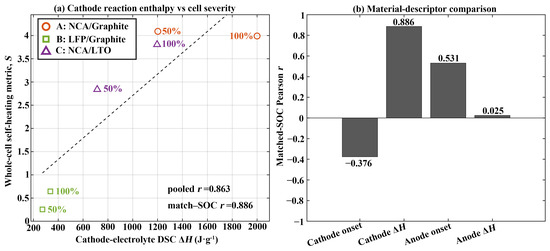
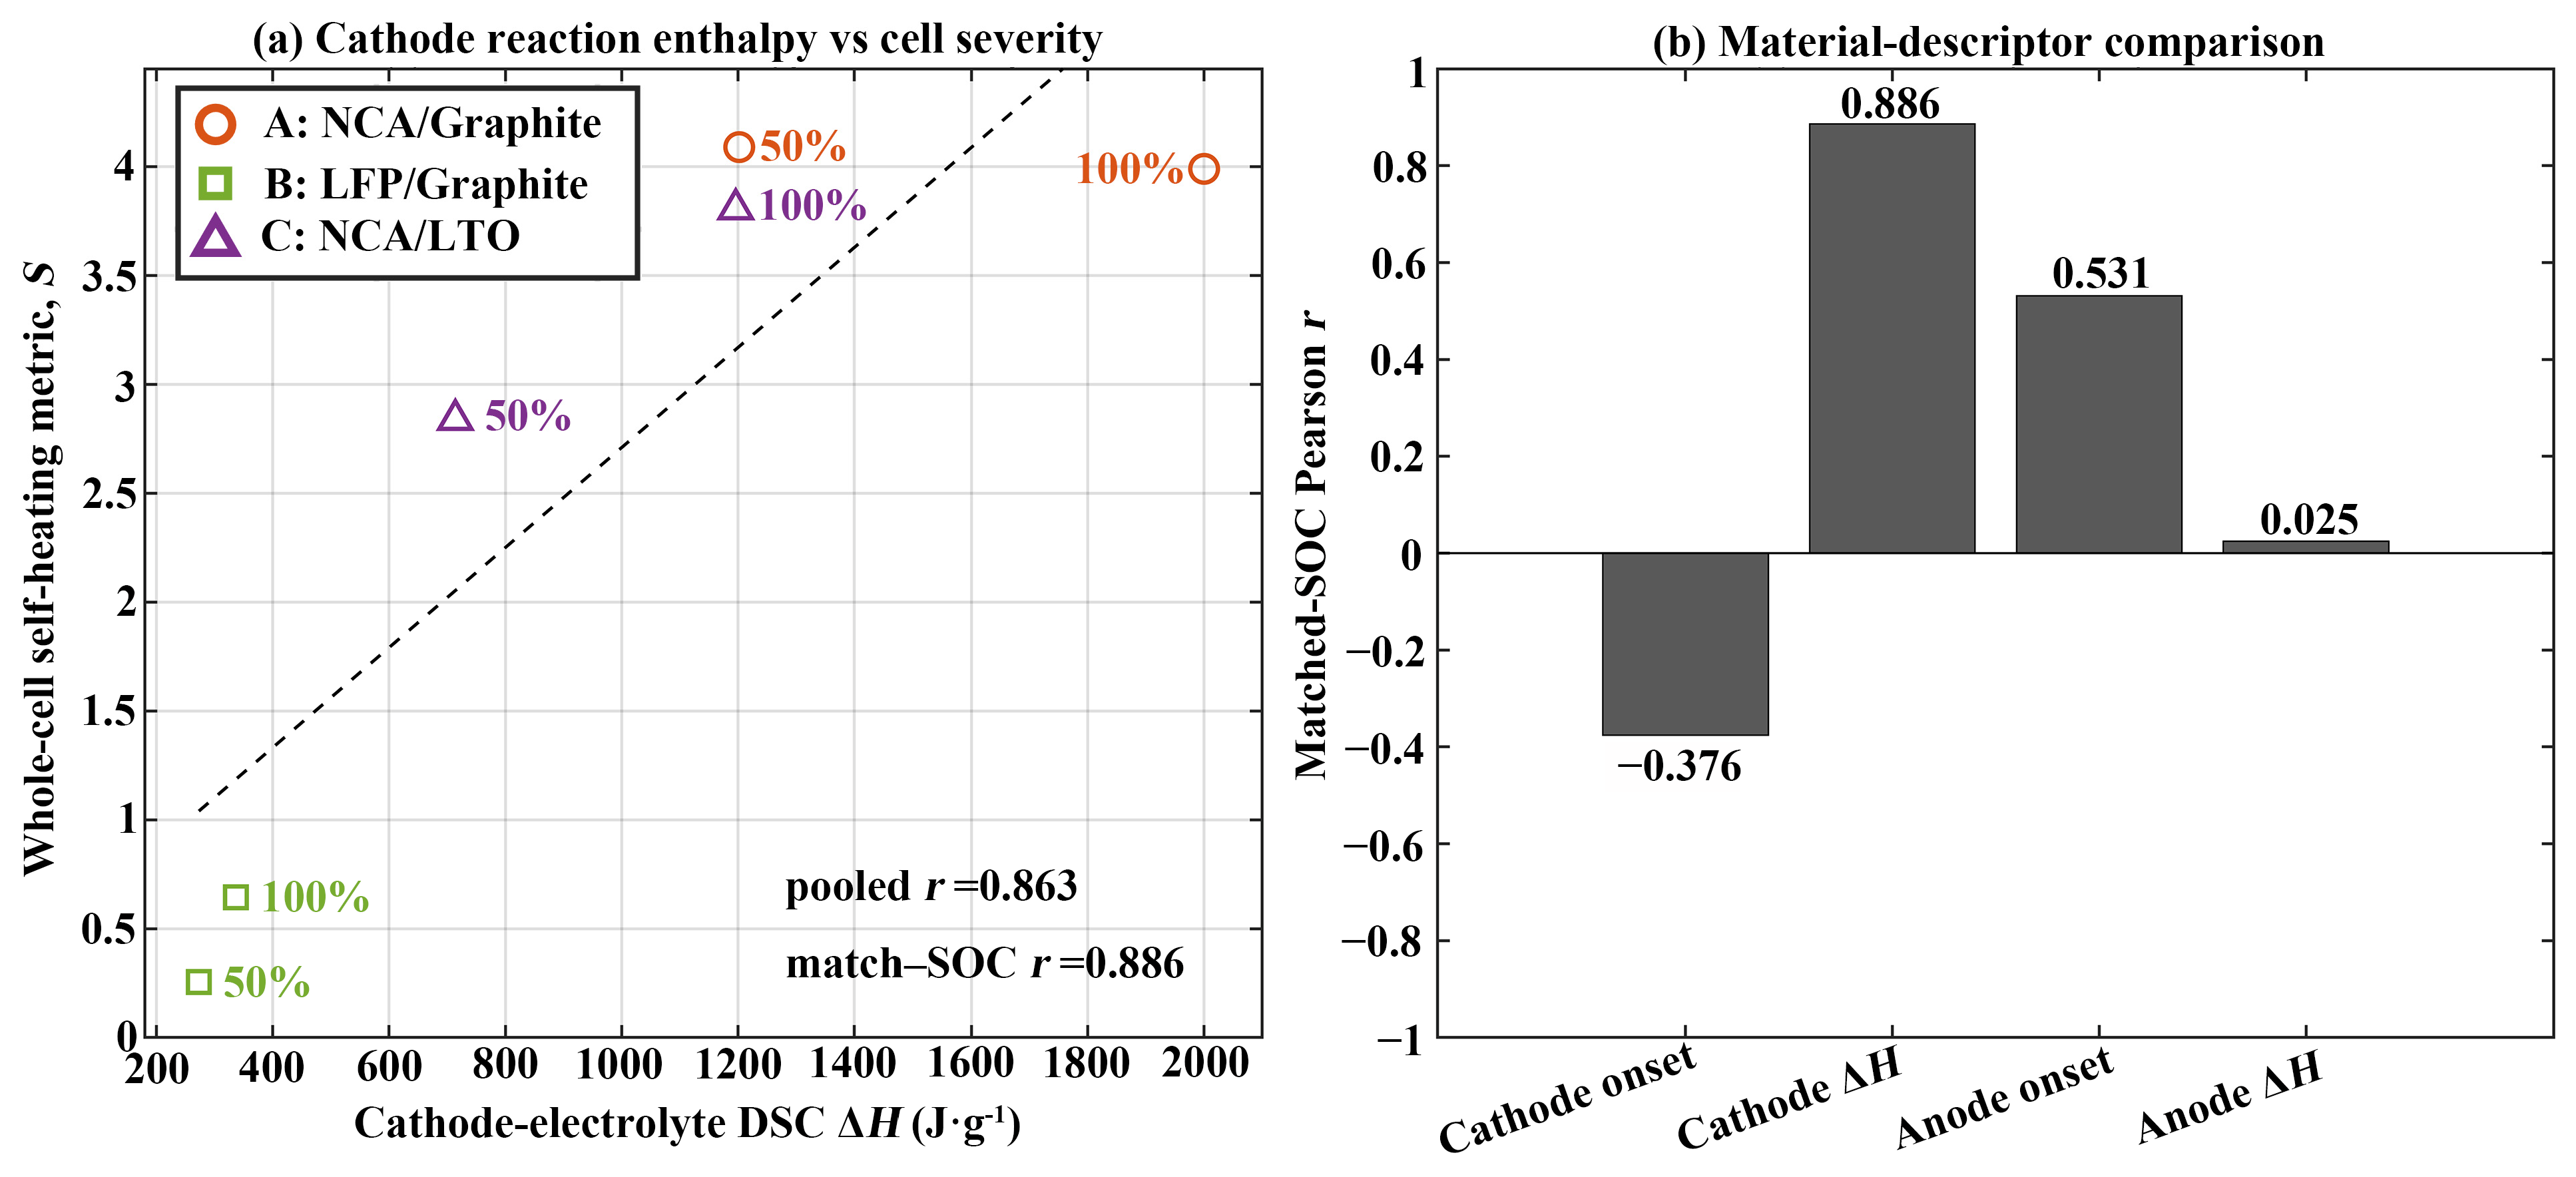
The Kvasha data showed a clear difference between onset temperature and cathode-associated reaction magnitude (Figure 6). For the six charged conditions, cathode–electrolyte onset had a pooled correlation of r = −0.384 with S and a matched-SOC correlation of r = −0.376, much smaller in magnitude than the matched-SOC Sandia value of r = −0.983. Cathode–electrolyte reaction enthalpy, in contrast, gave pooled and matched-SOC correlations of r = 0.863 and 0.886. Spearman sensitivity analysis strengthened the same contrast: matched-SOC ρ was 0.086 for cathode onset and 0.943 for cathode–electrolyte ΔH (Table S2). Given the small and clustered dataset, these values remain descriptive. Within that limitation, the onset relationship seen in Sandia was not reproduced to the same extent, whereas the positive association between cathode-associated exothermic magnitude and HRmax remained prominent.
Figure 6.
Cross-study comparison using the Kvasha et al. dataset. (a) Cathode–electrolyte DSC reaction enthalpy versus S from Equation (1) for charged conditions. (b) Matched-SOC Pearson correlations between S and cathode/anode onset and reaction-enthalpy descriptors.
Consistent with its role as an external consistency test, the comparison between the two studies should be made at the descriptor-class level rather than by treating their calorimetric quantities as numerically equivalent. Sandia Qexo,event was obtained by event-specific integration of raw cathode DSC traces, whereas Kvasha reported electrode–electrolyte reaction enthalpy from sealed high-pressure DSC capsules. The measurements therefore differ in sample composition, containment, and reaction scope, in addition to heating rate and test protocol [20,21,22]. Absolute onset and heat-release values were not pooled, and SOC-centering was performed separately within each study. The main cross-study observation is consequently qualitative and descriptive: cathode-associated exothermic magnitude retained a large association with S in both datasets, whereas the onset-based relationship was much less consistent.
This greater consistency does not make cathode reaction magnitude a unique determinant of intact-cell kinetics. In Kvasha Cell A, cathode–electrolyte enthalpy increased from 1202 J·g−1 at 50% SOC to 2000 J·g−1 at 100% SOC, while HRmax decreased from 12,309 to 9780 °C·min−1. Electrode crosstalk, anode chemistry, electrolyte reactivity, loading, geometry, and cell thermal properties can all alter runaway behavior even when the broad cathode chemistry is unchanged [16]. Full-cell safety metrics therefore remain properties of the complete cell rather than of the cathode alone [19].
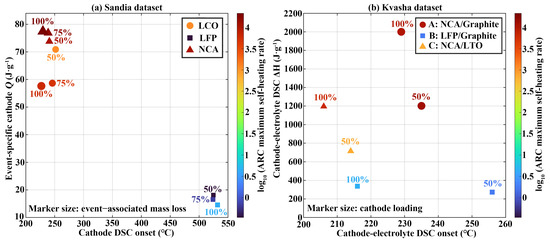
The two datasets support treating onset temperature and reaction magnitude as distinct, complementary material-scale descriptors rather than as components of a single protocol-independent map of whole-cell behavior (Figure 7). In the Sandia dataset, LFP occupied a high-onset, low-Qexo,event region relative to LCO and NCA. In the Kvasha electrode–electrolyte dataset, however, the absolute onset temperatures shifted substantially, and LFP was not consistently higher than the NCA-based configurations, highlighting the protocol sensitivity of onset. By contrast, reaction magnitude preserved a more consistent broad chemistry ordering, with LFP remaining below the NCA-based configurations at the charged states examined. Accordingly, Figure 7 is interpreted as a within-study comparison of complementary thermal descriptors rather than as a universal cross-study material-space boundary. Because the Sandia and Kvasha measurements differed in calorimetric protocol and sample configuration, absolute onset and heat-release values were not directly compared across studies. Accordingly, the apparent robustness of reaction magnitude should be interpreted as robustness of a descriptor class rather than of a numerically transferable calorimetric quantity.
Figure 7.
Cross-study cathode thermal-instability maps. (a) Sandia: cathode DSC onset versus event-specific apparent exothermic energy. (b) Kvasha: cathode–electrolyte DSC onset versus reaction enthalpy. Marker size denotes event-associated mass loss in (a) and cathode loading in (b); color denotes the dimensionless whole-cell self-heating metric S in both panels.
Component calorimetry is therefore most useful as one input to material screening and mechanistic interpretation, not as a stand-alone predictor of HRmax for an arbitrary commercial cell. The need for standardized DSC procedures [20,21], the progress in material-level data-driven screening [22,25], and the development of efficient full-cell ARC methods [19] all point to the same conclusion: material- and cell-scale calorimetry provide complementary rather than interchangeable safety information.
The age of the two quantitatively analyzed datasets should therefore be distinguished from the current relevance of the underlying scale-translation question. Representative studies published from 2020 to 2026 continue to combine component-level thermal analysis with cell-level safety measurements or models, but they generally use endpoints that are not directly interchangeable with the present ARC maximum self-heating-rate metric (Table 4). Yuan et al. [26], for example, examined commercial cells based on LFP, LTO, and NMC using whole-cell ARC while using DSC to characterize component thermal stability. Zhou et al. [16] combined DSC of electrolyte, wet electrodes, and stacked electrode configurations with full-cell ARC and modeling, demonstrating that inter-electrode crosstalk and cathode decomposition can materially alter the cell-level TR signature.
Table 4.
Representative recent studies linking component-scale calorimetry with cell-level thermal-safety behavior (2020–2026).
More recent work has extended the same question to different abuse modes and cathode systems. Kim et al. [27] compared six automotive prismatic cells using nail penetration and analyzed fully charged positive electrodes by DSC/TGA; their results linked cell resistance to internal-short-circuit-induced failure with cathode composition and positive-electrode thermal stability, while also noting that the evidence was not conclusive and that the measured electrode heat release could not be treated as the actual cell-level thermal energy. Mehrotra et al. [28] used multilayer DSC configurations for high- and ultra-high-Ni NCA systems to examine how layer interactions change thermal events and to extrapolate toward larger stack behavior. These studies support the importance of cathode-associated thermal descriptors, but they also illustrate why absolute onset temperatures or heat-release quantities cannot be transferred uncritically between experimental scales.
The scale gap is still explicit in the 2026 literature. Chen et al. [18] combined DSC and ARC in NCM811/Cu anode-free lithium-metal batteries and framed the discrepancy between small-scale calorimetry and large-format cell safety testing as a continuing knowledge gap. Their system differs fundamentally from the conventional lithium-ion chemistries analyzed here, so it is not an additional validation dataset for the present correlations. Rather, together with the studies summarized in Table 4, it provides contemporary external context showing that component-to-cell translation remains unresolved across battery platforms. The present work therefore uses Barkholtz/Sandia and Kvasha as the two quantitative datasets for which sufficiently compatible component and whole-cell descriptors could be reconstructed, while the 2020–2026 literature is used only as structured qualitative corroboration and not pooled into the correlation analysis.
4. Conclusions
This study reassessed component-to-cell thermal relationships by focusing on the consistency and transferability of cathode thermal descriptors rather than on previously established chemistry rankings. Raw Sandia ARC and TGA/DSC data were reprocessed to quantify cathode decomposition onset, event-specific apparent exothermic energy, and event-associated mass loss, and the resulting material-to-cell associations were compared with an independently generated literature dataset. A further cross-scale finding was that ΔTinit was negative for some LCO and LFP conditions, indicating that detectable whole-cell self-heating could begin before the corresponding isolated anode DSC onset was reached. This result reinforces that intact-cell initiation is not a direct reproduction of a single component onset, but instead reflects coupled cell-level processes and measurement context, including possible contributions from anode/SEI–electrolyte reactions and inter-electrode crosstalk.
Within the Sandia dataset, cathode onset temperature and event-specific exothermic energy both showed large matched-SOC Pearson correlations with the whole-cell self-heating metric S (r = −0.983 and 0.980, respectively). The principal limitation of the present study is the small and chemistry-structured evidence base: the Sandia analysis comprised only nine charged chemistry–SOC conditions across three chemistry families, and only one independent dataset was available for cross-study comparison. Rank-based sensitivity analysis produced the same qualitative pattern. More importantly, leave-one-chemistry-out stress testing was unstable for all three Sandia linear models, indicating that the strong within-dataset and matched-SOC associations did not extrapolate reliably to an unseen chemistry and therefore should not be interpreted as a chemistry-independent predictive relationship.
The independent Kvasha dataset showed markedly different behavior for onset temperature. The matched-SOC cathode–electrolyte onset correlation was only r = −0.376, whereas cathode–electrolyte reaction enthalpy retained a large matched-SOC association with whole-cell self-heating kinetics (r = 0.886). Spearman sensitivity analysis preserved this contrast. Because the Sandia Qexo,event and Kvasha ΔH values were obtained using different sample configurations and calorimetric protocols, they should not be regarded as equivalent quantities. The cross-study result is therefore best interpreted at the descriptor-class level: across the two conventional lithium-ion datasets examined, cathode-associated exothermic magnitude showed greater cross-dataset consistency with whole-cell self-heating kinetics than onset temperature alone.
This finding does not imply the existence of a universal cathode-based predictor. Recent cross-scale studies published from 2020 to 2026 show that component-to-cell thermal relationships depend on calorimetric protocol, electrode interactions, electrolyte chemistry, cell architecture, abuse mode, and battery platform. In particular, electrode crosstalk can substantially modify intact-cell thermal behavior, while in battery systems such as anode-free lithium-metal cells the dominant material-scale contribution may shift toward the anode/SEI/electrolyte subsystem rather than the cathode. Thus, the material descriptor that is most informative at the cell level is likely to be platform dependent.
Cathode destabilization temperature and cathode-associated exothermic magnitude should therefore be treated as complementary material-scale descriptors. Component calorimetry is most appropriately used for mechanistic interpretation, material screening, and platform-specific safety assessment rather than as a universal surrogate for whole-cell thermal safety. Broader validation using matched-protocol datasets, additional cell chemistries, independent replicates, and harmonized whole-cell endpoints will be required before any material-to-cell relationship can be considered generally transferable or predictive.
Supplementary Materials
The following supporting information can be downloaded at: https://www.mdpi.com/article/10.3390/batteries12100421/s1. Figure S1: Physics-guided component DSC onset extraction for the Sandia dataset; Figure S2: Representative cathode event extraction and baseline-corrected integration at 100% SOC for LCO, LFP, and NCA; Table S1: Charged-cathode event metrics and quality-control status; Table S2: Pearson and Spearman sensitivity analysis of component-to-cell associations; Table S3: Sandia linear-model extrapolation stress tests; Table S4: Sensitivity of cathode descriptor extraction and cross-scale associations to the predefined event-search windows; Table S5: Sensitivity of the Sandia matched-SOC associations to whole-cell response scaling and robust regression.
Author Contributions
Conceptualization, Y.L.; methodology, Y.L.; software, L.H. and Y.L.; validation, N.W. and Y.L.; formal analysis, Y.L.; investigation, N.W. and Y.L.; data curation, N.W. and Y.L.; writing—original draft preparation, Y.L.; writing—review and editing, N.W., M.L. and L.H.; visualization, N.W. and Y.L.; supervision, N.W., M.L. and L.H.; project administration, N.W. All authors have read and agreed to the published version of the manuscript.
Funding
This research received no external funding.
Data Availability Statement
The primary ARC and TGA/DSC data analyzed in this study are publicly available through the Sandia National Laboratories Energy Storage R&D Data Repository under the dataset associated with Barkholtz et al. [23]. The numerical values used for the independent cross-study comparison are available in Tables 3–6 of Kvasha et al. [24]. Processed event metrics, quality-control results, and sensitivity analysis results are provided in the Supplementary Materials. The analysis scripts are available from the corresponding author upon reasonable request.
Acknowledgments
During the preparation of this manuscript, the authors used ChatGPT (OpenAI, GPT-5 Thinking, San Francisco, CA, USA) to assist with language refinement and manuscript organization. The authors reviewed and edited all generated content and take full responsibility for the content of the publication.
Conflicts of Interest
The authors declare no conflicts of interest.
Abbreviations
The following abbreviations are used in this manuscript:
| TR | Thermal runaway |
| T | Temperature |
| ARC | Accelerating rate calorimetry |
| DSC | Differential scanning calorimetry |
| TGA | Thermogravimetric analysis |
| SOC | State of charge |
| LCO | Lithium cobalt oxide |
| LFP | Lithium iron phosphate |
| NCA | Lithium nickel cobalt aluminum oxide |
| LTO | Lithium titanate |
| HRmax | Maximum self-heating rate |
References
- Wei, N.; Zhang, F.; Zhang, W.; Li, X. Comparative Study on the Thermal Runaway Characteristics of Li(NixCoyMnz)O2 Batteries. Heliyon 2024, 10, e31203. [Google Scholar] [CrossRef] [Scilit] [PubMed]
- Xu, W.; Li, Y.; Wang, H.; Lu, L.; Ouyang, M. Study of the Arc Generation Mechanism Induced by Liquid Electrolyte in Battery Energy Storage Systems. eTransportation 2026, 27, 100533. [Google Scholar] [CrossRef] [Scilit]
- Li, H.; Gao, Q.; Wang, Y. Experimental Investigation of the Thermal Runaway Propagation Characteristics and Thermal Failure Prediction Parameters of Six-Cell Lithium-Ion Battery Modules. Energies 2023, 16, 5172. [Google Scholar] [CrossRef] [Scilit]
- Li, W.; Xue, Y.; Feng, X.; Liu, J.; Zhang, F.; Rao, S.; Zhang, T.; Gao, Z.; Du, Z.; Ni, C.; et al. Enhancing Understanding of Particle Emissions from Lithium-Ion Traction Batteries during Thermal Runaway: An Overview and Challenges. eTransportation 2024, 22, 100354. [Google Scholar] [CrossRef] [Scilit]
- Feng, X.; Ouyang, M.; Liu, X.; Lu, L.; Xia, Y.; He, X. Thermal Runaway Mechanism of Lithium Ion Battery for Electric Vehicles: A Review. Energy Storage Mater. 2018, 10, 246–267. [Google Scholar] [CrossRef] [Scilit]
- Wang, Q.; Ping, P.; Zhao, X.; Chu, G.; Sun, J.; Chen, C. Thermal Runaway Caused Fire and Explosion of Lithium Ion Battery. J. Power Sources 2012, 208, 210–224. [Google Scholar] [CrossRef] [Scilit]
- Deng, Z.; Liu, Y.; Wang, L.; Fu, N.; Li, Y.; Luo, Y.; Wang, J.; Xiao, X.; Wang, X.; Yang, X.; et al. Challenges of Thermal Stability of High-Energy Layered Oxide Cathode Materials for Lithium-Ion Batteries: A Review. Mater. Today 2023, 69, 236–261. [Google Scholar] [CrossRef] [Scilit]
- Huang, Y.; Lin, Y.-C.; Jenkins, D.M.; Chernova, N.A.; Chung, Y.; Radhakrishnan, B.; Chu, I.-H.; Fang, J.; Wang, Q.; Omenya, F.; et al. Thermal Stability and Reactivity of Cathode Materials for Li-Ion Batteries. ACS Appl. Mater. Interfaces 2016, 8, 7013–7021. [Google Scholar] [CrossRef] [Scilit] [PubMed]
- Zhang, H.; Liu, H.; Piper, L.F.J.; Whittingham, M.S.; Zhou, G. Oxygen Loss in Layered Oxide Cathodes for Li-Ion Batteries: Mechanisms, Effects, and Mitigation. Chem. Rev. 2022, 122, 5641–5681. [Google Scholar] [CrossRef] [Scilit] [PubMed]
- MacNeil, D.D.; Lu, Z.; Chen, Z.; Dahn, J.R. A Comparison of the Electrode/Electrolyte Reaction at Elevated Temperatures for Various Li-Ion Battery Cathodes. J. Power Sources 2002, 108, 8–14. [Google Scholar] [CrossRef] [Scilit]
- Yang, J.H.; Sung, J.Y.; Kweon, H.; Kim, S.; Kim, B.; Kim, J.; Mun, J.; Kim, J.H.; Kim, K.J. A Review of Failure Modes and Safety Strategies of Lithium-Ion Batteries from Materials to Systems. Adv. Sci. 2026, 13, e76228. [Google Scholar] [CrossRef] [Scilit] [PubMed]
- El-Tawil, R.S.; Abdel-Ghany, A.E.; Hashem, A.M.; Mauger, A.; Julien, C.M. Nanostructured Cathode Materials for Rechargeable Lithium-Ion Batteries: Synthesis, Morphology, and Performances. Int. J. Mol. Sci. 2026, 27, 6797. [Google Scholar] [CrossRef] [Scilit] [PubMed]
- Liu, S.; Lu, S.; Huang, J.; Zhao, J.; Zhang, H. A Review on Thermal Runaway Warning Technologies for Aviation Lithium-Ion Batteries: Progress, Challenges, and Prospects. Renew. Sustain. Energy Rev. 2026, 239, 117149. [Google Scholar] [CrossRef] [Scilit]
- Hu, D.; Huang, S.; Wen, Z.; Gu, X.; Lu, J. A Review on Thermal Runaway Warning Technology for Lithium-Ion Batteries. Renew. Sustain. Energy Rev. 2024, 206, 114882. [Google Scholar] [CrossRef] [Scilit]
- Yanyachi, A.M.; Lin, L.; Nanda, S.; Li, W.; Liu, Y.; Swinnea, S.; Khani, H.; Finegan, D.; Ezekoye, O.A. Linking DSC/TGA to Cell Levels: Energetics, Evolved Gases, and Thermal Safety of NMC811-Graphite Micro-Cell. Adv. Energy Mater. 2026, 16, e71193. [Google Scholar] [CrossRef] [Scilit]
- Zhou, H.; Parmananda, M.; Crompton, K.R.; Hladky, M.P.; Dann, M.A.; Ostanek, J.K.; Mukherjee, P.P. Effect of Electrode Crosstalk on Heat Release in Lithium-Ion Batteries under Thermal Abuse Scenarios. Energy Storage Mater. 2022, 44, 326–341. [Google Scholar] [CrossRef] [Scilit]
- Zheng, S.; Wang, L.; Feng, X.; He, X. Probing the Heat Sources during Thermal Runaway Process by Thermal Analysis of Different Battery Chemistries. J. Power Sources 2018, 378, 527–536. [Google Scholar] [CrossRef] [Scilit]
- Chen, D.; Liao, J.; Trdinich, Z.J.; Wang, C.; Shi, F. Impact of Electrolyte and SEI Passivity on Thermal Runaway: A Comparative DSC and ARC Analysis of Anode-Free Lithium Metal Batteries. J. Power Sources 2026, 667, 239261. [Google Scholar] [CrossRef] [Scilit]
- Ko, S.; Otsuka, H.; Kimura, S.; Takagi, Y.; Yamaguchi, S.; Masuda, T.; Yamada, A. Rapid Safety Screening Realized by Accelerating Rate Calorimetry with Lab-Scale Small Batteries. Nat. Energy 2025, 10, 707–714. [Google Scholar] [CrossRef] [Scilit]
- Li, K.; Wang, L.; Wang, Y.; Feng, X.; Jiang, F.; Ouyang, M. Correlating Phase Transition with Heat Generation through Calorimetric Data. eScience 2024, 4, 100226. [Google Scholar] [CrossRef] [Scilit]
- Bracht, C.; Preitschopf, T.; Schöneich, M.; Neff, T.; Kallfaß, C.; Finze, M. Influence of Crucible Types on Thermal Stability Analysis of Li-Ion Battery Components by Thermogravimetric Analysis–Differential Scanning Calorimetry. Energy Technol. 2024, 12, 2400365. [Google Scholar] [CrossRef] [Scilit]
- Sun, Y.; Xu, X.; Gan, L.; Jiao, S.; Han, S.; Zhao, Y.; Li, Y.; Yu, X.; Li, J.; Li, H.; et al. Disentangling Multifactorial Impacts on Cathode Thermochemical Properties with Explainable Machine Learning. EES Batter. 2025, 1, 153–160. [Google Scholar] [CrossRef] [Scilit]
- Barkholtz, H.M.; Preger, Y.; Ivanov, S.; Langendorf, J.; Torres-Castro, L.; Lamb, J.; Chalamala, B.; Ferreira, S.R. Multi-Scale Thermal Stability Study of Commercial Lithium-Ion Batteries as a Function of Cathode Chemistry and State-of-Charge. J. Power Sources 2019, 435, 226777. [Google Scholar] [CrossRef] [Scilit]
- Kvasha, A.; Gutiérrez, C.; Osa, U.; De Meatza, I.; Blazquez, J.A.; Macicior, H.; Urdampilleta, I. A Comparative Study of Thermal Runaway of Commercial Lithium Ion Cells. Energy 2018, 159, 547–557. [Google Scholar] [CrossRef] [Scilit]
- Cui, Z.; Liu, C.; Manthiram, A. Quantitative Analysis and Prediction of Thermal Runaway Metrics of High-Nickel Oxide Cathodes by Machine Learning Models. ACS Energy Lett. 2026, 11, 5901–5907. [Google Scholar] [CrossRef] [Scilit]
- Yuan, L.; Dubaniewicz, T.; Zlochower, I.; Thomas, R.; Rayyan, N. Experimental Study on Thermal Runaway and Vented Gases of Lithium-Ion Cells. Process Saf. Environ. Prot. 2020, 144, 186–192. [Google Scholar] [CrossRef] [Scilit]
- Kim, H.; Seifert, H.J.; Ziebert, C.; Finster, P.; Friedl, J. A Comparative Study of Commercial Automotive Prismatic Li-Ion Cells Using Nail Penetration Test, Differential Scanning Calorimetry and Thermogravimetric Analysis. J. Power Sources 2024, 623, 235416. [Google Scholar] [CrossRef] [Scilit]
- Mehrotra, A.; Berwal, P.; Oh, J.; Lee, Y.; Yoh, J.J. From Micro-Explosions to Full-Scale Fire: Predicting Thermal Runaway in Ultra-High Nickel Lithium-Ion Batteries with Layering Effect. Energy 2025, 320, 135502. [Google Scholar] [CrossRef] [Scilit]
- Cui, B.; Xiao, Z.; Cui, S.; Liu, S.; Gao, X.; Li, G. Safety Issues and Improvement Measures of Ni-Rich Layered Oxide Cathode Materials for Li-Ion Batteries. Electrochem. Energy Rev. 2024, 7, 27. [Google Scholar] [CrossRef] [Scilit]
- Zhao, G.; Sun, Y.; Ma, H.; Ren, F.; Huang, W.; Cheng, P.; Zhao, G.; Liu, Q.; An, Q.; Yang, L.; et al. Exploring Degradation Mechanisms and Recent Developments in High-Nickel Layered Cathodes for Lithium Batteries. Electrochem. Energy Rev. 2025, 8, 21. [Google Scholar] [CrossRef] [Scilit]
- Hölderle, T.; Baran, V.; Schökel, A.; Westphal, L.; Stelzer, R.U.; Niewa, R.; Müller-Buschbaum, P.; Senyshyn, A. Understanding the Temperature–Induced Decomposition of Commercial Nickel–Cobalt–Aluminum Oxide (LiNi0.8 Co0.15 Al0.05 O2) Electrodes. Batter. Supercaps 2025, 8, e202500421. [Google Scholar] [CrossRef] [Scilit]
- Liu, H.; Zhang, Y.; Wang, C.; Su, W.; Zhou, W.; Tong, Y.; Guan, M.; Zhai, W.; Zang, J.; Wang, S.; et al. Benchmarking the Thermal Decomposition Behaviors of Lithium-Ion Cathodes: Coupling Oxygen Release, Heat Generation, and Structural Evolution. J. Energy Chem. 2026, 119, 765–775. [Google Scholar] [CrossRef] [Scilit]
- Yuan, Y.; Ma, Q.; Zhang, X.; Zhang, F.; Song, X.; Xin, H.; Zhu, G.; Zhang, H. Influence of Cathode Materials on Thermal Characteristics of Lithium-Ion Batteries. Front. Chem. 2024, 12, 1324840. [Google Scholar] [CrossRef] [Scilit] [PubMed]
- Hwang, S.; Seo, S.; Song, M.; Nam, C.; Kim, J.; Hwang, Y.; Seo, S.; Song, J.; Jo, S.; Lim, H.; et al. Electrochemical Abuse-Driven Thermal Runaway in Lithium-Ion Batteries: Evolution From Beginning-of-Life to End-of-Life. Adv. Funct. Mater. 2026, 36, e21009. [Google Scholar] [CrossRef] [Scilit]
- Li, H.; Wu, X.; Fang, S.; Liu, M.; Bi, S.; Zhao, T.; Zhang, X. Study on the Electrical-Thermal Properties of Lithium-Ion Battery Materials in the NCM622/Graphite System. Front. Chem. 2024, 12, 1403696. [Google Scholar] [CrossRef] [Scilit] [PubMed]
- Huang, J.; Xia, Y.; Xu, S.; Li, L.; Ji, H.; Chen, X.; Xu, J. Predictive Thermal Safety of Lithium-Ion Batteries through a Unified Kinetic-Thermal Framework. J. Mater. Chem. A 2026, 14, 6651–6662. [Google Scholar] [CrossRef] [Scilit]
- Koenig, B.C.; Zhao, P.; Deng, S. Comprehensive Thermal-Kinetic Uncertainty Quantification of Lithium-Ion Battery Thermal Runaway via Bayesian Chemical Reaction Neural Networks. Chem. Eng. J. 2025, 507, 160402. [Google Scholar] [CrossRef] [Scilit]

Disclaimer/Publisher’s Note: The statements, opinions and data contained in all publications are solely those of the individual author(s) and contributor(s) and not of MDPI and/or the editor(s). MDPI and/or the editor(s) disclaim responsibility for any injury to people or property resulting from any ideas, methods, instructions or products referred to in the content. |
© 2026 by the authors. Licensee MDPI, Basel, Switzerland. This article is an open access article distributed under the terms and conditions of the Creative Commons Attribution (CC BY) license.