


Highlights
What are the main findings?
- •
- Phylogenetic reconstruction revealed multi-provincial lineages with widespread polyphyletic intermingling across Azuay, Cañar, and Loja accessions, confirming an absence of strict geographic monophyly.
- •
- Morphological characteristics of Macleania rupestris fruit varied among populations and may reflect different combinations of genetic, developmental, and local environmental influences.
- •
- Total phenolic content exhibited variation between individuals and a higher content of total phenolic compounds.
What are the implications of the main findings?
- •
- Contribution to the understanding of plant biodiversity, genetic resources, phytochemistry, and the conservation of underutilized native species.
- •
- Generated information provides a valuable scientific basis for future conservation strategies, germplasm management and use, domestication, and breeding for Macleania rupestris.
Abstract
Macleania rupestris is an underutilized wild fruit-bearing shrub native to the Ecuadorian Andes, with considerable ecological importance and potential for sustainable local development. However, information regarding its genetic, morphological, and phytochemical diversity remains scarce. This study aimed to characterize the genetic and morphological diversity and total phenolic content (TPC) of M. rupestris populations. A multilocus analysis was performed using three previously amplified concatenated sequences. Fruit characterization was conducted using quantitative morphological and physicochemical traits, while TPC was expressed as gallic acid equivalents and determined in fruits collected from the same individuals. Relationships among genetic, fruit, phytochemical, and environmental variables were also explored. The multilocus phylogenetic structure showed no clear geographic pattern, while most fruit traits exhibited limited differentiation among provinces. However, soluble solids content (°Brix), seed number, and pedicel length differed significantly among provinces. Fruit moisture content was moderately negatively correlated with soluble solids content (r = −0.45) and moderately positively correlated with seed number (r = 0.46). These correlations represent observational associations and do not demonstrate causal relationships. No significant correlation was detected between fruit traits and TPC. These findings provide important scientific basis for the conservation, selection of promising genotypes, and future domestication of this underutilized Andean fruit species.
1. Introduction
Macleania rupestris (Kunth) A.C. Sm. is a wild shrub species belonging to the Ericaceae family and found in Andean ecosystems and cloud forests between 1000 and 3000 m.a.s.l. [1]. In southern Ecuador, Ericacea species inhabit montane forests, where they demonstrate an ability to adapt to hostile ecological conditions [2]. Their edible fruits, locally referred to as “joyapa” constitute the traditional diet of surrounding rural communities [3,4]. This species has a significant contribution to the conservation of wildlife environment, as it serves as a food source for frugivorous birds, small mammals, and symbolic species like the Andean bear (Tremarctos ornatus), for which fruits of Ericaceae species represent an important component in their dietary habits [1,5,6]. Such consumption helps seed dispersal processes that spur natural forest regeneration [7]. Joyapa’s roots help to stabilize the soil on the slopes of the Andes, decreasing erosive processes and supporting better retention of the soil structure [8,9]. Joyapa also has potential bioactivity due to the presence of secondary metabolites such as flavonoids, anthocyanins, and other phenolic compounds [5,10].
From a horticultural perspective, the edible fruits of M. rupestris represent a potentially valuable native genetic resource for diversification of Andean fruit production. Traits such as fruit size, fresh and dry fruit weight, fruit moisture content, soluble solids content, seed number, pedicel length, and phenolic content are relevant to the preliminary evaluation of fruit quality, consumer acceptability, harvesting, postharvest handling, and the selection of promising plant material. Characterizing variation in these traits among wild accessions therefore constitutes an initial step toward germplasm selection, propagation, cultivation, and eventual domestication. Nevertheless, their horticultural performance must ultimately be evaluated under standardized cultivation and fruit-maturity conditions.
The integration of molecular markers with morphological descriptors and phytochemical analyses constitutes a valuable tool towards the identification of diversity in wild and underutilized species [11,12]. Molecular and phytochemical profiling are instruments to evaluate genetic diversity and to determine the extent of variation in organisms in natural populations [13,14]. The use of molecular markers is very helpful when taxonomic complexity or high morphological variation exists, as is the case for some members of the Ericaceae family [4,15]. This hybrid-analysis approach is especially relevant to describe genetically different species with opposing functional characteristics, which will support future in situ conservation, management, clonal propagation or domestication [11,16]. Combining genetic studies with morphologic and phytochemical information provides a setting for examining the likely relationships between genetic variability and ecological and morphological traits [14,17,18]. For M. rupestris, the analysis of genetic, morphological, and phytochemical diversity is key to establishing a scientific foundation to encourage its sustainable use and enhance conservation measures in the southern Ecuadorian Andes.
Members of the family Ericaceae from the Andes present significant adaptive radiation and high phenotypic diversity associated with the altitudinal gradients [3,4]. For example, wide genetic and phytochemical variation in terms of phenolic products and antioxidant capacity have been reported for fruits within species of Vaccinium and Cavendishia [4,19,20]. However, the degree of intraspecific diversity within M. rupestris populations is still little known. The information obtained contains gaps that limit our understanding of the evolutionary and adaptive pathways that shape their natural populations and constrain the development of effective conservation and sustainable management strategies [11,16]. The lack of scientific knowledge has restricted practical application of this species for use in food, cooking, and biotechnological applications, and in general, limits native plant genetic resource valorization [21,22].
To uncover the genetic diversity and multilocus phylogenetic structure of M. rupestris across the southern Ecuadorian Andes, the present study on joyapa populations had the following objectives: (i) determine multilocus genetic variation and phylogenetic clustering in natural populations; (ii) measure morphological variation in the plants and fruits within populations; (iii) evaluate total phenolic content; and (iv) probe the associations among morphology and TPC to offer potentially valuable insights into conservation, sustainable management, and eventual domestication of this underutilized Andean species.
2. Materials and Methods
2.1. Study Area and Plant Material Collection
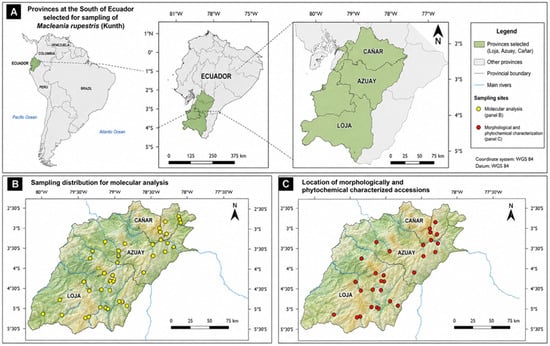
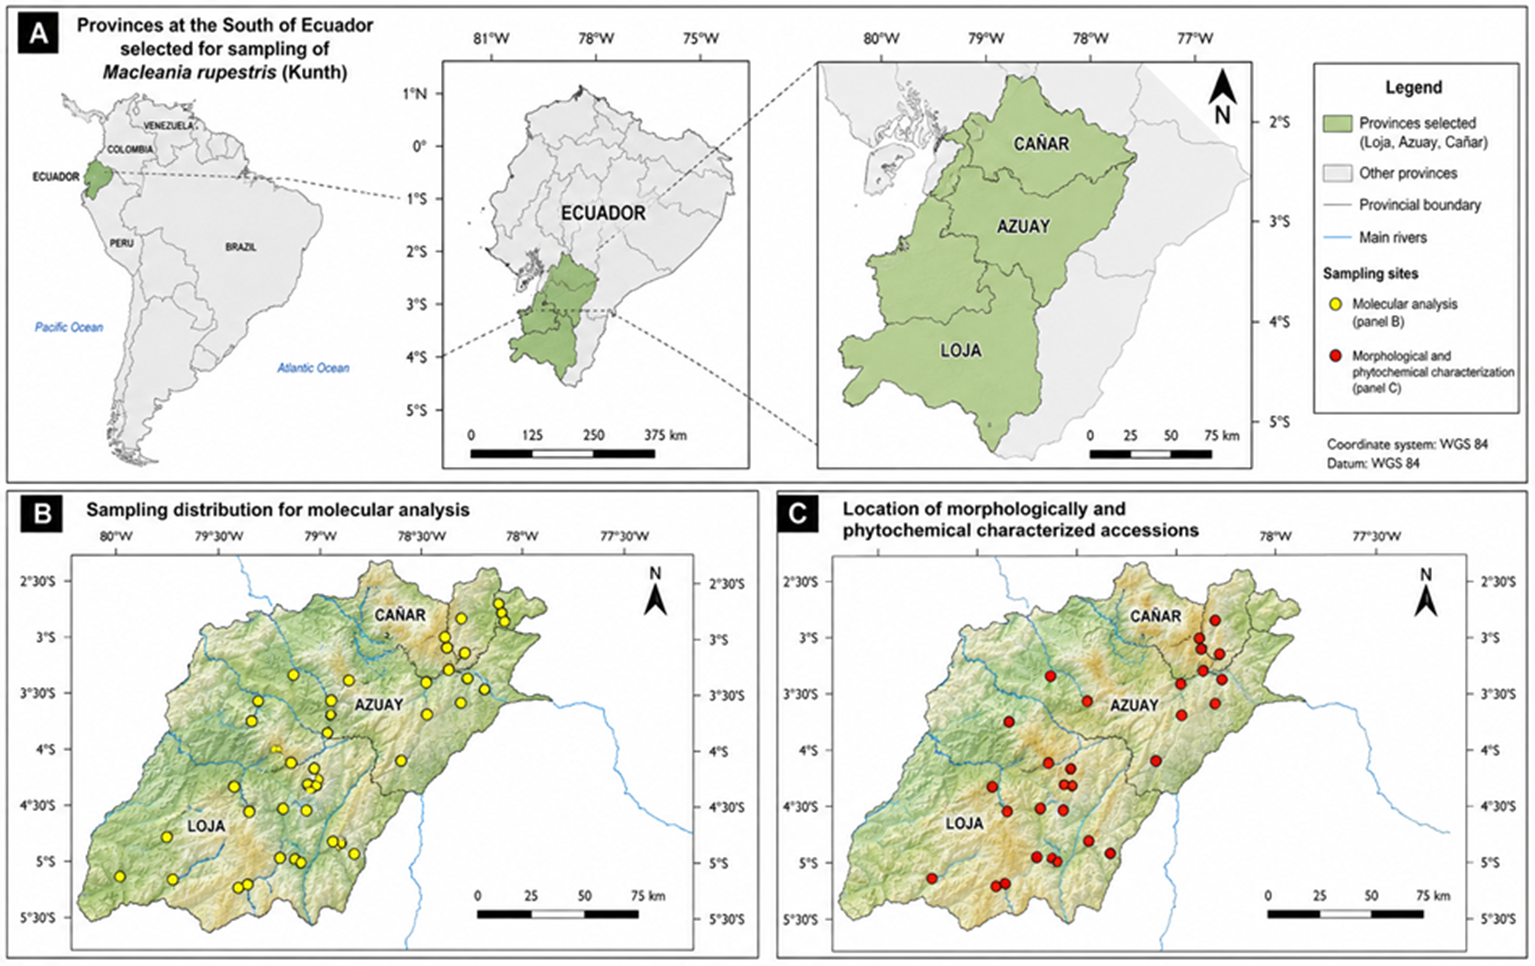
Samples of M. rupestris (Kunth) A.C. Sm. were collected in the southern Ecuadorian Andes, specifically in the provinces of Azuay, Cañar, and Loja, under research permit MAATE-DBI-CM-2024-0376. Sampling sites were located in transition zones between subparamo and paramo vegetation, including protected areas and roadside environments, across an altitudinal range of 2080–3565 m.a.s.l. Between three and five individuals were sampled per population to ensure representative genetic coverage; following recommended population sampling strategies [23,24]. Individual groups were also included as observed in Figure 1 and listed in Appendix A.
Figure 1.
Geographic location of the study area and sampling sites of M. rupestris (Kunth) in southern Ecuador. (A) Provinces selected for sampling (Loja, Azuay, and Cañar). (B) Spatial distribution of sampling sites used for molecular analyses. (C) Geographic location of accessions characterized through morphological and TPC analyses. Generative artificial intelligence (GenAI, GPT-5) was used to improve the visual presentation of the map shown in Figure 1, illustrating the geographic distribution of sampling locations in southern Ecuador. Note: The original map, including all sampling coordinates and geographic information, was developed by the authors. GenAI GPT-5 was not used for data analysis, interpretation of results, or scientific decision-making. The authors reviewed and edited all AI-assisted outputs and take full responsibility for the content of this publication.
2.2. Molecular Characterization
2.2.1. DNA Extraction, Amplification, and Sequencing
For molecular analysis, apical branch segments (~5 cm) bearing young leaves were collected; georeferenced using a high-precision GPS receiver (REACH RS2+, Emlid, Budapest, Hungary); labeled; and finally, transported in paper bags to the Molecular Biology Laboratory of the Faculty of Agricultural Sciences at the University of Cuenca. Upon arrival, samples were stored at 4 °C and processed within 48 h.
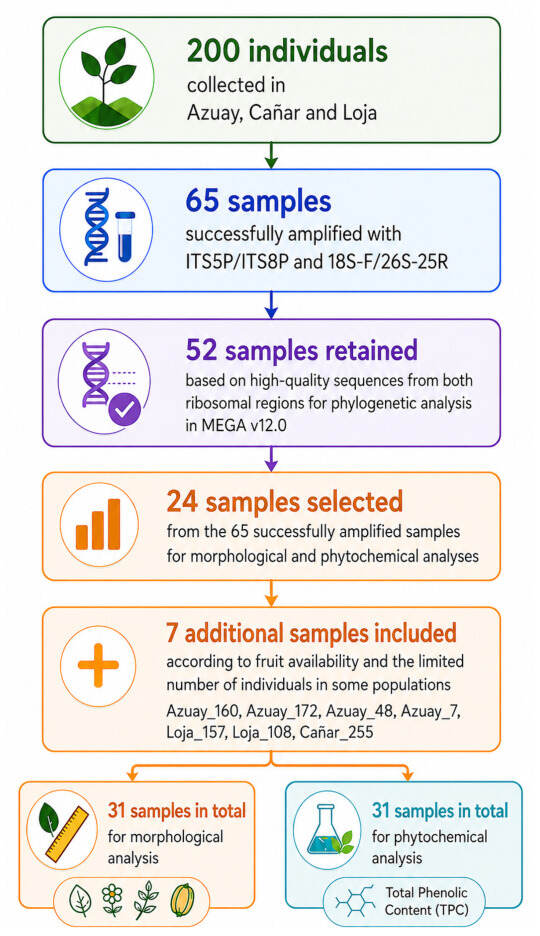
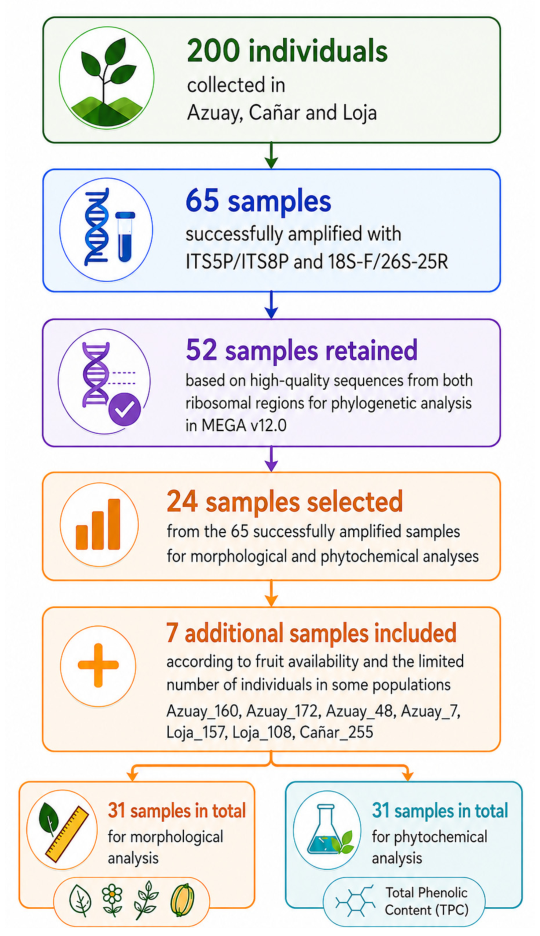
Genomic DNA was extracted from 200 samples using the modified protocol described by [25] (Figure 2). The protocol consists of using approximately 100 mg of fresh plant tissue (leaf), homogenized either manually in a pre-sterilized mortar and pestle with 1 mL of pre-heated CTAB lysis buffer (0.5% CTAB, 1% EDTA, 2.5% Tris base, 5% NaCl) or mechanically using a TissueLyser II (Qiagen, Venlo, The Netherlands) with Zirconox beads (2.8–3.3 mm). The resulting homogenate was transferred to 2 mL microcentrifuge tubes and vortexed thoroughly to obtain a uniform suspension. To minimize oxidative damage and inhibit nuclease activity, freshly prepared β-mercaptoethanol (5%, v/v) was added immediately prior to incubation. Polyvinylpolypyrrolidone (PVPP; 1.5%, w/v) was incorporated into the lysis buffer to enhance nucleic acid yield and purity. Samples were incubated at 65 °C for 10 min in a water bath with continuous agitation to ensure complete cellular disruption and protein denaturation. Phase separation was achieved by adding 600 µL of chloroform to each lysate, followed by vigorous mixing and centrifugation at 13,700× g for 10 min at 4 °C. The upper aqueous phase containing nucleic acids was carefully recovered without disturbing the interphase and transferred to a new microcentrifuge tube for subsequent purification and precipitation steps.
Figure 2.
Sampling strategy and analytical workflow used for the characterization of natural populations of Macleania rupestris in southern Ecuador. A total of 200 individuals were surveyed in the provinces of Azuay, Cañar, and Loja. Of these, 65 samples were successfully amplified using the ITS5P/ITS8P and 18S-F/26S-25R primer pairs. Fifty-two samples with high-quality sequences for both ribosomal regions were retained for phylogenetic analysis using MEGA v12.0. Independently, 24 individuals were selected from the 65 successfully amplified samples for fruit morphological characterization and determination of total phenolic content (TPC). Seven additional individuals were included according to fruit availability and the limited number of individuals in some populations, resulting in a total of 31 samples for the morphological and phytochemical analyses.
Preliminary amplification screening was conducted using four primer pairs targeting nuclear ribosomal regions, including Internal Transcribed Spacer (ITS) ITS5P/ITS4 and ITS5P/ITS8P [26], as well as 18S-F/26S-25R and 5.8S-32F/5.8S-32R [27]. Primer performance was initially evaluated on a subset of 6 randomly selected samples to assess amplification efficiency and fragment quality. Based on amplification consistency and sequencing suitability, the primer combinations ITS5P (5′-GGAAGGAGAAGTCGTAACAAGG-3′)/ITS8P (5′-CACGCTTTCCAGACTACA-3′) and 18S-F (5′-CCTTATCATTTAGAGGAAGGAG-3′)/26S-25R (5′-TATGCTTAAAYTCAGCGGGT-3′) were selected for further analyses.
Of the 200 samples processed, 65 were successfully amplified using the primer pairs ITS5P/ITS8P and 18S-F/26S-25R. All 65 samples produced detectable PCR products for both ribosomal regions. The amplicons were verified by agarose gel electrophoresis, purified, and submitted to Macrogen Inc. (Seoul, Republic of Korea) for bidirectional Sanger sequencing following the provider’s standard quality-control procedures.
Forward and reverse reads were assembled, trimmed, and evaluated for sequence quality. Only samples that yielded complete and unambiguous high-quality sequences for both the ITS and 18S–26S regions were retained. Following this quality-control process, 52 of the 65 samples were included in the concatenated sequence alignment and subsequent maximum likelihood analysis in MEGA v12.0. [28]. The remaining 13 samples were excluded because at least one of the two ribosomal regions produced incomplete, ambiguous, or insufficient-quality sequence data.
2.2.2. Sequence Processing and Genetic Analyses
Raw sequences were trimmed and quality-filtered using FinchTV (Geospiza, Inc., Seattle, WA, USA). Fifty-two samples were used for the multilocus phylogenetic analysis (Appendix A). High-quality sequences obtained from the ITS5P/ITS8P and 18S/26S loci were concatenated and aligned in MEGA v12.0 [28] using the ClustalW algorithm [29]. The best-fitting nucleotide substitution model was selected using the Bayesian Information Criterion (BIC) implemented in MEGA v12.0. The Tamura three-parameter model was identified as the best-fitting model for the concatenated ITS and 18S-26S dataset and was therefore used for maximum likelihood phylogenetic reconstruction. Statistical support was assessed using 1000 bootstrap replicates.
2.2.3. Population Genetic Diversity and Spatial Structure Analysis
To evaluate genetic diversity metrics and hierarchical population structure, concatenated nuclear ribosomal DNA sequences (ITS and 18S–26S) from 52 M. rupestris accessions were analyzed using Arlequin v3.5. Accessions were grouped into three geographic populations corresponding to their province of origin: Azuay (n = 36), Cañar (n = 5), and Loja (n = 11). Genetic diversity indices, including the number of polymorphic sites (S), parsimony-informative sites, number of haplotypes (H), haplotype diversity (Hd), and nucleotide diversity (π), were estimated for each regional population and across the total dataset [30]. Spatial genetic partitioning was evaluated through an analysis of molecular variance (AMOVA) based on pairwise sequence differences. The molecular variance was partitioned into two hierarchical levels: among geographic populations and within populations. The statistical significance of variance components and the overall fixation index (FST) was determined using 1000 non-parametric permutations. Additionally, pairwise population differentiation (FST) was computed between all pairs of provinces to assess regional genetic divergence, with p-values evaluated through 1000 effective permutations in Arlequin v3.5. [31].
2.3. Morphological Characterization
Representative individuals from each major genetic cluster were selected for morphological characterization. A total of 31 accessions were evaluated, including 23 from Azuay, 4 from Loja, and 4 from Cañar. To improve provincial representation and ensure an adequate number of replicates for statistical analyses, the accessions Azuay_160, Azuay_172, Azuay_48, Azuay_7, Loja_157, Loja_108, and Cañar_255 were additionally included in these evaluations. The lower number of samples from Loja and Cañar was due to the limited availability of fruits during the sampling period and the restricted size of the natural populations in these provinces.
Eight quantitative fruit traits were evaluated: fruit length (cm), fruit width (cm), pedicel length (mm), fresh fruit weight (g), dry fruit weight (g), fruit moisture content (%), soluble solids content (°Brix), and number of seeds per fruit. Fruit length, fruit width, and pedicel length were measured using a digital caliper. Fresh fruit weight was recorded using an analytical balance (BXX 30; BOECO, Hamburg, Germany). The fruits were subsequently dried at 100 °C until a constant weight was reached and dry fruit weight was then recorded using the same balance. Fruit moisture content was calculated on a fresh-weight basis using the following Equation (1):
Soluble solids content was measured using a handheld refractometer (BOE 30103; BOECO, Germany) and expressed as °Brix. Each accession was evaluated using 20 fresh fruits, except for seed number, which was determined from 10 fruits following the procedure described in [32]. Measurements obtained from individual fruits were averaged at the accession level; therefore, each accession constituted an independent observational unit for statistical analysis.
Statistical analyses were conducted in R version 4.3.2 (R Core Team). Differences among provinces were evaluated separately for each trait. Because the assumptions of normality and homogeneity of variances were not satisfied, the data were analyzed using the non-parametric Kruskal–Wallis test [33]. When a significant global difference was detected, Dunn’s post hoc test [34] was used for pairwise comparisons among provinces. For each trait, the resulting p-values were adjusted across the three pairwise comparisons using the Holm method [35]. Differences were considered statistically significant at p < 0.05. Hierarchical clustering was performed using standardized trait values, Euclidean distances, and Ward’s minimum-variance method (Ward.D2).
2.4. Total Phenolic Content (TPC) Analysis
Sample Preparation and Extraction of Total Phenolic Compounds
Total phenolic content (TPC) analysis was conducted using the same 31 samples from the morphological analysis. Prior to the preparation of extracts, between 30 and 40 g of fruits and fruit peduncles per plant of M. rupestris were freeze-dried using a Labconco Freezone 2.5 (Kansas City, MO, USA) FreeZone 2.5 (Labconco, Kansas City, MO, USA). The dried materials were pulverized prior to extraction. Percolation was selected as the extraction method using an ethanol/water 70/30 mixture. The obtained extracts were concentrated in a rotavap Laborota 4000 (Heidolph, Schwabach, Germany), and the final solvent residual was eliminated under a stream of nitrogen. Extracts were stored at −20 °C until analysis.
The Folin–Ciocalteu assay reported by [36] was used. Briefly, 200 µL of a 10% Folin–Ciocalteu solution prepared with ultra-pure distilled water was placed in test tubes; then, 100 µL of the extracts (1 mg/mL) was added to each tube and they were left for 5 min at room temperature. Finally, 800 µL of Na2CO3 solution (700 mM) was added and the tubes were left to stand for 1 h in the dark. After this incubation time, 200 µL of this mixture was placed in a Costar® 96-well flat-bottom plate (Corning Incorporated, Corning, NY, USA) and the absorbance at 765 nm was measured in an Synergy H1 microplate reader (BioTek Instruments, Winooski, VT, USA). The tests were performed in triplicate.
For the calibration curve, gallic acid was used as the standard in concentrations of 0.03125, 0.0625, 0.125, 0.25, 0.5 and 1 mg/mL. Results were expressed as mg gallic acid equivalents per g dry drug weight (DW) of the plant (mg GAE/g DW).
2.5. Statistical Analyses and Trait Associations
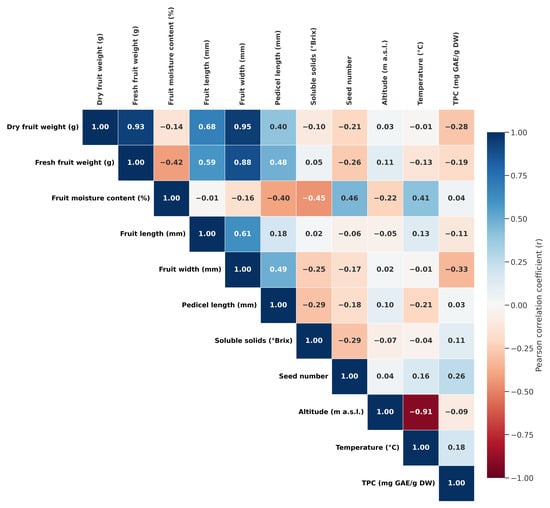
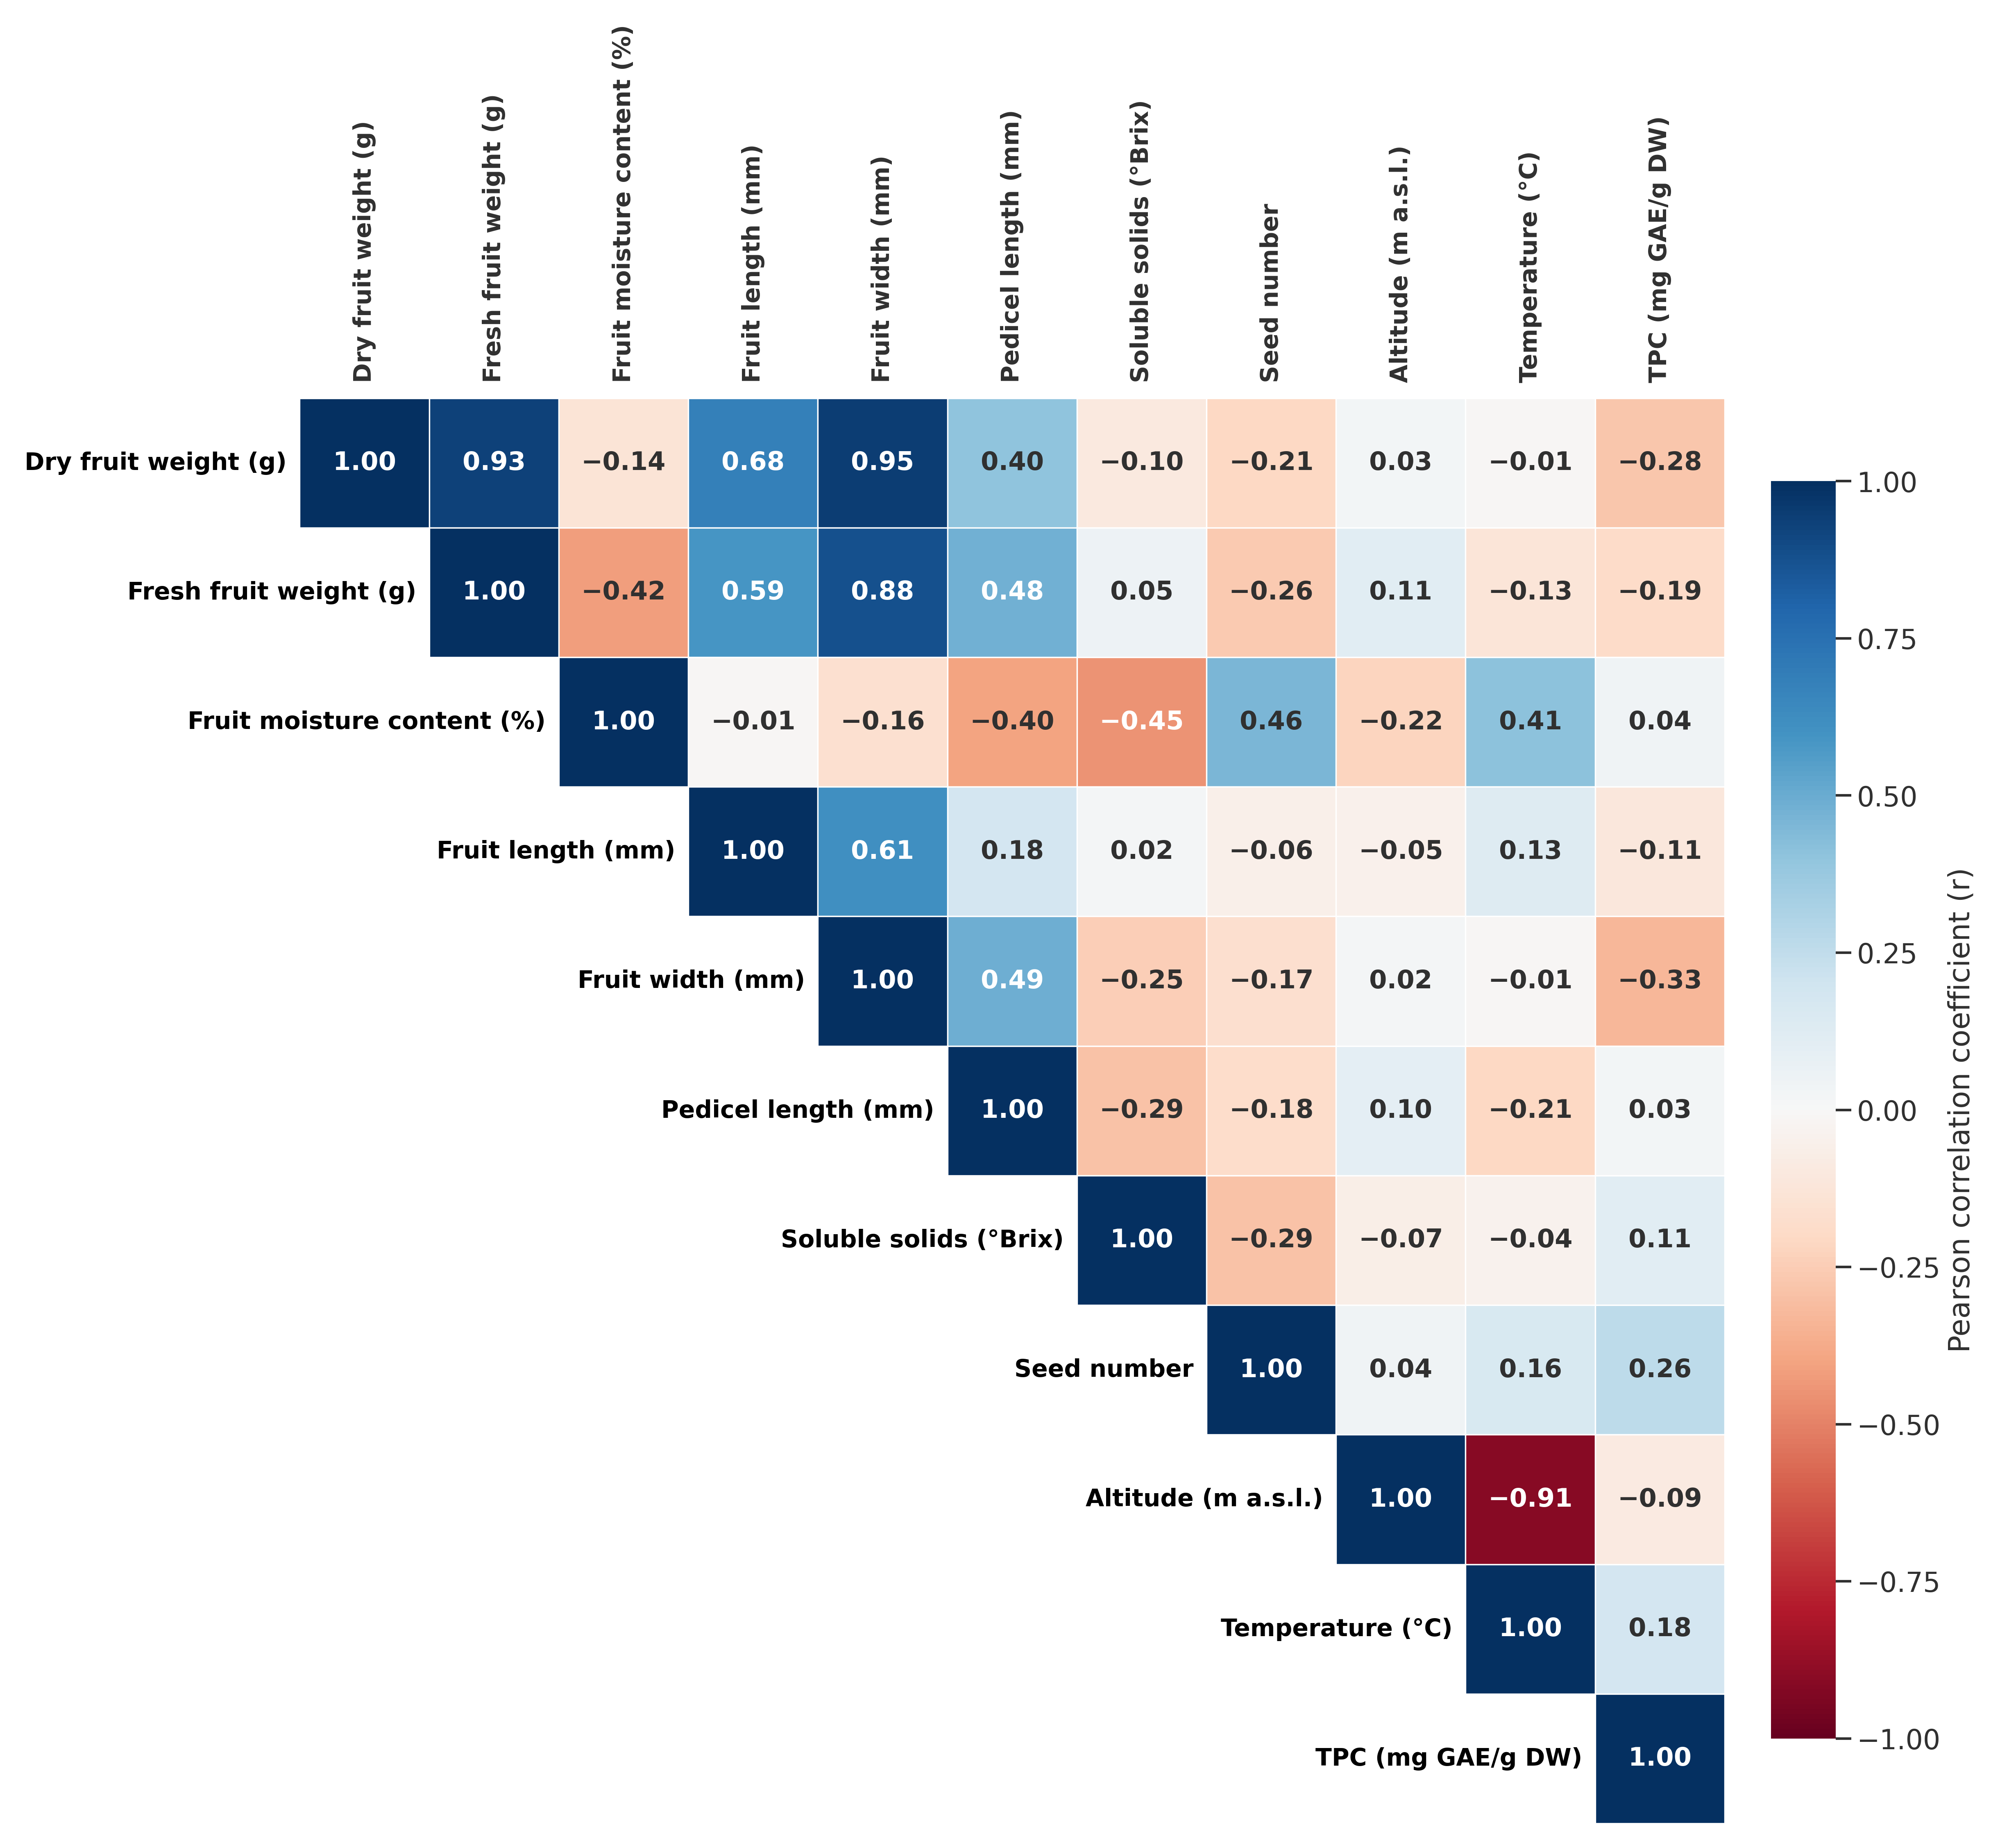
Relationships among fruit morphological traits, total phenolic content (TPC) and environmental variables were evaluated using Pearson correlation. The resulting correlation matrix was visualized as a heatmap using the corrplot package in R where blue tones indicate positive correlations, whereas red tones indicate negative correlations.
Patterns of similarity among the 31 individuals were based on morphological and TPC characteristics; Euclidean distance matrices were calculated using standardized data. Hierarchical clustering was performed using Ward’s minimum-variance method and dendrograms were generated to visualize grouping patterns among samples. The correspondence between morphological and TPC clustering was evaluated using tanglegram analysis, which enables visual comparison of concordant and discordant clustering relationships among samples. Associations between morphological and TPC distance matrices were quantified using Mantel tests based on Pearson’s correlation coefficient with 999 permutations. Statistical significance was assessed at p < 0.05. All statistical analyses were performed in R version 4.3.2 (R Core Team, Vienna, Austria) using the packages vegan, dendextend, corrplot, and ggplot2.
3. Results
3.1. Molecular Diversity and Genetic Differentiation
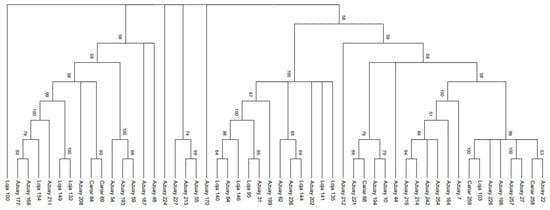
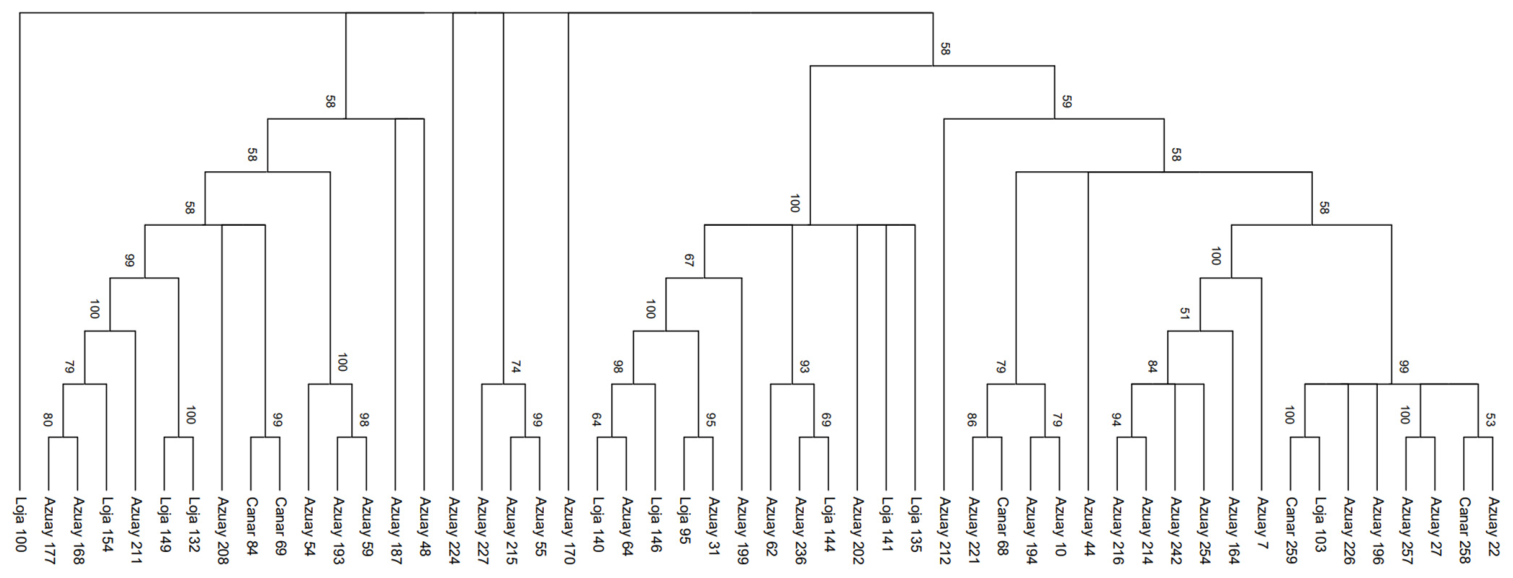
The maximum likelihood (ML) consensus tree constructed under the Tamura 3-parameter model (MEGA v12.0, 52 M. rupestris accessions) revealed that samples do not group by geographic origin, as accessions from Azuay, Cañar, and Loja are polyphyletically distributed across four main lineages (Figure 3).
Figure 3.
Maximum likelihood phylogenetic tree of Macleania rupestris individuals from the southern Ecuadorian Andes. The tree was reconstructed in MEGA v12.0 using the Tamura three-parameter model. Numbers at the nodes represent bootstrap support values (%) based on 1000 replicates.
- •
- Upper Multi-Provincial Clade (BS up to 99%): Groups accessions from all three provinces. Key pairings include Azuay 27 + Azuay 257 (100% BS), Loja 103 + Cañar 259 (100% BS), Azuay 22 + Cañar 258 (53% BS), an Azuay cluster (51–100% BS), and a mixed Azuay–Cañar subclade (79–86% BS).
- •
- Middle Core Clade (BS = 100%): Reflects strong genetic affinities between Azuay and Loja. Key subclades include Loja 144 + Azuay 236 (69% BS), Azuay 31 + Loja 95 (95% BS), and a cluster comprising Loja 146, Azuay 64, and Loja 140 (64–98% BS).
- •
- Intermediate Lineages: Positioned between the main clades, consisting of independent lineages (Azuay 170, 224, 48, and 187) and a subclade uniting Azuay 55 + Azuay 215 (99% BS) with Azuay 227 (74% BS).
- •
- Lower Clade: Features localized subgroups for Azuay (Azuay 59 + 193, 98% BS) and Cañar (Cañar 69 + 84, 99% BS), alongside a southern lineage linking Loja and Azuay samples (79–100% BS), with Loja 100 at the basal node.
Although some localized clustering was observed among specific accessions, accessions from different provinces were intermingled across the sequence lineages. Thus, the phylogenetic topology did not correspond to province-exclusive clustering. This pattern does not preclude genetic differentiation among the sampled provincial groups, as detected by the AMOVA and FST analyses.
3.2. Population Genetic Diversity and Spatial Structure
Sequence evaluation of the 52 concatenated nrDNA alignments identified 248 polymorphic sites and 30 parsimony-informative sites, defining eight distinct haplotypes (H = 8). The overall haplotype (Hd) and nucleotide (π) diversities were 0.6478 and 0.00599, respectively (Table 1). Regional diversity metrics varied: Loja presented the highest haplotype diversity (Hd = 0.7818), whereas Azuay harbored the highest nucleotide diversity (π = 0.00744). Cañar exhibited lower overall genetic metrics (Hd = 0.4000, π = 0.00062).
Table 1.
Genetic diversity parameters of Macleania rupestris populations based on concatenated nrDNA sequences.
Hierarchical AMOVA indicated that the vast majority of molecular variance was partitioned within populations (86.78%), while variation among provinces accounted for 13.22% of total variation (Table 2). Nevertheless, the overall fixation index demonstrated significant regional genetic structure (FST = 0.13225, p = 0.00391).
Table 2.
Analysis of molecular variance (AMOVA) among Macleania rupestris populations.
Pairwise FST comparisons confirmed significant differentiation between Loja and Azuay (FST = 0.13560, p = 0.00488) and between Loja and Cañar (FST = 0.32369, p = 0.00586; Table 3). In contrast, genetic differentiation between Azuay and Cañar was weak and non-significant (FST = 0.05816, p = 0.15039).
Table 3.
Pairwise FST values (below diagonal) and p-values (above diagonal) among populations.
3.3. Morphological Variation
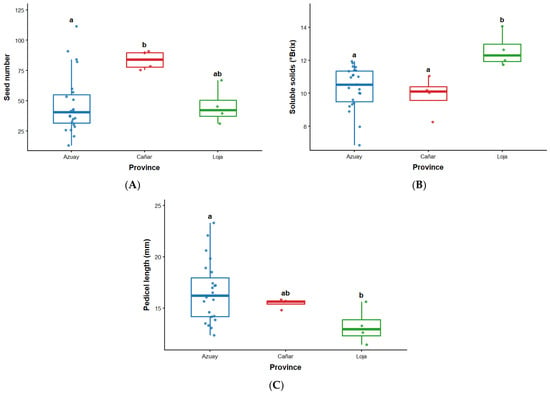
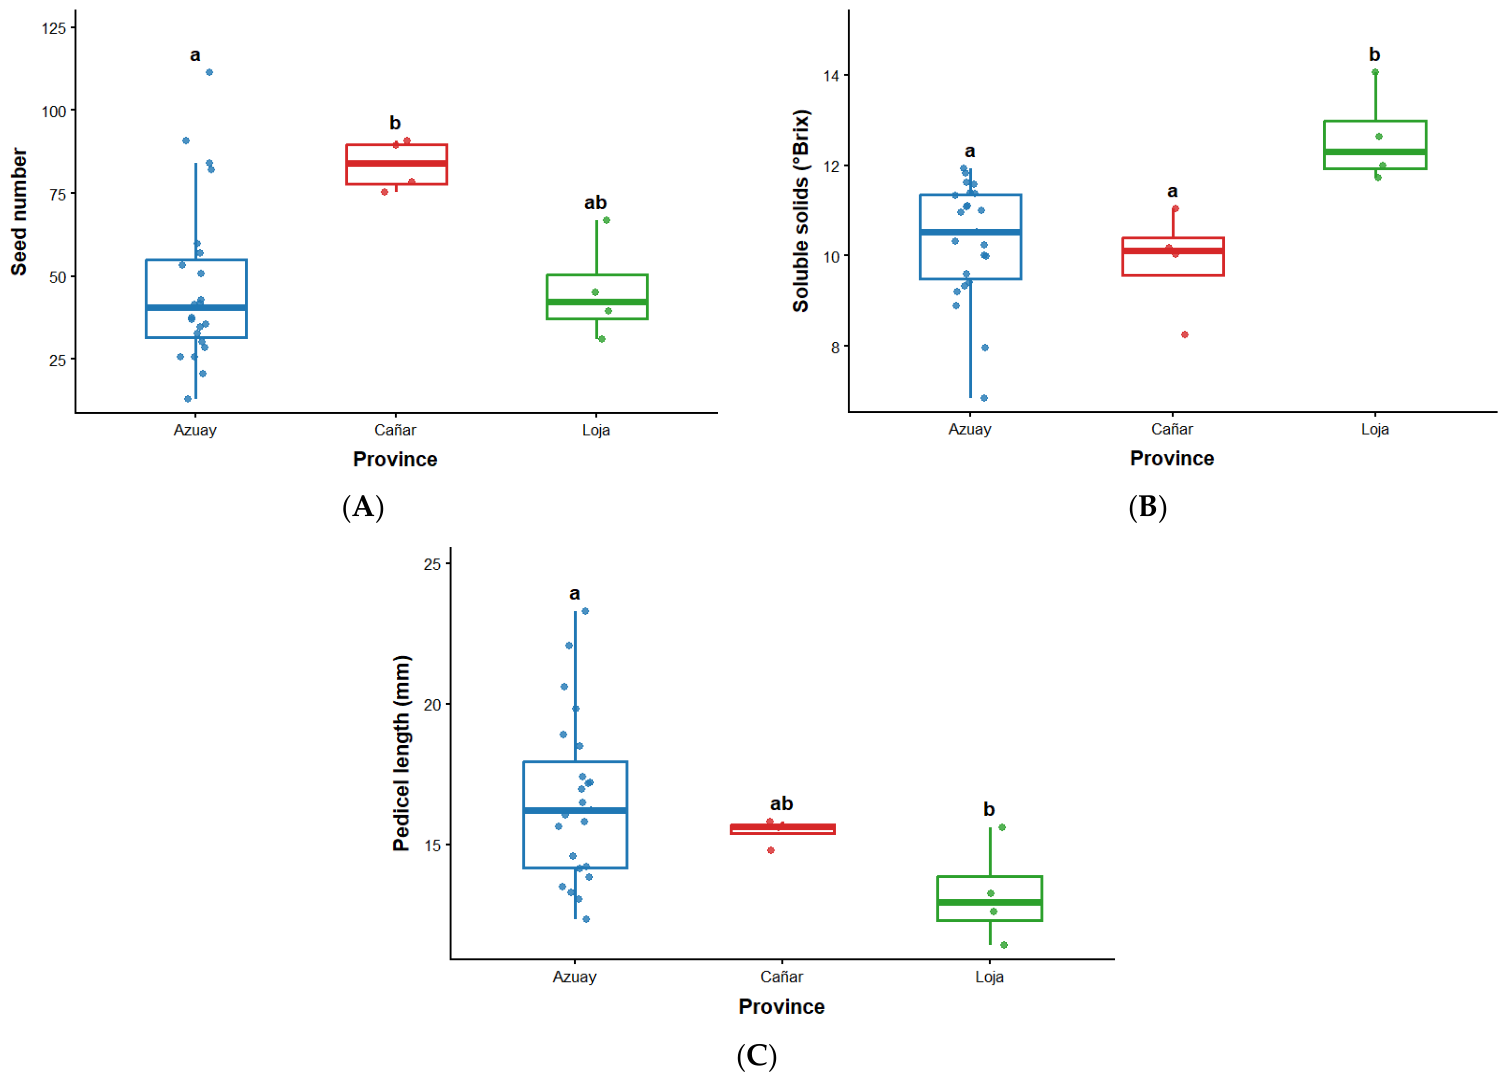
Significant differences among provinces were observed for seed number, soluble solids content, and pedicel length (Figure 4; Table S2). Seed number differed among provinces (Kruskal–Wallis: H = 6.16, p ≈ 0.046), with Cañar showing higher values than Azuay (Figure 4A; Table S3). Loja displayed intermediate values and did not differ significantly from either province. Soluble solids content also varied significantly among provinces (H = 9.93, p = 0.007; Figure 4B). Loja exhibited the highest °Brix values and differed significantly from both Azuay and Cañar, whereas no significant difference was detected between Azuay and Cañar. Pedicel length differed significantly among provinces (H = 6.35, p = 0.042; Figure 4C; Table S3), with Azuay showing longer pedicels than Loja. Cañar presented intermediate values and did not differ significantly from either Azuay or Loja. Descriptive statistics for the morphological, physicochemical, and phytochemical traits of the sampled accessions are presented in Table S1.
Figure 4.
Variation in seed number (A), soluble solids content (°Brix) (B), and pedicel length (mm) (C) among Macleania rupestris accessions from Azuay, Cañar, and Loja provinces. Boxplots represent the median and interquartile range, whiskers extend to 1.5 times the interquartile range, and points represent individual accessions. Different lowercase letters indicate significant differences among provinces according to Dunn’s post hoc test with Holm adjustment (padj < 0.05). Provinces sharing at least one letter were not significantly different.
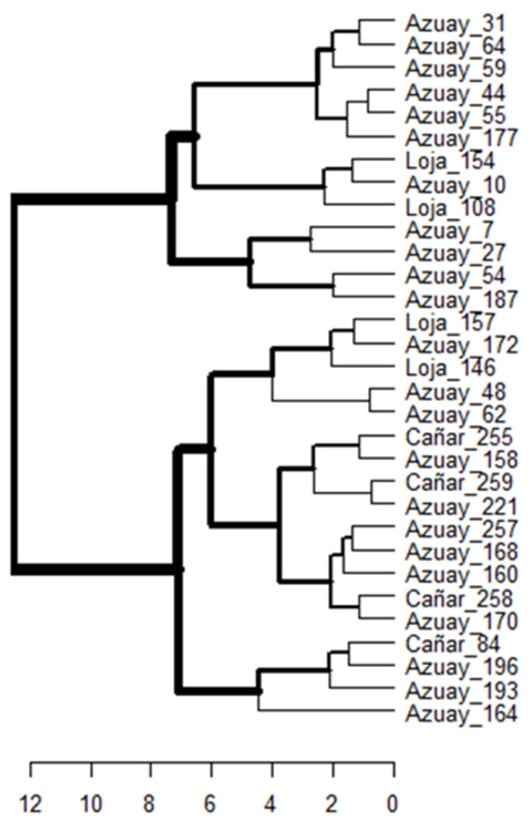
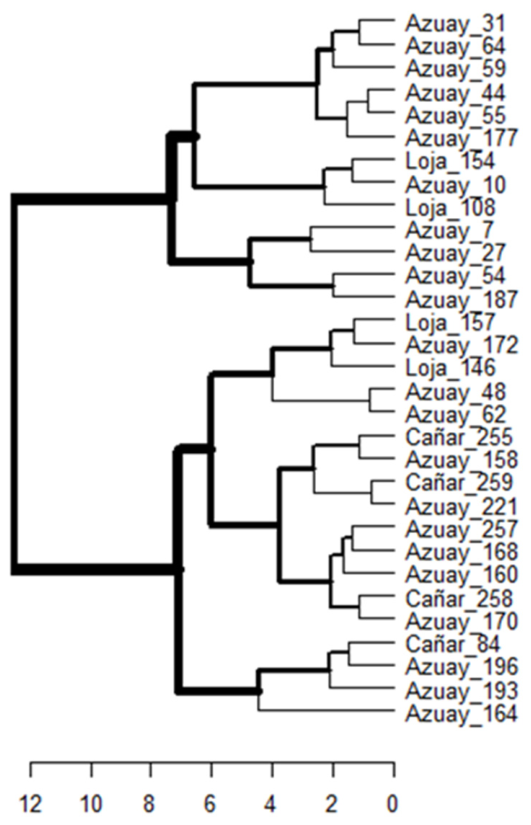
The cluster analysis based on fruit morphological traits (Figure 5) identified two major groups. The clustering pattern differed from that obtained using molecular markers; however, similarly, they did not show a clear association with the geographic origin of the samples. Individuals from different provinces were distributed across both groups, indicating that the observed fruit morphological variation was not grouped according to sampling location.
Figure 5.
Hierarchical clustering dendrogram of Macleania rupestris individuals based on fruit morphological and physicochemical traits, including fruit length, fruit width, fresh fruit weight, dry fruit weight, seed number, and soluble solids content (°Brix).
3.4. Total Phenolic Count (TPC)
The environmental conditions and total phenolic content (TPC) expressed as mg GAE/g DW of the sampled M. rupestris individuals are summarized in Table 4. Samples were collected across an altitudinal range between 2537 and 3566 m.a.s.l. in the provinces of Azuay, Cañar, and Loja, with mean annual temperatures ranging from 8.2 to 14.0 °C. Total phenolic content exhibited substantial variation among individuals, ranging from 15.10 to 44.74 mg GAE g−1 DW, indicating considerable TPC variability across the studied populations (Table 1).
Table 4.
Altitude, temperature, and total phenolic content (TPC) of Macleania rupestris samples collected in Azuay, Cañar, and Loja provinces, southern Ecuador.
3.5. Associations Among Morphological and Total Phenolic Content (TPC)
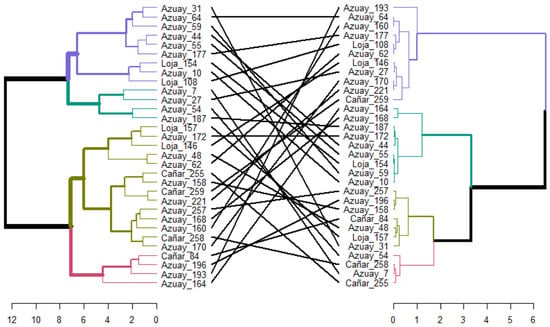
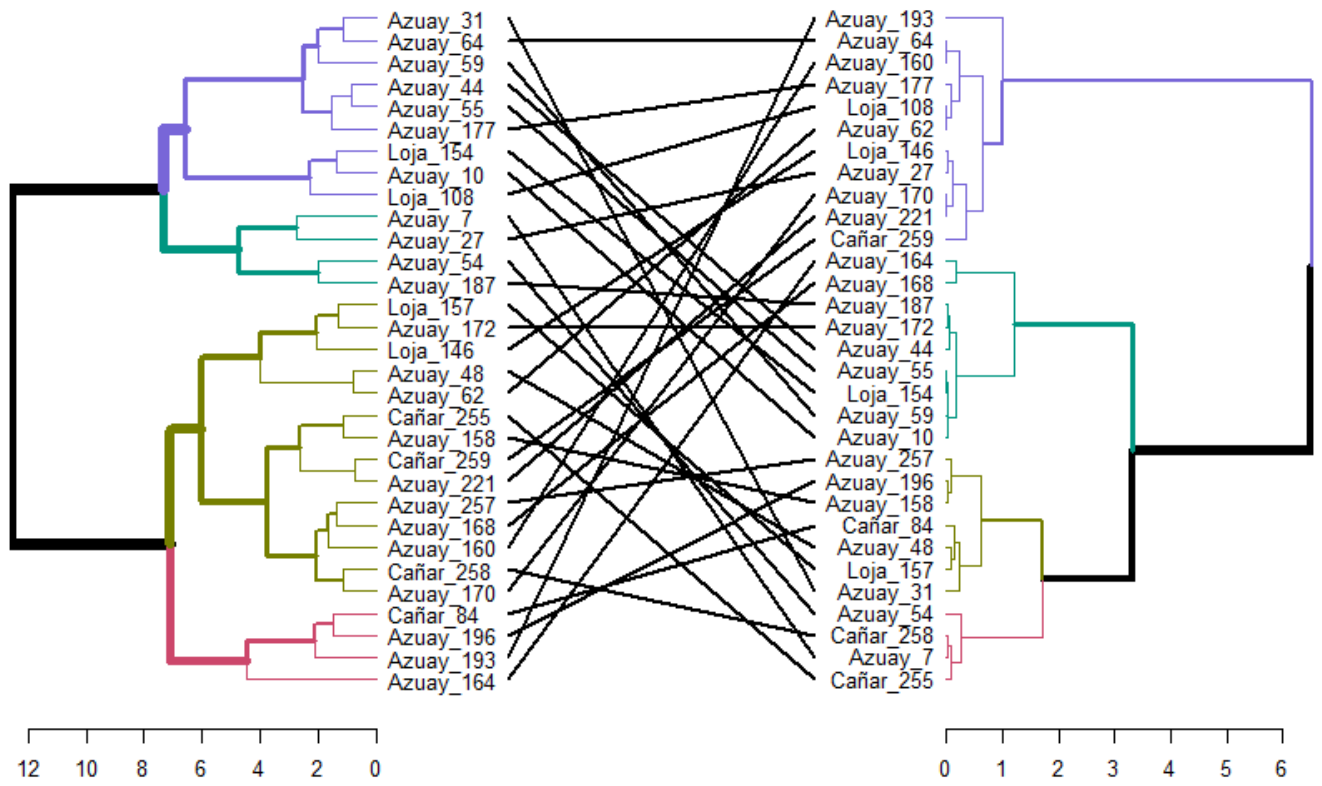
The comparison between morphological and TPC dendrograms using a tanglegram (Figure 6) revealed low topological congruence, characterized by numerous crossing links connecting the same accessions across both trees. Only a limited number of individuals maintained similar clustering positions, whereas most accessions showed different groupings between the two datasets. Consistent with this pattern, the Mantel test detected no significant correlation between the morphological and TPC distance matrices (r = 0.0142, p = 0.393).
Figure 6.
Tanglegram comparing dendrograms derived from fruit morphological traits (left) and total phenolic content (TPC) (right) in M. rupestris. Lines connect corresponding accessions between dendrograms. The high number of crossing links indicates low congruence between clustering patterns. Mantel test results revealed no significant correlation between morphological and TPC distance matrices (r = 0.0142, p = 0.393; 999 permutations).
The correlation heatmap (Figure 7) identified significant associations among environmental, morphological, and TPC variables. Moisture content was negatively correlated with total soluble solids (°Brix) (r = −0.45) and positively correlated with seed number (r = 0.46). Fruit weight was positively correlated with fruit length and fruit width, while fruit length and fruit width were also positively associated. In addition, fruit width showed a positive correlation with pedicel length.
Figure 7.
Pearson correlation matrix among environmental, morphological, and TPC variables of M. rupestris populations from the southern Ecuadorian Andes. Correlation coefficients (r) are displayed within each cell. Blue colors indicate positive correlations, whereas red colors indicate negative correlations, with color intensity proportional to the strength of the correlation.
Among environmental variables, altitude and temperature displayed a strong negative correlation as expected due to the fact that there is a thermic reduction at high altitude in mountains. Total phenolic content showed weak correlations with most morphological traits, with no strong associations detected.
4. Discussion
This study provides an integrated assessment of sequence variation, fruit morphology, and total phenolic content (TPC) in wild M. rupestris accessions from southern Ecuador. From a horticultural perspective, the evaluated traits provide baseline information on fruit size, soluble solids, seed content, moisture, and phenolic variation in an underutilized Andean fruit. These characteristics can support the initial identification of material for future propagation, cultivation, postharvest, and domestication studies. Nevertheless, the study was conducted on wild accessions rather than plants grown under standardized conditions, and the provinces were represented unequally (Azuay, n = 23; Cañar, n = 4; Loja, n = 4) in the morphological and TPC analyses. Provincial comparisons should therefore be interpreted as exploratory patterns within the sampled material rather than definitive estimates of regional differentiation.
4.1. Genetic Diversity and Geographic Structure
The maximum likelihood analysis of the concatenated nuclear ribosomal markers ITS and 18S–26S, using the Tamura three-parameter (T92) model selected for the sequence dataset, recovered four principal multi-provincial clades together with several intermediate lineages. Accessions from Azuay, Cañar, and Loja were intermingled across the topology rather than forming province-exclusive monophyletic groups. Consistent with this pattern, the analysis of molecular variance indicated that most molecular variation occurred within the sampled provincial groups (86.78%), whereas 13.22% was attributable to differences among provinces. A predominance of within-population or within-region genetic variation is frequently reported for long-lived, outcrossing woody plants [14,37]. However, because the present reconstruction was based on a limited set of ribosomal regions, it should be interpreted as a representation of sequence relationships among the sampled accessions, not as a fully resolved history of populations or lineages.
The global FST value was 0.13225 (p = 0.00391), indicating significant genetic differentiation among the sampled provincial groups. Pairwise comparisons detected significant differentiation between Loja and both Azuay (FST = 0.13560, p = 0.00488) and Cañar (FST = 0.32369, p = 0.00586), whereas differentiation between Azuay and Cañar was lower and not significant (FST = 0.05816, p = 0.15039). Thus, the Azuay and Cañar samples exhibited greater genetic similarity to each other than either did to the Loja samples. Nevertheless, the magnitude of the observed differentiation should be interpreted cautiously because of the small and unequal provincial sample sizes and the limited number of genetic markers analyzed. Furthermore, FST quantifies genetic differentiation but does not, by itself, identify the historical or contemporary processes responsible for the observed pattern. The comparatively high haplotype diversity recorded for Loja (Hd = 0.7818) and the higher nucleotide diversity observed in Azuay (π\pi = 0.00744) should therefore be regarded as characteristics of the sampled dataset that require confirmation through more balanced sampling and additional independent loci [14].
Several non-exclusive processes could produce the observed combination of intermingled sequence lineages and regional differentiation, including retention of ancestral variation, historical gene flow, and spatially restricted contemporary gene flow across the heterogeneous Andean landscape [34]. Dispersal of fleshy fruits by birds or mammals is biologically plausible for M. rupestris [38], and topographic discontinuities or the Amotape–Huancabamba biogeographic transition could potentially contribute to differentiation toward southern Ecuador [39]. Because disperser movement, pollen flow, landscape resistance, and demographic history were not measured, these mechanisms remain hypotheses rather than demonstrated explanations. Landscape-genetic studies with broader geographic coverage, balanced sample sizes, and higher-resolution markers will be required to distinguish among them.
4.2. Morphological Variation and Horticultural Relevance
From a horticultural perspective, the evaluated traits provide baseline information on fruit size, composition, sweetness, seed content, and phenolic variation in this underutilized Andean species. These characteristics are relevant to the initial assessment of fruit quality and may help guide future studies on propagation, cultivation, postharvest performance, and domestication. However, the present study did not evaluate plant performance under cultivated conditions; therefore, the findings should be interpreted as a preliminary characterization of wild accessions. Their interpretation is also limited by the unequal representation of accessions from Azuay, Cañar, and Loja.
Provincial differentiation was restricted to soluble solids content, seed number, and pedicel length, whereas fruit dimensions, fresh and dry weight, moisture content, and TPC showed no significant differences. Accessions from Loja had higher soluble solids content than those from Azuay and Cañar, while seed number differed significantly only between Cañar and Azuay. Pedicel length differed between Azuay and Loja, with Cañar showing intermediate values and no significant difference from either province. Therefore, the evaluated traits did not exhibit a common geographic pattern, suggesting that their variation among the sampled accessions may reflect different combinations of genetic, developmental, and local environmental influences.
Among these characteristics, soluble solids content has the clearest horticultural relevance because it is commonly associated with sweetness, ripening, and consumer perception of fruit quality. Sugar accumulation and soluble solids concentration can be influenced by genotype and maturity, as well as by temperature, solar radiation, crop load, and fruit water relations [40,41]. Consequently, the higher values recorded in Loja identify a potentially interesting pattern for future evaluation but cannot be attributed to a specific environmental or genetic factor based on the present observational study. Confirming whether this characteristic is maintained under cultivation would require common-garden or multi-environment trials in which fruit maturity and crop-management conditions are standardized.
Seed number was descriptively highest in Cañar, but the adjusted pairwise analysis supported a difference only between Cañar and Azuay. This distinction is important because the results do not demonstrate that Cañar differed from the other provinces. In berry crops, seed formation can be affected by pollen source, pollination success, ovule availability, and maternal resources, and it may also be associated with fruit development and final fruit size [42,43,44]. However, pollination, ovule number, resource allocation, and reproductive phenology were not evaluated in M. rupestris. These mechanisms should therefore be regarded as hypotheses for subsequent reproductive-biology studies rather than explanations for the provincial pattern observed here. Similarly, variation in pedicel characteristics can be relevant to fruit retention, detachment, harvesting, and postharvest handling in cultivated fruit crops [42]. None of these mechanisms or performance traits was measured here. Consequently, the seed-number and pedicel-length results should be treated as descriptive findings that identify questions for reproductive-biology and harvest-quality studies, rather than as evidence of contrasting pollination or harvesting performance among provinces.
The positive correlations among fruit weight, length, width, and pedicel length are consistent with developmental integration among fruit structures and with allometric relationships reported for other fleshy fruits [11,45,46]. By contrast, the association of lower soluble solids with higher humidity and the positive association between humidity and seed number were observational. They may reflect fruit water relations or reproductive responses to moisture, but humidity may also covary with altitude, temperature, radiation, maturity, or other unmeasured site characteristics [47,48,49,50,51]. These correlations therefore do not demonstrate an osmotic-dilution mechanism or justify specific irrigation recommendations. Controlled experiments will be needed to evaluate whether manipulating water availability changes sweetness or reproductive output in M. rupestris.
4.3. Phenolic Variation and Its Relationship with Fruit Morphology
Total phenolic content varied from 15.10 to 44.74 mg GAE/g DW among the evaluated M. rupestris accessions, indicating substantial within-sample phytochemical variation. However, TPC did not differ significantly among Azuay, Cañar, and Loja (p = 0.478), suggesting that the observed variation was not consistently structured according to province. This result should be interpreted cautiously because the low and unequal representation of accessions from Cañar and Loja limited the ability to detect geographic patterns. Nevertheless, the range of values recorded indicates that individual accessions may differ considerably in their total concentration of phenolic compounds. Similar levels of variation in phenolic compounds have been reported in native Andean fruits and other Ericaceae species, emphasizing the importance of these taxa as reservoirs of bioactive metabolites [20,51]. The total phenolic content observed in M. rupestris was higher than values reported for several cultivated blueberry (Vaccinium spp.) cultivars, which typically range between 10 and 30 mg GAE/g DW depending on genotype, fruit maturity, and analytical methodology [52,53]. Moreover, metabolomic studies including neotropical Ericaceae have identified M. rupestris as a species with a rich phenolic profile and strong antioxidant potential, supporting its value as an underutilized native fruit with promising nutritional and functional properties [54]. However, this comparison should be interpreted cautiously because M. rupestris is a wild species, whereas the blueberry values were primarily obtained from cultivated germplasm. Domestication and breeding commonly favor fruit size, yield, palatability, reduced bitterness, and other commercial attributes, potentially altering or reducing the accumulation and diversity of some defense-related secondary metabolites. Studies comparing wild and cultivated berries have likewise reported marked differences in secondary-metabolite profiles and, in some cases, higher phenolic concentrations in wild germplasm [55,56].
The tanglegram comparing the morphological and TPC dendrograms showed substantial topological incongruence, while the Mantel test detected no significant correlation between the corresponding distance matrices (r = 0.0142, p = 0.393). Therefore, no evidence was found that the fruit morphological traits evaluated here could serve as a reliable indirect proxy for TPC under the present sampling and analytical conditions. This result should not be interpreted as demonstrating complete biological independence between fruit morphology and phenolic composition; rather, no statistically detectable correspondence was identified within the scope and resolution of the present study [57].
4.4. Implications, Limitations, and Future Directions
For conservation programs, the information generated is highly relevant because it allows for prioritizing and selecting individuals for conservation through different strategies, based on the genetic diversity found. Similarly, the described morphological characteristics and polyphenol content provide a more complete understanding of the characteristics of M. rupestris populations present in southern Ecuador.
It is important to mention that any activities regarding M. rupestris should be carefully planned to avoid increasing harvesting pressure on natural populations, which could lead to population decline, as has been reported for other native Andean fruits such as mortiño (Vaccinium floribundum Kunth) [58]. The information generated in this study also provides a basis for domestication and cultivation programs aimed at producing M. rupestris outside its natural distribution areas. Such initiatives could reduce pressure on wild populations while promoting the sustainable use of the species. Furthermore, the development of cultivation technologies could allow the manipulation of desirable fruit traits, such as sweetness and seed production, through environmental management, including humidity regulation, while considering consumer preferences. Future studies should also investigate the effects of environmental and nutritional conditions, soil characteristics, and other agronomic factors on fruit production that allow domestication of this species. Together, these efforts could support local economic development while simultaneously promoting the conservation and valorization of this native Andean species and its associated ecological and food systems.
Several limitations define the scope of the conclusions. First, the marked imbalance among provinces, particularly the four accessions each from Cañar and Loja, limits statistical power and the extent to which the observed patterns can be generalized to the corresponding geographic populations. Small sample sizes may provide an incomplete representation of within-population genetic and phenotypic variation and increase uncertainty in estimates of population differentiation and diversity [59,60]. Similar sampling constraints are frequently encountered in studies of rare plants and plant species with extremely small populations, for which restricted population sizes, fragmented distributions, and limited availability of reproductive material can constrain the number of individuals available for analysis such in this study [32,61]. Therefore, the present results should be regarded as a baseline characterization of the sampled accessions rather than a comprehensive assessment of provincial diversity. Future studies should prioritize larger and more balanced sampling across populations and sampling sites, complemented by higher-resolution molecular markers and, where feasible, temporal or repeated sampling. Common-garden or multi-environment experiments would further help distinguish genetic variation from environmentally induced phenotypic variation. Standardized fruit-maturity assessment and targeted phenolic profiling would also improve the characterization of fruit quality and functional potential. Together, these approaches would allow the patterns identified here to be tested more robustly and provide stronger evidence for the conservation, domestication, and sustainable cultivation of M. rupestris.
5. Conclusions
Molecular analyses revealed significant genetic differentiation among the sampled provincial groups of M. rupestris. The maximum likelihood analysis based on the concatenated nuclear ribosomal regions ITS and 18S–26S recovered several sequence lineages containing accessions from different provinces, without province-exclusive clustering. AMOVA showed that most molecular variation occurred within the sampled provincial groups (86.78%), whereas a smaller proportion occurred among groups (13.22%). Nevertheless, the global (FST) value indicated significant differentiation among the sampled provincial groups, and pairwise comparisons detected differentiation particularly between Loja and both Azuay and Cañar. Thus, the phylogenetic topology and the differentiation analyses described complementary aspects of the genetic dataset. However, the small and unequal provincial sample sizes and the limited number of ribosomal regions analyzed require cautious interpretation and preclude definitive conclusions regarding gene flow, dispersal mechanisms, or population history.
Fruit traits exhibited limited differentiation among the sampled provincial groups. Fruit dimensions, fresh and dry fruit weight, and fruit moisture content did not differ significantly, whereas soluble solids content, seed number, and pedicel length showed specific pairwise differences. The higher soluble solids content recorded in the four Loja accessions and the seed-number differences detected between the sampled Cañar and Azuay accessions identify exploratory patterns of potential horticultural interest. However, these findings should not be generalized to the corresponding provinces because of the small and unequal group sizes. Fruit moisture content was negatively correlated with soluble solids content and positively correlated with seed number. These observational associations may reflect differences in fruit composition, water content, developmental stage, or maturity, but they do not establish causal relationships and should be evaluated under standardized or controlled conditions.
Total phenolic content varied considerably among accessions, ranging from 15.10 to 44.74 mg GAE/g DW, but did not differ significantly among the sampled provincial groups or show significant associations with the measured environmental variables. The observed values overlapped with or exceeded those reported for some cultivated blueberry (Vaccinium spp.) cultivars, supporting further investigation of M. rupestris as an underutilized fruit with potential functional attributes. Nevertheless, comparisons with cultivated berries should be interpreted cautiously because domestication history, genotype, fruit maturity, growing conditions, extraction procedures, and analytical methodology can influence TPC estimates.
Finally, the Mantel test detected no significant correlation between the morphological and TPC distance matrices. Therefore, no evidence was found that the fruit traits evaluated here could serve as a reliable indirect proxy for TPC under the present sampling and analytical conditions. Accessions of potential phytochemical interest should consequently be identified through direct biochemical screening. Overall, this study provides an integrated baseline assessment of sequence, fruit-trait, and phenolic variation among the sampled wild M. rupestris accessions from southern Ecuador. Given the small and unequal provincial sample sizes, further research using larger and more balanced population samples, broader geographic coverage, higher-resolution molecular markers, standardized fruit-maturity criteria, and common-garden or multi-environment trials will be necessary to validate the patterns identified here before they can be translated into conservation, domestication, and sustainable cultivation strategies.
Supplementary Materials
The following supporting information can be downloaded at https://www.mdpi.com/article/10.3390/horticulturae12091162/s1: Figure S1: Representative individuals of Macleania rupestris growing in their natural montane forest habitat, showing the species’ shrubby growth habit, leaf arrangement, and characteristic fruit morphology. Table S1: Descriptive statistics for the morphological, physicochemical, and phytochemical traits of Macleania rupestris accessions from Azuay, Cañar, and Loja provinces. Table S2: Kruskal–Wallis test results for morphological, physicochemical, and phytochemical traits of Macleania rupestris accessions from Azuay, Cañar, and Loja provinces. Differences among provinces were considered statistically significant at p < 0.05. H, Kruskal–Wallis test statistic; df, degrees of freedom; ns, not significant; *, p < 0.05; **, p < 0.01. Table S3: Dunn’s pairwise comparisons with Holm adjustment for traits showing significant differences among Macleania rupestris accessions from Azuay, Cañar, and Loja provinces. Dunn’s post hoc test was performed only for traits with a significant global Kruskal–Wallis result. For each trait, p-values were adjusted across the three pairwise comparisons using the Holm method. Adjusted p-values below 0.05 were considered statistically significant. n1 and n2 represent the numbers of accessions included from Province 1 and Province 2, respectively; Z, Dunn’s test statistic; ns, not significant; *, adjusted p < 0.05.
Author Contributions
Conceptualization, D.P.-T., Á.M.-A. and S.P.-L.; methodology, D.P.-T., Á.M.-A., S.P.-L. and F.L.-T.; validation, D.P.-T., Á.M.-A., S.P.-L. and O.J.; formal analysis, D.C.-S., P.C.-Q. and D.P.-T.; investigation, D.P.-T., D.C.-S., S.G., J.C.-L. and P.C.-Q.; resources, S.G., P.G.V.-O., C.A.J. and D.P.-T.; data curation, D.C.-S. and P.C.-Q.; writing—original draft preparation, D.P.-T. and D.C.-S.; writing—review and editing, D.P.-T., O.J., Á.M.-A., S.P.-L. and F.L.-T.; visualization, D.C.-S., D.P.-T. and P.C.-Q.; supervision, D.P.-T., Á.M.-A. and S.P.-L.; project administration, D.P.-T.; funding acquisition, D.P.-T. All authors have read and agreed to the published version of the manuscript.
Funding
The authors thank the Vice-Rectorate for Research of the University of Cuenca and Fondo de Investigación para la Agrobiodiversidad, Semillas y Agricultura Sustentable (FIASA) for funding the Project “Investigación, conservación y desarrollo de metodologías para el aprovechamiento sustentable de Macleania rupestris (joyapa) en los andes del sur del Ecuador” funding FIASA-CA-2023-009 under permit No. MAAE-ARSFC-2021-1854, granted by the National Biodiversity Directorate of the Ministry of Environment of Ecuador.
Data Availability Statement
Representative images of Macleania rupestris specimens and tables containing sample identification codes and general altitude ranges are provided within the article and its Supplementary Materials. Due to conservation and biosecurity concerns, precise geographic coordinates and detailed locality information are not publicly available. Additional datasets generated during the current study are available from the corresponding author upon reasonable request, subject to restrictions related to ongoing research activities and species conservation.
Acknowledgments
We sincerely thank the local communities and landowners who kindly granted access to their territories and facilitated field sampling activities, making the collection of Macleania rupestris samples possible. The authors also express their sincere gratitude to Beverley Wemple for her valuable assistance in reviewing and improving the English language of this manuscript. During the preparation of this manuscript, the authors used ChatGPT (OpenAI, GPT-5) to improve the visual presentation of the map shown in Figure 1, illustrating the geographic distribution of sampling locations in southern Ecuador. The original map, including all sampling coordinates and geographic information, was developed by the authors. ChatGPT was used solely to enhance the graphical design and visualization of the figure. All data verification, interpretation, and final editing of the figure were performed by the authors. ChatGPT was not used for data analysis, interpretation of results, or scientific decision-making.
Conflicts of Interest
The authors declare no conflicts of interest.
Appendix A
Table A1.
Identification of Macleania rupestris samples used for molecular, morphological, and total phenolic content (TPC) analyses.
References
- Luteyn, J. The Plant Family Ericaceae (“Blueberries”) in Ecuador: Ecology, Diversity, Economic Importance, and Conservation. Rev. Ecuat. Med. Cienc. Biológ. 2021, 42, 79–98. [Google Scholar] [CrossRef] [Scilit]
- Pacheco Flores de Valgaz, A.; Barcos-Arias, M.; Naranjo-Morán, J.; Peña Tapia, D.; Moreira-Gómez, R. Ericaceous Plants: A Review for the Bioprospecting of Ericoid Mycorrhizae from Ecuador. Diversity 2022, 14, 648. [Google Scholar] [CrossRef] [Scilit]
- Kron, K.A.; Judd, W.S.; Stevens, P.F.; Crayn, D.M.; Anderberg, A.A.; Gadek, P.A.; Quinn, C.J.; Luteyn, J.L. Phylogenetic Classification of Ericaceae: Molecular and Morphological Evidence. Bot. Rev. 2002, 68, 335–423. [Google Scholar] [CrossRef] [Scilit]
- Pedraza-Penalosa, P. New Blueberry and Mortiño Relatives (Ericaceae) from Northwestern Colombia. PhytoKeys 2015, 49, 33–58. [Google Scholar] [CrossRef] [Scilit]
- Lagos-Burbano, T.C.; Ordóñez-Jurado, H.; Criollo-Escobar, H.; Burbano, S.; Martínez, Y. Descripción de frutales nativos de la familia Ericaceae en el altiplano de Pasto, Colombia. Rev. Colomb. Cienc. Hortíc. 2010, 4, 9–18. [Google Scholar] [CrossRef] [Scilit]
- Reyes, A.; Rodríguez, D.; Rodríguez, D.; Castillo-Navarro, Y.; Restrepo, H.; Pardo, L.; Salgado, O.; Duque-Osorio, R.; Reyes-Amaya, N. Reproductive Aspects of Female Andean Bears (Tremarctos ornatus) in the Chingaza Massif, Eastern Range of the Colombian Andes. Mammalia 2024, 88, 75–84. [Google Scholar] [CrossRef] [Scilit]
- Casolo, V.; Braidot, E.; Petrussa, E.; Zancani, M.; Vianello, A.; Boscutti, F. Relationships between Population Traits, Nonstructural Carbohydrates, and Elevation in Alpine Stands of Vaccinium myrtillus. Am. J. Bot. 2020, 107, 639–649. [Google Scholar] [CrossRef] [Scilit]
- Gyssels, G.; Poesen, J.; Bochet, E.; Li, Y. Impact of Plant Roots on the Resistance of Soils to Erosion by Water: A Review. Prog. Phys. Geogr. 2005, 29, 189–217. [Google Scholar] [CrossRef] [Scilit]
- Wang, J.-H.; Cai, Y.-F.; Zhang, L.; Xu, C.-K.; Zhang, S.-B. Species Richness of the Family Ericaceae along an Elevational Gradient in Yunnan, China. Forests 2018, 9, 511. [Google Scholar] [CrossRef] [Scilit]
- Durán-Casas, S.; Veloza-Suan, C.; Magnitskiy, S.; Lancheros, H.O. Evaluation of Uva Camarona (Macleania rupestris Kunth A.C. Smith) Propagation with Air Layering. Agron. Colomb. 2013, 31, 18–26. [Google Scholar]
- Des Roches, S.; Post, D.M.; Turley, N.E.; Bailey, J.K.; Hendry, A.P.; Kinnison, M.T.; Schweitzer, J.A.; Palkovacs, E.P. The Ecological Importance of Intraspecific Variation. Nat. Ecol. Evol. 2018, 2, 57–64. [Google Scholar] [CrossRef] [Scilit]
- Kliebenstein, D. Quantitative Genomics: Analyzing Intraspecific Variation Using Global Gene Expression Polymorphisms or eQTLs. Annu. Rev. Plant Biol. 2009, 60, 93–114. [Google Scholar] [CrossRef] [Scilit]
- Frankham, R.; Ballou, J.D.; Briscoe, D.A. Introduction to Conservation Genetics; Cambridge University Press: Cambridge, UK, 2002. [Google Scholar]
- Nybom, H. Comparison of Different Nuclear DNA Markers for Estimating Intraspecific Genetic Diversity in Plants. Mol. Ecol. 2004, 13, 1143–1155. [Google Scholar] [CrossRef] [Scilit]
- Tripathi, V. Assessment of Genetic Diversity in Berberis lycium Royle Complex Using RAPD Markers. J. Cell Biol. Genet. 2013, 3, 1–13. [Google Scholar] [CrossRef] [Scilit]
- Allendorf, F.W.; Hohenlohe, P.A.; Luikart, G. Genomics and the Future of Conservation Genetics. Nat. Rev. Genet. 2010, 11, 697–709. [Google Scholar] [CrossRef] [Scilit]
- Cao, Y.; Ma, Y.; Li, Z.; Liu, X.; Liu, D.; Qu, S.; Ma, H. Genetic Diversity and Population Structure of Rhododendron longipedicellatum, an Endangered Species. Trop. Conserv. Sci. 2022, 15, 19400829221078112. [Google Scholar] [CrossRef] [Scilit]
- Powell, E.A.; Kron, K.A. Molecular Systematics of the Northern Andean Blueberries (Vaccinieae, Vaccinioideae, Ericaceae). Int. J. Plant Sci. 2003, 164, 987–995. [Google Scholar] [CrossRef] [Scilit]
- Contreras-Calderón, J.; Calderón-Jaimes, L.; Guerra-Hernández, E.; García-Villanova, B. Antioxidant Capacity, Phenolic Content and Vitamin C in Pulp, Peel and Seed from 24 Exotic Fruits from Colombia. Food Res. Int. 2011, 44, 2047–2053. [Google Scholar] [CrossRef] [Scilit]
- Vasco, C.; Ruales, J.; Kamal-Eldin, A. Total Phenolic Compounds and Antioxidant Capacities of Major Fruits from Ecuador. Food Chem. 2008, 111, 816–823. [Google Scholar] [CrossRef] [Scilit]
- FAO. The Second Report on the State of the World’s Plant Genetic Resources for Food and Agriculture. Available online: https://www.fao.org/4/i1500e/i1500e00.htm (accessed on 26 January 2026).
- Khoury, C.K.; Bjorkman, A.D.; Dempewolf, H.; Ramirez-Villegas, J.; Guarino, L.; Jarvis, A.; Rieseberg, L.H.; Struik, P.C. Increasing Homogeneity in Global Food Supplies and the Implications for Food Security. Proc. Natl. Acad. Sci. USA 2014, 111, 4001–4006. [Google Scholar] [CrossRef] [Scilit]
- Guarino, L.; Ramanatha Rao, V.; Reid, R.S. Collecting Plant Genetic Diversity: Technical Guidelines; CAB International: Wallingford, UK, 1995. [Google Scholar]
- Hoban, S.; Strand, A. Ex Situ Seed Collections Will Benefit from Considering Spatial Sampling Design and Species’ Reproductive Biology. Biol. Conserv. 2015, 187, 182–191. [Google Scholar] [CrossRef] [Scilit]
- Masoomi-Aladizgeh, F.; Jabbari, L.; Nekouei, R.K.; Aalami, A.; Atwell, B.J.; Haynes, P.A. A Universal Protocol for High-Quality DNA and RNA Isolation from Diverse Plant Species. PLoS ONE 2023, 18, e0295852. [Google Scholar] [CrossRef] [Scilit]
- Möller, M.; Cronk, Q.C.B. Origin and Relationships of Saintpaulia (Gesneriaceae) Based on Ribosomal DNA Internal Transcribed Spacer (ITS) Sequences. Am. J. Bot. 1997, 84, 956–965. [Google Scholar] [CrossRef] [Scilit]
- Pedraza, P. Systematics of the Neotropical Blueberry Genus Disterigma (Ericaceae). Syst. Bot. 2009, 34, 406–413. [Google Scholar] [CrossRef] [Scilit]
- Kumar, S.; Stecher, G.; Suleski, M.; Sanderford, M.; Sharma, S.; Tamura, K. MEGA12: Molecular Evolutionary Genetic Analysis Version 12 for Adaptive and Green Computing. Mol. Biol. Evol. 2024, 41, msae263. [Google Scholar] [CrossRef] [Scilit]
- Thompson, J.D.; Higgins, D.G.; Gibson, T.J. CLUSTAL W: Improving the Sensitivity of Progressive Multiple Sequence Alignment through Sequence Weighting, Position-Specific Gap Penalties and Weight Matrix Choice. Nucleic Acids Res. 1994, 22, 4673–4680. [Google Scholar] [CrossRef] [Scilit]
- Vega-Polo, P.; Cobo, M.M.; Argudo, A.; Gutierrez, B.; Rowntree, J.; Torres, M.d.L. Characterizing the Genetic Diversity of the Andean Blueberry (Vaccinium floribundum Kunth.) across the Ecuadorian Highlands. PLoS ONE 2020, 15, e0243420. [Google Scholar] [CrossRef] [Scilit]
- Excoffier, L.; Lischer, H.E.L. Arlequin Suite Ver 3.5: A New Series of Programs to Perform Population Genetics Analyses under Linux and Windows. Mol. Ecol. Resour. 2010, 10, 564–567. [Google Scholar] [CrossRef] [Scilit]
- Peña, D.F.; Villena, P.; Curillo, D.; Jiménez, C.A.; Ordoñez, E.; Jadán, O. Intraspecific Morphological Variation and Environmental Drivers in Macleania rupestris: A Model-Based Population Classification. Front. Plant Sci. 2025, 16, 1645659. [Google Scholar] [CrossRef] [Scilit]
- Kruskal, W.H.; Wallis, W.A. Use of Ranks in One-Criterion Variance Analysis. J. Am. Stat. Assoc. 1952, 47, 583–621. [Google Scholar] [CrossRef] [Scilit]
- Dunn, O.J. Multiple Comparisons Using Rank Sums. Technometrics 1964, 6, 241–252. [Google Scholar] [CrossRef]
- Holm, S. A Simple Sequentially Rejective Multiple Test Procedure. Scand. J. Stat. 1979, 6, 65–70. [Google Scholar]
- Singleton, V.L.; Orthofer, R.; Lamuela-Raventós, R.M. Analysis of Total Phenols and Other Oxidation Substrates and Antioxidants by Means of Folin-Ciocalteu Reagent. In Methods in Enzymology; Elsevier: Amsterdam, The Netherlands, 1999; Volume 299, pp. 152–178. [Google Scholar]
- Luteyn, J.L. Diversity, Adaptation, and Endemism in Neotropical Ericaceae: Biogeographical Patterns in the Vaccinieae. Bot. Rev. 2002, 68, 55–87. [Google Scholar] [CrossRef] [Scilit]
- Hughes, C.E.; Atchison, G.W. The Ubiquity of Alpine Plant Radiations: From the Andes to the Hengduan Mountains. New Phytol. 2015, 207, 275–282. [Google Scholar] [CrossRef] [Scilit]
- Luebert, F.; Weigend, M. Phylogenetic Insights into Andean Plant Diversification. Front. Ecol. Evol. 2014, 2, 27. [Google Scholar] [CrossRef] [Scilit]
- Rosales, M.A.; Rubio-Wilhelmi, M.M.; Castellano, R.; Castilla, N.; Ruiz, J.M.; Romero, L. Sucrolytic Activities in Cherry Tomato Fruits in Relation to Temperature and Solar Radiation. Sci. Hortic. 2007, 113, 244–249. [Google Scholar] [CrossRef] [Scilit]
- Hou, X.; Zhang, W.; Du, T.; Kang, S.; Davies, W.J. Responses of Water Accumulation and Solute Metabolism in Tomato Fruit to Water Scarcity and Implications for Main Fruit Quality Variables. J. Exp. Bot. 2020, 71, 1249–1264. [Google Scholar] [CrossRef] [Scilit]
- Taber, S.K.; Olmstead, J.W. Impact of Cross- and Self-Pollination on Fruit Set, Fruit Size, Seed Number, and Harvest Timing Among 13 Southern Highbush Blueberry Cultivars. HortTechnology 2016, 26, 213–219. [Google Scholar] [CrossRef] [Scilit]
- Strelin, M.M.; Aizen, M.A. The Interplay between Ovule Number, Pollination and Resources as Determinants of Seed Set in a Modular Plant. PeerJ 2018, 6, e5384. [Google Scholar] [CrossRef] [Scilit]
- Doi, K.; Nozaki, R.; Takahashi, K.; Iwasaki, N. Effects of the Number of Seeds per Berry on Fruit Growth Characteristics, Especially on the Duration of Stage II in Blueberry. Plants 2018, 7, 96. [Google Scholar] [CrossRef] [Scilit]
- Herrera, C.M.; Jordano, P.; Guitián, J.; Traveset, A. Annual Variability in Seed Production by Woody Plants and the Masting Concept: Reassessment of Principles and Relationship to Pollination and Seed Dispersal. Am. Nat. 1998, 152, 576–594. [Google Scholar] [CrossRef]
- Kader, A.A. Flavor Quality of Fruits and Vegetables. J. Sci. Food Agric. 2008, 88, 1863–1868. [Google Scholar] [CrossRef] [Scilit]
- Davies, J.N.; Hobson, G.E. The Constituents of Tomato Fruit—The Influence of Environment, Nutrition, and Genotype. Crit. Rev. Food Sci. Nutr. 1981, 15, 205–280. [Google Scholar] [CrossRef] [Scilit]
- Selås, V.; Sønsteby, A.; Heide, O.M.; Opstad, N. Climatic and Seasonal Control of Annual Growth Rhythm and Flower Formation in Vaccinium myrtillus (Ericaceae), and the Impact on Annual Variation in Berry Production. Plant Ecol. Evol. 2015, 148, 350–360. [Google Scholar] [CrossRef] [Scilit]
- Correia, S.; Schouten, R.; Silva, A.P.; Gonçalves, B. Factors Affecting Quality and Health Promoting Compounds during Growth and Postharvest Life of Sweet Cherry (Prunus avium L.). Front. Plant Sci. 2017, 8, 2166. [Google Scholar] [CrossRef] [Scilit]
- Khan, M.I.R.; Fatma, M.; Per, T.S.; Anjum, N.A.; Khan, N.A. Salicylic Acid-Induced Abiotic Stress Tolerance and Underlying Mechanisms in Plants. Front. Plant Sci. 2015, 6, 135066. [Google Scholar] [CrossRef] [Scilit]
- Schreckinger, M.E.; Lotton, J.; Lila, M.A.; de Mejia, E.G. Berries from South America: A Comprehensive Review on Chemistry, Health Potential, and Commercialization. J. Med. Food 2010, 13, 233–246. [Google Scholar] [CrossRef] [Scilit]
- Baenas, N.; Ruales, J.; Moreno, D.A.; Barrio, D.A.; Stinco, C.M.; Martínez-Cifuentes, G.; Meléndez-Martínez, A.J.; García-Ruiz, A. Characterization of Andean Blueberry in Bioactive Compounds, Evaluation of Biological Properties, and In Vitro Bioaccessibility. Foods 2020, 9, 1483. [Google Scholar] [CrossRef] [Scilit]
- Howard, L.R.; Clark, J.R.; Brownmiller, C. Antioxidant Capacity and Phenolic Content in Blueberries as Affected by Genotype and Growing Season. J. Sci. Food Agric. 2003, 83, 1238–1247. [Google Scholar] [CrossRef] [Scilit]
- Ma, C.; Dastmalchi, K.; Flores, G.; Wu, S.-B.; Pedraza-Peñalosa, P.; Long, C.; Kennelly, E.J. Antioxidant and Metabolite Profiling of North American and Neotropical Blueberries Using LC-TOF-MS and Multivariate Analyses. J. Agric. Food Chem. 2013, 61, 3548–3559. [Google Scholar] [CrossRef] [Scilit]
- Chamorro, M.F.; Mazzoni, A.; Lescano, M.N.; Fernandez, A.; Reiner, G.; Langenheim, M.E.; Mattera, G.; Robredo, N.; Garibaldi, L.; Quintero, C. Wild vs. Cultivated Strawberries: Differential Fruit Quality Traits and Antioxidant Properties in Fragaria chiloensis and Fragaria × ananassa. Discov. Food 2025, 5, 71. [Google Scholar] [CrossRef] [Scilit]
- Sabbadini, S.; Capocasa, F.; Battino, M.; Mazzoni, L.; Mezzetti, B. Improved Nutritional Quality in Fruit Tree Species through Traditional and Biotechnological Approaches. Trends Food Sci. Technol. 2021, 117, 125–138. [Google Scholar] [CrossRef] [Scilit]
- Karapetsi, L.; Pantelidis, G.; Pratsinakis, E.D.; Drogoudi, P.; Madesis, P. Fruit Quality Traits and Genotypic Characterization in a Pomegranate Ex Situ (Punica granatum L.) Collection in Greece. Agriculture 2021, 11, 482. [Google Scholar] [CrossRef] [Scilit]
- Vasquez-Castillo, W.; Ayala, K.; Almeida, M.; Barrientos-Priego, A.F.; Moncayo-Moncayo, P.; Monteros-Altamirano, Á. Morphological In Situ Characterization of Mortiño (Vaccinium floribundum Kunth) in the Andes of Ecuador. Int. J. Adv. Sci. Eng. Inf. Technol. 2022, 12, 1714–1720. [Google Scholar] [CrossRef] [Scilit]
- Barrett, S.C.H.; Kohn, J.R. Genetic and Evolutionary Consequences of Small Population Size in Plants: Implications for Conservation. In Genetics and Conservation of Rare Plants; Falk, D.A., Holsinger, K.E., Falk, D.A., Holsinger, K.E., Eds.; Oxford University Press: Oxford, UK, 1991; pp. 3–30. [Google Scholar]
- Teixeira, T.M.; Nazareno, A.G. One Step Away From Extinction: A Population Genomic Analysis of A Narrow Endemic, Tropical Plant Species. Front. Plant Sci. 2021, 12, 730258. [Google Scholar] [CrossRef] [Scilit]
- Nazareno, A.G.; Bemmels, J.B.; Dick, C.W.; Lohmann, L.G. Minimum Sample Sizes for Population Genomics: An Empirical Study from an Amazonian Plant Species. Mol. Ecol. Resour. 2017, 17, 1136–1147. [Google Scholar] [CrossRef] [Scilit]

Disclaimer/Publisher’s Note: The statements, opinions and data contained in all publications are solely those of the individual author(s) and contributor(s) and not of MDPI and/or the editor(s). MDPI and/or the editor(s) disclaim responsibility for any injury to people or property resulting from any ideas, methods, instructions or products referred to in the content. |
© 2026 by the authors. Licensee MDPI, Basel, Switzerland. This article is an open access article distributed under the terms and conditions of the Creative Commons Attribution (CC BY) license.