1. Introduction
Horticultural crop production systems encompass diverse cultivation patterns and constitute an essential foundation for ensuring high-quality agricultural product supply and enhancing agricultural efficiency [
1]. In practical production processes, the continuous occurrence and periodic outbreaks of pests have long been recognized as critical limiting factors affecting yield stability, commodity quality, and input cost control [
2]. With the promotion of high-density planting systems, the increasing proportion of facility-based cultivation, and intensified climate variability [
3], traditional plant protection strategies have become increasingly ineffective for timely response. This frequently results in missed optimal control windows as well as excessive pesticide application and inefficient use of control resources [
4]. Consequently, the development of intelligent perception and intervention-driven decision-making technologies tailored to horticultural production scenarios has become critically important for improving the precision of plant protection management, reducing environmental burdens, and promoting sustainable production [
5].
In long-standing practice, pest monitoring and control have primarily depended on manual field surveys, trap-based statistics, and experience-driven threshold decision methods [
6]. We define pest monitoring in this context as the systematic and continuous observation of pest populations and their activities within a specific horticultural environment to track developmental dynamics over time. Early research efforts focused on traditional image processing, utilizing color space segmentation, texture feature extraction, and morphological feature matching to achieve target detection and classification [
7,
8]. These approaches were primarily founded on manually designed feature principles, where pest regions were segmented through interpretable descriptor spaces [
9,
10]. However, in high-density facility-based production, environments are often characterized by high temperatures and humidity that make continuous manual inspection labor-intensive and unsustainable for the 24/7 automated surveillance required in modern horticulture [
3,
4]. Traditional methods often miss optimal control windows because they cannot provide the constant, granular surveillance required to capture rapid pest population shifts under complex backgrounds and illumination variations [
11,
12,
13]. Similarly, pest occurrence risk assessment has traditionally relied on empirical thresholds to predict population trends [
14,
15]. In this study, occurrence risk is explicitly defined as the probability of reaching the Economic Threshold based on the coupling of current pest population density and environmental factors. While stable in controlled environments, these methods treat visual recognition and risk assessment as separate processes without a unified information fusion mechanism [
16,
17]. This fragmentation makes it difficult to directly translate monitoring results into reliable control decision support, overlooking the production reality that pest occurrence does not always equate to damaging outbreaks [
18].
With the rapid advancement of deep learning, visual recognition models based on convolutional neural networks and attention mechanisms have established a new paradigm for agricultural perception [
19,
20]. Multi-scale feature fusion strategies and feature pyramid architectures have been widely adopted to enhance small-object detection capability [
21,
22,
23,
24]. Meanwhile, temporal neural networks have been introduced to perform nonlinear modeling of multivariate time series for pest outbreak prediction [
25,
26,
27]. Nevertheless, most existing studies remain predominantly focused on the single objective of category recognition accuracy, while decision-relevant information such as occurrence intensity and management thresholds remains insufficiently modeled [
28,
29,
30]. This recognition-centric paradigm leads to underutilization of available information, as production decisions are more closely associated with outbreak probability than with isolated recognition outcomes [
31,
32]. Furthermore, recognition and outbreak prediction models are often trained independently and applied in a cascaded manner, allowing errors to accumulate along the decision pipeline and undermining practical value [
33,
34].
The development of multimodal and multi-task learning provides a technical pathway to address this fragmentation by jointly modeling complementary information from different data sources within a shared representation space [
35,
36]. In agricultural perception, multimodal fusion enables models to exploit cross-source consistency constraints between images and meteorological data to mitigate single-modality noise [
37,
38]. We characterize this as multisource sensor data fusion, which is the technical process of integrating heterogeneous inputs, such as visual image streams and environmental sensor sequences, to form a more robust perception of the crop state. This fusion underpins multimodal pest recognition, a paradigm where pests are classified by interpreting visual phenotypes through their corresponding ecological context, ensuring the recognition result is consistent with environmental realities. This multimodal strategy is especially effective for addressing cases where pests are visually similar but present fundamentally different ecological outbreak probabilities. By integrating environmental variables, the model can distinguish between a manageable pest presence and a state of high intervention necessity driven by climatic factors—a distinction that remains invisible to vision-only systems or manual inspection [
33,
39]. These advancements culminate in decision-oriented pest detection, an approach where the detection process is intrinsically designed to output actionable signals regarding whether a management threshold has been crossed, rather than simply identifying pest presence. Despite the potential of intelligent perception, a significant gap remains in transitioning from simple identification to actionable decision support. Most existing studies focus on the single objective of category recognition accuracy, treating visual recognition and risk assessment as separate processes without a unified information fusion mechanism [
40]. This recognition-centric paradigm leads to an underutilization of environmental context, often resulting in missed optimal control windows or inefficient pesticide application when errors accumulate along independent, cascaded decision pipelines [
41,
42,
43].
Against this background, the present study is oriented toward the objective of transitioning from isolated pest recognition to intervention-driven decision-making. We propose a multimodal pest recognition and outbreak probability joint modeling method tailored to horticultural production scenarios. By collaboratively optimizing visual feature learning and environmental condition modeling within a unified network, the model is enabled not only to answer what pest is present, but also to further determine whether the ecological context necessitates immediate intervention [
39,
44]. The main contributions of this study are summarized as follows:
- 1.
A multimodal data integration mechanism is constructed to jointly input pest image information and environmental temporal variables such as temperature, humidity, and illumination, enabling ecological-condition-aware representation learning, detailed in
Section 2.1.
- 2.
An environment-guided feature modulation module is designed to adaptively regulate visual representations at the feature level using environmental information, thereby learning discriminative features associated with specific occurrence contexts, detailed in
Section 2.3.3.
- 3.
A recognition–outbreak joint loss function and multi-task collaborative training strategy are introduced to enhance model stability and generalization capability in complex horticultural scenarios, detailed in
Section 2.3.4.
- 4.
A risk-driven decision framework is established from an agricultural economics perspective to bridge the gap between pest detection and intervention necessity. By modeling the probability of reaching Economic Thresholds through the coupling of pest density and environmental triggers, we demonstrate the system’s practical value in reducing input costs and improving management efficiency, detailed in
Section 3.
2. Materials and Method
2.1. Data Collection
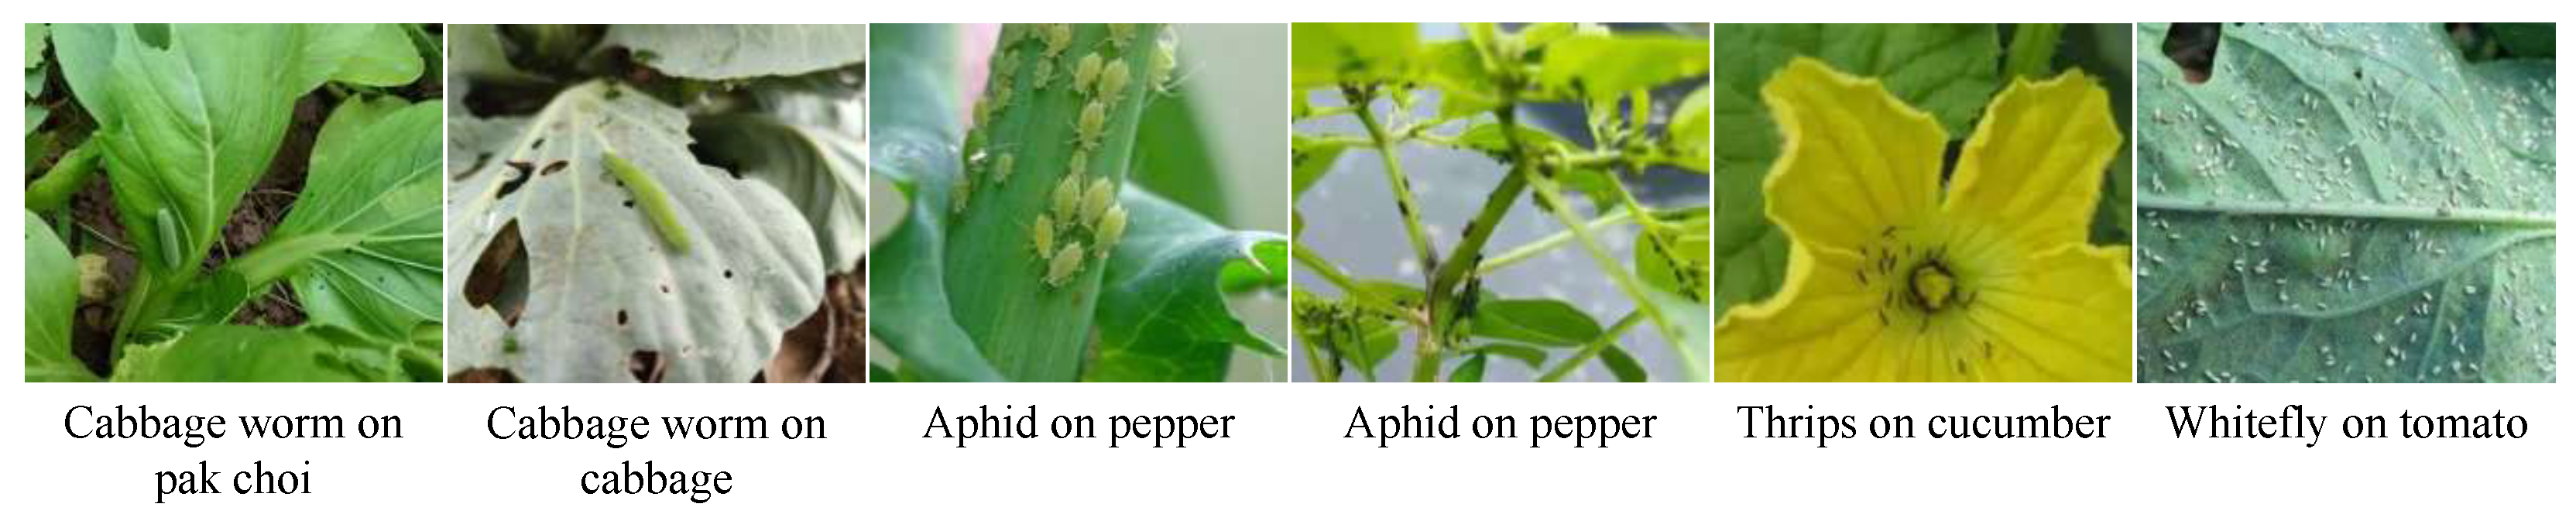
Multimodal data collection was conducted in representative horticultural production areas of Wuyuan County, Bayannur City, Inner Mongolia. The collected data covered both protected horticulture and open-field horticulture scenarios. The main crops included tomato, cucumber, and pepper grown under greenhouse conditions, as well as cabbage and leafy vegetables cultivated in open fields, as shown in
Figure 1. The data collection period spanned from early May to mid-September each year, covering four consecutive growing seasons from 2020 to 2023. Pest image data were acquired through a combination of fixed high-resolution industrial cameras and auxiliary manual field inspection.
The dataset annotation process followed a standardized protocol to ensure high label quality. Labels were assigned and cross-validated by three Certified Plant Entomologist, each possessing over ten years of professional experience in agricultural pest management. These experts performed the labeling according to the National Standards for Monitoring and Forecast of Crop Pests to ensure that the risk levels were consistent with agronomic realities. To quantitatively assess the reliability of the annotations, an inter-annotator agreement protocol was established. The resulting Cohen’s Kappa coefficient reached 0.86, indicating a high level of agreement among the experts and confirming the foundational quality of the labels.
For reproducibility and clarity, the criteria for defining and discretizing the occurrence risk levels are explicitly presented in
Table 1. These standards are based on established agricultural pest management thresholds, where risk is categorized primarily by pest density and potential environmental outbreak triggers.
During image acquisition, shooting time, crop type, and phenological stage information were synchronously recorded. The major pest species captured in the dataset included whiteflies (
Bemisia tabaci), aphids (Aphididae), thrips (Thysanoptera), and cabbage worm (
Pieris rapae), as shown in
Table 2. In the Bayannur region,
Bemisia tabaci and Aphididae primarily threaten greenhouse tomatoes and peppers by sucking sap from the undersides of leaves, often leading to sooty mold or virus transmission that significantly reduces fruit quality and marketable yield. Thysanoptera are major pests for cucumbers, where their rasping-sucking feeding behavior causes silver scarring and deformation of fruits, directly impacting economic value.
Pieris rapae larvae are the dominant pests for open-field cabbage, causing extensive defoliation during their peak occurrence from July to August, which can result in total crop failure if not managed. These species exhibit strong seasonal rhythms driven by local temperature and humidity shifts, justifying their selection as representative targets for joint recognition and risk modeling.
Environmental time-series data were automatically recorded by a multi-parameter sensor system deployed within the sampling areas. The sensors continuously collected key environmental variables, including air temperature, relative humidity, and light intensity, at fixed time intervals, with a sampling frequency set to once every 10 min. All environmental records were associated with timestamps and aligned with pest images collected within the corresponding time periods. To minimize the impact of spatial heterogeneity in the microclimate, the environmental values used for modeling were derived from sensors located within a 5-m radius of each specific image acquisition point. Prior to deployment and every quarter thereafter, all sensors underwent uniform calibration. We also implemented a median filtering procedure before processing each batch of data to detect and remove outliers, ensuring the statistical consistency of the longitudinal data across the four-year study period.
2.2. Data Preprocessing and Augmentation Strategy
In multimodal pest recognition and risk modeling tasks oriented toward horticultural production scenarios, data preprocessing and data augmentation are fundamental steps for improving model performance. These procedures are critical for ensuring multimodal data compatibility and maintaining statistical consistency across different sensors. From a methodological perspective, the primary objective is to suppress task-irrelevant noise and enhance the stability of sample representations during the training phase. Data augmentation aims to construct distribution-expanding perturbations that enable the model to learn discriminative features robust to viewpoint variation, scale changes, and environmental disturbances. Given that horticultural scenarios involve complex backgrounds and irregular environmental sensor time series, we design modality-specific processing pipelines for image and temporal data, incorporating alignment mechanisms to support subsequent multimodal joint modeling.
For image data preprocessing, quality filtering is first performed on the raw collected images from the perspective of statistical signal quality. The underlying principle is to remove samples exhibiting severe blur or excessive noise by means of sharpness measurement functions based on the variance of the Laplacian operator. This prevents the model from learning non-structural artifacts that could degrade recognition accuracy. For exposure anomalies, we apply contrast-limited adaptive normalization to ensure that the targets remain visible under varying lighting conditions. Scale normalization is also applied to ensure spatial resolution consistency in the input distribution. In this process, we utilize bilinear interpolation to unify input dimensions and an object-constrained cropping strategy to increase the relative target size and effective pixel density, which is particularly beneficial for identifying small pests that often blend into the leaf texture.
In data augmentation, the theoretical foundation is derived from the distribution expansion principle in empirical risk minimization. We construct a family of input transformations that preserve semantic labels to encourage the model to learn invariant feature representations. Geometric augmentation is particularly important in small-target scenarios, including random rotation and affine perturbations, which help the model develop robustness to pose variations regardless of pest orientation. To address the issue that small targets may vanish under excessive downscaling, a scale jittering strategy is adopted. In addition, local region copy-and-paste and object-preserving mixing strategies are employed to embed pest regions into different background locations, alleviating sample scarcity and reducing background bias. We also apply illumination and color perturbations to account for spectral differences between protected and open-field environments, alongside noise augmentation to simulate sensor noise and compression artifacts.
For environmental time-series data preprocessing, the core principles involve temporal alignment, noise smoothing, and scale standardization. Since sensor sampling frequencies and image acquisition times are typically inconsistent, a temporal window alignment mechanism is established to compute mean feature values around each acquisition timestamp. To suppress high-frequency noise caused by instantaneous sensor fluctuations, exponential smoothing is applied as a first-order low-pass filter to preserve overall environmental trends. Finally, heterogeneous variables such as temperature and humidity are standardized using z-score normalization to ensure balanced gradient updates during joint modeling. For seasonal periodicity, cyclic encoding is introduced to preserve the continuous structural characteristics of temporal proximity, thereby establishing a stable and learnable data foundation for subsequent multimodal pest recognition and joint risk modeling.
2.3. Proposed Method
2.3.1. Notation Glossary
To ensure that the description of the proposed framework is mathematically clear and consistent, we predefine the main symbols and operators used, which are summarized in the
Table 3.
2.3.2. Overall
A multimodal pest recognition and occurrence risk joint modeling framework oriented toward horticultural plant protection decision-making is proposed. The preprocessed pest images are first fed into the visual branch, where spatial semantic features are progressively extracted through a multi-layer convolutional or vision transformer backbone, forming multi-scale pest appearance representations that characterize pest morphology, texture structures, and spatial distribution under complex horticultural backgrounds. In parallel, environmental time-series data aligned with image timestamps are input into the environmental branch and compressed into compact environmental embedding vectors through temporal modeling modules, which are used to describe the ecological condition associated with each pest sample. During the feature interaction stage, the environmental embeddings are not directly concatenated with visual features. Instead, they are introduced as conditional information into an environment-guided module to adaptively modulate visual features, enabling dynamic adjustment of channel-wise or spatial responses in accordance with environmental variations. In this manner, the coupling relationship between pest appearance and environmental context is explicitly modeled. The environment-modulated visual features are then projected into a shared representation space and simultaneously connected to a pest category recognition head and an occurrence risk level discrimination head, forming a multi-task parallel output structure. Within this structure, the recognition task focuses on distinguishing pest categories, while the risk task integrates the modulated visual features and environmental semantics to determine whether the pest occurrence may develop into a risk level requiring intervention. The two tasks are jointly optimized through a unified loss function during training, such that recognition and risk assessment are mutually constrained at the feature level and remain consistent at the decision level. Ultimately, the model outputs not only explicit predictions of pest categories and risk levels, but also forms a risk-aware decision representation at intermediate layers, which reflects the integrated relationship among pest appearance, environmental conditions, and potential damage, thereby providing direct support for graded control and precise intervention in horticultural plant protection management.
2.3.3. Environment-Guided Pest Representation Learning Module
Within the proposed multimodal joint modeling framework, the environment-guided pest representation learning module plays a central role in explicitly integrating ecological environmental information into the visual feature learning process. The design objective is to characterize the coupling relationship between pest appearance and occurrence environment at the feature level, rather than performing simple compensation at the decision stage.
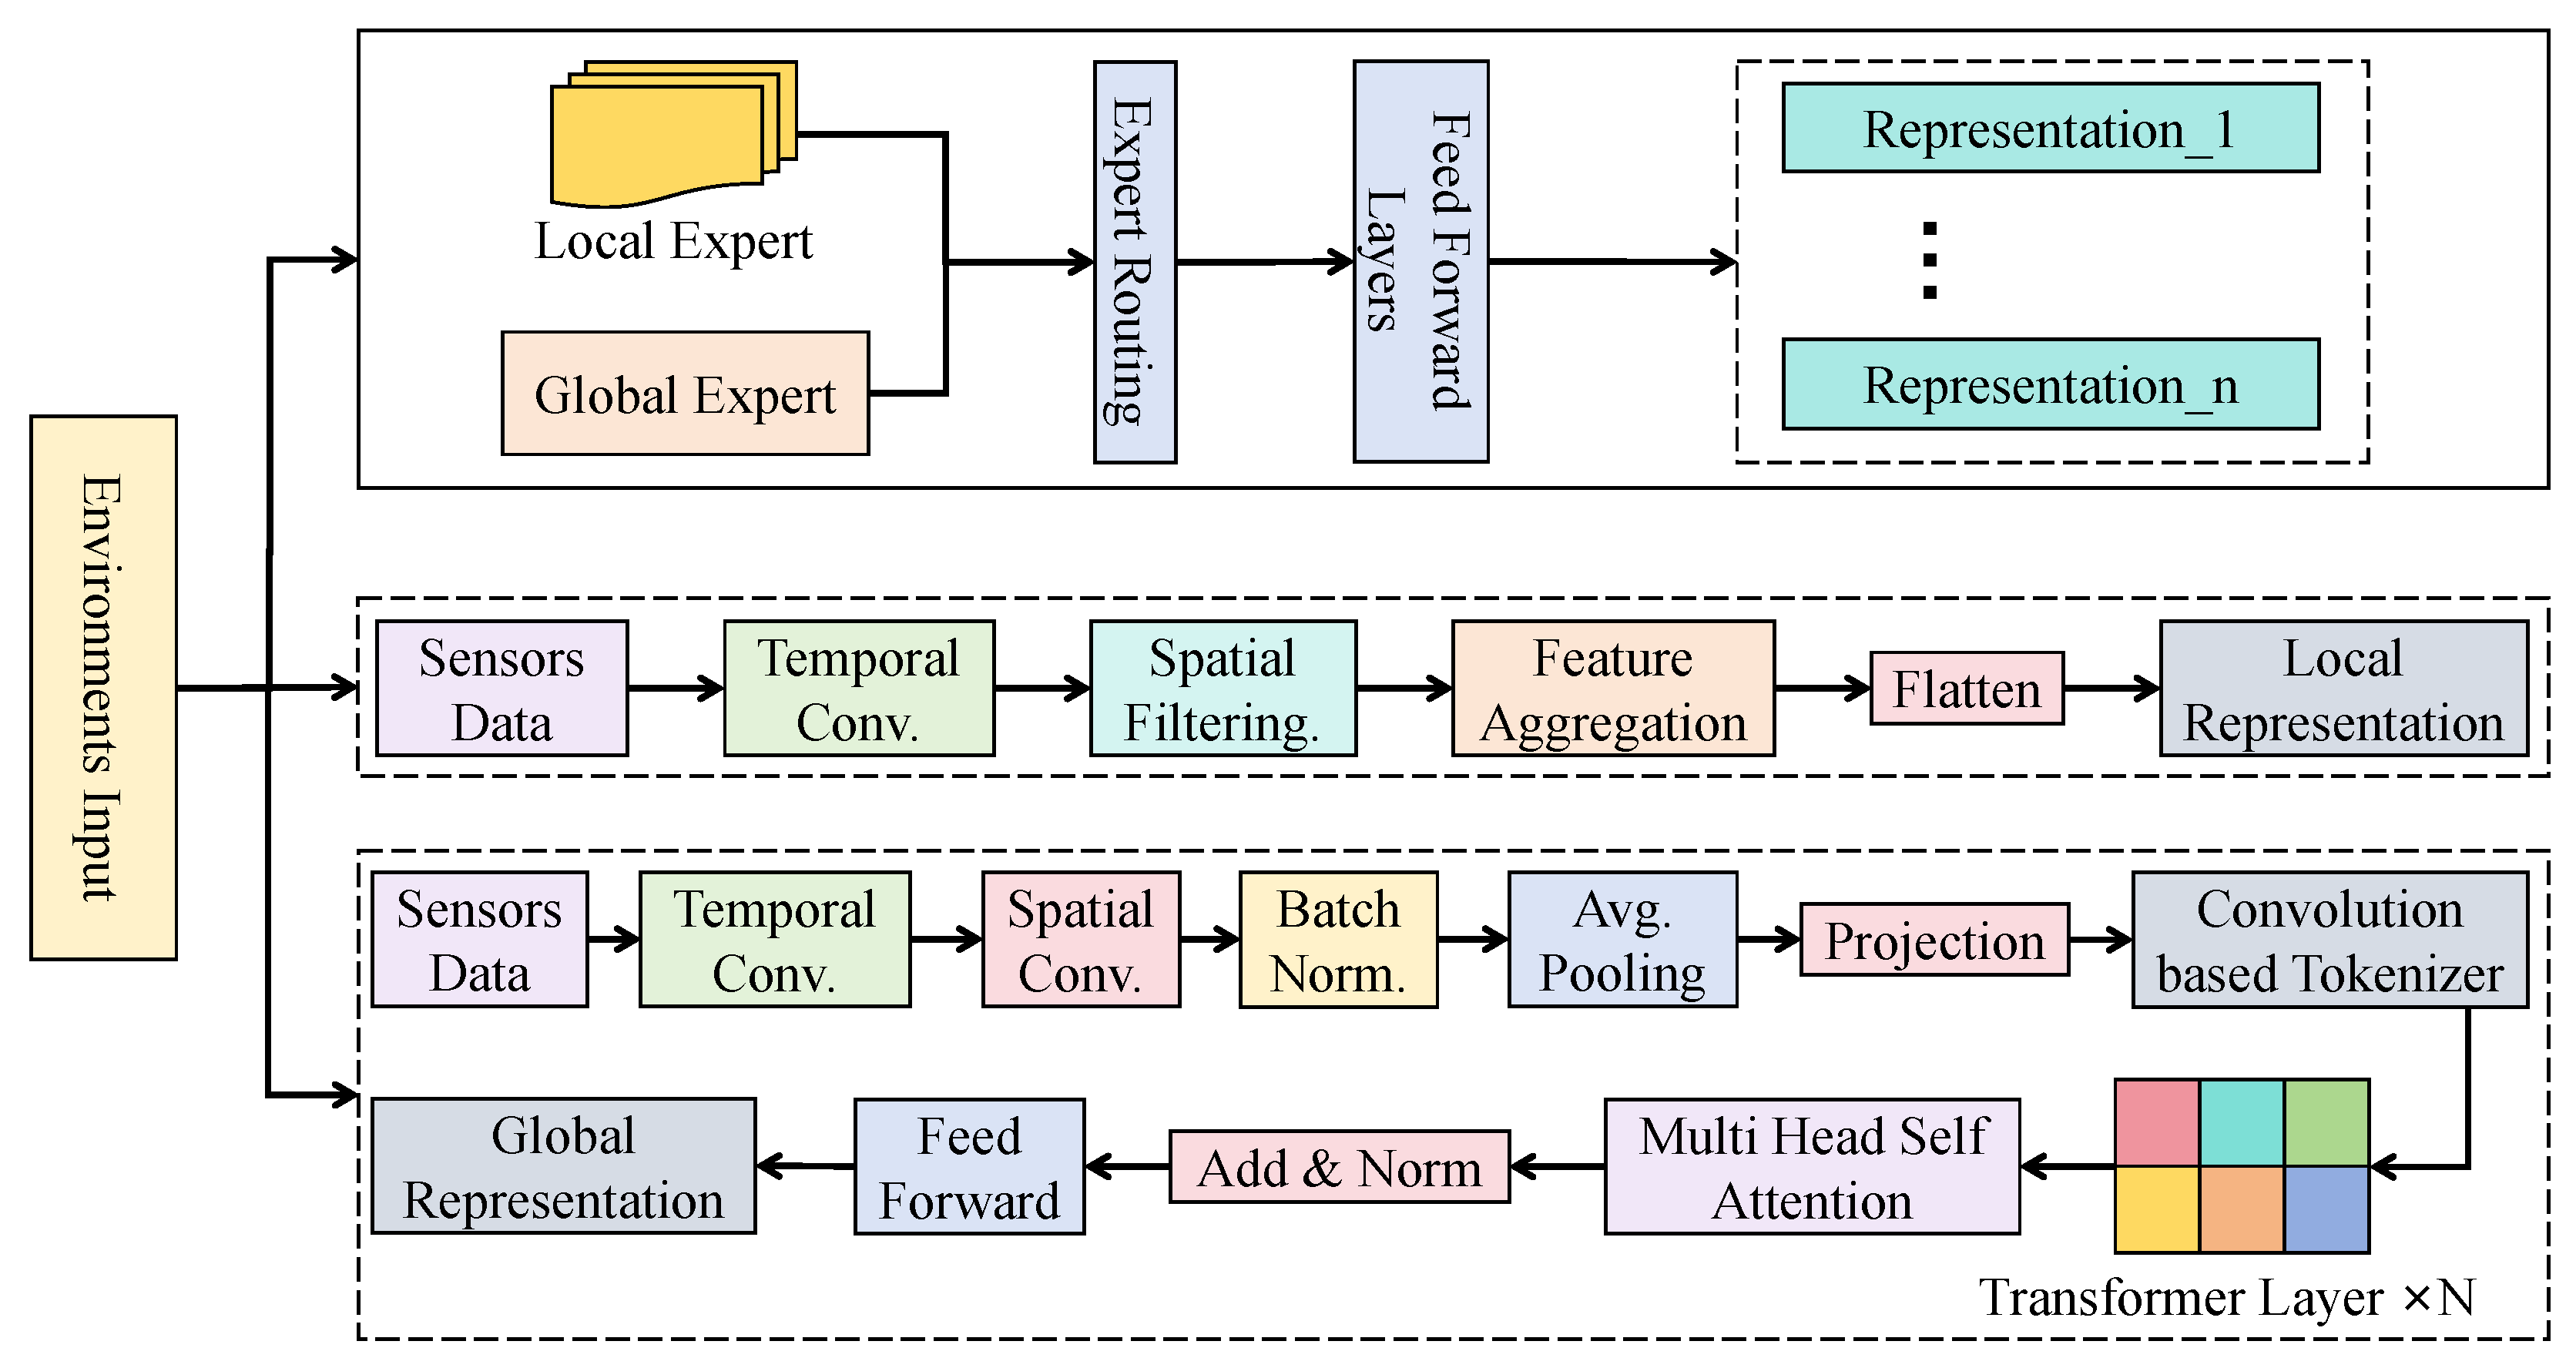
As shown in
Figure 2, the module consists of an environmental temporal encoding sub-network, an environmental semantic aggregation unit, and a visual feature modulation unit. The time-aligned and normalized multi-dimensional environmental sensor sequences are first input into the environmental branch, where local environmental patterns are modeled using one-dimensional temporal convolutional networks with a kernel size of
, and the channel width is progressively expanded from
to
to capture short-term variations in temperature, humidity, and illumination. Meanwhile, to model global environmental states across longer time spans, a transformer encoding layer based on self-attention mechanisms is introduced to perform global contextual modeling over local features, yielding a stable environmental semantic representation
.
This environmental representation serves as a contextual branch that generates dynamic modulation signals to guide the visual perception process. Instead of acting as simple predictive inputs, these environmental variables are projected through a feed-forward mapping network to produce channel-wise modulation parameters, allowing the environmental context to function as a learnable filter for the visual features. The environment-guided module learns a mapping function
that transforms the environmental vector
into modulation parameters
, which are applied to the visual features through a conditional affine transformation:
In this formulation, and act as the scaling and shifting factors that dynamically adjust the weights of different feature channels based on the current environmental state.
Distinguishing our approach from generic auxiliary information injection methods such as FiLM or standard conditional normalization, the modulation parameters in this framework are generated through a dual-attention interaction between temporal environmental features and spatial visual features. This specialized structure is designed to capture the non-linear coupling between pest developmental biological cycles and microclimate fluctuations, which global or static modulation methods often fail to represent. Moreover, the proposed recognition–risk joint optimization extends beyond conventional multi-task learning by introducing an ecological consistency constraint term . This constraint enforces logical alignment between the recognition results and risk predictions, compelling the network to select decision paths that adhere to plant protection logic even when visual features appear ambiguous or conflicting during the feature extraction process.
Through end-to-end training, these components are jointly optimized with the visual backbone, enabling environmental semantics to be naturally embedded into visual representation learning. This design is particularly advantageous for the target task, as it establishes strong coupling between visual and environmental information at the feature level, avoids inefficient post-hoc fusion, and provides a scalable structure for incorporating additional environmental variables or temporal expert branches in complex horticultural production scenarios.
2.3.4. Recognition–Risk Joint Optimization Module
The recognition–risk joint optimization module is designed around the principles of shared representation, conditional interaction, and dual-head joint constraints. It couples environment-modulated visual features with environmental condition representations within a unified structure to simultaneously output pest categories and risk levels, achieving end-to-end consistent optimization.
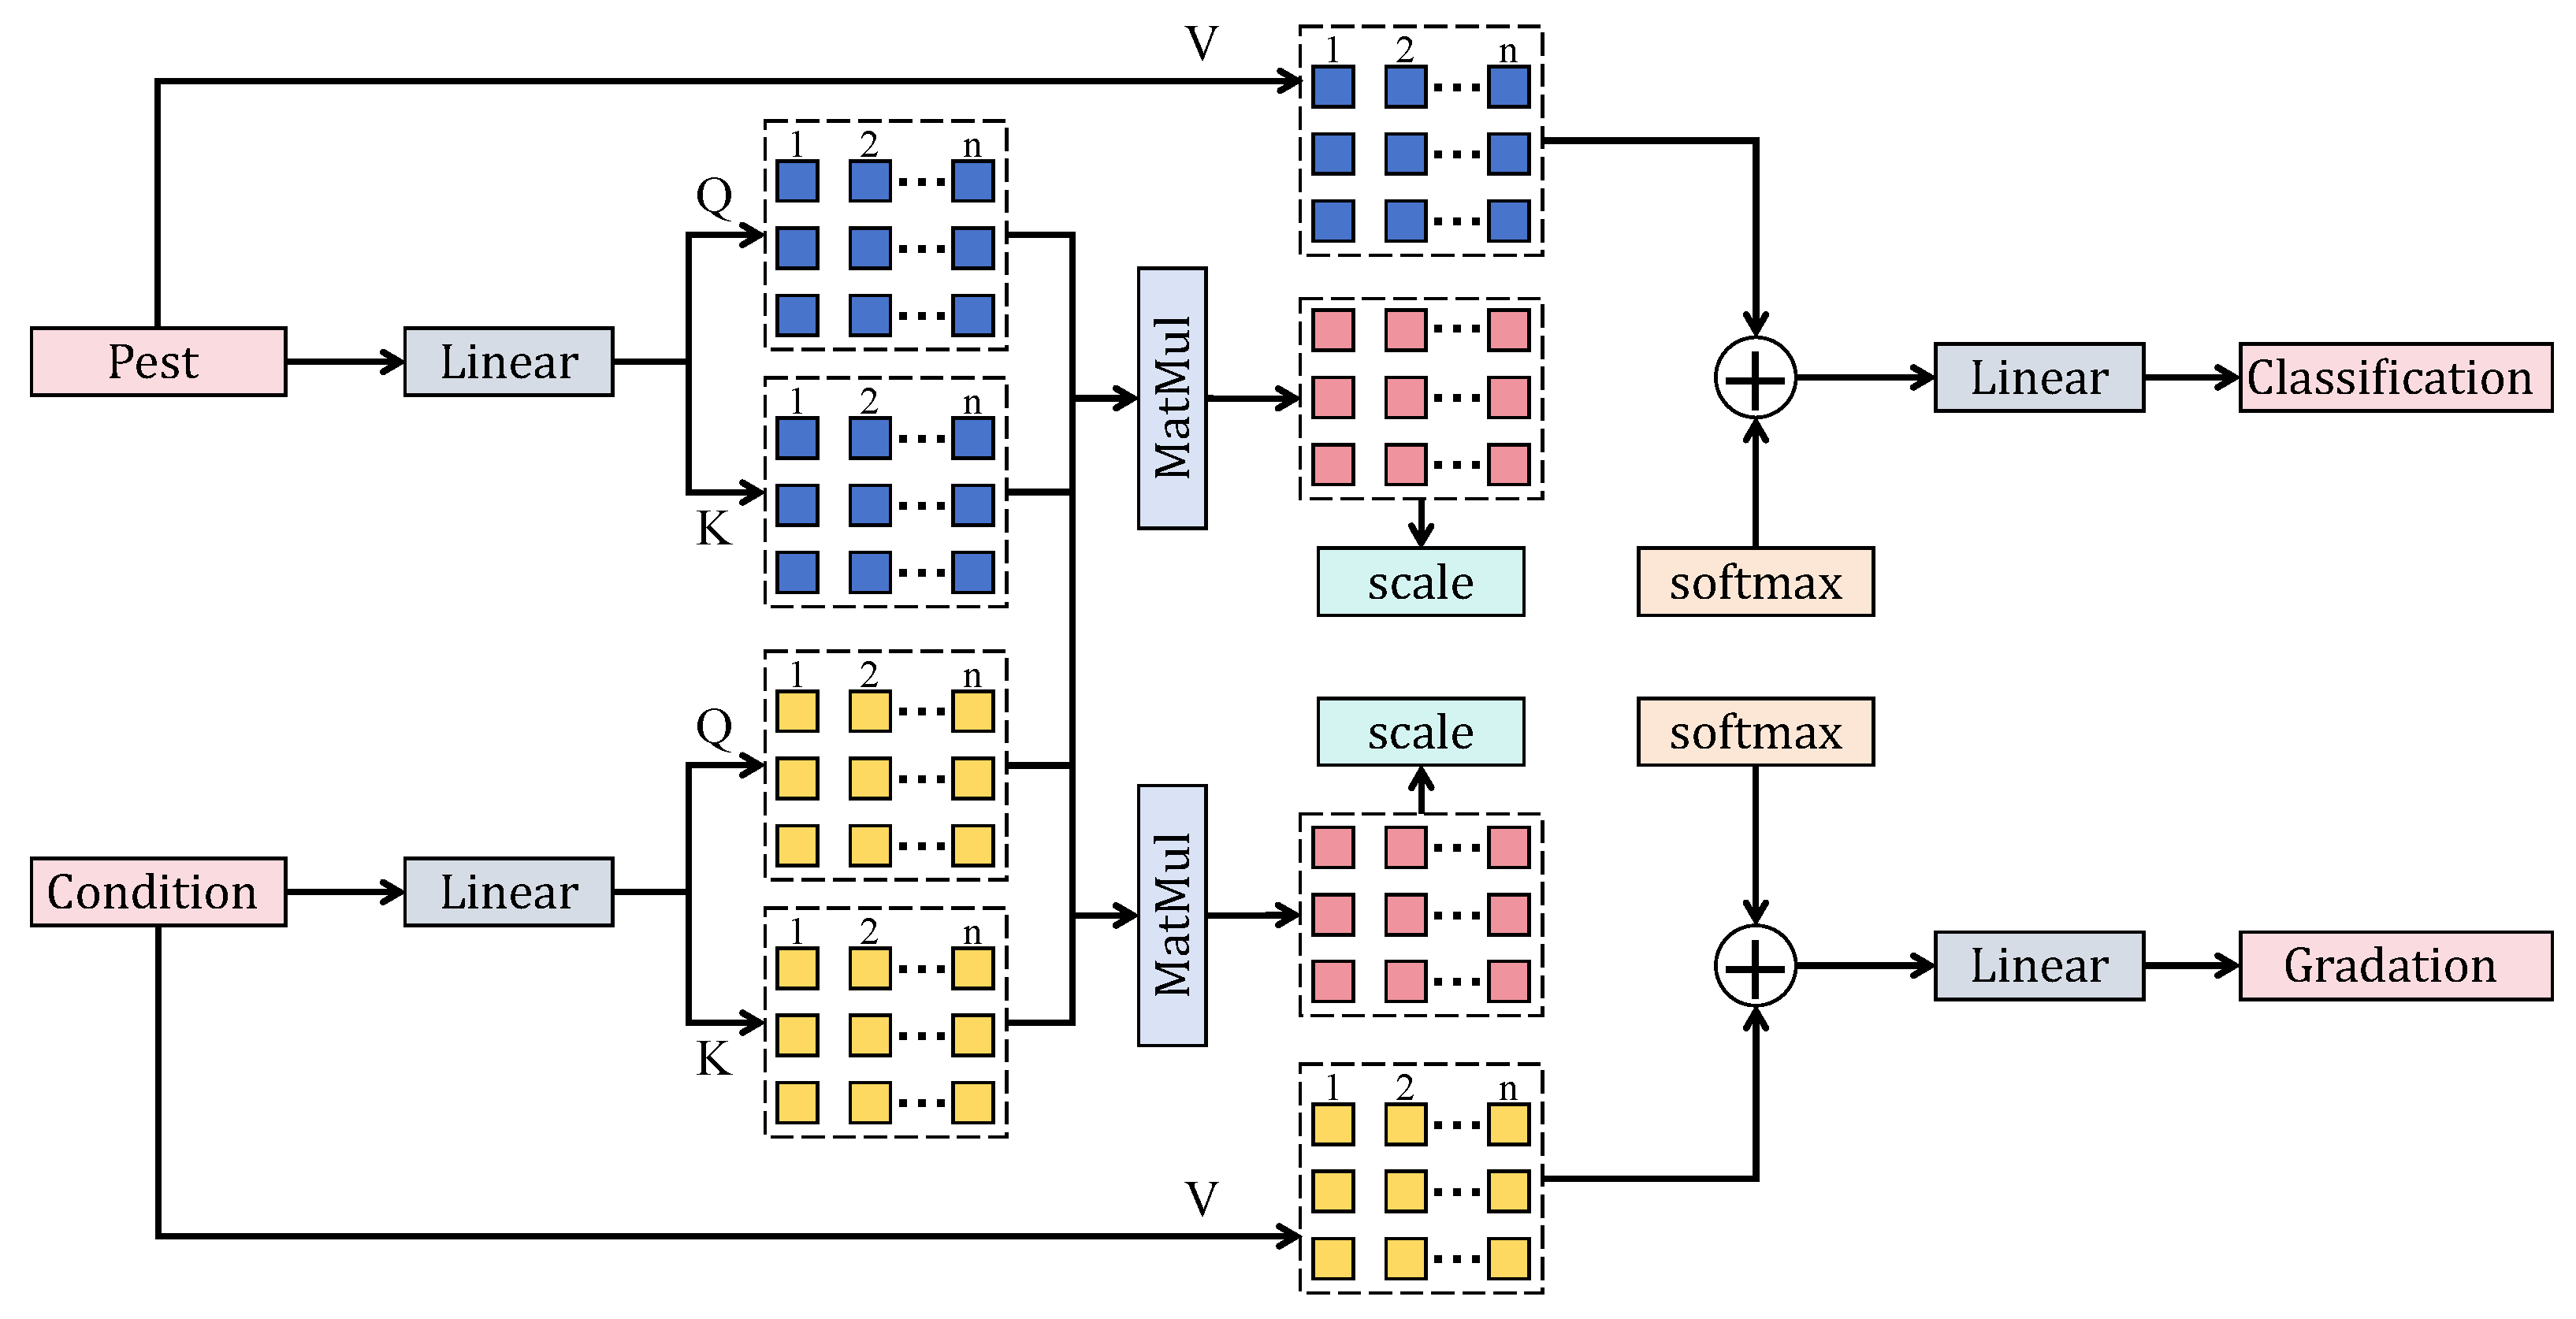
As shown in
Figure 3, the module comprises a linear alignment layer, two conditional attention interaction paths, and two lightweight prediction heads. We denote the environment-modulated visual feature map as a third-order tensor
, where
represents the channel depth, and
denotes the spatial resolution. After flattening the spatial dimensions,
visual tokens are obtained, forming the matrix
. Simultaneously, the environmental branch provides a sequence of
condition tokens, projected to
, characterizing the ecological state.
To facilitate multi-modal interaction, linear projection layers with weight matrices
are applied to generate queries (
), keys (
), and values (
) for both modalities:
where the multi-head attention (MHA) mechanism utilizes
heads with a per-head dimension of
. Two conditional correlation paths are constructed to capture internal appearance consistency (
) and selective environmental interpretation (
), respectively. The attention responses are calculated via scaled dot-product attention and integrated into a shared representation
through residual connections:
where
is a position-aligned projection mapping environmental context to the visual token space. The fused representation
is globally averaged to obtain the vector
, which serves as the input for the two tasks:
- 1.
Category Head: A two-layer MLP () with ReLU activation and dropout () for pest classification.
- 2.
Risk Head: A two-layer MLP () for discrete risk level discrimination.
The joint optimization objective
is formulated to balance recognition accuracy, risk prediction, and ecological consistency:
where
and
are cross-entropy losses for their respective tasks, and
is a consistency regularization term that penalizes structural discrepancies between recognition outcomes and risk levels. The coefficients
and
are hyperparameters used to stabilize the multi-task training process.
2.3.5. Risk-Aware Decision Representation Modeling Module
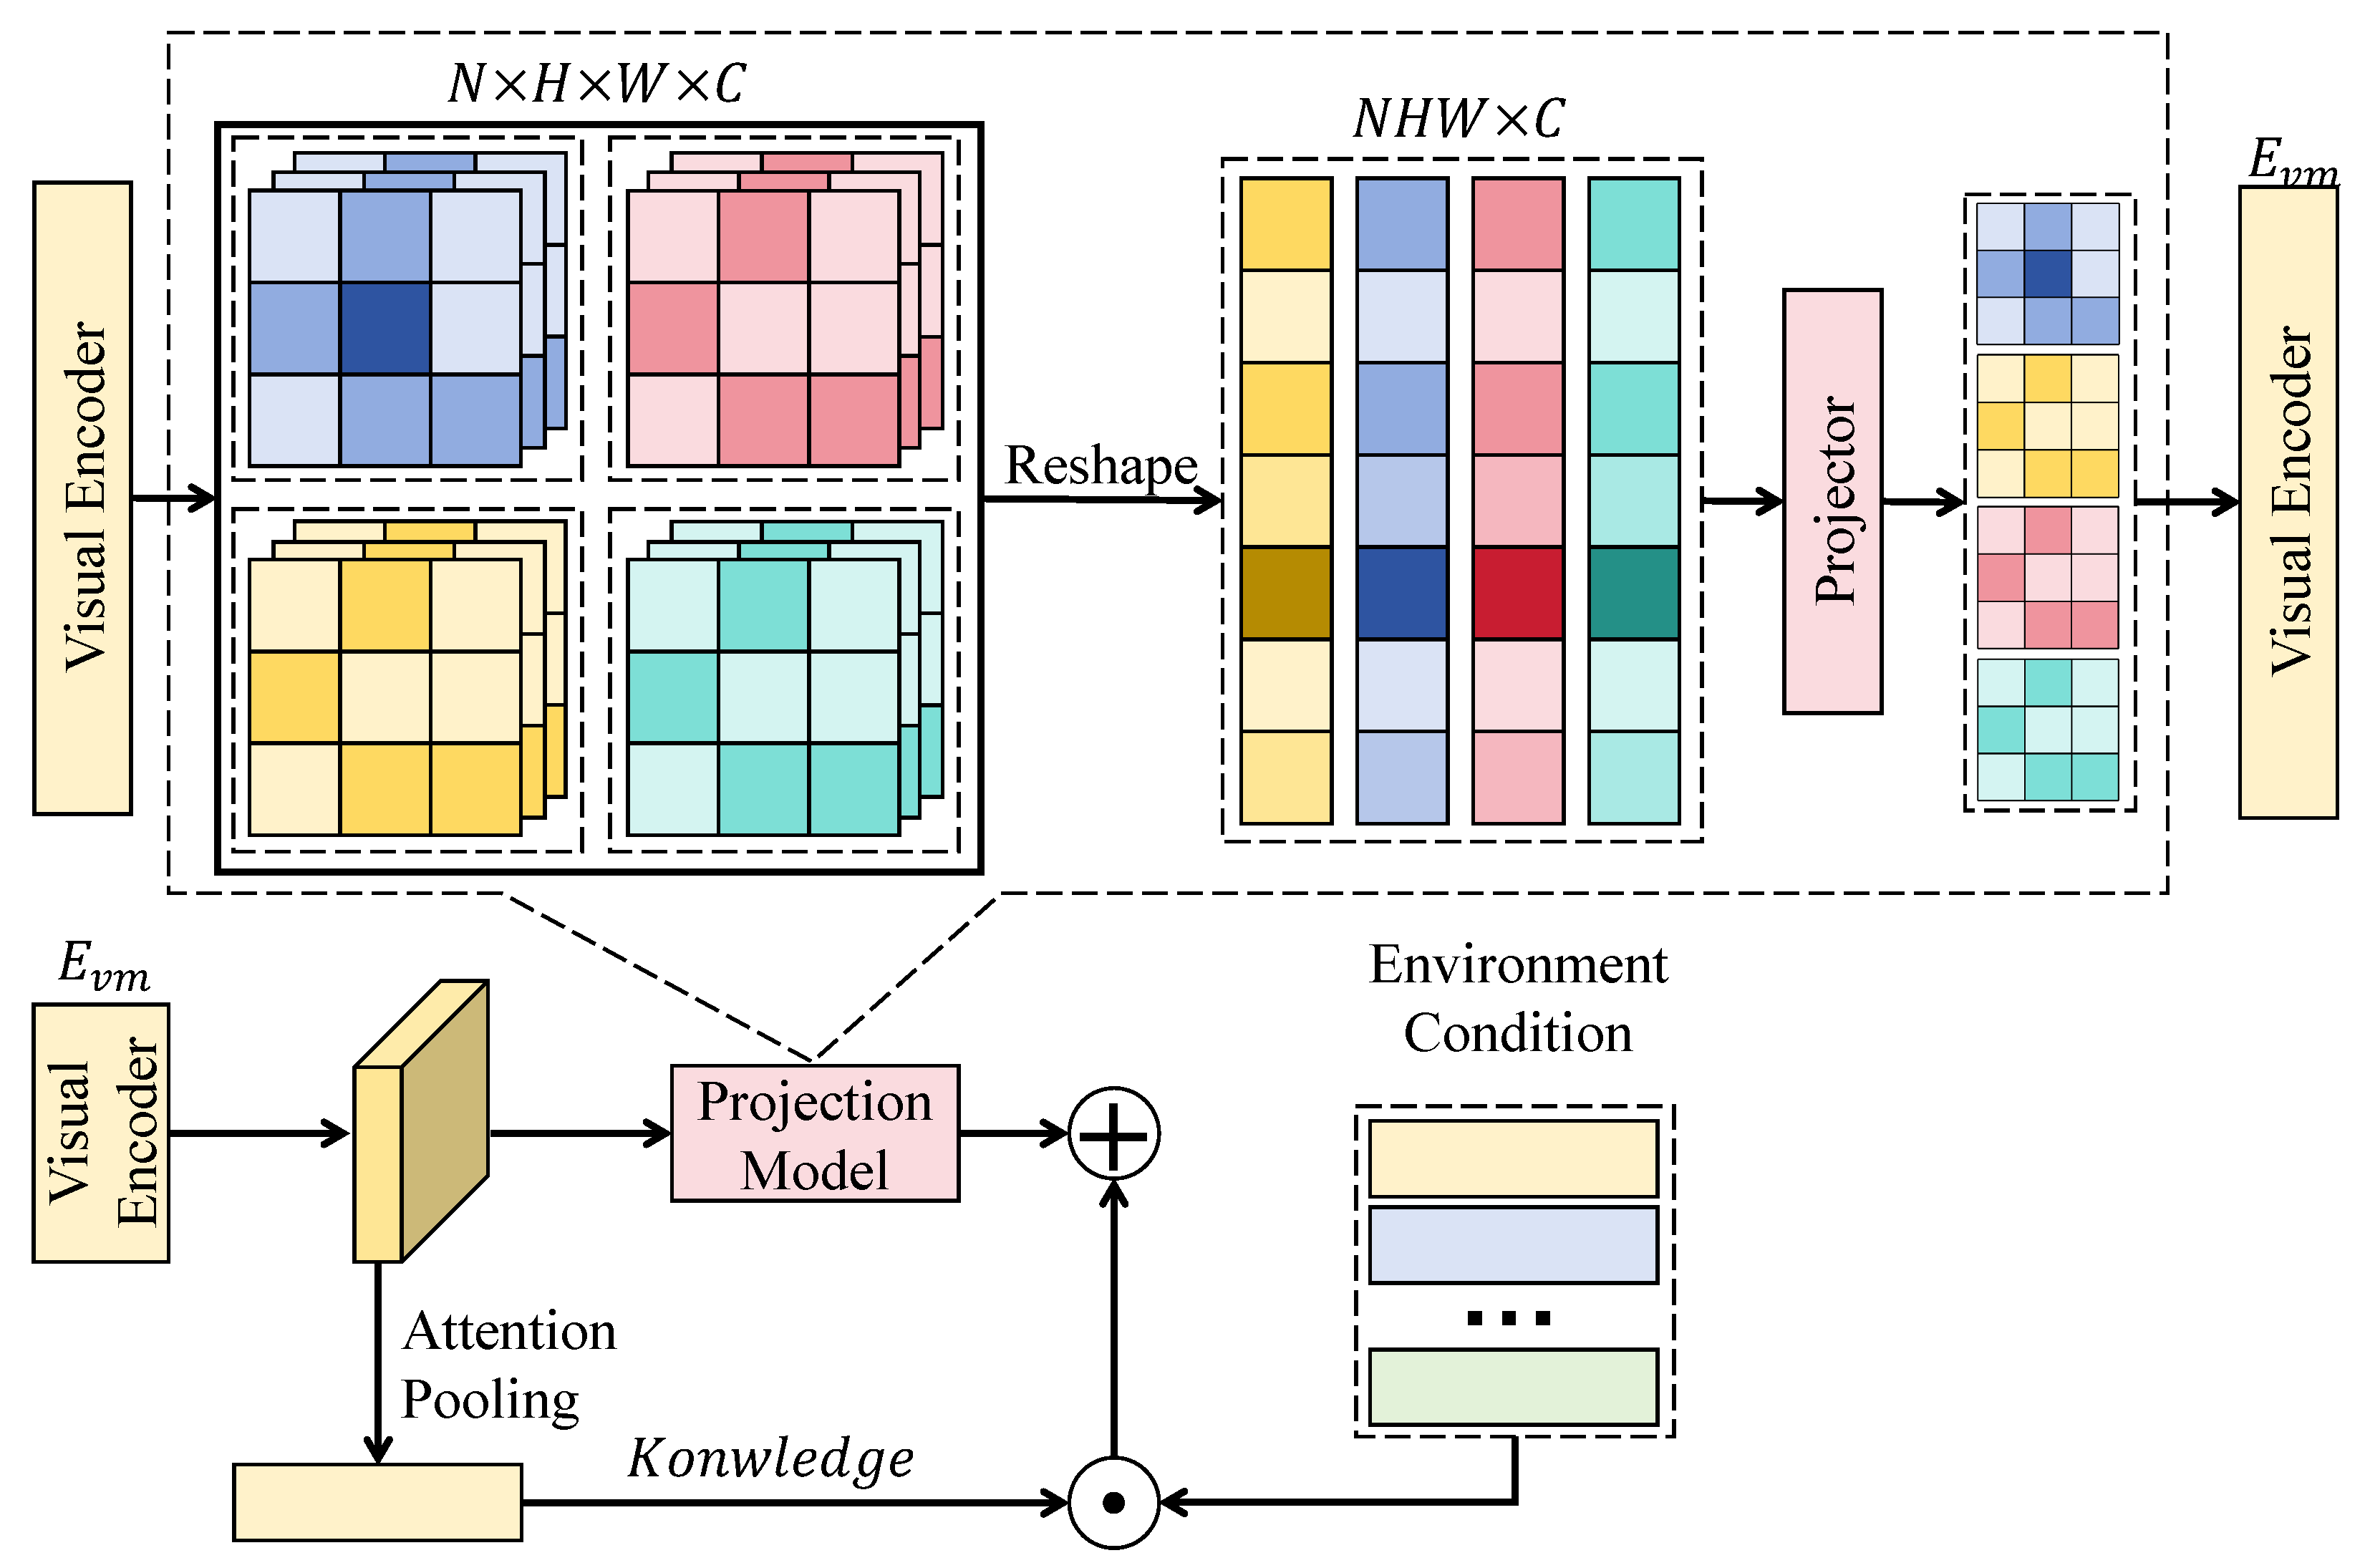
The risk-aware decision representation modeling module aims to further transform environment-guided visual features from being merely category-discriminative to being decision-actionable. Visual features produced by the encoder are reshaped into token sequences and compressed into a decision embedding space through a projection module, followed by attention pooling to obtain interpretable knowledge vectors, which are then fused with environmental conditions under a gating mechanism to form the final decision representation.
As shown in
Figure 4, let the environment-modulated visual features be denoted as
, with
and
. The features are reshaped into
with
. A two-layer MLP projector with residual alignment compresses the channel dimension from 256 to
,
where
and
. An attention pooling mechanism generates a knowledge vector
as a convex combination of tokens,
where
are learnable parameters. The environmental embedding
is then used to generate a gating vector
, and the final risk-aware decision representation is obtained as
This construction ensures bounded sensitivity to environmental perturbations and prevents unstable risk jumps. The resulting decision representation is subsequently used for risk level prediction and downstream strategy mapping, enabling outputs that encode structured relationships among appearance evidence, environmental conditions, and risk tendencies. In the context of the proposed task, this design effectively alleviates cases where recognition is correct but risk estimation is unstable, and provides a more robust basis for risk generalization across crops and production sites.
3. Results and Discussion
3.1. Experimental Configuration
3.1.1. Hardware and Software Platform
All experiments were conducted on a high-performance deep learning computing platform to ensure stability and efficiency for multimodal model training and large-scale image data processing. The hardware environment was built upon a multi-GPU server architecture, with NVIDIA RTX 4090 (NVIDIA Corporation, Santa Clara, CA, USA) graphics processing units as the core computational devices. Each GPU was equipped with 24 GB of memory and was used for both model training and inference. A multi-core, high-frequency CPU was employed to support data loading and parallel preprocessing, while the system memory capacity was set to 128 GB to avoid bottlenecks during joint loading and caching of multimodal data. The storage subsystem adopted NVMe solid-state drives to improve data input/output throughput and reduce I/O latency during training. During the training phase, GPU parallel acceleration and mixed-precision computation were enabled, allowing matrix operations and convolutional computations to be executed on tensor cores, thereby shortening the overall training cycle while maintaining numerical stability. The overall hardware configuration was sufficient to support multimodal inputs, joint task optimization, and repeated training under cross-validation settings. The software environment was established on a Linux operating system. Model development and training were implemented using the PyTorch (version 2.0.1) deep learning framework, combined with the CUDA acceleration toolchain and the cuDNN operator library to enable efficient GPU utilization. Data processing and numerical computation relied on the NumPy and SciPy libraries, while image augmentation and annotation parsing were implemented using OpenCV and Albumentations. Multimodal data alignment and temporal processing were carried out using Pandas and custom scripts. Automatic mixed precision and dynamic computation graphs were employed during training to improve computational efficiency and debugging flexibility. Experimental management and logging were conducted using TensorBoard for visual monitoring, enabling dynamic tracking of the loss function L, learning rate , and validation metrics, thereby ensuring reproducibility and traceability of the training process. For model training and evaluation, the dataset was partitioned according to the principle of sample independence using stratified random splitting. The proportions of the training set, validation set, and test set were set to 7:2:1, ensuring that pest categories and risk levels were distributed consistently across subsets to mitigate evaluation bias. On this basis, a -fold cross-validation strategy was further adopted, in which the full dataset was divided into five approximately equal subsets. In each round, one subset was selected as the validation set and the remaining four subsets were used for training. This procedure was repeated for five rounds, and performance metrics were averaged to obtain robust estimates of generalization performance. During training, the batch size was set to , and the initial learning rate was , with a cosine annealing learning rate scheduler applied for dynamic decay. The AdamW optimizer with weight decay was employed, where the weight decay coefficient was set to to suppress overfitting. The maximum number of training epochs was set to , and the early stopping patience was fixed at 10 epochs. The weighting coefficients for the multi-task joint loss were set to and to balance the contributions of recognition loss and risk discrimination loss. The dropout rate was set to to enhance model generalization. Through these data partitioning strategies and hyperparameter configurations, a balance was achieved among convergence speed, training stability, and generalization performance.
3.1.2. Baseline Models and Evaluation Metrics
Several representative models are selected as comparison baselines to cover diverse visual modeling paradigms and multimodal learning strategies. YOLOv8 [
45], as a classical one-stage detection model, is characterized by end-to-end training and multi-scale feature fusion, achieving a favorable balance between efficiency and accuracy and being well suited for real-time horticultural monitoring scenarios. Faster R-CNN [
46] adopts a two-stage detection framework that combines region proposal generation with refined classification and regression, enabling strong object localization capability and stable detection performance. RetinaNet [
47] incorporates focal loss to alleviate the class imbalance issue between positive and negative samples, thereby exhibiting robustness in dense small-target detection tasks. DETR [
48] is built upon a transformer-based global matching mechanism, which facilitates holistic modeling of object relationships while reducing reliance on handcrafted priors. Mask R-CNN [
49] extends object detection with an instance segmentation branch, providing more fine-grained spatial representations of pest bodies. The simple fusion concat method [
50] integrates visual and environmental features through direct feature fusion, serving as an intuitive and effective baseline for multimodal pest recognition and risk discrimination.
To ensure a fair and rigorous comparison among different modeling paradigms, we have summarized the training configurations and hyperparameter settings for all baseline models and the proposed framework in
Table 4. All models were trained and evaluated on the same hardware platform (NVIDIA RTX 4090) using consistent data partitioning (7:2:1) and 5-fold cross-validation strategies.
As indicated in
Table 4, multimodal baselines (simple fusion, Late Fusion, and GMU) follow a training protocol identical to the proposed method—utilizing an AdamW optimizer with an initial learning rate of
and a batch size of 32 over 150 epochs. This ensures that the observed performance gains of our framework are attributable to the structural innovation of the environment-guided modulation mechanism rather than variations in training intensity or data resolution.
Accuracy (
) was used to measure the proportion of correctly predicted samples over all predictions. Precision (
p) quantified the proportion of true positive samples among those predicted as positive, while recall (
r) measured the proportion of true positive samples that were successfully detected. Occurrence risk accuracy (
) was introduced to evaluate the model’s binary discrimination performance between Low Risk and High Risk levels, where risk is defined by the Economic Threshold coupling current pest density and environmental triggers. The metric mAP@50 represented the mean average precision across all categories under an intersection-over-union threshold of
, whereas mAP@75 denoted the mean average precision under a more stringent threshold of
, providing a comprehensive evaluation of localization and recognition quality.
Here, , , , and denote the numbers of true positives, true negatives, false positives, and false negatives for the category recognition task, respectively; , , , and represent the corresponding values for the binary risk level discrimination task; and represent the predicted and ground-truth bounding boxes; denotes the intersection over union; denotes the precision–recall curve as a function of recall r; represents the average precision of the c-th category; and C denotes the total number of categories.
3.2. Comprehensive Performance Evaluation Across Data Splits
This comparative experiment is designed to systematically evaluate the effectiveness and limitations of different modeling paradigms for horticultural pest recognition and occurrence risk discrimination from an overall performance perspective. Three core capabilities are emphasized: pest recognition and localization accuracy under complex horticultural scenarios, robustness to small targets, multi-scale variations, and background interference, and the reliability of transforming recognition outputs into risk-oriented decision signals.
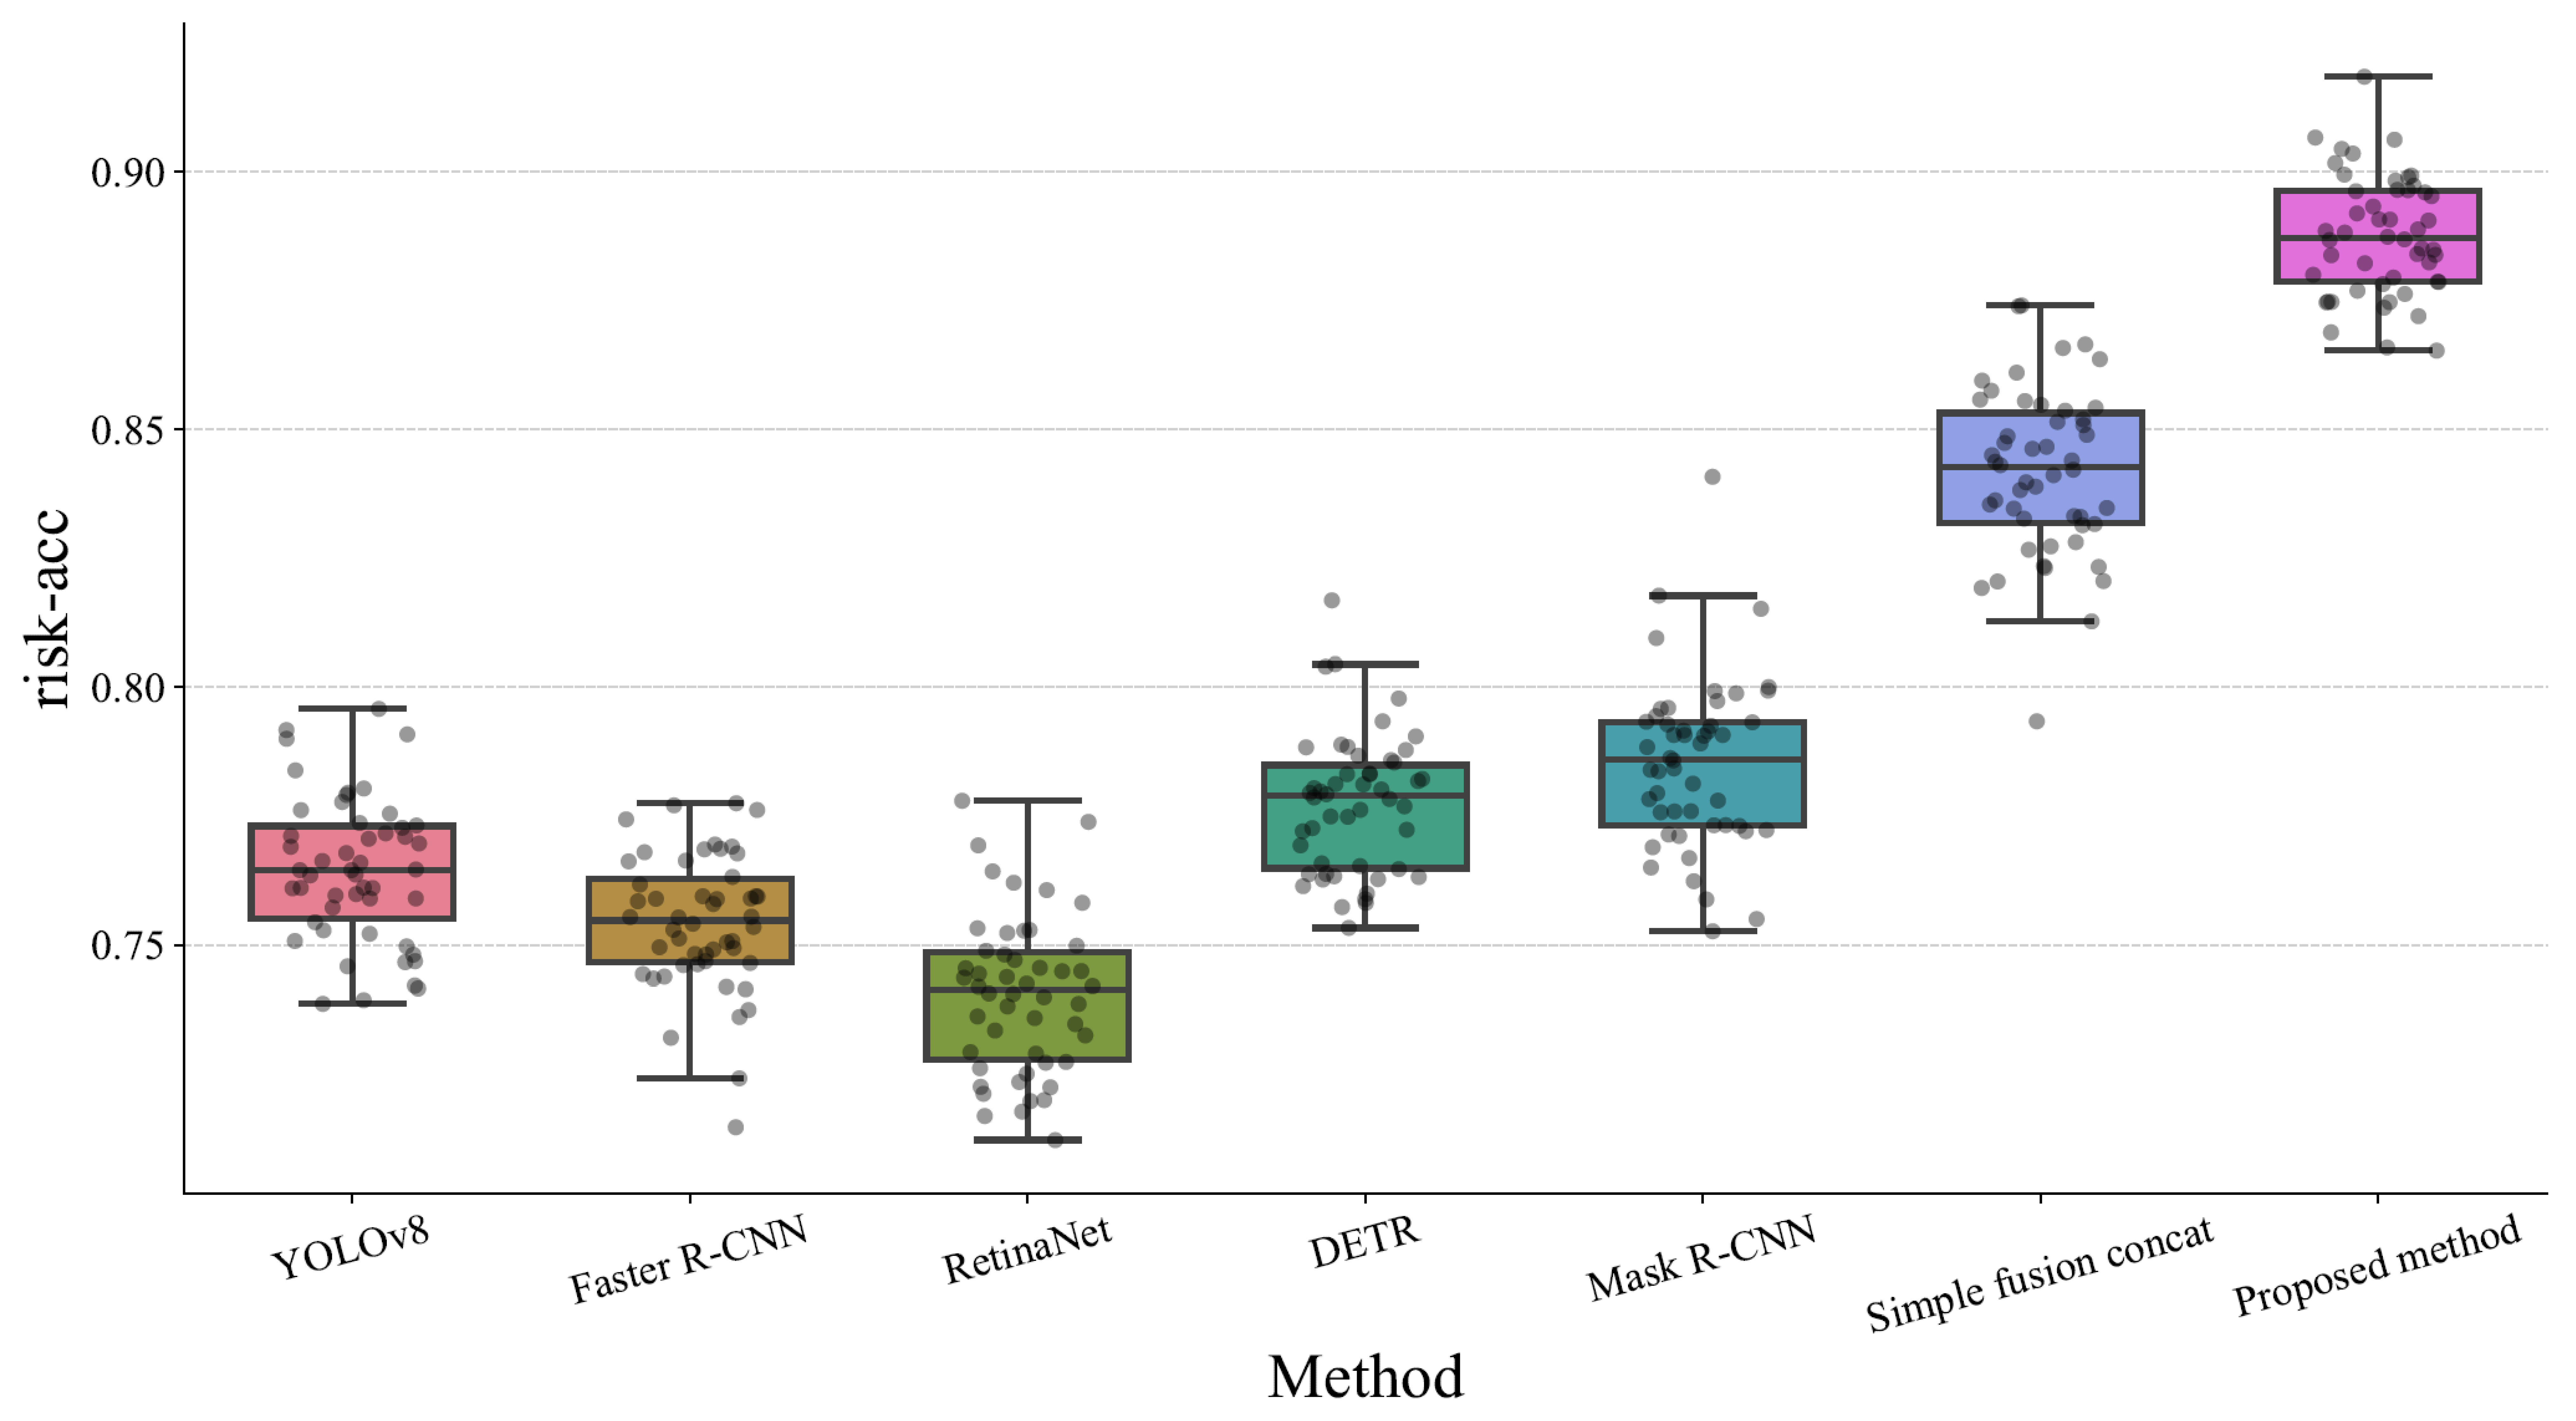
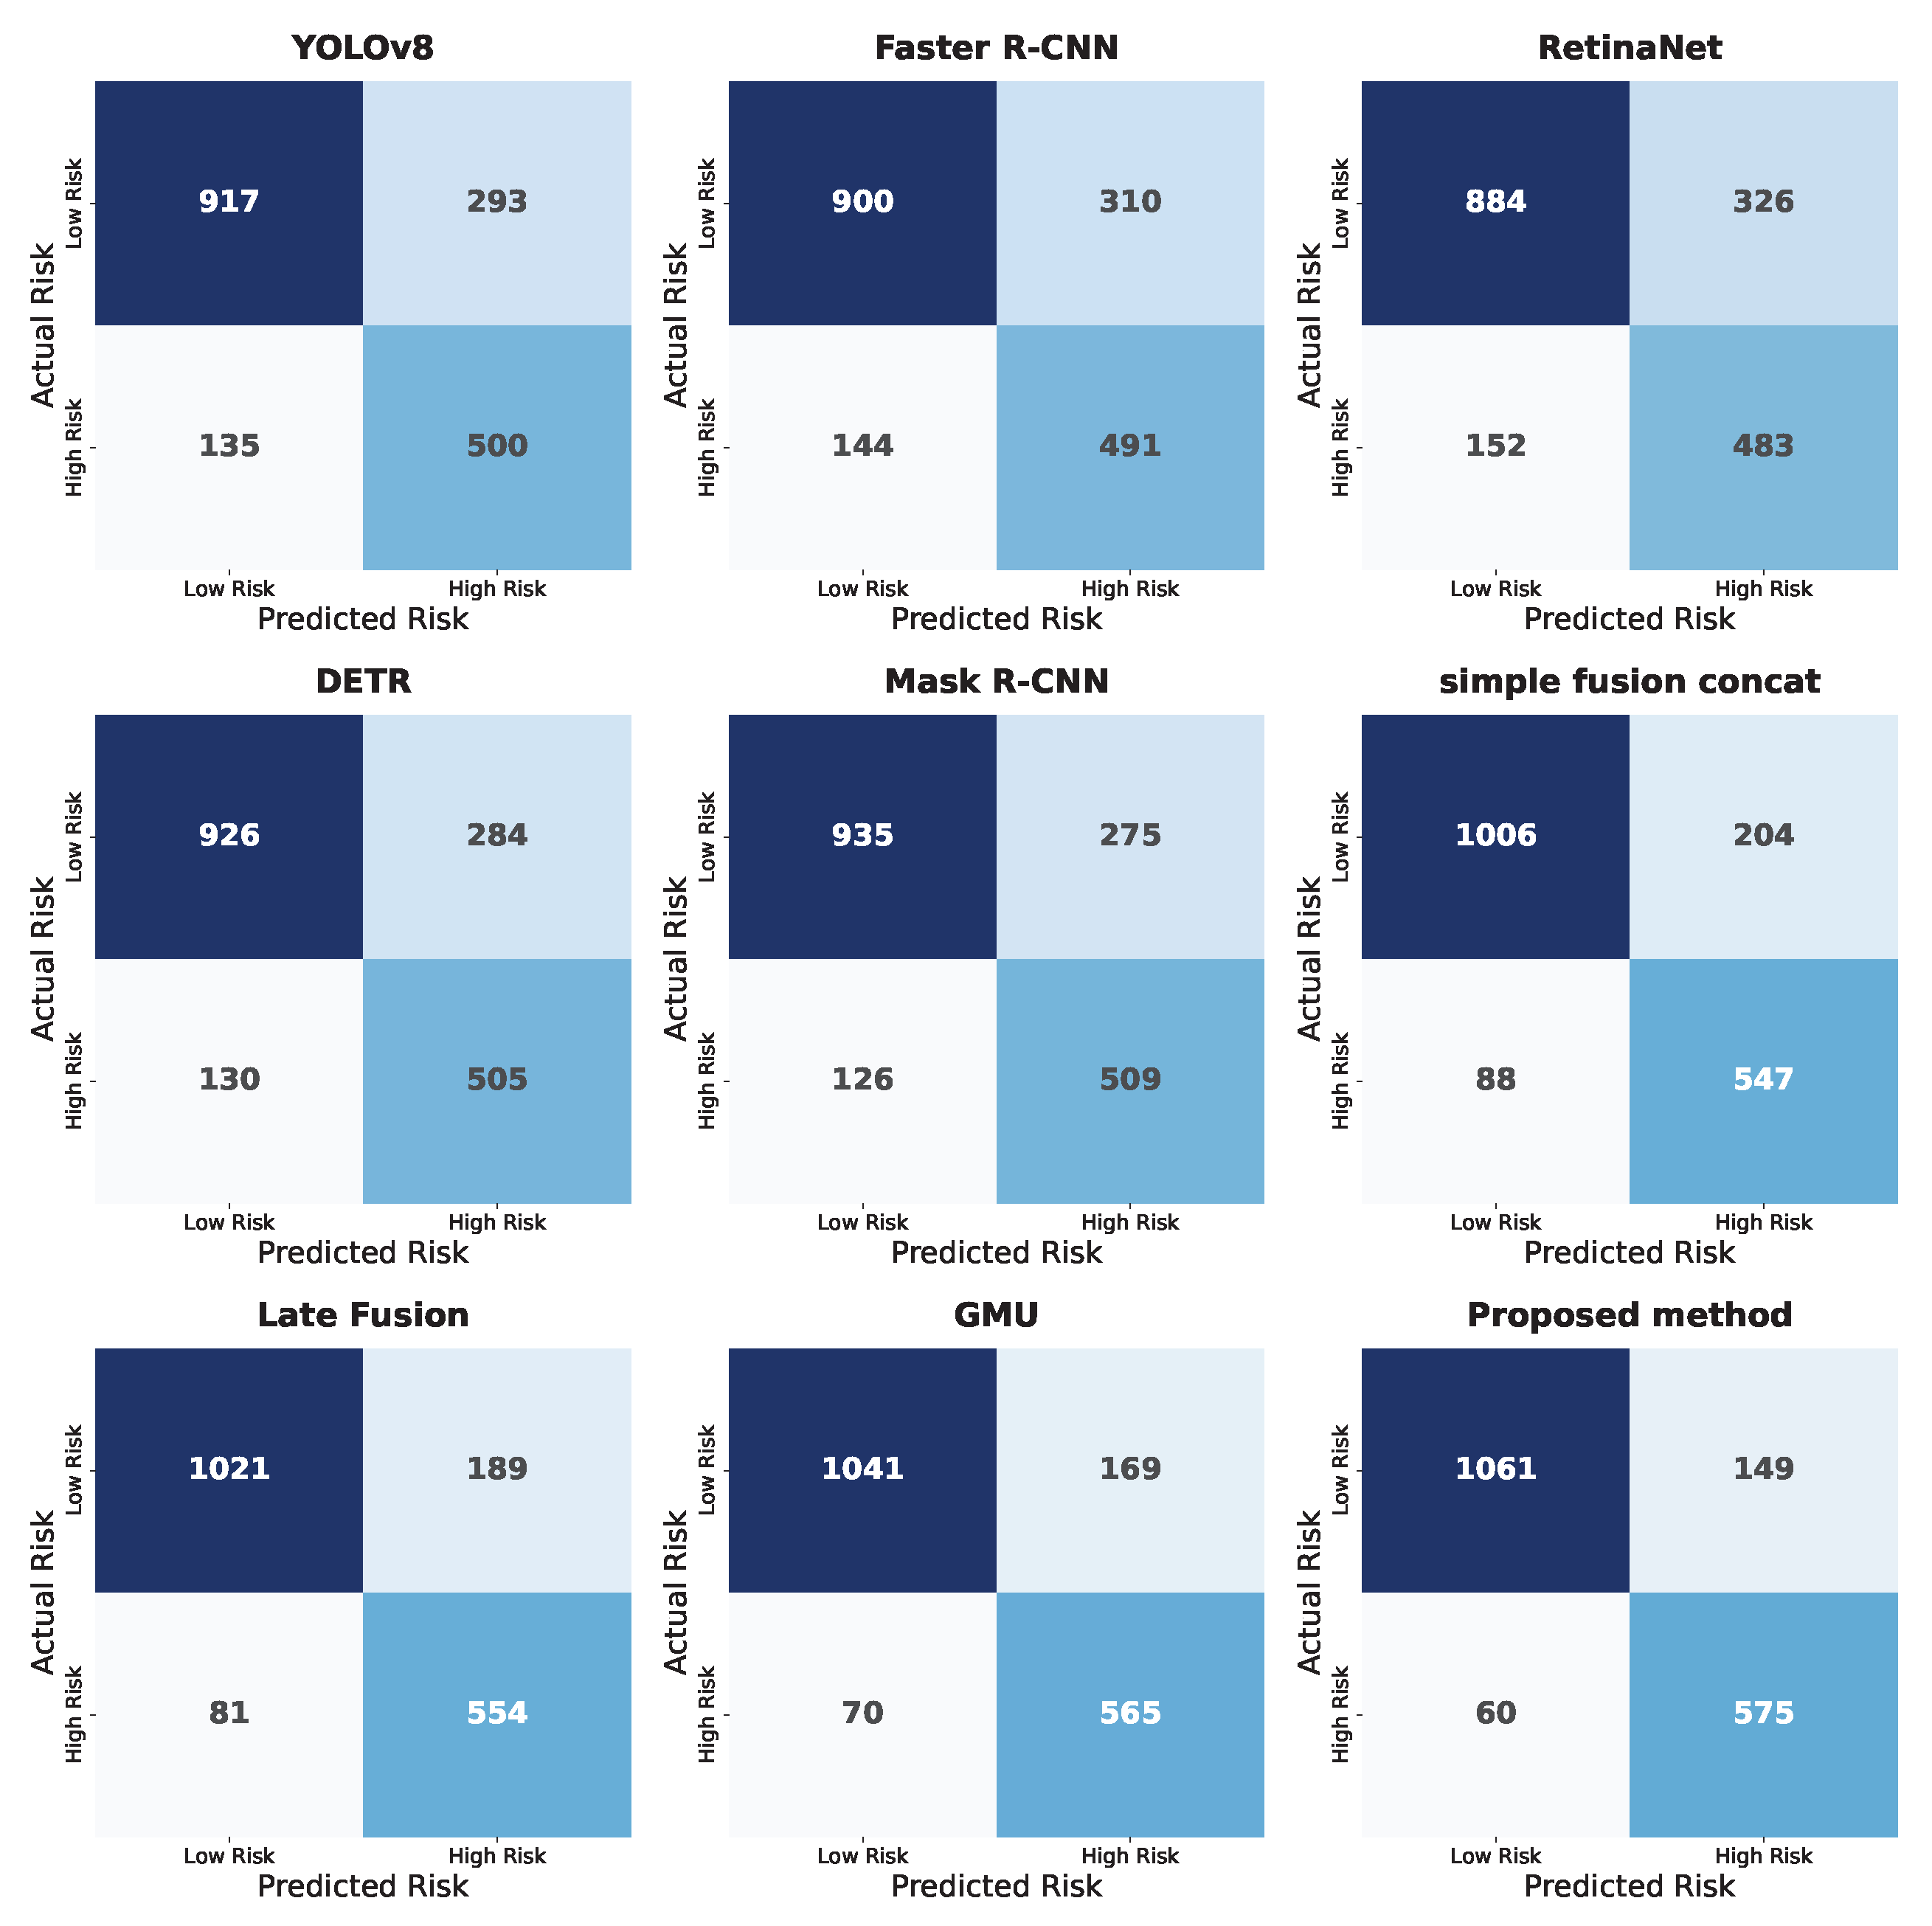
As shown in
Table 5,
Figure 5 and
Figure 6, pure vision-based detection models exhibit a relatively consistent performance hierarchy. RetinaNet and Faster R-CNN achieve comparatively lower scores across most metrics, largely constrained by anchor-based or fixed feature assignment mechanisms, which tend to produce unstable localization and confidence attenuation in horticultural pest scenarios characterized by dense small targets and frequent scale variations. YOLOv8 attains a favorable balance between efficiency and accuracy owing to its end-to-end optimization and multi-scale feature fusion, yet its regression-oriented formulation remains primarily focused on visual appearance discrimination and fails to sufficiently capture ecological semantics associated with pest occurrence. DETR and Mask R-CNN further improve detection performance, with the former benefiting from global matching to enhance object-level consistency and the latter leveraging instance-level segmentation for more precise boundary modeling, resulting in advantages at higher localization thresholds.
The computational analysis reveals that while our proposed method introduces an environmental branch, it maintains an inference speed of 17.6 ms, which is significantly faster than two-stage detectors and only slightly higher than YOLOv8. The model size of 28.6 M parameters demonstrates that the environment-guided modulation adds minimal memory overhead compared to basic fusion strategies. This efficiency ensures that the framework can be reliably deployed on edge devices without sacrificing real-time response capabilities.
To rigorously assess the generalization capability of the proposed method and the baseline models, it is essential to examine their performance across different data subsets.
Table 6 provides a detailed disaggregation of the precision, recall, and F1-score for each model on the training and validation sets. This granular reporting ensures that the high performance observed on the test set is not a result of overfitting to specific training samples but rather a reflection of robust feature representation learning.
The comparative analysis across the training, validation, and test sets indicates that all models maintain a high degree of performance consistency. Specifically, the proposed method exhibits a marginal difference of less than 2% in precision and recall between the training and test phases, which strongly suggests that the model has successfully learned generalized ecological and morphological features rather than memorizing the training data. This stable performance trend across all data splits reinforces the evidential value of the results and confirms the robustness of our multimodal joint modeling approach in unseen horticultural scenarios.
The limited gains in risk accuracy for vision-only models indicate that improving visual representation alone is insufficient to address the structural limitation of equating recognition with decision-making. The simple fusion approach yields notable overall improvements, yet its linear combination assumption overlooks conditional dependencies between visual and environmental cues, leading to unstable risk discrimination. In contrast, the proposed method achieves the best performance across all metrics, particularly in risk accuracy, demonstrating that the integration of environment-guided representation learning, recognition–risk joint optimization, and risk-aware decision representation structurally constrains feature learning toward shared representations that are simultaneously discriminative for category recognition and risk decision-making, thereby preventing error amplification along the recognition–decision chain and ensuring greater stability in real-world horticultural scenarios.
3.3. Generalization Across Scenarios
The cross-scenario generalization experiments are designed to systematically assess model stability and transferability under varying real-world horticultural production conditions. The primary focus is on whether reliable pest recognition and risk discrimination can be maintained when crop types, site environments, and climatic conditions across years differ from the training distribution.
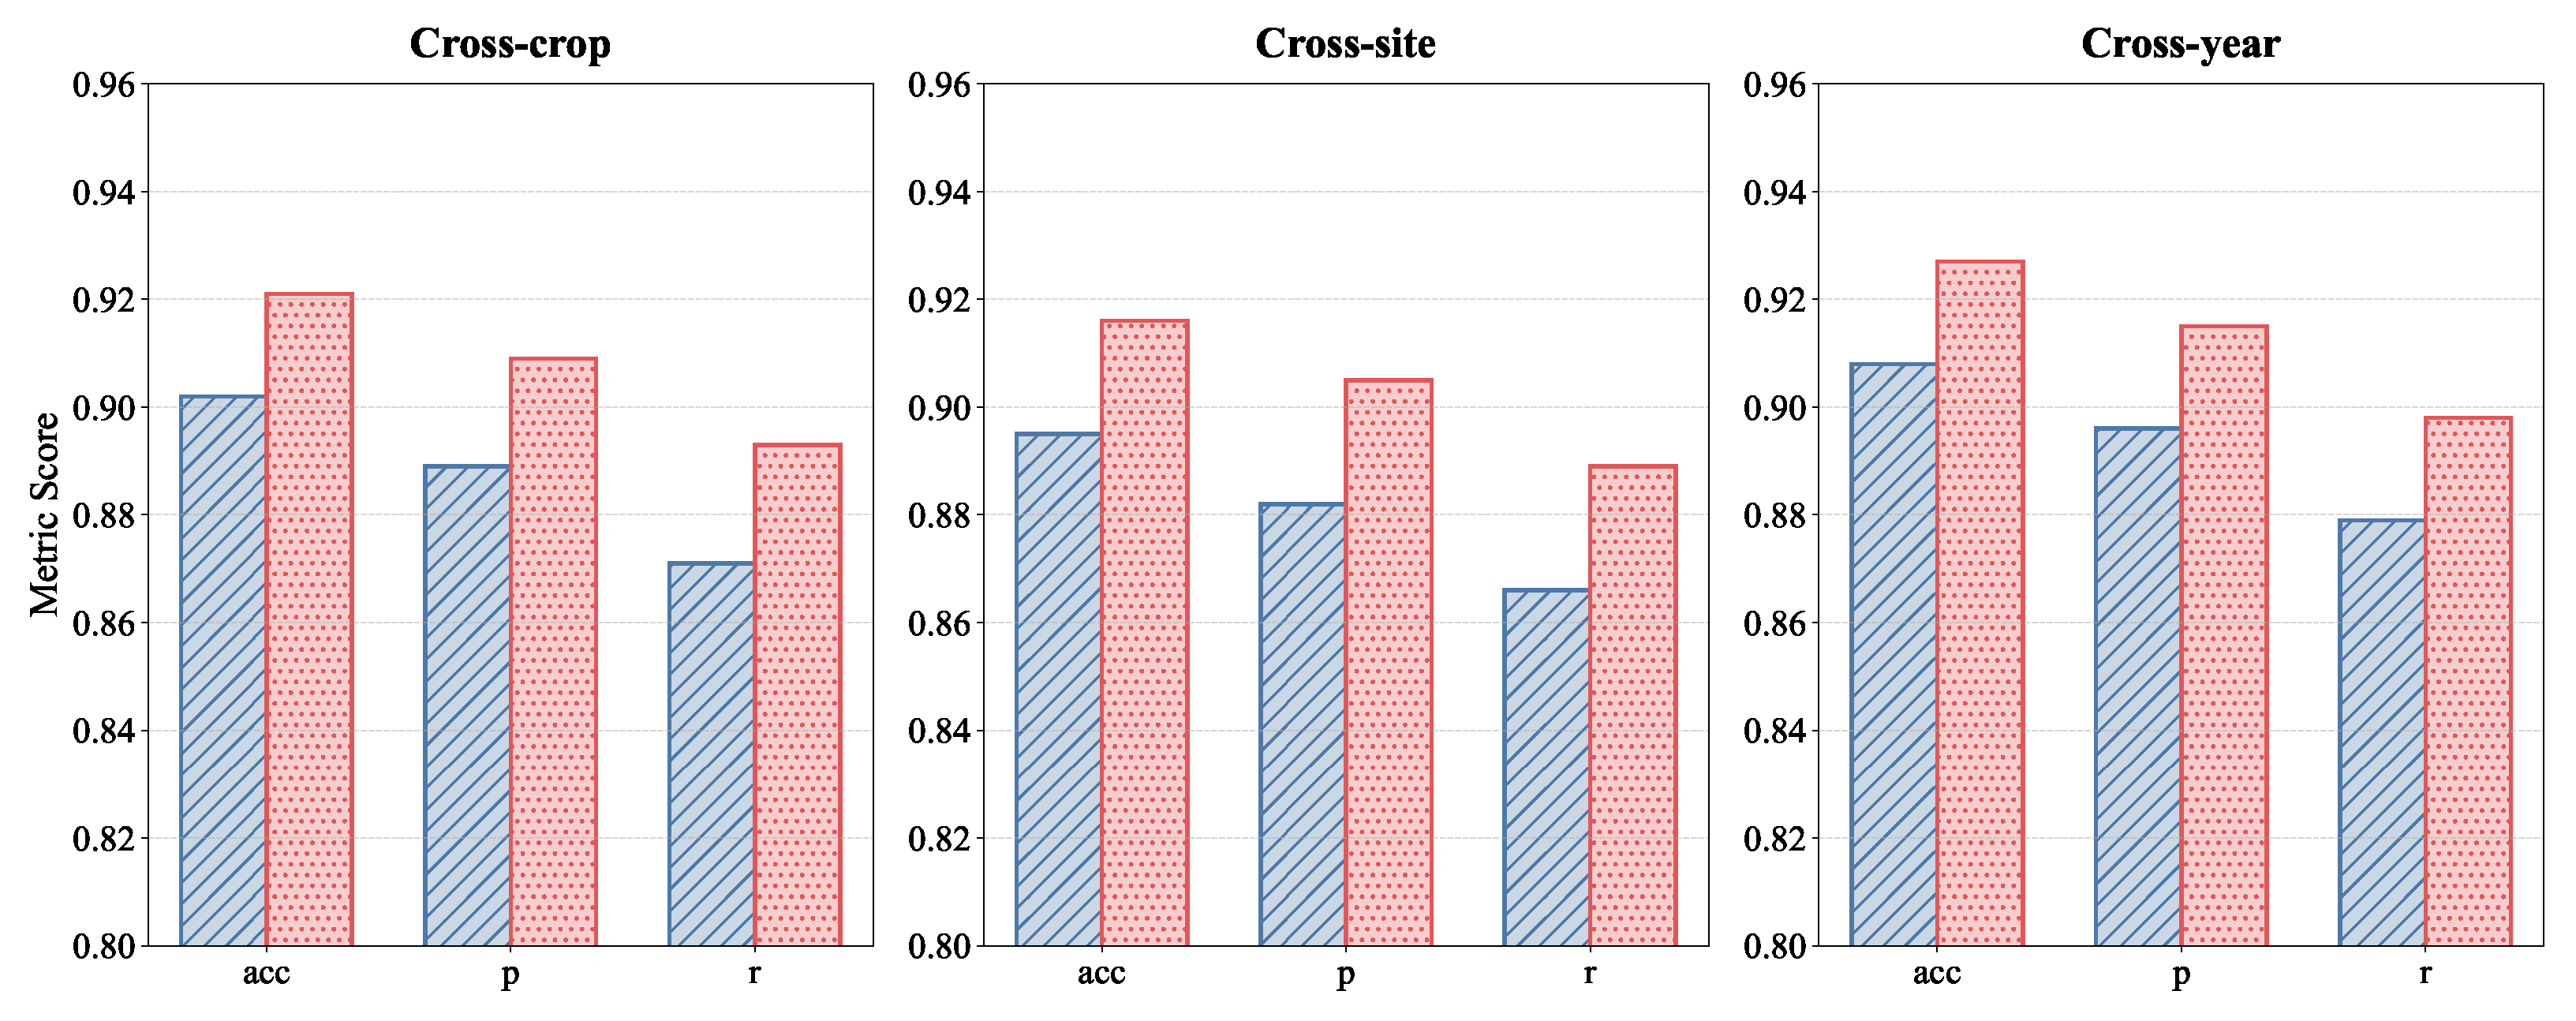
As shown in
Table 7 and
Figure 7, the simple feature concatenation approach exhibits consistent performance degradation under all three generalization settings, with particularly pronounced declines in risk accuracy, indicating strong dependence on the training data distribution. This behavior can be attributed to the implicit assumption of independence and equal contribution between visual and environmental features, which causes the decision boundary to drift when crop appearance or environmental distributions shift. A detailed analysis of the performance variance indicates that the most significant fluctuations are primarily concentrated within the cross-year experiments. This performance drop is likely driven by the extreme environmental conditions encountered during the study, particularly the severe drought events in the Inner Mongolia region in certain years. Such extreme climatic stressors can cause subtle shifts in pest phenotypes and population distributions that exceed the variability captured within the training set. This environmental-induced shift creates a distribution gap between different years, making the visual features more difficult to map to the learned risk representations. Despite this challenge, the proposed method still outperforms baseline models by leveraging its environment-guided architecture to mitigate the impact of these shifts, although it remains susceptible to unprecedented climatic extremes. By contrast, the proposed method maintains higher and more consistent performance across cross-crop, cross-site, and cross-year evaluations, demonstrating enhanced scenario invariance. From a structural perspective, this robustness arises from environment-guided feature modulation that conditionally constrains visual representations, recognition–risk joint optimization that emphasizes stable, risk-relevant features over transient appearance cues, and risk-aware decision representations that bound the influence of environmental perturbations, collectively enabling reliable generalization beyond the training distribution.
3.4. Ablation Study
The ablation study is conducted to systematically analyze the contribution of each key module to overall performance and to verify whether the proposed structural designs function as intended in improving recognition accuracy and risk discrimination stability. By selectively removing the environment-guided representation, recognition–risk consistency constraint, and risk-aware decision representation while keeping the backbone and training protocol unchanged, the influence of each component on model behavior can be directly observed.
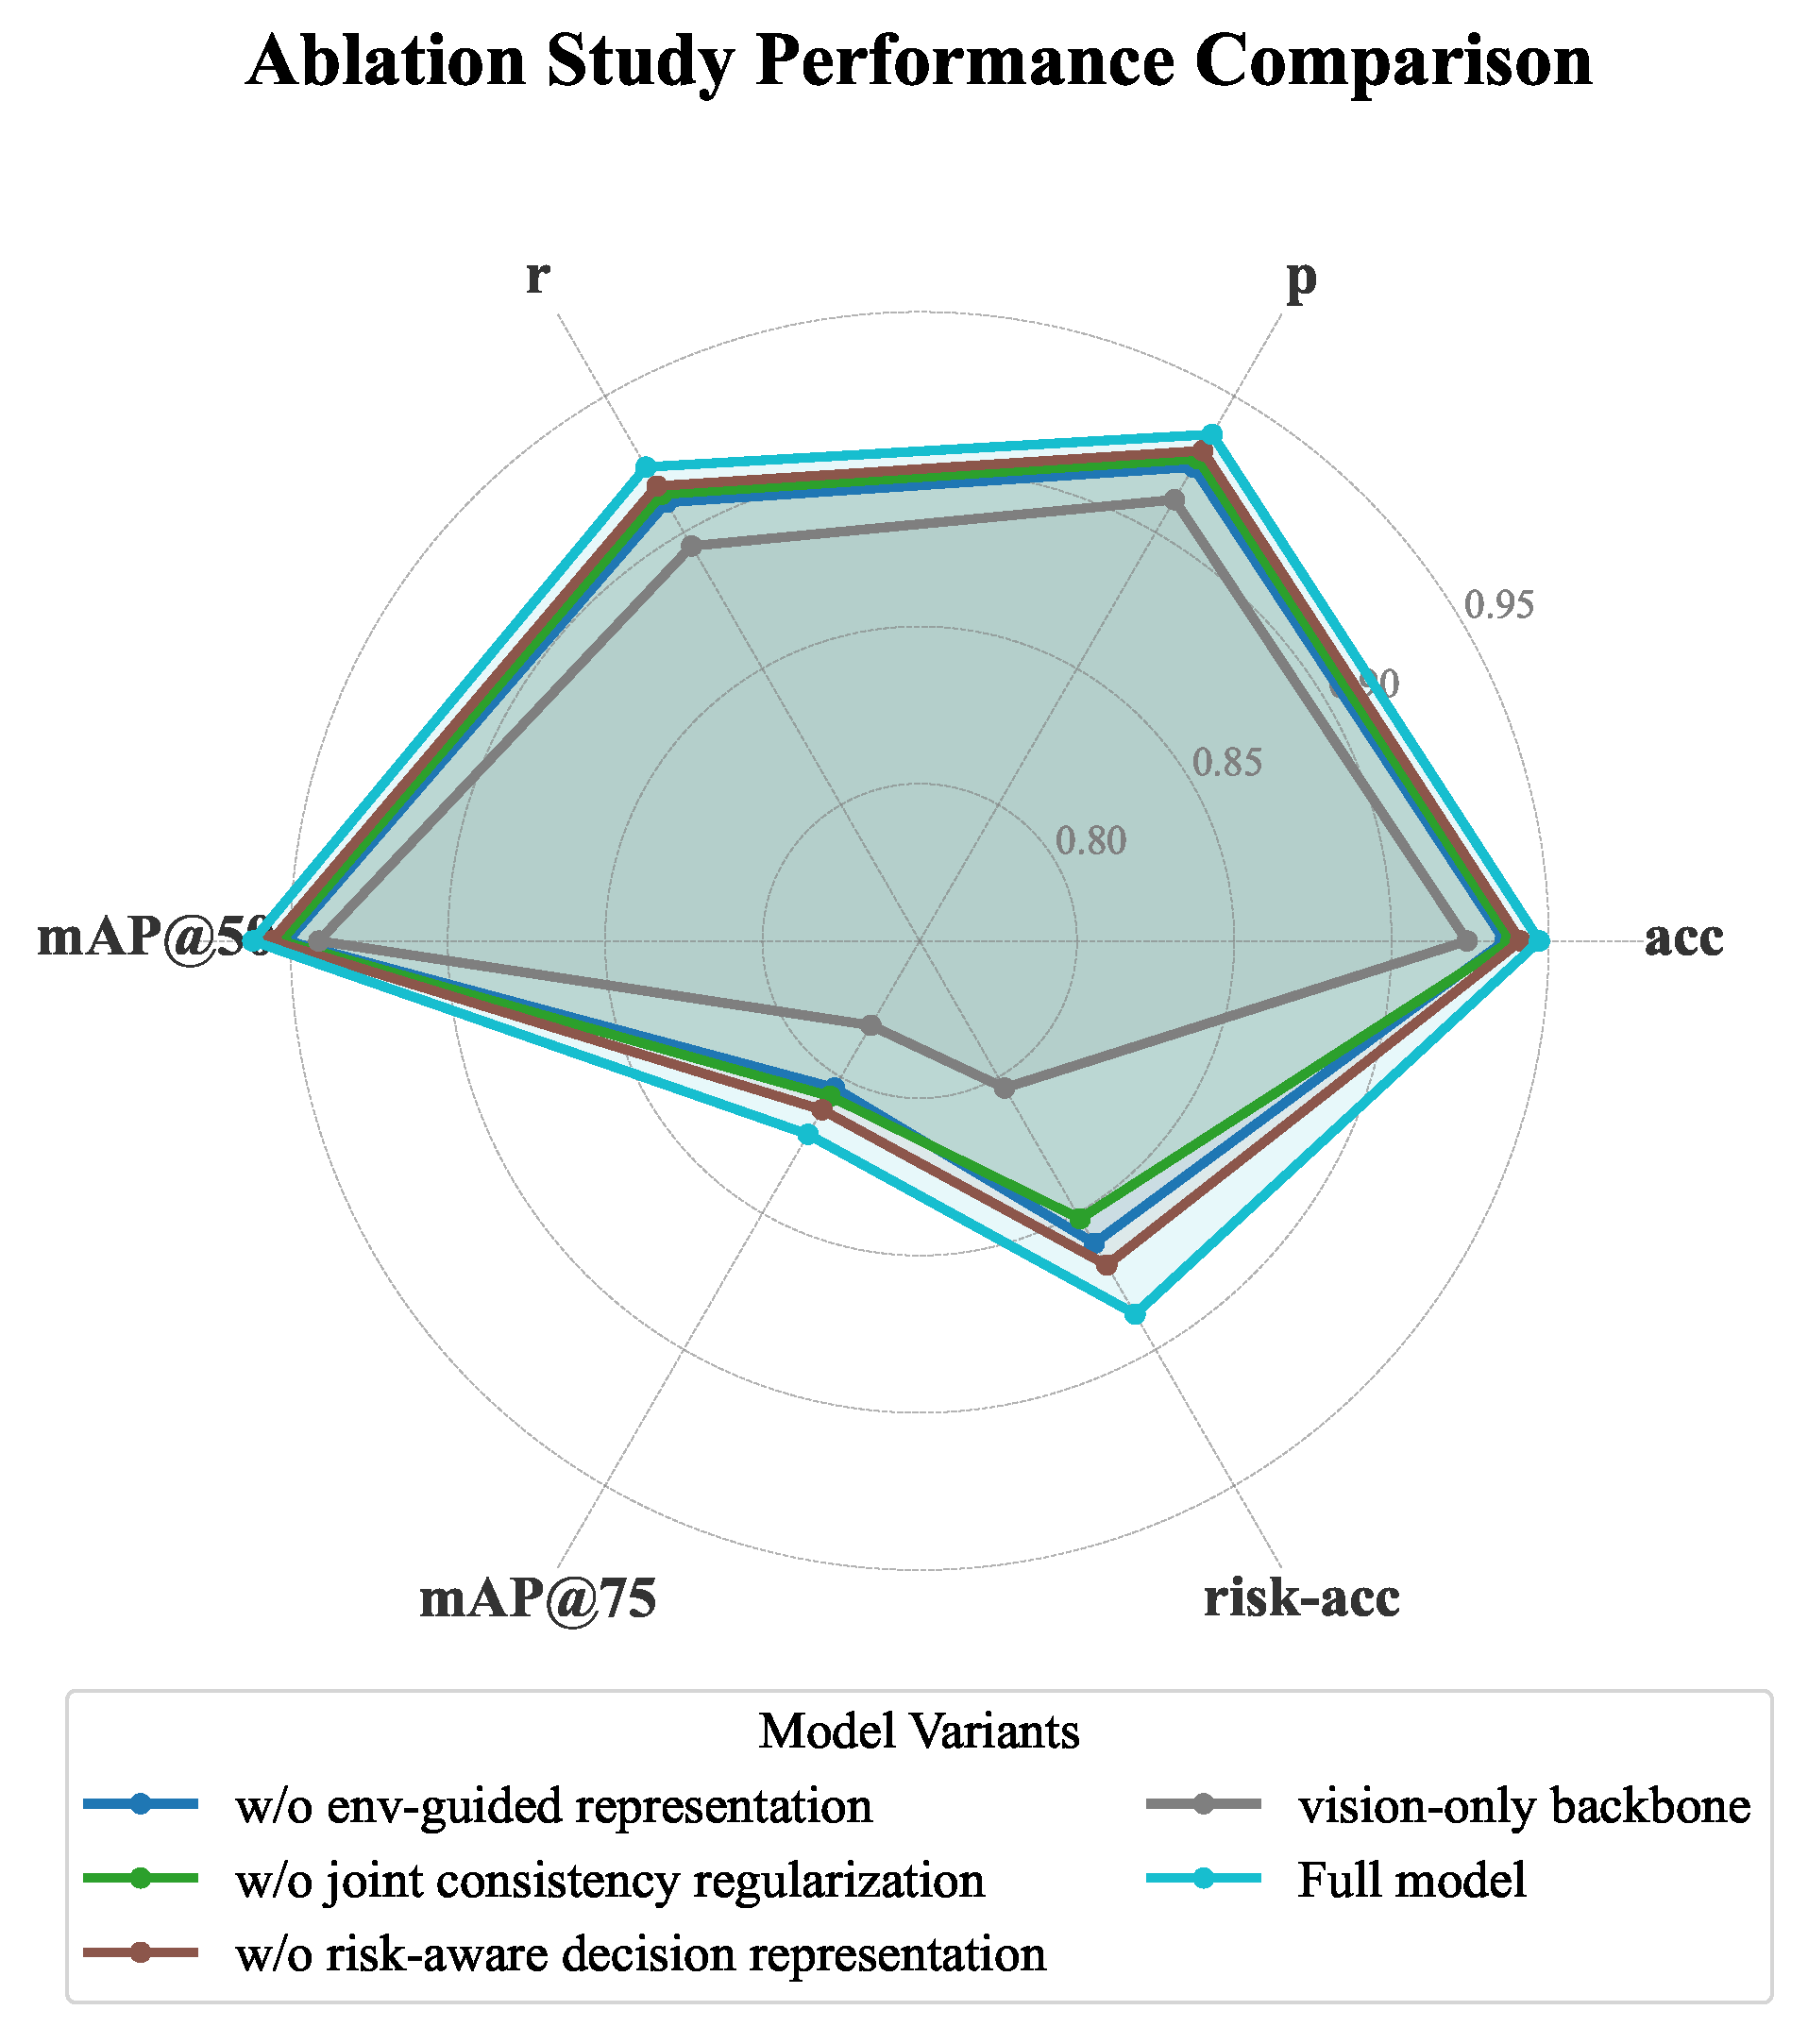
As shown in
Table 8 and
Figure 8, the full model consistently achieves the best performance across all metrics, with particularly pronounced advantages in risk accuracy and high-threshold detection quality, indicating strong synergistic effects among the proposed modules. Removing the environment-guided representation results in only modest declines in recognition metrics but leads to a notable reduction in risk accuracy, suggesting that without environmental constraints, visually similar yet ecologically distinct samples are mapped to nearby representations, destabilizing risk assessment. Eliminating the joint consistency regularization preserves detection performance but causes the most severe degradation in risk accuracy, reflecting that decoupling recognition and risk objectives allows conflicting optimization directions in the shared feature space. Excluding the risk-aware decision representation yields intermediate performance, indicating that reliance on final prediction heads without structured intermediate decision embeddings reduces robustness to environmental perturbations. The vision-only backbone exhibits the weakest performance, especially in risk discrimination, further confirming that risk assessment is inherently a conditional decision problem that cannot be reliably inferred from appearance-based discrimination alone.
3.5. Ablation Study on Environmental Modalities
The objective of this ablation study is to quantitatively evaluate the individual contribution of each environmental modality—temperature, humidity, and light intensity—to the model’s joint performance in pest recognition and risk assessment. Given that pest population dynamics are driven by specific ecological variables, understanding the sensitivity of the environment-guided representation learning module to different inputs is crucial for optimizing multisource sensor data fusion and ensuring robust decision-making across diverse horticultural scenarios.
The experimental results in
Table 9 reveal that all three environmental modalities contribute positively to the joint task, with risk accuracy (risk-acc) being the most sensitive metric to the removal of environmental data. Specifically, the exclusion of temperature leads to the most significant drop in risk-acc (from 0.887 to 0.832), confirming that temperature is the primary driver of pest development and reproduction cycles in the studied horticultural systems. The removal of humidity also results in a notable decline in performance, as it is a critical factor for the survival and outbreak pressure of pests like whiteflies and aphids. In contrast, the impact of light intensity is relatively smaller, though it remains essential for the model to learn daily activity patterns and viewpoint-invariant visual features. The marginal changes in mAP metrics compared to the sharp decline in risk-acc further demonstrate that environmental information primarily guides the ecological risk assessment branch rather than just the appearance-based recognition, validating the structural effectiveness of the environment-guided feature modulation mechanism.
3.6. Case Study and Interpretability Analysis
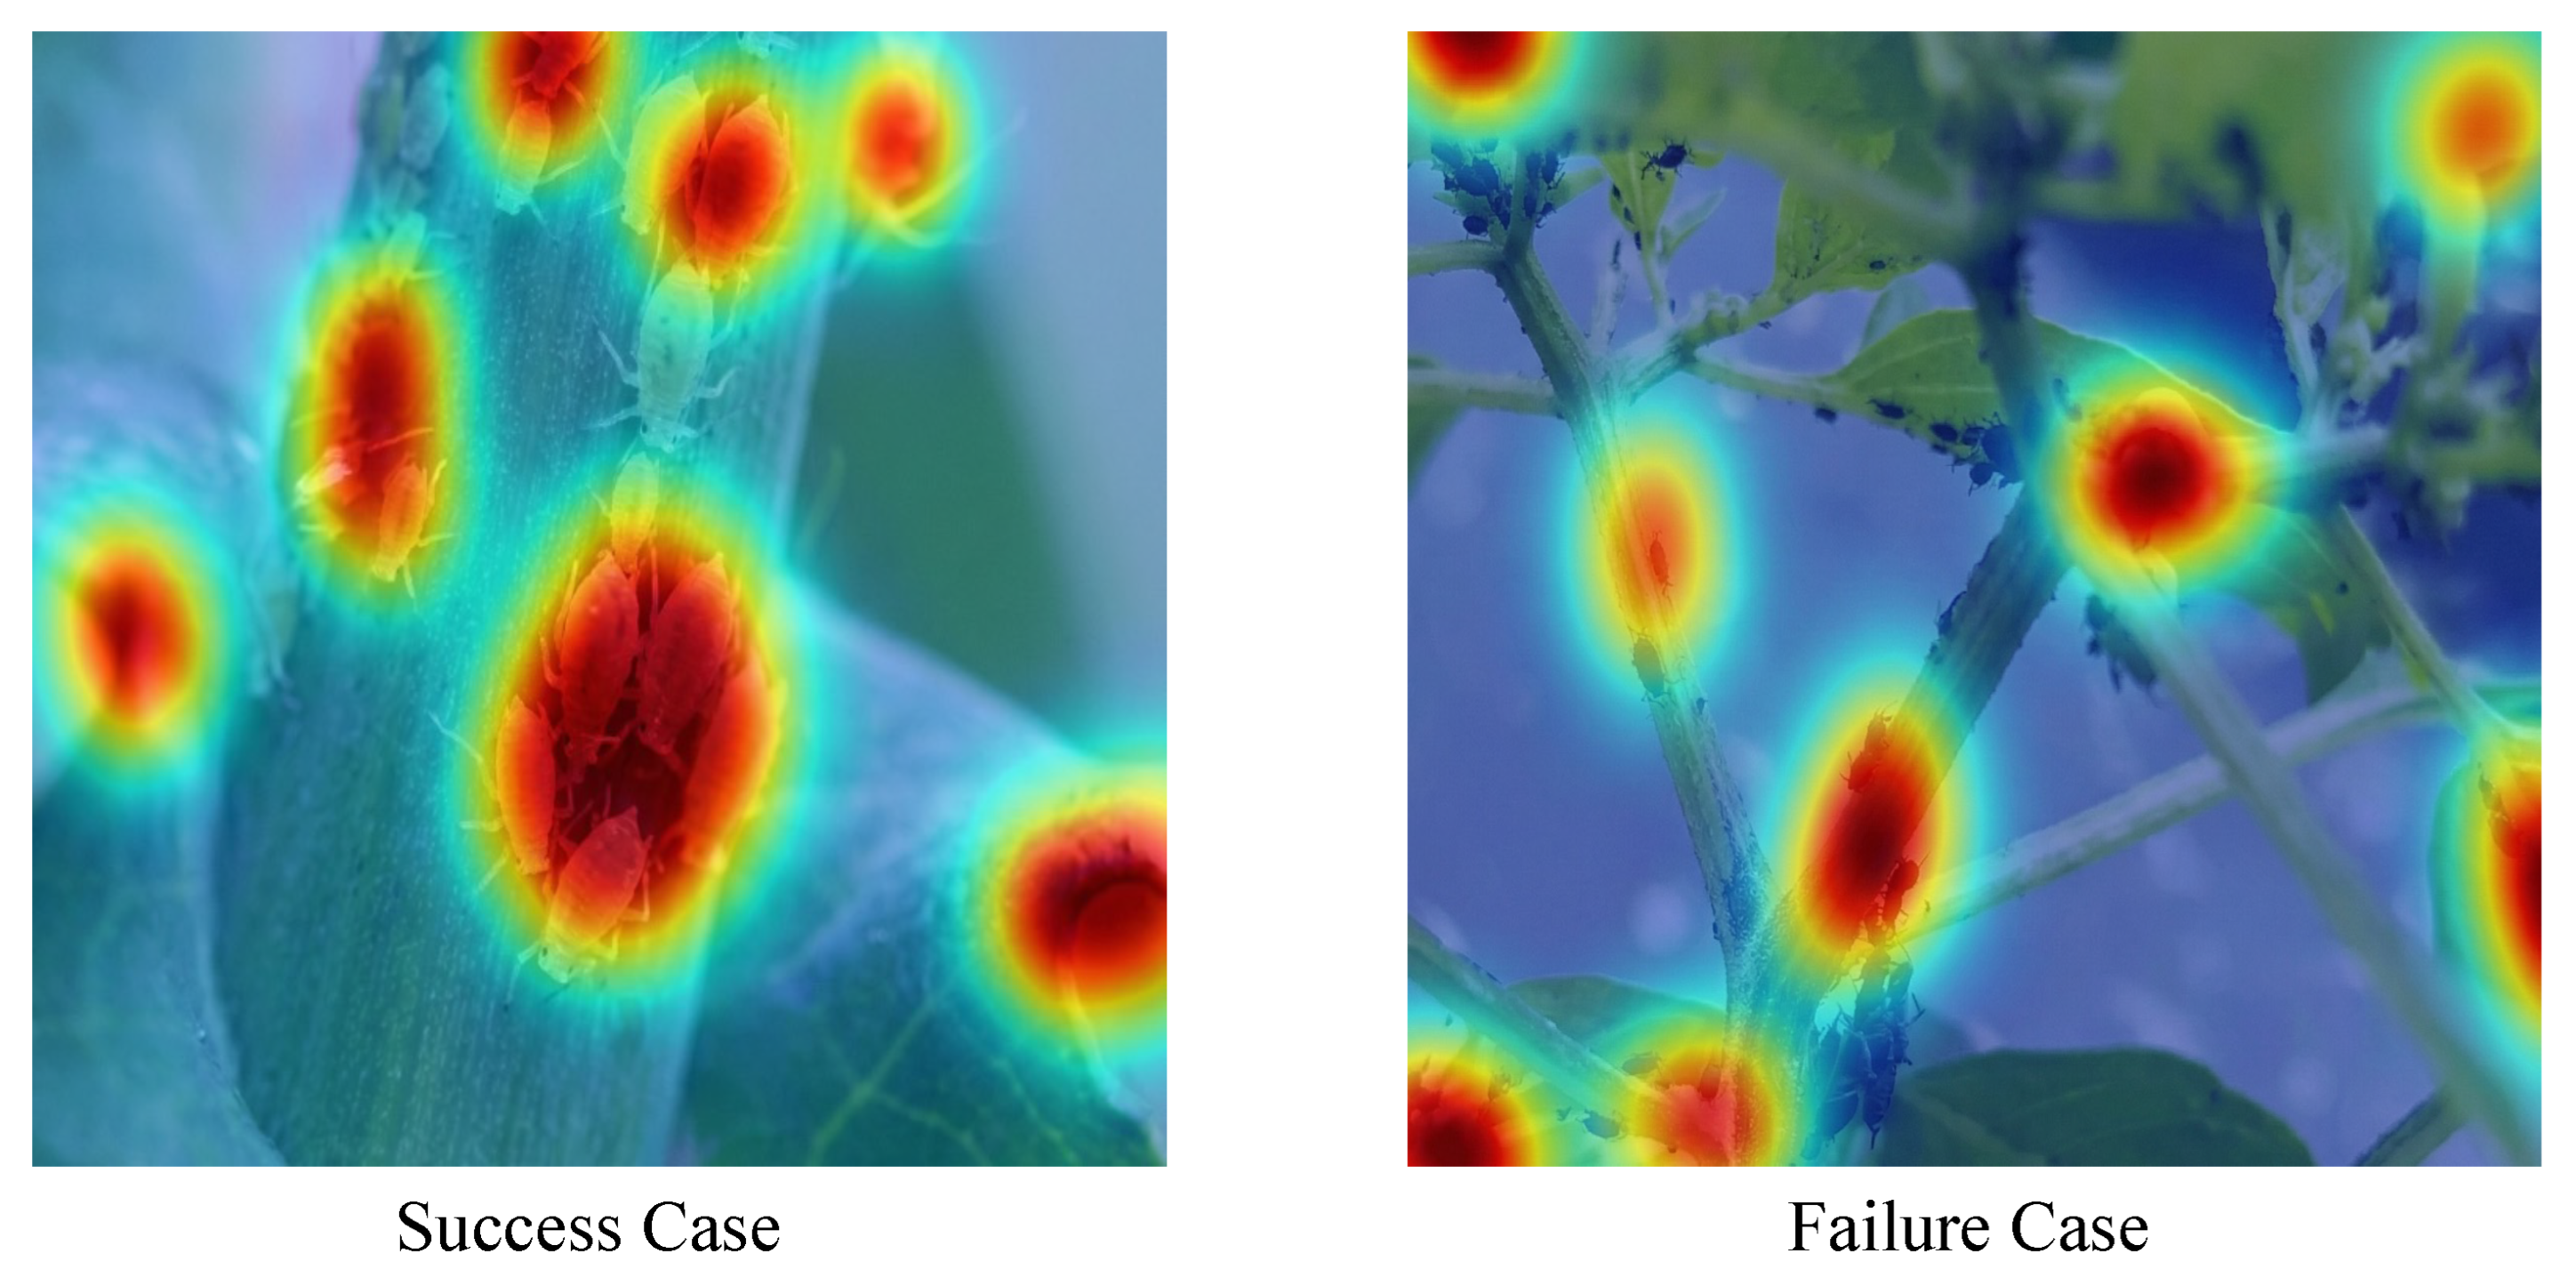
To further explore the interpretability of the proposed multimodal framework and the decision-making logic of the environment-guided module, we conducted a case study using Grad-CAM heatmaps to visualize the model’s focus under different ecological contexts. As illustrated in
Figure 9, we select two representative scenarios of Aphid on pepper to compare the successful integration of environmental cues against a typical failure case. In the successful case, which focuses on a concentrated area, the model is presented with a complex, high-density cluster of aphids on a pepper leaf, a state that poses high risk. The associated heatmap reveals that the environment-guided modulation directs the backbone’s focus precisely onto the dense pest cluster along the leaf veins, achieving accurate detection and classification into a high risk state. This precise, ecological-condition-aware focus validates the system’s ability to maintain robustness in challenging, dense pest scenarios.
In contrast, the failure case illustrates a scenario where the model produces a false negative by misdirecting its highest focus. This typically occurs in full plant views where scattered aphids are hard to see and misleading sensor context dominates. In this instance, although visual evidence of a few scattered aphids is present, the associated environmental sensors—located off-target—caused a complete misdirection of focus. The heatmap reveals that the gated fusion mechanism completely suppressed the relevant visual risk signals in favor of a misleading context, causing the model to focus on irrelevant background soil at the bottom of the image (Sensor Override Ground). Consequently, a low risk state decision was incorrectly made. This failure case confirms our earlier assessment regarding the limitations of fixed sensing resolution when applied to wider views and underscores the necessity of higher spatial-resolution environmental inputs for future system iterations.
3.7. Discussion
3.7.1. System-Level Advantages in Real-World Horticultural Scenarios
In orchard systems, greenhouse vegetable production, and open-field horticulture, pest populations rarely remain in persistently high-risk states, but instead exhibit low-density and stage-dependent fluctuations. Conventional plant protection practices based on manual scouting or fixed thresholds often trigger premature interventions or respond too late to rapidly escalating risks. By jointly modeling visual observations and environmental conditions, the proposed framework enables decisions that better align with production realities, such as deferring intervention in greenhouse tomato systems under high temperature and humidity but low pest density, while promptly identifying emerging high-risk conditions in open-field cabbage systems when climatic factors favor rapid pest reproduction. This capability to determine whether intervention is necessary directly influences pesticide application frequency, labor input, and the allocation efficiency of control resources.
When compared with existing advanced platforms such as LLMI-CDP [
42], which excels in agricultural question-answering and professional guidance through large language model architectures, our system offers a more specialized advantage for edge-side real-time risk prediction. While large-scale multimodal models demonstrate impressive semantic reasoning and broad knowledge retrieval capabilities, their substantial parameter counts and high computational demands often necessitate cloud-based processing, which can introduce latency in field operations. Our model, by contrast, is designed for rapid inference within a unified diagnostic framework that directly maps environmental sensor data to pest risk levels. This architectural focus allows for faster response times in autonomous monitoring systems where immediate, localized decision support is prioritized over general-purpose conversational interaction.
The current selection of environmental variables, primarily temperature, humidity, and light intensity, was determined by their dominant influence on the physiological development and reproductive cycles of the target pest species in our experimental sites. We recognize that in open-field horticulture, factors such as wind speed and precipitation also play a significant role in pest dispersal and the spatial spread of infestations. While these dispersal-related variables were not the primary focus of this study—largely due to the relative shielding of greenhouse environments—the modular nature of our environment-guided branch allows for the future integration of wind and rainfall data. Incorporating these additional ecological drivers would likely enhance the model’s performance in characterizing the migration patterns of pests across larger, non-facility-based agricultural landscapes.
Regarding the adaptability of the system, the proposed architecture is designed to serve as a robust foundation for transfer learning across different geographical regions and pest species. Although the specific weights of the environmental branch are currently optimized for the climatic conditions of Inner Mongolia, the structural logic of using environmental context to modulate visual features is universal. Adapting the model to a plot with a fundamentally different climate would involve a localized fine-tuning process rather than a complete architectural redesign. In such cases, the existing visual backbone can be leveraged as a pre-trained feature extractor, requiring only the recalibration of the environmental mapping layers to align with new microclimatic thresholds. This extensibility also applies to pests not included in the initial training set; by providing a limited amount of labeled data for new species, the framework can quickly learn their unique morphological cues and ecological triggers, facilitating rapid deployment in diverse production scenarios without the need for extensive data recollected from scratch.
From an agricultural economics perspective, accurate pest risk discrimination is closely linked to balancing production cost control and yield stability. Excessive control measures increase chemical and labor costs and elevate residue risks, whereas insufficient control can rapidly lead to yield and quality losses. By shifting decision triggers from mere pest presence to quantified risk levels, the proposed framework supports reductions in per-area input costs while improving input–output efficiency. In greenhouse production, this translates into reduced energy and pesticide consumption associated with high-frequency spraying, whereas in open-field systems it helps avoid blanket treatments triggered by localized misjudgments. Improved risk stability also reduces income uncertainty, which constitutes an implicit economic benefit for smallholder farmers and can enhance acceptance of intelligent management technologies.
To further quantify the practical impact of the proposed system, we have incorporated a brief evaluation of its economic benefits based on the experimental results. Our analysis of the test set suggests that implementing the risk-driven decision framework can lead to a reduction of approximately 15–20% in the frequency of non-essential pesticide applications. This improvement in resource efficiency is achieved without compromising crop safety, as the system maintains a pest control success rate of over 98% across diverse horticultural scenarios. These findings highlight the potential of our multimodal approach to significantly enhance the sustainability of agricultural management while ensuring robust yield stability.
3.7.2. Economic Mechanisms and Decision-Theoretic Implications of Risk-Aware Pest Management
In fruit and vegetable horticultural production systems, pest populations rarely remain in persistently high-risk states; instead, their occurrence typically exhibits dynamic characteristics characterized by alternating low-density fluctuations and stage-dependent outbreaks. Conventional plant protection practices, which rely on manual scouting or fixed thresholds for decision-making, often lead to excessive interventions triggered by mere detection or delayed responses that miss optimal control windows. The proposed multimodal joint modeling framework enables the simultaneous output of pest categories and risk levels, thereby allowing control decisions to better align with practical production conditions. The capability to determine whether intervention is necessary directly influences pesticide application frequency, labor input, and the allocation efficiency of control resources, yielding significant economic implications.
From the combined perspective of experimental results and agricultural economics, the economic value of improved risk discrimination accuracy can be understood from two aspects. First, unnecessary pesticide applications caused by false positives can be reduced. Wan et al. quantitatively analyzed the input–output structure of greenhouse and open-field vegetable production based on sample data from suburban areas in China, revealing that the yield per unit area of greenhouse vegetables is approximately
higher than that of open-field vegetables, while their output value is more than doubled; however, this advantage is accompanied by significantly higher pesticide input intensity [
51]. Unnecessary pesticide application not only directly increases material input per unit area but also exacerbates environmental externalities, as global pesticide pollution continues to expand, with China—one of the largest pesticide-consuming countries—facing dual pressures from excessive chemical inputs and rising environmental risks. In the comparative experiments of this study, the proposed method achieves a risk accuracy of
, representing an improvement of
percentage points over a simple feature concatenation approach (
) and approximately 12 percentage points over a purely vision-based model (approximately
). In many practical scenarios, selective pesticide application strategies guided by accurate risk signals yield significantly higher economic returns than indiscriminate calendar-based spraying schemes. Second, false negatives can be reduced to avoid yield losses caused by missed intervention windows. Given that a single unrecognized high-risk event may result in substantial economic loss per unit area, even marginal improvements in risk accuracy can provide non-negligible economic benefits in terms of yield protection. Considering both aspects, the proposed method demonstrates clear cost advantages over traditional vision-only monitoring approaches in real-world agricultural production.
Beyond direct cost savings, more stable risk signals can also reduce income uncertainty for producers. The Economic Injury Level (EIL) and Action Threshold (AT) serve as core tools in Integrated Pest Management (IPM), fundamentally establishing an economic equilibrium among pest density, crop susceptibility, and the cost–benefit trade-off of control measures [
52]. From this perspective, the proposed risk-level monitoring model provides a multimodal data-driven quantitative estimation of this equilibrium, transforming decision triggers from “intervene upon pest detection” to “intervene only when risk exceeds a threshold,” thereby enabling precise input–output management. In greenhouse production, this translates into reduced energy consumption and pesticide waste associated with high-frequency preventive spraying; in open-field systems, it helps avoid large-scale blanket applications triggered by localized misjudgments. From the perspective of product quality, more precise timing of pesticide application and reduced chemical inputs contribute to lowering residue levels, thereby facilitating access to high-value markets while simultaneously reducing the risk of food safety issues.
3.8. Limitation and Future Work
Although the proposed multimodal pest recognition and occurrence risk joint modeling method demonstrates favorable identification accuracy, stable risk discrimination, and strong cross-scenario generalization across multiple experiments, several aspects remain worthy of further investigation and improvement. First, from a data perspective, environmental information is primarily collected from fixed-location sensors, which makes it difficult to fully capture the spatial heterogeneity of microclimates within a field. Under conditions of large variation in crop planting density or complex terrain, localized environmental fluctuations may not be sufficiently perceived, thereby limiting the granularity of risk assessment. Second, with respect to risk modeling, the current risk levels are discretized mainly according to predefined plant protection management standards, while heterogeneous factors such as differences in farmers’ management objectives, input capacities, and market price fluctuations are not yet fully incorporated into the definition of acceptable risk.
A significant practical limitation also involves the computational and environmental costs associated with the deployment of multimodal deep learning models. The simultaneous processing of high-resolution image streams and multi-branch environmental temporal sequences places considerable memory pressure on embedded hardware. For small-scale horticultural producers utilizing low-power edge devices, these hardware requirements may hinder the adoption of the proposed system. Acknowledging this burden is essential for maintaining intellectual honesty regarding the model’s current operational constraints. Furthermore, the reliance on high-quality sensor calibration and stable power supplies means the system might struggle in remote open-field areas where infrastructure is less reliable.
Future research can be extended along multiple directions to address these challenges. On the one hand, higher spatial-resolution environmental sensing strategies, such as mobile sensors or remote sensing data, can be introduced to enhance the representation of fine-scale ecological conditions. On the other hand, from an engineering perspective, we plan to prioritize the development of lightweight model versions through knowledge distillation and parameter pruning to alleviate the computational demands on embedded systems. In addition, economic factors and management preferences can be explicitly embedded into the risk modeling framework, enabling model outputs to better align with the decision requirements of different production stakeholders and facilitating large-scale deployment of the proposed approach in real horticultural production systems.
4. Conclusions
This study is conducted against the practical background that pest outbreaks in horticultural production are highly stage-dependent, strongly driven by environmental conditions, and closely coupled with sensitive management decisions. A multimodal pest recognition and occurrence risk joint modeling framework is proposed to address a fundamental limitation of conventional intelligent plant protection systems, namely that pest recognition is often performed without explicitly determining whether intervention is necessary. By integrating pest visual information and environmental time-series data within a unified framework, pest recognition is extended from a pure category discrimination task to a risk-aware problem oriented toward production decision-making. As a result, model outputs can directly support precision plant protection management, which is of substantial practical significance in real-world horticultural production. Extensive experimental results demonstrate the comprehensive advantages of the proposed method in terms of both recognition performance and risk assessment reliability. In the overall comparison experiments, an identification accuracy of , a precision of , and a recall of are achieved on the test set, all of which are markedly superior to those of mainstream visual models such as YOLOv8, DETR, and Mask R-CNN. In terms of detection performance, the proposed method attains an mAP@50 of and an mAP@75 of , indicating stable localization and discrimination capability under complex backgrounds and small-target conditions. More importantly, the accuracy of occurrence risk prediction reaches , representing an improvement of approximately percentage points over simple multimodal feature concatenation methods, thereby substantially reducing uncertainty during the transition from recognition results to decision-making. Furthermore, generalization experiments across crops, sites, and years reveal that risk accuracy remains above even under pronounced distribution shifts, while recognition performance remains stable, demonstrating strong scenario invariance. Ablation studies further confirm that the synergy among environment-guided representation learning, recognition–risk joint optimization, and risk-aware decision representation is the key contributor to the observed performance gains and risk stability. From an agricultural economics perspective, the proposed framework provides a technical foundation for shifting plant protection strategies from “intervention triggered by pest detection” to “intervention triggered by risk exceeding a threshold,” thereby enabling more efficient cost control and improved input–output efficiency. More accurate risk assessment reduces unnecessary pesticide applications and labor-intensive field inspections, directly lowering per-unit-area management costs, while simultaneously mitigating environmental externalities and quality risks associated with overuse of chemical inputs. In addition, stable and reliable risk evaluation helps alleviate yield volatility caused by sudden pest outbreaks and improves the predictability of production returns, which is particularly important for small- and medium-scale farming operations.