


Abstract
To address the challenges of low manual harvesting efficiency and high difficulty in automated picking of safflower filaments in the unstructured field environments of Xinjiang, this study proposes an intelligent harvesting method that integrates lightweight visual detection and adaptive localization. Firstly, a safflower image dataset covering multiple scenarios and growth stages was constructed. An improved lightweight detection model, named SSO-YOLO, was proposed based on the YOLOv11n model. By introducing the StarNet backbone network, the SEAttention mechanism, and structural optimization, this model achieves a high detection accuracy (mAP@0.5 of 97.4%) while reducing the model size by 29.4% to 3.94 MB, significantly enhancing its deployment feasibility on mobile devices. Secondly, based on the detection results, an adaptive localization algorithm for picking points was developed. This algorithm achieves precise localization of picking points at the filament–flower head junction by integrating geometric analysis of filament growth posture, dynamic judgment of connection conditions, and intersection calculation of rotated bounding boxes. Experimental results demonstrate that this algorithm achieves an average localization success rate of 87.3% across various unstructured scenarios such as occlusion and backlighting, representing an improvement of approximately 10.7 percentage points over traditional methods. The estimation error for filament posture angle is merely 0.6°, and the localization success rate remains above 90% across the entire growth cycle. This study provides an efficient and robust visual solution for the automated harvesting of safflower filaments and offers valuable insights for advancing intelligent harvesting technologies for specialty cash crops.
1. Introduction
Safflower (Carthamus tinctorius L.), an annual herbaceous plant belonging to the Asteraceae family, is not only an important oilseed and natural pigment crop but is also highly valued in traditional medicine. Its dried filaments, commonly known as “safflower filaments,” are recognized for significant therapeutic effects such as promoting blood circulation, resolving stasis, regulating menstruation, and alleviating pain, leading to a growing market demand [1,2,3]. In major production regions like Xinjiang, safflower is typically cultivated in a non-structured pattern characterized by no film mulching and uniform row spacing. This practice results in an extremely complex agronomic scenario where plant heights vary, flowering is asynchronous, and filaments are distributed randomly in space, often intertwined with stems and leaves. Agronomic research clearly indicates that the content of bioactive compounds in safflower filaments changes dynamically. The optimal harvesting window falls 3 to 4 days after flowering, when the filament color turns from yellow to orange-red, moisture content is moderate, and the accumulation of key active components like hydroxysafflor yellow A reaches its peak [4,5]. Crucially, each safflower capitulum can flower sequentially 2–3 times during its full growth cycle. This necessitates that harvesting operations possess both “non-destructive” and “timely” characteristics. Currently, the harvesting of safflower filaments still relies primarily on manual labor, which suffers from low efficiency and high labor costs, making it unsuitable for large-scale cultivation demands. Therefore, developing efficient and intelligent mechanized harvesting technology for safflower filaments is an urgent requirement to overcome industry bottlenecks and ensure consistent product quality.
With the rapid advancement of agricultural robotics and artificial intelligence, vision-based intelligent harvesting systems have emerged as a pivotal direction for overcoming the picking bottlenecks of specialty cash crops [6]. In complex, unstructured field environments, achieving rapid and precise localization of picking points is key to the successful operation of harvesting robots [7]. Current research on visual localization for fruits or filaments has made significant progress for various crops, including famous tea, Chrysanthemum morifolium, and marigolds. These studies primarily rely on deep learning models from the YOLO series or Mask R-CNN, combined with morphological analysis or point cloud processing techniques, to achieve the recognition and coordinate extraction of picking points [8,9,10]. Collectively, this body of work demonstrates that a strategy combining “strong semantic perception provided by deep neural networks” with “precise localization guided by domain knowledge-driven geometric analysis” constitutes an effective paradigm for tackling complex agricultural scenarios.
Despite fruitful achievements in visual harvesting technology across numerous domains, its application to safflower filament harvesting remains a formidable challenge. Related research is still in its nascent and exploratory stages, exhibiting notable knowledge gaps. Regarding visual detection models for safflower filaments, challenges include the low detection accuracy, poor real-time performance, and large model size of such models. This is primarily due to mutual occlusion among filaments, flower heads, and foliage in unstructured growing environments. Zhou Jianping et al. from Xinjiang University proposed a natural environment safflower detection algorithm based on multi-feature extraction with YOLO-SSAR [11]. Their model achieved precision, recall, and mean Average Precision (mAP) rates of 90.1%, 88.5%, and 93.4% respectively on the test set, representing improvements of 5.9, 9.2, and 7.7 percentage points over the original YOLOv5s model, with a model size of 9.7 MB. Zhang Zhenguo et al. from Xinjiang Agricultural University proposed detection models for safflower filaments based on YOLOv3 and Faster R-CNN [12,13], achieving a mean Average Precision (mAP) of 91.49%. Their proposed models effectively addressed the difficulty of detecting safflower filaments under varying lighting conditions and foliage occlusion. Zhang Xinyue et al. from Northwest A&F University, addressing the issue of filaments being susceptible to complex field environments and limited device resources, proposed a lightweight safflower recognition model based on an improved YOLOv8 [14]. Compared to the baseline YOLOv8 model, their model size was reduced by 50.17% while achieving an average precision of 96.40%.
In the research on locating picking points for safflower filaments, although numerous scholars have combined morphology and deep learning algorithms for co-detection and localization, practical applications often face issues such as large model sizes hindering deployment on low-computational mobile platforms, and insufficient localization robustness in complex scenes like occlusion and backlighting. These limitations have yet to effectively meet the practical needs of automated safflower filament harvesting. For instance, the picking point localization model proposed earlier by the author’s team [15] was only effective for safflowers in the full-bloom stage and could not localize filaments across the entire safflower life cycle. The team led by Zhang Zhenguo proposed a lightweight picking point localization model based on SDC-DeepLabv3+ [16], which primarily utilized an improved DeepLabv3+ for safflower feature extraction and localized points based on a centroid projection method. However, issues with localization robustness persisted. Furthermore, the team led by Ge Yun from Shihezi University proposed picking point localization algorithms based on YOLO instance segmentation and safflower growth morphology [17,18]. For cases where the junction between occluded filaments and the flower head is invisible, they employed fitting based on detected partial regions, but this approach suffered from long processing times in practical localization.
Based on the above analysis, automated harvesting of safflower filaments still faces three core challenges: First, the filament targets are small in size and their morphology changes dynamically with growth, resulting in weak features in images and high susceptibility to interference from complex backgrounds. Second, factors such as varying field lighting, foliage occlusion, and disordered plant growth exacerbate uncertainty in visual recognition. Third, harvesting systems often need to be deployed on mobile robotic platforms, imposing strict requirements on the algorithm’s real-time performance, lightweight nature, and adaptability to embedded systems. Therefore, developing a robust, efficient, and lightweight detection and localization method for safflower filaments is crucial for advancing the intelligent harvesting of this crop.
To address the aforementioned problems, this study proposes an intelligent harvesting method for safflower filaments that integrates lightweight detection and adaptive localization. First, a safflower image dataset covering multiple scenarios and growth stages is constructed. Building upon the YOLOv11n model [19,20], an improved lightweight model named SSO-YOLO is designed. By deeply integrating a lightweight StarNet backbone [21], a channel attention mechanism (SEAttention) [22], and designing efficient detection modules, the model achieves robust and more accurate detection of safflower filaments and flower heads while significantly compressing the model size. Subsequently, an adaptive picking point localization algorithm based on 2D images is proposed. By fusing target geometric characteristics, dynamic judgment of growth posture, and rotated bounding box analysis, the algorithm enables precise calculation of picking points at the filament–flower head junction. Finally, validation is conducted on real field image data and samples from different growth stages. The comprehensive performance of the proposed method is systematically evaluated in terms of detection performance, localization success rate, angle estimation accuracy, and model efficiency. The aim is to provide a reliable technical reference for the automated harvesting of safflower filaments and other similar small-target crops.
2. Materials and Methods
2.1. Agronomic Basis and Requirements for Field Harvesting of Safflower Filaments
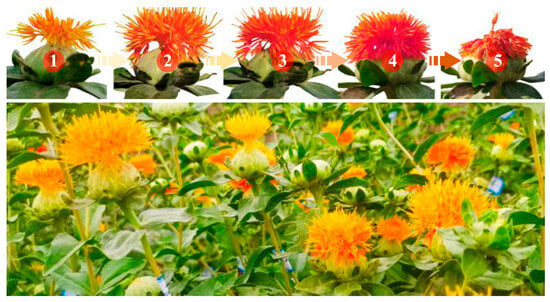
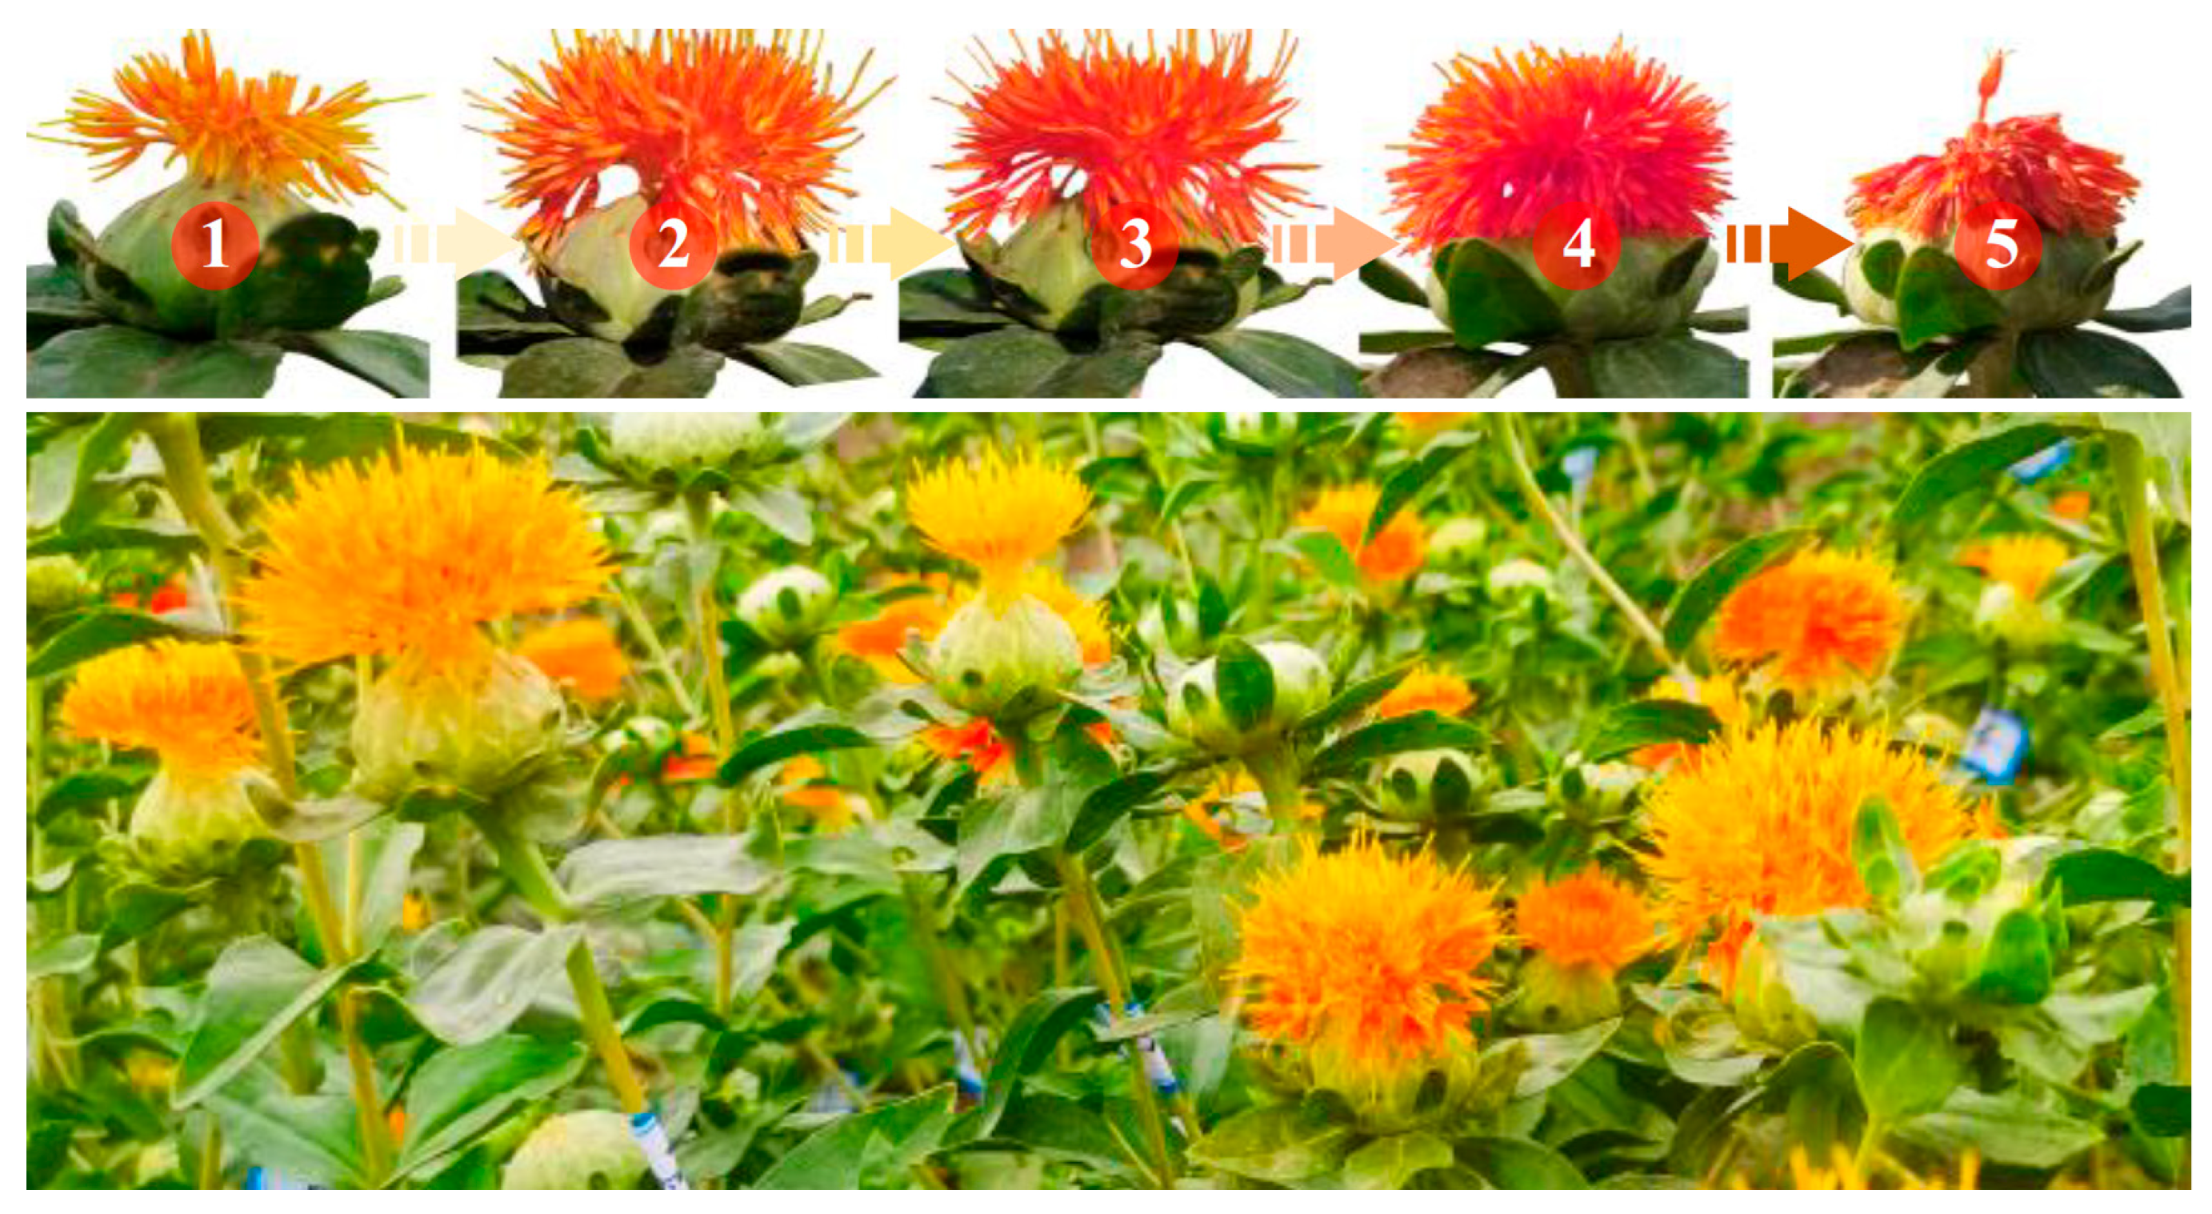
Safflower cultivation in Xinjiang currently predominantly employs a non-structured planting pattern characterized by no film mulching and uniform row spacing. This leads to diverse plant growth postures and incomplete synchrony in the flowering period. As shown in Figure 1, the numbers in the image indicate the days after flowering. The morphology and size of the filaments change dynamically depending on the growth stage and lighting conditions: from days 1 to 3 after flowering, the filaments stand erect and extend above the flower head; starting from day 4, they gradually droop as their moisture content decreases; by day 5 and beyond, most filaments become semi-dry and adhere closely to the surface of the flower head. According to the agronomic technical standards for safflower harvesting in Xinjiang, the optimal harvesting period is 3 to 4 days after flowering. At this stage, the filament color changes from yellow to orange-red, and the content of medicinal compounds is at its highest. Each flower head can flower sequentially 2–3 times during its complete growth cycle. Consequently, harvesting must simultaneously satisfy two key requirements: firstly, achieving non-destructive picking of filaments to avoid damaging the flower head and ensure subsequent flowering; secondly, possessing real-time recognition and harvesting capability to cope with the unstructured field environment and the dynamic changes in filament condition.
Figure 1.
Growth Morphology of Safflower.
2.2. Construction of the Field Safflower Image Dataset
2.2.1. Dataset Acquisition
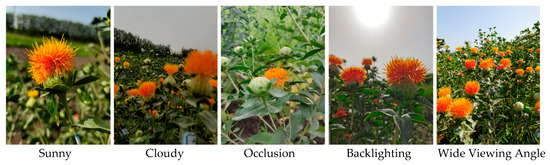
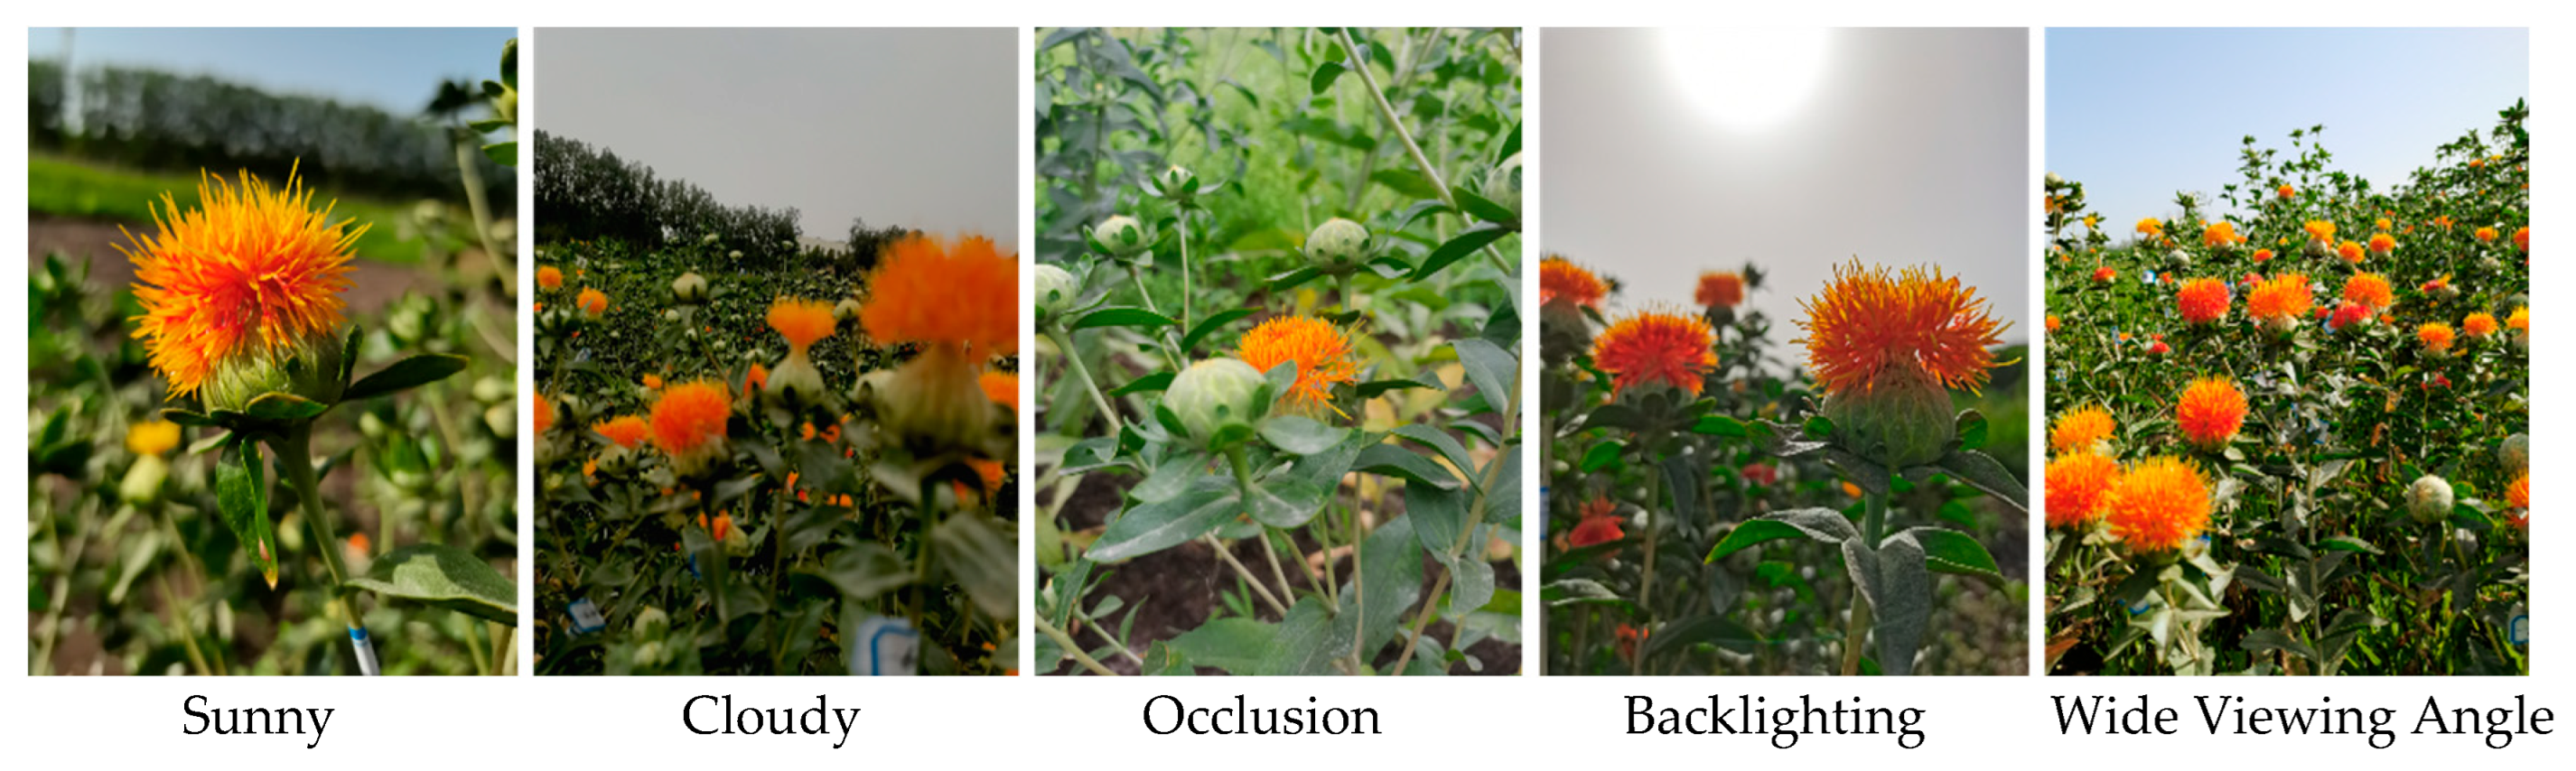
The image data for this study were collected at the safflower planting base of Xinjiang Institute of Technology (No. 1 Xuefu West Road, Aksu City, Xinjiang, China) from 20 to 25 June 2024. The acquisition device was a Huawei nova 7 Pro smartphone (Huawei Technology Co., Ltd., Guangdong, China), operated in professional camera mode for image acquisition. The image resolution was 3456 × 4608 pixels (approximately 16 megapixels). To simulate the actual working perspective of a field robot, the lens was positioned 0.3–1.0 m from the safflower plants during acquisition. Images were captured from two angles: eye-level and a 45° oblique angle. To comprehensively reflect the growth and morphological variations of safflower filaments in unstructured field environments, data acquisition covered various natural conditions, including scenarios such as sunny days, cloudy days, partial occlusion, backlighting, and different imaging perspectives. After preliminary screening and organization, a total of 1020 valid safflower images were obtained. Representative samples are shown in Figure 2.
Figure 2.
Sample Images from the Safflower Dataset.
2.2.2. Dataset Processing
To enhance the robustness and generalization capability of the safflower target detection model in unstructured farmland environments, this study addressed potential class distribution imbalances and model overfitting risks in the dataset caused by factors such as lighting and weather. By considering common operational challenges in the field like lighting variations, dust interference, and wind effects, data augmentation was applied to the original images. Specifically, three augmentation strategies were employed, random brightness adjustment, random saturation variation, and random blurring, to simulate visual changes in real-world conditions. After augmentation, the dataset comprised a total of 5000 images. These were divided into training, validation, and test sets in a 7:2:1 ratio, corresponding to 3500, 1000, and 500 images, respectively. Using the Rolabelimg3.0 software, manual annotation was performed on the safflower data covering the full growth cycle. Annotation categories included filaments and flower heads. The annotation boxes were minimum enclosing rectangles, rotated according to the actual growth orientation of the filaments and flower heads to ensure the long side of each rectangle was parallel or coincident with the target’s growth posture. Severely occluded or excessively distant targets were not annotated. The final annotation information was saved in XML format and subsequently converted into .txt format files readable by the detection model.
2.3. Lightweight Detection Model for Safflower
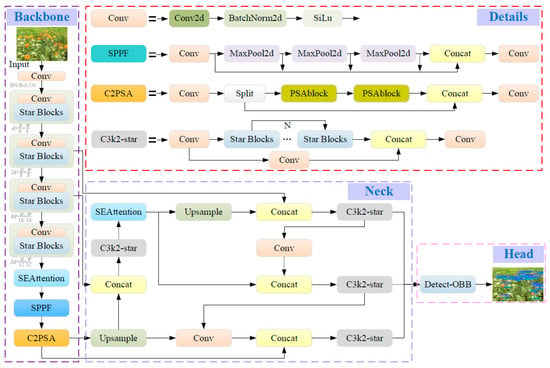
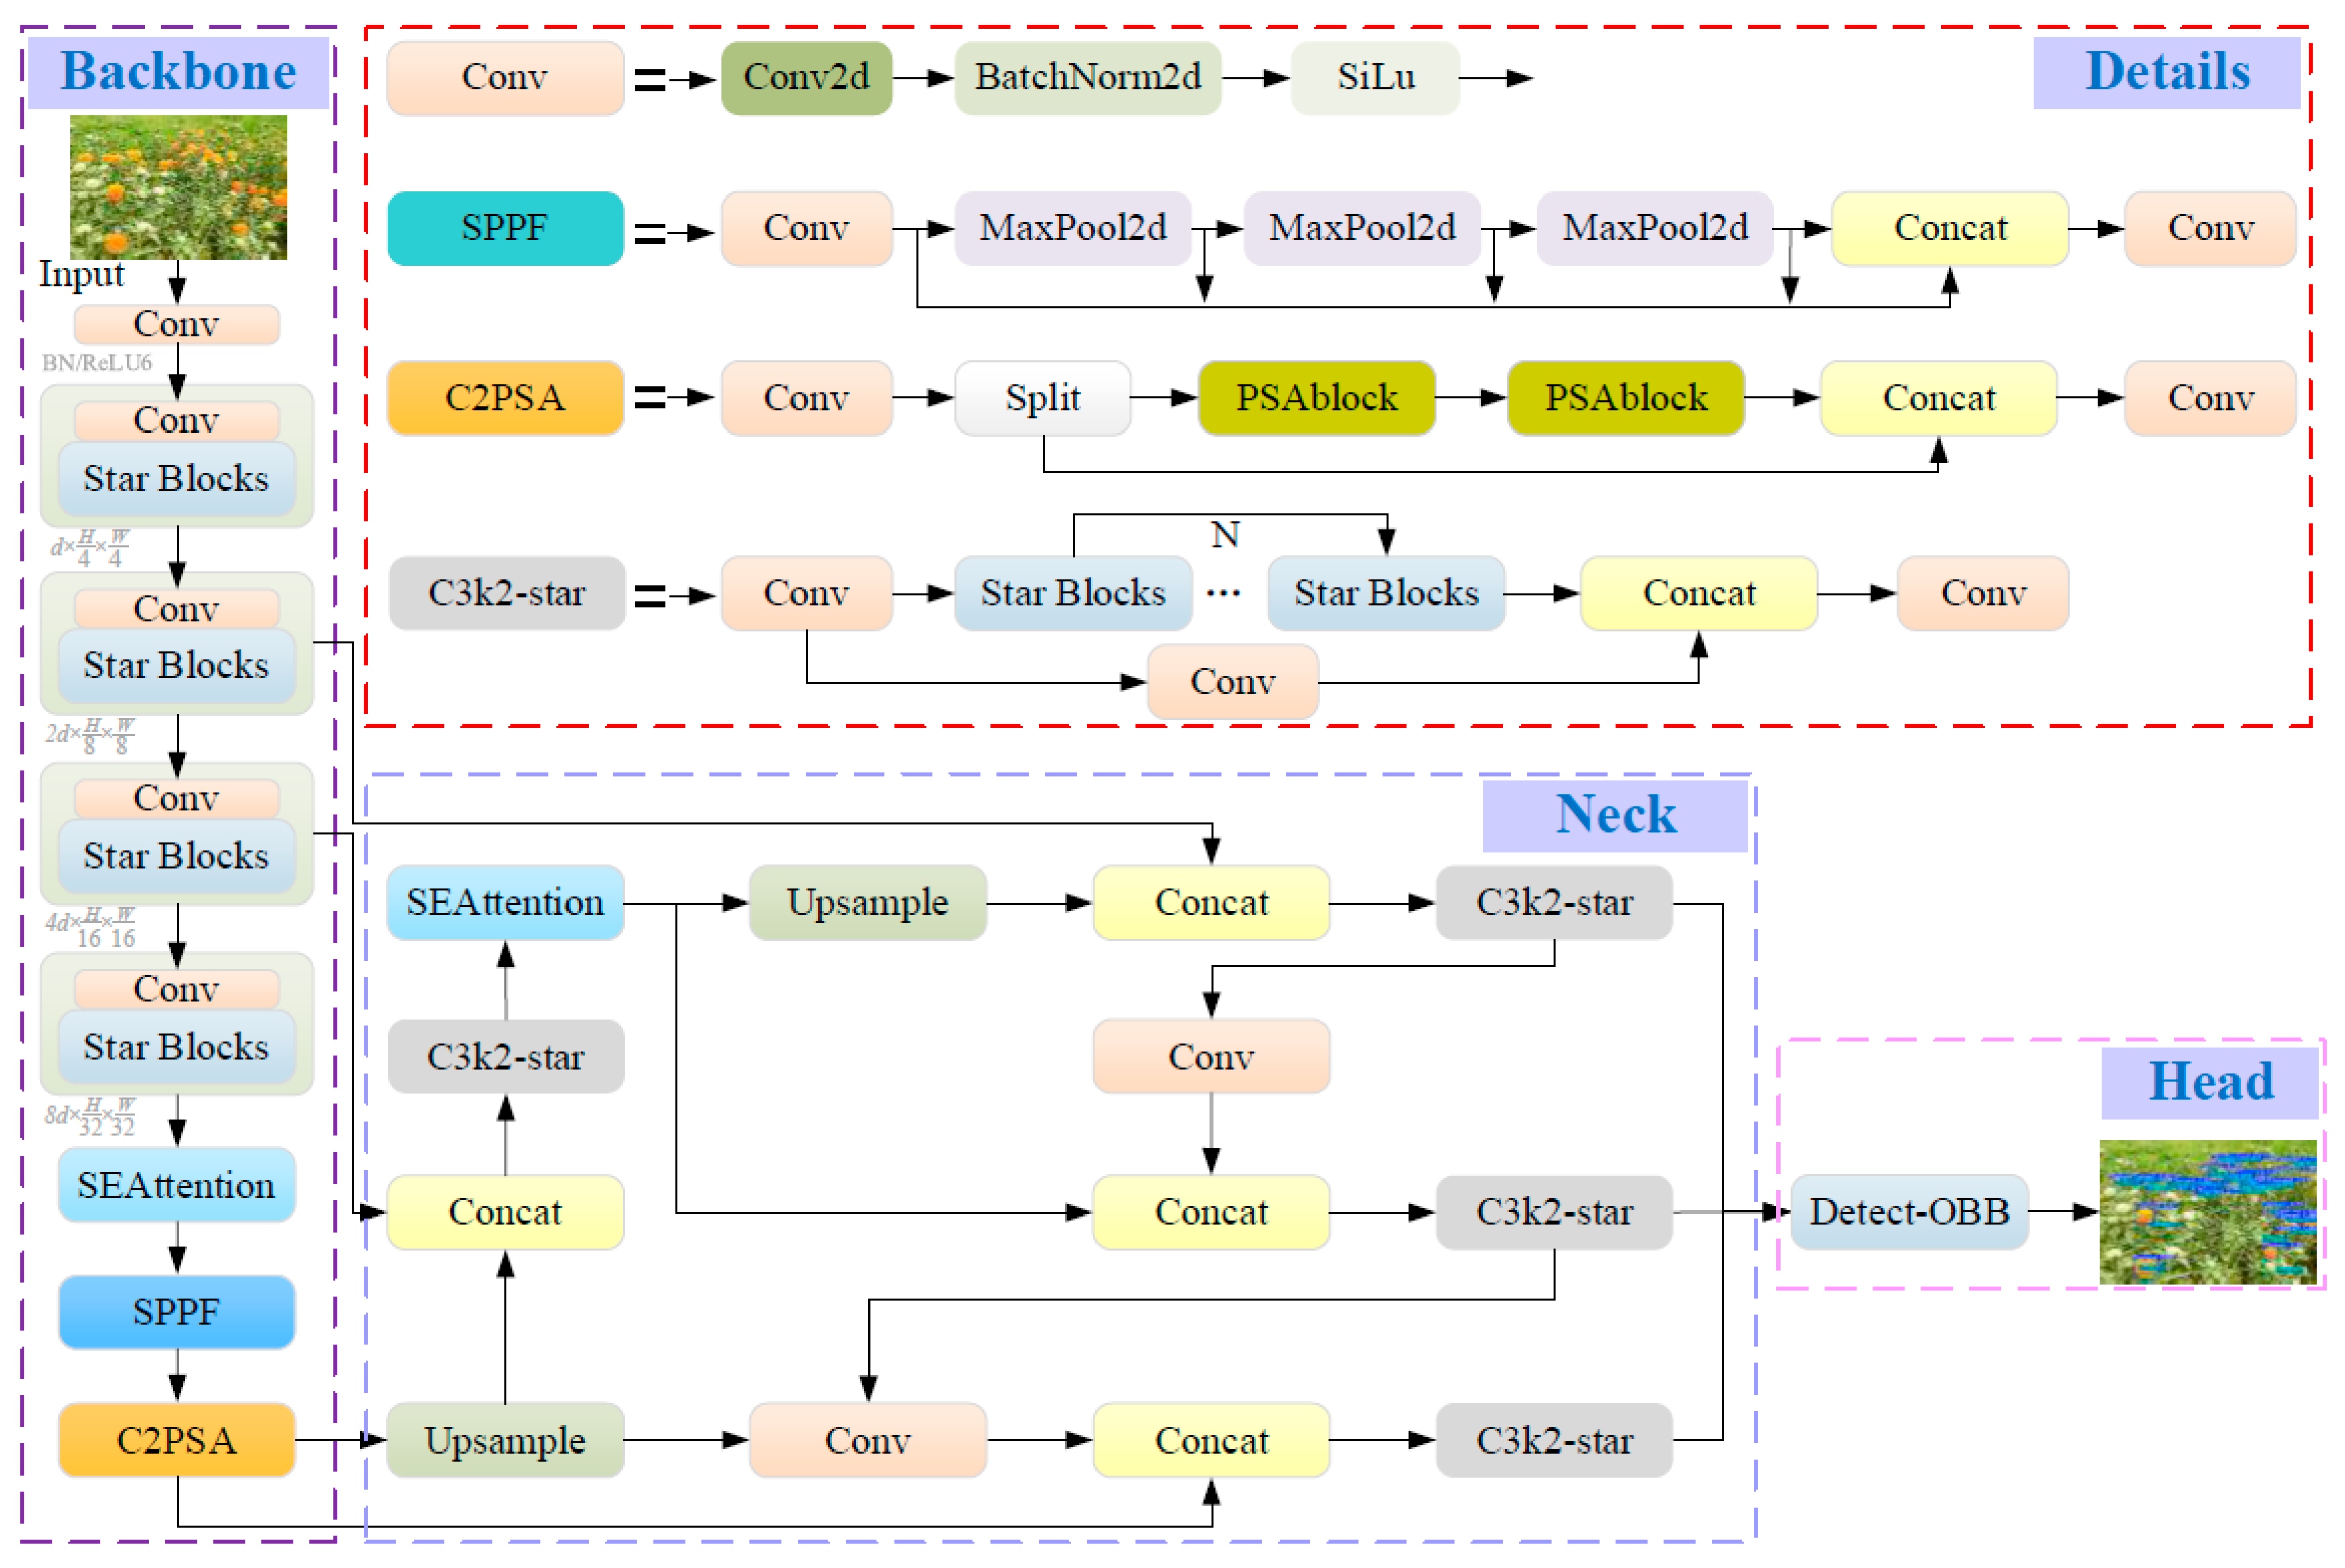
To address the dual challenges of insufficient detection accuracy for small safflower targets in unstructured farmland environments and the limited computational power of mobile devices, this study improved upon the YOLOv11n model proposed by Ultralytics and introduced a lightweight model named SSO-YOLO, suitable for detecting small safflower targets. Its overall architecture, as shown in Figure 3, consists of three core modules: Backbone, Neck, and Head.
Figure 3.
Architecture of the Lightweight Detection Network for Safflower.
The specific improvements are as follows: (1) Backbone: The lightweight StarNet was adopted as the primary feature extraction network. The SEAttention mechanism was embedded to suppress responses from channels associated with background interference and to enhance the feature weights of channels relevant to filaments and flower heads. (2) Neck: To improve inference speed on low-computational devices, the Star Blocks module was used to replace the original C3k2 bottleneck structure of the baseline model. Simultaneously, the SEAttention mechanism was introduced to enhance multi-scale feature fusion capability. (3) Head: The rotated detection network, Detect-OBB, was redesigned based on Shared Convolution and Group Normalization (GN). This redesign further improved the model’s detection efficiency while maintaining its ability to express multi-scale features.
2.3.1. StarNet Lightweight Feature Extraction Network
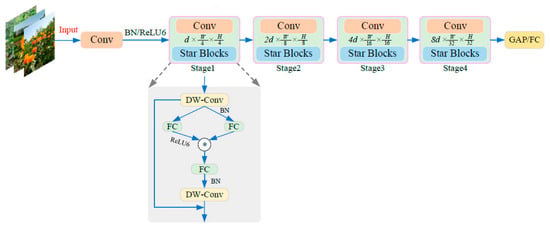
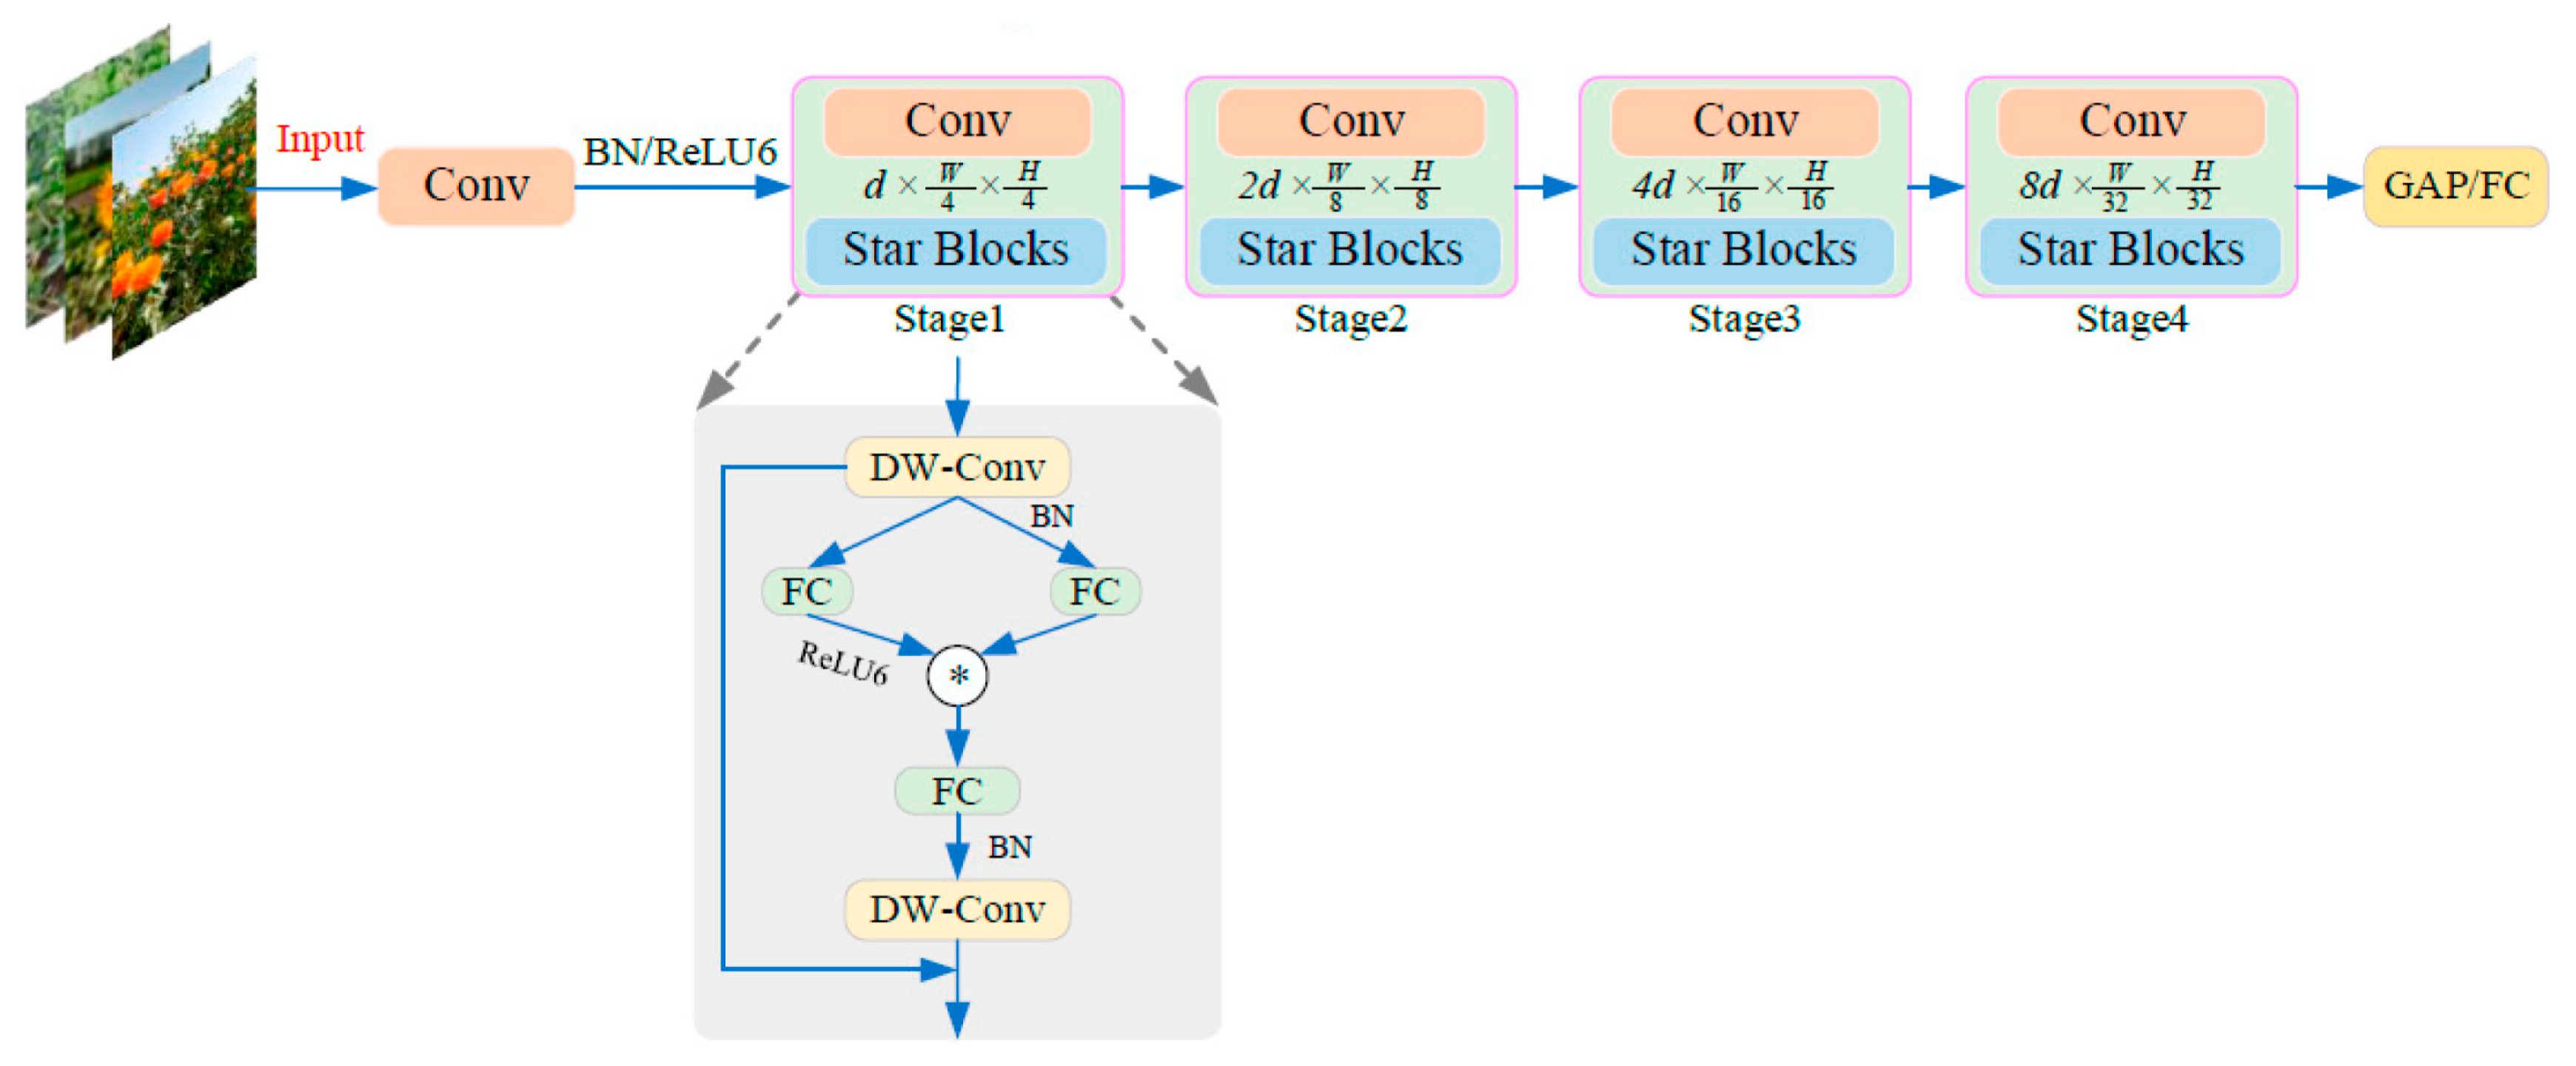
To enhance the real-time performance of the safflower detection model on low-computational field devices, this study employs the StarNet lightweight network to replace the backbone network of YOLOv11n for feature extraction. StarNet was jointly proposed by Northeastern University and Microsoft in 2024, and its performance surpasses mainstream lightweight networks such as GhostNet, FasterNet, and MobileNet in several benchmarks. This network possesses the ability to implicitly map low-dimensional features to a high-dimensional, non-linear space, thereby gaining the representational advantages of high-dimensional features while maintaining low-dimensional computational complexity. This makes it highly suitable for deployment requirements on mobile field platforms. The StarNet architecture, illustrated in Figure 4, adopts a four-stage hierarchical structure. Initial downsampling is performed via a convolutional layer, followed by feature extraction through multiple stages of Star Blocks, with the number of channels doubling at each stage. This design significantly enhances the network’s feature extraction capability while controlling computational complexity. Its core is the star operation, . The specific workflow is as follows: first, preliminary feature extraction is performed using depthwise convolution, followed by Batch Normalization (BatchNorm) to improve fusion efficiency. The feature map is then split into two branches: one branch is processed by the ReLU6 activation function, while the other remains linear and undergoes a dimension-increasing transformation. Subsequently, the two branch features are fused via the star operation. Finally, depthwise convolution is used again to further enhance local features and accomplish dimension reduction.
Figure 4.
StarNet Network Structure.
In the computation for a single neural network layer, defining for a single output channel and a single input element, where d is the input channel index, the star operation over multiple output channels and multiple feature elements involving , , are channel indices, represents the coefficient for each term, can be expressed as:
As shown in Formula (1), apart from the term, each term forms a nonlinear function with respect to x, corresponding to an independent implicit dimension. This indicates that the star operation, while maintaining d-dimensional explicit computation, implicitly achieves a high-dimensional feature mapping of approximately dimensions, significantly enhancing feature representation capability without introducing additional computational overhead.
Stacking this star operation across multiple layers of a neural network can further expand the implicit dimensions in an exponential manner. Assuming the output of the n-th layer is Ol, the output of the star operation can be expressed as:
As indicated by the expression above, after passing through n layers of the star operation, the dimensionality of the network’s implicit feature space can reach . Assuming an isotropic network with a width of 128 and 10 layers, its implicit feature dimensionality is approximately 901024, which numerically approximates an infinite-dimensional space. It can thus be understood that even stacking only a few layers allows the star operation to exponentially increase the implicit dimensionality of features. This endows the network with exceptionally strong representational capacity, making it particularly well-suited for the design of lightweight network architectures.
2.3.2. SEAttention Mechanism
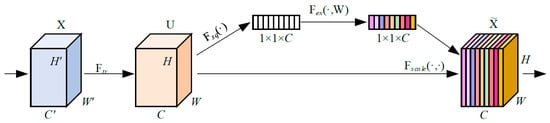
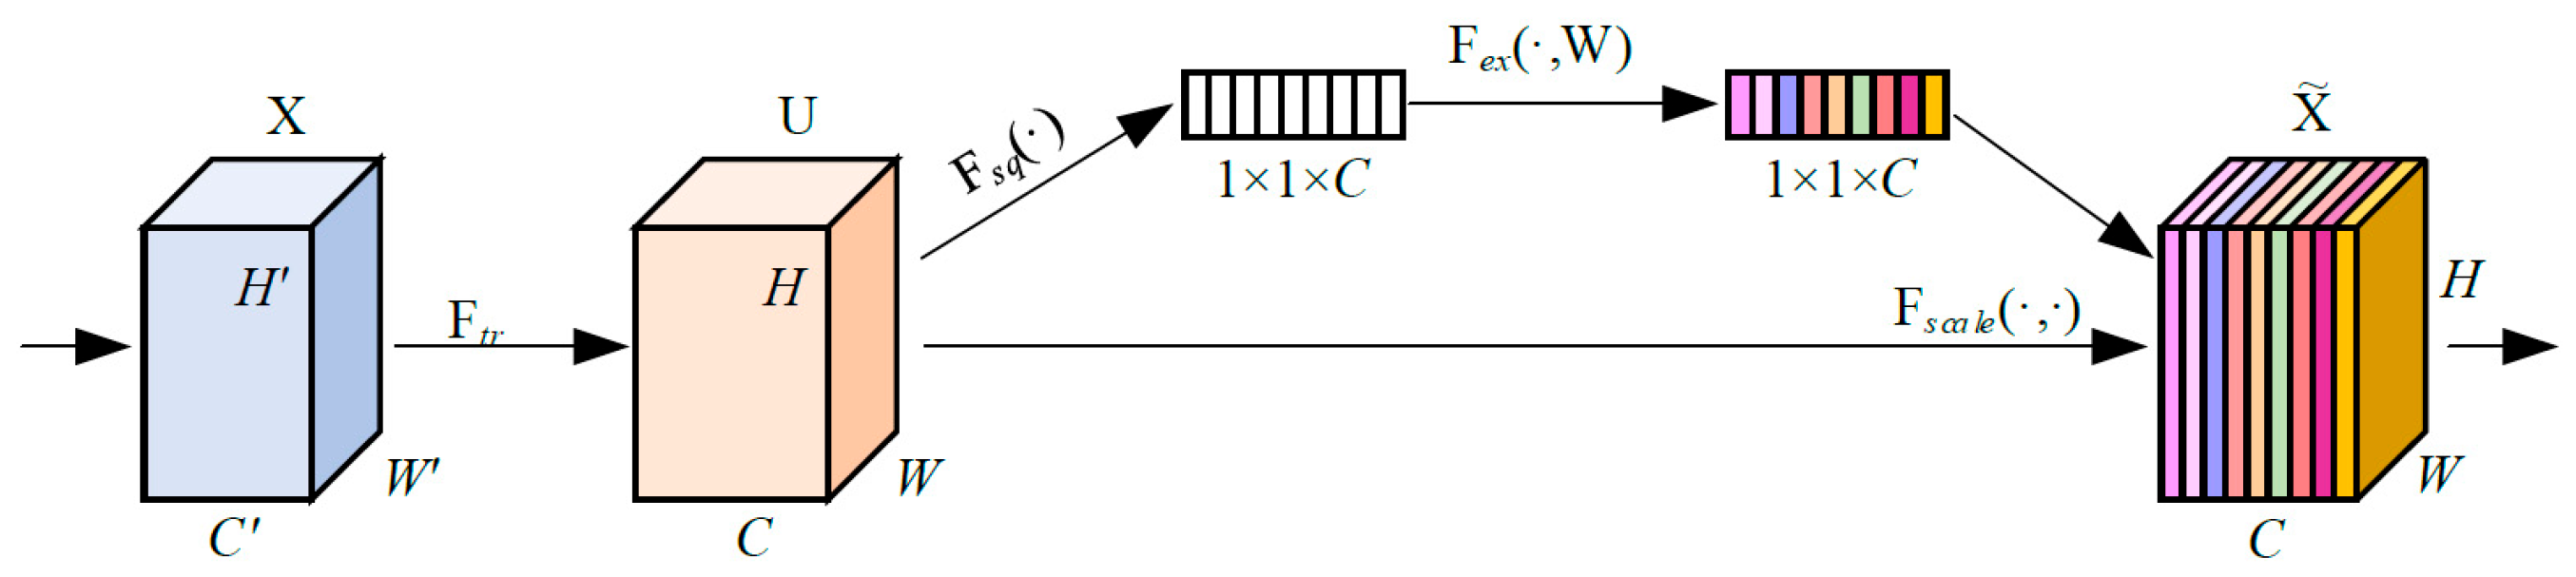
In unstructured field environments, target detection models are susceptible to interference from complex backgrounds. This often leads to insufficient feature extraction for small targets such as safflower filaments and flower heads, resulting in blurred edge localization. To enhance the model’s perception of these small targets and enable adaptive weight adjustment across feature channels, this study introduces the lightweight channel attention module, Squeeze-and-Excitation (SE). This module is embedded into the deeper layers of the backbone network and the feature fusion stage of the neck, respectively. Through its squeeze–excitation–recalibration mechanism, the SE module dynamically recalibrates the feature responses of individual channels. It suppresses redundant background information while amplifying key features related to filaments and flower heads. This process enhances the model’s representational capacity and localization accuracy in complex field environments. The specific structure is illustrated in Figure 5.
Figure 5.
Structure of the SEAttention Mechanism.
As can be seen from the structural diagram in Figure 5, the SE module first processes the input feature map X through a convolution operation to obtain the output feature map U. Subsequently, it performs a squeeze operation, Fsq(·), which utilizes global average pooling to compress the feature map into a one-dimensional feature vector Zc of dimensions 1 × 1 × C. This vector aggregates the feature response information of the corresponding channel across the entire spatial domain. Its mathematical expression is given by (6):
In the formula, Uc represents the feature of the c-th channel in the feature map, and Zc is the global statistical descriptor for that channel. For the complex safflower detection scenario, this operation effectively captures the distribution characteristics of safflower filaments across the global spatial context. It helps prevent the loss of feature information caused by the small target size or partial occlusion, ensuring the model perceives the global distinctions between filaments, flower heads, and the background.
Following the aforementioned squeeze operation, the excitation operation Fex is applied. This primarily involves transforming the compressed statistical vector Zc using two fully connected layers and a nonlinear activation function. This process achieves the adaptive allocation of channel-wise weights, enabling the model to autonomously learn to assign higher weights to the feature channels most relevant to safflower filaments. Its mathematical expression is given by (7):
In the formula, z is the compressed real number, represents the Sigmoid activation function, denotes the ReLU activation function, and W1 and W2 are the weight matrices for dimensionality reduction and dimensionality increase of the two fully connected layers, respectively.
Finally, the recalibration operation (Fscale) is performed, which fuses the weight vector S with the original feature map U. This achieves adaptive enhancement and suppression of feature channels, resulting in the recalibrated feature map. This effectively improves the distinction between filaments/flower heads and the background in complex field environments, providing more discriminative feature input for subsequent target detection tasks. Its mathematical expression is shown in (8):
In the proposed SSO-YOLO model, the SE modules are embedded into both the backbone and the neck networks. This configuration enables channel weight calibration early in the feature extraction stage, reinforcing the low-level spectral and textural features of small safflower targets and preventing their submersion due to small size. Simultaneously, within the neck network, the modules facilitate the fusion of high- and low-dimensional features, optimizing the integration of boundary-specific and global features of safflower. This embedding approach preserves the core advantages of the SE module-lightweight design and adaptability-while being fully aligned with the feature extraction and fusion logic required for detecting small safflower targets in complex environments, thereby further enhancing detection accuracy.
2.3.3. Detect-OBB Lightweight Oriented Detection Head
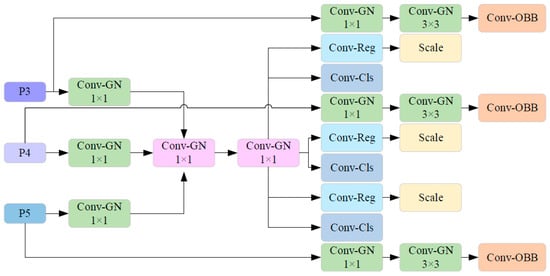
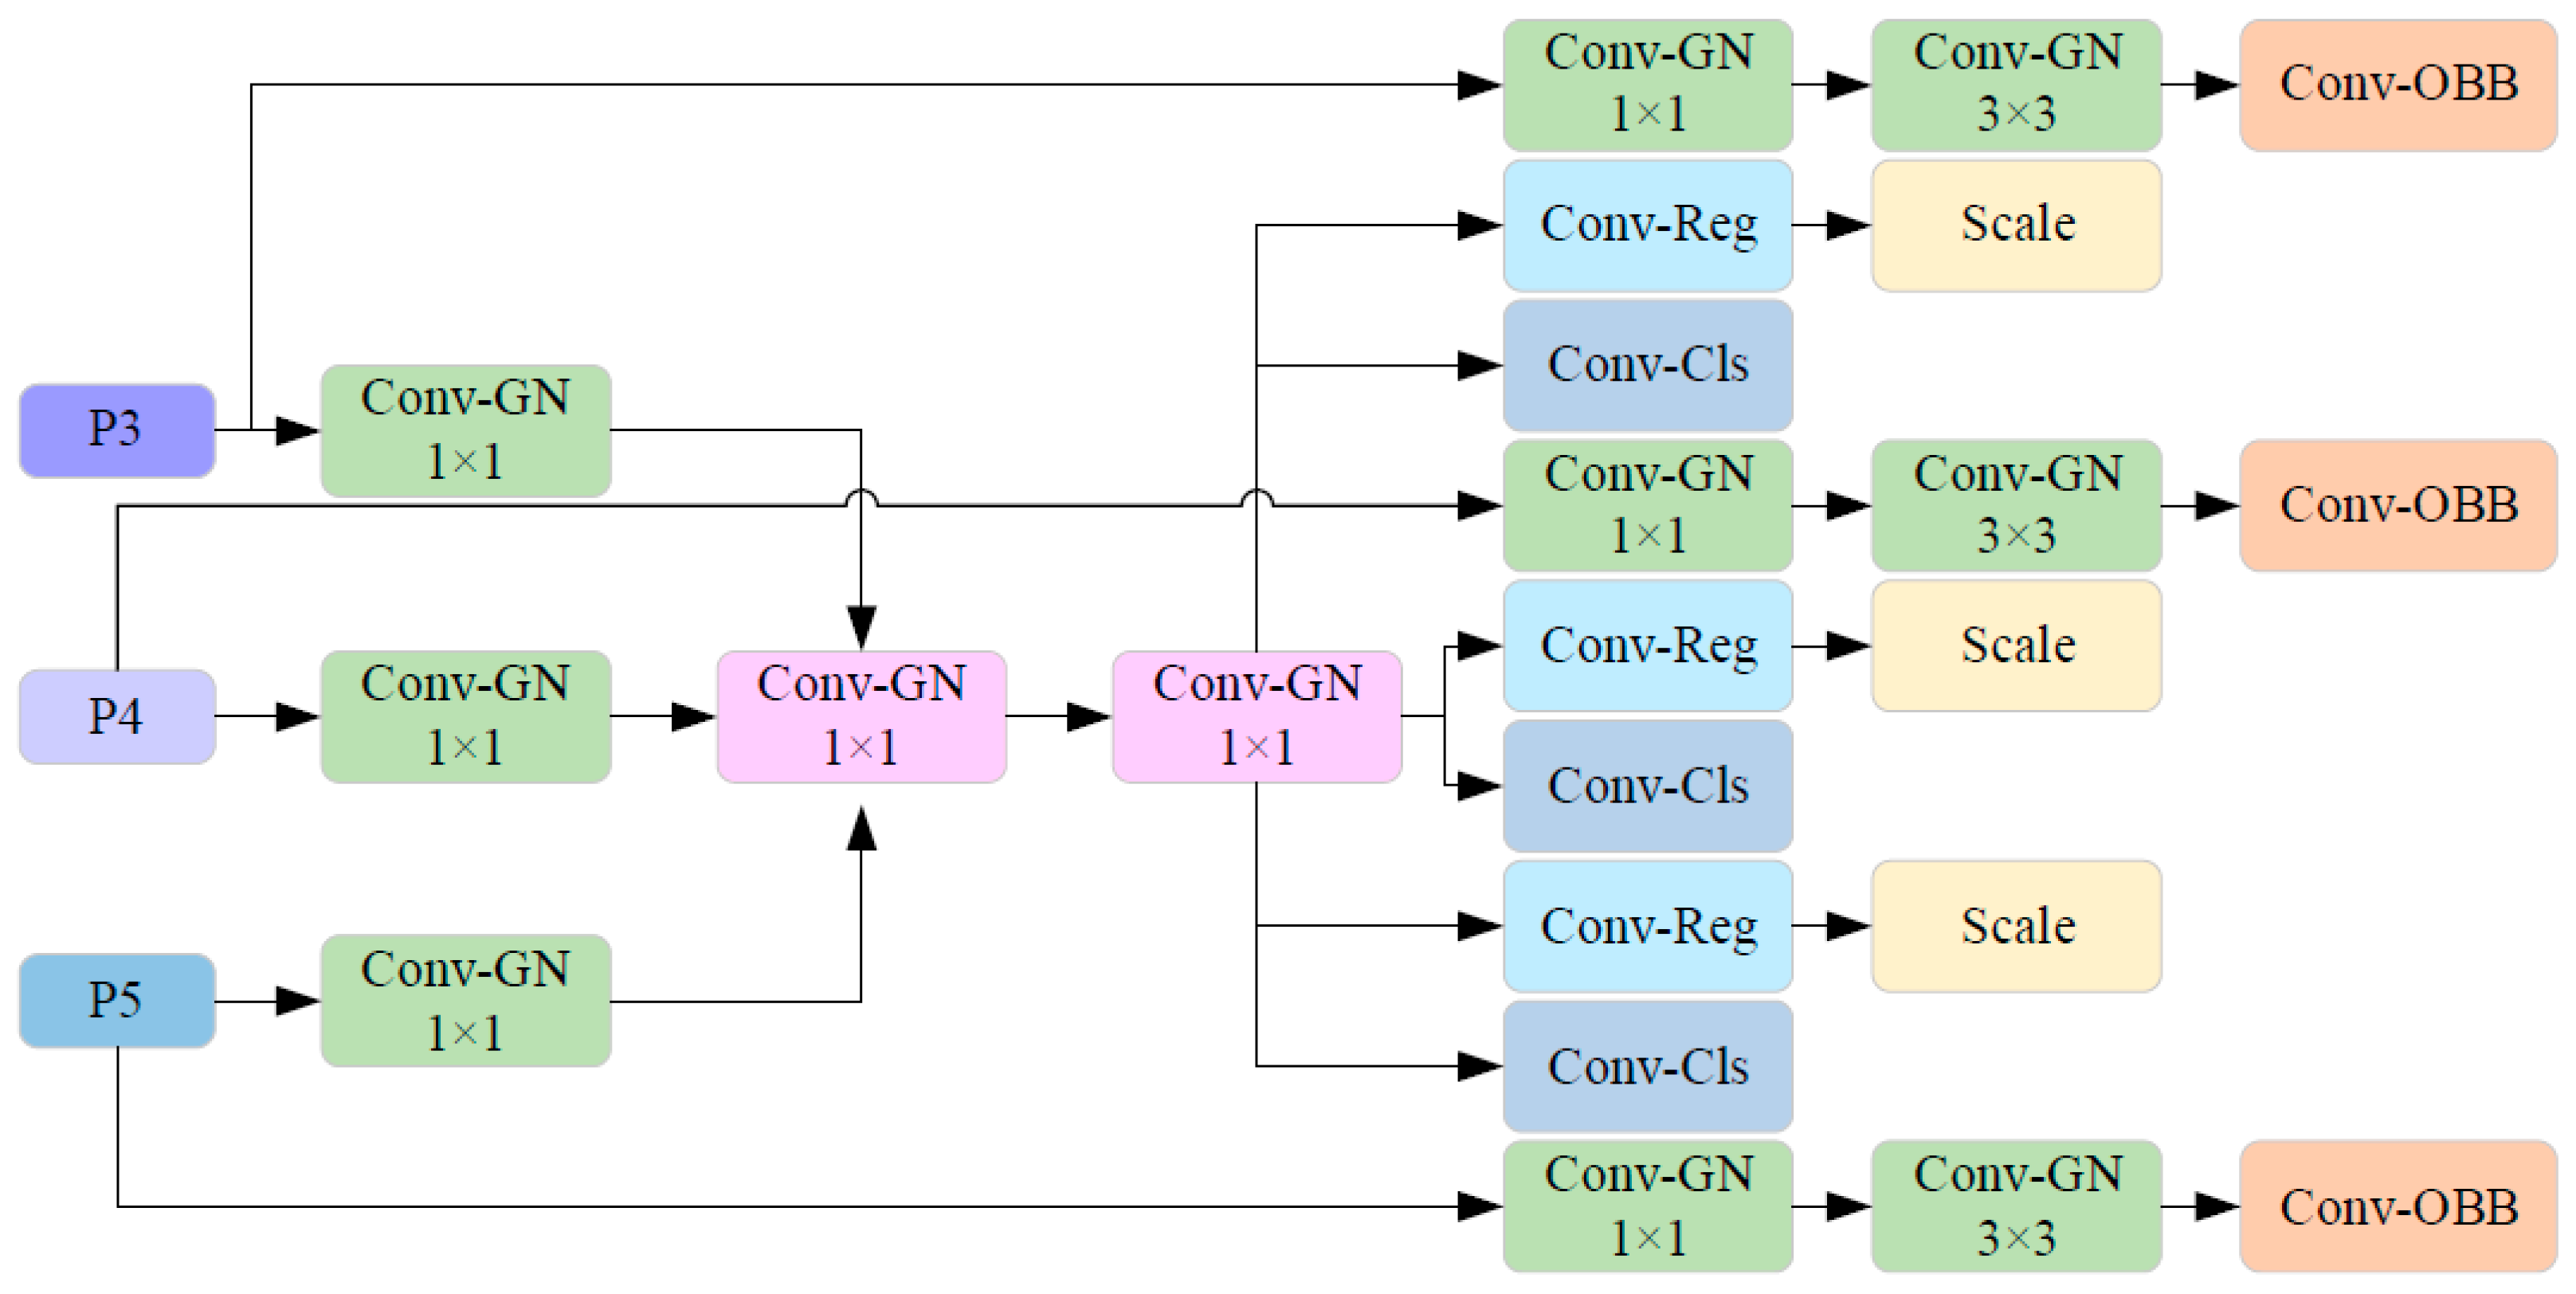
In unstructured field planting environments, safflower filaments exhibit diverse growth postures, posing significant challenges for real-time detection by harvesting robot perception systems and precise localization for end-effectors. To address this, this study designed a lightweight oriented detection head (Detect-OBB) based on shared convolution and Group Normalization (GN). It also incorporates a rotation angle parameter to more accurately localize the growth posture of safflower filaments. Its structure is illustrated in Figure 6.
Figure 6.
Structure of the Detect-OBB Head.
As shown in Figure 6, the Detect-OBB head receives three multi-scale feature maps (P3–P5) from the Feature Pyramid Network (FPN). Each feature map is first passed through a 1 × 1 convolutional layer for channel dimension transformation and fusion, followed by Group Normalization (GN) to stabilize the feature distribution and accelerate convergence. This design avoids the dependency on batch statistics during inference inherent to traditional Batch Normalization (BN). The transformation relationships are as shown in Equations (9) and (10):
In the equations, represents the input feature map at each scale; W and b denote the weight and bias corresponding to the current convolution kernel, respectively; is a learnable scaling parameter; is the mean of the G-th group; is the variance of the G-th group; is a constant; and is a learnable shift parameter.
Subsequently, the normalized feature proceeds to the core shared convolution module. This module consists of two consecutive 3 × 3 convolutional layers, with the convolutional weights being shared across all scales and all spatial positions. This weight-sharing strategy is key to reducing computational load and memory footprint. Each convolutional stage is followed by GN and the SiLU activation function. The calculation formulas are shown in (11) and (12):
In the equations, and represent the shared weights of the first and second 3 × 3 convolutional layers, respectively. This approach reduces redundancy in model parameters while simultaneously enhancing the correlation between features across different layers and scales. Consequently, it enables the entire network to significantly increase speed while maintaining high detection accuracy.
2.4. Adaptive Localization Model for Picking Points of Safflower Filaments
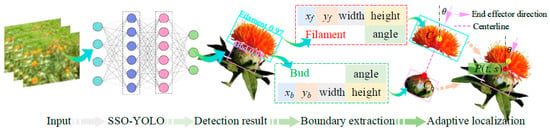
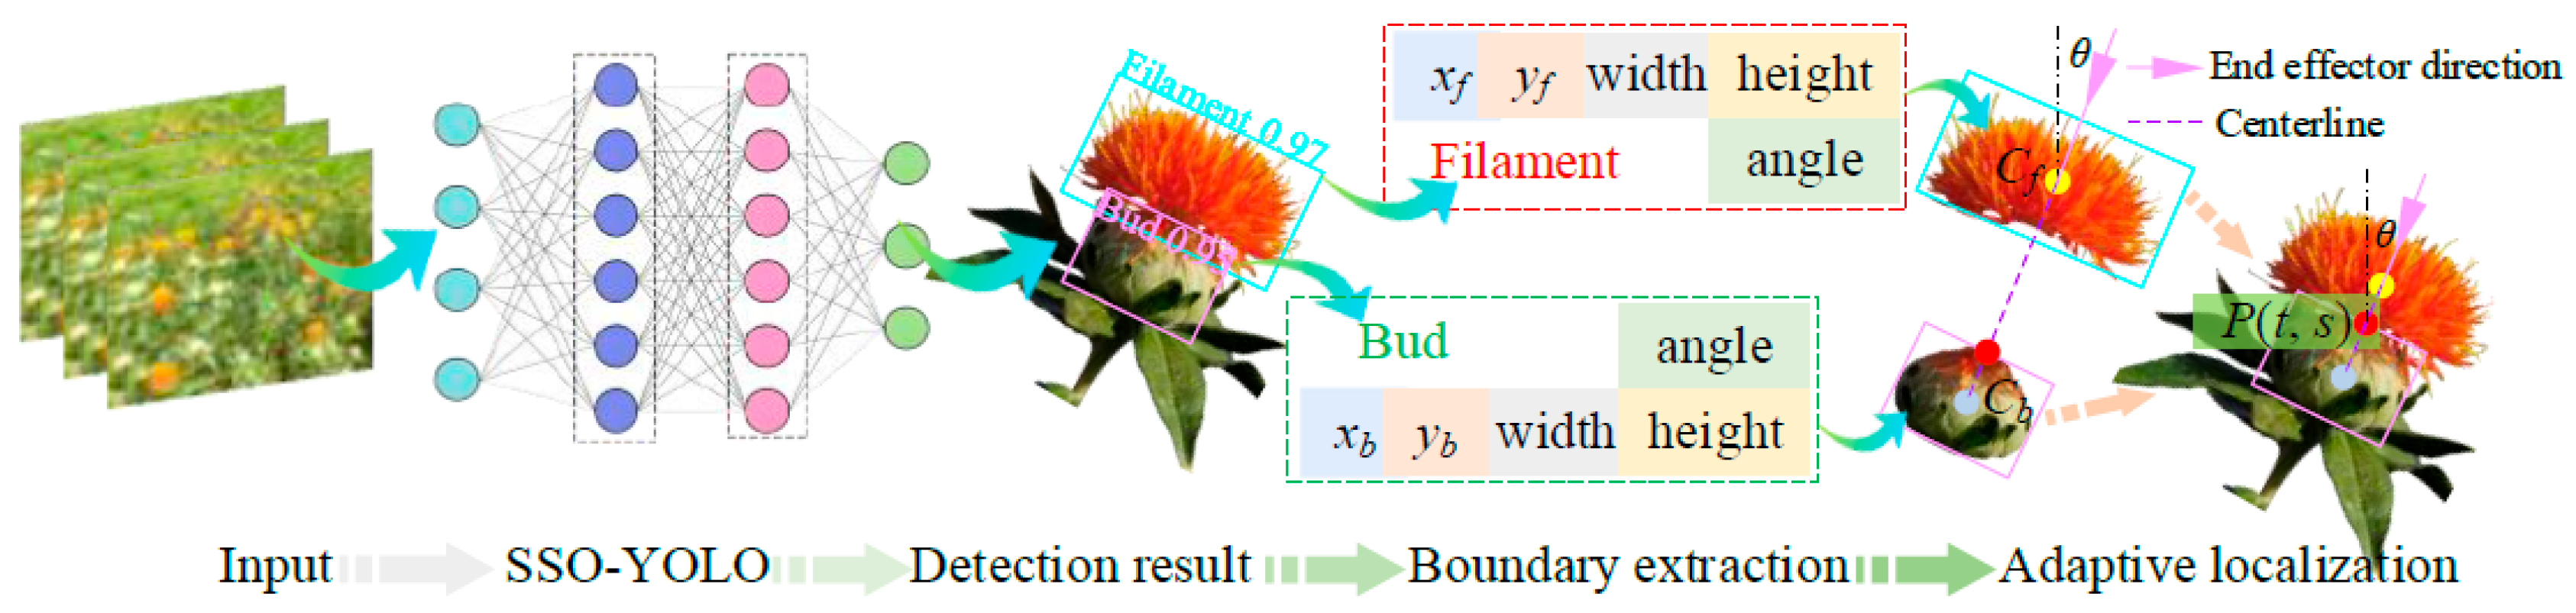
In unstructured field environments, the diverse growth postures of safflower plants and the dynamic morphological changes in their filaments often lead to deviations or failures in the 3D localization of picking points by harvesting robot vision systems. To improve the accuracy and robustness of picking point localization based on RGB-D cameras, this study, building upon previous research findings and considering the dynamic characteristics of safflower growth, proposes an adaptive localization method based on 2D image analysis. The overall workflow and principle of the method are illustrated in Figure 7.
Figure 7.
Adaptive Localization Workflow for Safflower Filament Picking Points.
The method first utilizes the improved SSO-YOLO model proposed in Section 2.3 of this paper to detect filament and flower head targets in the image, obtaining their rotated bounding boxes to characterize the targets’ growth orientation and spatial distribution. Subsequently, based on the detection results, the OpenCV library is employed to extract the minimum enclosing contours of the filaments and flower heads, calculate their centroid positions, and further fit the principal axis direction of the filaments (the optimal movement direction for the end-effector during picking). By analyzing the angle between the filament’s principal axis and the vertical direction (or the reference direction of the flower head’s main stem), the natural growth posture of the filament can be dynamically inferred. Finally, by integrating information such as the geometric centroid of the filament contour, the principal axis orientation, and the relative position of the flower head, the optimal picking point coordinates are adaptively calculated within the 2D image plane. This provides stable and accurate input for subsequent 3D coordinate mapping and the control of the robotic arm’s end-effector.
Based on the localization workflow shown in Figure 7, the 2D localization of safflower filament picking points primarily relies on the detection results from the SSO-YOLO model and further involves adaptive calculation combined with the dynamic growth geometry of safflower. This localization process mainly comprises three core modules: the Connection Condition Judgment Module, the Intersection Point Calculation Module, and the Adaptive Angle Calculation Module. Their specific functions and implementation logic are detailed below.
2.4.1. Connection Condition Judgment Module
For the two rotated bounding boxes detected by SSO-YOLO, Bf (filament) and Bb (flower head), the connection condition judgment comprises spatial intersection verification and vertical alignment assessment. The spatial intersection verification is based on the principle of polygon overlap detection. The vertex set of a rotated bounding box Bi is defined as:
The intersection condition is then judged as:
In the equations, pi represents the polygonal region formed by the vertex set Vi, and Mi(x, y) is the mask function of the two polygons.
For the vertical alignment assessment, defining the filament center as and the flower head center as , the vertical alignment condition is:
Based on the above analysis, the final connection condition judgment is determined as shown in Formula (17):
2.4.2. Intersection Point Calculation Module
According to the agronomic requirements for manual harvesting of safflower, the picking point should be located at the junction where the filament connects to the flower head. Therefore, the intersection point calculation module in this study, based on satisfying the vertical alignment condition described in Section 2.4.1, constructs a straight line by connecting the centroids of the two rotated bounding boxes. It then calculates the intersection point of this line with the flower head’s bounding box to determine the 2D coordinates of the picking point. The specific geometric calculation process is as follows: Define the endpoints of the center line (L) as and . Let the width, height, and rotation angle of the flower head’s rotated bounding box be denoted as w, h, and , respectively. Based on the geometric relationship between the center line L and the rotated bounding box, the calculation formulas for the intersection point coordinates (t, s) can be derived as shown in Equations (18)–(20).
In the equations, vk represents the vertex coordinates of the bounding box, is the rotation matrix, and A is an invertible matrix.
2.4.3. Adaptive Angle Calculation Module
Traditional detection methods based on horizontal bounding boxes struggle to adapt to the diverse growth postures of filaments, often leading to deviations in picking point localization. To address this issue, this study designed an adaptive angle calculation module. This module dynamically computes the principal axis direction angle of the filament based on its actual growth trend, thereby effectively overcoming localization failures caused by morphological variations. This angle information is not only used to correct the two-dimensional picking point coordinates but also provides adaptive posture control parameters for the robotic arm’s end-effector, ensuring frontal approach and precise harvesting. The core formulas for adaptive angle calculation are shown in Equations (21)–(24).
In the above equations, represents the angle between the safflower filament’s growth direction and the vertical direction (which indicates the frontal harvesting direction for the end-effector). denotes the vector from the flower head center to the filament center, and represents the unit vector in the vertical direction.
2.5. Performance Evaluation Metrics for Detection Models
To comprehensively and quantitatively evaluate model performance, this study selects five key metrics from two dimensions: detection accuracy and computational efficiency. These are Precision (P), Recall (R), mean Average Precision (mAP@0.5), Model Size, and inference speed (Frames Per Second, FPS). Precision measures the proportion of true positive samples among those predicted as positive, reflecting the reliability of the model. Recall measures the proportion of true positives that are successfully detected, indicating the completeness of model coverage. The mAP@0.5 metric provides a comprehensive evaluation of the model’s discriminative ability in complex backgrounds by balancing precision and recall. Model Size directly impacts the feasibility of deployment on embedded devices, while inference speed determines the real-time capability of the vision system. Together, these two factors ensure the lightweight design and efficient operation of the harvesting robot.
3. Results and Discussion
To validate the effectiveness of the improved model and picking point localization method proposed in this study, all experiments were conducted on the following computational platform. The hardware environment consisted of a Windows 11 operating system, an AMD Ryzen Threadripper PRO 3975WX 32-core processor (Advanced Micro Devices, Santa Clara, CA, USA), an NVIDIA RTX A5000 GPU, and 384 GB RAM (frequency 3.50 GHz). The software environment included Python 3.8.18, PyTorch 1.13.1, and CUDA 11.6. Key hyperparameters for model training were set as follows: number of training epochs = 300, input image size (imgsz) = 640, batch size = 32. The SGD optimizer was selected with an initial learning rate (lr0) = 0.01, momentum = 0.937, and weight decay = 0.0005.
3.1. Comparative Analysis of Baseline Model Detection Performance
To select a suitable baseline model for safflower detection in unstructured field environments, this study systematically compared current mainstream object detection models. Evaluation metrics including Precision (P), Recall (R), mean Average Precision (mAP@0.5), and Model size were used to comprehensively assess the robustness and generalization performance of each model. Detailed experimental results are presented in Table 1.
Table 1.
Detection Results of Different Baseline Models.
Based on the comparative experimental results of different baseline models shown in Table 1, this study ultimately selected YOLOv11n as the baseline model for safflower detection. This decision was primarily based on its balanced performance across three key aspects: overall detection capability, class-specific discriminative ability, and model size.
First, regarding overall detection performance, YOLOv11n achieved the highest mean Average Precision (mAP@0.5) among all compared models at 97.3%. Its Recall (R) of 91.4% also ranked first, indicating that this model possesses the strongest capability for detecting safflower targets in complex field environments with a relatively low miss rate. Although its Precision (P) of 95.0% is slightly lower than that of YOLOv8n (95.5%), it remains at an excellent level. This demonstrates that YOLOv11n maintains good target discrimination accuracy while ensuring a high detection rate.
Second, examining the detection results for the two specific classes, Filament and Bud, YOLOv11n demonstrated robust performance for both. For filaments, its mAP@0.5 was 97.4%, the highest among all models. For buds, its mAP@0.5 was 97.2%, also among the top performers. This indicates that the model possesses consistent recognition capability across different classes, making it suitable for harvesting scenarios requiring simultaneous detection of both filaments and flower heads.
Furthermore, in terms of model size, YOLOv11n has a size of 5.58 MB, which is significantly smaller than YOLOv8n (6.31 MB) and comparable to YOLOv10n. While slightly larger than YOLOv12n (5.54 MB) and YOLOv13n (5.5 MB), its substantial advantages in key detection metrics allow it to maintain an excellent performance–size balance even under limited computational resources. This makes it more suitable for deployment on mobile field harvesting equipment.
In summary, YOLOv11n was selected as the baseline model for subsequent improvements in this study because it maintains high detection precision and recall while featuring a relatively compact model size. It thus offers a balanced combination of robustness, generalizability, and practical deployment feasibility.
3.2. Comparative Analysis of Improved Model Detection Performance
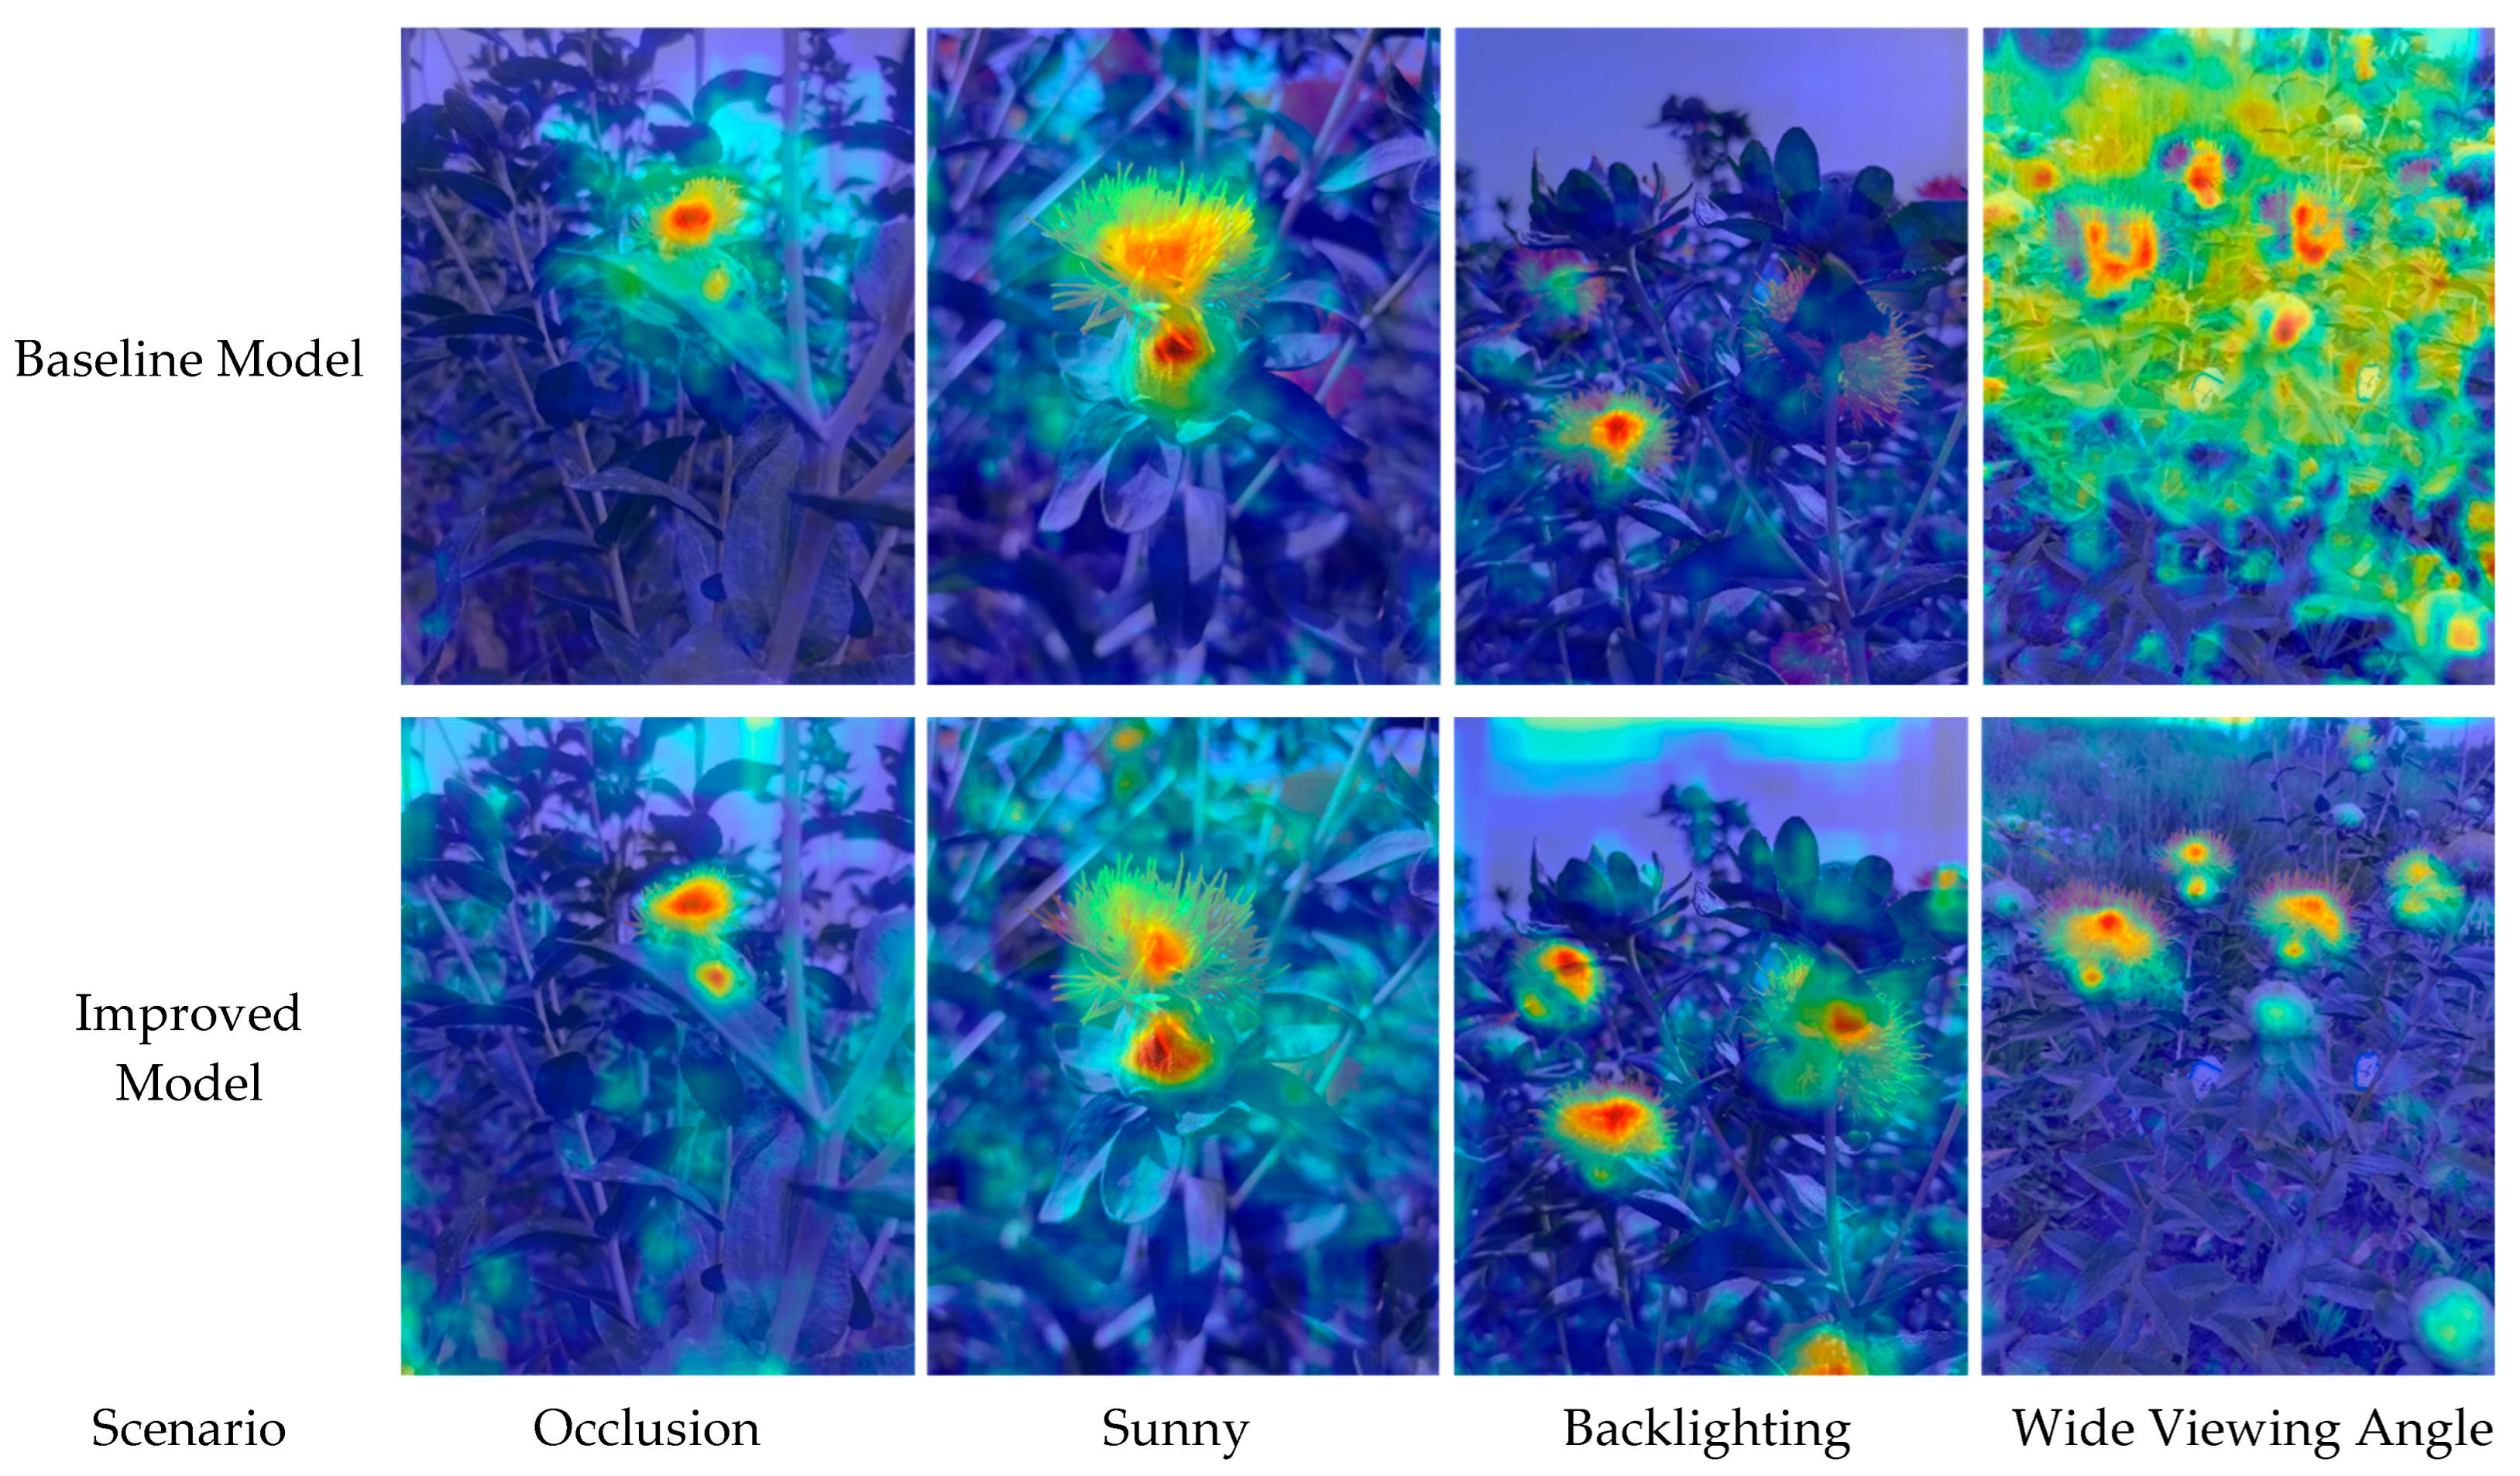
Building upon the selected YOLOv11n baseline model, we conducted a comparative experimental analysis to systematically evaluate the improvement effects of the proposed SSO-YOLO model in terms of lightweight design and generalization performance. The relevant experimental data are presented in Table 2, and a visual comparison of model features is shown in Figure 8.
Table 2.
Detection Results of YOLOv11 and SSO-YOLO Models.
Figure 8.
Comparative Results of Model Feature Visualization via Heatmaps.
Based on the comparative experimental results shown in Table 2, the proposed SSO-YOLO model significantly reduces model complexity and storage requirements while maintaining high detection performance, demonstrating good lightweight characteristics and deployment adaptability. The detailed analysis is as follows:
- (1)
- The overall mean Average Precision (mAP@0.5) of SSO-YOLO reaches 97.4%, which is essentially equivalent to that of the baseline model YOLOv11n (97.3%). This indicates that the model improvements did not compromise overall detection accuracy. Specifically, the mAP@0.5 for the Filament class is 97.5%, slightly higher than the baseline (97.4%), suggesting the effectiveness of structural optimizations for small targets. The mAP@0.5 for the Bud class is 97.3%, also comparable to the baseline (97.2%). Furthermore, the overall Recall (R) of SSO-YOLO is 91.9%, representing an increase of 0.5 percentage points compared to the baseline (91.4%). This reflects an enhanced capability of the model to detect targets in complex field environments, with an improvement in reducing missed detections.
- (2)
- The overall Precision (P) of SSO-YOLO is 93.4%, which is 1.6 percentage points lower than the baseline (95.0%). This decrease is typically associated with the structural simplifications inherent in the model lightweighting process. However, precision remains at a relatively high level. Furthermore, when considered alongside the improved recall rate, the model achieves a balance between “recall” and “precision” that is more suitable for practical harvesting scenarios. That is, it prioritizes ensuring targets are not missed, relying on subsequent localization modules for precise picking point calculation.
- (3)
- The model size of SSO-YOLO is only 3.94 MB, representing a reduction of approximately 29.4% compared to YOLOv11n (5.58 MB). This significant compression results from lightweight design choices such as backbone network replacement, the introduction of attention mechanisms, and convolutional structure optimization. These changes make the model more suitable for deployment on computational resource-constrained mobile field devices, facilitating real-time detection and low-power operation. Furthermore, in terms of computational efficiency, the SSO-YOLO model achieves an inference speed of 121.1 FPS on the same test platform (NVIDIA RTX A5000), representing a 12.4% improvement over YOLOv11n (108.7 FPS). This enhancement, combined with the aforementioned reduction in model size, collectively demonstrates that SSO-YOLO achieves an excellent balance between accuracy and efficiency, laying a solid foundation for its deployment on resource-constrained mobile field robot platforms.
In summary, SSO-YOLO achieves significant model compression at a minor performance cost, demonstrating advantages in terms of being lightweight, possessing generalization capability, and offering practical deployment utility. This aligns well with the practical requirements for detection models in field-based intelligent harvesting systems.
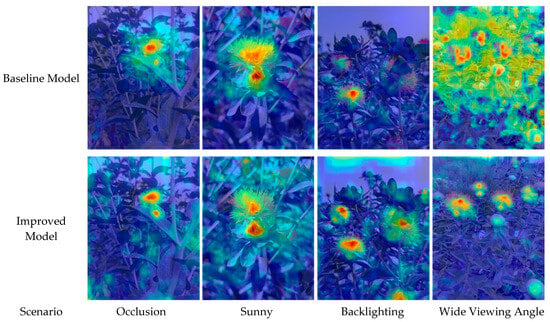
Figure 8 presents a comparative visualization of model feature heatmaps generated using the GradCAM++ method [23,24]. By comparing the attention distributions of the baseline model YOLOv11n and the proposed SSO-YOLO model across different field scenarios, the improvements in feature extraction capability, interference resistance, and environmental adaptability achieved by SSO-YOLO can be intuitively revealed. A detailed analysis is as follows:
- (1)
- In scenarios with mutual occlusion by branches, leaves, or other flower heads, the heat response areas of YOLOv11n are relatively dispersed, with some responses spreading to the background or adjacent non-target regions. In contrast, the heat distribution of SSO-YOLO is more concentrated on the actual main body parts of the filaments and flower heads. This indicates that the introduced SEAttention mechanism effectively suppresses background interference and enhances the model’s ability to focus channel weights on key regions.
- (2)
- Under sunny and backlighting conditions, the feature response of YOLOv11n to filament edges and textural details weakens, and the heat areas exhibit a degree of generalization and blurring. SSO-YOLO, however, maintains a higher and more concentrated response intensity under varying lighting conditions. It shows more pronounced heat activation particularly at the junction between filaments and the flower head, suggesting that its structural improvements help enhance the model’s robustness in preserving features under changing illumination.
- (3)
- In images captured from a distance or at wide viewing angles, filament targets occupy a significantly smaller pixel proportion. YOLOv11n shows a weaker response to such small targets under these conditions, with sparse and discontinuous heat distribution. SSO-YOLO, through the multi-level feature extraction of StarNet, maintains a stronger response to local details of filaments even under low-resolution perception. The heatmaps show that it can more completely cover small target regions, verifying its structural advantage in long-distance, small-target detection.
In summary, the feature visualization results demonstrate that SSO-YOLO, through the integration of a lightweight backbone network and attention mechanisms, exhibits superior feature-focusing capability and structural perception characteristics across various complex field environments. Consequently, while maintaining low model complexity, it enhances the recognition robustness and environmental adaptability of the model for small safflower filament targets.
3.3. Evaluation Experiment for Adaptive Picking Point Localization
Building upon the accurate detection of safflower achieved by the aforementioned SSO-YOLO model, a specialized performance validation experiment was further designed to systematically evaluate the effectiveness and localization accuracy of the proposed adaptive picking point localization algorithm across the full growth cycle of safflower.
3.3.1. Experimental Method and Evaluation Criteria
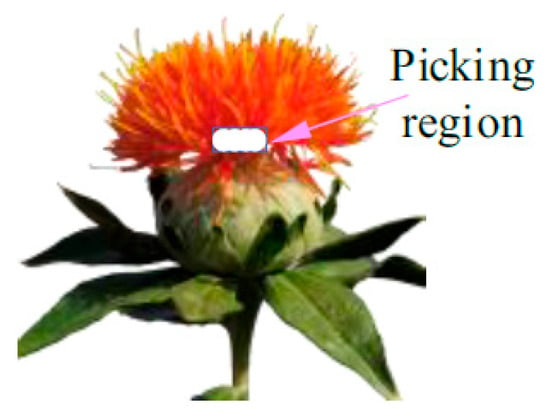
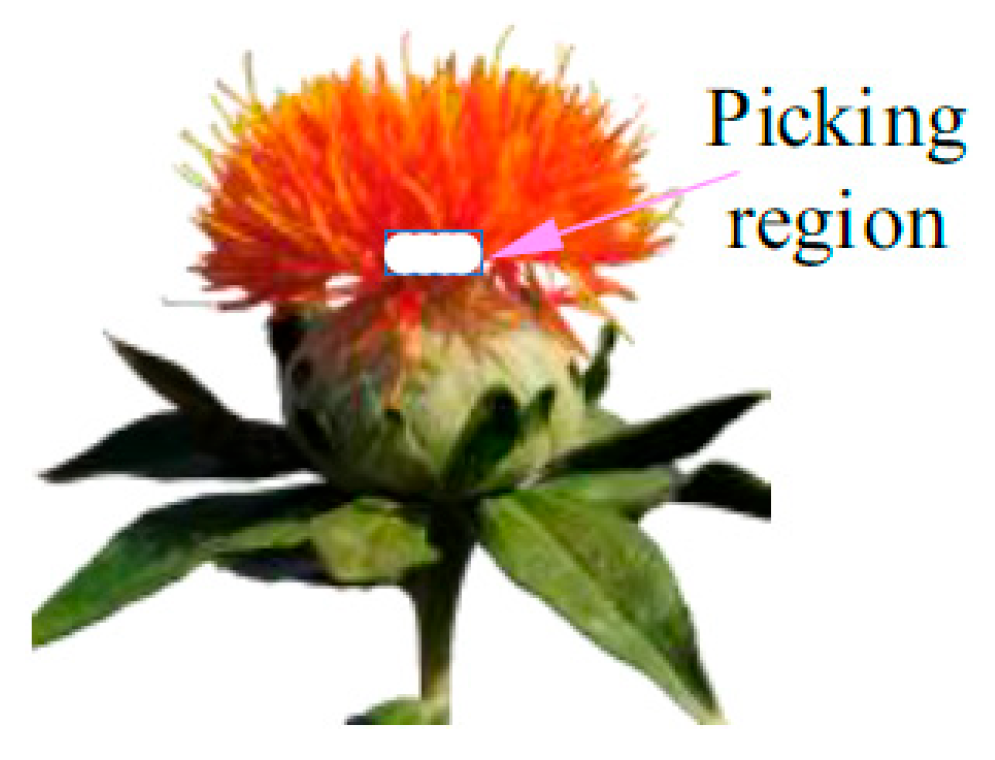
In accordance with the requirements of the Xinjiang Safflower Cultivation and Harvesting Technical Specifications and incorporating manual harvesting experience, this experiment defines the junction between the filament and the flower head as a standard picking area-a rectangular region measuring approximately 8 mm × 4 mm (as shown in Figure 9). To validate the accuracy and robustness of the picking point localization algorithm, 150 images covering different field scenarios were randomly selected from the test set. The following two metrics were used for quantitative evaluation: (1) Picking Point Localization Accuracy Rate: A localization is considered successful if the algorithm’s output picking point falls within the aforementioned rectangular area. The number of successes is counted through manual verification. (2) Filament Growth Posture Angle Error (): The filament’s principal axis direction estimated by the algorithm is compared against a benchmark value obtained through manual measurement using an angle measurement tool. The error is calculated using the formula below:
Figure 9.
Distribution of Picking Areas for Safflower Filaments.
In the formula, is the manually measured angle, and is the angle determined by the proposed algorithm.
3.3.2. Comparative Experimental Results of Localization Methods
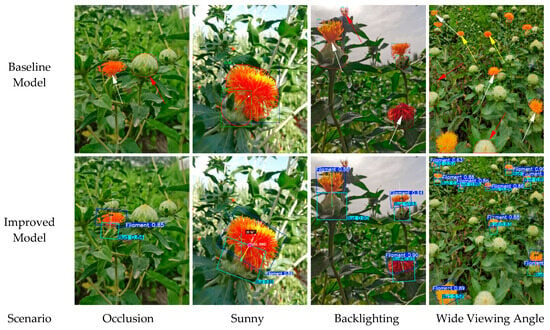
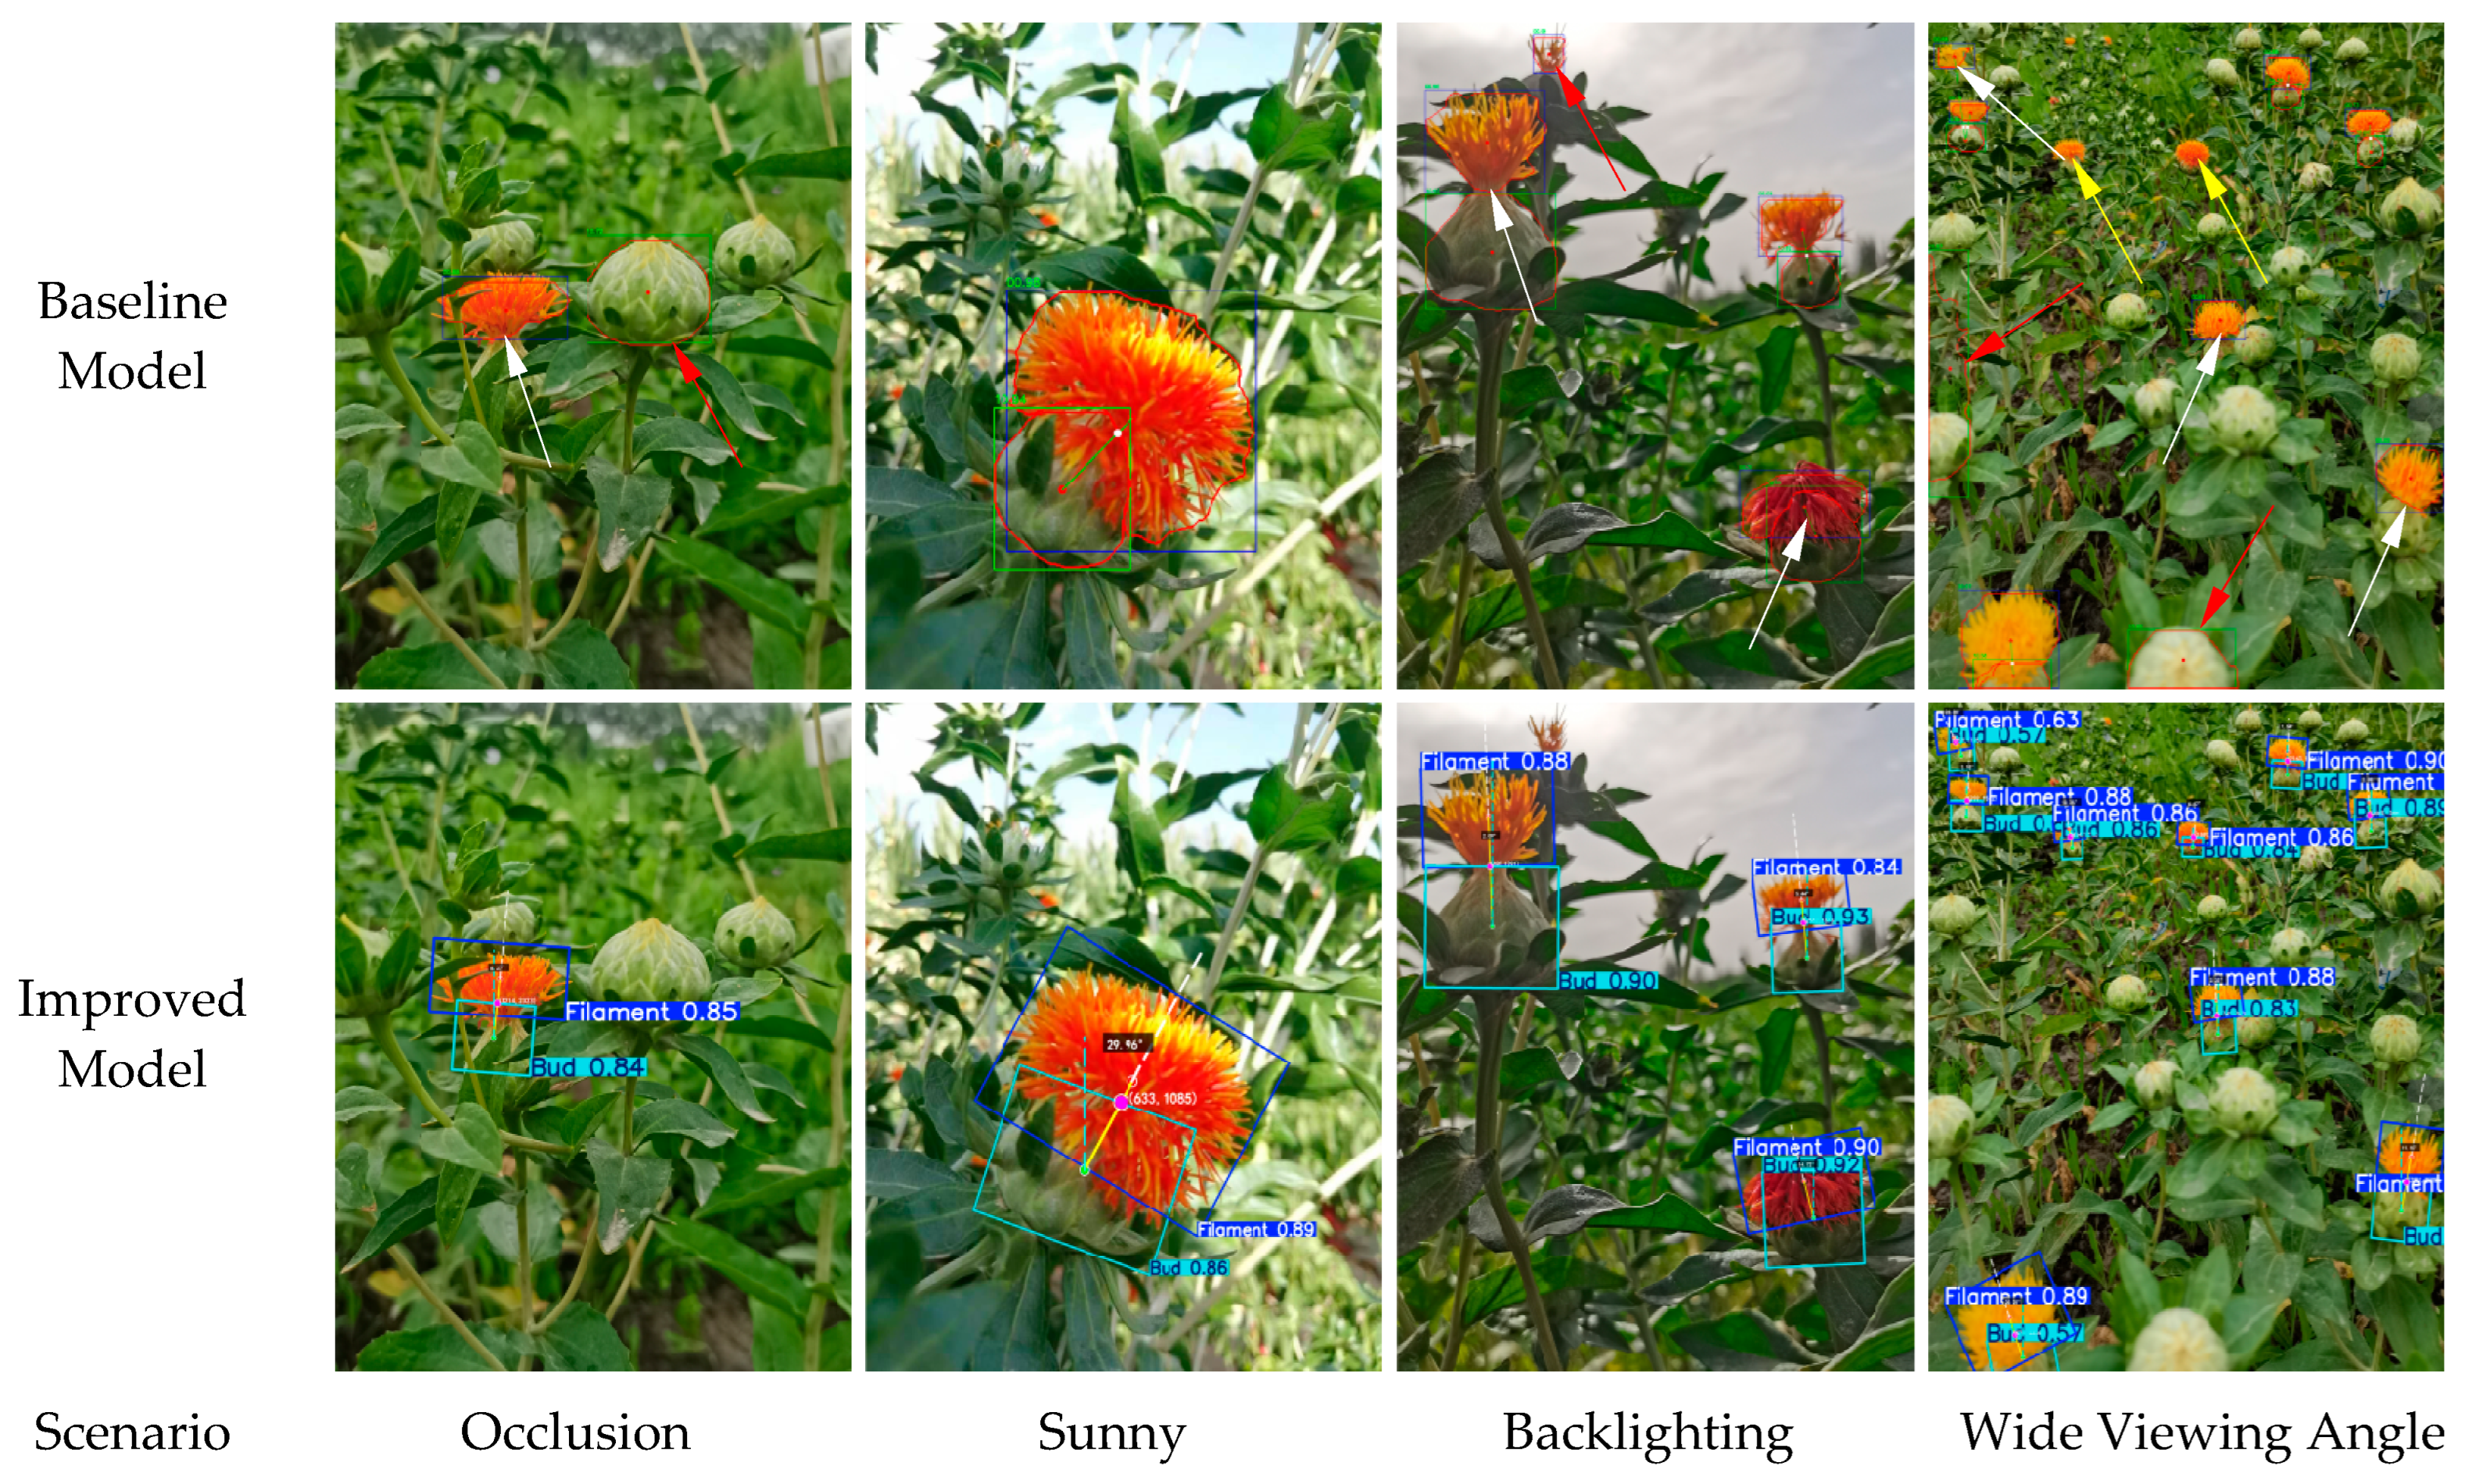
To validate the performance advantages of the proposed adaptive picking point localization algorithm over traditional 2D localization methods [15,18], a comparative experiment was conducted using the aforementioned test image data. The comparative results of the algorithms in terms of localization accuracy and angle estimation precision are presented in Table 3. A visual comparison of typical localization effects under different scenarios is shown in Figure 10.
Table 3.
Comparative Experiment of Different Localization Methods.
Figure 10.
Visual Comparison of Typical Localization Results.
According to the comparative experimental data of different localization methods presented in Table 3, the adaptive localization algorithm proposed in this study demonstrates significant superiority over traditional 2D localization methods across all key metrics. The comprehensive localization success rate of the proposed method across all test scenarios reached 87.3%, representing an improvement of approximately 10.7 percentage points compared to the 76.6% success rate of the traditional method. Particularly in two complex scenarios-occlusion and backlighting-the success rates improved from 67.2% to 82.1% and from 71.9% to 87.5%, respectively. This proves that by integrating adaptive judgment of growth posture, the algorithm effectively mitigates the impact of partial occlusion and lighting interference on localization consistency.
Under relatively ideal conditions such as sunny weather and wide viewing angles, the proposed method still maintains a significant advantage: the success rate in sunny scenarios increased from 87.0% to 94.4%, and from 80.3% to 85.2% in wide-viewing-angle scenarios. This reflects the algorithm’s stable localization capability under various environmental conditions, making it more suitable for the practical demands of unstructured field harvesting operations. Furthermore, the mean angle error of the proposed method across all scenarios is only 0.6°, indicating its ability to precisely estimate the principal axis direction of the filaments, thereby providing high-precision input for real-time posture adjustment of the robotic arm. In contrast, the traditional method, lacking integrated adaptive calculation of growth posture, does not systematically provide angle error data, resulting in relatively limited usability for practical control purposes.
The comparative analysis of typical field scenarios presented in Figure 10 visually highlights the distinct differences in picking point detection and localization performance between the proposed adaptive localization algorithm and the traditional 2D localization method. In the figure, white arrows indicate localization failures, yellow arrows indicate detection failures (missed detections), and red arrows indicate misdetections or erroneous localizations.
In the scenario with foliage occlusion, the traditional method, reliant on fixed geometric priors, struggles to adapt to variations in the partial visibility of filaments. Consequently, it exhibits a higher number of localization failures (white arrows) and erroneous localizations (red arrows). Under the uniform lighting of sunny conditions, the picking points located by the traditional method tend to shift towards the main body of the flower head, posing a potential risk of damaging the flower head during actual harvesting. This indicates that systematic bias cannot be entirely avoided even in ideal environments. In backlighting and wide-viewing-angle scenarios, the traditional method suffers from further missed detections (yellow arrows) and localization failures due to impaired contour feature extraction.
In contrast, the proposed adaptive picking point localization method, through the integration of dynamic growth posture judgment and multi-level feature optimization, significantly improves the localization success rate. It also effectively reduces instances of erroneous and missed localizations, demonstrating better adaptability to the practical requirements for precise harvesting of safflower filaments in complex field environments.
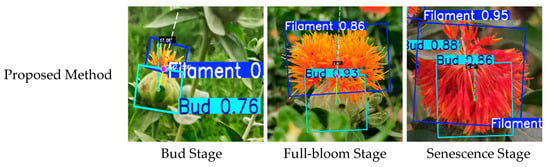
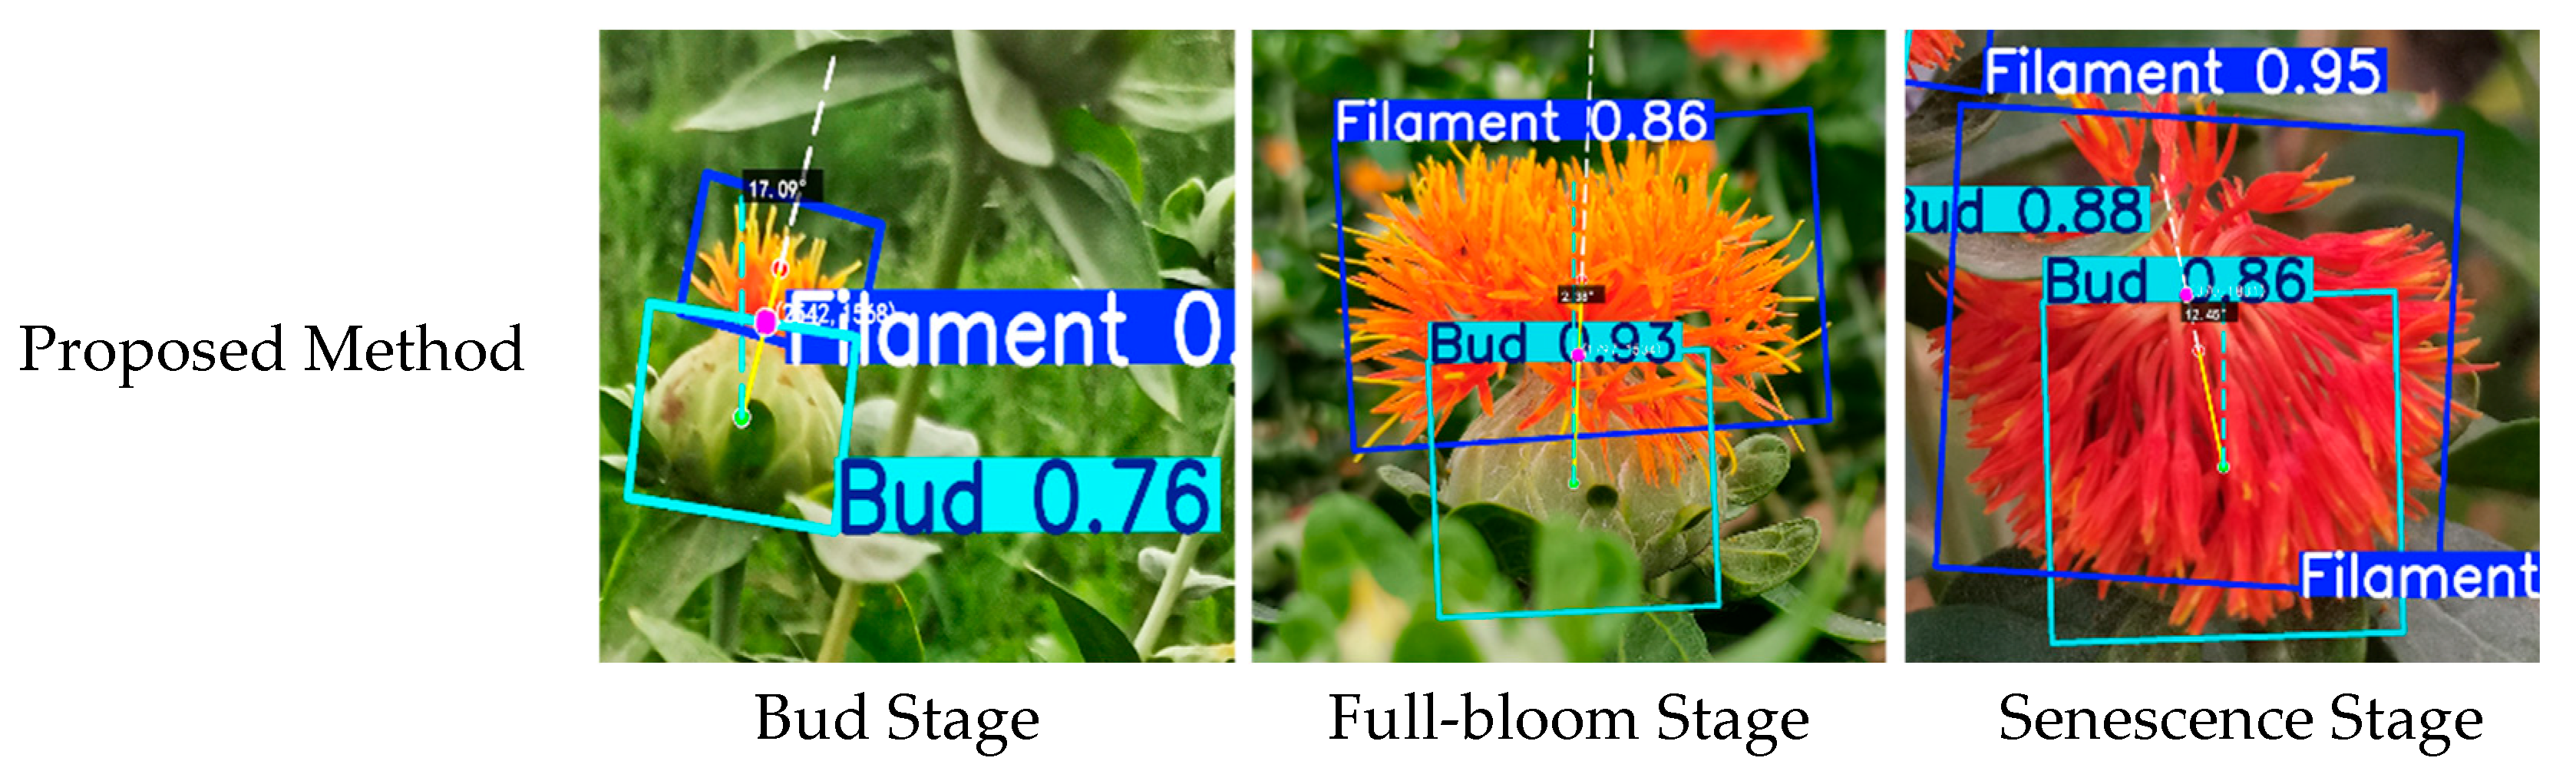
3.3.3. Picking Point Localization Experiment Across Different Growth Stages
To further verify that the proposed adaptive picking point localization method is suitable for safflower filaments across their full growth cycle, this section presents a detection and comparison using filaments from the bud stage, full-bloom stage, and senescence stage under sunny conditions. Sample visualization results are shown in Figure 11, and the experimental data are presented in Table 4.
Figure 11.
Localization Visualization Results Across Full Growth Cycle Stages.
Table 4.
Picking Point Localization Data Across Different Growth Stage.
According to the localization data for picking points across different growth stages presented in Table 4, the proposed method achieves a localization success rate of up to 90% throughout the full safflower growth cycle. Particularly during the bud and full-bloom stages where filament morphology is relatively stable, the algorithm effectively utilizes the growth morphology for precise localization. Compared to the full-bloom stage, the algorithm’s success rate decreases by 8 percentage points during the senescence stage. This phenomenon primarily stems from the filaments in senescence becoming dry, curled, or even partially detached, leading to weakened morphological features and increased difficulty in contour extraction. This, in turn, affects the judgment of the connection point and the estimation of the posture angle. Future work could introduce feature enhancement mechanisms specifically for morphological degradation to improve localization consistency across the entire cycle. Safflower can flower 2–3 times within its full growth cycle, requiring continuous harvesting across successive flowering stages. Based on the experimental results presented above, compared to the picking-point localization methods for safflower filaments studied by Zhang He and Guo Hui et al. [17,25] and the tea-picking point localization method investigated by Chen Chunlin et al. [26], the localization algorithm proposed in this study not only demonstrates advantages in both accuracy and real-time performance but also shows potential for stable operation across different flowering periods. It thus offers reliable technical support for the repeated and continuous harvesting operations of field robots.
While achieving preliminary results, this study also has several limitations that point to directions for future research:
(1) The breadth and generalization capability of the dataset require expansion. The dataset constructed in this study primarily focuses on safflower under the dominant cultivation practices in the Xinjiang region and does not systematically encompass the morphological and color variations across different geographical locations, seasons, and multiple cultivated varieties. This may limit the model’s ability to recognize morphological features of safflower outside specific varieties or growing environments. Future work necessitates the creation of a large-scale, standardized dataset spanning different regions, varieties, and growth cycles to further enhance the model’s generalization capability and practicality. (2) The perception modality and system integration remain relatively singular. The current algorithm relies mainly on RGB image information. In extreme cases such as highly overlapping flower heads or severe occlusion, its localization stability may be constrained. Furthermore, the research has not yet achieved real-time closed-loop integration and testing of the vision system with a robotic arm and end-effector on an actual robotic platform. The migration of the algorithm from a server environment to an embedded system may face domain adaptation challenges. The next steps will involve exploring multimodal perception methods that integrate depth information or temporal context and conducting comprehensive hardware-software co-harvesting experiments to validate the system’s robustness and real-time performance in dynamic field environments. (3) The accuracy and adaptive capability of 3D spatial localization still need improvement. Although the proposed 2D localization method achieves high accuracy within the image plane, practical harvesting requires the transformation of 2D coordinates into 3D spatial poses. This process is influenced by multiple factors, including camera calibration, robotic arm accuracy, and environmental disturbances. Future efforts will aim to achieve more stable and precise mapping of picking points in 3D space by introducing stereo vision or RGB-D cameras, combined with hand-eye calibration and motion planning algorithms.
4. Conclusions
Aiming at the key technologies for intelligent robotic harvesting of Xinjiang safflower filaments in unstructured planting environments, this study systematically proposed and validated an intelligent harvesting method integrating lightweight detection and adaptive localization. Through a series of experiments, the following main conclusions were drawn:
- (1)
- In terms of visual detection, this study constructed a safflower image dataset covering multiple scenarios and growth stages. Based on this, a lightweight improved model, SSO-YOLO, was proposed. Experiments demonstrated that this model maintains high accuracy (mAP@0.5 reaching 97.4%) while reducing its size by approximately 29.4% compared to the baseline YOLOv11n, effectively balancing detection performance and computational efficiency. Feature visualization further confirmed that, through the introduction of a lightweight backbone network and a channel attention mechanism, the model’s ability to focus on key features of filaments and flower heads is significantly enhanced in complex scenarios such as occlusion and backlighting. This provides reliable front-end perceptual support for subsequent precise localization.
- (2)
- Regarding picking point localization, the proposed adaptive localization algorithm, by integrating detection outputs, geometric analysis of growth posture, and dynamic connection point judgment, achieves accurate estimation of picking points in the 2D image space. Compared to traditional localization methods based on fixed rules or simple centroids, this algorithm improves the average localization success rate by approximately 10.7 percentage points across various unstructured scenarios including occlusion, backlighting, and wide viewing angles. Furthermore, the estimation error for the filament posture angle is only 0.6°. This indicates that by simulating the natural growth trend of filaments for adaptive calculation, the algorithm significantly enhances robustness and localization accuracy in complex field environments.
- (3)
- Regarding localization across the full safflower filament growth cycle, the localization method achieves success rates above 90% during the bud, full-bloom, and senescence stages, demonstrating good stage adaptability to meet the continuous harvesting needs of safflower’s multiple flowering events. Visual comparisons more intuitively reflect that the algorithm effectively reduces missed and erroneous localizations caused by environmental interference or target morphological changes. The localized points better conform to the agronomic standards of manual harvesting, thereby reducing the risk of damaging the flower heads.
In conclusion, the SSO-YOLO detection model and the adaptive picking point localization method proposed in this study provide a practical and effective visual solution for the intelligent harvesting of safflower filaments in unstructured field environments. The method demonstrates commendable performance in terms of being lightweight, environmentally robust, and adaptable across the full growth cycle, possessing technical potential for integration into practical harvesting systems. It also offers a valuable reference for research on the mechanized harvesting of similar specialty cash crops (such as saffron, chrysanthemums, etc.).
Author Contributions
Conceptualization, B.C. and J.L.; methodology, L.W.; validation, L.W. and B.C.; formal analysis, B.M. and L.C.; investigation, B.C., L.W. and J.L.; resources, B.M. and L.C.; data curation, L.W.; writing—original draft preparation, B.C. and L.W.; writing—review and editing, J.L., B.M. and L.C.; project administration, J.L.; funding acquisition, B.C. All authors have read and agreed to the published version of the manuscript.
Funding
This research was funded by the Natural Science Foundation of Xinjiang (Grant Number: 2025D01C89), and the National Natural Science Foundation of China (NSFC) (Grant Number: 32560422), and the second batch of Tianshan Talent Cultivation Plan for Young Talent Support Project (Grant Number: 2023TSYCQNTJ0040).
Data Availability Statement
The annotated image dataset (including safflower images and corresponding picking-point annotations) supporting this study is openly available in gitcode at https://gitcode.net/m0_60172526/yolov5-mcd (2 February 2026).
Conflicts of Interest
The authors declare no conflicts of interest.
References
- National Pharmacopoeia Commission. Pharmacopoeia of the People’s Republic of China; China Medical Science and Technology Press: Beijing, China, 2020; pp. 232–233.
- Tunçtürk, M.; Danesh, Y.R.; Tunçtürk, R.; Oral, E.; Najafi, S.; Nohutçu, L.; Jalal, A.; Oliveira, C.E.S.; Teixeira Filho, M.C.M. Safflower (Carthamus tinctorius L.) response to cadmium stress: Morpho-physiological traits and mineral concentrations. Life 2023, 13, 135. [Google Scholar] [CrossRef] [Scilit] [PubMed]
- Zhang, Z.; Zhao, M.Y.; Xing, Z.Y.; Liu, X.F. Design and Experiment of Double-acting Opposite Direction Cutting End Effector for Safflower Harvester. Trans. Chin. Soc. Agric. Mach. 2022, 53, 160–170. [Google Scholar]
- Zhang, Z.; Peng, X.; Xie, B.; Wang, Y.; Shi, R.; Li, J.; Cao, W.; Chu, W.; Zeng, C. Investigation into the efficient cooperative planning approach for Dual-Arm picking sequences of Dwarf, High-Density safflowers. Sensors 2025, 25, 4459. [Google Scholar] [CrossRef] [Scilit] [PubMed]
- Li, P.H. Intelligent Saffron Harvesting Key Technology Research. Master’s Thesis, Northwest A&F University, Xianyang, China, 2024. [Google Scholar]
- Hua, W.; Zhang, Z.; Zhang, W.; Liu, X.; Hu, C.; He, Y.; Mhamed, M.; Li, X.; Dong, H.; Saha, C.K.; et al. Key technologies in apple harvesting robot for standardized orchards: A comprehensive review of innovations, challenges, and future directions. Comput. Electron. Agric. 2025, 235, 110343. [Google Scholar] [CrossRef] [Scilit]
- Chen, C.; Song, Z.; Li, X.; Chen, C.; Yang, F.; Wang, Z. Research status of apple picking robotic arm picking strategy and end-effector. Comput. Electron. Agric. 2025, 235, 110349. [Google Scholar] [CrossRef] [Scilit]
- Li, Y.; Wu, S.; He, L.; Tong, J.; Zhao, R.; Jia, J.; Chen, J.; Wu, C. Development and field evaluation of a robotic harvesting system for plucking high-quality tea. Comput. Electron. Agric. 2023, 206, 107659. [Google Scholar] [CrossRef] [Scilit]
- Shi, G.Y.; Ji, J.P.; Li, T.H.; Li, W.X.; Li, Y.; Zhang, G.S. Detecting chrysanthemum to classify flowering stages using improved YOLOv8s. Trans. Chin. Soc. Agric. Eng. 2025, 41, 192–199. [Google Scholar]
- Ma, B.; Wu, Z.; Ge, Y.; Chen, B.; Zhang, H.; Xia, H.; Wang, D. A Recognition Method for Marigold Picking Points Based on the Lightweight SCS-YOLO-Seg Model. Sensors 2025, 25, 4820. [Google Scholar] [CrossRef] [Scilit] [PubMed]
- Chen, J.R.; Xu, Y.; Zhou, J.P.; Wang, X.R.; Luo, M.; Xu, S.B. Detecting safflower in the natural environment using YOLO-SSAR. Trans. Chin. Soc. Agric. Eng. 2025, 41, 215–223. [Google Scholar]
- Zhang, Z.; Shi, R.; Xing, Z.; Guo, Q.; Zeng, C. Improved faster region-based convolutional neural networks (R-CNN) model based on split attention for the detection of safflower filaments in natural environments. Agronomy 2023, 13, 2596. [Google Scholar] [CrossRef] [Scilit]
- Zhang, Z.; Xing, Z.Y.; Zhao, M.Y.; Yang, S.P.; Guo, Q.F.; Shi, R.M.; Zeng, C. Detecting safflower filaments using an improved YOLOv3 under complex environments. Trans. Chin. Soc. Agric. Eng. 2023, 39, 162–170. [Google Scholar]
- Zhang, X.Y.; Hu, G.R.; Li, P.H.; Cao, X.M.; Zhang, H.; Chen, J.; Yang, L.L. Recognizing safflower using improved lightweight YOLOv8n. Trans. Chin. Soc. Agric. Eng. 2024, 40, 163–170. [Google Scholar]
- Chen, B.; Ding, F.; Ma, B.; Yao, Q.; Ning, S. Research on detection and location method of safflower filament picking points during the blooming period in unstructured environments. Sci. Rep. 2025, 15, 10851. [Google Scholar] [CrossRef] [Scilit] [PubMed]
- Xing, Z.; Zhang, Z.; Wang, Y.; Xu, P.; Guo, Q.; Zeng, C.; Shi, R. SDC-DeepLabv3+: Lightweight and precise localization algorithm for safflower-harvesting robots. Plant Phenomics 2024, 6, 0194. [Google Scholar] [CrossRef] [Scilit] [PubMed]
- Zhang, H.; Ge, Y.; Xia, H.; Sun, C. Safflower picking points localization method during the full harvest period based on SBP-YOLOv8s-seg network. Comput. Electron. Agric. 2024, 227, 109646. [Google Scholar] [CrossRef] [Scilit]
- Zhang, H.; Sun, C.; Ge, Y.; Ma, B.; Xia, H. A lightweight method for identifying safflower picking points based on the integration of object detection and instance segmentation networks. Eng. Appl. Artif. Intell. 2025, 162, 112737. [Google Scholar] [CrossRef] [Scilit]
- Huang, Z.; Lee, W.S.; Yang, P.; Ampatzidis, Y.; Shinsuke, A.; Peres, N.A. Advanced canopy size estimation in strawberry production: A machine learning approach using YOLOv11 and SAM. Comput. Electron. Agric. 2025, 236, 110501. [Google Scholar] [CrossRef] [Scilit]
- Han, T.; Yu, S.S.; Ma, L.; Huang, Y.R.; Hou, S.N.; Pang, J.L. Research on the Detection Model of Foreign Objects and Defects in Photovoltaic Panels Based on Improved YOLOv11n. Comput. Eng. Appl. 2025, 61, 123–134. [Google Scholar]
- Ma, X.; Dai, X.; Bai, Y.; Wang, Y.; Fu, Y. Rewrite the stars. In Proceedings of the IEEE/CVF Conference on Computer Vision and Pattern Recognition, Seattle, WA, USA, 16–22 June 2024; pp. 5694–5703. [Google Scholar]
- Hu, J.; Shen, L.; Sun, G. Squeeze-and-excitation networks. In Proceedings of the IEEE Conference on Computer Vision and Pattern Recognition, Salt Lake City, UT, USA, 18–22 June 2018; pp. 7132–7141. [Google Scholar]
- Selvaraju, R.R.; Cogswell, M.; Das, A.; Vedantam, R.; Parikh, D.; Batra, D. Grad-cam: Visual explanations from deep networks via gradient-based localization. In Proceedings of the IEEE International Conference on Computer Vision, Venice, Italy, 22–29 October 2017; pp. 618–626. [Google Scholar]
- Jamil, M.S.; Banik, S.P.; Rahaman, G.A.; Saha, S. Advanced gradcam++: Improved visual explanations of CNN decisions in diabetic retinopathy. In Computer Vision and Image Analysis for Industry 4.0; Chapman and Hall/CRC: Boca Raton, FL, USA, 2023; pp. 64–75. [Google Scholar]
- Guo, H.; Chen, H.; Gao, G.; Zhou, W.; Wu, T.; Qiu, Z. Safflower corolla object detection and spatial positioning methods based on YOLO v5m. Trans. Chin. Soc. Agric. Mach. 2023, 54, 272–281. [Google Scholar]
- Chen, C.; Lu, J.; Zhou, M.; Yi, J.; Liao, M.; Gao, Z. A YOLOv3-based computer vision system for identification of tea buds and the picking point. Comput. Electron. Agric. 2022, 198, 107116. [Google Scholar] [CrossRef] [Scilit]

Disclaimer/Publisher’s Note: The statements, opinions and data contained in all publications are solely those of the individual author(s) and contributor(s) and not of MDPI and/or the editor(s). MDPI and/or the editor(s) disclaim responsibility for any injury to people or property resulting from any ideas, methods, instructions or products referred to in the content. |
© 2026 by the authors. Licensee MDPI, Basel, Switzerland. This article is an open access article distributed under the terms and conditions of the Creative Commons Attribution (CC BY) license.