


Abstract
The MOPLUS project, funded by the Portuguese Recovery and Resilience Plan (PRR), aims to enhance soil organic matter, soil structure, and water retention in apple orchards located in the “Maçã de Alcobaça” Protected Geographical Indication area through organic fertilization based on locally available livestock effluents, thereby reducing reliance on synthetic fertilizers under Mediterranean climatic conditions. This study evaluated the physiological and biometric responses of apple trees subjected to four fertilization strategies (M1–M4) in three commercial ‘Gala’ orchards in central Portugal over three growing seasons (2023–2025). Measurements included leaf functional traits, gas exchange, chlorophyll fluorescence, spectral indices, vegetative growth, fruit production per tree and mean fruit weight. Interannual climatic variability and orchard-specific conditions were the dominant drivers of tree response, while fertilization effects were smaller and mainly expressed through interactions with year and orchard. When analyzed within the same orchard, fertilization strategies M2 and particularly M3 maintained physiological performance, vegetative growth, and fruit production per tree at levels comparable to full mineral fertilization. Among treatments, M3 showed the most consistent responses across sites and years, indicating that partial mineral substitution with pig slurry can sustain tree functioning while maintaining or enhancing fruit production per tree. The most restrictive strategy (M4) occasionally showed reduced photosynthetic performance under specific orchard–year combinations, suggesting a threshold effect associated with stronger mineral reduction, but without evidence of generalized physiological stress. Overall, these findings demonstrate that partial substitution of mineral fertilizers by organic amendments—especially pig slurry (M3) and, to a lesser extent, composted cattle manure (M2)—is agronomically viable, allowing apple tree performance and productivity to be maintained while enhancing system resilience under Mediterranean climatic variability. These results also provide practical decision support for site-adapted fertilization management in commercial drip-irrigated apple orchards, supporting reduced mineral fertilizer dependence without compromising productivity.
1. Introduction
The escalating costs of mineral fertilizers, driven by global economic instability and recurrent energy crises, have posed substantial challenges for orchard management across Europe [1,2]. At the same time, excessive use of synthetic nutrients has led to soil degradation, nutrient leaching, contamination of surface and groundwater, greenhouse gas emissions, and shifts in soil microbial communities, which are increasingly evident [3,4,5]. In response, the European Union has introduced regulatory measures targeting a 20% reduction in synthetic fertilizer use by 2030, prompting stakeholders to explore innovative nutrient management strategies that balance productivity, cost-efficiency, and environmental stewardship [6,7]. In parallel, evolving consumer expectations increasingly demand fruit production systems—such as apple orchards—that ensure high-quality yields while minimizing environmental impacts [8].
Alternative fertilization strategies have therefore gained attention. These include slow-release mineral formulations, enhanced-efficiency fertilizers, cover crops and green manures, biofertilizers, and organic amendments derived from livestock or agro-industrial by-products [9,10,11,12,13,14,15]. These approaches enhance soil fertility and structure, stimulate microbial activity, improve nutrient cycling, and reduce the carbon footprint compared with conventional mineral fertilization [16,17,18]. Beyond nutrient supply, organic inputs support long-term soil health by increasing water retention, reducing erosion risk, and fostering resilient orchard ecosystems capable of adapting to climate variability [19,20]. Their integrated adoption aligns with principles of circular agriculture and regenerative soil management, reconciling productivity, economic feasibility, and environmental sustainability [21,22].
Among these alternatives, livestock-derived organic amendments have emerged as particularly promising. They supply essential macronutrients, increase soil organic matter and microbial diversity, promote nutrient cycling, and facilitate integration of plant and animal production systems [23,24,25]. Such amendments can partially or completely replace mineral fertilizers, reducing production costs while enhancing soil health and potentially improving tree physiological performance and fruit quality [26,27]. However, under commercial orchard conditions, multi-year evidence integrating tree physiological functioning, vegetative growth, and yield responses to organic fertilization remains limited, particularly in perennial fruit systems exposed to increasing climatic variability. Evaluating apple tree responses to organic fertilization—including photosynthetic performance, chlorophyll fluorescence, and growth dynamics—is therefore essential for defining management practices that sustain yield and fruit quality while meeting environmental and regulatory objectives [28,29,30].
This study was conducted within the framework of the MOPLUS project, which aimed to identify and validate sustainable nutrient management practices in the Alcobaça region [31]. Field trials were conducted in three commercial ‘Gala’ apple orchards, where mineral fertilizers were partially replaced with organic amendments derived from locally available livestock effluents. The experimental design allowed the evaluation of tree responses under real production conditions, with particular emphasis on management practices related to soil structure and water retention, organic amendment application and incorporation methods, inter-row management for soil regeneration, and monitoring of soil organic matter and nutrient dynamics. Complementary activities included the assessment of tree physiological performance and fruit quality, as well as knowledge transfer through living labs and technical training for local producers.
Against this background, the present study aimed to disentangle the relative contributions of fertilization strategy, orchard-specific conditions, and interannual climatic variability to apple tree physiological performance, vegetative growth, and fruit development. By combining agronomic, environmental, and physiological approaches, this multi-year study provides an integrated assessment of how organic fertilization influences leaf functional traits, photosynthetic performance, vegetative growth, and fruit development in high-value apple orchards. The results support evidence-based fertilization strategies that maintain productivity, enhance soil health, reduce reliance on synthetic inputs, and provide solutions for the circular use of animal organic residues, thereby reducing the risks of ecosystem disruption. More broadly, they contribute to discussions on sustainable intensification and adaptive orchard management, helping growers balance economic viability with environmental responsibility under increasingly variable climatic and regulatory conditions.
2. Materials and Methods
2.1. Study Sites and Experimental Design
This study was conducted in three drip-irrigated commercial apple orchards (Malus domestica Mill., cv. Gala, with approximately 10% pollinators—Granny Smith and Malus floribunda varieties), chosen for their different soil textures, which are managed by members of grower organizations involved in the project. The orchards are located within the municipality of Alcobaça (district of Leiria), in the Central region of Portugal (Oeste sub-region): Frubaça (FR) (39°35′18″ N, 8°59′21″ W), CARSAG (CAR) (39°30′29″ N, 9°06′22″ W), and Campotec (CT) (39°30′55″ N, 9°00′53″ W) (Figure 1 and Figure 2).
Figure 1.
(a) Regional location of the experimental apple orchards in Alcobaça, Portugal; (b) detailed view of the study area. Municipal boundaries are shown in orange, and the Alcobaça municipality is highlighted in yellow (Google Earth, November 2025).
Figure 2.
Location and delineation of the experimental plots within the municipality of Alcobaça, Portugal: (a) FR (Frubaça), (b) CT (Campotec), and (c) CAR (CARSAG) orchards (Google Earth, November 2025).
The study covered three consecutive growing seasons (2023–2025). According to the Köppen–Geiger climate classification [32], the region exhibits a Mediterranean climate with mild, dry summers (Csb), characterized by wet winters and temperate summers. Long-term climatic normals indicate a mean annual precipitation of approximately 696 mm, concentrated mainly between October and March, and a mean annual air temperature of 15.4 °C, with average maximum and minimum temperatures of 18.9 °C and 12.5 °C, respectively [33]. The proximity to the Atlantic Ocean and local topography contribute to microclimatic variability within the study area, which is reflected in site-specific differences among orchards.
Soil properties differed among sites, as determined by laboratory analyses, and represent a key source of spatial heterogeneity. The CAR orchard (Figure 2c) is characterized by sandy loam soil (85.1% sand, 5.9% silt, 9.1% clay), offering balanced drainage and moderate water-holding capacity. The FR orchard (Figure 2a) presents loamy sand soil (84.1% sand, 4.9% silt, 11.1% clay), with high drainage and comparatively lower water retention. In contrast, the CT orchard (Figure 2b) exhibits sandy clay loam soil (67.1% sand, 10.9% silt, 22.1% clay), which provides greater water and nutrient retention capacity. These textural differences are expected to influence soil water dynamics and tree physiological responses under varying climatic conditions.
All orchards were managed under drip irrigation to maintain optimal soil moisture, with irrigation scheduling guided by soil moisture sensor data obtained from either Sentek EnviroSCAN soil moisture profiling probes (Sentek Technologies, Stepney, SA, Australia) or multi-depth capacitance probes (EnviroPro®, ICT International Pty Ltd., Armidale, NSW, Australia), and a permanent living mulch cover was maintained between rows. Soil maintenance in the inter-row zones is performed using mechanical methods, whereas in-row zones are managed through targeted herbicide applications. Trees were trained under a spindle system and managed following standard commercial practices. Key structural and management characteristics of the orchards are summarized in Table 1.
Table 1.
Main characteristics of the orchards included in the study.
2.2. Fertilization Treatments
Each experimental orchard included four fertilization treatments, arranged in a randomized complete block design with three replicates per treatment. The four fertilization treatments were defined to represent a realistic gradient of mineral N replacement by locally available organic amendments under commercial orchard conditions. Each replicate consisted of five tagged apple trees, which were selected within the experimental plot to represent the average canopy size and vigor and were not necessarily spatially contiguous. In total, 60 trees were monitored per orchard (4 treatments × 3 replicates × 5 trees).
The fertilization strategies were designed to evaluate contrasting proportions of inorganic and organic nutrient sources while maintaining comparable total nutrient inputs. The four treatments differed in the relative contribution of mineral fertilizers, composted cattle manure, and pig slurry, as well as in their application zone, timing, and management practices (Table 2). Mineral fertilization was applied through both topdressing and fertigation using commercial inorganic fertilizers, including Amicote® (0–26–0), Nitromagnésio 27 (27–0–0 + Mg), NPK 18–18–18, NPK 15–5–30, 13–0–46, Solusop® 52 (0–0–52), and monoammonium phosphate (MAP; 12–61–0). Fertilizer type, timing, and application rates varied slightly between orchards and years according to local fertilization plans.
Table 2.
Fertilization treatments applied in the experimental orchards, including fertilizer type and proportion, application zone, application method, timing, and complementary management actions.
Treatment M1 consisted exclusively of inorganic fertilization (100% Inorg), applied along the tree row by broadcast application combined with fertigation during the growing season (FGS), including applications at budbreak (BB) and post-harvest (PH).
Treatment M2 combined 75% inorganic fertilization, applied as in M1, with 25% composted cattle manure applied to the tree row at budbreak, and 12.5% pig slurry applied to the inter-row at post-harvest, followed by immediate mowing (IM) of the living mulch.
Treatment M3 followed the same inorganic fertilization strategy as M2 but replaced composted manure with 25% pig slurry applied to the tree row at budbreak and incorporated into the soil (INC). An additional 12.5% of pig slurry was applied to the inter-row at post-harvest, followed by immediate mowing (IM).
Treatment M4 reduced the inorganic fraction to 50%, applied as in M1, and combined it with 25% composted cattle manure applied to the tree row at budbreak. The remaining 37.5% of pig slurry was applied at post-harvest, distributed between the tree row and inter-row, with soil incorporation in the tree row (INC) and immediate mowing (IM) of the living mulch in the inter-row.
The organic fertilizers used in the study comprised composted cattle manure and pig slurry, representative of locally available organic amendments. Organic amendments were sourced locally in each orchard; therefore, their composition was not identical across sites and may vary between years. Detailed compositional characterization of the organic fertilizers is being addressed in a dedicated companion manuscript currently in preparation. Although fertilization treatments are expressed as relative proportions, the corresponding total nitrogen inputs were within the range typically recommended for ‘Gala’ apple orchards in the region (approximately 70–90 kg N ha−1 year−1), adjusted annually based on leaf and soil nutrient analyses.
2.3. Meteorological Data and Environmental Conditions
Meteorological data were obtained from automatic weather stations located in orchards adjacent to the experimental sites, at distances ranging from approximately 150 m to 2 km from the monitored plots. For each site, the following variables were recorded: precipitation; mean, minimum, and maximum air temperature; relative humidity; solar radiation; wind speed; and reference evapotranspiration (ET0).
ET0 was used as an integrative indicator of atmospheric evaporative demand, incorporating the combined effects of air temperature, relative humidity, solar radiation, and wind speed. Daily ET0 was calculated using the FAO-56 Penman–Monteith equation for a reference grass surface [34]:
where ET0 is the reference evapotranspiration (mm day−1), Rn is the net radiation at the crop surface (MJ m−2 d −1), G is the soil heat flux density (MJ m−2 d −1), T is mean daily air temperature at 2 m height (°C), u2 is the wind speed at 2 m height (m s−1), es is the saturation vapor pressure (kPa), ea is the actual vapor pressure (kPa), Δ is the slope of the vapor pressure curve (kPa °C−1), and γ is the psychrometric constant (kPa °C−1).
Daily meteorological data were aggregated on a quarterly basis (Q1: January–March; Q2: April–June; Q3: July–September; Q4: October–December) to characterize seasonal climatic patterns and facilitate interannual and inter-site comparisons. Quarterly and annual summaries were used to describe the environmental conditions prevailing during the study period (2023–2025) at the three orchards.
2.4. Biometric Measurements
Biometric measurements were conducted to monitor vegetative growth and canopy development of apple trees from 2023 to 2025. In each experimental orchard, fifteen trees per fertilization treatment (M1–M4) were permanently tagged and monitored, resulting in a total of 60 trees per orchard. Trees were selected within each experimental plot to represent average canopy size and vigor. In cases where tagged trees were removed due to phytosanitary management (e.g., fire blight), they were replaced by nearby trees within the same treatment and plot, and this was accounted for in the interpretation of growth increments.
All tagged trees were included in the biometric assessment. However, due to logistical constraints and the nature of specific measurements, different subsets of trees were used for variables, as described below.
Biometric measurements were carried out twice per year, corresponding to a spring–early summer assessment and a late autumn assessment, to quantify seasonal growth increments. In 2023, initial measurements were conducted on 1 June at FR, 6 June at CT, and 14 June at CAR, while final measurements were performed on 15 November 2023 at all sites. In 2024, first measurements were carried out in March (21 March at CT and CAR, and 25 March at FR), with final measurements conducted in November 2024 at all orchards. In 2025, initial measurements were taken on 29 May at CT and CAR, and on 6 June at FR. Final measurements were performed on 2 December 2025 at CT and on 3 December 2025 at the remaining orchards.
Trunk diameter was measured on all tagged trees at 20 cm above the grafting point using a digital caliper (Calibit, Horticultural Knowledge, Italy) (Figure 3a), with measurements taken at three equidistant positions around the trunk. The average of the three diameters (D1, D2, D3) was used to calculate the trunk cross-sectional area (TCSA, cm2) according to:
where D1, D2, and D3 are trunk diameters (cm) measured at 20 cm above the graft union, and π is the mathematical constant (≈3.1416).
Figure 3.
Overview of field and laboratory measurements. (a) Trunk diameter measurement with a digital caliper; (b) leaf disk sampling for SLA determination; (c) CCI measurement using MC-100; (d) leaf gas exchange measurements using IRGA; (e) leaf reflectance indices acquired with PolyPen; and (f) chlorophyll fluorescence measurements using PEA.
Tree height (TH) and canopy dimensions were assessed on subsets of ten trees per treatment, selected from the tagged population. Total tree height (Htotal) and height to the base of the canopy (Hβase) were measured using a graduated measuring rod (GR 500 Professional, Bosch, Stuttgart, Germany). Canopy width was measured using a flexible measuring tape at three vertical positions: at the base (Lβase), at mid-height (Lmid), and at the upper canopy level (Ltop), measured 50 cm under the canopy apex. The methodology has been frequently applied to capture differences in trees exhibiting a cone-shaped crown with a broad base, as observed in this region as a consequence of the training and pruning techniques employed.
Canopy volume (CV, m3) was estimated using an empirical geometric approach based on the mean canopy width and canopy height, as previously described in [10]. Canopy volume was calculated as follows:
where Lβase, Lmid, and Ltop are canopy widths (cm), and Htotal and Hβase, are measured in meters.
Vegetative growth was quantified using annual growth increments, calculated as the difference between final and initial measurements within each year for trunk cross-sectional area (ΔTCSA) and canopy volume (ΔCV), which were used as integrative indicators of vegetative development.
Because ΔTCSA relies on the continuity of individual trees across measurement dates, this variable was interpreted with caution in situations involving tree replacement or replanting associated with phytosanitary management (e.g., removal of trees affected by fire blight), which may disrupt trunk growth continuity. In most cases, only the infected tree was removed; however, in a few situations neighboring trees were also removed for phytosanitary reasons. Therefore, growth increment analyses (ΔTCSA and ΔCV) were restricted to trees whose surrounding conditions remained unchanged between measurement dates, minimizing potential bias due to altered competition.
2.5. Physiological Measurements
Physiological measurements were conducted to characterize leaf functional traits, photosynthetic performance, and optical properties of apple trees under the different fertilization treatments. All physiological assessments were performed on the same sampling dates within each year, ensuring full temporal coherence among variables, including specific leaf area (SLA), chlorophyll content index (CCI), gas exchange, leaf reflectance indices, and chlorophyll fluorescence.
Two sampling campaigns were carried out annually, corresponding to late spring/early summer and mid-summer. Sampling dates were orchard-specific but consistent across all physiological variables. At the FR orchard, leaf sampling was conducted on 1 June and 3 August 2023, 6 June and 8 August 2024, and 16 June and 13 August 2025. At CT, measurements were performed on 6 June and 9 August 2023, 7 June and 9 August 2024, and 20 June and 8 August 2025. At CAR, sampling took place on 14 June and 1 August 2023, 28 May and 1 August 2024, and 24 June and 1 August 2025.
All measurements were carried out on fully expanded, healthy, sun-exposed leaves located in the mid-portion of current-season shoots. For each orchard and sampling date, five trees per fertilization treatment were assessed, and tree means were used for all statistical analyses.
2.5.1. Specific Leaf Area (SLA)
SLA was determined from leaf samples collected during the same two annual sampling campaigns described above. For each fertilization treatment, 50 leaves were collected per campaign. Leaves were selected from the middle third of the canopy and transported in sealed containers and kept shaded at ambient temperature, minimizing moisture loss prior to processing.
Using a metal punch with a 14 mm diameter, two disks were extracted from each leaf blade, avoiding major veins (Figure 3b). Disk area was calculated as follows:
For each treatment, five Petri dishes (replicates) were prepared, each containing 20 leaf disks. Fresh mass was measured using an analytical balance (Kern ALJ 160-4AM; precision 0.1 mg; Kern and Sohn GmbH, Balingen, Germany). Samples were oven-dried (WTC Binder 7200, Typ E 115; Tuttlingen, Germany) at 70 °C for 48 h and weighed immediately after removal. SLA was calculated following Reich et al. [35] as follows:
2.5.2. Chlorophyll Content Index (CCI)
Chlorophyll content index (CCI) was measured using a portable chlorophyll concentration meter (MC-100, Apogee Instruments, Logan, UT, USA) (Figure 3c), which estimates chlorophyll content based on the ratio of leaf transmittance at 653 nm and 931 nm wavelengths [36].
Measurements were conducted during the same sampling dates used for SLA and all other physiological variables. Sampling dates were orchard-specific but consistent across variables and years (2023–2025). At each measurement date, five trees per treatment were assessed, and multiple leaves per tree were measured to obtain representative tree means.
2.5.3. Gas Exchange Parameters
Leaf gas exchange was measured on the same dates as CCI assessments using a portable infrared gas analyzer (IRGA; LCproT, ADC BioScientific Ltd., Hoddesdon, UK) equipped with a 6.35 cm2 leaf chamber (Figure 3d). Measurements were performed on 10 trees per treatment, with one fully expanded leaf measured per tree.
The following parameters were recorded: net photosynthetic rate (An, µmol CO2 m−2 s−1), stomatal conductance (gs, mol H2O m−2 s−1), transpiration rate (E, mmol H2O m−2 s−1), and intercellular CO2 concentration (Cᵢ, µmol mol−1). Instantaneous water-use efficiency (WUE, µmol CO2 mmol−1 H2O) was calculated automatically by the IRGA and analyzed at the annual scale.
Measurements were conducted in the morning (09:30–13:00 h) under stable clear-sky conditions to minimize diurnal variability in vapor pressure deficit and avoid afternoon stomatal depression, which is common in Mediterranean orchards during the warm season. Although chamber conditions were controlled, this time window was selected to ensure comparability among trees, orchards, and years under non-stressful and physiologically stable conditions. Chamber conditions were standardized as follows: CO2 concentration ≈ 400 µmol mol−1, photosynthetically active radiation (PAR) 1500 µmol m−2 s−1, leaf chamber temperature 25 °C, and airflow 200 µmol s−1.
2.5.4. Leaf Reflectance Indices
Leaf reflectance measurements were performed on fully expanded, sun-exposed leaves collected from previously marked apple trees within each fertilization treatment, following the same sampling dates described in Section 2.5. Measurements were conducted using a PolyPen RP 410 UVIS spectroradiometer (Photon Systems Instruments, Drásov, Czech Republic), operating over a spectral range of 380–790 nm (Figure 3e).
The instrument is equipped with an integrated xenon light source and a non-destructive leaf clip, ensuring consistent illumination and measurement geometry. Reflectance spectra were recorded on one leaf per sampled tree, and the PolyPen automatically calculated 25 vegetation indices based on the acquired spectra, including indices related to canopy structure, chlorophyll content, carotenoids, and stress responses (e.g., NDVI, SRI, MCARI, OSAVI, SIPI, GM1, GM2, ARI1, ARI2, CRI1, CRI2).
Before each measurement session, the instrument was calibrated using a Spectralon® white reference panel according to the manufacturer’s instructions. Reflectance data and the corresponding vegetation indices were stored in the device’s internal memory and later exported via USB for further processing.
2.5.5. Chlorophyll Fluorescence
Chlorophyll fluorescence was assessed using a HandyPEA Plant Efficiency Analyzer (Hansatech Instruments Ltd., Norfolk, UK) on the same sampling dates as the other physiological measurements (Figure 3f). Leaves were dark-adapted for 20 min and then exposed to a saturating light pulse of 3500 µmol photons m−2 s−1.
A subset of parameters derived from the OJIP fluorescence transient was selected to avoid redundancy and improve interpretability, including the maximum quantum yield of PSII (Fv/Fm), the performance index on an absorption basis (PIabs), absorption per reaction centerrr (ABS/RC), energy dissipation per reaction centre (DIo/RC), and electron transport per reaction centre (ETo/RC), providing complementary information on PSII efficiency, energy partitioning, and electron transport capacity [37,38,39].
2.6. Fruit Production and Mean Fruit Weight Assessment
Fruit production was assessed at harvest on the same tagged trees used for biometric and physiological measurements. At each orchard, fruits from tagged trees within each fertilization treatment were harvested according to the commercial harvest schedule, either in a single harvest or in successive harvest rounds when applicable.
Fruits collected from the tagged trees were kept separate from the remaining orchard production. For each fertilization treatment and orchard, total fruit fresh weight (kg tree−1) and fruit number were recorded at the tree level to characterize per-tree production and fruit load. Due to differences in planting density, orchard structure, and tree replacement among sites, yield was not extrapolated to a per-area basis. Mean fruit weight (g) was subsequently calculated as the ratio between total fruit fresh weight and total fruit number and used as an indicator of fruit size and performance rather than overall productivity.
2.7. Statistical Analysis
All statistical analyses were conducted using JASP software (version 0.95.4, University of Amsterdam, The Netherlands). Statistical significance was set at p < 0.05.
SLA, CCI, gas exchange parameters, chlorophyll fluorescence variables, PolyPen-derived spectral indices, biometric traits, and mean fruit weight were analyzed using three-way analysis of variance (ANOVA), with Year, Orchard, and Treatment (M1–M4) as fixed factors. Two- and three-way interaction terms were included to evaluate context-dependent responses across years and orchard conditions.
Normality of residuals was assessed using the Shapiro–Wilk test, and homogeneity of variances using Levene’s test. No data transformations were applied prior to statistical analyses. When the assumption of homoscedasticity was violated, Welch’s ANOVA was applied.
Games–Howell post hoc tests were used for pairwise comparisons when significant effects were detected, as this procedure does not assume equal variances or equal sample sizes. For the descriptive comparisons within each year × orchard subset reported in Table 3, Tukey’s HSD test (p < 0.05) was applied to assign letter groupings among treatments. ANOVA summary results are reported in the Appendix A (Table A1, Table A2, Table A3, Table A4, Table A5, Table A6, Table A7, Table A8, Table A9, Table A10 and Table A11) to support the interpretation of main effects and interactions while avoiding over-fragmentation of the Results section. No additional family-wise error correction (e.g., Bonferroni) was applied, as the Games–Howell procedure provides robust control of Type I error under heteroscedasticity and unequal sample sizes.
Table 3.
Mean fruit production (±SE) per tree (kg tree−1) by year, orchard, and fertilization treatment. Within each year and orchard, different letters indicate significant differences among fertilization treatments according to Tukey’s HSD test (p < 0.05). Comparisons across years or orchards are not implied.
Effect sizes were reported as partial eta squared (η2p) to quantify the magnitude of main and interaction effects. Effect size magnitude was interpreted using partial eta squared (η2p), with values of approximately 0.01, 0.06, and ≥0.14 indicating small, moderate, and large effects, respectively.
To reduce redundancy among the 25 PolyPen-derived vegetation indices, Principal Component Analysis (PCA) was performed separately for spring and summer datasets. Sampling adequacy was evaluated using the Kaiser–Meyer–Olkin (KMO) test, and inter-variable correlations were assessed using Bartlett’s test of sphericity. Components with eigenvalues greater than 1 were retained, and promax rotation was applied. Scores of the retained rotated components (RCs) were subsequently analyzed using three-way ANOVA (Year × Orchard × Treatment), applying Welch’s ANOVA and Games–Howell post hoc tests when variance homogeneity was violated.
3. Results
3.1. Meteorological Conditions During the Study Period
Meteorological conditions varied markedly among years and orchards, reflecting both interannual climatic variability and site-specific environmental gradients, particularly associated with distance from the Atlantic coast (Figure 4 and Figure 5). To capture seasonal dynamics relevant to apple tree phenology and physiology, climatic data were analyzed on a quarterly basis (Q1–Q4).
Figure 4.
Quarterly precipitation (bars) and reference evapotranspiration (ET0; lines) at the three experimental orchards (CT, FR, and CAR) during 2023, 2024, and 2025. Bars represent total precipitation accumulated per quarter, and lines represent mean quarterly ET0. Data are presented by quarter (Q1–Q4).
Figure 5.
Quarterly means air temperature and relative humidity recorded at the three experimental orchards (CT, FR, and CAR) during 2023, 2024, and 2025. Solid lines represent mean air temperature, dashed lines represent relative humidity, and line colors correspond to the different orchards (CT, FR, and CAR). Data are presented by quarter (Q1–Q4).
At Campotec (CT), precipitation followed a pronounced seasonal pattern, with wetter conditions during Q1 and Q4 and dry springs and summers (Q2–Q3). This inland site exhibited greater thermal amplitude, with mean air temperature increasing from Q1 to Q3 and summer maxima approaching 27–28 °C, resulting in elevated reference evapotranspiration (ET0) during the warmest quarters.
The Frubaça (FR) orchard showed intermediate climatic characteristics. Precipitation was more variable than at CT, with occasional summer rainfall events, particularly in 2023. Summer air temperatures were slightly higher on average than at CT, while relative humidity declined during Q2–Q3, leading to consistently high summer ET0.
In contrast, CARSAG (CAR) displayed climatic features typical of a coastal environment, characterized by milder temperatures, reduced thermal amplitude, and persistently higher wind speeds. Relative humidity remained higher and more stable throughout the year, and the combined influence of maritime air masses moderated temperature extremes and shaped a distinct evaporative regime compared with the more inland orchards.
Overall, the quarterly analysis revealed a clear spatial climatic gradient, ranging from a more continental inland site (CT), through an intermediate environment (FR), to a maritime-influenced coastal site (CAR). These contrasting environmental conditions provide a robust framework for interpreting orchard-specific physiological, biometric, and yield responses presented in subsequent sections.
3.2. Physiological Parameters
3.2.1. Specific Leaf Area
- (a)
- Spring
SLA measured in spring differed markedly among years and orchards (Figure 6). In 2023, the highest SLA values were observed at CT, whereas CAR consistently exhibited lower values across all fertilization treatments, with FR showing intermediate responses. A generalized reduction in SLA occurred in 2024 across all orchards, followed by a pronounced increase in 2025, particularly at CT, where the highest SLA values were recorded. These patterns indicate a dominant influence of interannual climatic variability and orchard-specific conditions on spring SLA, with fertilization treatments playing a secondary and context-dependent role.
Figure 6.
Mean SLA (±SE) across orchards and fertilization treatments in spring over 2023–2025.
Three-way ANOVA revealed significant main effects of Year and Orchard on spring SLA, whereas Treatment did not show a significant main effect when considered independently (Appendix A.1, Table A1). However, significant interaction terms—particularly Year × Orchard and higher-order interactions involving Treatment—indicated that SLA responses to fertilization treatments were contingent on orchard-specific conditions and interannual climatic variability.
- (b)
- Summer
A similar pattern was observed for SLA measured in summer (Figure 7). SLA values varied significantly among years and orchards, with CT consistently presenting higher values and CAR lower values, while FR remained intermediate. SLA increased markedly in 2025 across all orchards, with the highest values recorded at CT, particularly under treatments M2–M4.
Figure 7.
Mean SLA (±SE) across orchards and fertilization treatments in summer over 2023–2025.
Three-way ANOVA confirmed significant effects of Year and Orchard on summer SLA, while Treatment showed no consistent main effect (Appendix A.1, Table A1). Higher-order interactions revealed that treatment-related differences emerged only under specific orchard–year combinations, reinforcing the secondary and context-dependent role of fertilization modality relative to dominant climatic and site effects. However, M3 consistently exhibited higher SLA values in CT across all analyzed years and in CAR in 2025, while M4 showed higher SLA values in CT and FR in 2025, indicating that treatments based on pig slurry application rather than mineral fertilization were associated with more favorable SLA values.
3.2.2. Chlorophyll Content Index
- (a)
- Spring
CCI measured in spring differed significantly among orchards and years (Figure 8). FR consistently exhibited the highest CCI values, CT the lowest, and CAR intermediate values. Across years, a general decline in CCI was observed at CT in 2025, whereas FR maintained relatively stable and high CCI values throughout the study period.
Figure 8.
Mean CCI (±SE) across orchards and fertilization treatments in spring over 2023–2025.
Three-way ANOVA indicated significant effects of Year and Orchard on spring CCI, while Treatment did not show a significant main effect (Appendix A.1, Table A2). Significant interaction terms, particularly the Year × Orchard interaction, indicated that interannual CCI dynamics differed among orchards, whereas treatment-related differences were expressed only under specific orchard conditions.
- (b)
- Summer
A comparable spatial pattern was observed for CCI measured in summer (Figure 9), with FR presenting the highest values, CT the lowest, and CAR intermediate responses. Interannual variation was evident, with a marked reduction in CCI at CT in 2025, while CAR and FR showed year-dependent trends.
Figure 9.
Mean CCI (±SE) across orchards and fertilization treatments in summer over 2023–2025.
Three-way ANOVA confirmed significant main effects of Year and Orchard on summer CCI, whereas Treatment again showed no consistent main effect (Appendix A.1, Table A2). Treatment effects emerged only through a weak Orchard × Treatment interaction, indicating a limited and context-dependent influence of fertilization treatments relative to dominant site and climatic effects. CCI values were consistently higher in CT across all years in M3 and M4, suggesting enhanced leaf chlorophyll content and, consequently, improved photosynthetic capacity under this treatment.
3.2.3. Measurement of Gas Exchange Parameters
- (a)
- Spring
In spring, gas exchange parameters were predominantly influenced by interannual variability and orchard-specific conditions, with fertilization effects being secondary and parameter dependent (Appendix A.2, Table A3).
Intercellular CO2 concentration (Cᵢ) and transpiration rate (E) showed strong and significant effects of Year and Orchard, together with pronounced Year × Orchard interactions, indicating contrasting interannual trajectories among orchards. These patterns reflect the dominant role of environmental conditions in shaping leaf-level gas exchange during spring. Minor Orchard × Treatment and Orchard × Treatment × Year interactions were also detected for E; however, their effect sizes were small to moderate, indicating a limited and context-dependent influence of fertilization on spring transpiration dynamics.
Stomatal conductance (gs) was significantly affected by Treatment, Year, and Orchard. However, treatment-related effects were small compared with the influence of environmental drivers, indicating a secondary and context-dependent role of fertilization.
Net photosynthetic rate (An) was significantly influenced by Orchard and Treatment, with a strong Year × Orchard interaction, indicating that interannual variability modulated orchard-specific photosynthetic performance, while fertilization effects remained comparatively limited (Figure 10). The consistently lower performance of M4 across the majority of years and orchards warrants particular attention.
Figure 10.
Mean net photosynthetic rate (An ± SE) across orchards and fertilization treatments in spring over 2023–2025.
Overall, spring gas exchange dynamics were primarily environmentally driven, with fertilization effects acting as secondary modifiers under specific orchard–year conditions.
- (b)
- Summer
During summer, gas exchange parameters exhibited strong and coherent responses to temporal and spatial factors, with Year and Orchard emerging as the dominant sources of variability across all measured variables (Appendix A.2, Table A3).
Cᵢ varied significantly among years and orchards, with a strong Year × Orchard interaction, reflecting the combined influence of interannual climatic variability and site-specific conditions on internal CO2 dynamics.
E was strongly controlled by Year, together with a pronounced Year × Orchard interaction. In addition, Treatment and Year × Treatment effects were detected, indicating that fertilization modulated transpiration responses depending on climatic conditions. These results highlight the dominant role of climate and local microclimate in driving evaporative demand during summer.
gs was significantly affected by Year, Orchard, and Treatment, with strong Year × Orchard interactions and weaker Orchard × Treatment effects, indicating that stomatal regulation was primarily structured by interannual and orchard-related environmental variability, with a secondary but statistically detectable modulation by fertilization treatment.
An was mainly controlled by Year and Orchard, with additional significant effects of Treatment and Orchard × Treatment, indicating that fertilization influenced photosynthesis in an orchard-dependent manner during summer (Figure 11).
Figure 11.
Mean net photosynthetic rate (An ± SE) across orchards and fertilization treatments in summer over 2023–2025.
Collectively, summer gas exchange responses confirmed the dominant role of environmental drivers, while fertilization effects were secondary and expressed mainly through context-dependent interactions, without consistent treatment-specific trends across orchards or years. Lower values were observed for M2 and M4 in CT in 2023 and 2025, with M4 consistently showing reduced values in CAR in 2024 and 2025.
3.2.4. Water-Use Efficiency
Leaf-level WUE exhibited strong interannual and orchard-level variability (Appendix A.2, Table A4). Year exerted the strongest influence on WUE, while Orchard also contributed significantly.
In contrast, fertilization treatments did not show a significant main effect, and its associated effect size was negligible. Interaction terms indicated that treatment-related differences in WUE emerged only under specific site conditions.
Overall, WUE was primarily structured by climatic variability and orchard-specific environmental drivers.
3.2.5. Measurement of Leaf Reflectance Indices
- (a)
- Spring
In spring, PCA of leaf reflectance indices showed very good sampling adequacy (KMO = 0.86). Four rotated components (RC1–RC4) with eigenvalues >1 were retained, explaining 89.1% of the total variance (Appendix A.3, Table A6). Promax rotation was applied.
RC1, representing overall canopy greenness and structural vigor (e.g., NDVI, RDVI, OSAVI, MCARI1), was strongly driven by interannual variability and orchard-specific conditions. Orchard-related differences were minor in 2023 but became increasingly pronounced in 2024 and 2025, indicating increasing differentiation among orchards over time. Fertilization treatments did not exert a consistent main effect, emerging only under specific orchard–year combinations. To visually illustrate the dominant spring spectral gradient captured by RC1, RDVI—the index with the highest loading in this component—was selected as a representative example (Figure 12).
Figure 12.
Mean RDVI (±SE) across orchards and years in spring over 2023–2025, calculated from individual observations and pooled across fertilization treatments. RDVI was selected as a representative index of RC1 based on its highest loading in the spring PCA.
RC2, dominated by pigment ratio and structural indices, reflected strong environmental gradients associated with both year and orchard. This component was largely independent of fertilization treatments, indicating that spring pigment balance was primarily regulated by climatic variability and site characteristics rather than nutrient inputs.
RC3 captured stress- and efficiency-related spectral responses and was overwhelmingly structured by interannual variability, with orchard conditions modulating the magnitude of responses. While orchard-level differences were consistent, fertilization effects were expressed only through interactions, highlighting the context-dependent nature of physiological stress responses.
RC4, associated mainly with anthocyanin-related indices, explained a smaller proportion of variance, and reflected secondary pigment dynamics. Its variability was driven predominantly by year and orchard, with treatment effects remaining marginal and restricted to interaction terms.
Overall, spring leaf reflectance variability was dominated by interannual climatic forcing, with orchard-specific conditions acting as secondary modulators. Fertilization effects were limited and expressed primarily through context-dependent interactions rather than stable main effects.
- (b)
- Summer
In summer, PCA of leaf reflectance indices showed very good sampling adequacy (KMO = 0.85). Five rotated components (RC1–RC5) were retained, together explaining 87.9% of the total variance (Appendix A.3, Table A7). As in spring, Promax rotation was applied.
RC1, integrating indices related to canopy greenness, structure, and pigment balance (e.g., SIPI, TCARI, NDVI, OSAVI), was strongly controlled by interannual variability and orchard-specific conditions, indicating pronounced temporal and spatial variability in summer spectral responses. Treatment effects were not expressed as consistent main effects but emerged through interactions under specific environmental contexts. To visually illustrate the dominant summer spectral gradient captured by RC1, SIPI was selected as a representative example (Figure 13).
Figure 13.
Mean SIPI (±SE) across orchards and years in summer over 2023–2025, calculated from individual observations and pooled across fertilization treatments. SIPI was selected as a representative index of RC1 based on its highest loading in the summer PCA.
RC2 reflected broad temporal and spatial gradients in canopy spectral behavior, with strong differentiation among years and orchards and negligible sensitivity to fertilization treatments.
RC3 exhibited orchard-dependent interannual trajectories, with fertilization effects emerging only through interactions with year and orchard, indicating that stress-related spectral responses during summer were highly context dependent.
RC4 was overwhelmingly dominated by interannual variability, with year explaining the largest proportion of variance among all components. Orchard and treatment effects were secondary and manifested mainly through higher-order interactions.
RC5 captured finer-scale spectral variability and showed significant effects of year, orchard, and treatment, together with multiple interaction terms, reflecting subtle but structured differences in leaf reflectance associated with specific orchard–year–treatment combinations.
Overall, summer leaf reflectance variability was primarily governed by interannual climatic conditions and orchard location, while fertilization effects remained secondary and highly context dependent.
3.2.6. Chlorophyll Fluorescence Parameters
- (a)
- Spring
In spring, chlorophyll fluorescence parameters were primarily driven by interannual variability and orchard-specific conditions, whereas management treatments exerted limited influence (Appendix A.2, Table A5; Figure 14).
Figure 14.
Mean maximum quantum efficiency of PSII (Fv/Fm; ± SE) across orchards and years in spring over 2023–2025, calculated from individual observations and pooled across fertilization treatments.
The maximum quantum efficiency of PSII (Fv/Fm) showed significant effects of Year and Orchard, with higher values in 2025 compared with 2023–2024 and consistently lower values in the coastal orchard (CAR). A significant Year × Orchard interaction indicated that interannual trajectories differed among orchards, with the strongest increases observed at FR.
The performance index on an absorption basis (PIabs) was significantly affected by Year, Orchard, and Treatment, as well as by a Year × Orchard interaction. PIabs showed a marked decline in 2025, particularly in inland orchards, while treatment effects were limited and mainly driven by contrasts between M1 and M4.
Energy flux parameters at the reaction center level (ABS/RC and DIo/RC) were significantly influenced by Year and Orchard, with higher ABS/RC and lower DIo/RC values in 2025, indicating seasonal adjustments in energy absorption and dissipation. Significant Year × Orchard interactions further highlight orchard-dependent interannual responses. No consistent main effects of treatments were detected for these parameters.
- (b)
- Summer
During summer, chlorophyll fluorescence responses were dominated by interannual variability, with orchard-specific conditions exerting secondary context-dependent influences, while fertilization treatment effects remained small and context dependent (Appendix A.2, Table A5; Figure 15).
Figure 15.
Mean maximum quantum efficiency of PSII (Fv/Fm; ± SE) across orchards and years in summer over 2023–2025, calculated from individual observations and pooled across fertilization treatments.
Fv/Fm exhibited strong interannual variability, with a pronounced reduction in 2024 followed by partial recovery in 2025, consistent across orchards. Orchard-related differences were moderate, and fertilization treatment effects were small and expressed in a context-dependent manner, mainly associated with contrasts between M1 and M4. A significant Year × Orchard interaction indicated site-specific seasonal dynamics in PSII efficiency.
PIabs was overwhelmingly controlled by Year, accounting for the largest proportion of variance, with lower values in 2024 and partial recovery in 2025. Orchard and treatment effects were statistically significant but small, and no higher-order interactions involving treatments were detected.
Energy flux parameters TRo/RC and ABS/RC showed strong Year effects, with progressive decreases from 2023 to 2025, consistent with increasing summer stress. Orchard effects were weaker but significant, whereas treatment effects were minor and mainly reflected lower ABS/RC values under M4. Interaction effects were limited and did not show consistent patterns across sites.
Overall, PEA-derived chlorophyll fluorescence parameters indicate that seasonal and interannual environmental variability, together with orchard-specific conditions, were the primary drivers of PSII performance during summer, while fertilization treatment effects were secondary and largely expressed through specific parameters or isolated interactions.
3.3. Biometric Parameters
Tree growth parameters were primarily governed by interannual variability and orchard-specific conditions, whereas treatment exerted a minor or negligible influence (Appendix A.4, Table A9).
Canopy volumetric growth was overwhelmingly affected by Year, which explained the largest proportion of variance (η2p = 0.869), indicating that interannual climatic variability was the dominant driver of vegetative development. Volumetric growth was significantly higher in 2025 compared with both 2023 and 2024, while no differences were observed between 2023 and 2024. Orchard location also exerted a strong effect (η2p = 0.327), with CT showing consistently higher volumetric increments than CAR and FR, reflecting more favorable site conditions for vegetative expansion.
In contrast, treatment showed only a small effect on canopy volumetry (η2p = 0.031), indicating that management-related differences were minor relative to the dominant influence of year and orchard. Although several higher-order interactions reached statistical significance, their associated effect sizes were small and did not indicate consistent biological trends; therefore, these effects were not examined in further detail.
The increment in trunk cross-sectional area (ΔTCSA) followed a similar pattern. Year exerted a strong influence (η2p = 0.599), confirming a pronounced interannual growth effect consistent with canopy volumetry results, with trunk growth being significantly greater in 2025. Orchard also had a strong effect (η2p = 0.481), with CT exhibiting higher increments than CAR and FR. However, ΔTCSA was interpreted with caution for the final year of the study, as tree replacement events disrupted the continuity of trunk growth measurements, and this variable was therefore not used for graphical representation.
3.4. Fruit Production and Mean Fruit Weight
Fruit production was assessed at harvest on the same tagged trees used for biometric and physiological measurements. At each orchard, fruits from tagged trees within each fertilization treatment were harvested according to the commercial harvest schedule, either in a single harvest or in successive harvest rounds when applicable. Fruits collected from the tagged trees were kept separate from the remaining orchard production.
Fruit production was first evaluated on a per-tree basis (kg tree−1), using total fruit fresh weight recorded for each tagged tree (Table 3). This approach allowed differences in fruit load among treatments, orchards, and years to be assessed, while avoiding extrapolation to yield per unit area due to differences in planting density, orchard structure, and tree replacement among sites.
Across the three growing seasons, fruit production per tree varied markedly among years and orchards, reflecting strong interannual climatic variability and orchard-specific conditions. Higher per-tree production was generally observed in CT, whereas CAR consistently exhibited lower values, reflecting differences in orchard structure and tree vigor. Interannual variability was also evident, with production levels differing substantially between years across all orchards.
In addition to these dominant effects, fertilization treatment exerted a statistically significant influence on fruit production per tree in the global analysis (Appendix A.5, Table A10), although with a markedly smaller effect size than Year and Orchard. Post hoc comparisons derived from the overall model indicated a higher mean fruit production per tree under treatment M3 relative to M2 and M4, and a positive trend compared to the fully mineral treatment (M1). However, when examined within individual year × orchard combinations (Table 3), treatment effects were generally weak or absent, with significant differences detected only in specific site–year contexts. The presence of a significant Treatment × Year × Orchard interaction further confirms that fertilization effects were context dependent, varying according to site-specific and interannual conditions rather than following a consistent ranking across orchards.
Following the analysis of fruit production per tree, mean fruit weight was examined as a complementary indicator of fruit size and potential market valorization, acknowledging its strong dependence on crop load and tree-level functional performance.
Mean fruit weight was significantly affected by Year, Orchard, and Treatment (Figure 16; Appendix A.5, Table A11), with Year explaining the largest proportion of variance (η2p = 0.242), indicating strong interannual control on fruit size. Mean fruit weight increased from 2023 to 2024 and declined markedly in 2025, a pattern consistently observed across all orchards.
Figure 16.
Mean fruit weight (g) as affected by fertilization treatment (M1–M4) across three growing seasons (2023–2025) in the three experimental orchards: CARSAG (CAR), Campotec (CT), and Frubaça (FR).
Orchard location also exerted a significant effect (η2p = 0.084), with fruits harvested in CAR consistently showing lower mean weights than those from CT and FR. Treatment had a statistically significant but relatively small effect (η2p = 0.037), with M1 tending to produce lighter fruits relative to M2 and M4. A significant Treatment × Orchard interaction (η2p = 0.084) indicated that fertilization effects on fruit size were orchard dependent, while the significant Year × Orchard interaction (η2p = 0.123) reflected non-uniform interannual variability across sites. In contrast, interactions involving Treatment × Year and the three-way interaction were not significant, indicating that treatment effects on fruit size were relatively stable across years.
Overall, fruit production per tree was primarily controlled by interannual climatic variability and orchard-specific conditions, while fertilization treatment exerted a statistically significant but smaller effect. Treatment-related differences were mainly expressed under specific orchard–year combinations, with M3 generally showing higher fruit production per tree relative to M2 and M4. Mean fruit weight reflected these differences in fruit load, confirming its role as a complementary indicator of fruit size and potential market value rather than overall productivity.
4. Discussion
4.1. Dominant Role of Interannual Climatic Variability on Leaf Functional Traits and Physiology
Across all physiological, spectral, and biometric variables, interannual climatic variability emerged as the dominant driver of apple tree responses, consistently outweighing the effects of fertilization treatments. This pattern was particularly evident for SLA, gas exchange parameters, chlorophyll fluorescence, and leaf reflectance indices, in both spring and summer measurements.
Specific leaf area responded strongly to Year and Orchard in both seasons. In spring, SLA was significantly affected by year (F = 42.90, p < 0.001, η2p = 0.326) and orchard (F = 60.08, p < 0.001, η2p = 0.404), while treatment had no significant main effect. A similar pattern was observed in summer, with large effects of year (F = 27.44, p < 0.001, η2p = 0.258) and orchard (F = 54.69, p < 0.001, η2p = 0.439). The marked increase in SLA observed in 2025, particularly at the inland orchard (CT), coincided with higher spring–summer temperatures and radiation combined with pronounced summer drought, suggesting the development of thinner, more expansive leaves under conditions favoring rapid canopy deployment despite increasing atmospheric demand [40,41].
However, when comparisons are made within the same orchard, agronomically relevant treatment-related patterns emerge. Treatment M3 consistently exhibited higher SLA values in CT across all analyzed years and in CAR in 2025, while M4 also showed higher SLA values in CT and FR in 2025. These results indicate that fertilization strategies based on pig slurry, alone or combined with composted manure, were able to sustain or even enhance leaf structural development relative to the fully mineral treatment.
In addition, CCI values were consistently higher in CT across all years under M3 and M4, reflecting increased leaf chlorophyll content and suggesting that organic-based fertilization strategies maintained adequate nitrogen availability to support photosynthetic pigment synthesis and leaf functional performance.
Gas exchange parameters measured with IRGA further confirmed the predominance of environmental control. Intercellular CO2 concentration (cᵢ) and transpiration rate (E) showed large and highly significant effects of both year (cᵢ: F = 57.57, η2p = 0.144; E: F = 64.30, η2p = 0.158) and orchard (cᵢ: F = 114.78, η2p = 0.251; E: F = 121.40, η2p = 0.262), with strong year × orchard interactions. These results indicate that stomatal behavior and carbon assimilation were primarily regulated by atmospheric demand and site-specific microclimatic conditions rather than by fertilization regime [42,43].
Within orchards, treatment M3 consistently sustained net photosynthetic rates comparable to the fully mineral treatment, indicating that partial substitution of mineral fertilization did not constrain carbon assimilation. In contrast, the lower An values occasionally observed under M4—particularly in CT during 2023 and 2025 and in CAR during 2024 and 2025—suggest that stronger reductions in mineral fertilization may approach a threshold beyond which nitrogen availability becomes limiting under certain site and climatic conditions. Importantly, these reductions were context dependent and did not translate into generalized physiological stress, as indicated by stable Fv/Fm values. Nitrogen is a major constituent of chlorophyll and plays a central role in the formation of photosynthetic pigments. Deficiency in nitrogen has been shown to decrease chlorophyll content and CO2 assimilation in leaves, ultimately impairing light harvesting and photosynthetic electron transport efficiency under N-limiting conditions [44].
Chlorophyll fluorescence parameters derived from the OJIP transient showed a comparable structure. In summer, year explained a very large proportion of variance for PIabs (F = 117.62, p < 0.001, η2p = 0.421), TRo/RC (F = 104.63, η2p = 0.392), and ABS/RC (F = 104.61, η2p = 0.392). Despite this strong seasonal forcing, Fv/Fm values remained within non-stressful ranges, indicating functional acclimation of PSII rather than chronic photoinhibition, even under hot and dry summer conditions [45,46,47].
4.2. Orchard-Specific Modulation by Soil Properties and Microclimate
Although climate was the primary driver, orchard location consistently modulated the magnitude and direction of physiological responses. The inland orchard CT, characterized by higher thermal amplitude, higher solar radiation, and a sandy clay loam soil with greater water and nutrient retention, showed higher SLA, greater canopy development, and stronger vegetative growth. This was reflected in very large effects of year (ΔVolumetry: F = 1666.41, η2p = 0.869) and orchard (F = 122.17, η2p = 0.327) on canopy growth.
In contrast, the coastal orchard CAR, under persistent wind exposure, higher relative humidity, and moderated temperatures, exhibited more conservative physiological behavior, including lower transpiration rates and distinct chlorophyll fluorescence and reflectance signatures. FR, with loamy sand soil and intermediate climatic exposure, consistently displayed intermediate responses across most variables. These orchard-level contrasts highlight the importance of soil texture and microclimate as filters through which interannual climatic variability is expressed at the tree level. It should be noted that the orchard factor integrates not only soil texture and microclimatic conditions, but also differences in clone, tree age, and planting density, which should be considered when interpreting site-specific effects [48,49,50,51,52].
In addition to abiotic constraints, orchard-specific differences in biotic stress likely contributed to the observed patterns. In particular, the higher incidence of fire blight (Erwinia amylovora) symptoms observed at the CAR orchard represents an additional source of stress that may have constrained vegetative vigor and carbon allocation processes. Although disease incidence was not quantitatively assessed, its uneven spatial occurrence likely acted as an additional site-specific stressor and should therefore be considered a confounding but ecologically realistic factor. This biotic pressure likely exacerbated limitations on fruit growth at this site. However, lower mean fruit weight at CAR should be interpreted in the context of its generally lower fruit production per tree, indicating that reduced fruit size reflects the combined influence of biotic stress, orchard structure, and fruit load rather than stress effects alone. Although disease severity was not quantitatively assessed, its uneven spatial occurrence should be considered when interpreting orchard effects and year × orchard interactions [53,54,55].
4.3. Fertilization Treatments: Maintaining Productivity and Physiological Stability Under Reduced Mineral Inputs
Although fertilization treatments exerted smaller effects than interannual climatic variability and orchard-specific conditions, their agronomic relevance becomes evident when comparisons are conducted within the same orchard. Under these conditions, fertilization strategies M2 and M3 consistently maintained physiological performance, vegetative growth, and fruit development at levels comparable to the fully mineral treatment, demonstrating that partial substitution of mineral fertilizers by organic amendments can sustain orchard performance without physiological or productive penalties.
Among the tested strategies, M3 showed the most consistent responses across orchards and years, supporting the hypothesis that pig slurry provides a more readily available nutrient supply than solid organic amendments. This faster nutrient availability likely contributed to the maintenance of leaf physiological functioning and fruit development under reduced mineral fertilization, in line with previous observations from long-term orchard trials [56,57,58,59,60].
Leaf-level water-use efficiency was primarily structured by year and orchard, while treatments showed no significant main effect. This indicates that organic-based fertilization strategies did not compromise the balance between carbon assimilation and water loss, even under years of higher evaporative demand, reinforcing their suitability under Mediterranean climatic conditions [61,62,63]. Where treatment-related differences occurred, they were expressed mainly under specific orchard–year combinations.
Mean fruit weight provided an integrative perspective linking physiological performance, vegetative growth, and environmental constraints, particularly when interpreted in conjunction with fruit production per tree. Given that fruit size is strongly influenced by crop load, variations in mean fruit weight largely reflect the combined effects of assimilate availability and sink competition rather than productivity per se.
From a grower-oriented perspective, the absence of systematic reductions in fruit production per tree under M2 and M3 is particularly relevant. Despite interannual variability, these treatments maintained fruit load and mean fruit weight comparable to the fully mineral strategy, indicating that partial mineral substitution does not compromise economically relevant yield components. This finding is consistent with recent evidence showing that fertilization management influences not only fruit size but also quality-related traits and volatile profiles in ‘Gala’ apples, without compromising market-relevant attributes under reduced mineral inputs [64].
In addition to maintaining fruit size, fruit production per tree provides a complementary functional perspective on fertilization effects. Despite the dominant influence of year and orchard, fertilization treatment exerted a statistically significant effect on fruit production per tree, with M3 consistently showing higher values than M2 and M4 and a positive trend relative to full mineral fertilization. Importantly, this increased fruit load under M3 was not associated with reductions in photosynthetic performance, chlorophyll status, or PSII efficiency, indicating that higher reproductive output did not result from physiological overexertion. Instead, these results suggest an improved balance between carbon assimilation and sink demand at the tree level, reinforcing the agronomic relevance of M3 as a strategy that sustains both physiological functioning and productive expression under reduced mineral inputs.
Orchard-specific patterns further modulated these responses. Fruits harvested at CAR consistently exhibited lower mean weights than those from CT and FR, reflecting the combined influence of coastal microclimate, soil characteristics, and higher biotic stress pressure, in combination with its generally lower fruit production per tree. Treatments exerted a statistically significant but small effect on mean fruit weight, with reduced mineral inputs combined with organic amendments maintaining fruit size at levels comparable to the fully mineral treatment. Treatment effects were dependent on orchard conditions, reinforcing the context-dependent nature of management responses [65].
Finally, although the most restrictive strategy (M4) occasionally showed lower physiological performance under specific orchard–year combinations, these effects were not systematic and did not translate into generalized yield penalties. This suggests that M4 represents a practical lower boundary for mineral input reduction, highlighting the importance of site-adapted fertilization strategies rather than uniform prescriptions.
4.4. Soil Organic Matter Dynamics and Delayed Treatment Effects
The generally weak main effects of treatments are consistent with the delayed and cumulative nature of organic amendments. Composted manure and slurry require time for mineralization, microbial processing, and incorporation into soil aggregates before translating into detectable changes in plant physiology [66,67,68,69]. This interpretation is supported by the recurrent significance of higher-order interactions involving year and orchard, particularly for sensitive parameters such as gs, An, and several PCA-derived reflectance components.
Soil texture likely modulated the expression of these delayed effects. In CT, the higher intrinsic water-holding capacity may buffer short-term stress but also limit the immediate physiological impact of additional organic inputs. In contrast, the coarser-textured soils of FR and CAR may benefit more progressively from organic amendments through improvements in soil structure and moisture buffering, particularly under dry summer conditions [70,71].
The permanent living mulch present across all orchards likely contributed to baseline improvements in soil moisture conservation and surface microclimate, acting as a stabilizing background factor rather than a primary source of treatment differentiation [9,72]. This delayed-response framework further supports the observed stability of M2 and M3, which appear to balance short-term nutrient availability with longer-term improvements in soil functioning.
4.5. Implications for Sustainable Orchard Management
Overall, this study demonstrates that apple tree physiological performance, vegetative growth, and fruit growth were primarily governed by interannual climatic variability and orchard-specific abiotic and biotic conditions, while fertilization treatments exerted a secondary and context-dependent influence. Across all measured variables—specific leaf area, gas exchange, chlorophyll fluorescence, leaf reflectance indices, biometric growth, and mean fruit weight—Year and Orchard consistently explained a substantially larger proportion of variability than Treatment strategy [73].
From a management perspective, these results support the feasibility of reducing synthetic fertilizer inputs while maintaining physiological stability and fruit size, provided that soil characteristics, local climate, and orchard-specific stress factors are taken into account. Under scenarios of increasing climatic variability, strategies that enhance soil functioning and system resilience—rather than maximizing short-term inputs—are likely to be more effective for sustaining apple orchard performance [1,52].
To facilitate interpretation across the large number of measured variables, a synthesis of dominant drivers based on effect size magnitude is provided in Table 4. Across all functional domains, interannual climatic variability and orchard-specific conditions consistently outweighed fertilization treatment effects, which emerged mainly through higher-order interactions [74,75].
Table 4.
Relative importance of Year, Orchard, Treatment, and their interactions across functional domains.
5. Conclusions
This study provides clear evidence that apple tree performance is primarily driven by interannual climatic variability and orchard-specific conditions, while fertilization treatments play a secondary and context-dependent role. Across physiological, spectral, biometric, and fruit growth–related variables, environmental forcing consistently outweighed management effects, highlighting the central role of climate–soil interactions in regulating tree functioning in Mediterranean apple orchards.
Crucially, fertilization strategies integrating organic amendments with reduced mineral inputs—particularly M3 and, to a slightly lesser extent, M2—maintained physiological performance, vegetative growth, tree production and fruit size at levels comparable to full mineral fertilization. These results provide robust field-based evidence that partial replacement of mineral fertilizers by organic inputs is agronomically viable in commercial apple orchards, without inducing physiological stress or yield penalties.
While the most restrictive strategy (M4) occasionally showed reduced photosynthetic performance under specific orchard–year combinations, these effects were not systematic and did not compromise overall tree functioning. This indicates that M4 represents a practical lower boundary for mineral input reduction, emphasizing the importance of site-adapted implementation rather than uniform fertilization prescriptions.
The generally weak main effects of fertilization treatments are consistent with the delayed and cumulative nature of organic amendments, whose benefits depend on progressive mineralization, microbial activity, and improvements in soil structure. The recurrent significance of higher-order interactions involving Year and Orchard underscores the need to interpret fertilization responses within a multi-year and site-adapted framework, particularly under increasing climatic variability.
Several limitations should be acknowledged. The experimental timeframe may not fully capture long-term changes in soil organic matter pools and nutrient cycling associated with organic amendments. In addition, soil biological indicators were not directly assessed, limiting mechanistic insight into microbial-mediated processes underlying delayed treatment responses. Finally, physiological measurements were conducted at the leaf level and may not fully represent whole-canopy or whole-orchard carbon and water dynamics.
Future research should therefore adopt longer-term experimental designs integrating soil biological indicators, continuous soil moisture monitoring, and canopy-scale physiological assessments. Linking leaf-level measurements with remote sensing approaches and ecosystem-scale carbon and water fluxes would further improve understanding of orchard resilience under increasing climatic uncertainty.
Overall, these results support the adoption of site-adapted fertilization strategies that promote the use of organic amendments as partial substitutes for mineral fertilizers, prioritizing soil functioning and long-term system resilience over short-term input maximization, and reinforcing the role of integrated soil and nutrient management in sustainable perennial fruit production systems.
Author Contributions
Conceptualization, M.L.d.S.; methodology, M.G., M.R., M.M., F.M., J.V. and M.L.d.S.; software and validation, M.G., M.R., F.M., S.F., and M.L.d.S.; formal analysis, S.F., M.G., M.R. and M.L.d.S.; investigation, M.G., M.R., F.M., V.A., S.R., P.B., J.V. and M.L.d.S.; resources, M.L.d.S.; data curation, M.G., M.R., S.F., and M.L.d.S.; writing—original draft preparation, S.F.; writing—review and editing, S.F., M.G., M.R., F.M., V.A., S.R., P.B., J.V., M.M., and M.L.d.S.; supervision, M.G., M.R., F.M., J.V. and M.L.d.S.; project administration, M.L.d.S.; funding acquisition, S.F. All authors have read and agreed to the published version of the manuscript.
Funding
This research was funded by the project “R&D + I—Research and Innovation Projects in Partnership-Climate Change Mitigation”, reference PRR-C05-i03-I-000018-LA3.2; LA3.3; LA3.4-“MOPLUS”, within the scope of the Recovery and Resilience Plan (PRR), funded by the European Union—NextGenerationEU. The APC was funded by the same project.
Data Availability Statement
The data supporting the findings of this study are included in the article and its Appendix A. Additional raw data and intermediate calculations are available from the corresponding author upon reasonable request.
Conflicts of Interest
The authors declare no conflicts of interest.
Abbreviations
The following abbreviations are used in this manuscript:
| Acronym | Definition |
| An | Net photosynthetic rate |
| ABS/RC | Absorption flux per PSII reaction center |
| ARI | Anthocyanin Reflectance Index |
| ARI1 | Anthocyanin Reflectance Index 1 |
| ARI2 | Anthocyanin Reflectance Index 2 |
| BB | Budbreak |
| BC | Broadcast application |
| CAR | CARSAG orchard (Alfeizerão) |
| CCI | Chlorophyll Content Index |
| Ci | Intercellular CO2 concentration |
| CRI | Carotenoid Reflectance Index |
| CRI1 | Carotenoid Reflectance Index 1 |
| CRI2 | Carotenoid Reflectance Index 2 |
| CT | Campotec orchard (Acipreste) |
| Ctr1 | Carter stress index 1 |
| Ctr2 | Carter stress index 2 |
| CV (ΔCV) | Canopy volume (annual increment) |
| DIo/RC | Energy dissipation flux per PSII reaction center |
| E | Transpiration rate |
| ET0 | Reference evapotranspiration |
| FGS | Fertigation during the growing season |
| FR | Frubaça orchard (Maiorga) |
| Fv/Fm | Maximum quantum efficiency of PSII |
| G | Green reflectance index |
| GM1 | Gitelson and Merzlyak index 1 |
| GM2 | Gitelson and Merzlyak index 2 |
| GO | Grower organizations |
| gs | Stomatal conductance |
| IM | Immediate mowing |
| INC | Soil incorporation |
| Inorg | Inorganic fertilizer |
| IR | Inter-row |
| IRGA | Infrared Gas Analyzer |
| KMO | Kaiser–Meyer–Olkin measure of sampling adequacy |
| Lic1 | Leaf Chlorophyll Index 1 |
| Lic2 | Leaf Chlorophyll Index 2 |
| M | Composted cattle manure |
| M1–M4 | Fertilization treatments |
| MCARI | Modified Chlorophyll Absorption Ratio Index |
| MCARI1 | Modified Chlorophyll Absorption Ratio Index 1 |
| NDVI | Normalized Difference Vegetation Index |
| NPCI | Normalized Pigment Chlorophyll Index |
| NPQI | Normalized Phaeophytinization Index |
| OSAVI | Optimized Soil-Adjusted Vegetation Index |
| PAR | Photosynthetically Active Radiation |
| PCA | Principal Component Analysis |
| PEA | Plant Efficiency Analyzer |
| PH | Post-harvest |
| PIabs | Performance index on absorption basis |
| PRI | Photochemical Reflectance Index |
| RC | Rotated component |
| RDVI | Renormalized Difference Vegetation Index |
| R | Tree row |
| S | Pig slurry |
| SIPI | Structure-Insensitive Pigment Index |
| SLA | Specific Leaf Area |
| SPRI | Structure-Insensitive Pigment Index |
| TCARI | Transformed Chlorophyll Absorption in Reflectance Index |
| TCSA | Trunk cross-sectional area (annual increment) |
| TRo/RC | Electron transport flux per PSII reaction center |
| TVI | Triangular Vegetation Index |
| WUE | Water-use efficiency |
| ZMI | Zarco–Tejada and Miller Index |
Appendix A
Appendix A.1. Leaf Structural Traits
Table A1.
Three-way ANOVA results for specific leaf area (SLA) measured in spring and summer.
Table A2.
Three-way ANOVA results for chlorophyll content index (CCI) measured in spring and summer.
Appendix A.2. Gas Exchange, Water-Use Efficiency and Chlorophyll Fluorescence
For chlorophyll fluorescence parameters, full factorial ANOVA models were evaluated. For clarity, Table A3 and Table A5 reports only the statistically relevant main effects supporting the interpretations discussed in the main text.
Table A3.
Three-way ANOVA results for gas exchange parameters measured in spring and summer.
Table A4.
Three-way ANOVA results for water-use efficiency (WUE = A/E).
Table A5.
Three-way ANOVA results for chlorophyll fluorescence parameters measured in spring and summer.
Appendix A.3. Leaf Reflectance Indices
For the ANOVA performed on PCA response components (RCs), full factorial models including all main effects and interactions were evaluated. For clarity, Table A8 reports only the statistically relevant effects supporting the interpretations discussed in the main text.
Table A6.
Rotated component loadings from PCA of vegetation indices (spring). Only loadings ≥ 0.40 are shown; strong loadings (≥0.70) are bold. Promax rotation applied.
Table A7.
Rotated component loadings from PCA of vegetation indices (summer). Only loadings ≥ 0.40 are shown; strong loadings (≥0.70) are in bold. Promax rotation applied.
Table A8.
Three-way ANOVA results for PCA response components (RCs) measured in spring and summer.
Appendix A.4. Tree Growth Parameters
Table A9.
Three-way ANOVA results for tree growth parameters.
Appendix A.5. Yield Components
Table A10.
Three-way ANOVA results for fruit production per tree (kg tree−1).
Table A11.
Three-way ANOVA results for mean fruit weight (g).
References
- Baima, L.; Nari, L.; Nari, D.; Bossolasco, A.; Blanc, S.; Brun, F. Sustainability Analysis of Apple Orchards: Integrating Environmental and Economic Perspectives. Heliyon 2024, 10, e38397. [Google Scholar] [CrossRef] [Scilit]
- AGROGES—Sociedade de Estudos e Projectos de Gestão, Lda. O Impacto da Atual Escalada de Preços dos Fatores de Produção: O Caso Particular dos Fertilizantes. Artigo Técnico; Julho 2022. Available online: https://www.agroges.pt/wp-content/uploads/2022/07/202207-Agroges-ArtigoTecnico-01.pdf (accessed on 25 November 2025). (In Portuguese)
- Khan, M.; Mobin, M.; Zahid, A.; Alamri, S. Fertilizers and Their Contaminants in Soils, Surface and Groundwater. In Environmental Pollution; Elsevier: Amsterdam, The Netherlands, 2020. [Google Scholar] [CrossRef] [Scilit]
- Nuruzzaman, M.; Bahar, M.M.; Naidu, R. Diffuse Soil Pollution from Agriculture: Impacts and Remediation. Sci. Total Environ. 2025, 962, 178398. [Google Scholar] [CrossRef] [Scilit]
- Ferreira, C.S.S.; Seifollahi-Aghmiuni, S.; Destouni, G.; Ghajarnia, N.; Kalantari, Z. Soil Degradation in the European Mediterranean Region: Processes, Status and Consequences. Sci. Total Environ. 2022, 805, 150106. [Google Scholar] [CrossRef] [Scilit]
- Heyl, K.; Ekardt, F.; Roos, P.; Garske, B. Achieving the Nutrient Reduction Objective of the Farm to Fork Strategy: An Assessment of CAP Subsidies for Precision Fertilization and Sustainable Agricultural Practices in Germany. Front. Sustain. Food Syst. 2023, 7, 1088640. [Google Scholar] [CrossRef] [Scilit]
- Batool, M.; Sarrazin, F.J.; Zhang, X.; Musolff, A.; Nguyen, T.V.; Attinger, S.; Kumar, R. Scenario Analysis of Nitrogen Surplus Typologies in Europe Shows That a 20% Fertilizer Reduction May Fall Short of 2030 EU Green Deal Goals. Nat. Food 2025, 6, 787–798. [Google Scholar] [CrossRef] [Scilit]
- Jabbour Al Maalouf, N.; Elia, J.; Boutros, F.; Balouza, M.; Sawaya, C. Sustainable Practices and Their Impact on the Operations of Fresh Fruits and Vegetables Market in the Cold Chain. Clean. Logist. Supply Chain 2024, 13, 100196. [Google Scholar] [CrossRef] [Scilit]
- Ferreira, S.; Sánchez, J.M.; Gonçalves, J.M.; Eugénio, R.; Damásio, H. Remote Sensing-Assisted Estimation of Water Use in Apple Orchards with Permanent Living Mulch. Agronomy 2025, 15, 338. [Google Scholar] [CrossRef] [Scilit]
- Ferreira, S.; Lopes, C.; Gonçalves, M.; Rodrigues, M.; Martinho, F.; Sousa, M.L.d. Multiyear Assessment of Biofertilizer Application on ‘Gala’ Apple Orchards: Impacts on Soil Fertility, Leaf Mineral Content, and Agronomic Performance. Plants 2025, 14, 3319. [Google Scholar] [CrossRef] [Scilit] [PubMed]
- Sousa, M.L.d.; Gonçalves, M. Avaliação do Potencial da Aplicação de Biofertilizantes em Pomares de Macieira ‘Gala’. Relatório técnico, Instituto Nacional de Investigação Agrária e Veterinária (INIAV), Dep. Produção de Pomóideas—Polo de Inovação de Alcobaça, Vida Rural, Maio 2020. Available online: https://www.vidarural.pt/wp-content/uploads/sites/5/2020/06/Potencial-da-aplicacao-de-biofertilizantes.pdf (accessed on 25 November 2025). (In Portuguese)
- Montemurro, F.; Fiore, A.; Campanelli, G.; Tittarelli, F.; Ledda, L.; Canali, S. Organic Fertilization, Green Manure, and Vetch Mulch to Improve Organic Zucchini Yield and Quality. HortScience 2013, 48, 1027–1033. [Google Scholar] [CrossRef] [Scilit]
- Scavo, A.; Fontanazza, S.; Restuccia, A.; Anastasi, U.; Cosentino, S.L.; Mauromicale, G. The Role of Cover Crops in Improving Soil Fertility and Plant Nutritional Status in Temperate Climates: A Review. Agron. Sustain. Dev. 2022, 42, 93. [Google Scholar] [CrossRef] [Scilit]
- Ammar, E.E.; Rady, H.A.; Khattab, A.M.; Amer, M.H.; Mohamed, S.A.; Elodamy, N.I.; Al-Farga, A.; Aioub, A.A.A. A Comprehensive Overview of Eco-Friendly Bio-Fertilizers Extracted from Living Organisms. Environ. Sci. Pollut. Res. 2023, 30, 113119–113137. [Google Scholar] [CrossRef] [Scilit] [PubMed]
- Priya, E.; Sarkar, S.; Maji, P.K. A Review on Slow-Release Fertilizer: Nutrient Release Mechanism and Agricultural Sustainability. J. Environ. Chem. Eng. 2024, 12, 113211. [Google Scholar] [CrossRef] [Scilit]
- Khan, M.T.; Aleinikovienė, J.; Butkevičienė, L.-M. Innovative Organic Fertilizers and Cover Crops: Perspectives for Sustainable Agriculture in the Era of Climate Change and Organic Agriculture. Agronomy 2024, 14, 2871. [Google Scholar] [CrossRef] [Scilit]
- Huang, R.; Li, W.; Niu, M.; Hu, B. Organic Farming to Improve Soil Quality and the Functional Structure of Soil Microbial Communities. Agriculture 2025, 15, 1381. [Google Scholar] [CrossRef] [Scilit]
- Kabato, W.; Hailegnaw, N.; Mutum, L.; Molnar, Z. Managing Soil Health for Climate Resilience and Crop Productivity in a Changing Environment. Sci. Total Environ. 2025, 1000, 180460. [Google Scholar] [CrossRef] [Scilit]
- Dung, T.V.; Ngoc, N.P.; Dang, L.V.; Hung, N.N. Impact of Cover Crop and Mulching on Soil Physical Properties and Soil Nutrients in a Citrus Orchard. PeerJ 2022, 10, e14170. [Google Scholar] [CrossRef] [Scilit]
- Sileshi, G.W.; Stewart, Z.P.; Odhong, J.; Mhlanga, B.; Amede, T.; Aynekulu, E.; Thierfelder, C.; Marenya, P.; Dittmer, K.M.; Aliyu, K.T.; et al. A Review of Organic Inputs to Inform Soil Health Advice for African Smallholder Farmers: Localization Matters. NPJ Sustain. Agric. 2025, 3, 20. [Google Scholar] [CrossRef] [Scilit]
- Hiregoudar, H.R.; Kumar, A.; Kannabiran, K.; Singla, A.; Swain, S.K.; Pandey, A.; Kore, V.T.; Singh, G.; Kaur, M.; Singh, A. Global Impact of Regenerative Practices on Fruit Orchard Sustainability. Int. J. Res. Agron. 2025, 8, 200–208. [Google Scholar] [CrossRef] [Scilit]
- Kabenomuhangi, R. Regenerative Agriculture and Soil Health: Enhancing Biodiversity through Sustainable Farming Practices. Int. J. Res. Publ. Rev. 2024, 5, 3203–3215. [Google Scholar] [CrossRef] [Scilit]
- Rayne, N.; Aula, L. Livestock Manure and the Impacts on Soil Health: A Review. Soil Syst. 2020, 4, 64. [Google Scholar] [CrossRef] [Scilit]
- Ali, A.; Jabeen, N.; Chachar, Z.; Chachar, S.; Ahmed, S.; Ahmed, N.; Laghari, A.A.; Sahito, Z.A.; Farruhbek, R.; Yang, Z. The Role of Biochar in Enhancing Soil Health and Interactions with Rhizosphere Properties and Enzyme Activities in Organic Fertilizer Substitution. Front. Plant Sci. 2025, 16, 1595208. [Google Scholar] [CrossRef] [Scilit] [PubMed]
- Mgxaji, Y.; Mutengwa, C.S.; Mukumba, P.; Dzvene, A.R. Biogas Slurry as a Sustainable Organic Fertilizer for Sorghum Production in Sandy Soils: A Review of Feedstock Sources, Application Methods, and Agronomic Impacts. Agronomy 2025, 15, 1683. [Google Scholar] [CrossRef] [Scilit]
- Xing, Y.; Xie, Y.; Wang, X. Enhancing Soil Health through Balanced Fertilization: A Pathway to Sustainable Agriculture and Food Security. Front. Microbiol. 2025, 16, 1536524. [Google Scholar] [CrossRef] [Scilit] [PubMed]
- Liu, Y.; Lan, X.; Hou, H.; Ji, J.; Liu, X.; Lv, Z. Multifaceted Ability of Organic Fertilizers to Improve Crop Productivity and Abiotic Stress Tolerance: Review and Perspectives. Agronomy 2024, 14, 1141. [Google Scholar] [CrossRef] [Scilit]
- Zhuang, L.; Wang, P.; Hu, W.; Yang, R.; Zhang, Q.; Jian, Y.; Zou, Y. A Comprehensive Study on the Impact of Chemical Fertilizer Reduction and Organic Manure Application on Soil Fertility and Apple Orchard Productivity. Agronomy 2024, 14, 1398. [Google Scholar] [CrossRef] [Scilit]
- Yao, R.; Bai, R.; Yu, Q.; Bao, Y.; Yang, W. The Effect of Nitrogen Reduction and Applying Bio-Organic Fertilisers on Soil Nutrients and Apple Fruit Quality and Yield. Agronomy 2024, 14, 345. [Google Scholar] [CrossRef] [Scilit]
- Li, Q.; Chen, Y.; Zhu, J.; Liu, L.; Liu, J.; Cheng, C.; Li, L. Effects of Organic Substitution on the Yield and Quality of Apples and Residual Nitrate-N Leaching in Soil. Agronomy 2024, 14, 415. [Google Scholar] [CrossRef] [Scilit]
- European Union—NextGenerationEU. Project “R&D+I—Research and Innovation Projects in Partnership—Climate Change Mitigation” (MOPLUS), PRR-C05-i03-I-000018, Alcobaça Apple Orchards. 2025. Available online: https://moplus.webnode.pt/ (accessed on 26 November 2025).
- Kottek, M.; Grieser, J.; Beck, C.; Rudolf, B.; Rubel, F. World Map of the Köppen–Geiger Climate Classification Updated. Meteorol. Z. 2006, 15, 259–263. [Google Scholar] [CrossRef] [Scilit]
- Instituto Português do Mar e da Atmosfera (IPMA). Climate Normal—Alcobaça/Fruticulture Station Vieira Natividade, 1991–2020; Version 1.0, 2024. Available online: https://www.ipma.pt/bin/file.data/climate-normal/cn_91-20_ALCOBACA_E_FRUTICULTURA.pdf (accessed on 2 September 2025).
- Allen, R.G.; Pereira, L.S.; Raes, D.; Smith, M. Crop Evapotranspiration—Guidelines for Computing Crop Water Requirements; FAO Irrigation and Drainage Paper 56; FAO: Rome, Italy, 1998. [Google Scholar]
- Reich, P.B.; Walters, M.B.; Ellsworth, D.S. World Map of the Köppen–Geiger Climate Classification Updated. Proc. Natl. Acad. Sci. USA 1997, 94, 13730–13734. [Google Scholar] [CrossRef] [Scilit]
- Parry, C.; Blonquist, J.M., Jr.; Bugbee, B. In Situ Measurement of Leaf Chlorophyll Concentration: Analysis of the Optical/Absolute Relationship. Plant Cell Environ. 2014, 37, 2508–2520. [Google Scholar] [CrossRef] [Scilit]
- Strasser, R.J.; Tsimilli-Michael, M.; Srivastava, A. Analysis of the Chlorophyll a Fluorescence Transient. In Chlorophyll a Fluorescence: A Signature of Photosynthesis; Papageorgiou, G.C., Govindjee, Eds.; Advances in Photosynthesis and Respiration; Springer: Dordrecht, The Netherlands, 2004; Volume 19, pp. 321–362. [Google Scholar] [CrossRef] [Scilit]
- Gao, J.; Li, P.; Ma, F.; Goltsev, V. Photosynthetic Performance during Leaf Expansion in Malus micromalus Probed by Chlorophyll a Fluorescence and Modulated 820 nm Reflection. J. Photochem. Photobiol. B 2014, 137, 144–150. [Google Scholar] [CrossRef] [Scilit]
- Strasser, R.J.; Tsimilli-Michael, M.; Qiang, S.; Goltsev, V. Simultaneous In Vivo Recording of Prompt and Delayed Fluorescence and 820 nm Reflection Changes during Drying and after Rehydration of the Resurrection Plant Haberlea rhodopensis. Biochim. Biophys. Acta Bioenerg. 2010, 1797, 1313–1326. [Google Scholar] [CrossRef] [Scilit]
- Dwyer, J.M.; Hobbs, R.J.; Mayfield, M.M. Specific Leaf Area Responses to Environmental Gradients through Space and Time. Ecology 2014, 95, 399–410. [Google Scholar] [CrossRef] [Scilit]
- Byun, C. Canopy Cover Size and Establishment Rate Determine Biotic Resistance to Aster pilosus Invasion: A Priority Effect. Plant Ecol. 2022, 223, 559–568. [Google Scholar] [CrossRef] [Scilit]
- Fernando, Y.; Adams, M.; Kuhlmann, M.; Butardo, V., Jr. Stomatal and Non-Stomatal Leaf Traits for Enhanced Water Use Efficiency in Rice. Biology 2025, 14, 843. [Google Scholar] [CrossRef] [Scilit]
- Stefanski, A.; Butler, E.E.; Bermudez, R.; Montgomery, R.A.; Reich, P.B. Stomatal Behaviour Moderates the Water Cost of CO2 Acquisition for 21 Boreal and Temperate Species under Experimental Climate Change. Plant Cell Environ. 2023, 46, 3102–3119. [Google Scholar] [CrossRef] [Scilit] [PubMed]
- Chen, L.-H.; Xu, M.; Cheng, Z.; Yang, L.-T. Effects of Nitrogen Deficiency on Photosynthesis, Chlorophyll Fluorescence, Antioxidant Systems, and Sulfur Metabolism in Rice (Oryza sativa L.). Int. J. Mol. Sci. 2024, 25, 10409. [Google Scholar] [CrossRef] [Scilit]
- Jägerbrand, A.K.; Kudo, G. Short-Term Responses in Maximum Quantum Yield of PSII (Fv/Fm) to Ex Situ Temperature Treatment of Populations of Bryophytes Originating from Different Sites in Hokkaido, Northern Japan. Plants 2016, 5, 22. [Google Scholar] [CrossRef] [Scilit] [PubMed]
- Kimm, H.; Guan, K.; Gentine, P.; Wu, J.; Bernacchi, C.; Sulman, B.; Griffis, T.; Lin, C. Redefining Droughts for the U.S. Corn Belt: The Dominant Role of Atmospheric Vapor Pressure Deficit over Soil Moisture in Regulating Stomatal Behavior of Maize and Soybean. Agric. For. Meteorol. 2020, 287, 107930. [Google Scholar] [CrossRef] [Scilit]
- Xu, Z.; Tian, Y.; Liu, Z.; Xia, X. Comprehensive Effects of Atmosphere and Soil Drying on Stomatal Behavior of Different Plant Types. Water 2023, 15, 1675. [Google Scholar] [CrossRef] [Scilit]
- Borden, K.; Anglaaere, L.; Owusu, S.; Martin, A.; Buchanan, S.; Addo-Danso, S.; Isaac, M. Soil Texture Moderates Root Functional Traits in Agroforestry Systems across a Climatic Gradient. Agric. Ecosyst. Environ. 2020, 295, 106915. [Google Scholar] [CrossRef] [Scilit]
- Ordonez, S.; Deák, B.; Valkó, O.; Szász, V.; Neumann, K.V.; Csergő, A.M. Microclimate and Dry Years Interfere with Landscape Structure Effects on Intraspecific Trait Variation. Ecol. Evol. 2025, 15, e71417. [Google Scholar] [CrossRef] [Scilit] [PubMed]
- Shi, W.; Zeng, W.; Aritsara, A.; Yi, Y.; Zhu, S.; Cao, K.-F. The Interaction between Climate and Soil Properties Influences Tree Species Richness in Tropical and Subtropical Forests of Southern China. Forests 2024, 15, 1441. [Google Scholar] [CrossRef] [Scilit]
- Wang, M.-Y.; Shi, X.-Z.; Yu, D.-S.; Xu, S.-X.; Tan, M.-Z.; Sun, W.-X.; Zhao, Y.-C. Regional Differences in the Effect of Climate and Soil Texture on Soil Organic Carbon. Pedosphere 2013, 23, 799–807. [Google Scholar] [CrossRef] [Scilit]
- Huang, J.; Wang, T.; Xin, C.; Wu, D.; Wang, J.; Ge, Z.; Lou, X. Orchard Soil Health—Current Challenges and Future Perspectives. Horticulturae 2025, 11, 1206. [Google Scholar] [CrossRef] [Scilit]
- Agrios, G.N. Plant Diseases Caused by Prokaryotes: Bacteria and Mollicutes. In Plant Pathology, 5th ed.; Agrios, G.N., Ed.; Academic Press: San Diego, CA, USA, 2005; pp. 615–703. [Google Scholar] [CrossRef] [Scilit]
- Lakso, A.N. Early Fruit Growth and Drop—The Role of Carbon Balance in the Apple Tree. Acta Hortic. 2011, 903, 733–742. [Google Scholar] [CrossRef] [Scilit]
- Teviotdale, B.L. Pest Notes: Fire Blight; UC ANR Publication 7414; University of California Agriculture and Natural Resources: Oakland, CA, USA, 2011; Available online: https://ipm.ucanr.edu/home-and-landscape/fire-blight/pest-notes/ (accessed on 15 December 2025).
- Mota, M.; Martins, M.J.; Policarpo, G.; Sprey, L.; Pastaneira, M.; Almeida, P.; Maurício, A.; Rosa, C.; Faria, J.; Martins, M.B.; et al. Nutrient Content with Different Fertilizer Management and Influence on Yield and Fruit Quality in Apple cv. ‘Gala’. Horticulturae 2022, 8, 713. [Google Scholar] [CrossRef] [Scilit]
- Oliveira, A.M.F.d.; Mendonça, V.; Amorim, P.E.C.; Freire, R.I.d.S.; Silva, L.R.B.d.; Silva, D.E.G.d.; Ferreira, F.N.; Bonou, S.I.; Silva, L.d.A.; Fernandes, P.D.; et al. Organic and Mineral Fertilization on the Photosynthetic, Nutritional, and Productive Efficiency of Ficus carica L. Subjected to Conduction Systems in a Semi-Arid Region of Brazil. Agriculture 2025, 15, 2128. [Google Scholar] [CrossRef] [Scilit]
- Wang, S.; Guo, S.; Zhai, L.; Hua, L.; Khoshnevisan, B.; Wang, H.; Liu, H. Comprehensive Effects of Integrated Management on Reducing Nitrogen and Phosphorus Loss under Legume–Rice Rotations. J. Clean. Prod. 2022, 361, 132031. [Google Scholar] [CrossRef] [Scilit]
- Song, X.; Guo, W.; Xu, L.; Shi, L. Beneficial Effect of Humic Acid Urea on Improving Physiological Characteristics and Yield of Maize (Zea mays L.). Acta Physiol. Plant. 2022, 44, 1–12. [Google Scholar] [CrossRef] [Scilit]
- Duarte, B.; Carreiras, J.A.; Melo, J.; Gonçalves, M.; Silva, A.B.; Leão de Sousa, M. Impact of Mineral and Organic Fertilization Practices on Elemental Authenticity Signature of ‘Royal Gala’ Apples from the Protected Geographical Indication (PGI) “Maçã de Alcobaça”. J. Food Compos. Anal. 2024, 132, 106308. [Google Scholar] [CrossRef] [Scilit]
- Franco-Navarro, J.D.; Padilla, Y.G.; Álvarez, S.; Calatayud, Á.; Colmenero-Flores, J.M.; Gómez-Bellot, M.J.; Hernández, J.A.; Martínez-Alcalá, I.; Penella, C.; Pérez-Pérez, J.G.; et al. Advancements in Water-Saving Strategies and Crop Adaptation to Drought: A Comprehensive Review. Physiol. Plant. 2025, 177, e70332. [Google Scholar] [CrossRef] [Scilit]
- Carvalho, F.; Escobar, L.; Camargo, I.; Rojas Molina, J.; Jaimes Suarez, Y.Y.; Rivera, J. The Interspecific Interactions in Agroforestry Systems Enhance Leaf Water Use Efficiency and Carbon Storage in Cocoa. Environ. Exp. Bot. 2023, 205, 105119. [Google Scholar] [CrossRef] [Scilit]
- Eyles, A.; Bound, S.; Oliver, G.; Corkrey, R.; Hardie, M.; Green, S.; Close, D. Impact of Biochar Amendment on the Growth, Physiology, and Fruit of a Young Commercial Apple Orchard. Trees—Struct. Funct. 2015, 29, 1817–1826. [Google Scholar] [CrossRef] [Scilit]
- Figueiredo, A.C.; Silva, A.B.; Tavares, C.; Pastaneira, M.; Melo, J.; Rodrigues, C.F.; Machado, A.M.; Antunes, M.; Cruz, C.; Marques da Silva, J.; et al. Influence of Orchard Fertilization Management and Post-Harvest Storage Time on Malus domestica cv. ‘Gala’ Fruit Volatiles and Quality Parameters. J. Food Compos. Anal. 2025, 138, 107000. [Google Scholar] [CrossRef] [Scilit]
- Morariu, P.A.; Sestras, A.F.; Andrecan, A.F.; Borsai, O.; Bunea, C.I.; Militaru, M.; Dan, C.; Sestras, R.E. Apple Cultivar Responses to Fungal Diseases and Insect Pests under Variable Orchard Conditions: A Multisite Study. Crops 2025, 5, 30. [Google Scholar] [CrossRef] [Scilit]
- Jakhro, M.I.; Habib, M.; Zhai, B.; Li, Z. Advancing Apple Orchard Management through Soil Organic Carbon: A Systems-Based Review. Soil Use Manag. 2025, 41, e70042. [Google Scholar] [CrossRef] [Scilit]
- Podedworny, G.; Przybyłko, S. Early-Stage Growth Performance of Apple Trees under Different Biochar Application Methods in Mineral and Organic Fertilisation Regimes. Agriculture 2025, 15, 2493. [Google Scholar] [CrossRef] [Scilit]
- Krogstad, T.; Zivanovic, V.; Simic, A.; Aksic, M.F.; Licina, V.; Meland, M. Nitrogen Mineralization of Apple Orchard Soils in Regions of Western and South-Eastern Norway. Agronomy 2023, 13, 2570. [Google Scholar] [CrossRef] [Scilit]
- Lawrence, B.T.; Melgar, J.C. Annual Compost Amendments Can Replace Synthetic Fertilizer, Improve Soil Moisture, and Ensure Tree Performance during Peach Orchard Establishment in a Humid Subtropical Climate. Front. Plant Sci. 2023, 14, 1172038. [Google Scholar] [CrossRef] [Scilit]
- Wesseling, J.; Stoof, C.; Ritsema, C.; Oostindie, K.; Dekker, L. The Effect of Soil Texture and Organic Amendment on the Hydrological Behaviour of Coarse-Textured Soils. Soil Use Manag. 2009, 25, 274–283. [Google Scholar] [CrossRef] [Scilit]
- Pokhrel, A.; Kanissery, R.; Strauss, S.L.; Albrecht, U. Integration of Organic Amendments and Weed Management to Improve Young Citrus Tree Growth under HLB-Endemic Conditions. Agronomy 2025, 15, 772. [Google Scholar] [CrossRef] [Scilit]
- Tang, W.; Yang, H.; Wang, W.; Wang, C.; Pang, Y.; Chen, D.; Hu, X. Effects of Living Grass Mulch on Soil Properties and Assessment of Soil Quality in Chinese Apple Orchards: A Meta-Analysis. Agronomy 2022, 12, 1974. [Google Scholar] [CrossRef] [Scilit]
- Leonel, S.; Roberto, S.R.; da Silva, S.R. Orchard Management under Climate Change. Horticulturae 2025, 11, 98. [Google Scholar] [CrossRef] [Scilit]
- Picon-Cochard, C.; Vassal, N.; Martin, R.; Herfurth, D.; Note, P.; Louault, F. Intra- and Inter-Annual Climatic Conditions Have a Stronger Effect than Grazing Intensity on Root Growth of Permanent Grasslands. bioRxiv 2020. bioRxiv:2020.08.23.263137. [Google Scholar] [CrossRef] [Scilit]
- Rezapour, S.; Nouri, A.; Alamdari, P. How Long-Term Orchard Management Revitalizes Soil Health beyond the Topsoil. Earth Syst. Environ. 2026, 10, 321–342. [Google Scholar] [CrossRef] [Scilit]
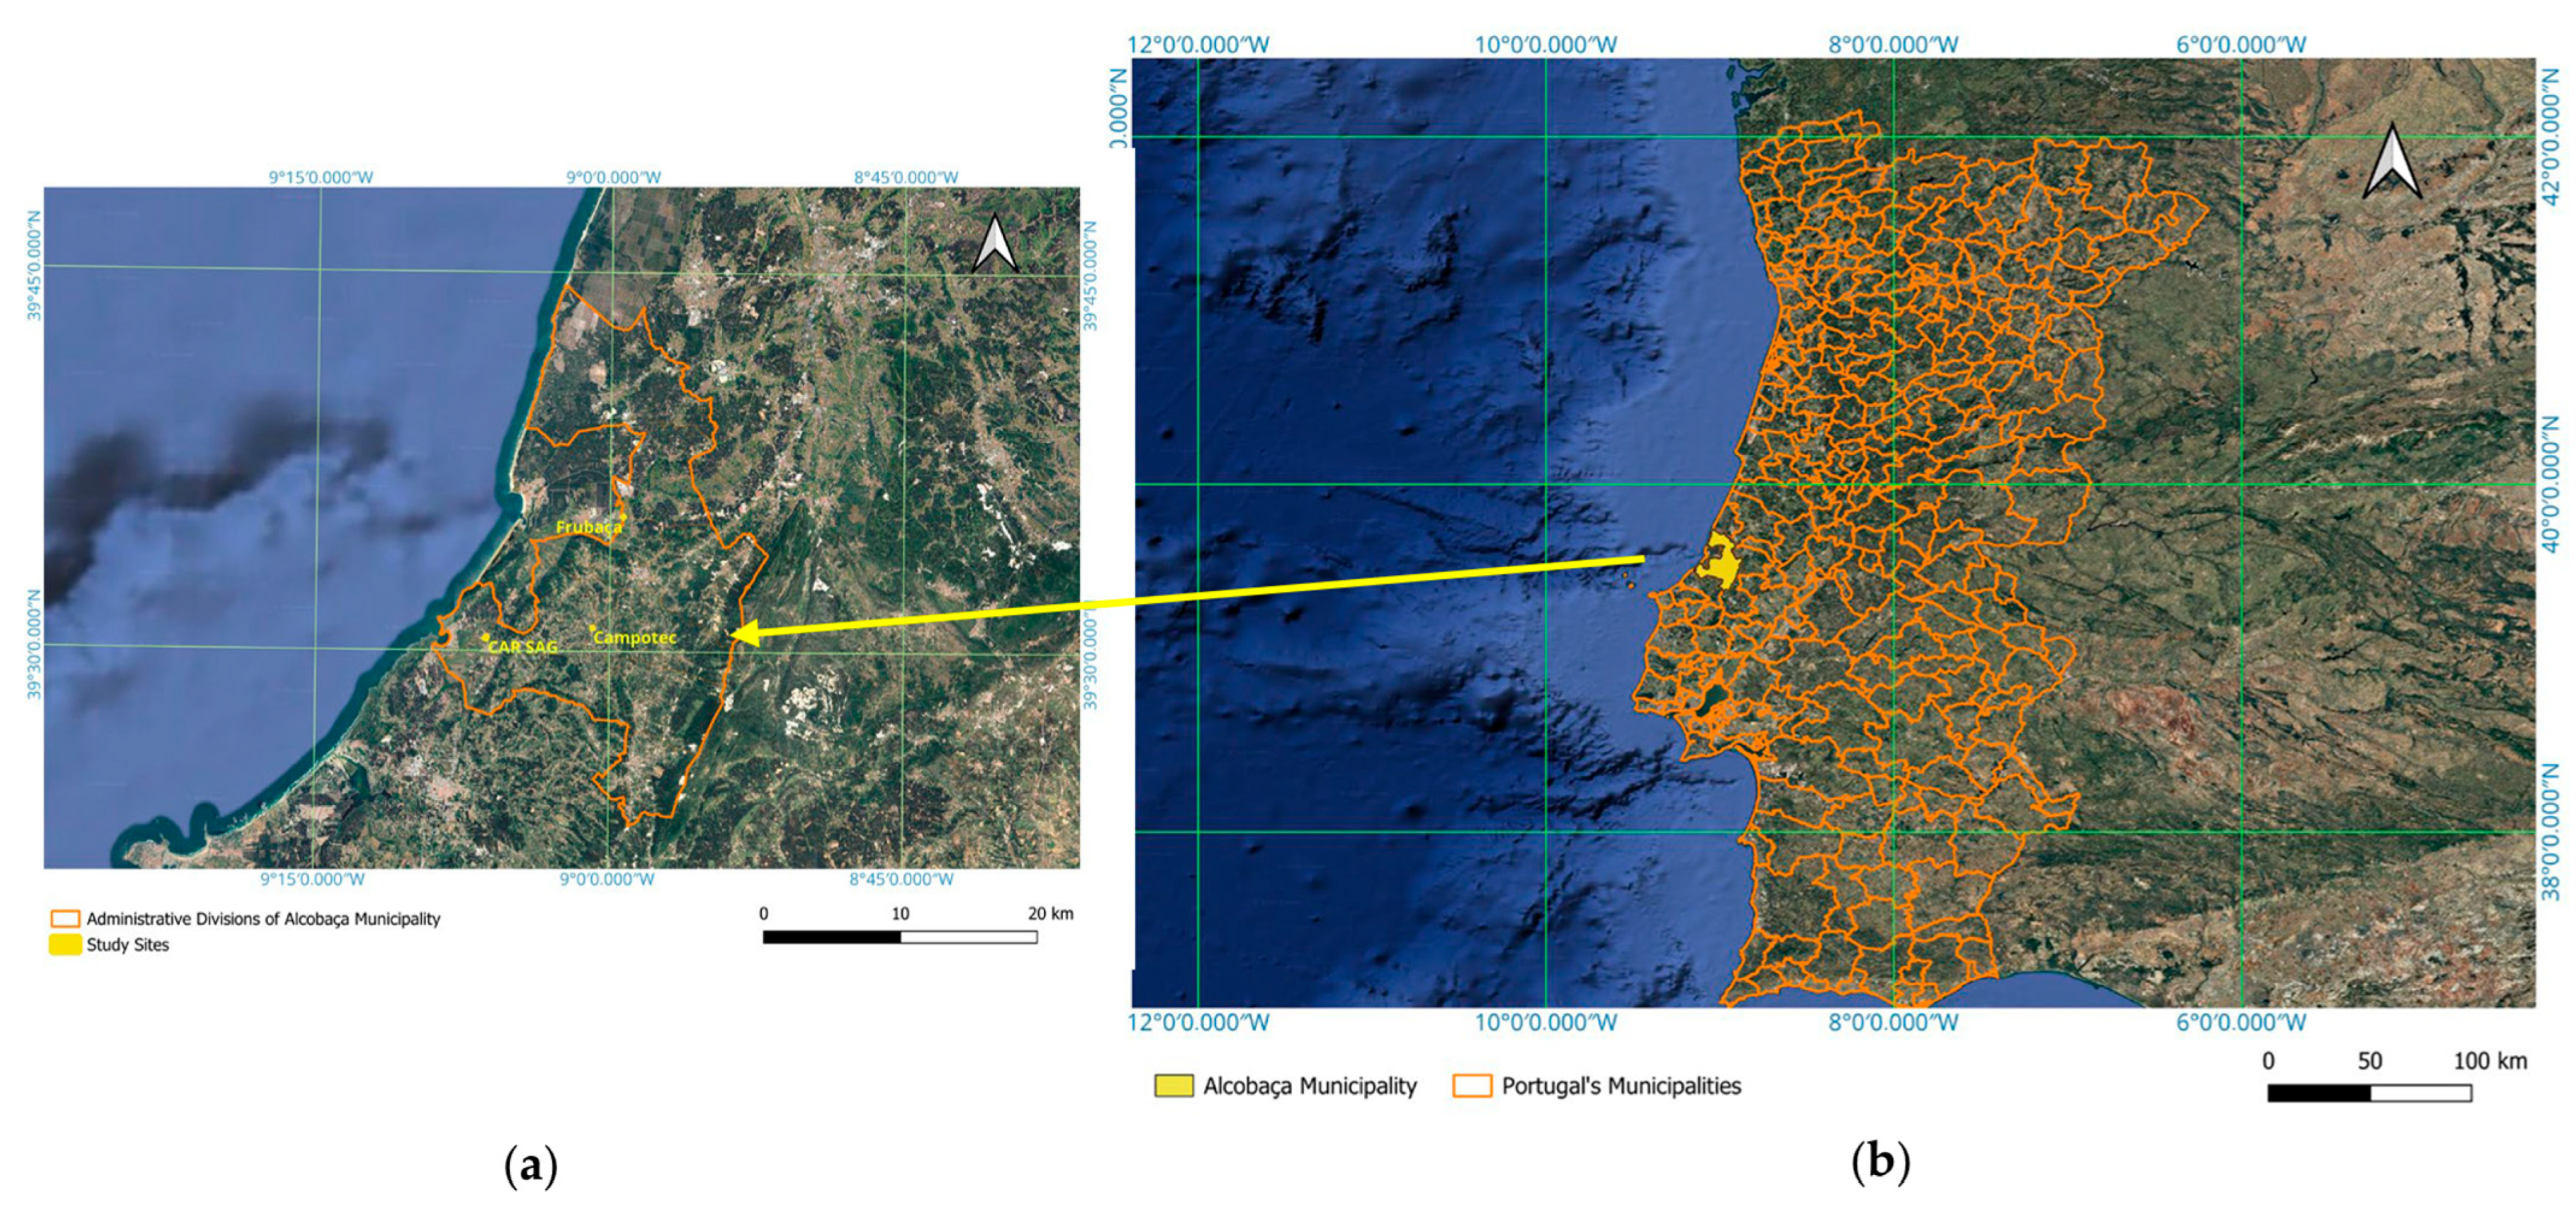
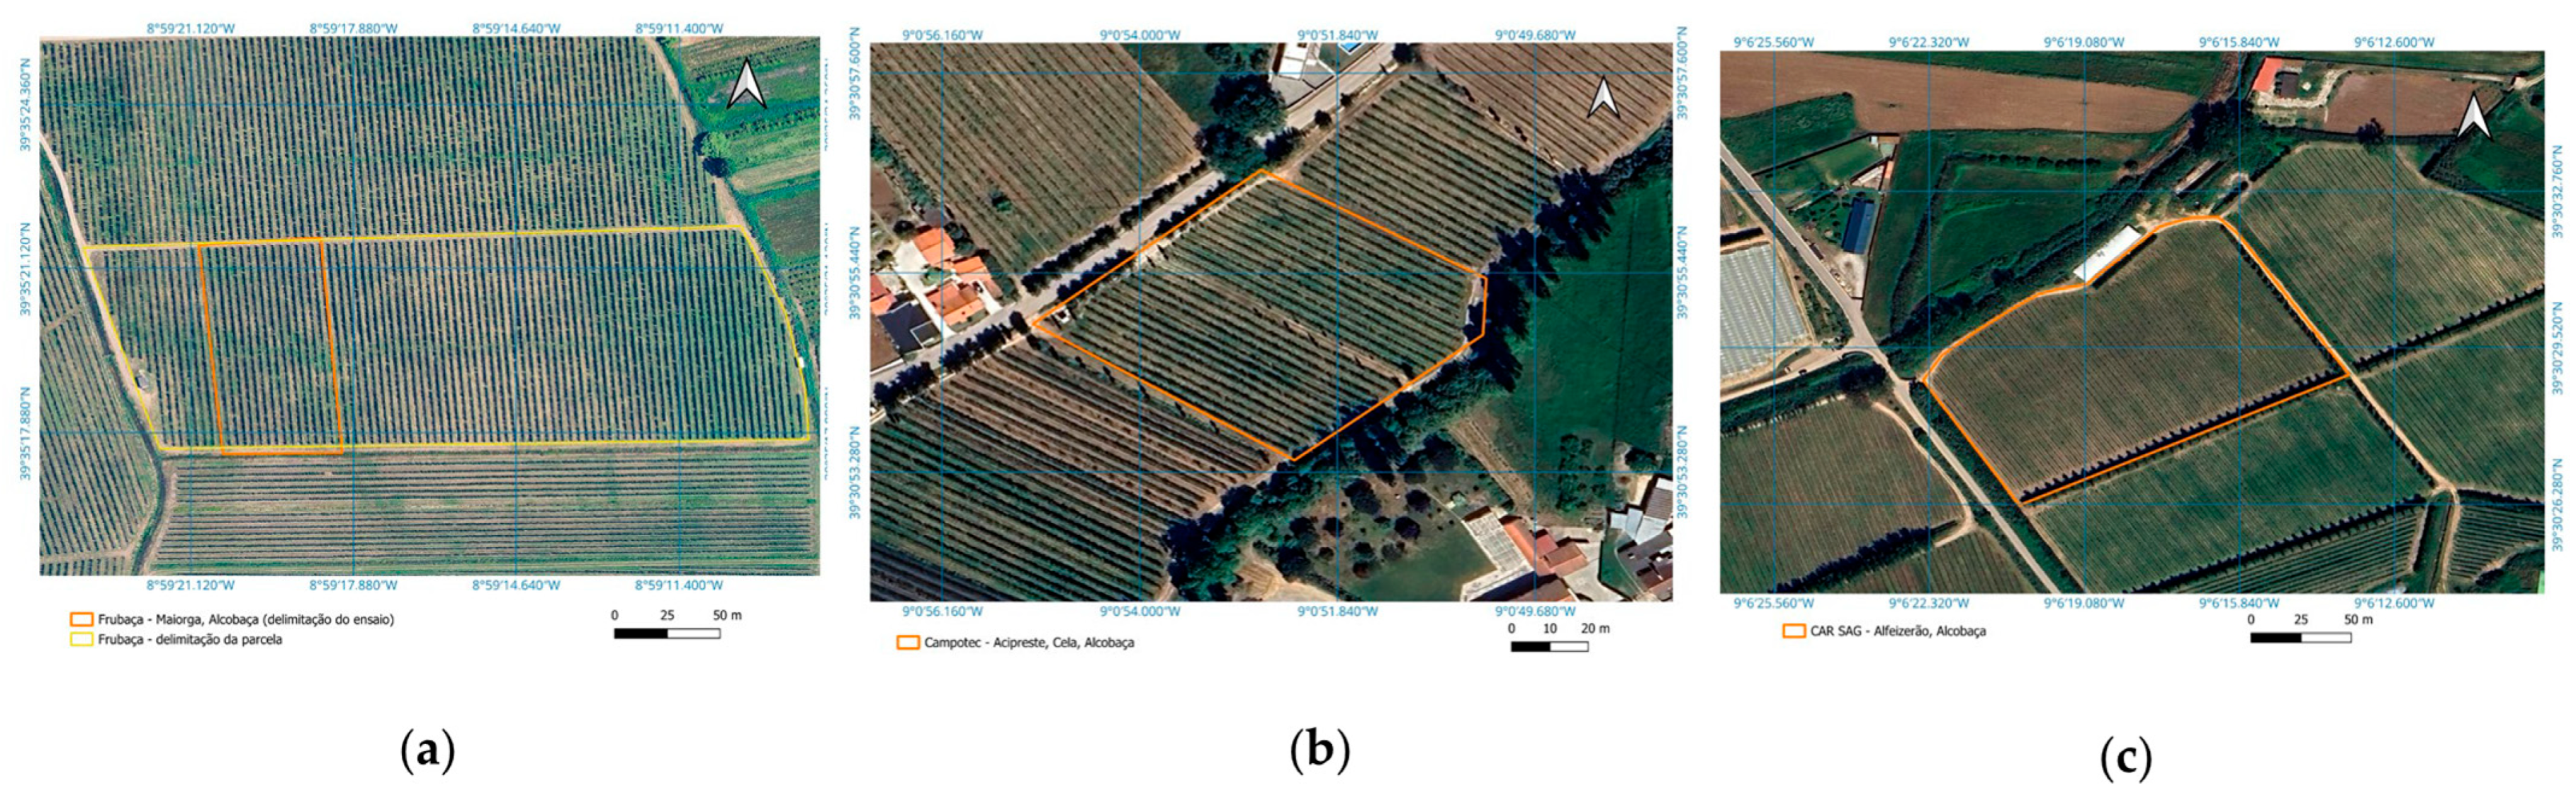
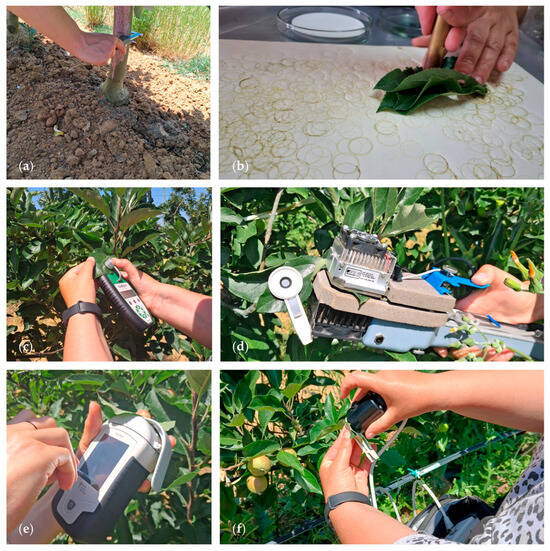
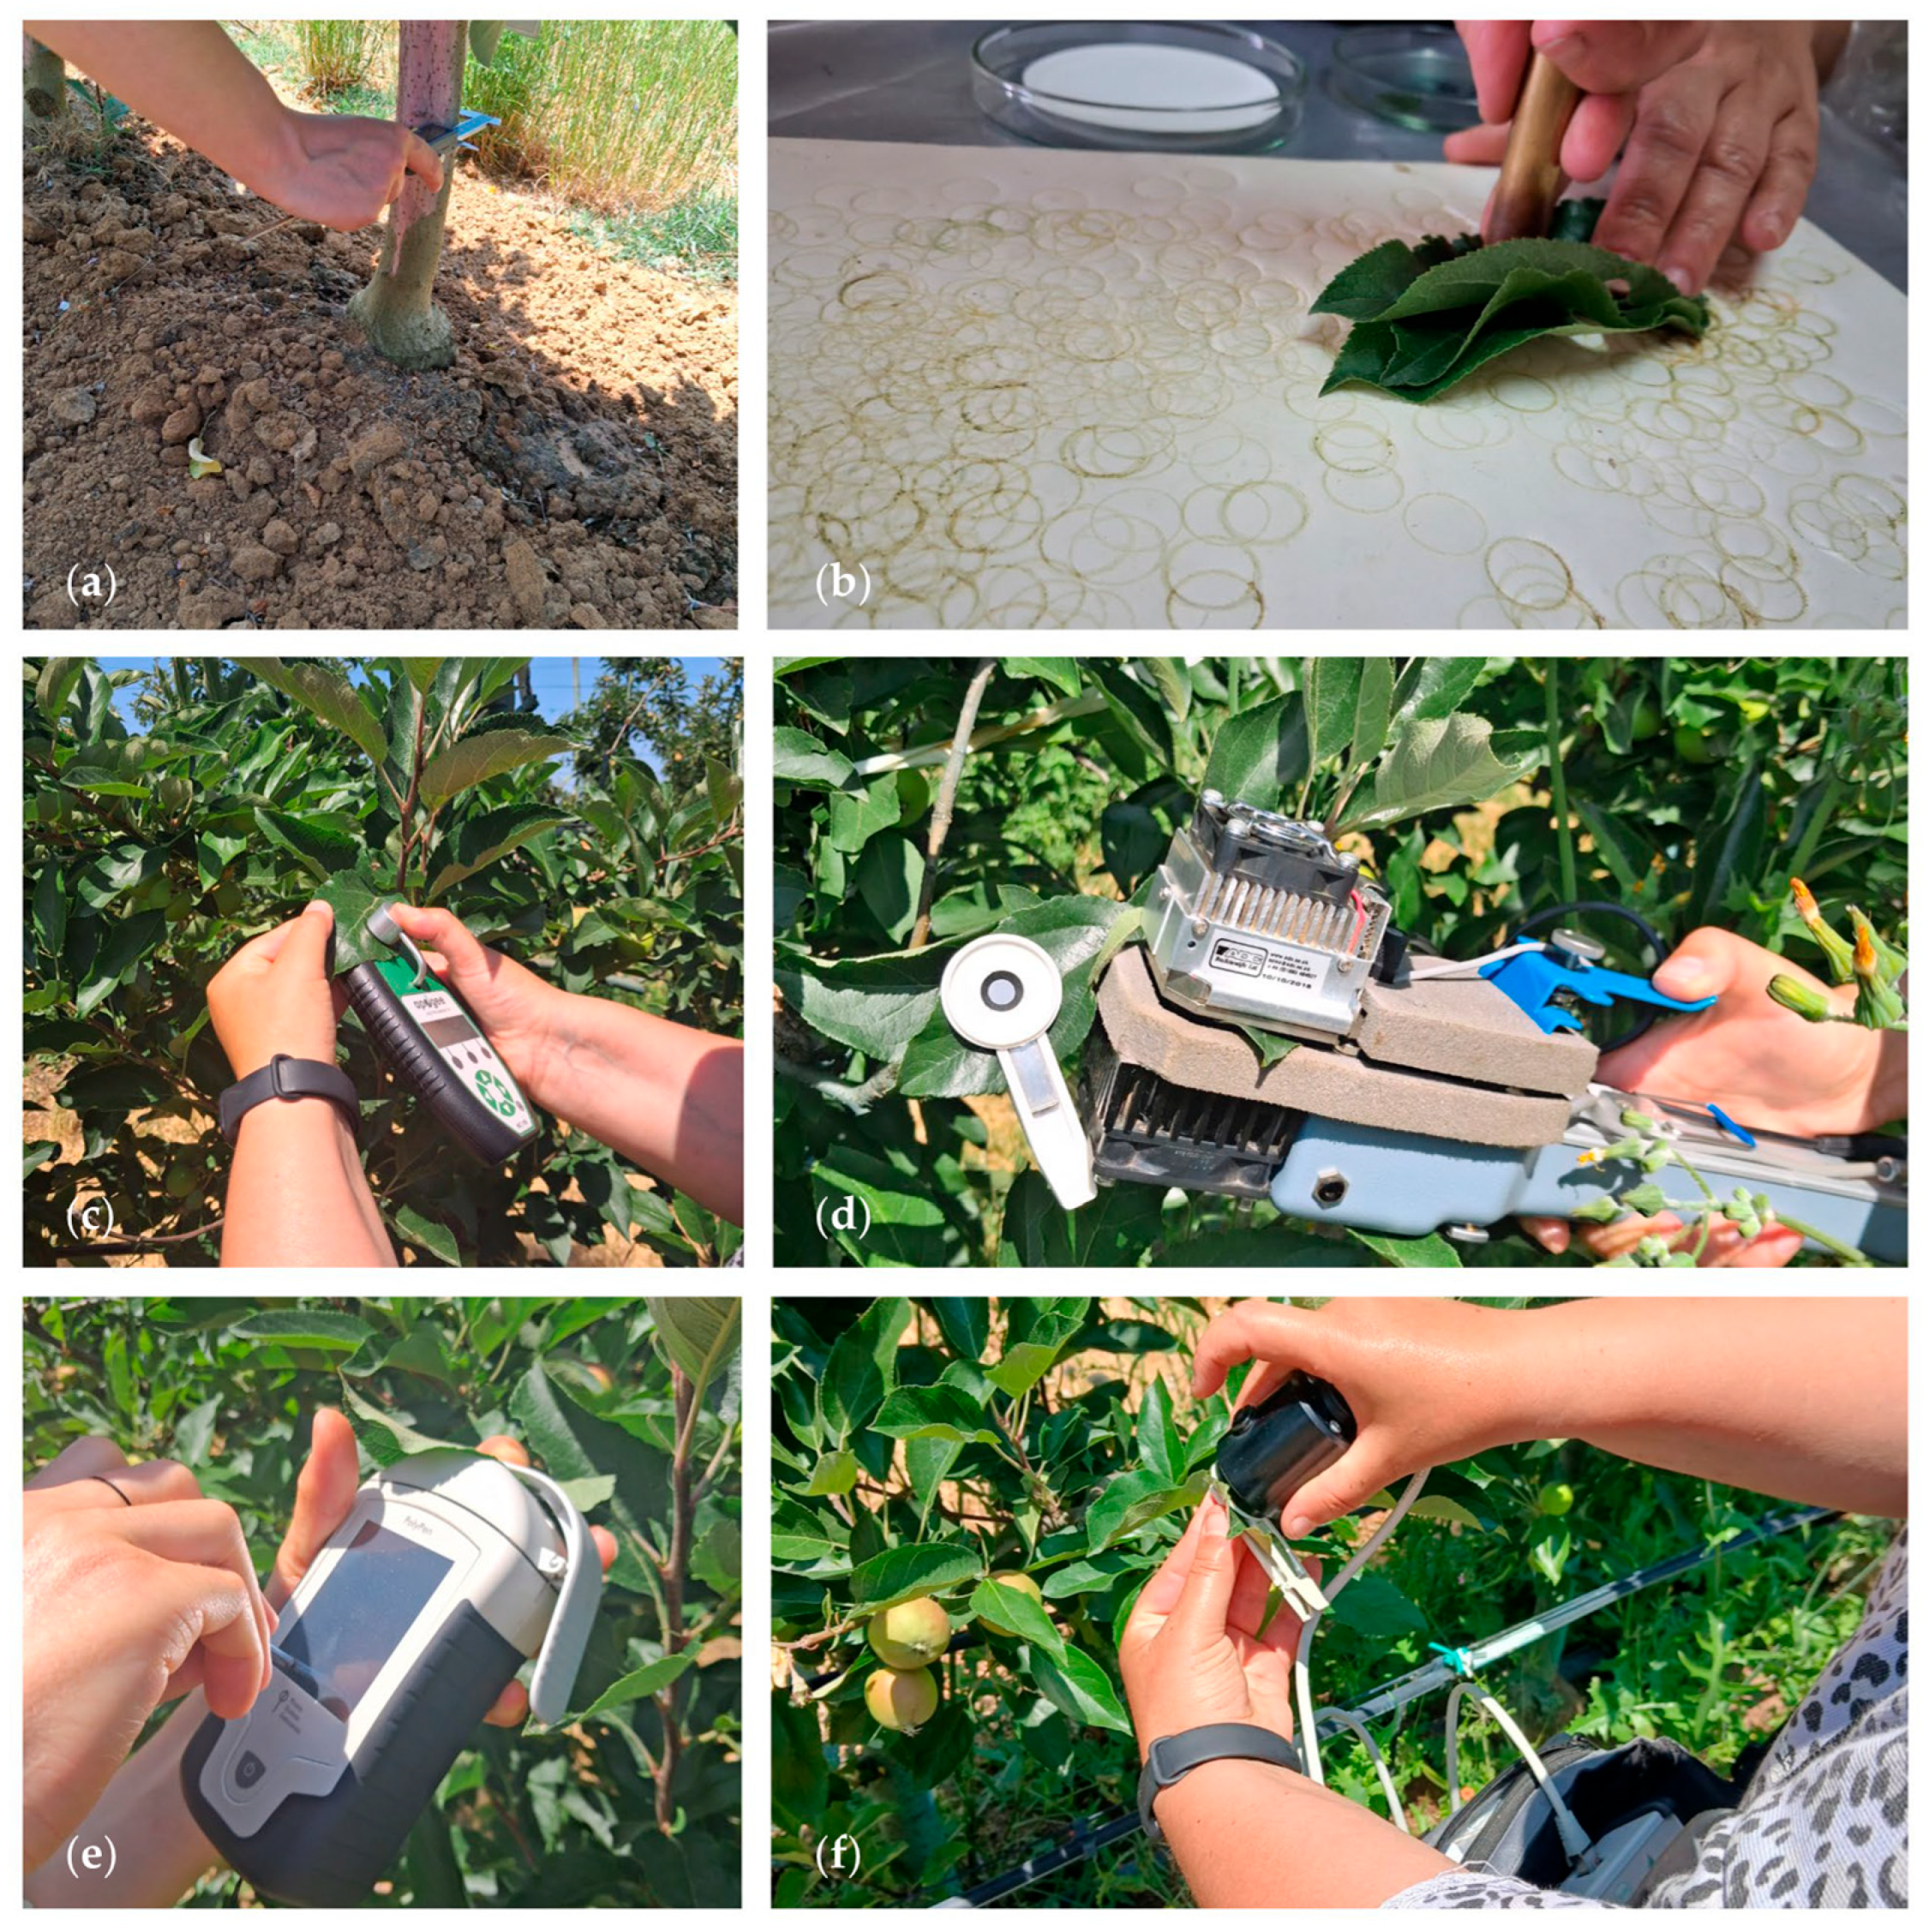
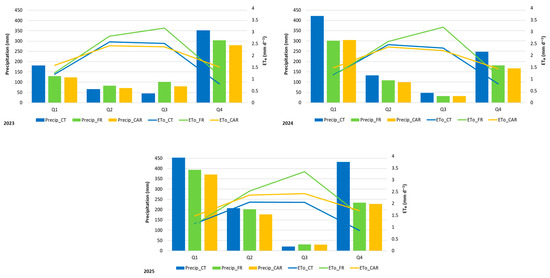
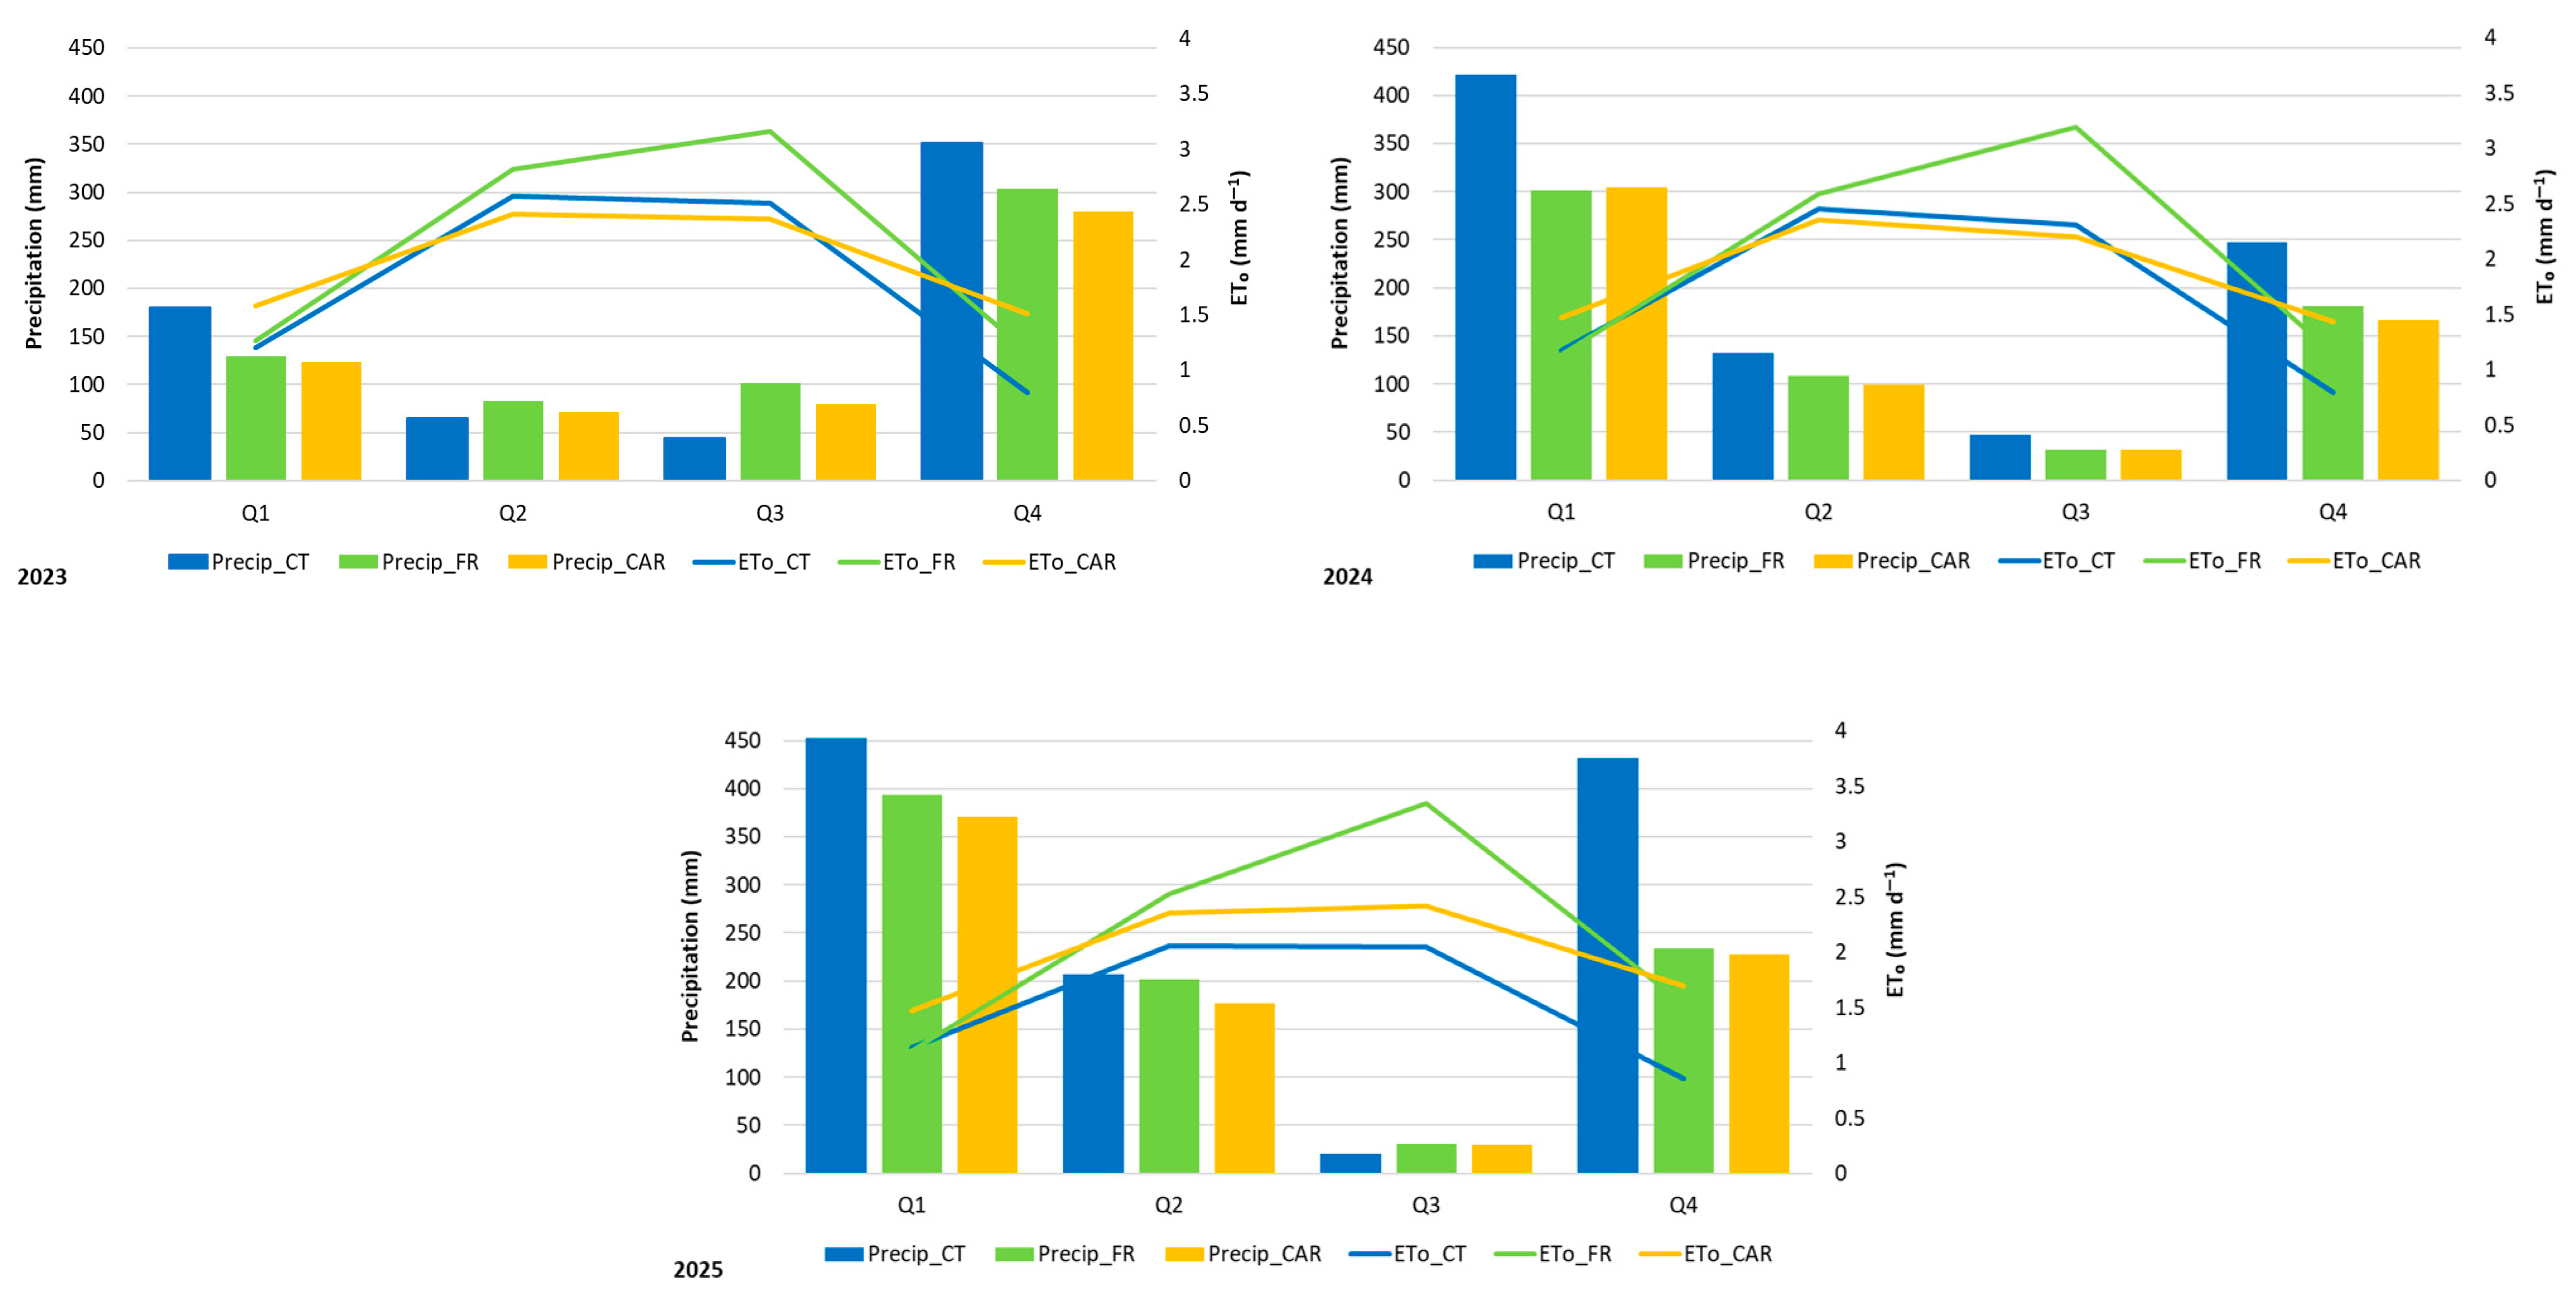
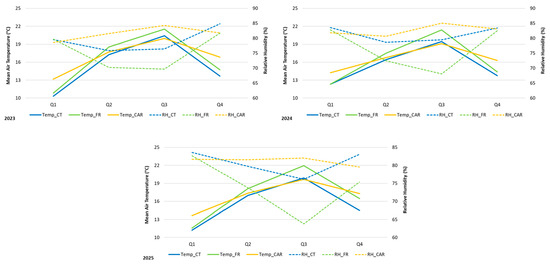
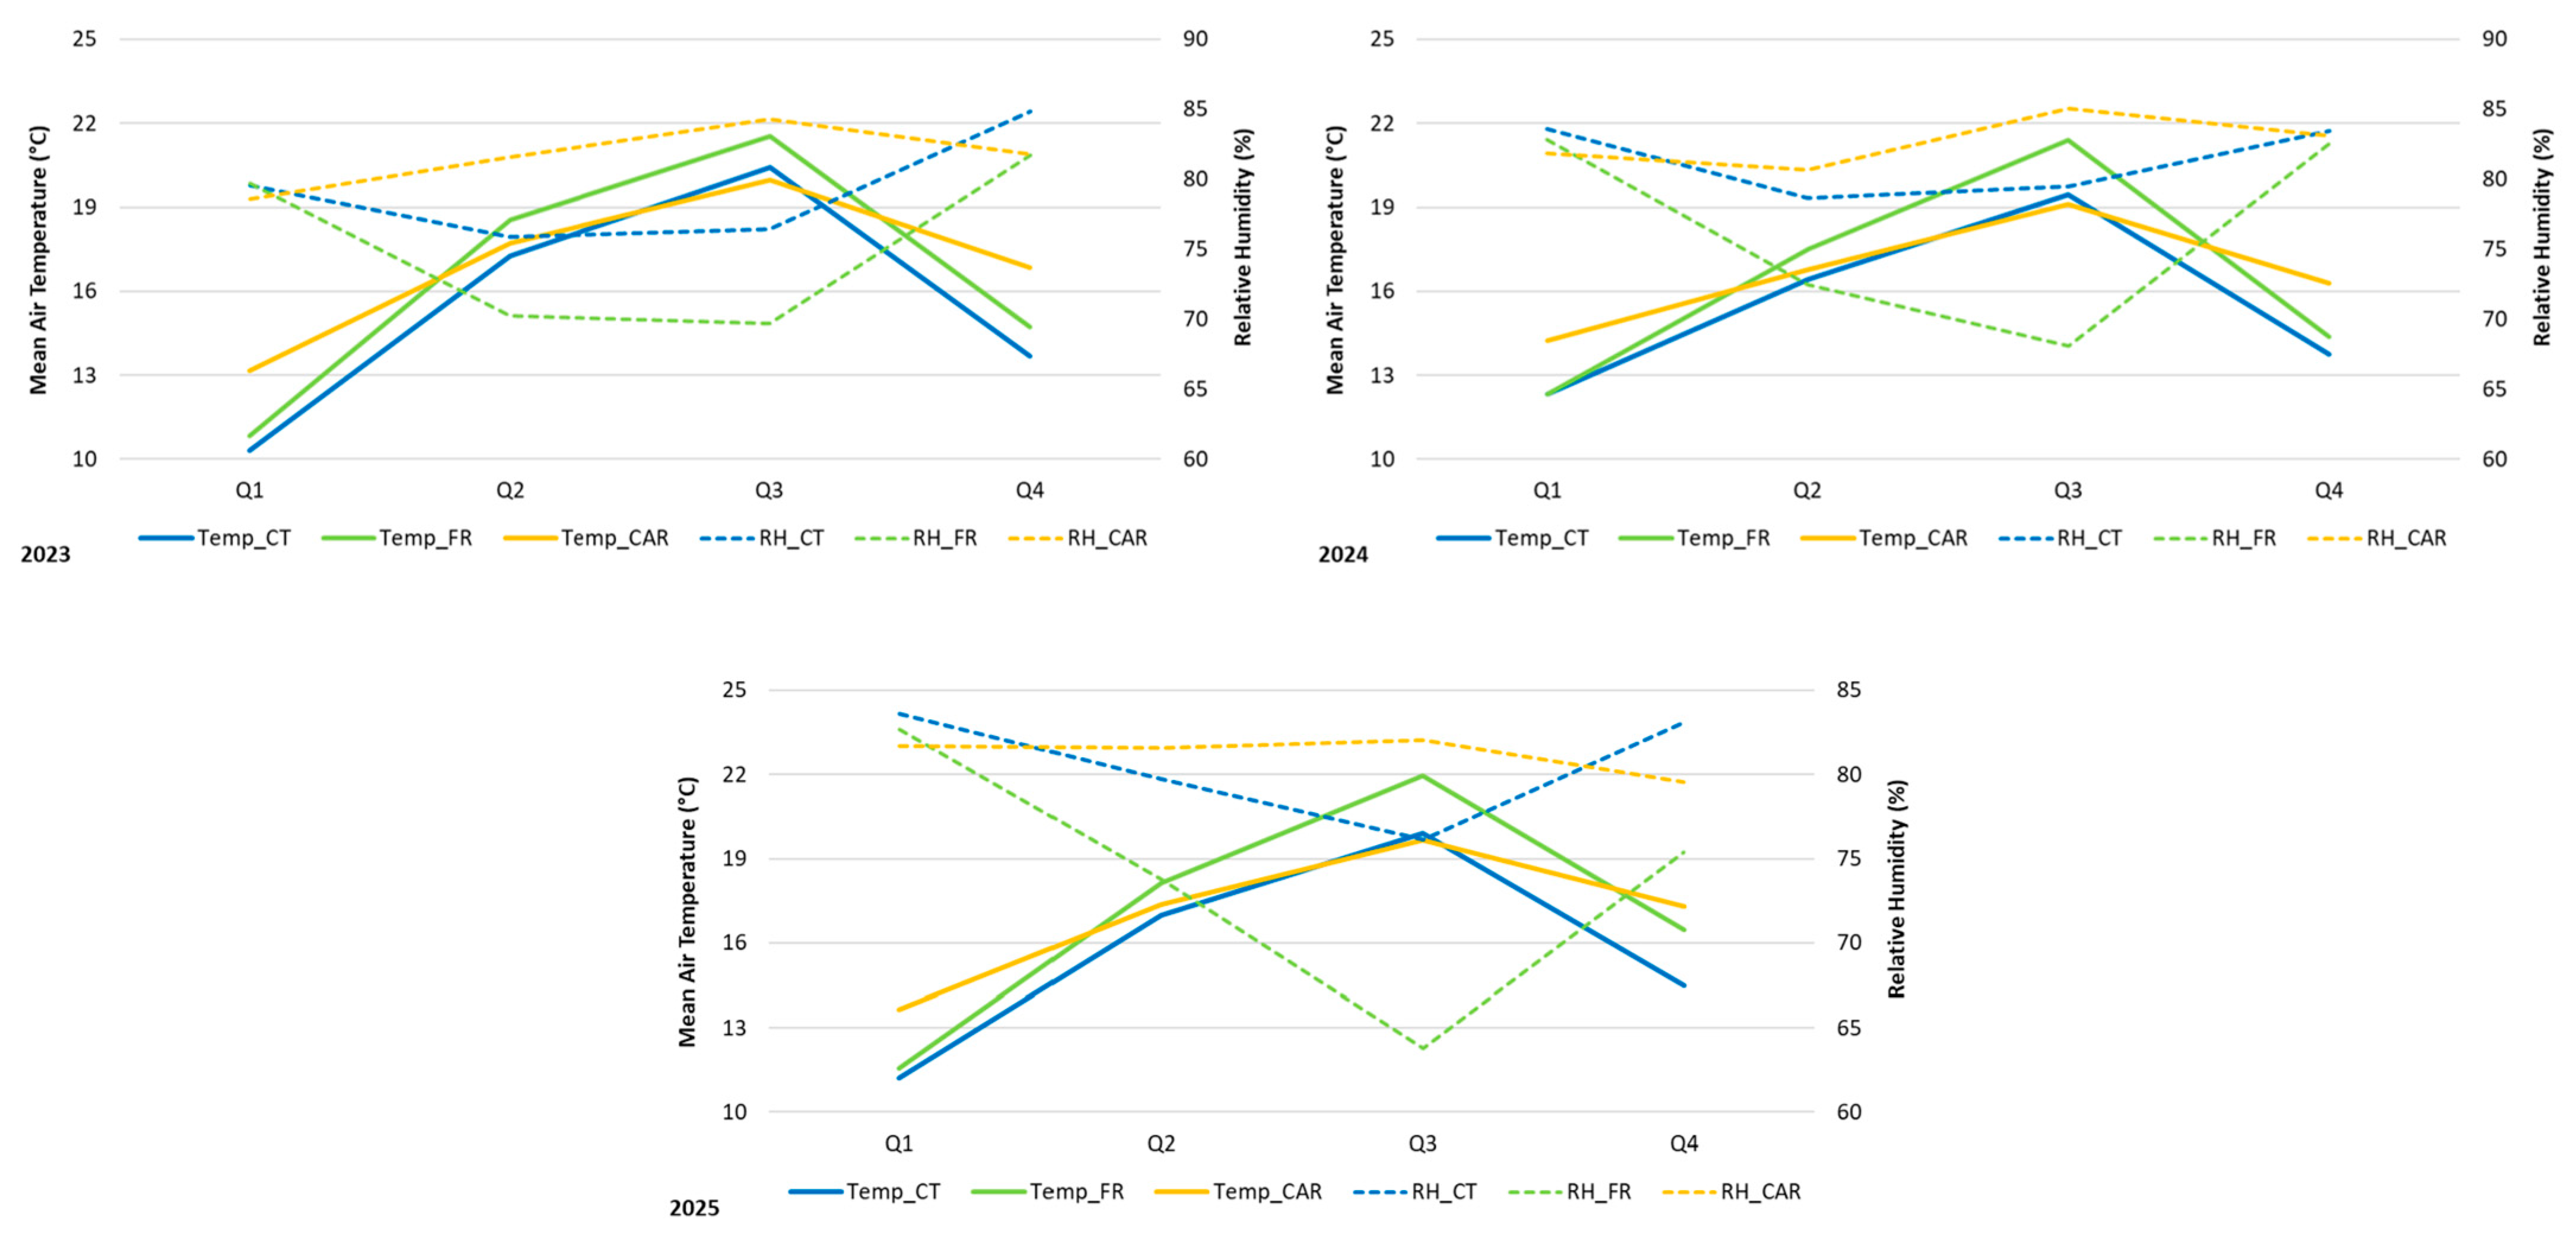
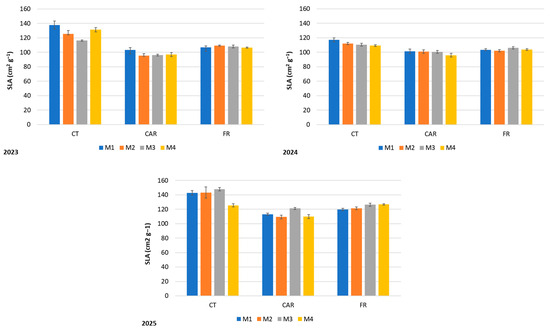
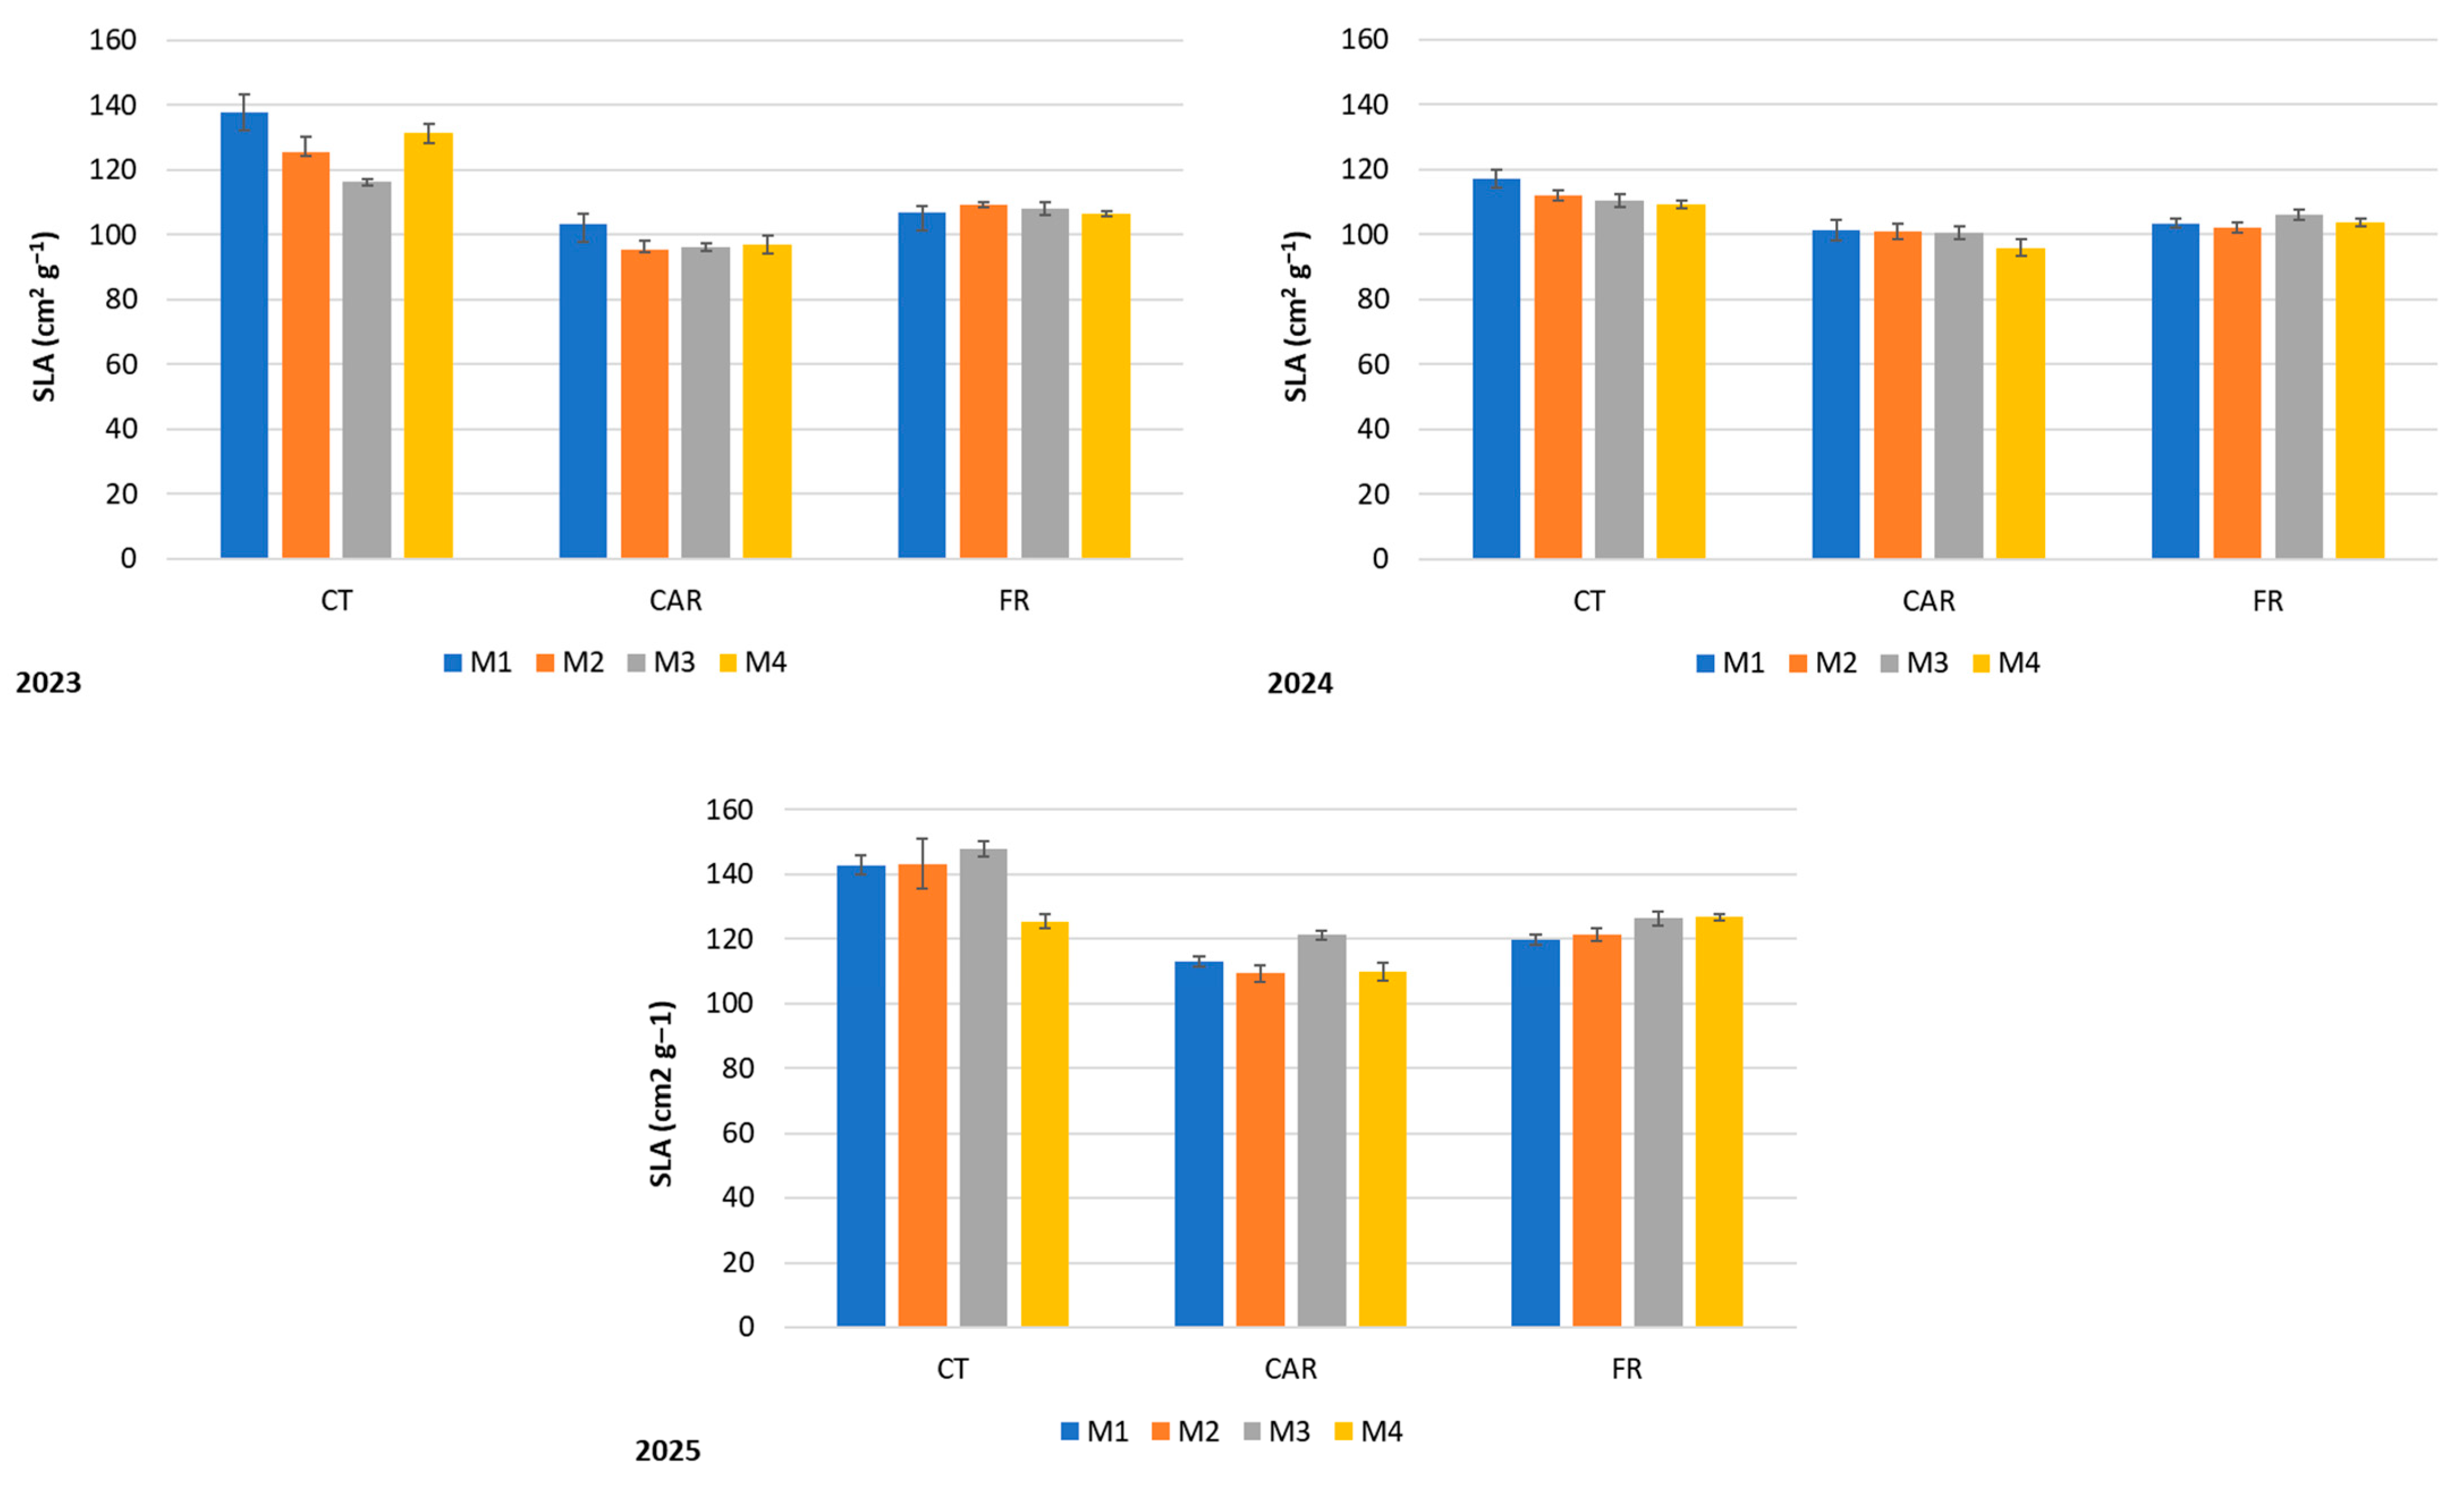
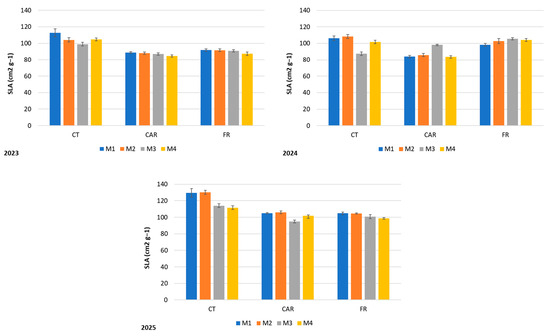
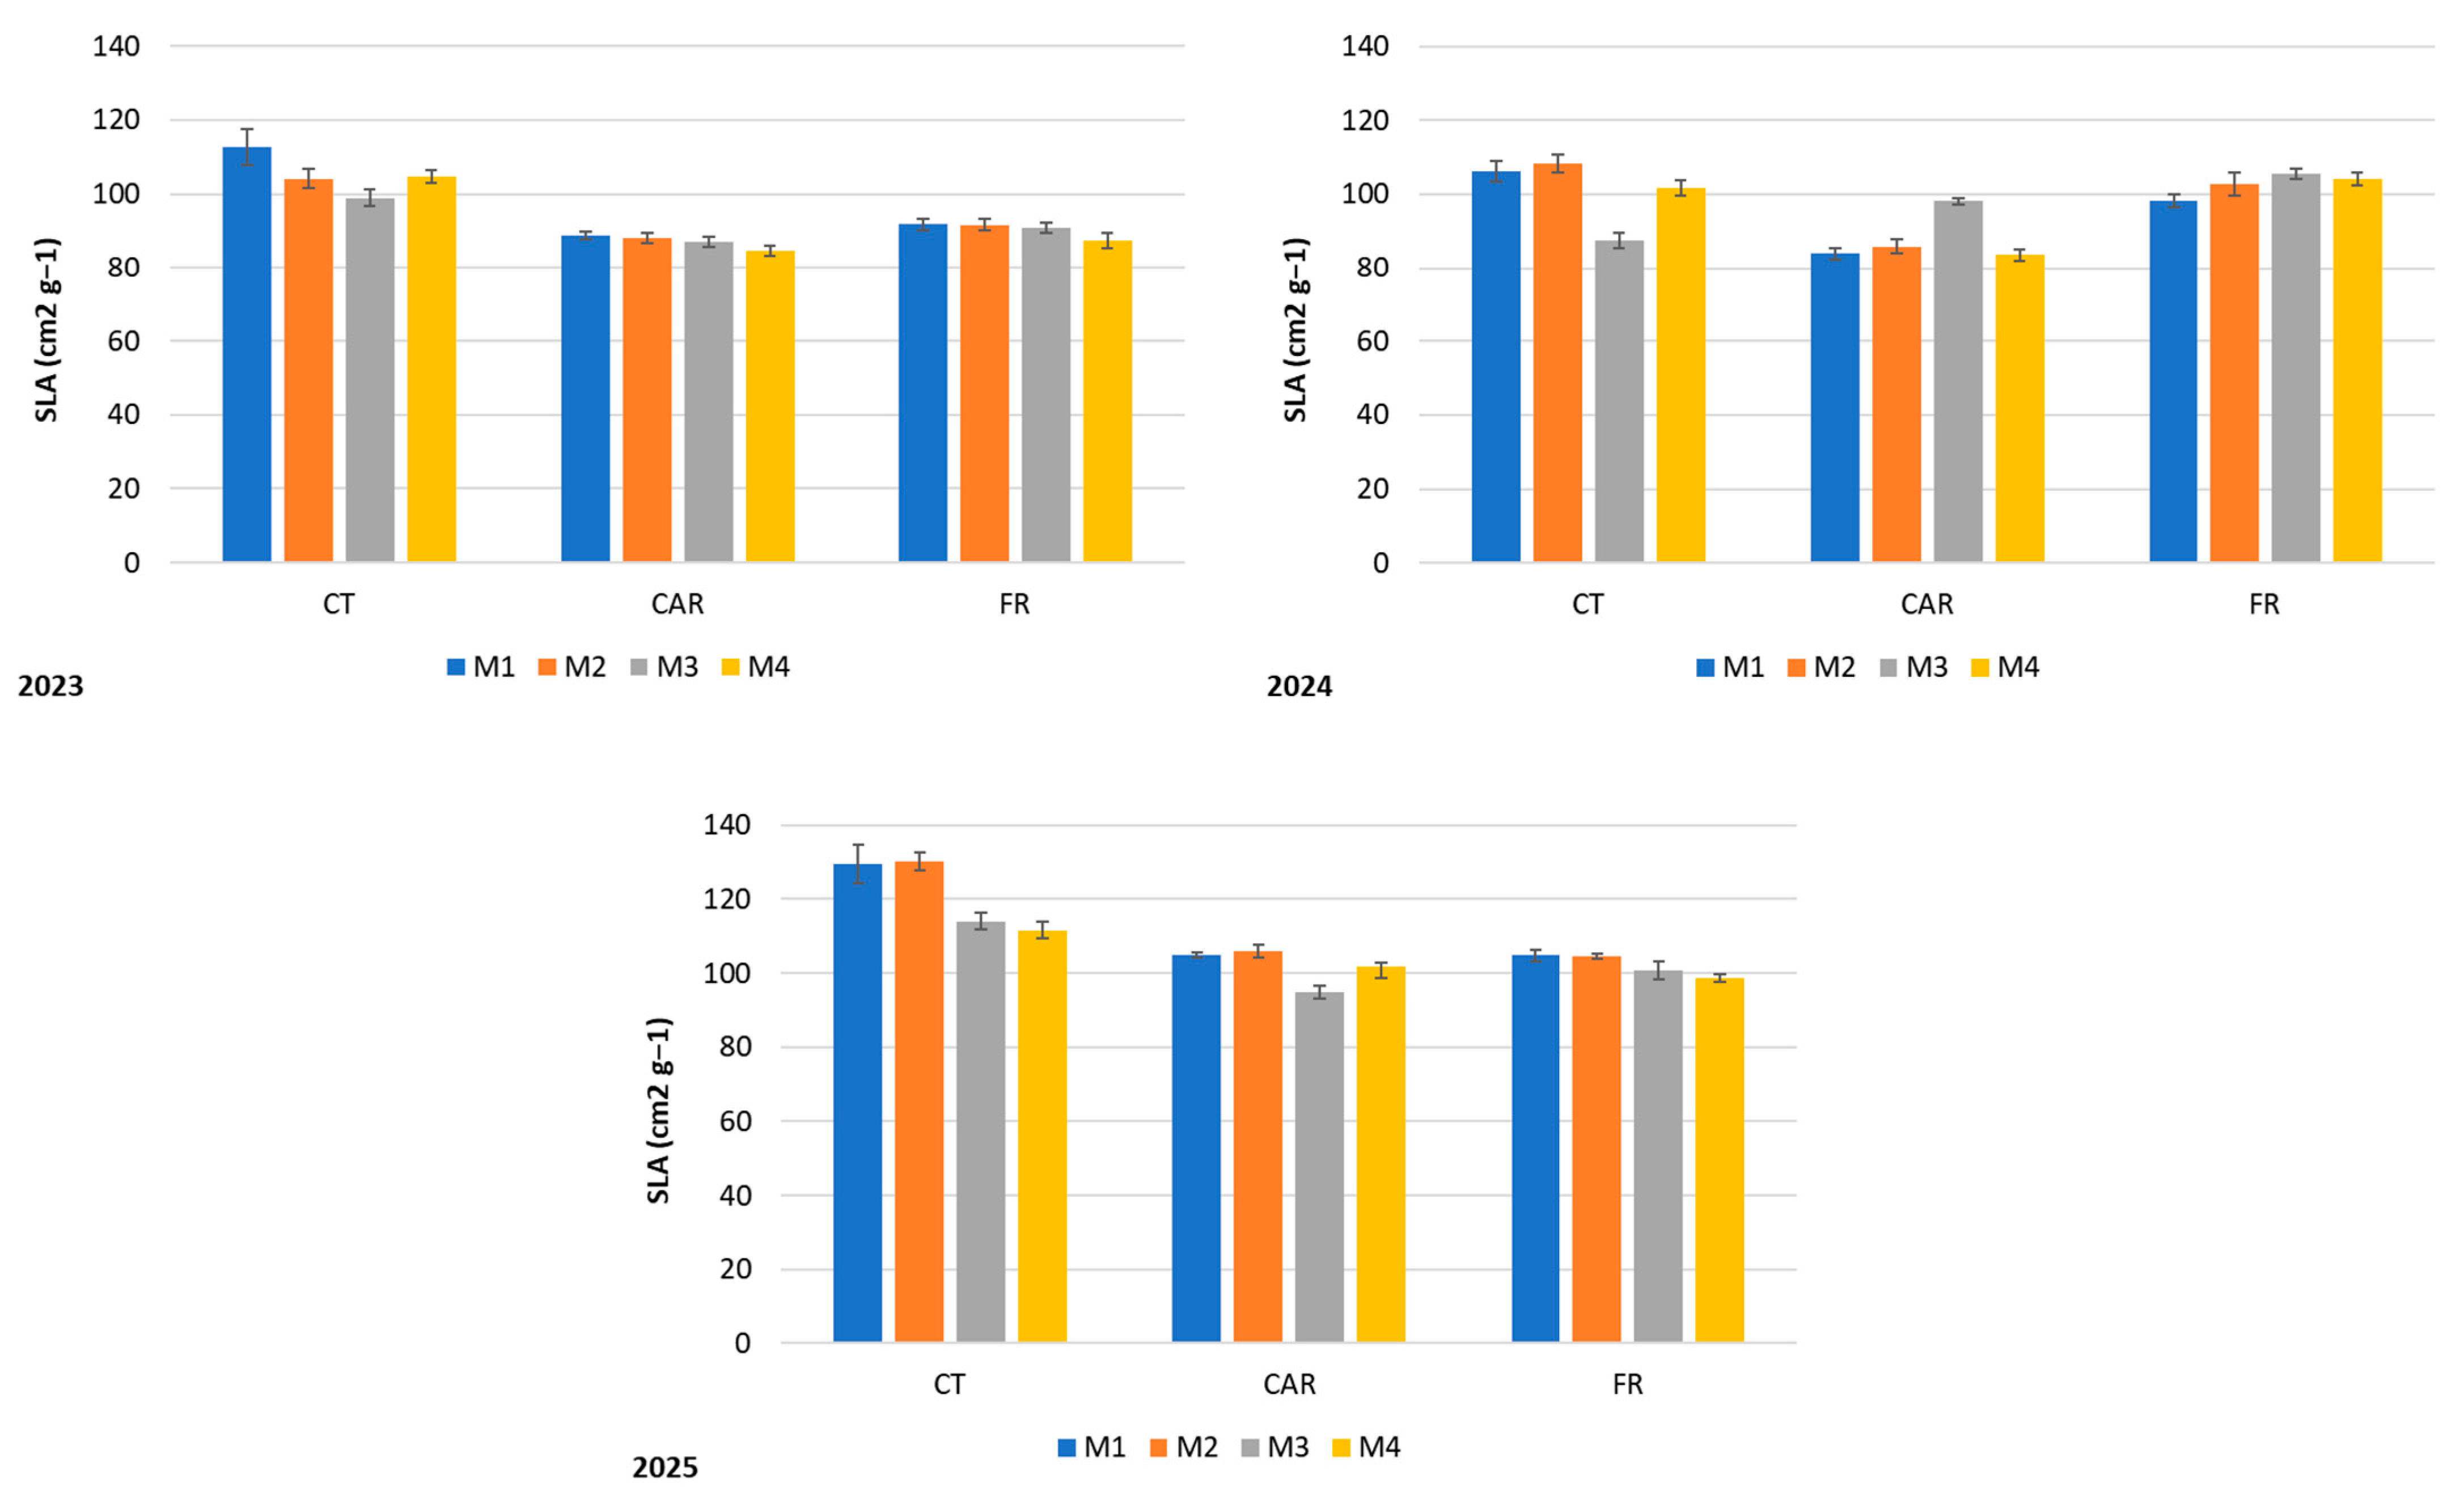
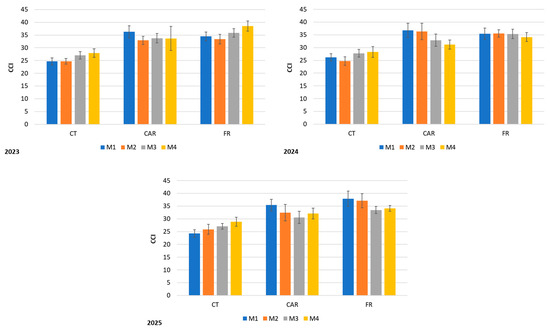
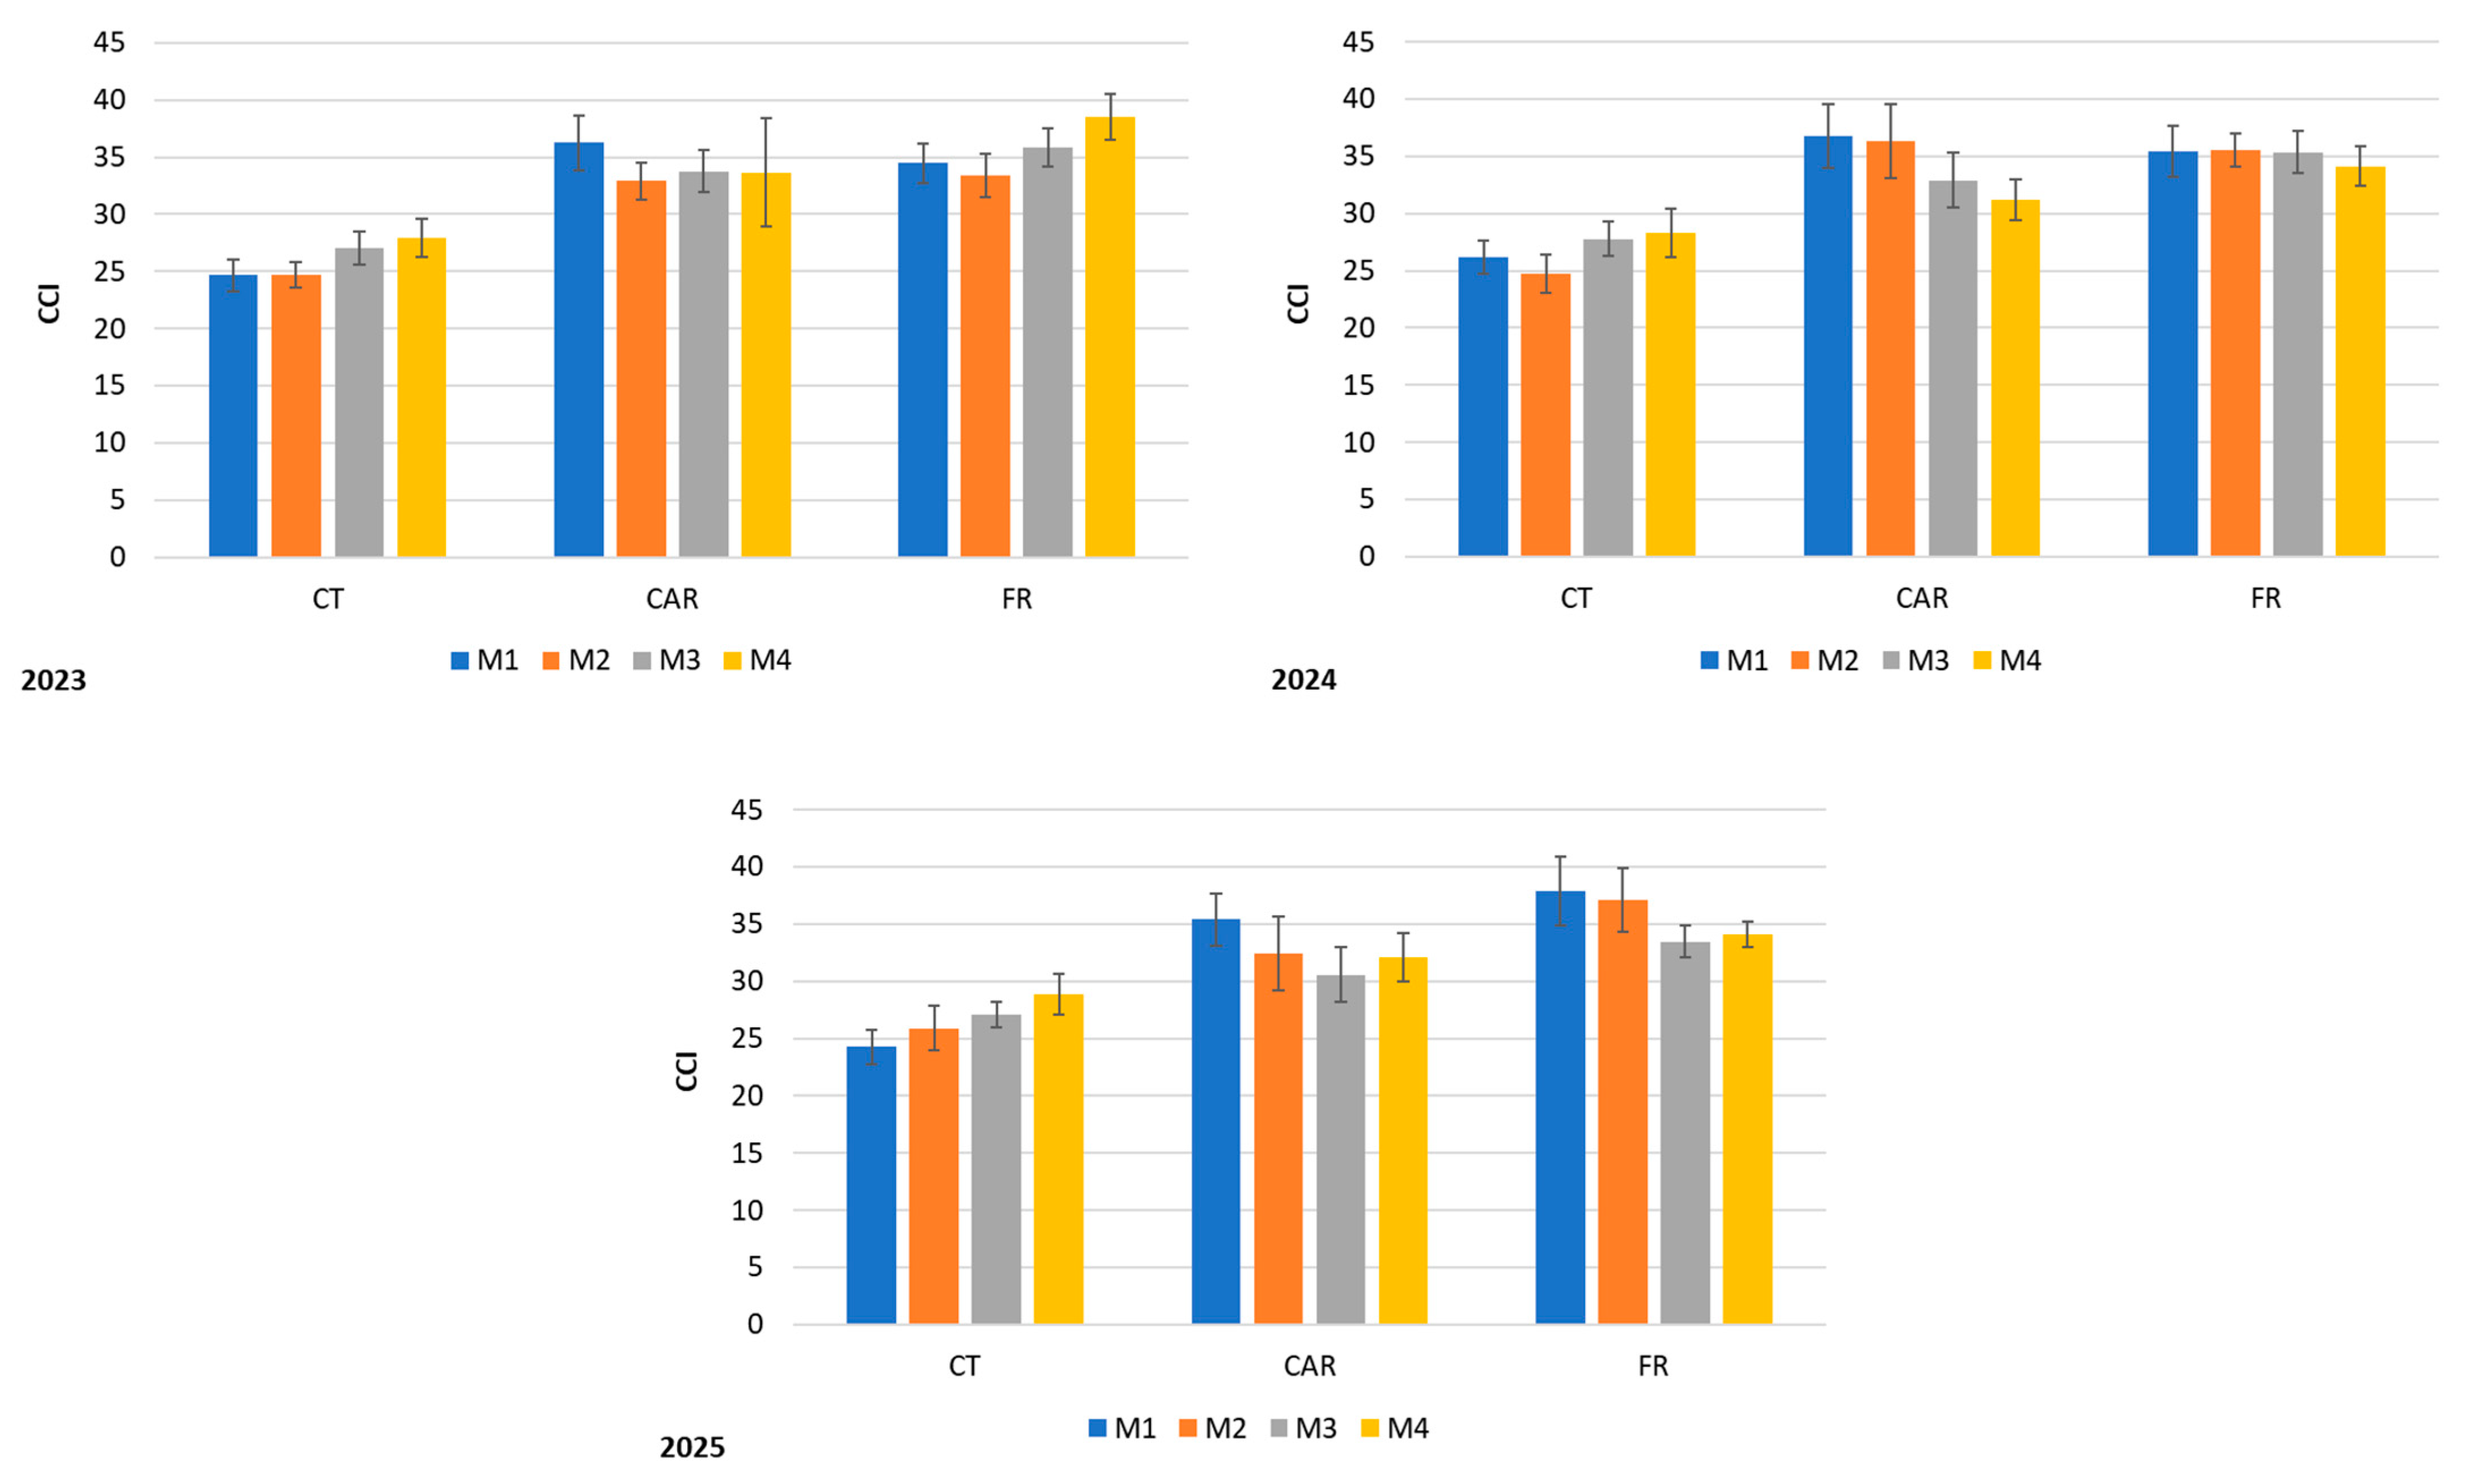
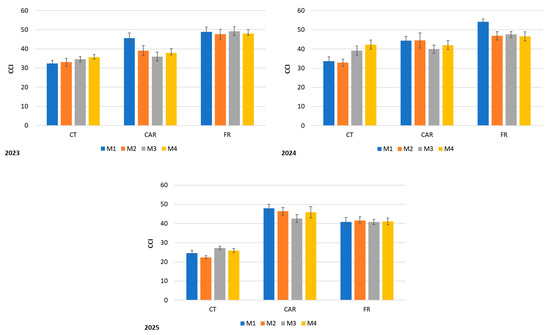
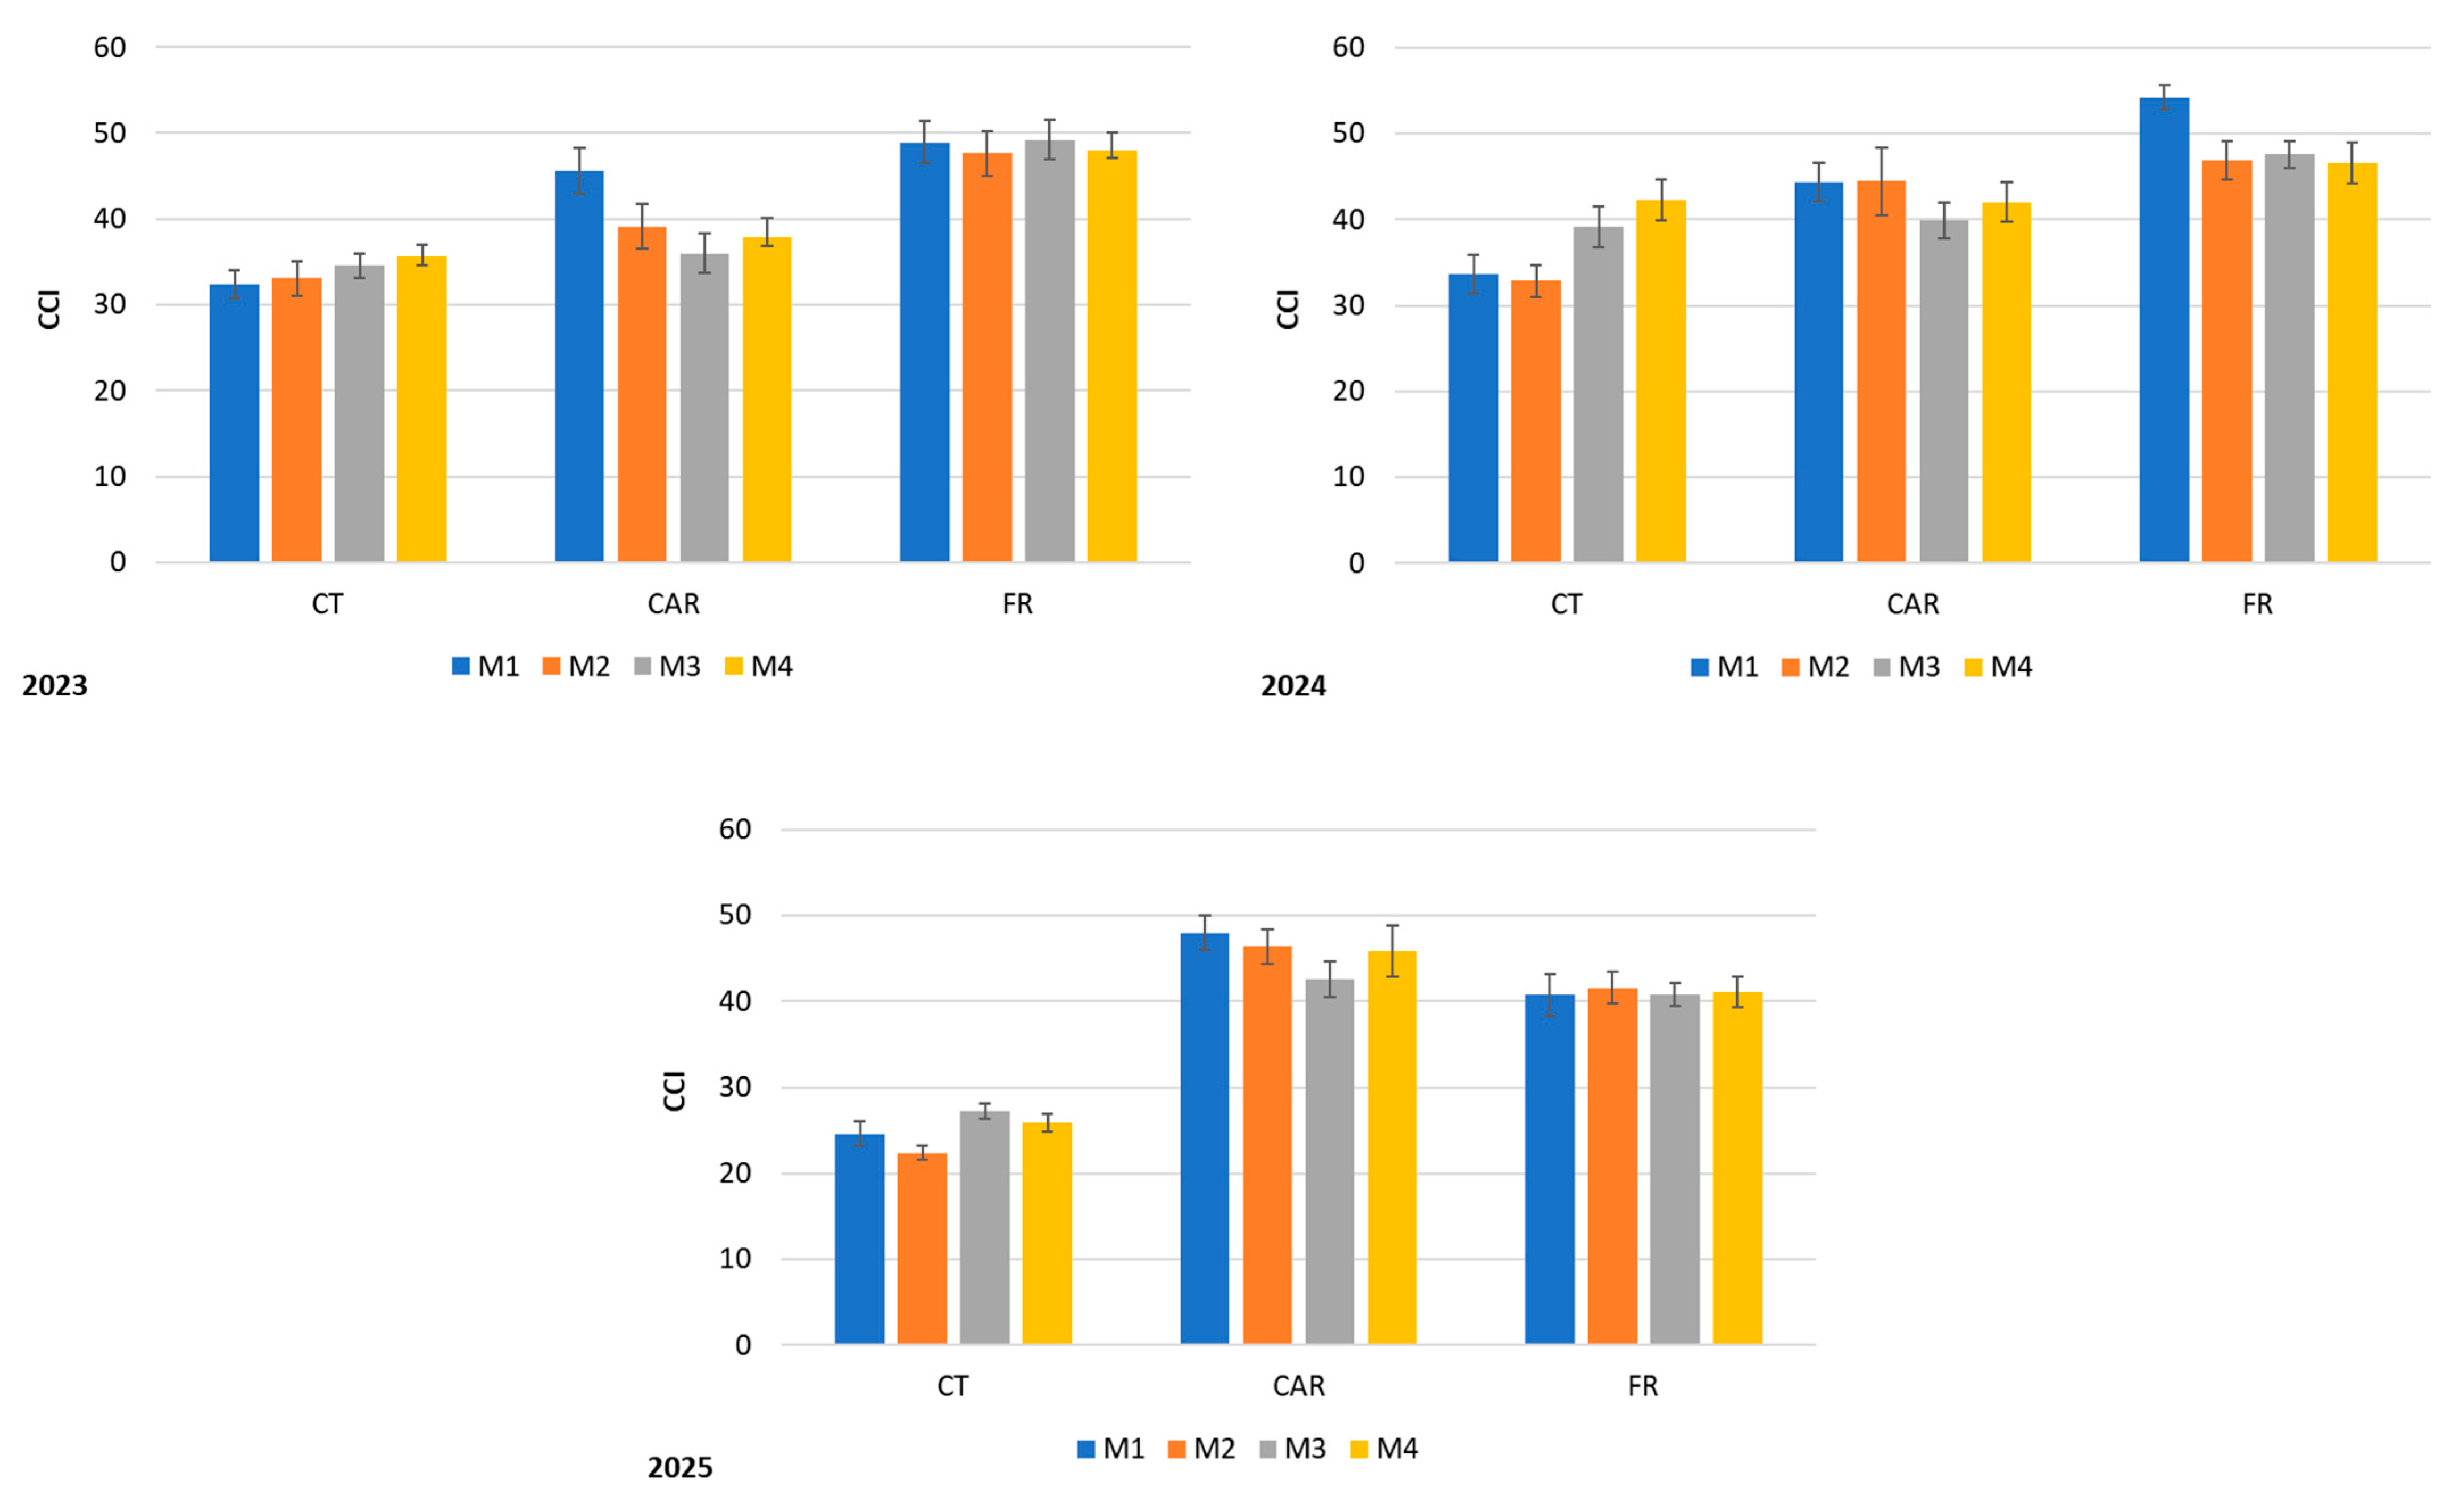
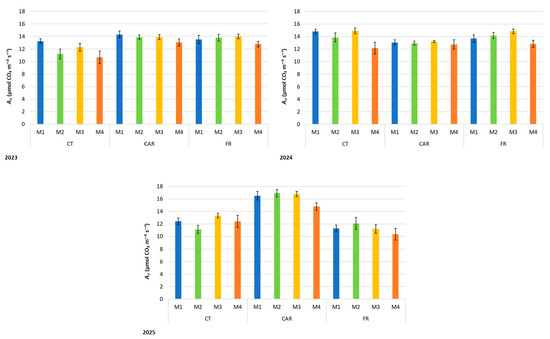
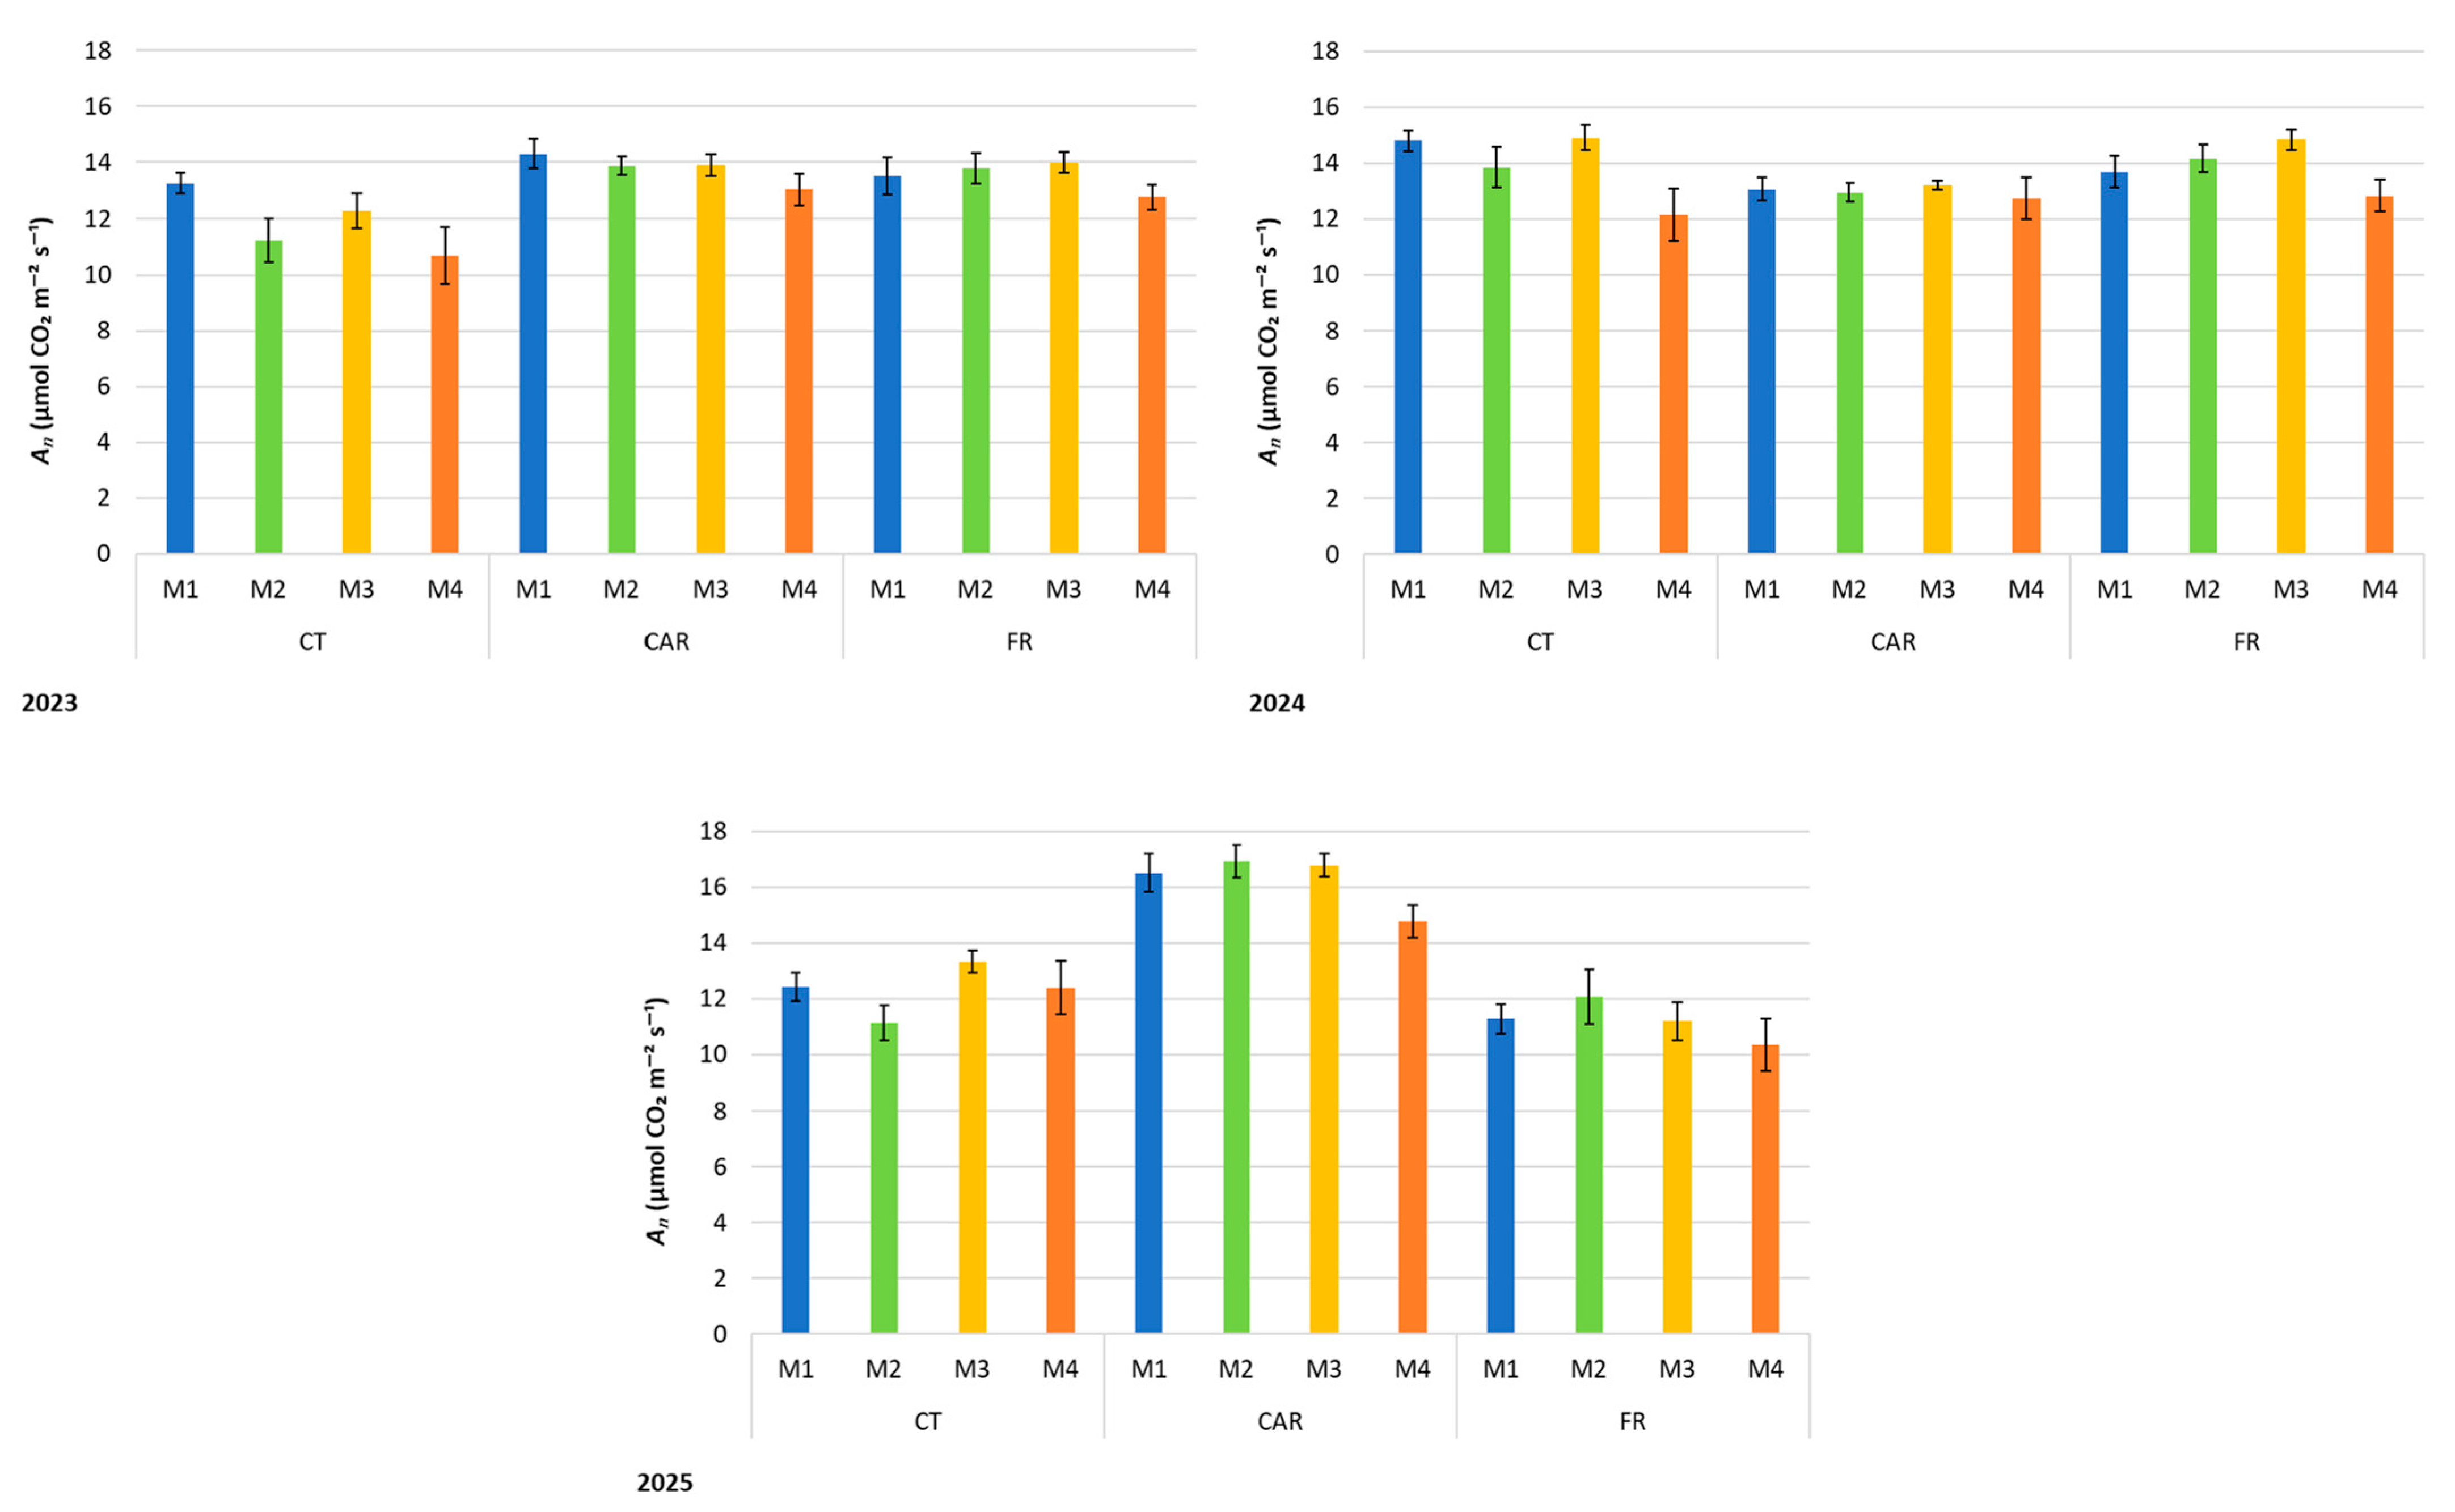
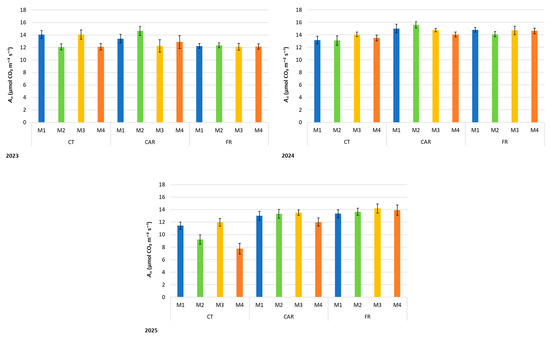
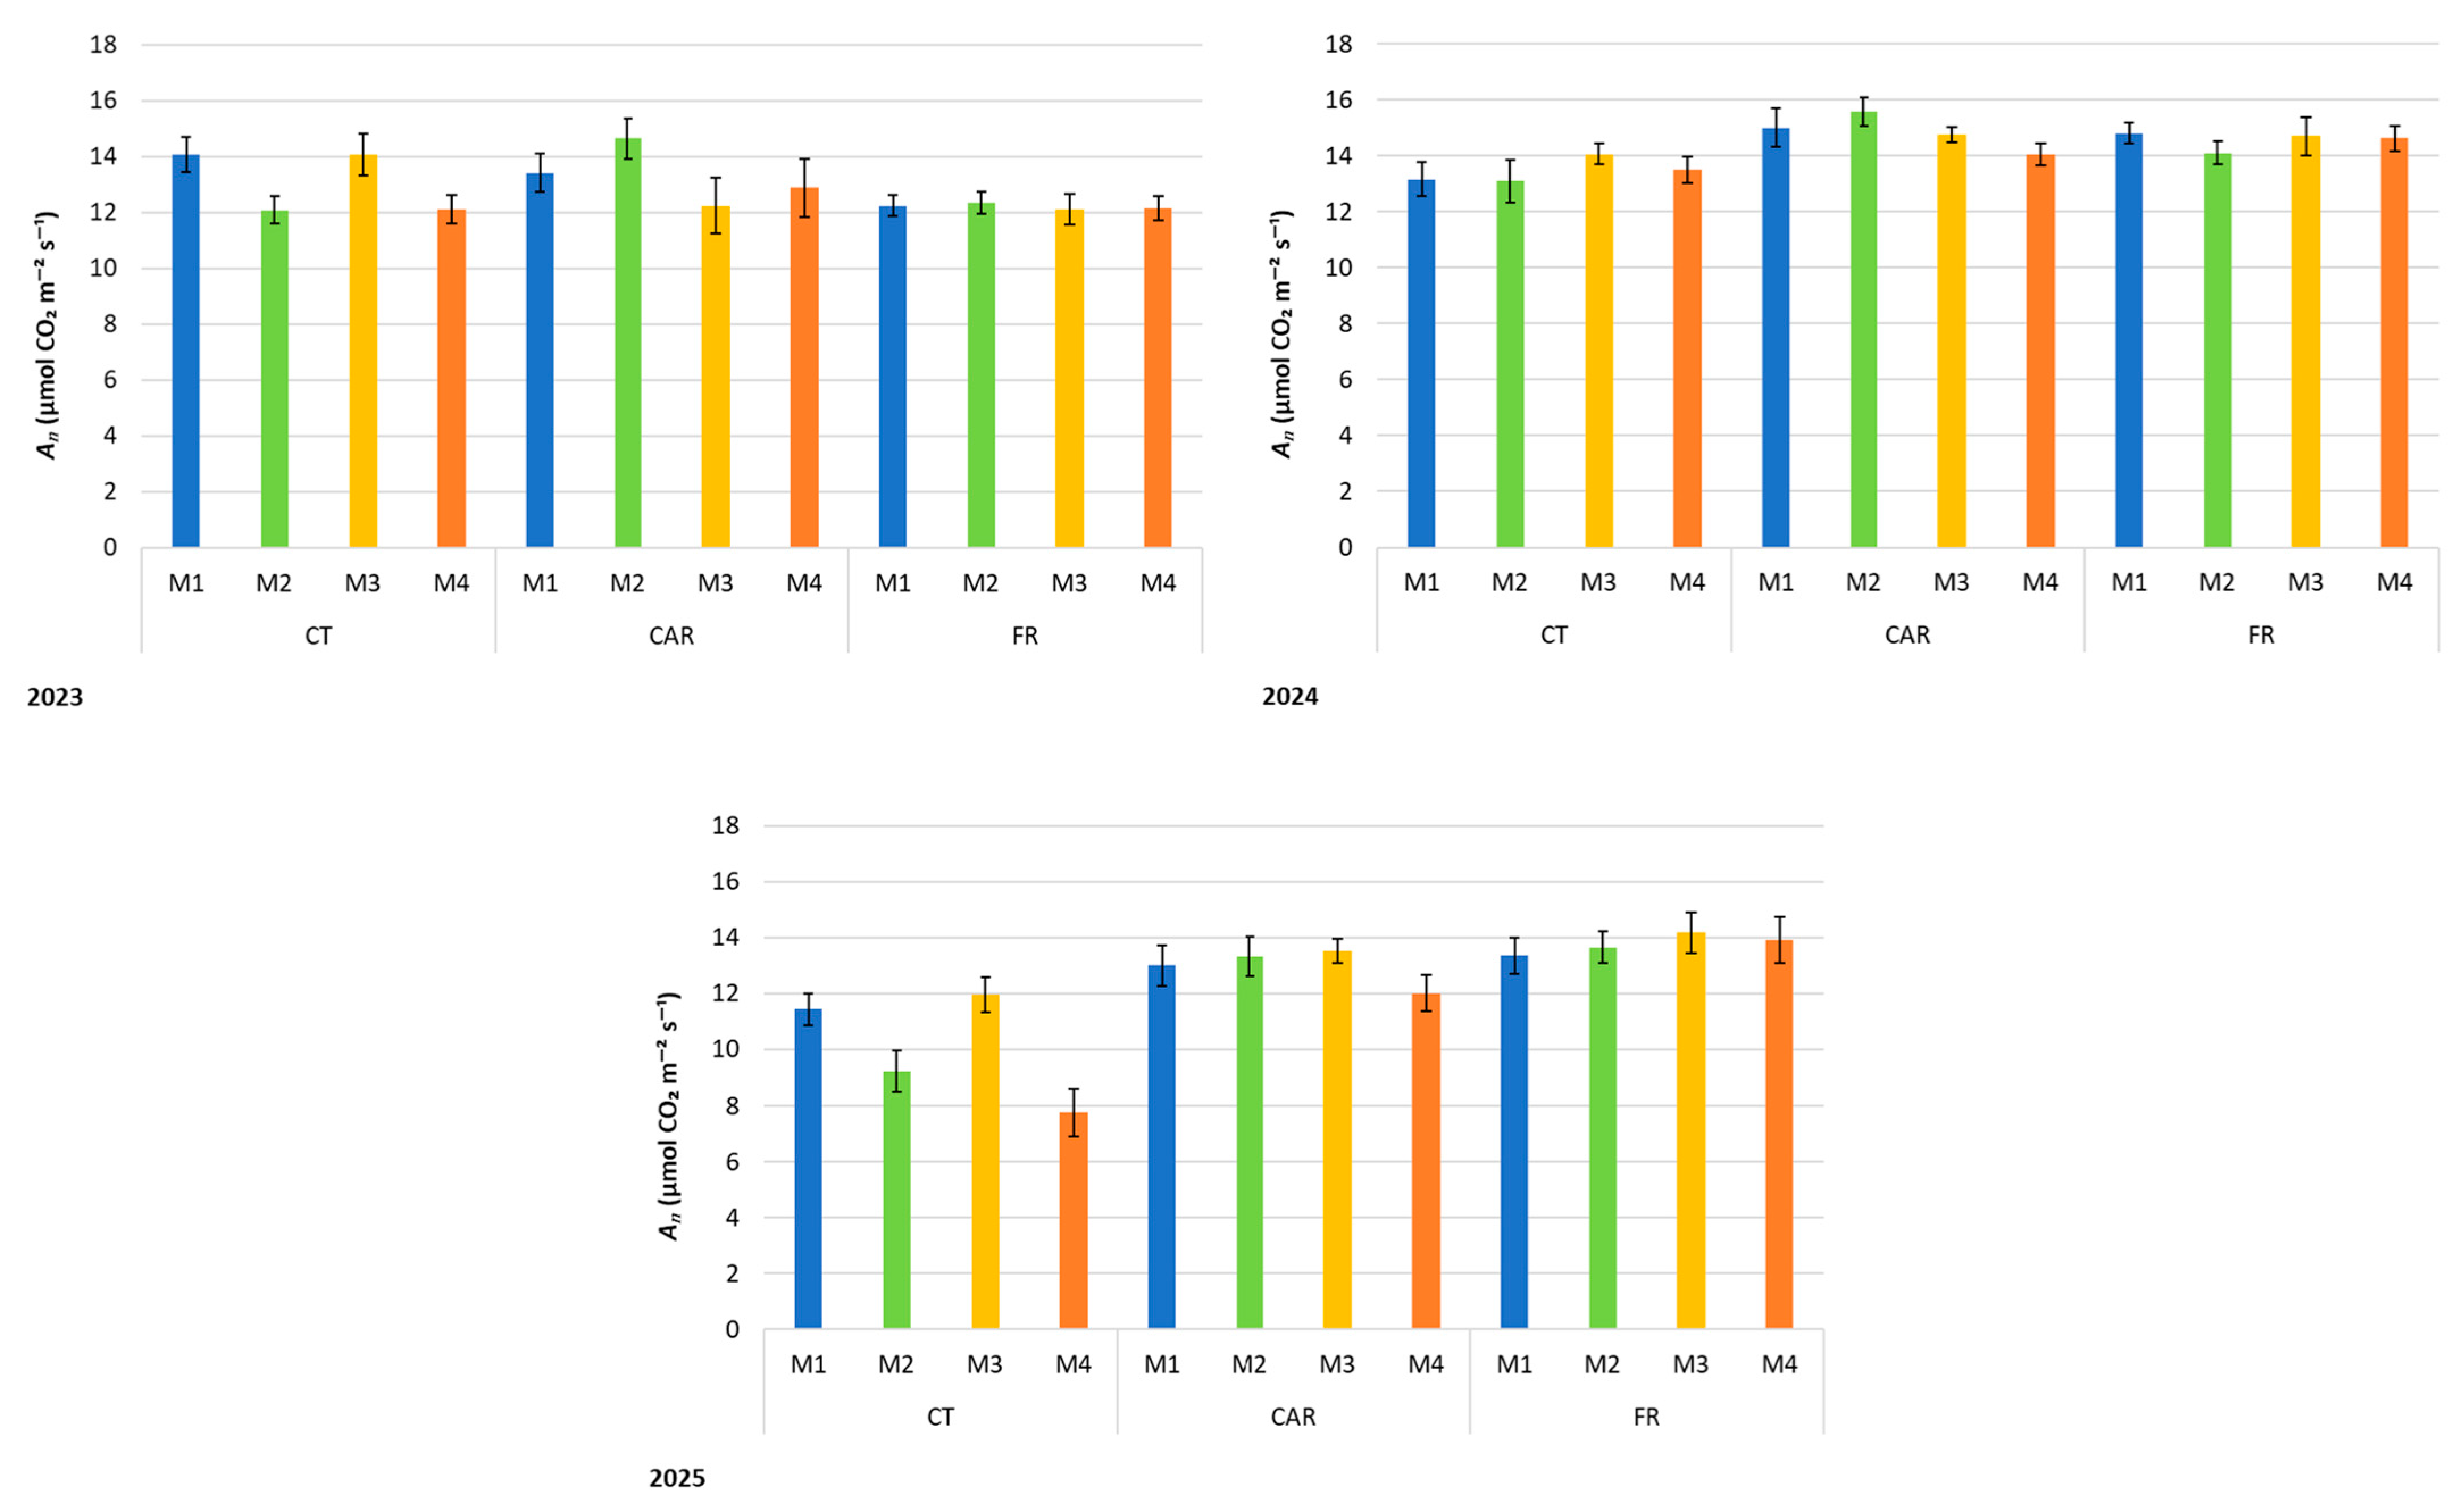
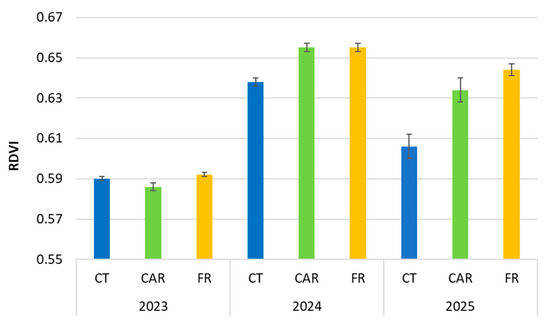
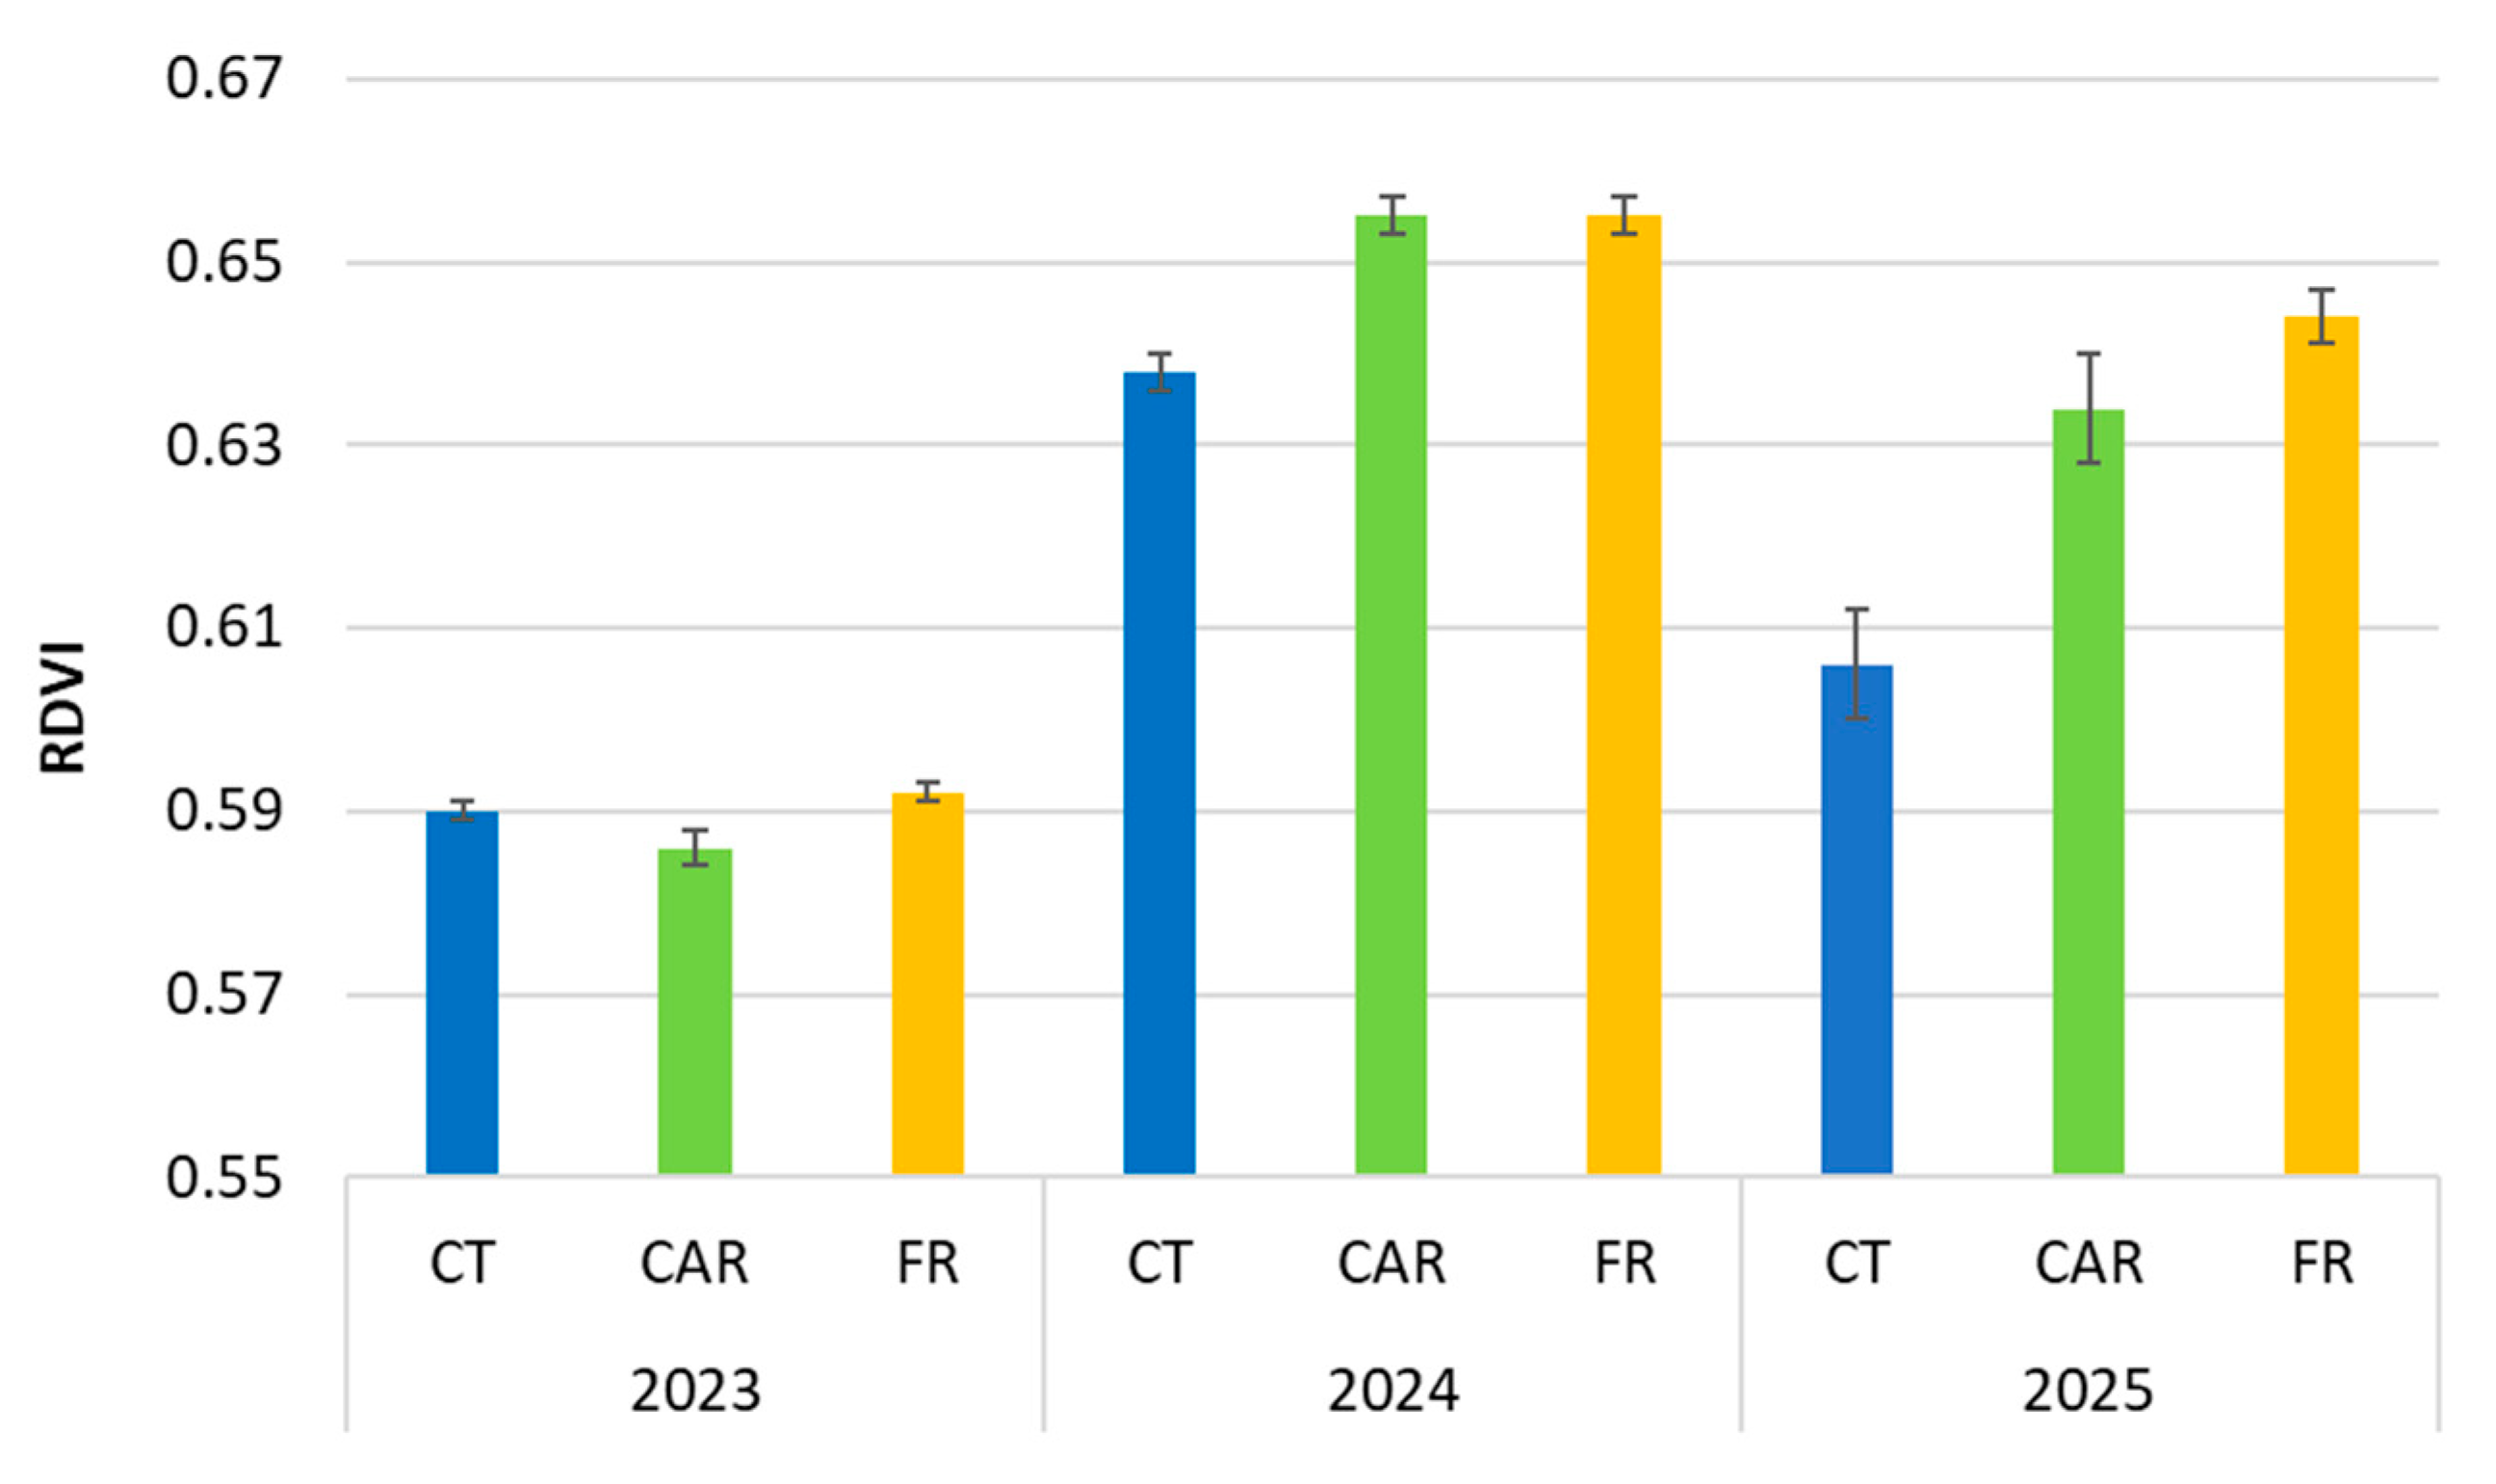
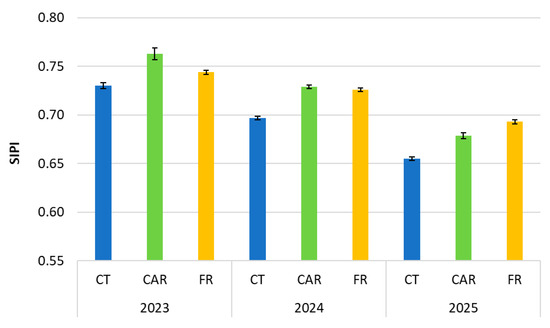
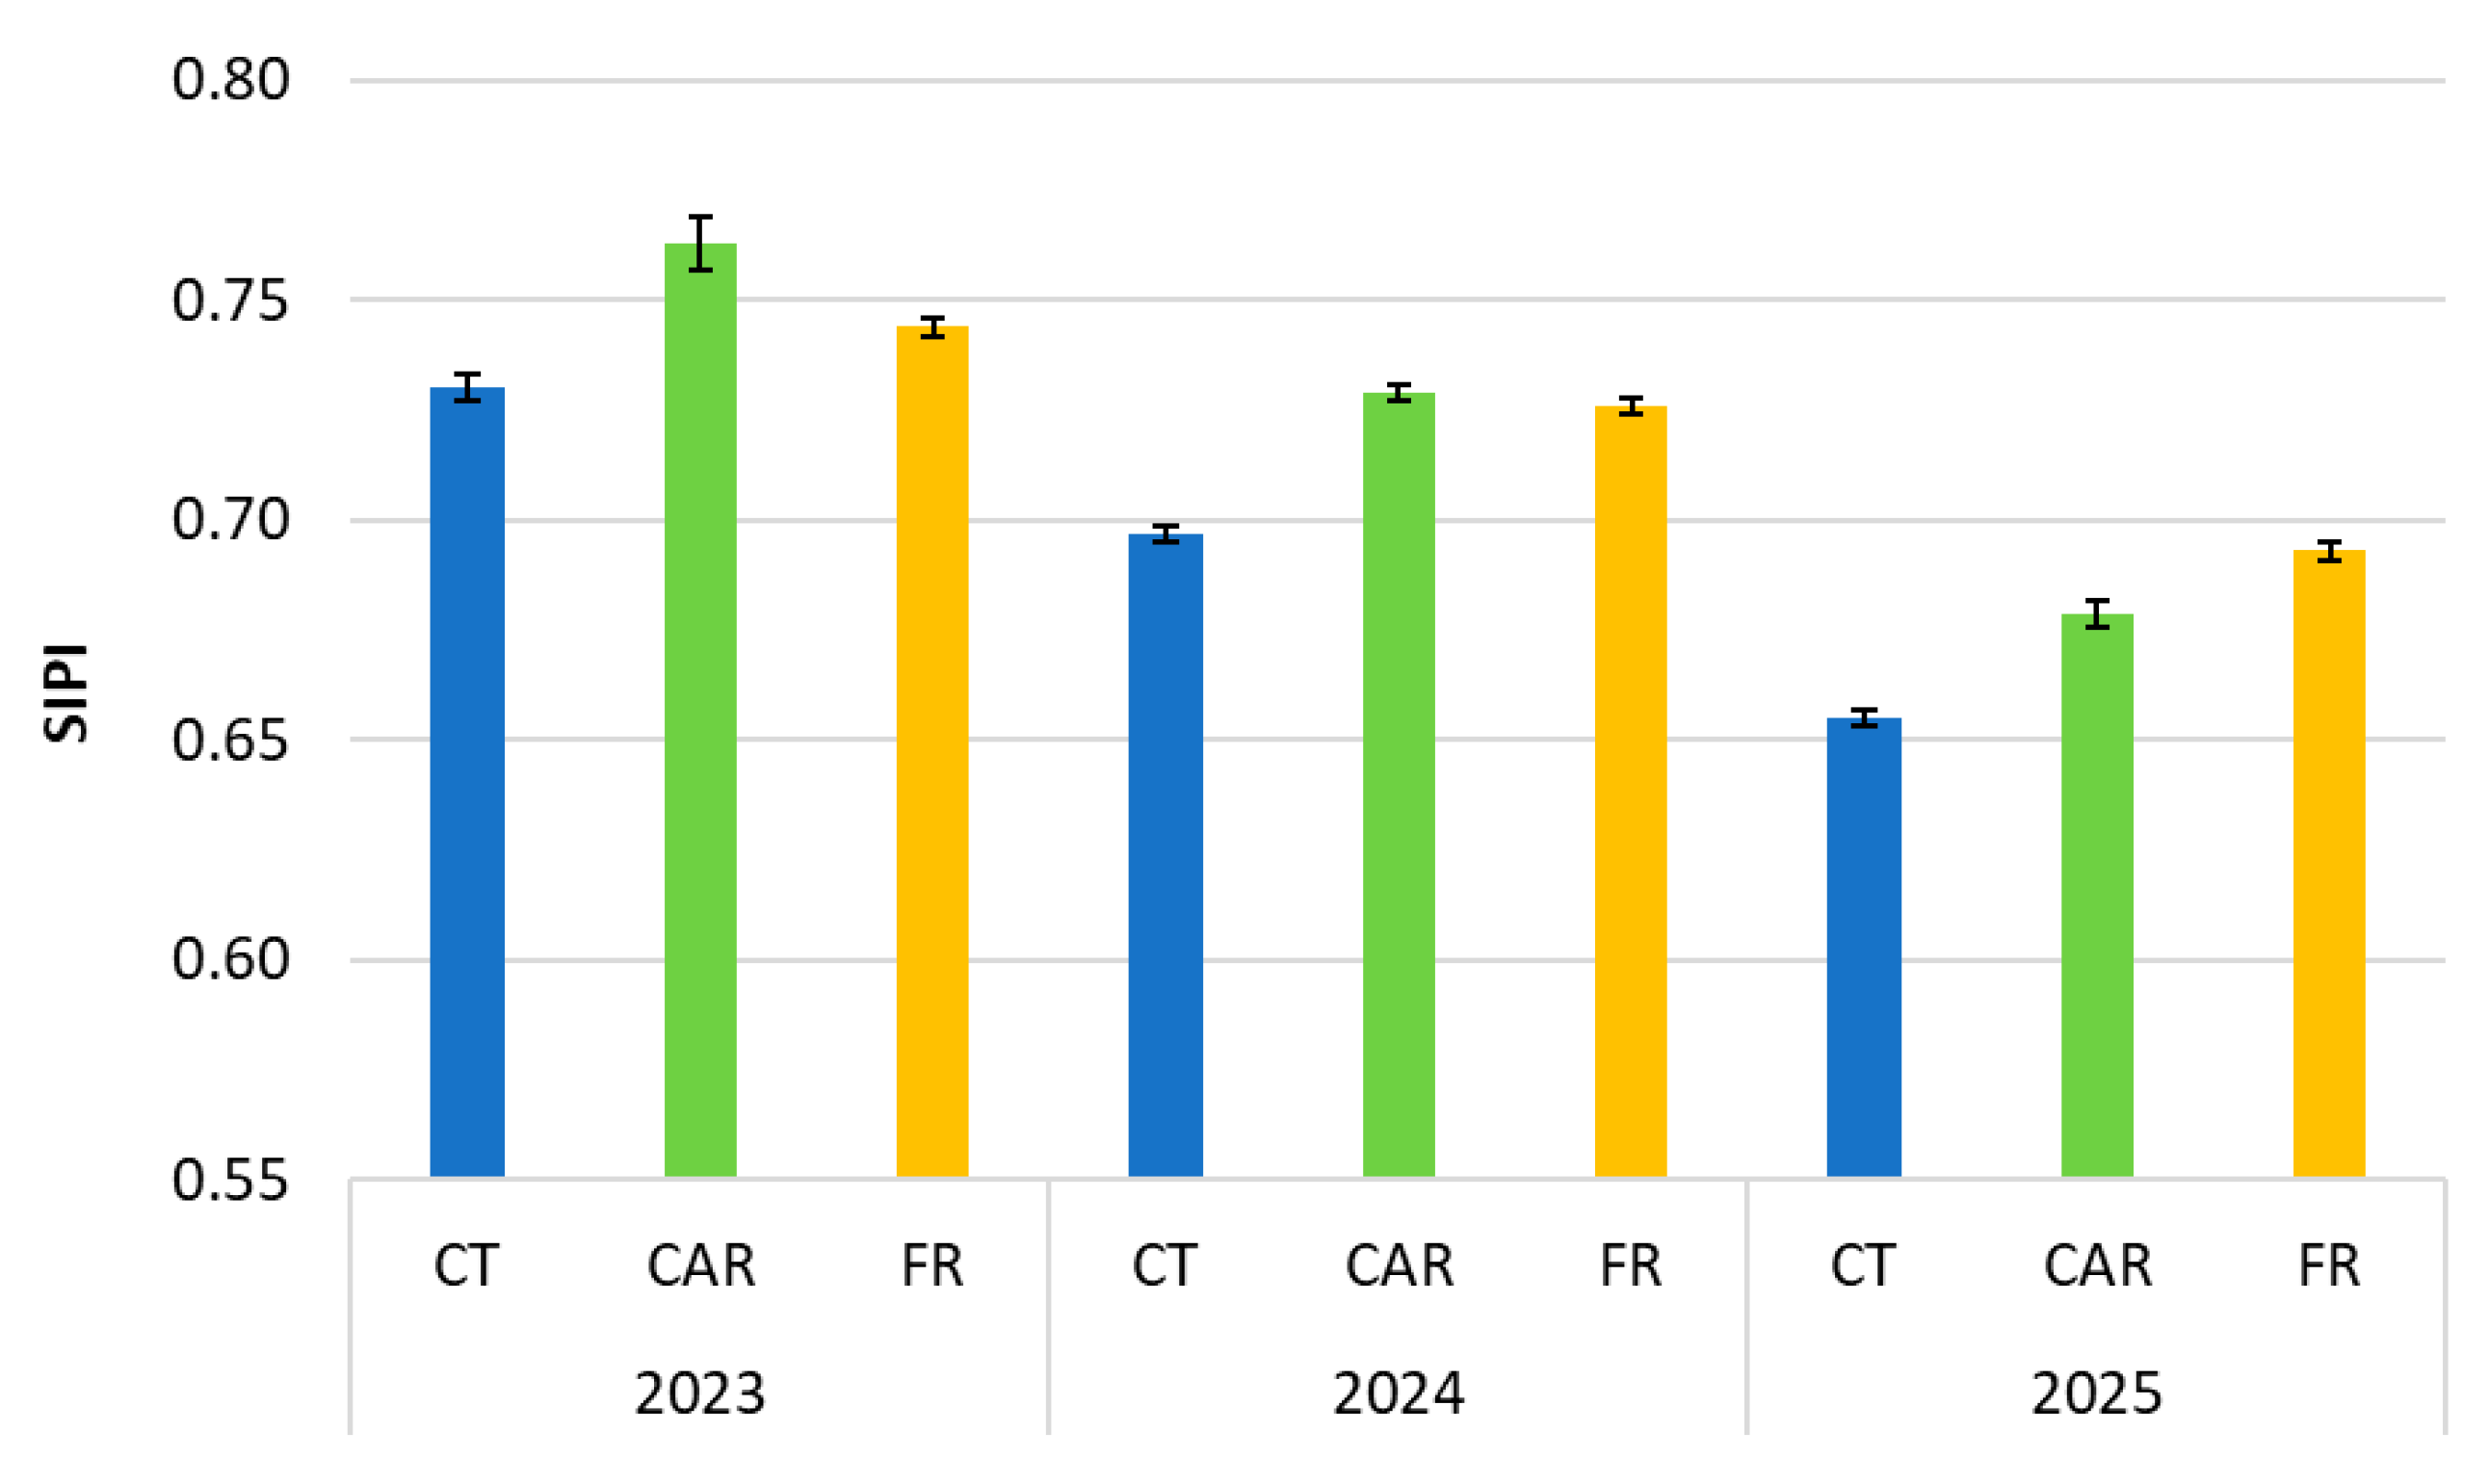
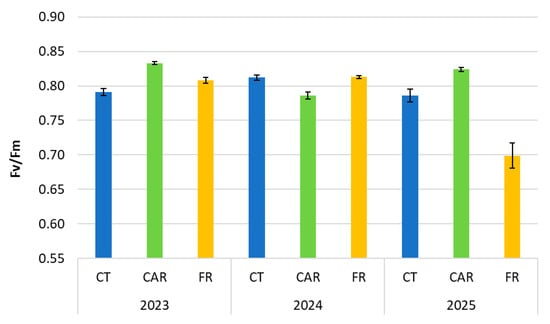
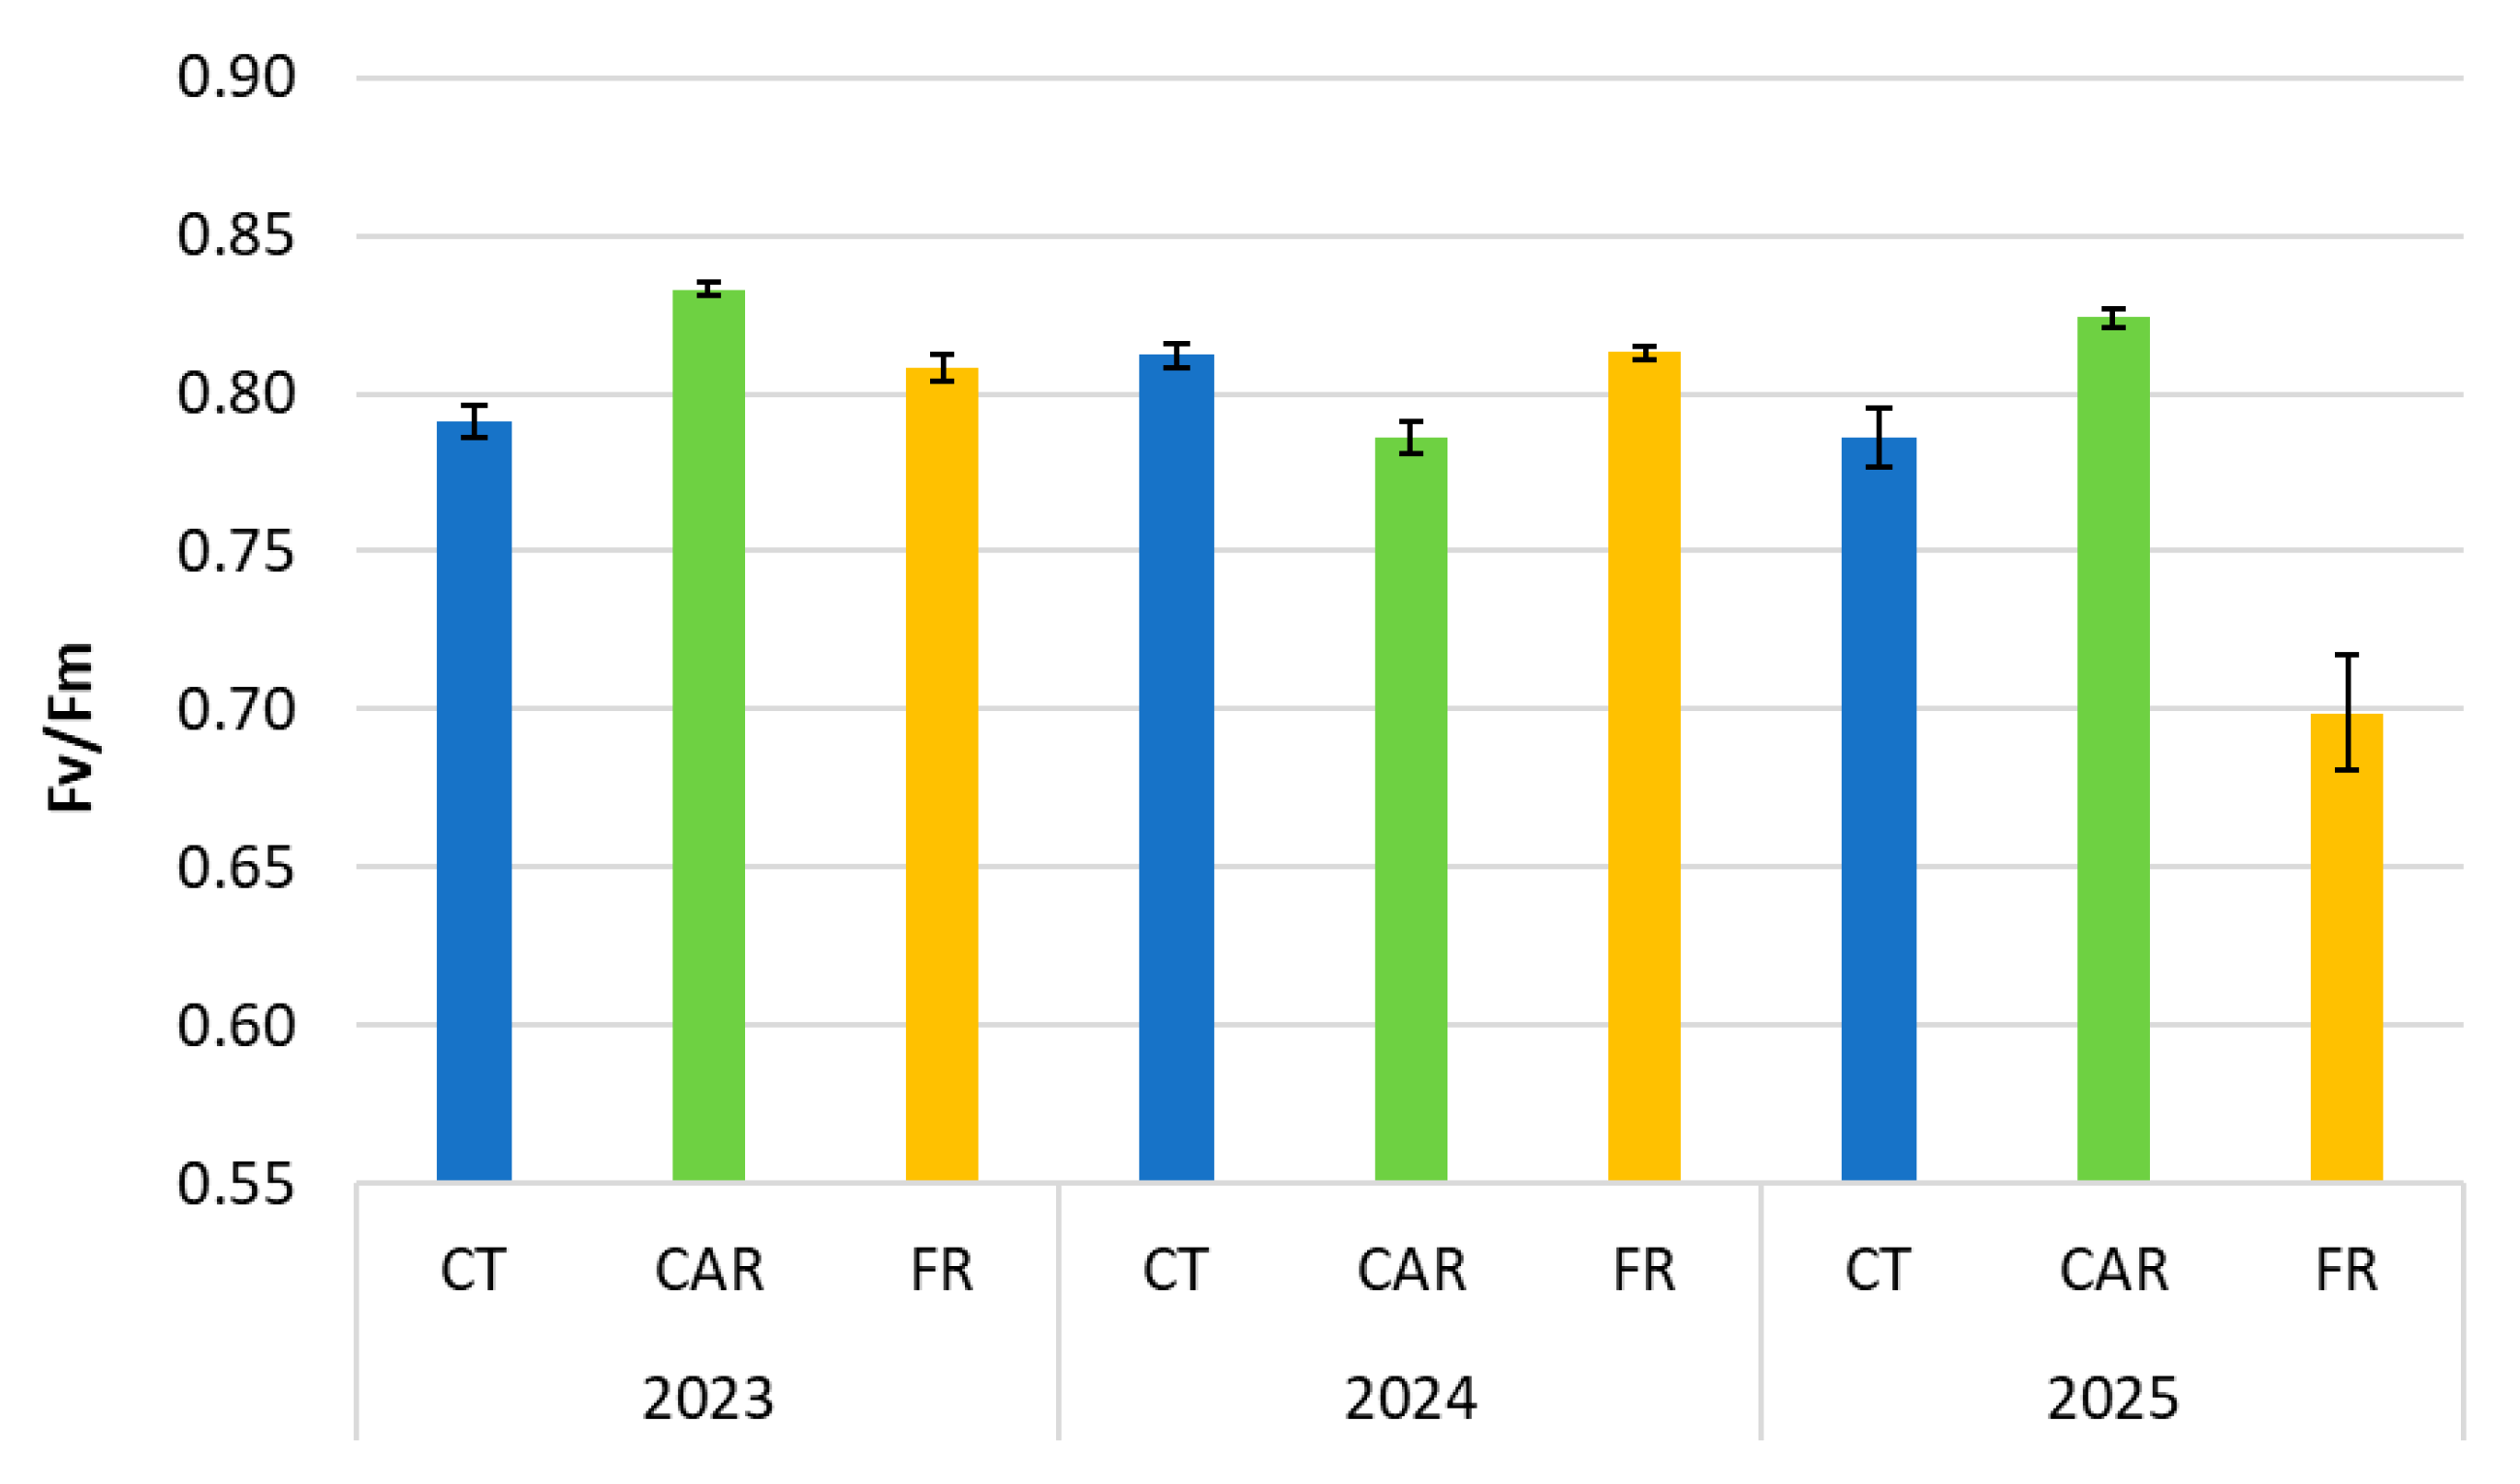
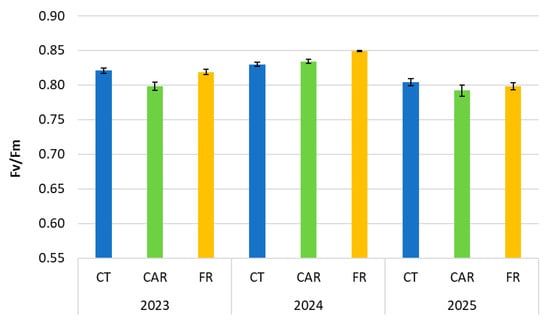
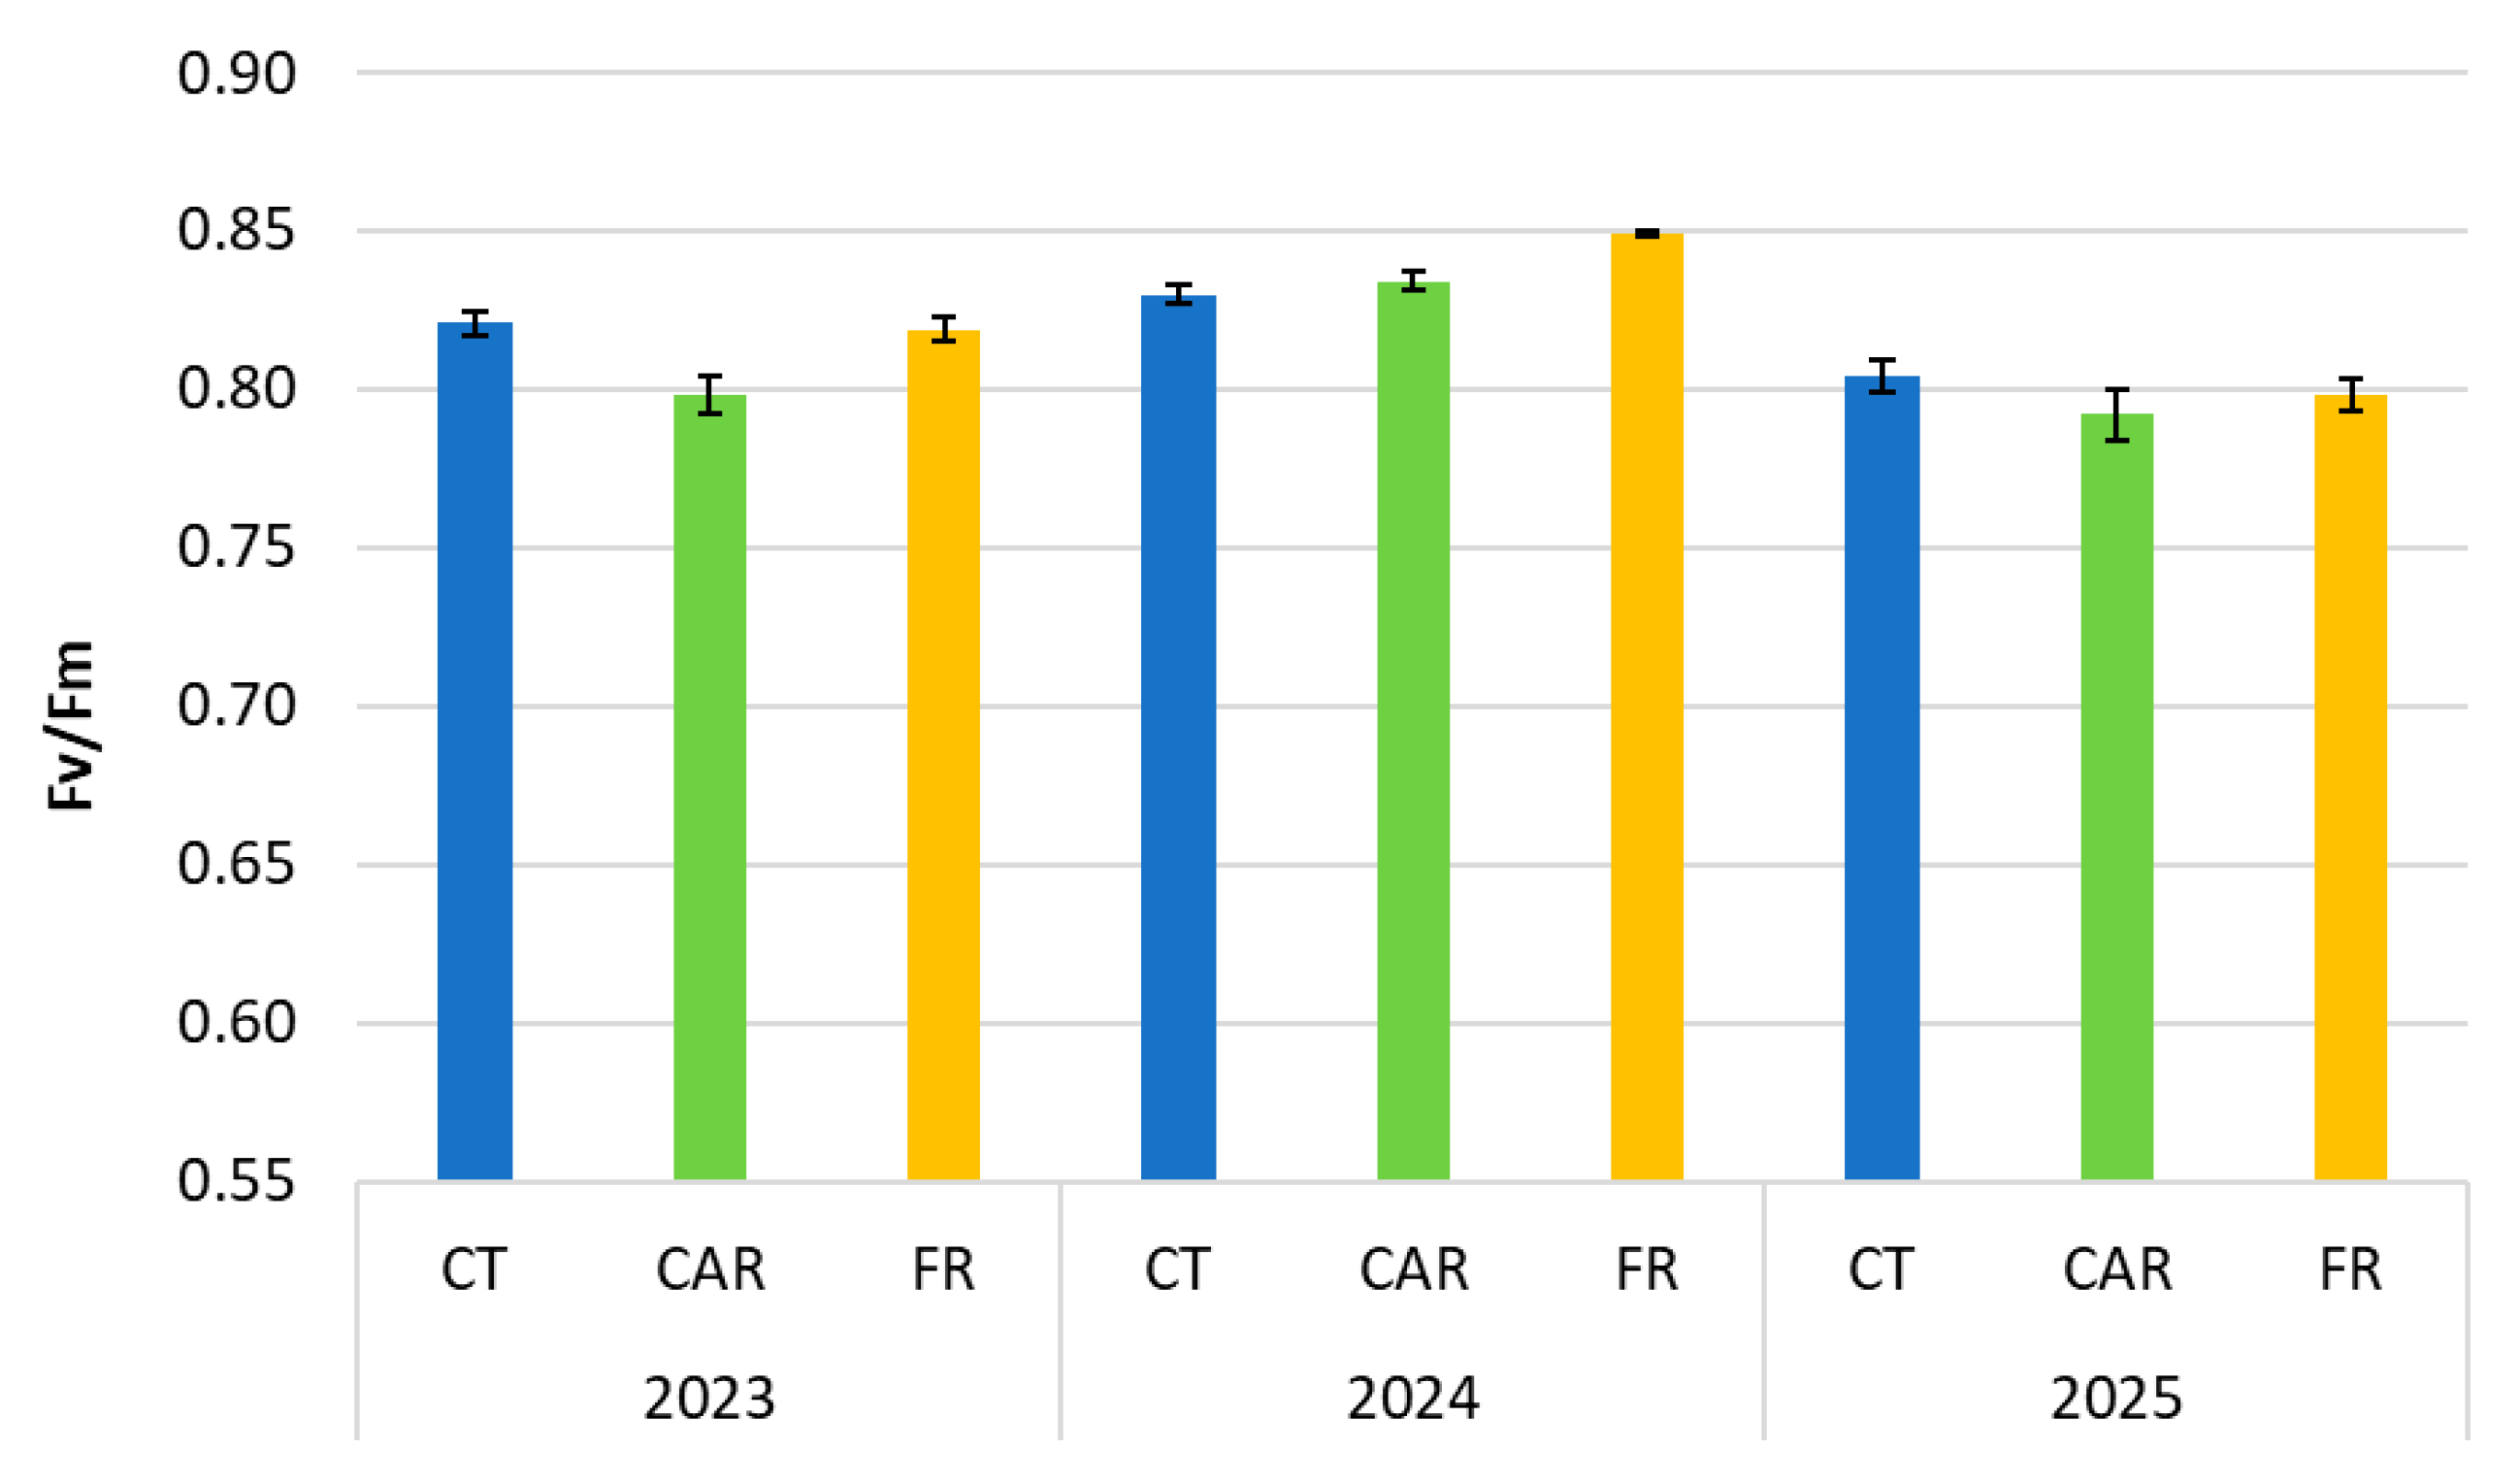
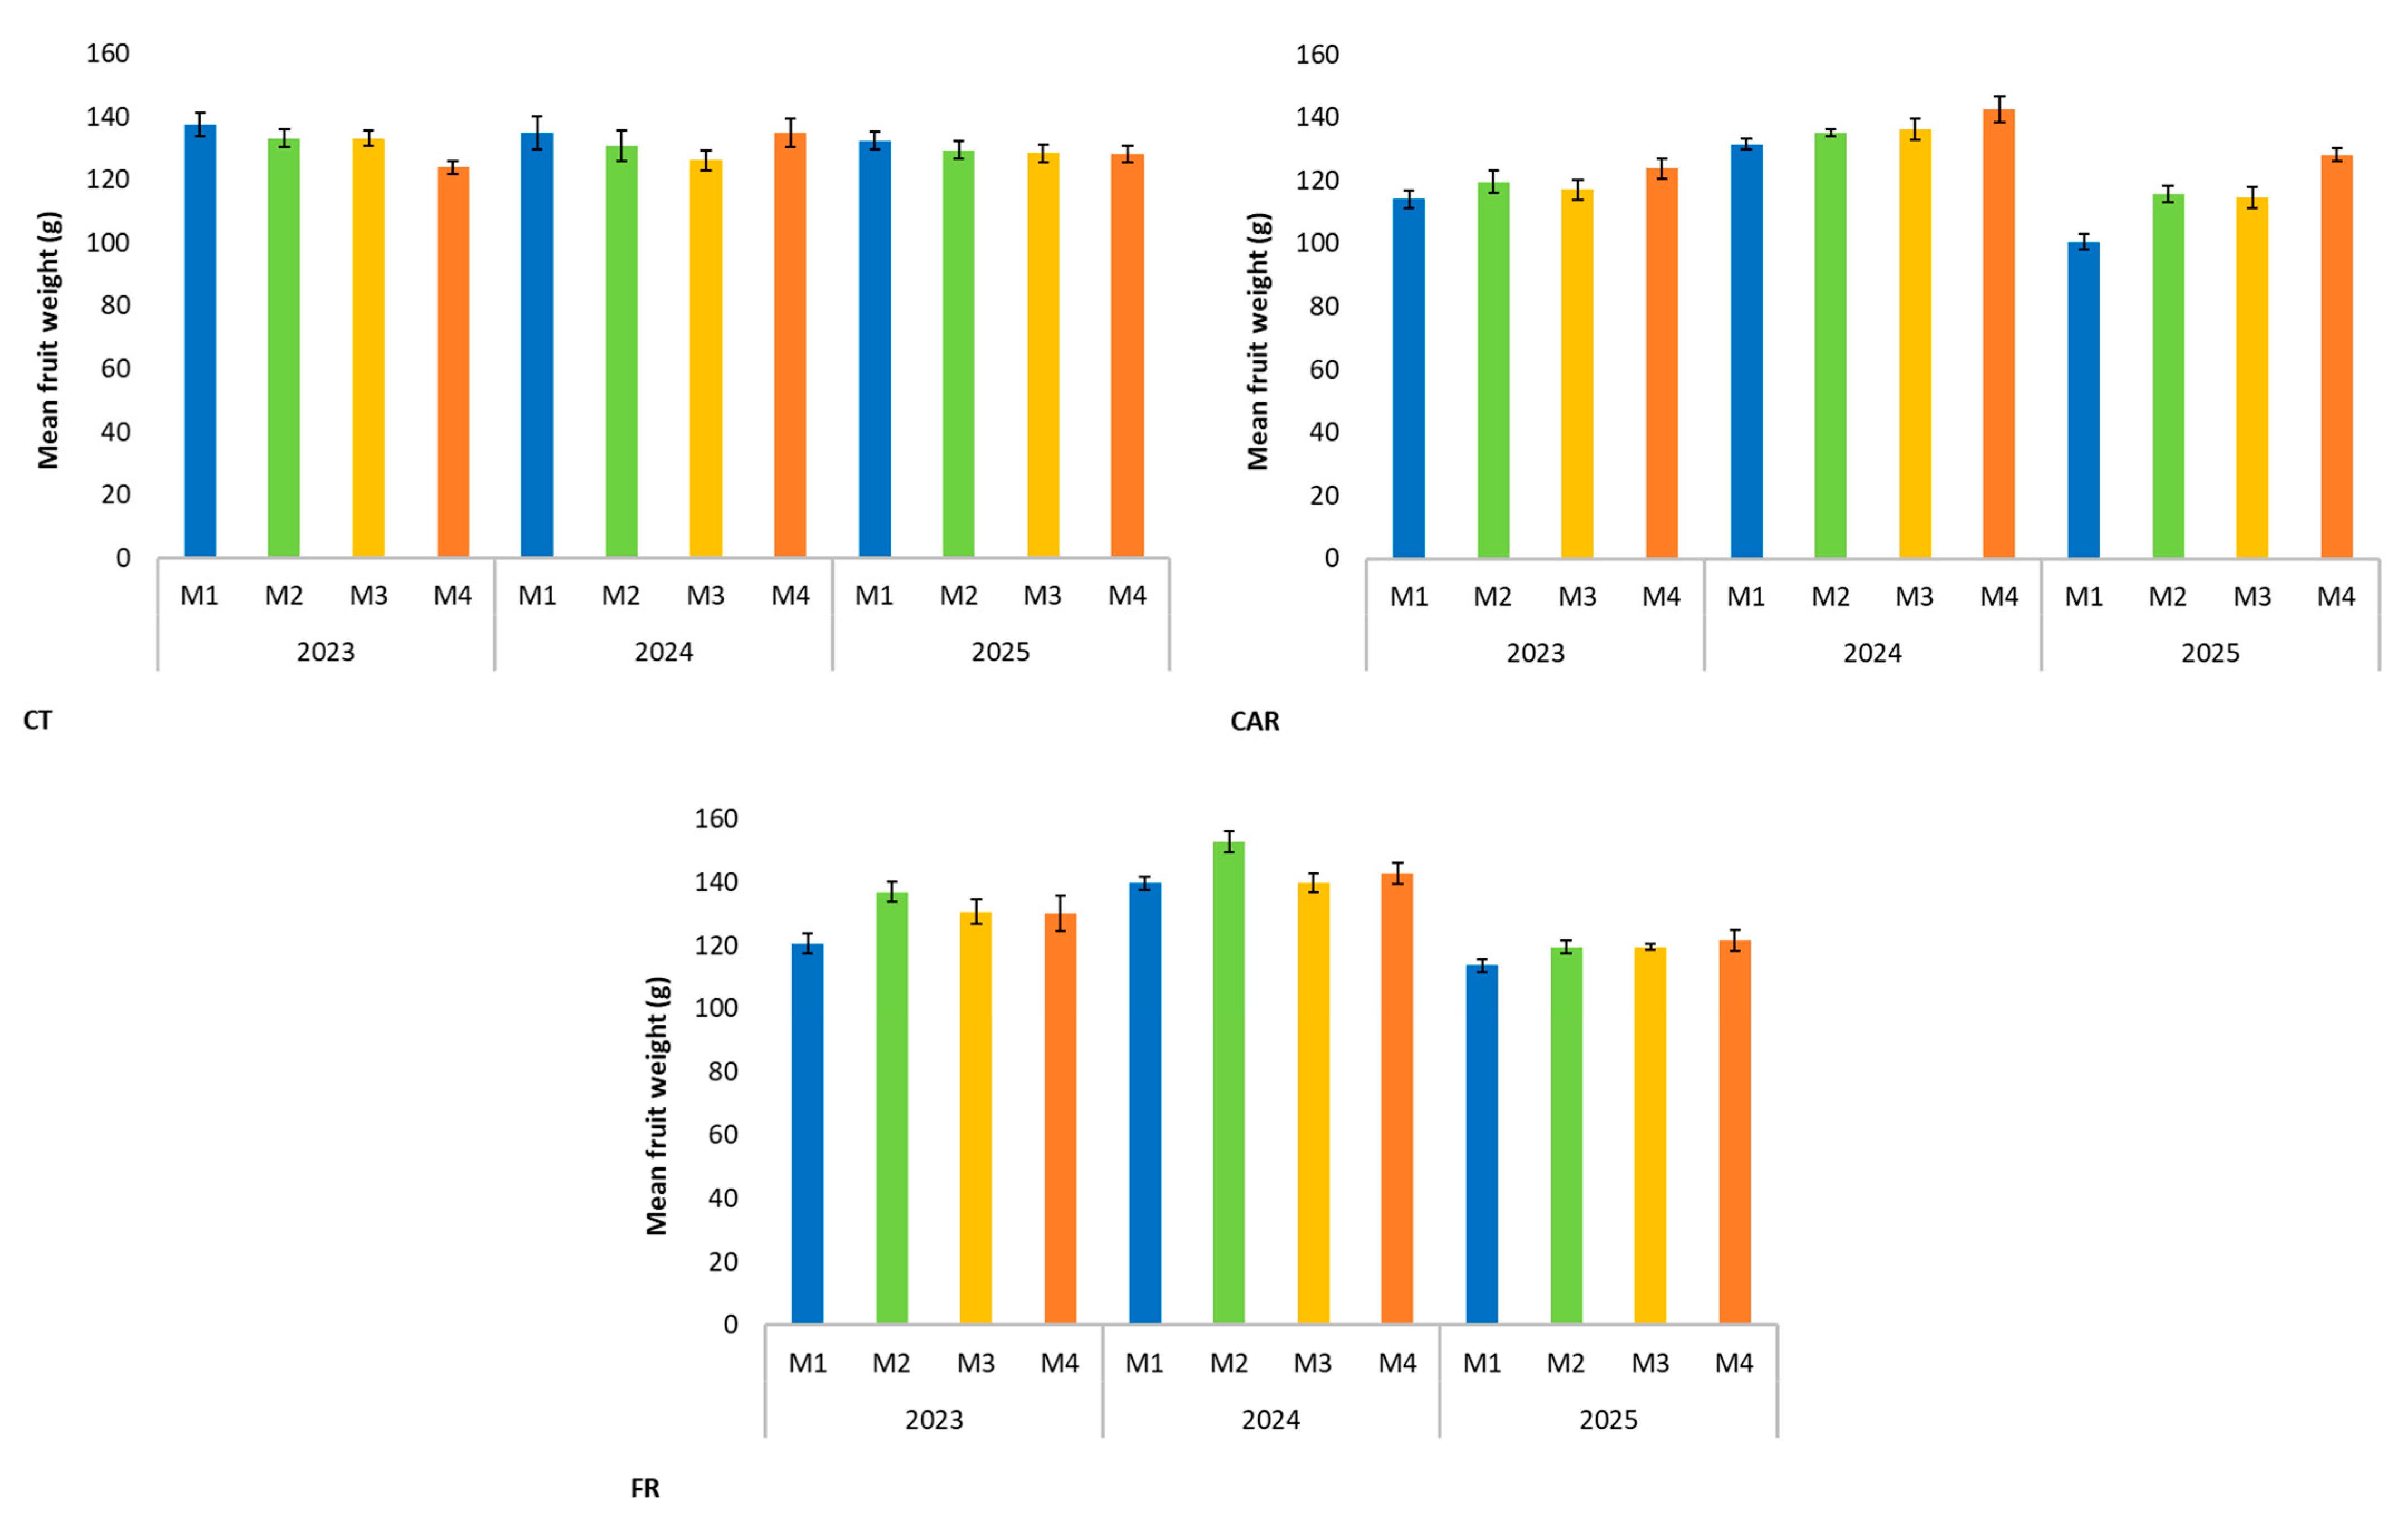

Disclaimer/Publisher’s Note: The statements, opinions and data contained in all publications are solely those of the individual author(s) and contributor(s) and not of MDPI and/or the editor(s). MDPI and/or the editor(s) disclaim responsibility for any injury to people or property resulting from any ideas, methods, instructions or products referred to in the content. |
© 2026 by the authors. Licensee MDPI, Basel, Switzerland. This article is an open access article distributed under the terms and conditions of the Creative Commons Attribution (CC BY) license.