


Highlights
What are the main findings?
- •
- The yellow-fruited Rubus hirsutus (‘Y’) is a natural fruit color variant of the red-fruited Rubus hirsutus (‘R’). Its total amino acid content is significantly higher than that of the red fruit, with glutamine showing the greatest difference.
- •
- ‘Y’ exhibits high expression of genes involved in glutamine and branched-chain amino acid synthesis, while ‘R’ shows dominant expression of genes in the cysteine and aromatic amino acid pathways.
- •
- ‘R’ is characterized by high accumulation of flavonols/isoflavonoids, whereas ‘Y’ is characterized by high accumulation of flavonoid glycosides; their differential accumulation shows potential associations with fruit-color divergence.
What are the implications of the main findings?
- •
- Characterizing the differences in amino acid profiles, metabolites and gene expression between mature fruits of red-fruited and yellow-fruited Rubus hirsutus provides candidate genes and reference data for molecular breeding of Rubus hirsutus.
- •
- The multi-omics integration approach provides a reference methodology for investigating the mechanisms of color and flavor quality in other characteristic fruit tree species.
Abstract
This study utilized mature fruits of red-fruited genotype ‘R’ of Rubus hirsutus Thunb and yellow-fruited form Rubus hirsutus Thunb. f. xanthocarpus (Nakai) M.Kim (‘Y’) as materials, employing HPLC, metabolomic, and transcriptomic techniques to describe the differences in amino acid metabolism, metabolite accumulation and gene expression between the mature fruits of the two genotypes of Rubus hirsutus, and analyze the metabolic characteristics between the yellow fruit variant and the wild red fruit. The results showed that the free amino acids of yellow-fruited ‘Y’ (1638.6 μg/g FW) were significantly higher than those of red-fruited ‘R’ (1331.8 μg/g FW), with glutamine showing the most significant difference. Metabolomics identified 232 differential metabolites: red fruits appeared dark red due to enrichment of anthocyanins, while yellow fruits exhibited bright yellow coloration dominated by chalcone glycosides and flavonols. Transcriptomic screening revealed 5052 differentially expressed genes, among which amino acid-related biosynthesis pathways showed the most significant differences. Specifically, genes encoding glutamine synthetase and those involved in branched-chain amino acid metabolism were highly expressed in ‘Y’ fruits, whereas genes associated with cysteine metabolism and aromatic amino acid metabolism were predominantly expressed in ‘R’ fruits. Collectively, these findings characterize the differences in amino acid metabolism, metabolites and transcripts between mature red-fruited and yellow-fruited Rubus hirsutus Thunb., and unravel the potential association between amino acid metabolism and fruit-color variation, providing a theoretical reference for subsequent research on the regulatory mechanisms governing fruit color and quality.
1. Introduction
Rubus hirsutus Thunb. is a wild raspberry species in the Rosaceae family, characterized by strong disease resistance, robust plant growth, and high yield [1]. In addition to fresh consumption, its fruits can be processed into jams, juices, fruit wines, and other products [2]. The whole plant and roots possess medicinal properties, offering health benefits such as anti-inflammatory, detoxification, heat-clearing, sedative, and anti-rheumatic effects [3]. Wild R. hirsutus fruits are typically red, featuring an attractive appearance and sweet-sour flavor. They accumulate abundant bioactive compounds such as soluble sugars, organic acids, anthocyanins, flavonoids, and ellagic acid, and possess strong antioxidant capacity [4,5,6]. R. hirsute.s Thunb. is rich in bioactive polyphenolic constituents that confer considerable health-promoting properties. Specific well-documented phenolic compounds include procyanidin B2, catechin, quercetin-3-O-rutinoside (rutin), and ellagitannins, which contribute to antioxidant and anti-inflammatory effects. Over recent years, with the growing consumer demand for “superfruits” [7], R. hirsutus has attracted considerable attention due to its high antioxidant activity and unique aromatic profile. Field observations have revealed significant fruit color polymorphism in R. hirsutus populations from the color transition to ripening stages: in addition to the typical red type, orange-yellow forma can also occur. Fruit color serves not only as a core indicator of commercial appearance but is also closely associated with nutritional quality, flavor compounds, and postharvest resistance [8,9,10,11]. Therefore, elucidating the differences in nutritional substances and molecular mechanisms underlying different fruit colors holds important theoretical and industrial significance for directed improvement in R. hirsutus genotypes and enhancement of economic value.
Fruit color in the genus Rubus is determined by the combined action of anthocyanins and carotenoids, producing diverse color phenotypes including red, yellow, purple, and black. However, the dominant pigment types vary significantly among different species: red raspberry (R. idaeus) and black raspberry (R. occidentalis) are dominated by anthocyanins such as cyanidin-3-glucoside, conferring red-purple to black phenotypes [12]; whereas Chinese raspberry (R. parvifolius) shows decreased anthocyanin content during ripening, with massive accumulation of carotenoids including β-citraurin laurate and zeaxanthin, maintaining bright red fruit color [13]. Yellow raspberry varieties exhibit yellow coloration due to weakened anthocyanin synthesis and elevated proportions of lutein and β-carotene [13]. As important pigments in Rubus fruits, carotenoids enrich fruit color phenotypes through synergistic or complementary interactions with anthocyanins. Current research on R. hirsutus has primarily focused on resource surveys and qualitative analysis of certain bioactive components [14]. Fruit color serves as an important indicator of appearance quality and is often associated with the accumulation of specific metabolites [15], while color variation may imply changes in nutritional or flavor constituents. The formation of fruit nutritional components and aroma results from the synergistic action of primary and secondary metabolic networks [16]. Amino acid metabolism occupies a central position in this process: on the one hand, amino acids directly participate in protein synthesis and serve as flavor precursors, with specific amino acids such as branched-chain and aromatic amino acids acting as precursors for various volatile aroma compounds [17,18,19]; on the other hand, their metabolic branches connect with the TCA cycle and phenylpropanoid pathway, influencing antioxidant activity and stress response capabilities [20]. Furthermore, aromatic amino acids serve as starting materials for flavonoid and anthocyanin synthesis, directly affecting fruit color development. Over the past decade, scholars both domestically and internationally have successively discovered in model materials such as Chinese bayberry (Myrica rubra) [21], tomato (Solanum lycopersicum) [14], and apples [18] that different fruit color types—red, purple, yellow, and white—exhibit significant differences in total free amino acid content, essential amino acid ratios, and taste-active amino acid composition. Moreover, fruits with higher amino acid enrichment capacity are typically more popular in consumer markets. Amino acid content determination across five cherry tomato cultivars with different colors identified 22 free amino acids [22], with green fruits showing the highest essential amino acid content, followed by black, yellow, red, and orange fruits, while Glu was the most abundant amino acid across all five cultivars. Amino acid analysis of peach varieties with different flesh colors revealed that yellow- and white-fleshed varieties both contained total amino acid contents above 1100 μg/g FW [23], whereas red-fleshed varieties showed total amino acid contents below 750 μg/g FW, with Asn being the highest among all amino acids. In five-leaf strawberry (Fragaria pentaphylla) [24], white strawberry fruits exhibited more intense aroma than red fruits. Eighteen amino acids were detected in both fruit types except for Gly and Gln, with red fruits showing higher amino acid contents than white fruits.
Amino acids provide carbon skeletons and nitrogen sources for glycolysis, the tricarboxylic acid (TCA) cycle, phenylpropanoid pathway, and terpenoid pathway, thereby influencing the synthesis of color-related secondary metabolites such as phenolic acids, flavonoids, and anthocyanins, as well as aroma components including esters, aldehydes, alcohols, and terpenes [25]. Previous studies have demonstrated that deepening fruit coloration is accompanied by increased activity of phenylalanine ammonia-lyase (PAL), promoting the conversion of phenylalanine toward anthocyanin synthesis [26]. Upregulation of branched-chain amino acid transaminase (BCAT) and branched-chain α-keto acid dehydrogenase (BCKD) for amino acids such as leucine, isoleucine, and valine can generate fruity and floral aroma compounds including 3-methylbutanol and ethyl 2-methylbutanoate [27]. However, the amino acid composition, key structural genes, and regulatory networks underlying fruit-color divergence among mature ‘R’. hirsutus genotypes remain largely uninvestigated. Accordingly, this study aimed to: (1) characterize the differential profiles of amino acids and fruit color-related metabolites in mature fruits derived from distinct R. hirsutus genotypes with different fruit colors; and (2) screen key metabolites and candidate genes modulating amino acid biosynthesis and catabolism in R. hirsutus. We quantified amino acids and their derivatives in mature fruits of two distinct R. hirsutus genotypes, including the red-fruited wild type (‘R’) and yellow-fruited forma (‘Y’), followed by integrated transcriptomic and metabolomic analyses. By screening differentially accumulated metabolites and differentially expressed genes associated with amino acid biosynthesis, we further revealed potential associations of amino acid metabolic pathways with different genotype fruit-color traits of R. hirsutus., and identified metabolic differences that are putatively linked to fruit-color divergence. Collectively, this study not only advances our understanding of genotype-specific amino acid metabolic differences accompany fruit-color divergence in R. hirsutus, but also provides novel strategies and candidate targets for genetic improvement in fruit color and aroma quality, offering valuable insights into the complex regulatory networks governing fruit development and ripening in different R. hirsutus genotypes.
2. Materials and Methods
2.1. Experimental Materials
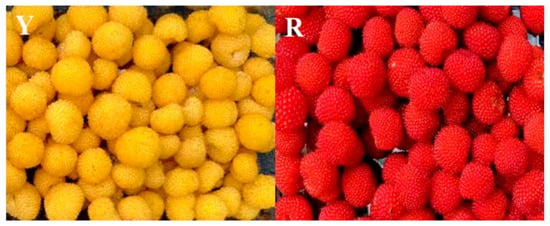
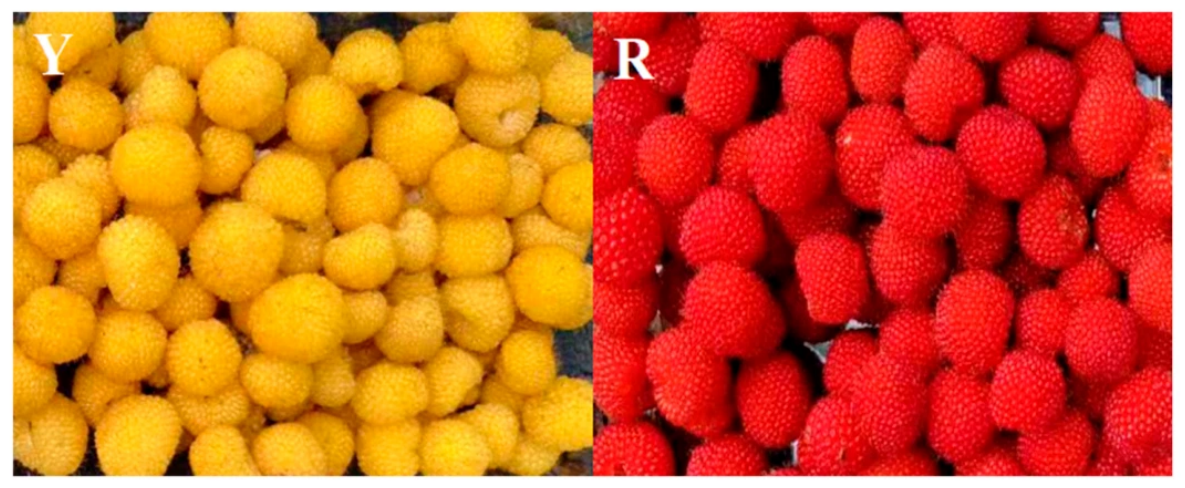
This study focuses on the yellow-fruited plant (Rubus hirsutus Thunb. f. xanthocarpus), which is a natural variant that emerged in the wild population of red-fruited plants. There have been taxonomic reports confirming that it is a variant of the red-fruited plant and not an independent species (https://www.plantplus.cn/cn/sp/%E9%BB%84%E6%9E%9C%E8%93%AC%E8%97%9F, accessed on 5 February 2026). The single yellow-fruited plant was discovered from the wild red-fruited population, and both genotypes were planted in Nanjing Zhongshan Botanical Garden (118°49′ E, 32°03′ N). Plants were cultivated in 25 L containers filled with substrate composed of imported peat moss (Pindstrup) and perlite at a volume ratio of 2:1. All Rubus hirsutus materials were cultivated in open-air substrate pots in Nanjing with regular irrigation to maintain stable substrate moisture during vegetative and fruit developmental stages. The experimental site has a humid subtropical monsoon climate, with mild temperature, sufficient sunlight and abundant rainfall during the vegetative growth period from March to June. Low-toxicity pesticides including 20% Fenpropathrin EC and 80% Mancozeb WDG were used only during the vegetative phase for pest and disease prevention, while no chemical protection agents were applied within two weeks prior to fruit ripening to avoid fruit residue. Urea and balanced water-soluble compound fertilizer (N-P-K 20-20-20) were applied during plant growth to meet nutrient requirements. The yellow-fruited variant is a spontaneous mutant of Rubus hirsutus and was propagated vegetatively via rhizome tiller reproduction. The variant was continuously cultivated for three complete and independent growth cycles. Throughout multi-cycle vegetative propagation, the yellow-fruited phenotype remained genetically stable, with no phenotypic segregation and no reversion to the wild-type red-fruited trait. This stable performance across independent vegetative generations confirms that the fruit-color variation is a genetically heritable trait, rather than a temporary environmentally induced phenotypic plasticity. For both red-fruited and yellow-fruited Rubus hirsutus plants, nine independent healthy individuals were selected and equally divided into three non-overlapping groups, with each group comprising three distinct plants. For each group, 20–30 mature fruits were harvested from each plant and pooled to form one independent biological replicate (Figure 1). A uniform sampling standard was adopted: fruits were collected at a stable, fully mature stage prior to the sharp and significant decline in fruit firmness. Samples were immediately frozen in liquid nitrogen in situ and stored at −80 °C for subsequent analysis.
Figure 1.
Mature fruits of two distinct R. hirsutus genotypes: yellow-fruited forma (‘Y’) and red-fruited wild type (‘R’).
2.2. Fruit Color Phenotyping
Color parameters of fruit surface were quantified using a portable DOHO DS-60C colorimeter. Technical specifications include: measuring aperture: Φ10 mm; illuminant: D65; observation angle: 10°; standard deviation: ΔEab ≤ 0.02. Before measurement, the instrument was powered on and pre-warmed for approximately 30 min to stabilize internal light source and sensors, followed by calibration against the standard white board to establish baseline reference. Each fruit sample was placed steadily on the measuring platform; the fruit surface was kept clean and dust-free, and closely attached to the measuring aperture to block ambient stray-light interference. The L*, a*, b* color coordinates were recorded, and the average values were used as the color parameters for each fruit. Chroma and hue angle ). All fruits were calculated from the measured values. All measurements were conducted under constant natural light conditions, avoiding direct light interference, with 9 fruits measured per treatment. These nine fruits were all obtained from the rubus produced by individual plants.
2.3. Rubus hirsutus Determination of Carotenoid Content in Fruits
The method was performed according to Zhou [28]. Briefly, 0.1 g of Rubus hirsutus fruit samples was weighed and cut into small pieces, then placed into a mortar. After adding 3–5 mL of 95% ethanol, the mixture was ground into a homogenate in the dark. The homogenate was filtered into a 10 mL test tube, and the residue was rinsed repeatedly with ethanol. The extract was then diluted to 10 mL with ethanol, sealed, wrapped in aluminum foil, and extracted for 3 h. Using 95% ethanol as the control solution, the sample solution was transferred into a glass cuvette and measured using a UV-Vis spectrophotometer. The absorbance values were determined at wavelengths of 665 nm, 649 nm, and 470 nm, respectively. The content (mg/g) was calculated by substituting the absorbance values into the corresponding formula. The calculation formulas are as follows: Car (mg/L) = ; Car (mg/g Fw) = .
2.4. Determination of Amino Acid Composition and Content
The sample was accurately weighed (to the nearest 0.0001 g) into a test tube, and an appropriate amount of 1 mM HCl in 20% ethanol was added. The mixture was then extracted ultrasonically at 4 °C for 30 min, followed by centrifugation at 12,000 rpm for 10 min at 4 °C, and the supernatant was collected. An appropriate volume of extraction solution was added to the pellet, and the extraction procedure above was repeated. The supernatants from the two extractions were combined, brought to a constant volume, and mixed thoroughly. After filtration through a 0.22 μm aqueous membrane filter, the free amino acid content was determined using a high-performance liquid chromatography system (1260 Infinity I, Agilent, Technologies, Santa Clara, CA, USA). Quantification followed the pre-column online derivatization procedure described by Henderson et al. [29]: ortho-phthalaldehyde (OPA) was used for labeling primary amino acids, and 9-fluorenylmethyl chloroformate (FMOC) for labeling secondary amino acids. The two reagents sequentially reacted with amino groups to generate highly sensitive fluorescent derivatives, which were then separated by high-performance liquid chromatography for accurate quantification. Quantification of amino acids was performed using mixed external amino acid standards for calibration. For detailed chromatograhic methods, please refer to Supplementary Table S1.
2.5. Metabolomic Data Analysis
A total of 100 mg of mature red and yellow fruits of Rubus hirsutus were separately ground in liquid nitrogen, and the homogenate was resuspended in prechilled 80% methanol containing 0.1% formic acid, followed by thorough vortexing. After incubation on ice for 5 min, the samples were centrifuged at 15,000 rpm and 4 °C for 5 min. The supernatant was collected and diluted with LC-MS grade water to a final methanol concentration of 53%, transferred to a new Eppendorf tube, and centrifuged again at 15,000 g and 4 °C for 10 min. The final supernatant was injected into the LC-MS/MS system for analysis [30]. UHPLC-MS/MS analyses were performed using a Vanquish UHPLC system (Thermo Fisher Scientific, Bremen,, Germany) coupled with an Orbitrap Q ExactiveTM HF mass spectrometer (Thermo Fisher, Germany) in Biozeron Co., Ltd. (Shanghai, China). Chromatographic and mass spectrometric conditions are detailed in Supplementary Table S2. The raw data files generated by UHPLC-MS/MS were processed using the Compound Discoverer 3.1 (CD3.1, Thermo Fisher) to perform peak alignment, peak picking, and quantitation for each metabolite; main parameter settings are detailed in Supplementary Table S2.
These metabolites were annotated using the KEGG database (https://www.genome.jp/kegg/pathway.html, accessed on 20 April 2026), HMDB database (https://hmdb.ca/metabolites, accessed on 20 April 2026) and LIPIDMaps database (https://lipidmaps.org/, accessed on 20 April 2026). Principal component analysis (PCA) and orthogonal partial least squares discriminant analysis (OPLS-DA) were performed at metaX (aflexible and comprehensive software for processing metabolomic data). We applied univariate analysis (t-test) to calculate the statistical significance (p-value). Differential metabolites were screened with three criteria: variable importance in projection (VIP) > 1, fold change (FC) ≥ 1.5, and Benjamini–Hochberg FDR-adjusted q-value < 0.05. It is noted that the metabolite annotations are based solely on database spectral matching and lack standard substance validation. They are presumptive annotations. Further confirmation is required through MS-MS fragment analysis and standard substance experiments. Therefore, all downstream biological interpretations for these compounds are based only on these presumptive annotations.
2.6. Transcriptome Data Analysis
Total RNA was extracted from tissues using TRIzol reagent, followed by genomic DNA digestion with DNase I. Quality control was performed using an Agilent 2100 Bioanalyzer and NanoDrop ND-2000 to ensure samples met quality standards of OD260/280 = 1.8–2.2, OD260/230 ≥ 2.0, RIN ≥ 6.5, and 28S:18S ≥ 1.0. Based on the Illumina TruSeq RNA library preparation system, mRNA was enriched using oligo(dT) magnetic beads, fragmented with fragmentation buffer, and subjected to cDNA synthesis, end repair, A-tailing, and indexed adapter ligation. Fragments of 200–300 bp were selected via agarose gel electrophoresis and amplified for 15 cycles using Phusion DNA polymerase (NEB). Finally, 150 bp paired-end sequencing was performed on the Illumina NovaSeq 6000 platform. Raw data were quality-controlled using Trimmomatic to retain clean reads with length ≥ 75 bp. De novo assembly was conducted using Trinity, and functional annotation was performed by BLASTX (BLAST+ v2.12.0) alignment against NCBI NR, String, and KEGG databases. Differential expression analysis was performed using edgeR. Raw gene-level counts generated by RSEM were used as input, while RPKM values were only used for data visualization. Genes with low expression were filtered prior to analysis. TMM (trimmed mean of M-values) normalization was performed to correct between-library differences. A design matrix without intercept was built, and differential expression testing was implemented under the generalized linear model (GLM) framework of edgeR for the contrast between the yellow-fruited genotype (‘Y’) and red-fruited genotype (‘R’). Common dispersion was estimated, and DEGs were identified according to the predefined thresholds. GO and KEGG enrichment analyses of DEGs were conducted. All genes annotated to GO or KEGG databases in the transcriptome were used as the background gene set. Fisher’s exact test was adopted to compute p-values, and the Benjamini–Hochberg (BH) method was used for multiple-testing correction. The contrast was set to compare Y against R. Genes with FDR ≤ 0.05 and |log2FC| ≥ 1 were regarded as differentially expressed genes. The raw RNA-seq reads and de novo transcriptome assembly data generated in this study have been deposited in the NCBI BioProject database under accession number PRJNA1498186.
2.7. Real-Time Quantitative PCR (qRT-PCR) Gene Expression Analysis
To verify the accuracy of transcriptome data, eight DEGs related to plant amino acid metabolic pathways were selected for RT-qPCR validation. Primers for the corresponding DEGs were designed using Primer Premier 6 software (Table S6), and quantitative analysis was performed based on the cDNA sequences of the respective DEGs. Ru18s was used as the internal reference gene [31]. The total reaction volume for qPCR was 20 μL, consisting of 10 μL of 2 × SYBR Green qPCR Mix, 0.4 μL each of the forward and reverse primers, 2 μL of cDNA template, and 7.2 μL of RNase-free water. The qPCR amplification program included an initial denaturation at 95 °C for 30 s, followed by 40 cycles of denaturation at 95 °C for 15 s and annealing at 60 °C for 30 s. The final relative expression level of each gene was calculated using the 2^(−ΔΔCt) method.
2.8. Statistical Analysis
All physiological and biochemical indicators, including luminance (L), red-green value (a), yellow-blue value (b), amino acid contents and qPCR data, were statistically analyzed using SPSS Statistics 27 software. Comparisons between the two groups (red-fruited Rubus hirsutus vs. yellow-fruited Rubus hirsutus) were performed using independent-samples t-test. Data in the figures and tables are presented as mean ± standard deviation (SD), with each data point representing at least three independent biological replicates (n ≥ 3). Significance levels in the figures are defined as follows: * p < 0.05, ** p < 0.01, *** p < 0.001.
3. Results
3.1. Analysis of Chromatic Phenotypic Characteristics in R. hirsutus of Two Distinct Genotypes
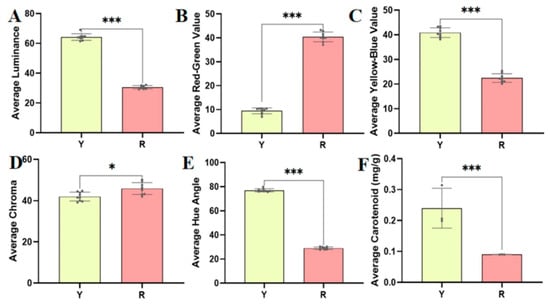
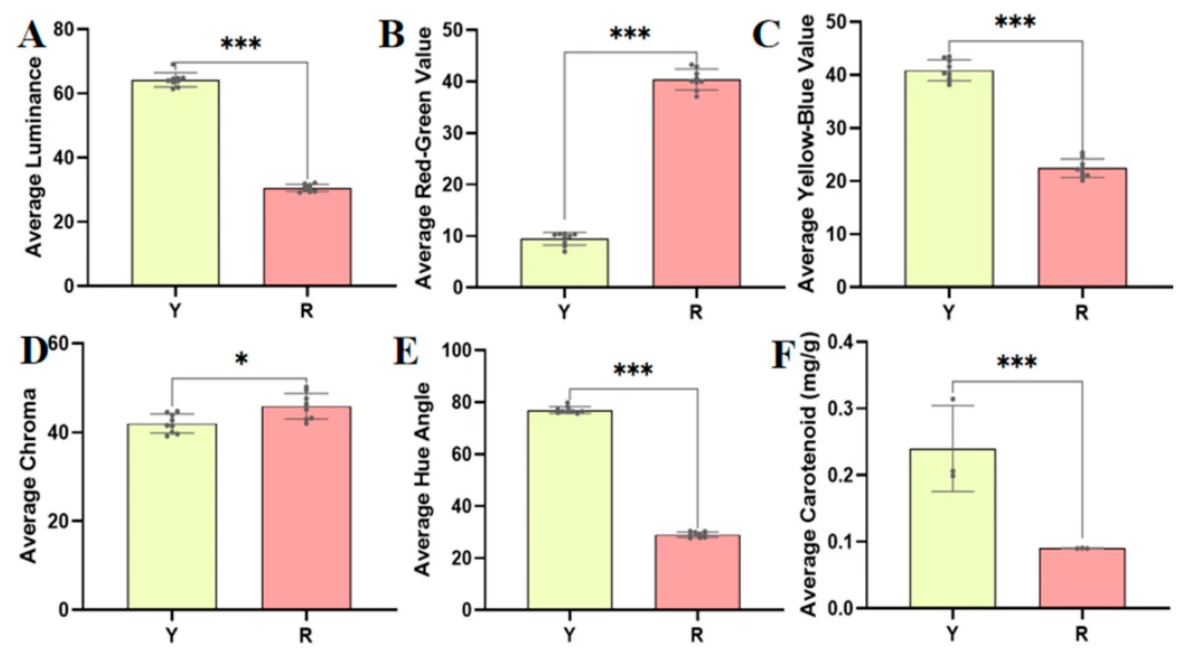
From the color difference index results (Figure 2A–C), we can observe that the average luminance of red-fruited genotype was significantly lower than that of yellow-fruited genotype, while the red-green value (a value) was notably higher, indicating a stronger red hue in red fruits. In contrast, the yellow-blue value (b value) of the yellow-fruited genotype was distinctly higher than that of the red-fruited genotype, reflecting a more intense yellow hue. These differences in colorimetric parameters clearly revealed the distinct phenotypic characteristics between red- and yellow-fruited genotypes at maturity: red fruits exhibited lower luminance and stronger redness, whereas yellow fruits presented higher luminance and a more prominent yellow color. Regarding color parameters, the average chroma of red Rubus ‘R’ was slightly higher than that of yellow Rubus ‘Y’, while the average hue angle was significantly lower in ‘R’ than in ‘Y’ (Figure 2D,E), indicating that ‘R’ exhibited more saturated color and a redder hue. In addition, the determination of carotenoid content revealed that the average carotenoid content in ‘Y’ was approximately 0.24, which was significantly higher than the value of approximately 0.09 in ‘R’ (Figure 2F), and this difference was clearly correlated with the variation pattern of color parameters between the two types.
Figure 2.
Phenotypic indicators of fruit color in Rubus hirsutus. (A) Luminance (L). (B) Red-green value (a). (C) Yellow-blue value (b). (D) Chroma (C). (E) Hue angle (hab). (F) Carotenoid (mg/g). Note: The chromaticity indicators consist of 9 samples per group, while the pigment indicators consist of 3 samples per group. * p < 0.05, *** p < 0.001.
3.2. Determination of Different Fruit Color-Related Amino Acids and Their Derivatives Between Different Genotypes
To investigate amino acid composition and content in mature fruits of different-colored Rubus hirsutus, this study employed high-performance liquid chromatography (HPLC) technology to quantitatively analyze free amino acids in yellow-fruited (‘Y’) and red-fruited (‘R’) R. hirsutus (Table 1). The results showed that the total free amino acid content (TFAA) in ‘Y’ (1638.6 μg/g FW) was significantly higher than that in ‘R’ (1331.8 μg/g FW); non-essential amino acids (NEAAs) represented the most predominant group in mature Rubus hirsutus fruits. The most abundant amino acid in ‘Y’ was Asn, while in ‘R’ it was Pro. Significant differences were observed in the composition of various amino acids between the two types, with Gln showing the most significant difference: the mean content in ‘Y’ reached 97.72 µg/g compared to only 18.74 µg/g in ‘R’, representing a 5.21-fold difference. Sulfur-containing amino acids (SAAs), primarily Met and Cys, are easily lost from the human body and are generally low in plant proteins [32], a phenomenon also observed in R. hirsutus, where SAAs accounted for 0.53–0.68% of total EAAs. The total essential amino acid (EAA) content in ‘Y’ was higher than in ‘R’, as most EAAs except Leu, Lys, and Trp showed relatively higher contents in the ‘Y’ group. During fruit ripening, taste-active amino acids serve as flavor precursors that undergo enzymatic hydrolysis and conversion to react with sugars, acids, phenolics, and other substances, generating various volatile compounds that significantly influence fruit aroma and taste. Based on their taste impact, these can be classified into umami, sweet, and bitter amino acids [33]. Umami amino acids mainly include Glu and Asp; the data in the table show that umami amino acid contents in R. hirsutus fruits ranged from 303.77 to 330.91 µg/g, accounting for 20.19–22.81% of total free amino acids. Sweet amino acids are primarily composed of Thr, Ser, Gly, Ala, and Pro; in R. hirsutus fruits, sweet amino acids accounted for 41.24–45.42% of total free amino acids, with Ala playing the major role in ‘Y’ and Pro in ‘R’. Bitter amino acids in R. hirsutus fruits mainly included Leu, Ile, Val, Phe, Trp, Met, Arg, and His, with contents ranging from 210.21 to 278.07 µg/g, accounting for 12.83–20.88% of total free amino acids. In summary, sweet amino acid contents were substantially higher than those of umami and bitter amino acids. Branched-chain amino acids (Leu, Ile, Val) can maintain nitrogen balance and regulate immune and metabolic homeostasis by synergistically promoting muscle protein synthesis, inhibiting breakdown, and serving as extrahepatic energy substrates; the total branched-chain amino acid content in R. hirsutus was 58.02–71.76 µg/g. The total aromatic amino acid content ranged from 57.23 to 108.09 µg/g.
Table 1.
Amino acid content in fructification of R. hirsutus.
3.3. Screening of Fruit Color-Related Metabolites and Derivatives in Two Genotypes
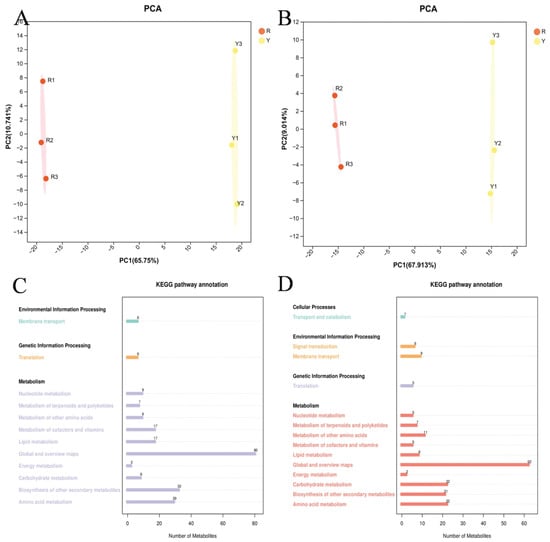
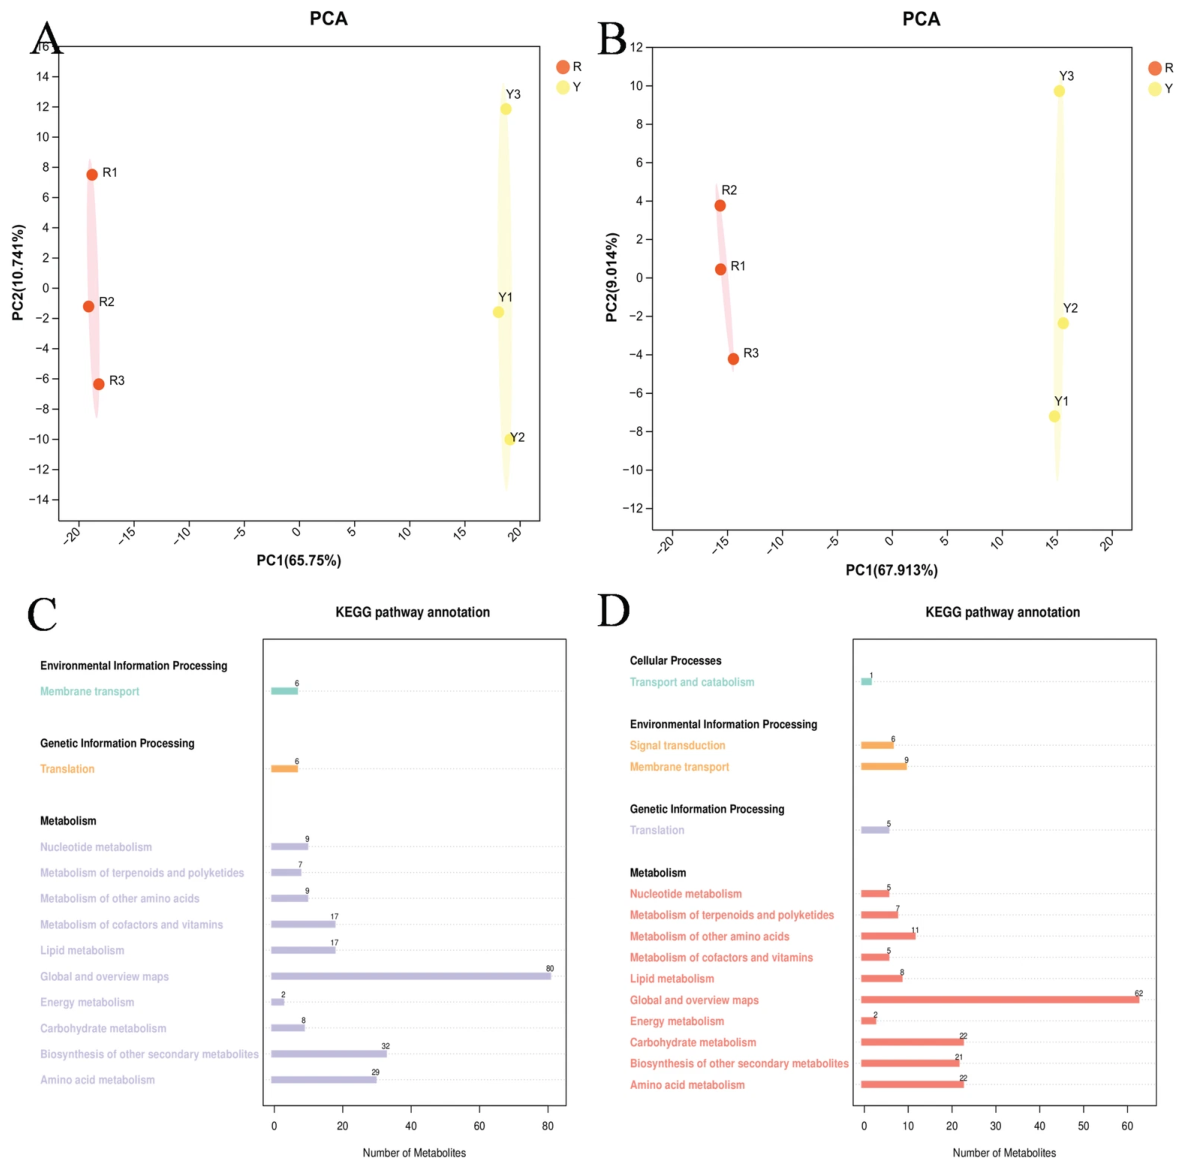
Principal component analysis (PCA) of metabolomic data from mature Rubus hirsutus samples with different fruit colors (Figure 3A,B) revealed that in positive-ion mode, the first and second principal components cumulatively explained 76.49% of the dataset variance; in negative-ion mode, they explained 76.92%. The overall aggregation degree was high for samples of different-colored R. hirsutus, with yellow-fruited R. hirsutus (Y) showing higher sample clustering than red-fruited R. hirsutus (R) in both ion modes.
Figure 3.
Metabolomic analysis of mature fruits from two R. hirsutus genotypes. (A,B) PCA analyses under positive and negative ions; each dot represents one biological replicate; (C,D) KEGG database annotations under positive and negative ions; the horizontal axis indicates the number of annotated metabolites mapped to each KEGG pathway.
Untargeted metabolomic analysis of ‘Y’ vs. ‘R’ identified a total of 1045 metabolites. KEGG database annotation (Figure 3C,D) showed that in positive-ion mode, 209 metabolites were annotated, of which 100 were mapped to 12 metabolic pathways in KEGG entries. The top four metabolic pathways by metabolite count were: global and overview maps, biosynthesis of other secondary metabolites, amino acid metabolism, and lipid metabolism. In negative-ion mode, 159 metabolites were annotated, of which 80 were mapped to 14 metabolic pathways in KEGG entries. The top four metabolic pathways were: global and overview maps, amino acid metabolism, carbohydrate metabolism, and biosynthesis of other secondary metabolites.
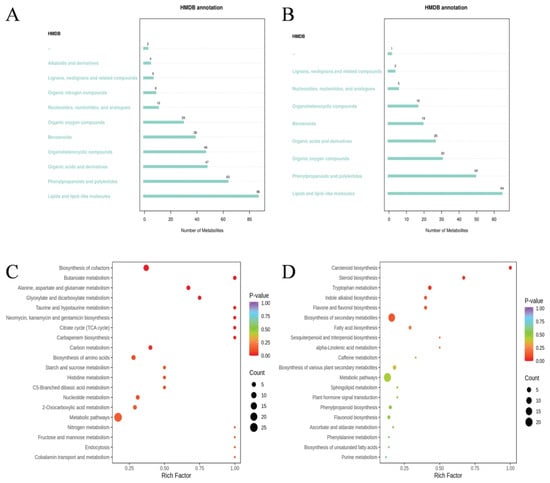
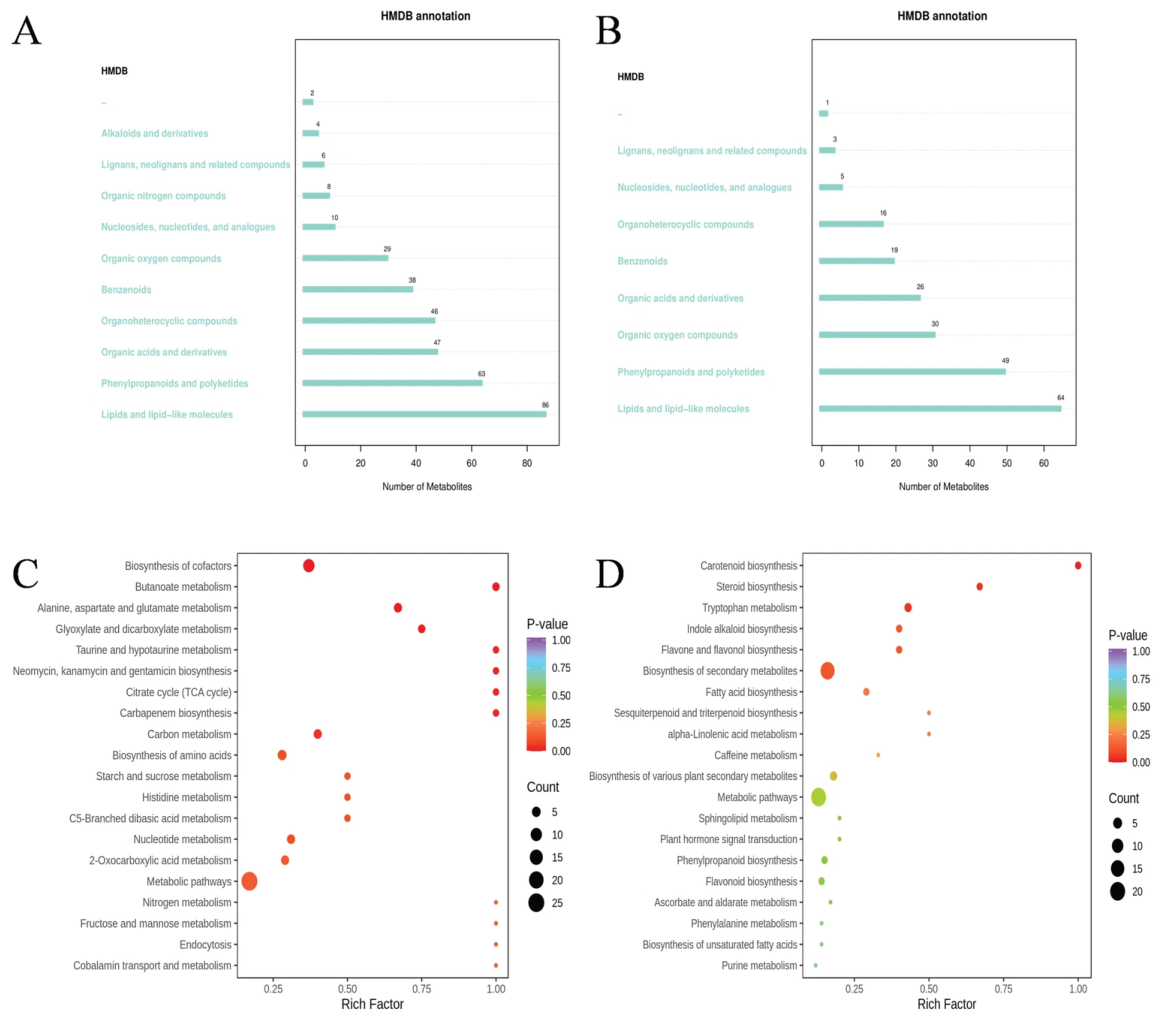
HMDB database annotation of metabolites from mature R. hirsutus with different fruit colors (Figure 4A,B) revealed that in positive-ion mode, 339 metabolites were classified into 11 HMDB superclasses, with 86 metabolites (25.37%) categorized as “lipids and lipid-like molecules,” followed by “phenylpropanoids and polyketides” and “organic acids and derivatives.” In negative-ion mode, 213 metabolites were classified into nine HMDB superclasses, with 64 metabolites (30.05%) categorized as “lipids and lipid-like molecules,” followed by “phenylpropanoids and polyketides” and “organic oxygen compounds.”
Figure 4.
Metabolite annotation and KEGG enrichment of differential metabolites between yellow-fruited (‘Y’) and red-fruited (‘R’) Rubus hirsutus mature fruits. (A,B) HMDB superclass annotation of metabolites under positive-ion and negative-ion modes. Horizontal axis shows metabolite count for each chemical superclass. (C) KEGG enrichment bubble plot for metabolites with significantly higher relative abundance in Y relative to R. (D) KEGG enrichment bubble plot for metabolites with significantly lower relative abundance in Y relative to R. Bubble size represents metabolite count; color gradient corresponds to p-value significance.
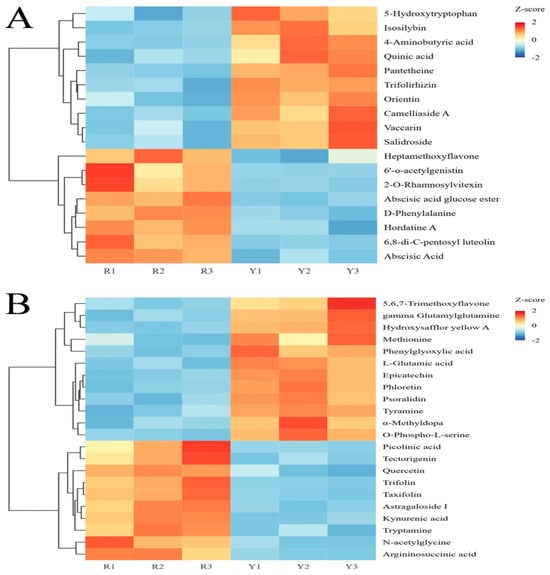
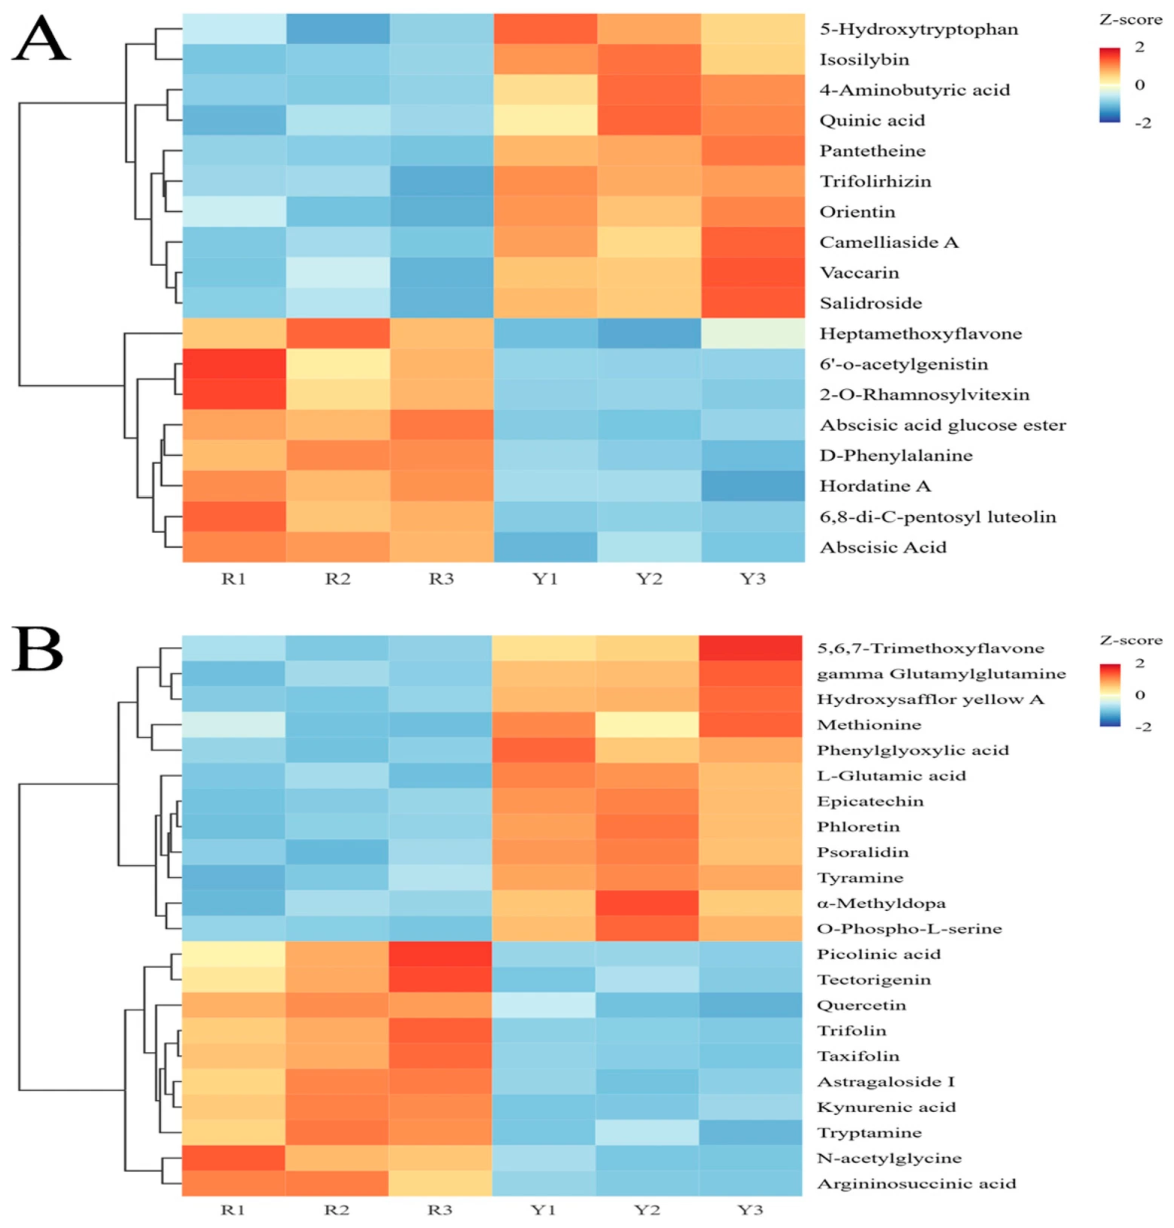
OPLS-DA was performed to screen differential metabolites between ‘R’ and ‘Y’ groups. The model quality was evaluated by R2X, R2Y and Q2. A permutation test with 200 permutations was applied to evaluate the risk of model overfitting (Figure S1). The corresponding permutation test plot reports model R2X = 0.666, R2Y = 1.00, and Q2 = 0.981; the permutation test for the intercept R2Y = 0.000464, and Q2 = 0.00472. Given the very limited sample size (n = 3 biological replicates per genotype, total six observations) and high-dimensional metabolomic data, we cannot fully rule out potential overfitting risk, even though permutation test results appeared favorable. The results indicate that although the results of the permutation test are satisfactory, due to the limited sample size, it is not possible to completely rule out the potential risk of overfitting. Differential metabolite analysis of mature R. hirsutus with different fruit colors was conducted using FDR (Benjamini–Hochberg) correction, screening thresholds of FC ≥ 1.5, OPLS-DA VIP ≥ 1, and q-value < 0.05, yielding 232 differential metabolites, including 101 upregulated and 131 downregulated; details of metabolite annotations are shown in Supplementary Table S3. These differential metabolites mainly belonged to categories such as “Organic acids and derivatives,” “Lipids and lipid like molecules,” and “Phenylpropanoids and polyketides.” A total of 15 significant flavonoid differential metabolites were identified in ‘Y’ vs. ‘R’, among which eight putatively annotated metabolites including camelliaside A, vaccarin, epicatechin, orientin, epimedin A, psoralian, phloretin, and trifolirhizin were significantly upregulated, while seven putatively annotated metabolites including quercetin, taxifolin, hordatine A, 6″-O-acetylgenistin, trifolin, tectorigenin and Astragaloside I were significantly downregulated. In both modes, 39 metabolites related to fruit color formation and amino acid metabolism were selected from the differential putatively annotated metabolites (Figure 5). The figure shows that most differential metabolites exhibited higher expression in ‘R’ in both positive- and negative-ion modes.
Figure 5.
Differential metabolite relative abundance analysis under positive- and negative-ion modes. (A) Differential metabolites screened in negative-ion mode. (B) Differential metabolites screened in positive-ion mode.
3.4. Analysis of Metabolic Differences Between Two Genotypes with Contrasting Fruit Colors
According to the KEGG enrichment bubble plot (Figure 4C,D) the significantly different metabolites identified in ‘Y’ vs. ‘R’ were collectively enriched in 83 metabolic pathways; among them, there are 60 pathways enriched with metabolites showing higher abundance and 23 pathways enriched with metabolites showing lower abundance. The upregulated differential metabolites were mainly significantly enriched in pathways such as metabolic pathways, biosynthesis of cofactors, butanoate metabolism, alanine, aspartate and glutamate metabolism, and Glyoxylate and dicarboxylate metabolism. Putatively annotated metabolite Citric acid, 4-aminobutyric acid, L-Glutamic acid and alpha Ketoglutaric acid are involved in alanine, aspartate and glutamate metabolism. Putatively annotated metabolite L-Glutamic acid, Citric acid and alpha Ketoglutaric acid are involved in Glyoxylate and dicarboxylate metabolism. The downregulated differential metabolites were mainly significantly enriched in pathways such as carotenoid biosynthesis, steroid biosynthesis, Tryptophan metabolism, biosynthesis of secondary metabolites, and flavone and flavonol biosynthesis. Putatively annotated metabolite Abscisic acid glucose ester and Abscisic acid are involved in carotenoid biosynthesis. Putatively annotated metabolite Picolinic acid, L-Glutamic acid and Tryptamine are involved in Tryptophan metabolism. Among the upregulated metabolites, the pathways with the largest number of enriched differential metabolites were metabolic pathways, biosynthesis of secondary metabolites, biosynthesis of cofactors and biosynthesis of amino acids, containing 25, 14, 10 and five differential metabolites, respectively. Among the downregulated metabolites, the pathways with the largest number of enriched differential metabolites were metabolic pathways, biosynthesis of secondary metabolites, Tryptophan metabolism and biosynthesis of various plant secondary metabolites, containing 20, 17, three and three differential metabolites, respectively.
Through comparative metabolomic analysis of ‘Y’ and ‘R’ Rubus fruits, the results indicate that the differences in fruit color mainly arise from significant differences in the accumulation of flavonoids, isoflavonoids, and phenolic acids. ‘R’ is enriched with various color-related flavonoid/isoflavonoid compounds, including putatively annotated metabolite quercetin, taxifolin, trifolin, tectorigenin, Astragaloside_I, and 6″_o_acetylgenistin, which together constitute the phenotypic basis for the red coloration of ‘R’. Among them, the putatively annotated feature 6″_o_acetylgenistin is present at extremely high levels in ‘R’ but very low levels in ‘Y’, making it one of the most significant isoflavonoid markers distinguishing the two fruit colors. In contrast, ‘Y’ is mainly dominated by the upregulation of yellow pigments and flavonol compounds, leading to the formation of its yellow phenotype. The relative signal intensity of the putatively annotated pigment-related feature Hydroxysafflor-yellow A was significantly higher in ‘Y’ than in ‘R’. Several other putatively annotated flavonoid-related features (epicatechin, phloretin, psoralidin, and 5,6,7-Trimethoxyflavone) also displayed elevated signal in ‘Y’; these differential MS signals suggest potential links to the yellow fruit phenotype. KEGG enrichment analysis further confirmed that flavonoid biosynthesis, isoflavonoid biosynthesis, and flavone and flavonol biosynthesis pathways play core roles in fruit color differences. Furthermore, amino acid metabolites also showed significant differences, suggesting that fruit color formation may be related to coordinated antioxidant regulation and secondary metabolic networks. Among them, putatively annotated metabolite L-Glutamic_acid, 4-aminobutyric acid, methionine, Tyramine, 5-Hydroxytryptophan, and O-Phospho-L-serine were significantly upregulated in ‘Y’, while putatively annotated metabolite D-phenylalanine, argininosuccinic acid, Kynurenic acid, Tryptamine, and N-acetylglycine were significantly enriched in ‘R’. These differences in amino acid metabolites indicate that the two fruit colors of Rubus exhibit significant divergence in nitrogen metabolism allocation, antioxidant defense, and secondary metabolic precursor supply.
3.5. Transcriptome Analysis of Two R. hirsutus Genotypes with Contrasting Fruit Colors
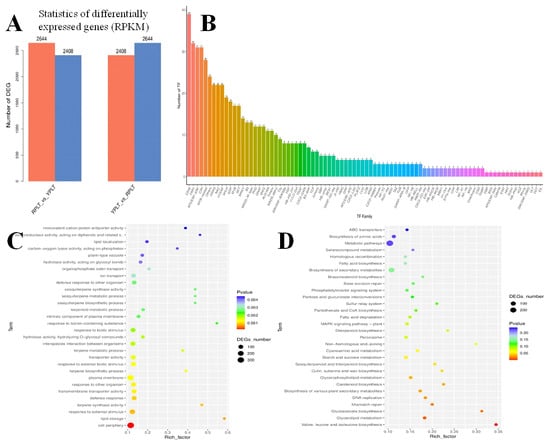
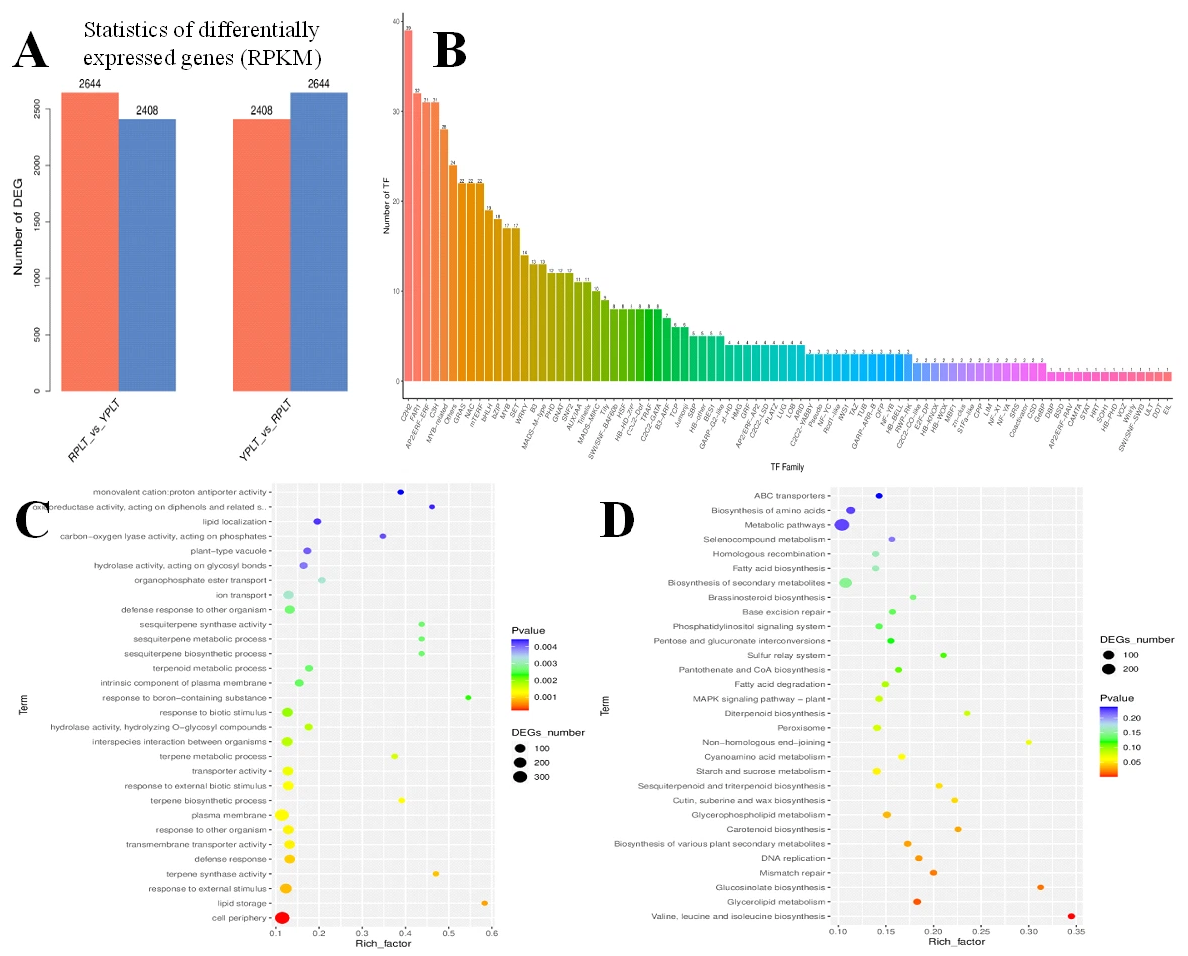
High-quality RNA extracted from mature fruits of ‘Y’ and ‘R’ was used to construct strand-specific cDNA libraries. Sequencing was performed at Shanghai Lingen Biotechnology Co., Ltd. (Shanghai, China) using paired-end 150 bp mode after stringent quality control filtering. Each biological replicate generated 40.053–523.020 million clean reads with Q30 scores exceeding 97.53% (Table S4), ensuring data reliability. All clean reads were de novo assembled using Trinity, and the assembled sequences were aligned against NR, Swiss-Prot, eggNOG, KEGG, GO, and CAZy databases to obtain annotation information for predicted genes (Table S4). To exclude transcripts derived from epiphytic or endophytic microorganisms, all Trinity-assembled unigenes were taxonomically annotated against the NCBI NR database (Table S5). Among the 24,883 unigenes, 22,947 (92.22%) were assigned to Viridiplantae, 1897 (7.78%) to Fungi, 35 to Metazoa, and four remained unclassified. No bacterial, archaeal, or viral sequences were detected. All non-plant transcripts were filtered out, and only the 22,947 Viridiplantae unigenes were retained for subsequent expression quantification and differential expression analysis. Using standard criteria of |log2FC| ≥ 1 and FDR ≤ 0.05, a total of 5052 DEGs were identified between the two genotypes (Figure 6A). Compared to ‘R’, 2408 genes showed upregulated expression in ‘Y’ fruits, while 2644 genes showed downregulated expression.
Figure 6.
Transcriptome analysis of two R. hirsutus genotypes with contrasting fruit colors. (A) Number of DEGs; upregulated and downregulated genes are shown in orange and blue bars, respectively. (B) Classification and quantity distribution of annotated transcription factor families among DEGs; (C) GO enrichment analysis of DEGs; bubble size corresponds to DEG number; color represents p-value; (D) KEGG pathway enrichment analysis of DEGs; bubble size corresponds to DEG number, color represents p-value.
Transcription factor annotation was performed on unigenes (Figure 6B), and the family distribution of differential transcription factors was analyzed. A total of 642 genes were annotated, with the top five transcription factor families being: C2H2 with 39 genes (6.07%), FAR1 with 32 genes (4.98%), AP2/ERF and C3H with 31 genes each (4.83%), and MYB with 28 genes (4.36%). GO enrichment and KEGG enrichment analyses of DEGs were conducted with a p-value threshold of 0.05 (Figure 6C,D). GO enrichment analysis revealed that 1260 DEGs were enriched in 130 GO pathways, where 42 pathways were annotated to molecular functions, seven to cellular components, and 81 to biological processes. The three most significantly enriched pathways were “terpene synthase activity,” “plasma membrane,” and “lipid storage.” KEGG enrichment analysis showed enrichment in 120 pathways, with the most significant pathways being “valine, leucine and isoleucine biosynthesis,” followed by “glycerophospholipid metabolism,” “glucosinolate biosynthesis,” and “carotenoid biosynthesis.” The pathways with the highest number of enriched DEGs were “metabolic pathways,” “biosynthesis of secondary metabolites,” “biosynthesis of amino acids,” and “protein processing in endoplasmic reticulum,” containing 286, 164, 39, and 31 DEGs, respectively.
The “biosynthesis of amino acids” pathway contained 39 enriched genes, including 14 upregulated and 25 downregulated. Twenty genes were associated with amino acid synthesis: TRINITY_DN13301_c0_g1, TRINITY_DN27199_c0_g1, TRINITY_DN33655_c0_g1, and one other DEG participated in cysteine biosynthesis; TRINITY_DN16564_c0_g1, TRINITY_DN20966_c0_g1, TRINITY_DN29096_c0_g1, and two other DEGs jointly participated in valine and isoleucine biosynthesis, while TRINITY_DN29609_c0_g1 additionally participated in isoleucine biosynthesis. Furthermore, TRINITY_DN32548_c0_g1, TRINITY_DN34535_c0_g1, and TRINITY_DN29609_c0_g1 participated in the leucine biosynthesis pathway; TRINITY_DN31575_c0_g1, TRINITY_DN31575_c0_g3, and TRINITY_DN28613_c0_g1 participated in the histidine biosynthesis pathway; TRINITY_DN32931_c0_g3, TRINITY_DN32931_c0_g4, and TRINITY_DN26313_c0_g1 participated in the Tryptophan biosynthesis pathway; TRINITY_DN24931_c0_g1 and TRINITY_DN35301_c0_g1 participated in methionine and arginine biosynthesis, respectively.
3.6. qPCR Validation
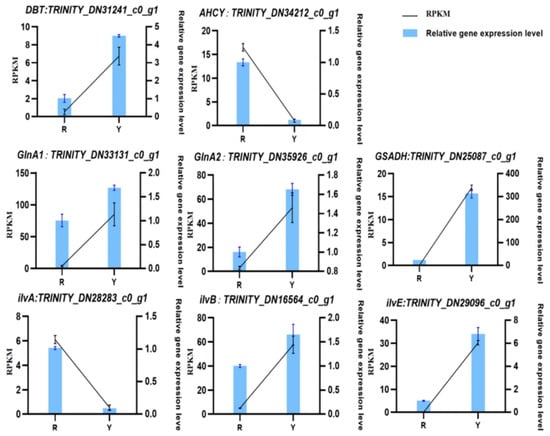
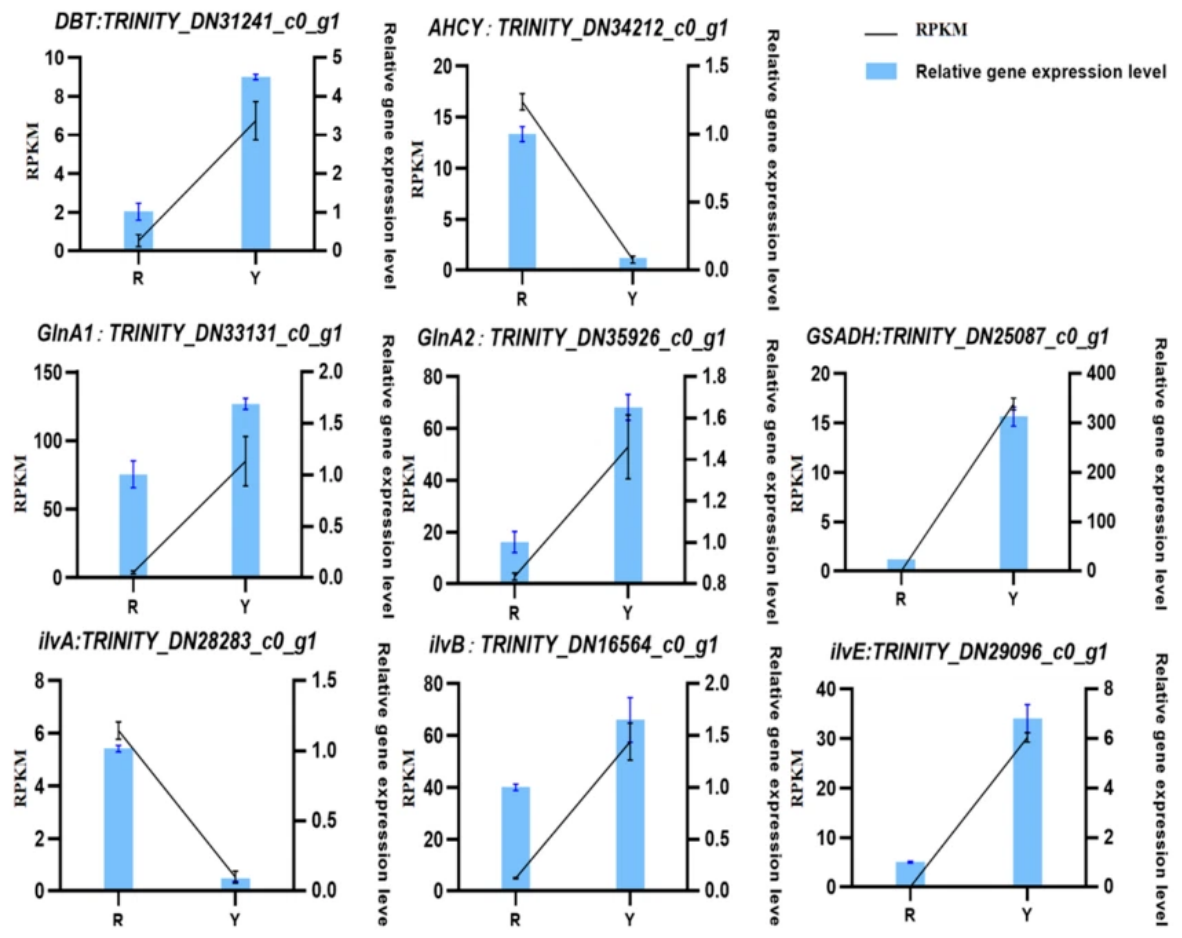
To verify the reliability of transcriptome sequencing data, this study randomly selected eight genes related to amino acid metabolic pathways, designed primers, and performed RT-qPCR validation. The results showed that the expression patterns of these eight genes were basically consistent with the transcriptome results (Figure 7), indicating that the transcriptome sequencing data are reliable.
Figure 7.
qPCR validation.
4. Discussion
Fruit-color variation is jointly determined by genetic background and environmental factors, with the former setting the pigment synthesis capacity and the latter modulating final pigment composition and content [34]. In this study, the ‘Y’ exhibited a ‘bright golden yellow’ phenotype with high L*, high b*, and low a* values, whereas the ‘R’ showed a deep red-purple appearance with low L*, high a*, and low b*. These colorimetric differences quantitatively confirmed distinct pigment deposition patterns between the two genotypes. Metabolomic profiling further revealed that the color divergence is not driven by a single pigment but by differential accumulation across multiple flavonoid branches: ‘R’ was enriched in flavonol/isoflavonoid-type compounds (e.g., putatively annotated metabolite quercetin, trifolin, 6′-O-acetylgenistin), while ‘Y’ accumulated flavonoid glycosides (e.g., putatively annotated metabolite orientin, camelliaside A, vaccarin). This pattern suggests that the two genotypes allocate precursors differently between anthocyanin biosynthesis and competing glycosylation pathways.
Phenolic compounds are major determinants of the biological activity of Rubus hirsutus fruits. The total pool and individual composition of phenolics (including flavonoids, anthocyanins, hydroxycinnamic acids and hydrolyzable tannins) largely govern antioxidant, radical-scavenging and anti-inflammatory potential. In our untargeted metabolomic dataset, 28 phenolic compounds were quantified. The total phenolic abundance in ‘R’ was approximately 12.7-fold higher than in ‘Y’ (Table S7). This disparity was primarily driven by putatively annotated metabolite genistin, hesperetin-5-O-glucoside, skimmin and the anthocyanin kuromanin, all of which were markedly more abundant in ‘R’. Notably, a small subset of phenolics (putatively annotated metabolite catechin, ellagic acid, caffeic acid and p-coumaric acid) accumulated to higher levels in ‘Y’, indicating that although the overall phenolic pool is far larger in ‘R’, the two forms differ in phenolic composition rather than merely in total quantity. Because total phenolic content is the principal contributor to antioxidant capacity in berry fruits, the substantially larger phenolic pool in ‘R’ suggests that red fruits possess theoretically greater potential health-promoting biological activity associated with phenolic metabolites. Beyond their bioactive functions, fruit-rich juice matrices are also capable of modulating umami-associated sensory properties and enhancing the sensory acceptance of plant-based food systems [35]. It should be noted that neither fruit form shows absolute overall nutritional superiority. While the red-fruited form ‘R’ displays greater theoretical health-promoting potential originating from high phenolic accumulation, ‘Y’ possesses advantages in amino acid-related nutritional quality: ‘Y’ contained significantly higher total free amino acid content, together with higher total essential amino acid levels, and accumulated high abundances of nutritionally important amino acids including asparagine, glutamine and alanine. In addition, several individual bioactive phenolics such as putatively annotated metabolite catechin and ellagic acid were more enriched in ‘Y’. Nevertheless, this interpretation is inferred exclusively from metabolite-profiling data. Direct in vitro or in vivo biological-activity assays were not conducted in the current work, and the functional significance of these phenolic differences remains to be confirmed by independent experiments.
Compared with existing studies, amino acid contents of Rubus hirsutus varied under different cultivation modes [36], and leaf amino acid contents differed significantly among its genotypes [37]. In our study, amino acid metabolism differed substantially between the two genotypes. The total free amino acid content in ‘Y’ (1638.6 μg/g FW) was significantly higher than in ‘R’ (1331.8 μg/g FW), with glutamine showing the most pronounced difference (5.21-fold). This contrasts with Rubus chingii Hu, where essential amino acids accounted for up to 33.62% of total amino acids during the yellow-to-red transition [38]. In our mature fruits, EAA proportions were only 10.37% (‘Y’) and 11.74% (‘R’), suggesting that amino acid allocation strategies in R. hirsutus differ markedly from those in R. chingii, or that developmental stage strongly influences EAA accumulation. Similarly, in peach, yellow- and white-fleshed varieties contained total amino acids above 1100 μg/g FW, whereas red-fleshed varieties were below 750 μg/g FW [23]. The transcriptomic data provide mechanistic clues for these metabolic differences. Glutamine synthetase (GS, K01915) was highly expressed in ‘Y’, correlating with glutamine accumulation. This observation differs from blackberry, where plastidial GS abundance declines sharply during ripening while cytosolic GS remains stable [39]. The high GS expression in ‘Y’ may thus reflect a distinct nitrogen assimilation strategy, potentially supporting the synthesis of asparagine and alanine as nitrogen donors. For branched-chain amino acids (BCAAs), acetolactate synthase (K01652) and BCAT (K00826, TRINITY_DN29096_c0_g1) were specifically upregulated in ‘Y’, consistent with the enrichment of valine and isoleucine. In tomato and strawberry, BCAT-mediated transamination of BCAAs is a core step in the “amino-keto acid-alcohol-ester” pathway leading to fruity volatiles [40,41,42]. The coordinated upregulation of BCAA synthesis and transamination genes in ‘Y’ therefore suggests that yellow fruits may have a greater potential for flavor precursor supply, although direct volatile profiling is needed to confirm this.
Significant differences in amino acid metabolic pathways were observed between the red-fruited and yellow-fruited R. hirsutus genotypes in this study, at both metabolite accumulation and potential regulatory levels. Some amino acids can be converted into secondary metabolites via specific enzymatic reactions, potentially participating in fruit quality formation. Meanwhile, amino acid metabolism is tightly interconnected with core pathways including glycolysis and the tricarboxylic acid cycle, which together may shape nutrient accumulation and flavor profiles during fruit ripening. In the metabolomic comparison between ‘Y’ and ‘R’, we found that putatively annotated metabolite N-caffeoylagmatine, 4-aminobutyric acid, and Nε-(1-carboxymethyl)-L-lysine showed higher contents in ‘Y’. The accumulation of 4-aminobutyric acid often functions in stress response and maintenance of cellular redox balance, while the increased phenolic amides such as N-caffeoylagmatine may participate in secondary metabolic defense and signal transduction responses in yellow fruits, suggesting that ‘Y’ may be under higher oxidative stress or possess stronger reactive oxygen species-scavenging capacity. In contrast, the significant accumulation of various amino acids and their derivatives in red fruits—including putatively annotated metabolite L-citrulline, Kynurenic acid, nicotianamine, argininosuccinic acid, and various dipeptides (such as WKK, WLH, etc.)—indicates substantial divergence in amino acid metabolism between these two genotypes. Kynurenic acid, as a product of the Tryptophan metabolic pathway, participates in photoprotection and antioxidant responses; nicotianamine is involved in metal ion chelation and transport, affecting the distribution and utilization of trace elements in fruits while the accumulation of arginine metabolism-related intermediates (such as L-citrulline and argininosuccinic acid) may accelerate red phenotype maturation by promoting NO-mediated carotenoid cleavage or ethylene precursor synthesis. In summary, the metabolic variations between ‘Y’ and ‘R’ fruits putatively reflect differences in antioxidant defense and stress response capacity. Meanwhile, our observational data imply potential distinctions in nitrogen metabolism patterns, amino acid-derived metabolic processes, and signaling molecule accumulation between the two fruit genotypes.
In ‘R’, cysteine metabolism and aromatic amino acid pathways were more active. Genes encoding serine acetyltransferase (K00640) and cysteine synthase (K01738) showed higher expression in ‘Y’ in our dataset, yet cysteine and glutathione accumulated more in ‘R’. This apparent discrepancy may be explained by post-transcriptional regulation or by a higher demand for cysteine in ‘R’ for glutathione synthesis, which in turn stabilizes anthocyanins. This is consistent with the “sulfur metabolism–anthocyanin stabilization” mechanism reported in bilberry [43], and with the abundant accumulation of kuromanin in ‘R’. The aromatic amino acid pathway in ‘R’ likely supplies phenylalanine and tyrosine as precursors for anthocyanin and proanthocyanidin biosynthesis, linking amino acid metabolism directly to the red phenotype.
From a practical application perspective, the present multi-omics findings provide valuable baseline information for the utilization of R. hirsutus germplasm resources. The red-fruited genotype ‘R’ accumulates abundant anthocyanins and phenolics, and the yellow-fruited genotype ‘Y’ shows elevated free amino acid levels. This study is the first to employ combined transcriptomic–metabolomic analysis to dissect metabolic divergence between the red-fruited wild type and the yellow-fruited natural form of R. hirsutus Thunb., and reveals amino acid metabolic differences among different R. hirsutus genotypes, which have not been reported in previous studies. Meanwhile, the present study has certain limitations: the multi-omics analysis only uncovers correlations between genes and metabolites and cannot prove direct causal regulatory relationships. Further genetic transformation experiments are required for functional validation of candidate genes.
5. Conclusions
By integrating multi-omics technologies, this study characterizes differences in amino acid composition, metabolite accumulation, and key gene expression profiles between mature fruits of yellow-fruited (‘Y’) and red-fruited (‘R’) Rubus hirsutus. The key findings are summarized as follows: (1) Compared with the red-fruited genotype, the yellow-fruited genotype (‘Y’) exhibited significantly higher free amino acids and essential amino acid content, with asparagine, alanine, and glutamine as the characteristic dominant amino acid components. Notably, key genes involved in the glutamine synthetase pathway and branched-chain amino acid metabolic pathway were significantly upregulated in yellow fruits; this transcriptional pattern correlates with the observed metabolic features of efficient nitrogen assimilation and accumulation of flavor-related amino acids in ‘Y’. (2) The red-fruited genotype (‘R’) accumulates high levels of proline and arginine. Transcriptomic data indicated enhanced activity of cysteine metabolism, glutathione metabolism and aromatic amino acid synthesis pathways in red fruits, which correlates with abundant accumulation of anthocyanin glycosides (e.g., kuromanin) and the red fruit phenotype of ‘R’. Collectively, our multi-omics data reveal multiple potential links between amino acid metabolism and fruit-related traits in R. hirsutus. Amino acids may supply precursors for secondary metabolism such as anthocyanin biosynthesis, participate in antioxidant defense responses, and be involved in nitrogen transport and utilization; however, causal regulatory relationships remain to be experimentally validated. These findings not only deepen the understanding of the coordinated regulatory network among fruit color, nutrition, and flavor in Rubus fruits but also provide critical candidate gene targets and theoretical basis for the directed improvement in R. hirsutus genotypes via molecular breeding strategies, laying a foundation for the development and utilization of high-quality Rubus germplasm resources.
Supplementary Materials
The following supporting information can be downloaded at https://www.mdpi.com/article/10.3390/horticulturae12111371/s1. Table S1: Chromatographic conditions for amino acid quantification. Table S2: Chromatographic–mass spectrometric and data-processing parameters for metabolomics. Table S3: Annotation of differential metabolites. Table S4: Summary of RNA-seq data quality. Table S5: Taxonomic annotation of Trinity-assembled unigenes against NCBI NR database. Table S6: Primers used for RT-qPCR validation. Table S7: Relative abundances of 28 phenolic-related metabolites detected in ‘R’ and ‘Y’ R. hirsutus fruits. Figure S1: Permutation test of the OPLS-DA model comparing fruit metabolomes between ‘R’ and ‘Y’.
Author Contributions
X.W. (Xingru Wei): Data collection and curation; writing—original draft; writing—final version; literature retrieval; figure preparation; study design; and data analysis. X.W. (Xiaomin Wang): Conceptualization; critical revision of the manuscript for important intellectual content; writing—final version; and study design. Z.L.: Conceptualization; critical revision of the manuscript for important intellectual content; and writing—final version. X.T.: Data collection and curation; writing—original draft; writing—final version; literature retrieval; figure preparation; and data analysis. L.T.: Conceptualization; critical revision of the manuscript for important intellectual content; and writing—final version. Q.Z.: Conceptualization; critical revision of the manuscript for important intellectual content; writing—final version; project administration; and funding acquisition. S.C.: Data collection and curation; writing—original draft; writing—final version; and literature retrieval. Y.W.: Conceptualization; critical revision of the manuscript for important intellectual content; and writing—final version. All authors agree to be accountable for the accuracy and authenticity of the entire research work, and ensure that any issues related to the accuracy or integrity of any part of the manuscript are appropriately investigated and resolved. All authors have read and agreed to the published version of the manuscript.
Funding
Jiangsu Key Laboratory for Conservation and Utilization of Plant Resources (JSPKLB202411), Postgraduate Research & Practice Innovation Program of Jiangsu Province (26CXJH7538).
Data Availability Statement
The original contributions presented in this study are included in the article and Supplementary Materials. Further inquiries can be directed to the corresponding author.
Conflicts of Interest
Author Ziyu Li is employed by the company Shenzhen Noposion Crop Science Co., Ltd., Shenzhen 518102, China. The remaining authors declare that the research was conducted in the absence of any commercial or financial relationships that could be construed as potential conflicts of interest.
References
- Zhao, W.W.; Li, A.M.; Zhang, Z.H.; Zhang, Y.; Li, Y.H.; Chen, X.D. Study on photosynthetic characteristics of wild raspberry Rubus hirsutus. China Fruits 2014, 58–61. (In Chinese) [Google Scholar]
- Zhong, S.M.; Lin, H.P.; Wang, Q.S.; Zhou, Z.Y.; Lou, X.L. Preparation of Rubus hirsutus fruit juice beverage. J. Zhejiang For. Coll. 1998, 79–83. (In Chinese) [Google Scholar]
- Zhang, K.; Wang, D.Q. Textual research on the original plant of Rubus hirsutus in shennong bencao jing. Mod. Chin. Med. 2011, 13, 9–11. (In Chinese) [Google Scholar]
- Chen, B.H.; Liu, J.Q.; Lin, W.Q. Studies on nutritional components utilization of Rubus hirsutus fruits from fujian province. J. Fujian Norm. Univ. (Nat. Sci. Ed.) 2000, 2, 85–88. (In Chinese) [Google Scholar]
- Wang, X.M.; Li, H.Y.; Wu, W.L.; Qu, L.W.; Li, W.L. Study on low-temperature storage of Rubus hirsutus pollen. Jiangsu Agric. Sci. 2010, 3, 170–171. (In Chinese) [Google Scholar]
- Fu, Y.; Zhou, X.; Chen, S.; Sun, Y.; Shen, Y.; Ye, X. Chemical composition and antioxidant activity of Chinese wild raspberry (Rubus hirsutus Thunb.). LWT—Food Sci. Technol. 2015, 60, 1262–1268. [Google Scholar] [CrossRef] [Scilit]
- Meyerding, S.; Kürzdörfer, A.; Gassler, B. Consumer preferences for superfood ingredients—The case of bread in Germany. Sustainability 2018, 10, 4667. [Google Scholar] [CrossRef] [Scilit]
- Barrett, D.M.; Beaulieu, J.C.; Shewfelt, R. Color, flavor, texture, and nutritional quality of fresh-cut fruits and vegetables: Desirable levels, instrumental and sensory measurement, and the effects of processing. Crit. Rev. Food Sci. Nutr. 2010, 50, 369–389. [Google Scholar] [CrossRef] [Scilit] [PubMed]
- Kumar, P.S.; Maurer, D.; Feygenberg, O.; Love, C.; Alkan, N. Improving the red color and fruit quality of ‘Kent’ mango fruit by pruning and preharvest spraying of prohydrojasmon or abscisic acid. Agronomy 2020, 10, 944. [Google Scholar] [CrossRef] [Scilit]
- Sivankalyani, V.; Feygenberg, O.; Diskin, S.; Wright, B.; Alkan, N. Increased anthocyanin and flavonoids in mango fruit peel are associated with cold and pathogen resistance. Postharvest Biol. Technol. 2016, 111, 132–139. [Google Scholar] [CrossRef] [Scilit]
- David, R.; Jose, E. Phenotypic diversity and relationships of fruit quality traits in apricot (Prunus armeniaca L.) germplasm. Euphytica 2008, 163, 143–158. [Google Scholar] [CrossRef] [Scilit]
- Kim, J.; Ryu, J.; Lee, H.S.; Kim, J.H.; Kim, D.-G.; Ha, T.H.; Kim, S.H. Evaluation of anthocyanin profiling, total phenolic and flavonoid content, and antioxidant activity of korean Rubus accessions for functional food applications and breeding. Antioxidants 2025, 14, 1012. [Google Scholar] [CrossRef] [Scilit] [PubMed]
- Li, X.B.; Sun, J.; Chen, Z.; Jiang, J.; Jackson, A. Characterization of carotenoids and phenolics during fruit ripening of Chinese raspberry (Rubus chingii Hu). RSC Adv. 2021, 11, 10804–10813. [Google Scholar] [CrossRef] [Scilit] [PubMed]
- Cheng, Y.; Wan, H.J.; Yao, Z.P.; Ye, Q.J.; Wang, R.Q.; Yang, Y.J.; Zhou, G.Z.; Ruan, M.Y. Amino acid composition and flavor analysis of different cherry tomato varieties. J. Nucl. Agric. Sci. 2019, 33, 2177–2185. (In Chinese) [Google Scholar]
- Xue, Q.Q.; Zhang, Q.X.; Zhang, A.A.; Li, D.; Liu, Y.; Xu, H.; Yang, Q.; Liu, F.; Han, T.; Tang, X.; et al. Integrated metabolome and transcriptome analysis provides clues to fruit color formation of yellow, orange, and red bell pepper. Sci. Rep. 2024, 14, 29737. [Google Scholar] [CrossRef] [Scilit] [PubMed]
- Delphine, M.P.; Sonia, O.; Jose, G.V. From central to specialized metabolism: An overview of some secondary compounds derived from the primary metabolism for their role in conferring nutritional and organoleptic characteristics to fruit. Front. Plant Sci. 2019, 10, 835. [Google Scholar] [CrossRef] [Scilit] [PubMed]
- Klee, H.J.; Tieman, D.M. The genetics of fruit flavour preferences. Nat. Rev. Genet. 2018, 19, 347–356. [Google Scholar] [CrossRef] [Scilit] [PubMed]
- Alnuwaiser, A.M. Study and comparison of amino acids in red and green apples. Int. J. Pharm. Sci. 2017, 8, 4097–4105. [Google Scholar] [CrossRef]
- Gonda, I.; Bar, E.; Portnoy, V.; Lev, S.; Burger, J.; Schaffer, A.A.; Tadmor, Y.; Gepstein, S.; Giovannoni, J.J.; Katzir, N.; et al. Branched-chain and aromatic amino acid catabolism into aroma volatiles in Cucumis melo L. fruit. J. Exp. Bot. 2010, 61, 1111–1123. [Google Scholar] [CrossRef] [Scilit] [PubMed]
- Kogovšek, P.; Pompe-Novak, M.; Petek, M.; Fragner, L.; Weckwerth, W.; Gruden, K. Primary metabolism, phenylpropanoids and antioxidant pathways are regulated in potato as a response to potato virus Y infection. PLoS ONE 2016, 11, e0146135. [Google Scholar] [CrossRef] [Scilit] [PubMed]
- Zhu, Y.F.; Wang, Y.; Wang, G.Y.; Zhou, C.C.; Jiao, Y.; Gan, K.X.; Sun, D.L.; Zhu, C.Q.; Jia, H.J.; Gao, Z.S. Analysis of free amino acid composition in fruits of different Chinese bayberry (Myrica rubra) varieties. J. Zhejiang Univ. Sci. B 2021, 47, 736–742. (In Chinese) [Google Scholar]
- Baek, M.W.; Lee, J.H.; Yeo, C.E.; Tae, S.H.; Chang, S.M.; Choi, H.R.; Park, D.S.; Tilahun, S.; Jeong, C.S. Antioxidant profile, amino acids composition, and physicochemical characteristics of cherry tomatoes are associated with their color. Antioxidants 2024, 13, 785. [Google Scholar] [CrossRef] [Scilit] [PubMed]
- Sun, M.; Zhao, B.; Cai, Z.; Yan, J.; Ma, R.; Yu, M. Amino acid profiles in peach (Prunus persica L.) fruit. Foods 2022, 11, 1718. [Google Scholar] [CrossRef] [Scilit] [PubMed]
- Duan, W.; Shao, W.; Lin, W.; Yuan, L.; Lu, Q.; Chen, L.; Zagorchev, L.; Li, J. Integrated metabolomics and transcriptomics reveal the differences in fruit quality of the red and white fragaria pentaphylla morphs. Food Biosci. 2021, 40, 100896. [Google Scholar] [CrossRef] [Scilit]
- Tieman, D.M.; Zeigler, M.; Schmelz, E.A.; Taylor, M.G.; Bliss, P.; Kirst, M.; Klee, H.J. Identification of loci affecting flavour volatile emissions in tomato fruits. J. Exp. Bot. 2006, 57, 887–896. [Google Scholar] [CrossRef] [Scilit] [PubMed]
- Yang, Z.F.; Zheng, Y.H.; Cao, S.F. Influence of harvest maturity on fruit quality, color development and phenylalanine ammonia-lyase(PAL) activities in Chinese bayberry during storage. Acta Hortic. 2013, 171–175. [Google Scholar] [CrossRef] [Scilit]
- Roland, T.; Friedrich, D. Biogenesis of banana volatiles. J. Agric. Food Chem. 2002, 21, 560–565. [Google Scholar] [CrossRef] [Scilit]
- Zhou, N.; Yan, Y.; Wen, Y.; Zhang, M.; Huang, Y. Integrated transcriptome and metabolome analysis unveilsthe mechanism of color-transition in edgeworthia chrysantha tepals. BMC Plant Biol. 2023, 23, 567. [Google Scholar] [CrossRef] [Scilit] [PubMed]
- Henderson, J.W.; Ricker, R.D.; Bidlingmeyer, B.A.; Woodward, C. Rapid, Accurate, Sensitive, and Reproducible HPLC Analysis of Amino Acids; Amino Acids: Santa Clara, CA, USA, 2000; Volume 1100, pp. 1–10. [Google Scholar]
- Want, E.J.; O’Maille, G.; Smith, C.A.; Brandon, T.R.; Uritboonthai, W.; Qin, C.; Trauger, S.A.; Siuzdak, G. Solvent-Dependent Metabolite Distribution, Clustering, and Protein Extraction for Serum Profiling with Mass Spectrometry. Anal. Chem. 2006, 78, 743–752. [Google Scholar] [CrossRef] [Scilit] [PubMed]
- Wu, Y.Q.; Zhang, C.H.; Yang, H.Y.; Brandon, T.R.; Uritboonthai, W.; Qin, C.; Trauger, S.A.; Siuzdak, G. Selection and validation of candidate reference genes for gene expression analysis by RT-qPCR in Rubus. Int. J. Mol. Sci. 2021, 22, 10533. [Google Scholar] [CrossRef] [Scilit] [PubMed]
- Krajcovicova-Kudlackova, M.; Babinska, K.; Valachovicova, M. Health benefits and risks of plant proteins. Bratisl. Lek. Listy 2005, 106, 231–234. [Google Scholar] [CrossRef] [Scilit]
- Kohl, S.; Behrens, M.; Dunkel, A.; Hofmann, T.; Meyerhof, W. Amino acids and peptides activate at least five members of the human bitter taste receptor family. J. Agric. Food Chem. 2013, 61, 53–60. [Google Scholar] [CrossRef] [Scilit] [PubMed]
- Espley, R.V.; Jaakola, L. The role of environmental stress in fruit pigmentation. Plant Cell Environ. 2023, 46, 3663–3679. [Google Scholar] [CrossRef] [Scilit] [PubMed]
- Belovic, M.; Pezo, L.; Radivojevic, G.; Penić, M.; Lazarević, J.; Filipčev, B.; Čakar, U.; Vitas, J.; Cvetković, B. Relationship between knowledge, attitudes, and practices for the consumption of spirulina-enriched fruit and vegetable juices: Structural equation modelling and consumers’ preference evaluation approach. Nutrients 2026, 18, 1309. [Google Scholar] [CrossRef] [Scilit] [PubMed]
- Tong, X.B.; Wei, X.R.; Zeng, Q.L.; Ping, X.; Liu, L.; Jiang, Y.; Wang, X. Multidimensional evaluation of fruit color differentiation in Rubus hirsutus Thunb.: Significant differences in morphological, nutritional, and physiological characteristics between red and yellow berry varieties. Int. J. Food Sci. 2026, 2026, 8921700. [Google Scholar] [CrossRef] [Scilit] [PubMed]
- Wu, H.L.; Ping, X.Y.; Liu, L.Q.; Wang, X.M.; Wu, Y.Q.; Wei, X.R.; Li, W.L. Comparative analysis of differences in leaf phenotype, physiological parameters, and elemental composition between two fruit-color types of Rubus hirsutus. Russ. J. Plant Physiol. 2025, 72, 177. [Google Scholar] [CrossRef] [Scilit]
- Luo, Y.Y.; Hua, Y.J.; Chen, S.J.; Qian, X.; Ruan, H.; Pan, P.; Chen, H. Widely untargeted metabolomics profiling combined with transcriptome analysis provides new insight into amino acid biosynthesis at different developmental stages of Rubus chingii hu (Chinese raspberry). J. Med. Food 2024, 27, 993–1003. [Google Scholar] [CrossRef] [Scilit] [PubMed]
- Famiani, F.; Walker, P.R. Changes in abundance of enzymes involved in organic acid amino acid sugar metabolism photosynthesis during the ripening of blackberry fruit. J. Am. Soc. Hortic. Sci. 2009, 134, 167–175. [Google Scholar] [CrossRef] [Scilit]
- Pérez, A.G.; Olías, R.; Luaces, P.; Sanz, C. Biosynthesis of strawberry aroma compounds through amino acid metabolism. J. Agric. Food Chem. 2002, 50, 4037–4042. [Google Scholar] [CrossRef] [Scilit] [PubMed]
- Schwab, W.; Davidovich-Rikanati, R.; Lewinsohn, E. Biosynthesis of plant-derived flavor compounds. Plant J. Cell Mol. Biol. 2008, 54, 712–732. [Google Scholar] [CrossRef] [Scilit] [PubMed]
- Tieman, D.; Taylor, M.; Schauer, N.; Fernie, A.R.; Hanson, A.D.; Klee, H.J. Tomato aromatic amino acid decarboxylases participate in synthesis of the flavor volatiles 2-phenylethanol and 2-phenylacetaldehyde. Proc. Natl. Acad. Sci. USA 2006, 103, 8287–8292. [Google Scholar] [CrossRef] [Scilit] [PubMed]
- Jaakola, L.; Määttä, K.; Pirttilä, A.M.; Törrönen, R.; Kärenlampi, S.; Hohtola, A. Expression of genes involved in anthocyanin biosynthesis in relation to anthocyanin, proanthocyanidin, and flavonol levels during bilberry fruit development. Plant Physiol. 2002, 130, 729–739. [Google Scholar] [CrossRef] [Scilit] [PubMed]

Disclaimer/Publisher’s Note: The statements, opinions and data contained in all publications are solely those of the individual author(s) and contributor(s) and not of MDPI and/or the editor(s). MDPI and/or the editor(s) disclaim responsibility for any injury to people or property resulting from any ideas, methods, instructions or products referred to in the content. |
© 2026 by the authors. Licensee MDPI, Basel, Switzerland. This article is an open access article distributed under the terms and conditions of the Creative Commons Attribution (CC BY) license.