


Abstract
Lavender (Lavandula angustifolia Mill.) owes much of its ornamental and economic value to its violet–purple inflorescences, yet the molecular basis of this coloration remains poorly understood. By integrating untargeted metabolomics, RNA-seq, and phylogenetic analysis with morphological and microscopic observations across floral development, we resolved the developmental program of anthocyanin pigmentation in L. angustifolia ‘Xinxun 2’. Anthocyanin content followed an initiation–peak–plateau trajectory, peaking at full flowering; nevertheless, the corolla continued to shift toward purple–blue at late flowering despite stable pigment levels, indicating that the final hue is not governed by pigment quantity alone. Molecularly, the delphinidin branch (F3′5′H) was the principal determinant of the violet phenotype, and the pathway was temporally partitioned—structural genes peaked at early flowering, whereas the late anthocyanin-modifying gene AOMT was induced at full flowering, and the competing flavan-3-ol branch enzyme ANR was also up-regulated at this stage; two subgroup-6 R2R3-MYB transcription factors (MYB90, MYB114) emerged as candidate activators. These findings provide the first stage-resolved molecular framework for floral pigmentation in lavender and identify full flowering as the optimal pigment-extraction window, offering concrete targets for molecular breeding of novel flower colors.
1. Introduction
Few ornamental plants are as inseparable from their color as lavender. The violet-to-purple inflorescences of Lavandula angustifolia Mill. (Lamiaceae) define the genus for consumers, underpin its ornamental market value, and, together with its essential oil, support a global industry spanning perfumery, cosmetics, pharmaceuticals, and landscaping [1,2,3,4]. Flower pigmentation in Lamiaceae is chemically distinctive: family members typically accumulate delphinidin-derived anthocyanins extensively decorated with aromatic and aliphatic acyl groups, modifications that stabilize the chromophore, shift absorption toward violet and blue, and, in genera such as Salvia and Tripora, enable intramolecular copigmentation and even metalloanthocyanin formation [5,6,7,8]. However, despite this well-documented chemical diversity, the specific structural genes and the underlying transcriptional regulatory mechanisms that determine the characteristic hue of lavender remain largely unexplored.
Anthocyanins, the dominant pigments of purple and blue flowers in most angiosperms, are synthesized through the flavonoid branch of the phenylpropanoid pathway, and their final hue is set at three successive levels [9,10]. Although the enzymatic steps of anthocyanin biosynthesis are conserved across higher plants, the specific branch utilization and spatiotemporal regulation in lavender remain largely unresolved. It begins with the conversion of phenylalanine to 4-coumaroyl-CoA by early enzymes (PAL, C4H, and 4CL), which then condenses with malonyl-CoA to form chalcone via CHS. Subsequent isomerization and hydroxylation by CHI and F3H yield dihydroflavonols. Finally, late biosynthetic enzymes, including DFR, ANS, and UFGT, convert these precursors into stable anthocyanins [11,12]. First, competition between flavonoid 3′-hydroxylase (F3′H) and flavonoid 3′,5′-hydroxylase (F3′5′H) partitions flux between pelargonidin-type (orange–red, one hydroxyl), cyanidin-type (red–purple, two hydroxyls) and delphinidin-type (violet–blue) aglycones, making B-ring hydroxylation the primary determinant of color along the red-to-blue axis [9,10]. Crucially, the specific degree of B-ring hydroxylation strongly dictates the substrate preference of dihydroflavonol 4-reductase (DFR), a key rate-limiting enzyme that ultimately determines which anthocyanidin branch is synthesized [13,14]. Second, sequential glycosylation, methylation, and—critically in Lamiaceae—aromatic acylation with hydroxycinnamoyl moieties generate polyacylated anthocyanins whose folded conformations protect the flavylium cation and shift the absorption maximum bathochromically [5,8,15]. Third, the pigments must be efficiently sequestered into the vacuole by TT19-class glutathione S-transferases (GSTs) and MATE/ABC-type transporters. Recent studies have revised the classical view of GSTs as mere transporters; current evidence indicates that they primarily act as enzymes catalyzing glutathione conjugation, while a carrier/ligandin role cannot be excluded [12,16]. The loss of these components abolishes pigmentation even when biosynthesis is intact, while vacuolar pH, metal ions, and copigments further tune the realized hue [17,18]. Flower color is thus an emergent property of biosynthesis, decoration, transport, and vacuolar chemistry acting in concert [5,17].
These processes are orchestrated by a layered transcriptional system centered on the highly conserved MYB–bHLH–WD40 (MBW) complex, in which subgroup-6 R2R3-MYB activators confer spatiotemporal specificity. Biosynthesis and transport can be co-regulated in feedforward loops, as exemplified by the RcMYB75–RcGSTFL11 module in rose, and GST genes such as MaGST1, which function primarily as catalytic enzymes, also play crucial roles in determining final flower color [19,20]. Given that anthocyanin accumulation is intrinsically developmental, this machinery generates stage-specific accumulation programs: stage-resolved analyses in Gloriosa superba, Sophora japonica, and rose have shown that the temporal dynamics of individual cyanidin- and delphinidin-type glycosides, rather than their mere presence, dictate color intensity at full bloom [21,22,23]. Capturing such programs requires reading metabolite accumulation together with gene expression, because transcripts are transient whereas anthocyanins are relatively stable pigments whose final accumulation represents a dynamic balance between biosynthesis and degradation. The core regulatory mechanism of anthocyanin biosynthesis, specifically the MYB-bHLH-WD40 (MBW) complex, was initially discovered and characterized in Arabidopsis [24], and has been reviewed [25,26]. Integrated transcriptome–metabolome analysis, coupled with correlation analysis, provides a powerful analytical template for pigment dissection in plants. However, a stage-resolved framework for floral pigmentation has not yet been established in lavender.
Although chromosome-level genomes [2,27] and extensive multi-omics studies have thoroughly elucidated terpenoid biosynthesis and trichome development in lavender [28,29,30,31,32], the molecular mechanisms governing its most defining trait—flower color—remain poorly understood. Consequently, the current understanding of lavender coloration is restricted to a basic chromatographic survey [3] and the cloning of a single structural gene (LaCHS) [33], leaving its specific anthocyanidin branching, pigment decoration, and upstream regulatory networks (e.g., the MBW complex) largely unexplored.
To close this gap, we profiled L. angustifolia flowers across three developmentally ordered stages (early flowering [EF], pale-purple onset; full flowering [FF], peak pigmentation and ornamental value; late flowering [LF], wilting with a dark purple-blue shift) using integrated untargeted metabolomics (UPLC-MS/MS) and RNA-seq. We hypothesized that (i) the violet hue arises from developmental accumulation of delphinidin-type anthocyanins; (ii) pigmentation is underpinned by coordinated, stage-specific expression of structural and modifying genes (e.g., F3′5′H, glycosyltransferases, acyltransferases); and (iii) R2R3-MYBs such as MYB90 and MYB114 act as candidate regulators, identifiable through stage-resolved co-expression analyses. Accordingly, we characterized metabolite dynamics, identified structural genes and candidate regulators, and reconstructed the metabolite–gene network, providing the first stage-resolved framework for flower color in lavender and a foundation for breeding novel colors.
2. Materials and Methods
2.1. Sampling
The L. angustifolia ‘Xinxun 2’ (LA) was cultivated in the lavender planting field (81°23′23″ E, 43°56′0″ N; 623m) of Yili Agricultural Science Research Institute, Yining, Xinjiang Uygur Autonomous Region. Their cultivar identities were confirmed by the Crop Variety Registration Certificates (No. Xindeng Lavender 2013-21 for ‘Xinxun 2’ and No. 2015-45 for ‘Xinxun 4’) issued by the Xinjiang Uygur Autonomous Region Non-Staple Crop Variety Registration Office. Plants grown for five years were employed in the present study. Samples were collected at the bud stage (BS), EF, FF, and LF stages. Four biological replicates were applied for the metabolomic analysis, and three biological replicates were applied for the transcriptomic analysis and RT-qPCR. All samples were immediately thrown into liquid nitrogen upon harvest and stored at −80 °C for determination of volatiles and RNA-sequencing. Morphological observations of flowers were performed using a Nikon SMZ18 stereomicroscope (Nikon, Tokyo, Japan) at a magnification of 10×. For microscopic observation of trichomes and epidermal cells, fresh floral tissues were carefully dissected from the corolla and calyx using fine forceps under a stereomicroscope. The dissected tissues were mounted on a glass slide in a drop of distilled water, covered with a coverslip, and examined under a Nikon ECLIPSE Ni microscope (Nikon, Tokyo, Japan) at 40× magnification. Images were captured using a digital camera, and scale bars were automatically generated by the NIS-Elements D software (version 5.10.00).
2.2. Determination of Anthocyanins
The anthocyanin content was determined using the pH-differential method [34]. Briefly, fresh lavender flower samples (0.5 g) were ground into a fine powder using liquid nitrogen and extracted with 5 mL of freshly prepared 50% acidified ethanol (ethanol:water:concentrated HCl = 100:98:2, v/v/v) at a solid-to-liquid ratio of 1:10. The mixture was vortexed thoroughly and incubated in a water bath at 60 °C for 30 min in the dark with intermittent shaking. After cooling to room temperature, the extract was centrifuged at 12,000 rpm for 10 min, and the supernatant was filtered through a 0.45 μm membrane. Aliquots of the supernatant (0.5 mL) were then mixed with 2.5 mL of pH 1.0 (KCl-HCl) and pH 4.5 (sodium acetate-HCl) buffers, respectively (dilution factor, DF = 6), and following a 20–30 min incubation in the dark, the absorbance was measured at 530 nm and 700 nm using the corresponding buffers as blanks. The anthocyanin content was calculated as ΔA = (A530 − A700)pH 1.0 − (A530 − A700)pH 4.5 and anthocyanin content (mg/g FW) = (ΔA × DF × MW × V × 1000)/(ε × l × m), where MW is the molecular weight of cyanidin-3-glucoside (449.2 g/mol), ε is the molar extinction coefficient (26,900 L·mol−1·cm−1), l is the path length (1 cm), m is the sample mass (0.5 g), and V is the extraction volume (0.005 L), which simplifies to anthocyanin content (mg/g FW) = ΔA × 1.002.
2.3. Sample Extraction Procedure
Lavender samples (50 ± 5 mg) were accurately weighed into 2 mL centrifuge tubes, and one 6 mm grinding bead was added to each tube. After adding 400 µL of extraction solvent (methanol:water = 4:1, v/v) containing four internal standards (including L-2-chlorophenylalanine at 0.02 mg/mL), the samples were homogenized using a cryogenic tissue grinder at −10 °C and 50 Hz for 6 min, followed by ultrasonication at 5 °C and 40 kHz for 30 min. The homogenates were then kept at −20 °C for 30 min and centrifuged at 13,000× g for 15 min at 4 °C. The resulting supernatant was transferred to autosampler vials with inserts for instrumental analysis. A quality control (QC) sample was prepared by pooling 20 µL of supernatant from each individual sample.
2.4. LC-MS Conditions
LC-MS analysis was performed on a Thermo Fisher Scientific UHPLC-Q Exactive HF-X system (Thermo Fisher Scientific, Waltham, MA, USA). Chromatographic separation was carried out on an ACQUITY UPLC HSS T3 column (100 mm × 2.1 mm i.d., 1.8 µm; Waters, Milford, MA, USA) maintained at 40 °C, with a mobile phase consisting of (A) 95% water and 5% acetonitrile containing 0.1% formic acid and (B) 47.5% acetonitrile/47.5% isopropanol/5% water containing 0.1% formic acid, and the injection volume was 3 µL. Mass spectrometric detection was performed using electrospray ionization in both positive and negative ion modes over a scan range of m/z 70–1050. The sheath gas flow rate was 50 arb, the aux gas flow rate was 13 arb, the heater temperature was 425 °C, the capillary temperature was 325 °C, the S-Lens RF level was 50, the normalized collision energies were 20, 40, and 60, the spray voltages were +3500 V (positive mode) and −3500 V (negative mode), and the resolutions were 60,000 for full MS and 7500 for MS2. Quality control (QC) samples were prepared by mixing equal volumes of all sample extracts, processed and analyzed in the same manner as the study samples, and inserted after every 5–15 analytical samples to monitor the stability of the entire detection process.
2.5. Metabolomics Data Analysis
Raw data were imported into Progenesis QI v3.0 (Waters Corporation, Milford, MA, USA) for baseline filtering, peak detection, integration, retention time correction, and peak alignment, yielding a data matrix containing retention time, mass-to-charge ratio (m/z), and peak intensity (Table S2). Compound identification was then performed using the same software by matching MS and MS/MS spectral information against major public metabolite databases, including HMDB (http://www.hmdb.ca/, accessed on 10 June 2026) and METLIN (https://metlin.scripps.edu/, accessed on 10 June 2026). The MS mass error was set to less than 10 ppm, and metabolites were identified based on the MS/MS matching score.
The experiment was performed using a completely randomized design (CRD), with 4 independent biological replicates per group. Data processing and statistical analysis were performed using multiple software platforms. Morphological and biochemical data were analyzed with SPSS 27.0 (IBM, Armonk, NY, USA) and Origin 2021 (OriginLab, Northampton, MA, USA), and differences among groups were assessed by independent samples t-test, with significance defined as p < 0.05. For metabolomic data, after preprocessing (missing value filtering, imputation, normalization, and QC-based removal of variables with RSD > 30%), multivariate statistical analyses including hierarchical clustering, principal component analysis, and orthogonal partial least squares discriminant analysis were conducted on the MetWare Cloud (MetWare, Wuhan, China) platform. Differentially accumulated metabolites were screened using a VIP score ≥ 1.0 from the OPLS-DA model and a fold change ≥ 2.0 or ≤ 0.5. Metabolite annotations and pathway enrichment analyses were performed using the KEGG database, and correlation heatmaps were generated with MetWare Cloud (MetWare, Wuhan, China).
2.6. Transcriptome Library Preparation and Sequencing
Total RNA was extracted from tissue samples, and its concentration and purity were assessed using a NanoDrop 2000 spectrophotometer (Thermo Fisher Scientific, Waltham, MA, USA). RNA integrity was evaluated by agarose gel electrophoresis, and the RNA quality number (RQN) was determined using an Agilent 5300 system (Agilent Technologies, Santa Clara, CA, USA). For library construction, each sample required ≥1 μg of total RNA with a concentration ≥30 ng/μL, an RQN > 6.5, and an OD260/280 ratio between 1.8 and 2.2. Messenger RNA was subsequently enriched from total RNA through A-T base pairing between oligo(dT)-conjugated magnetic beads and the poly(A) tail at the 3′ end of mRNA. The enriched mRNA was randomly fragmented to approximately 300 bp by adding fragmentation buffer. First-strand cDNA was synthesized using reverse transcriptase and random primers with the fragmented mRNA as the template, followed by second-strand synthesis to generate double-stranded cDNA. The double-stranded cDNA was subjected to end repair and A-tailing, after which adapters were ligated. The ligation products were purified and size-selected, amplified by PCR (13 cycles) to enrich the library, and purified to obtain the final library. The constructed libraries were then subjected to high-throughput sequencing on the NovaSeq platform (Illumina, San Diego, CA, USA) using a PE150 strategy.
2.7. Analysis of the Transcriptomic Data
Raw sequencing reads were first filtered using fastp (v0.23.4) [35] to remove adapters and low-quality reads (Table S3). The resulting clean reads were mapped to the chromosome-level reference genome of Lavandula angustifolia ‘Jingxun 2’ (NCBI BioProject: PRJNA700125) [27] using HISAT2 (v2.2.1) [36], yielding mapping rates of 68.38–97.35%. Transcript assembly and expression quantification were performed with StringTie (v2.2.1) [37], and expression levels were normalized to transcripts per million (TPM). Gene functional annotation was carried out by searching the transcripts against the NR, Swiss-Prot, Pfam, COG, Gene Ontology (GO), and KEGG databases; KEGG Orthology (KO) assignments were then generated for pathway mapping. The resulting expression matrix was used for differential expression analysis with DESeq2 (v1.42.0) [38].
2.8. Identification of Anthocyanin Biosynthesis Structural Genes and Transcriptional Regulators
The structural genes of the anthocyanin/flavonoid biosynthesis pathway were identified in the predicted proteome of the chromosome-level Lavandula angustifolia ‘Jingxun 2’ reference genome (65,905 proteins; NCBI BioProject PRJNA700125) using KIPEs3 v0.38 [39] together with the curated bait and conserved-residue dataset for flavonoid biosynthesis (FlavonoidBioSynBaits v3.4; available at https://github.com/bpucker/KIPEs, accessed on 15 June 2026), following the KIPEs3 multi-evidence framework of sequence similarity, retention of essential functional residues, and phylogeny-based orthology assignment [39,40]. KIPEs3 detects homologues through sequence similarity to curated bait sequences and evaluates their functional integrity by comparing the conservation of experimentally verified, functionally important amino acid residues for each enzyme; the output reports the percentage of conserved functional residues. The ≥75% threshold was applied as an exploratory filter to reduce manual screening efforts and exclude potential pseudogenes, rather than as a final criterion for functional determination.
Because FlavonoidBioSynBaits v3.4 does not provide conserved-residue definitions for the downstream decoration families, family-specific functional residues were defined in a function-motif-driven manner and all candidates were scored uniformly with KIPEs3 v0.38. For anthocyanin 5-O-glucosyltransferases (A5GTs), 37 UDP-sugar donor-binding positions within the 44-amino-acid PSPG box were used. For BAHD acyltransferases (3AT/5MAT/3MAT), the HXXXD catalytic motif, the DFGWG motif and four-residue flanking windows were combined (15/31/29 positions). For class II O-methyltransferases (OMT), 143 positions fully conserved across 12 characterised homologues were applied. Candidates passing the ≥75% retention threshold were further filtered by expression level (TPM ≥ 10) and by directional concordance between transcript and product accumulation across the developmental stages.
For transcriptional regulators, R2R3-MYB candidates were retrieved from the full predicted proteome using MYB_annotator v0.2 [41]. R2R3-MYB DNA-binding domains were aligned with Arabidopsis thaliana reference MYBs from subgroups 4, 5, 6, 7 and 15, and subgroup assignment was resolved by maximum-likelihood phylogeny; assignment to subgroup 6 was supported by the conserved C-terminal ANDV motif in the R3 domain.
As an additional line of evidence for confirming the presence/absence and orthology of all identified genes, maximum-likelihood phylogenies were reconstructed for each gene family, with previously characterised functional sequences from the literature included as references. Multiple sequence alignments were generated with MAFFT v7.490 (G-INS-i algorithm) [42] and converted to codon alignments with pxaa2cdn [43]; alignments were filtered with pxclsq from the PHYX toolkit (p 0.1) [43]. Maximum-likelihood trees were inferred with IQ-TREE v2.3.6 [44] using --alrt 1000 -B 1000 -m MFP, with the best-fit substitution model determined by ModelFinder [45] (for the R2R3-MYB tree, Q.INSECT+G4 was selected).
2.9. Quantitative Real-Time PCR
Total RNA was isolated from lavender flowers using TRIzol Universal reagent (Tiangen, DP424, Beijing, China) following the manufacturer’s protocol. Complementary DNA (cDNA) was synthesized from the total RNA and used as the template for RT-qPCR, with gene-specific primers listed in Table S4. Each 20 μL reaction contained 10 μL of TB Green Premix Ex Taq (TaKaRa, Beijing, China), 2.0 μL of cDNA template (100 ng/μL), 0.8 μL of each forward and reverse primer (10 μM), and 3.4 μL of nuclease-free water. Thermal cycling consisted of an initial denaturation at 95 °C for 30 s, followed by 40 cycles of 95 °C for 5 s and 60 °C for 40 s. Three biological replicates were analyzed for each treatment, with two technical replicates performed per biological replicate. Relative gene expression was calculated using the 2−ΔΔCT method [46] with β-actin (La_Actin, GenBank ID: 64810781) as the internal reference gene.
2.10. Data Processing and Statistical Analysis
Correlations between the metabolomic and transcriptomic datasets were calculated across the three developmental stages (EF, FF and LF; n = 12, four biological replicates per stage) in R (version 4.5.3) using the rcorr function of the Hmisc package (version 5.3-0). As the log2-transformed expression (TPM) and metabolite data were approximately normally distributed, Pearson’s correlation coefficient (r) was used, with Spearman’s rank correlation applied as a non-parametric alternative when the normality assumption was not met. The corresponding p-values were adjusted by the Benjamini–Hochberg false discovery rate procedure (p.adjust, stats package, version 4.5.3), and gene–metabolite pairs with |r| ≥ 0.8 and FDR < 0.05 were considered significantly correlated. The results were visualized as a correlation heatmap (corrplot package, version 0.95) and a gene–compound network constructed in Cytoscape (version 3.10.3), and the directional trends of the RNA-seq data were compared with those of RT-qPCR by Pearson’s correlation (R = 0.721, p < 0.001). Finally, the pathway map was assembled using KEGG (Majorbio Cloud Platform), ChemDraw (version 25, PerkinElmer, Waltham, MA, USA) and Adobe Illustrator (version 2023, Adobe, San Jose, CA, USA).
3. Results
3.1. Morphological and Anthocyanin Changes During Floral Development in Lavender
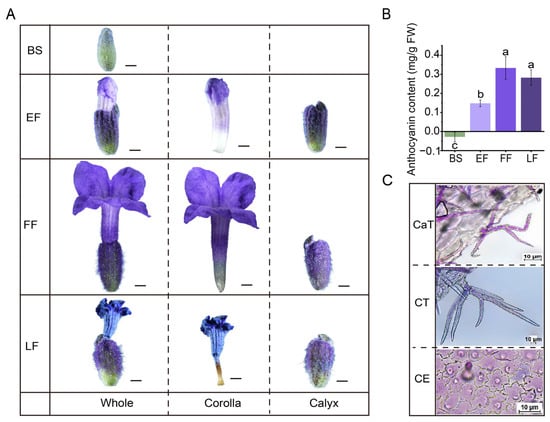
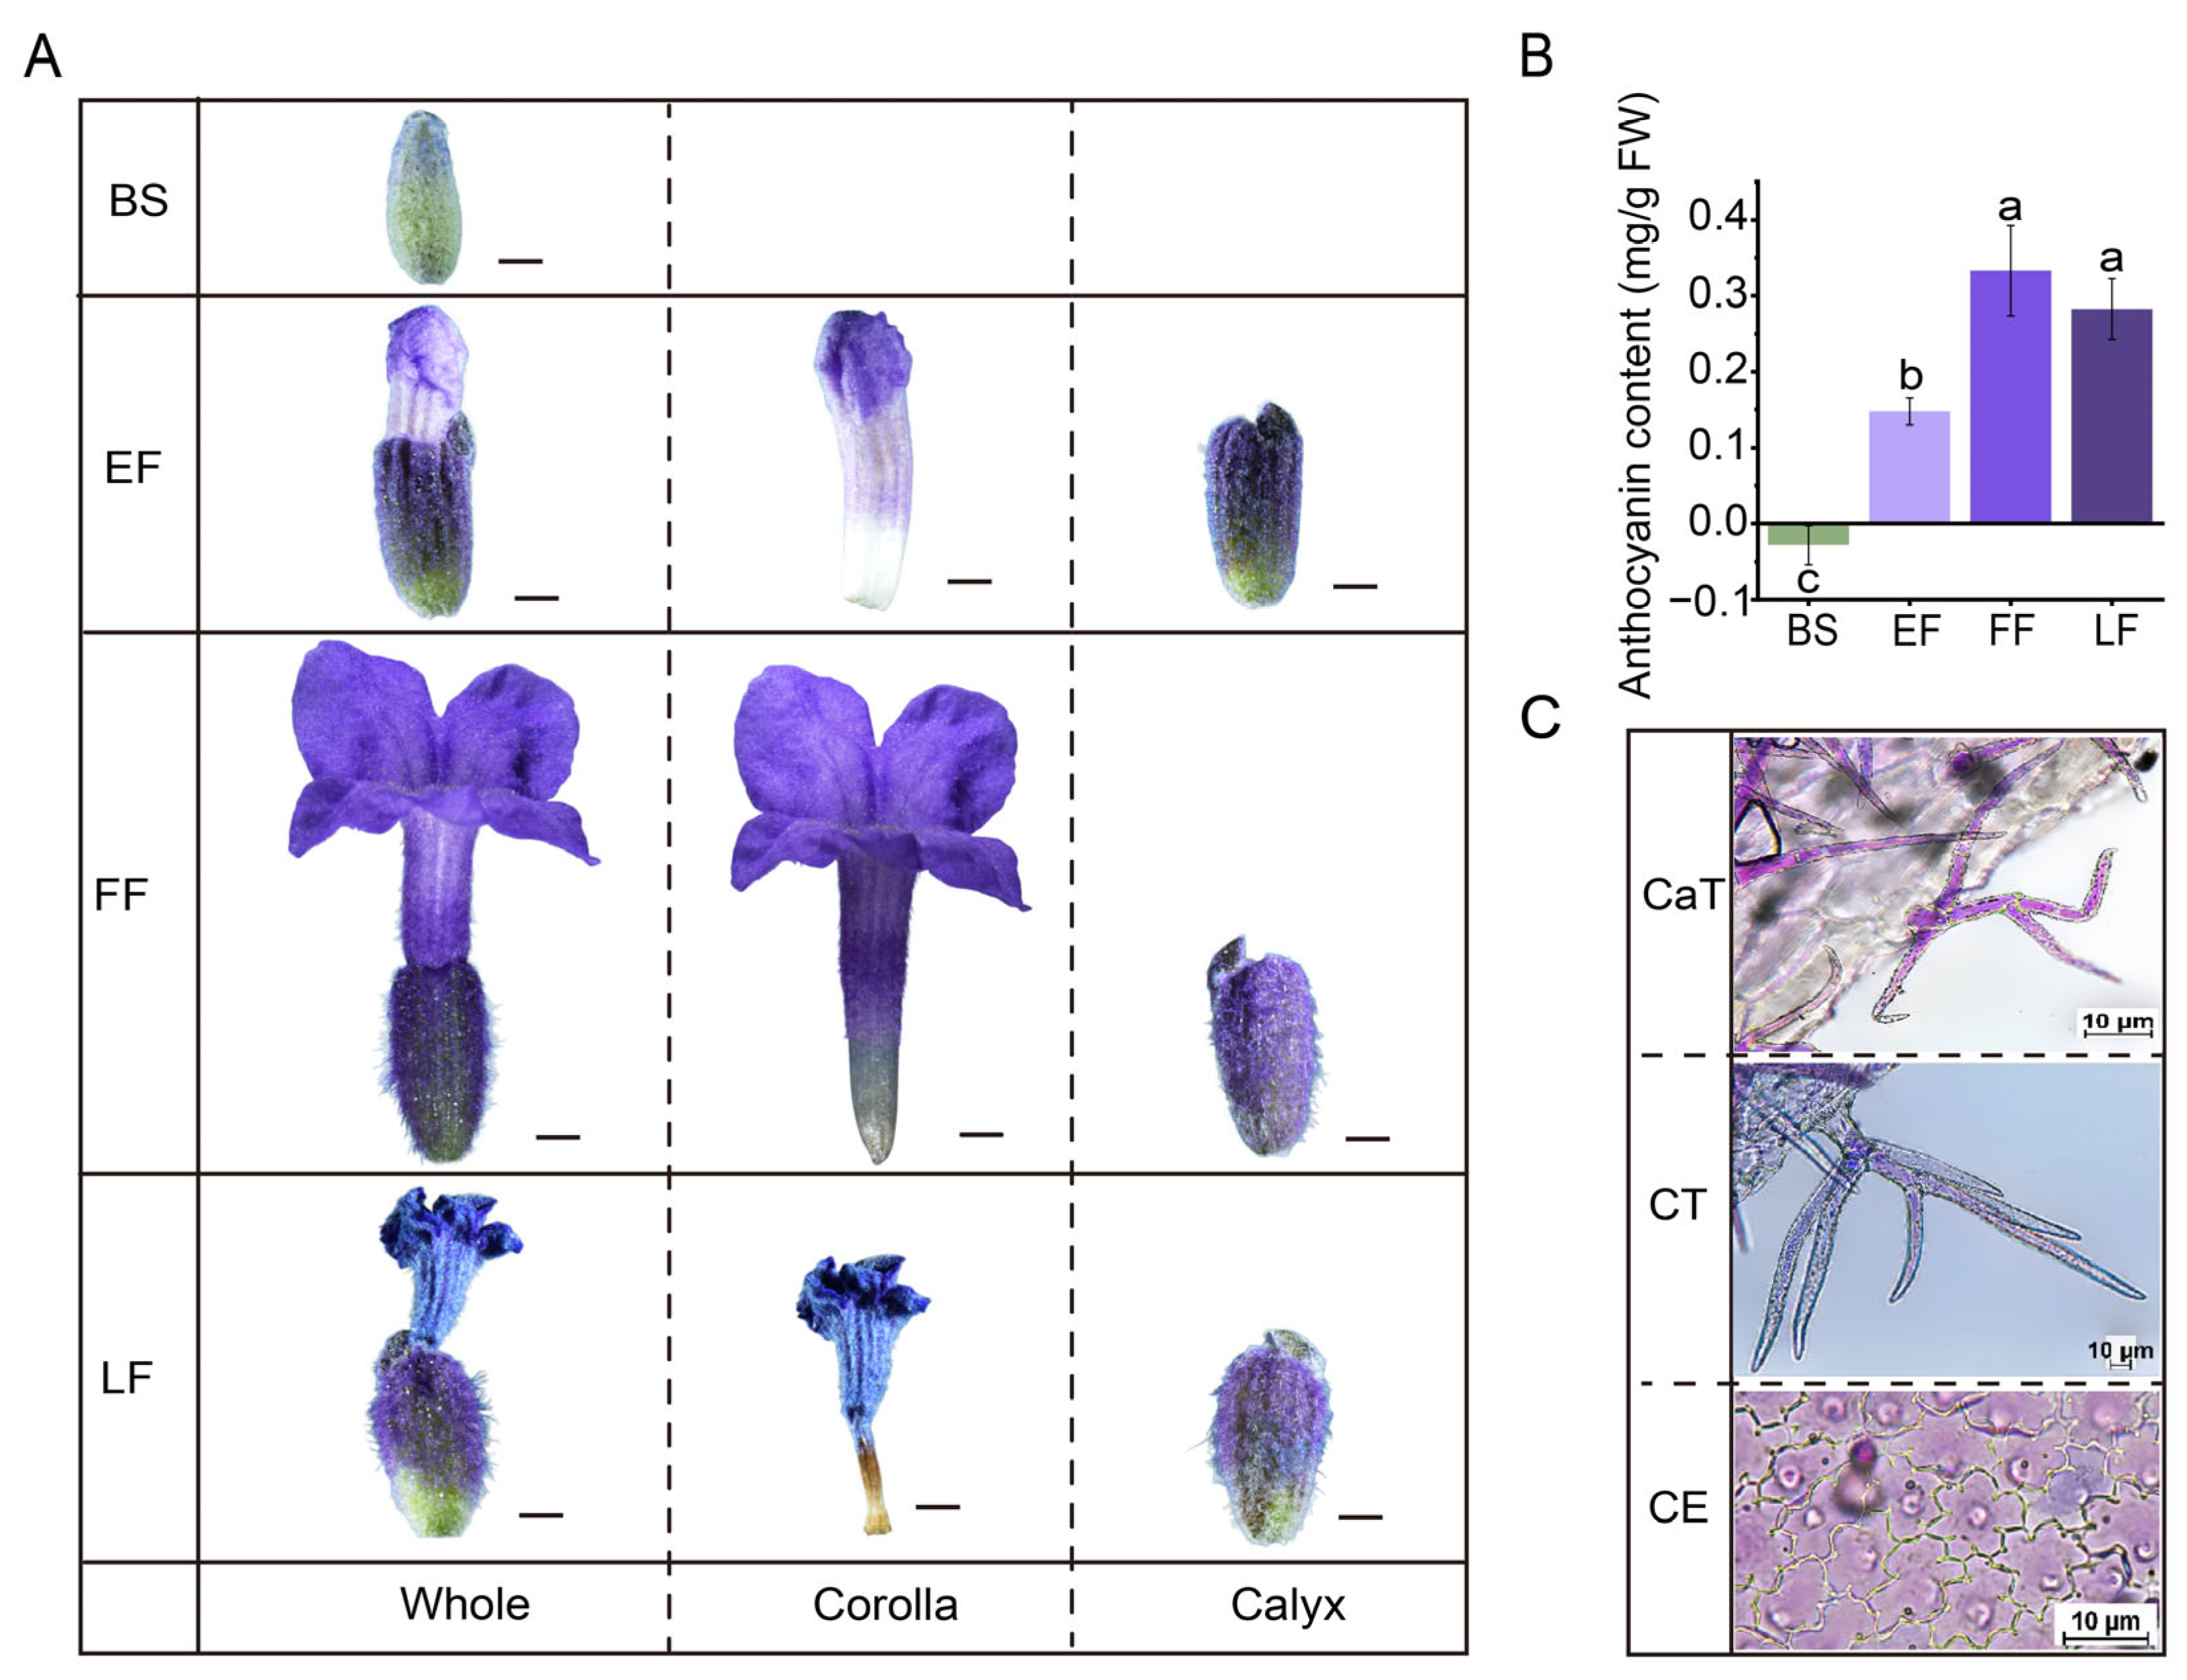
The macroscopic phenotypes of the corolla and the corresponding variations in anthocyanin content were analyzed across different developmental stages (Figure 1A). At the BS, the buds remained closed and green, with no visible pigmentation. At the EF, the apical region of the corolla exhibited pale purple coloration, while the base remained whitish. By the FF, the corolla was fully expanded and displayed a deep purple hue. At the LF, the corolla showed signs of wilting, with the color exhibiting a slight transition toward a darker purple–blue. Quantitative analysis (Figure 1B and Table S1) indicated that anthocyanin content was extremely low at the BS stage (nearly 0 mg/g FW). The content increased markedly to approximately 0.15 mg/g FW at EF, and reached a peak of approximately 0.32 mg/g FW at FF. At LF, the anthocyanin content showed no significant difference compared to FF (p > 0.05) and remained high at approximately 0.28 mg/g FW. It is worth noting that the pH-differential method may underestimate the content of acylated anthocyanins, as indicated by the increased A530 at pH 1.0 in Table S1. Notably, since the anthocyanin content did not degrade extensively at LF, the observed color shift towards blue at this stage may potentially be attributed to the vacuolar microenvironment (e.g., pH) or the effects of co-pigmentation; however, the specific mechanisms underlying this color change require further experimental confirmation.
Figure 1.
Analysis of anthocyanin accumulation and distribution during flower development. (A) Morphological observations of flowers at different developmental stages (BS: Bud stage; EF: Early flowering; FF: Full flowering; LF: Late flowering), showing the color transition of the whole flower, corolla, and calyx. Scale bars = 1000 μm. (B) Quantitative analysis of anthocyanin content (on a fresh weight basis) across the four developmental stages. The results revealed that anthocyanin content increased significantly from BS to EF, reached its peak at FF, and then plateaued at LF. Data are presented as means ± standard deviation (SD), and different lowercase letters (a, b, c) indicate significant differences among stages (p < 0.05). (C) Microscopic observation of the flower surface, displaying distinct types of trichomes (CaT: trichomes containing purple–red pigments; CT: purple-pigmented trichomes) and epidermal cells accumulating anthocyanins (CE). Scale bars = 10 μm.
Microscopic observations (Figure 1C) further characterized the epidermal cells of different floral parts. The calyx (CaT) epidermis was densely covered with sharp trichomes. The corolla (CT) epidermal cells exhibited papillate protrusions, a cellular morphology that may potentially facilitate light reflection. In the pigment-containing epidermal cell layer (CE), cells were larger in size and possessed prominent central vacuoles. Microscopic observations revealed purple–red substances within these vacuoles, suggesting that anthocyanins are primarily sequestered within the vacuoles of epidermal cells.
Taken together, these integrated analyses show that corolla coloration in lavender is a developmentally programmed and cell-type-specific process. Quantitatively, pigmentation peaks at FF and the subsequent color shift towards blue at LF is independent of further anthocyanin synthesis, but rather tuned by the vacuolar microenvironment. Spatially, pigments are confined to the vacuoles of the enlarged epidermal cells. These findings therefore define FF as the reference stage for molecular analysis and establish the biochemical, cellular and optical framework for dissecting the transcriptional regulation of the anthocyanin pathway.
3.2. Anthocyanin Accumulation During Flower Development
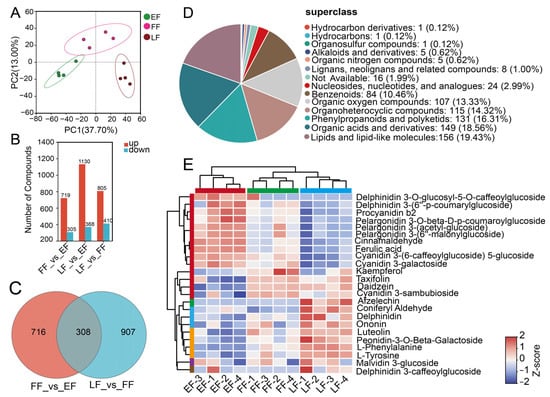
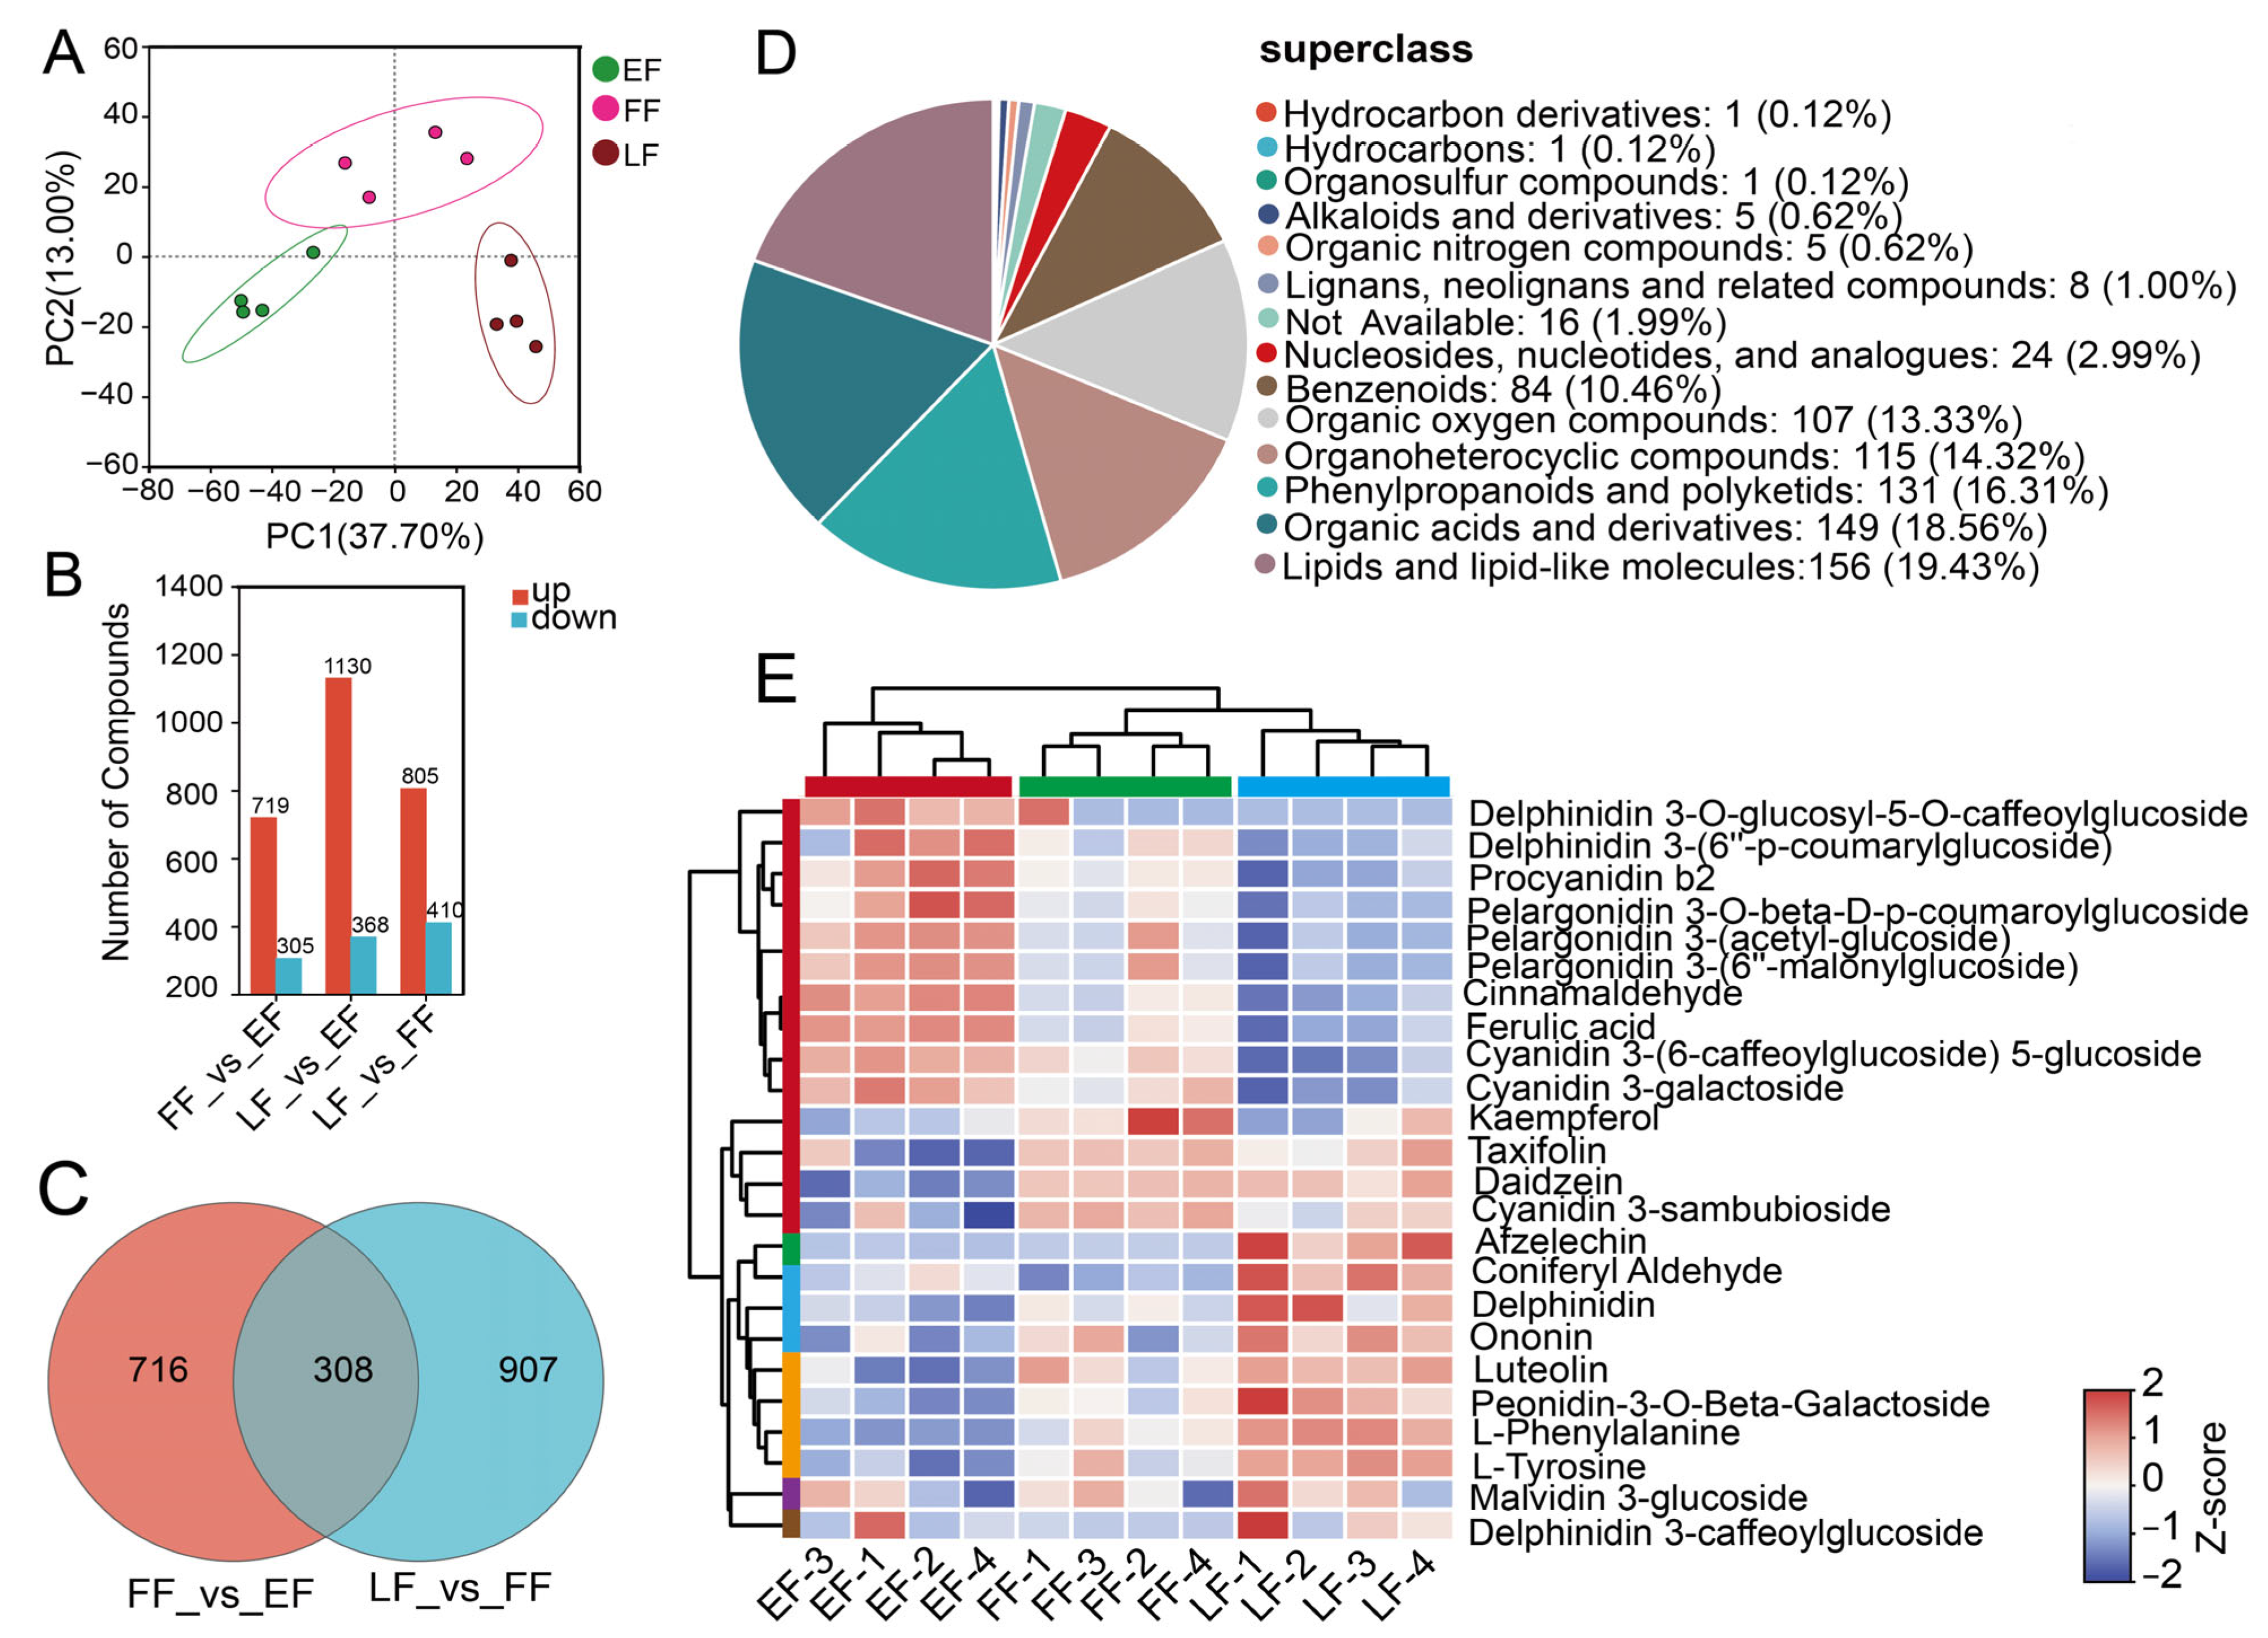
To investigate the dynamic metabolic profiles and the mechanisms underlying anthocyanin accumulation in lavender (Lavandula spp.) across different flower developmental stages (EF, FF and LF), untargeted metabolomics analysis was performed. Principal component analysis (PCA) showed distinct inter-group separation and tight intra-group clustering among the three developmental stages (PC1 = 37.70%, PC2 = 13.00%), indicating pronounced metabolic reprogramming during flower development (Figure 2A). Based on an integrated assessment of the PLS-DA and correlation heatmap, the experimental data demonstrated high system stability and biological reproducibility (Figure S1A,B). Comparative analyses identified 1024, 1498, and 1215 differentially accumulated metabolites (DAMs) in the FF vs. EF, LF vs. EF, and LF vs. FF comparisons, respectively (Figure 2B). Notably, the number of up-regulated DAMs significantly outnumbered the down-regulated ones during the transition from the EF to the FF stage. Furthermore (Figure S1C,D), Venn diagram analysis revealed 716 and 907 exclusive DAMs in the FF vs. EF and LF vs. FF comparisons, respectively, with only 308 DAMs shared between them (Figure 2C), suggesting that metabolic reprogramming was particularly intensive during the transition from EF to FF.
Figure 2.
Differential metabolomic analysis across different flower developmental stages (EF, FF, and LF). (A) Principal component analysis (PCA) score plot of metabolites from the early flowering (EF), full flowering (FF), and late flowering (LF) stages. (B) Bar chart showing the numbers of significantly up-regulated (red) and down-regulated (blue) differentially accumulated metabolites (DAMs) in the FF vs. EF, LF vs. EF, and LF vs. FF comparisons. (C) Venn diagram showing the unique and shared DAMs between the FF vs. EF and LF vs. FF comparison groups. (D) Pie chart illustrating the chemical superclass classification of the 803 successfully annotated DAMs out of the 1024 total DAMs in the FF vs. EF comparison. (E) Hierarchical clustering heatmap displaying the accumulation patterns of the 24 core compounds across the EF, FF, and LF stages (four biological replicates each). The color scale represents the Z-score normalized relative abundance, with red indicating high accumulation and blue indicating low accumulation.
Based on chemical superclass annotation, 803 out of the 1024 DAMs in the FF vs. EF comparison were successfully classified, predominantly into lipids and lipid-like molecules (19.43%), organic acids and derivatives (18.56%), and phenylpropanoids and polyketides (16.31%) (Figure 2D). The remaining 221 DAMs lacked chemical superclass annotations. Comprehensive KEGG enrichment analysis indicated that the differential metabolites among the EF, FF, and LF groups were mainly enriched in aromatic amino acid metabolism (phenylalanine, tyrosine, and tryptophan) and the biosynthesis of plant secondary metabolites (notably phenylpropanoids and flavonoids), among others (Figure S1E,F). Hierarchical clustering analysis (HCA) further visualized the temporal accumulation patterns of these metabolites, where the EF group clustered independently and was distinctly separated from the FF and LF groups (Figure 2E). Notably, flavonoids and anthocyanins closely associated with the purple–blue flower coloration (e.g., derivatives of delphinidin, cyanidin, and pelargonidin) exhibited remarkably high accumulation levels during the FF and LF stages, in stark contrast to their low abundance in the EF stage. Collectively, these results suggest that the specific accumulation and fine-tuning of phenylpropanoid/flavonoid pathway metabolites during the FF stage provide a solid biochemical foundation for the deep transition of lavender flower color.
3.3. Transcriptome Profiling and Differential Gene Expression Analysis During Flower Development
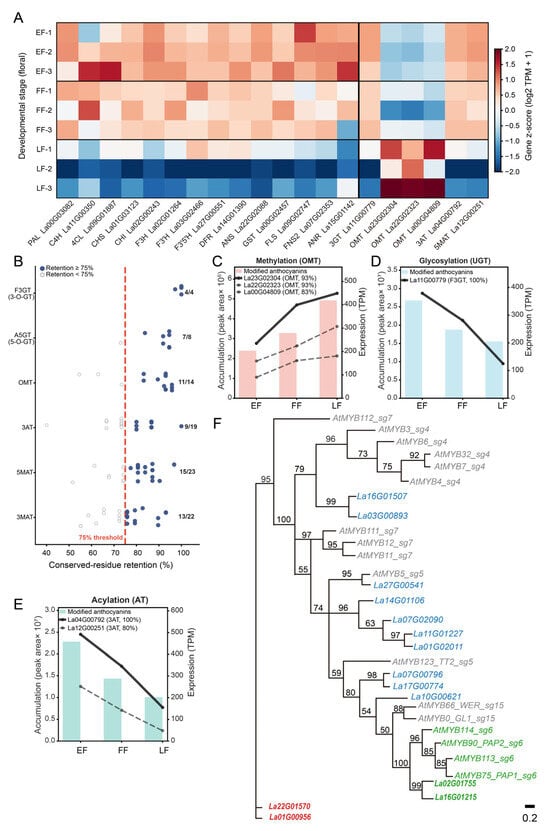
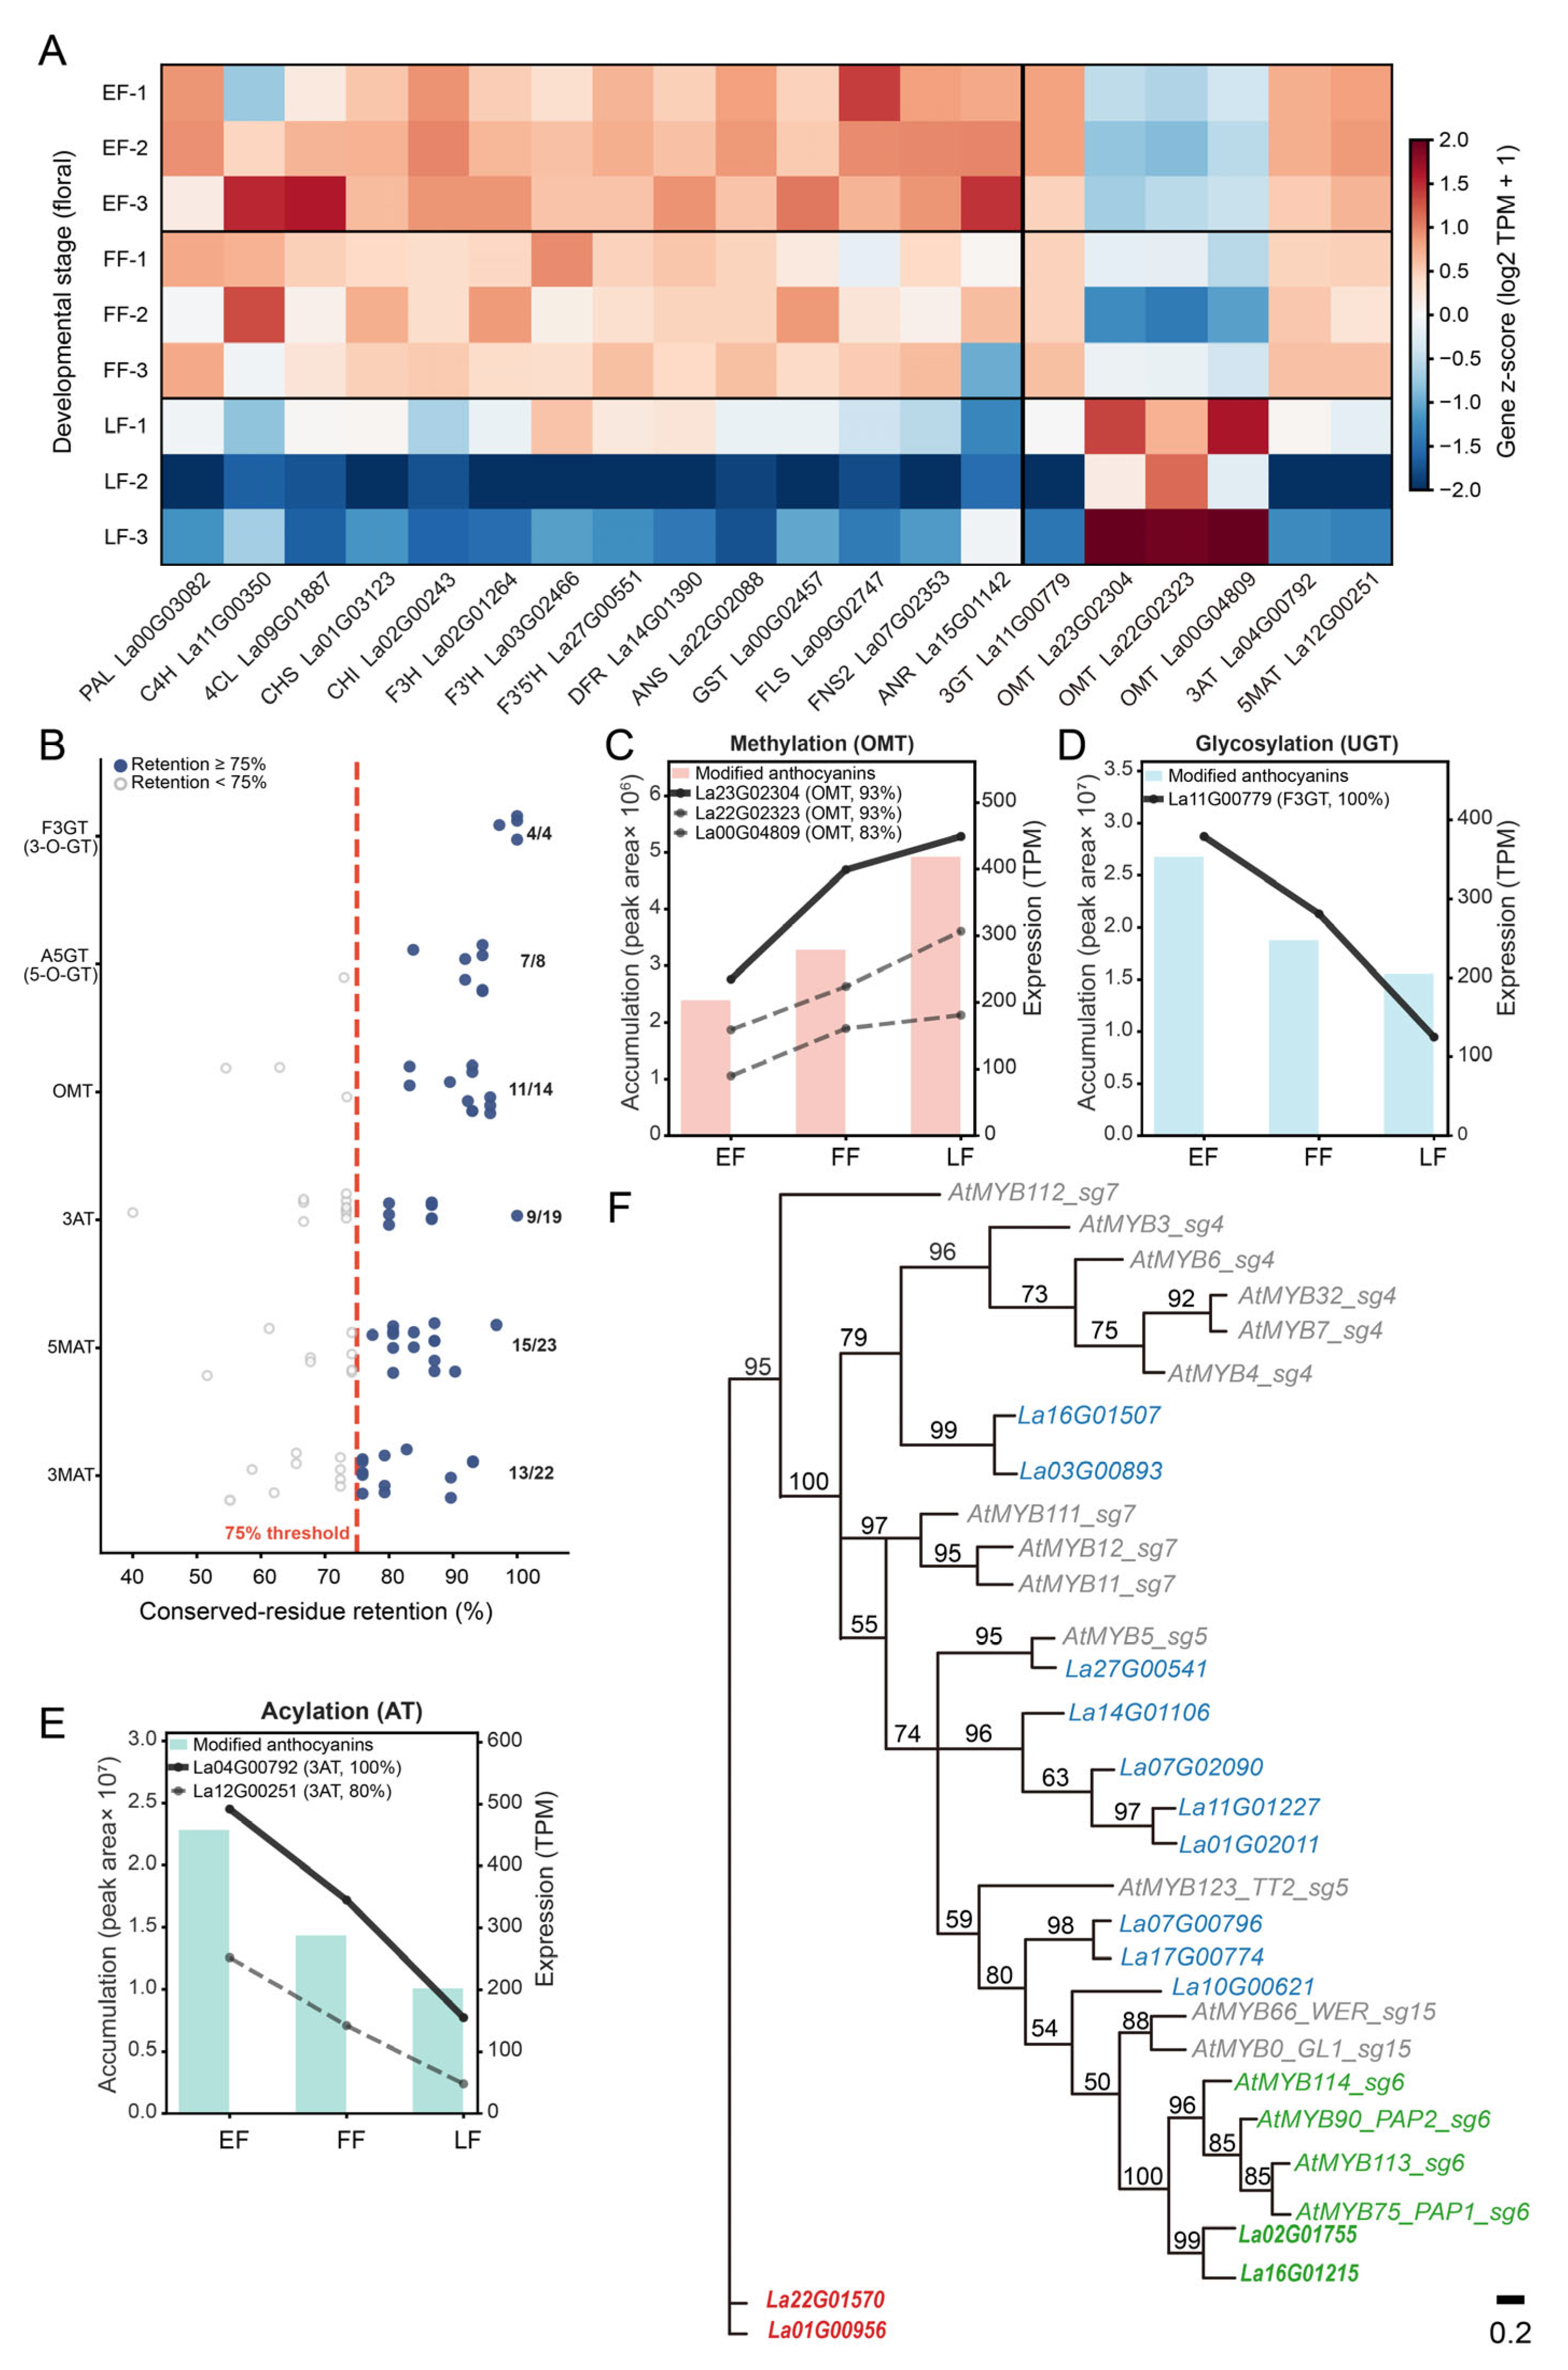
Following the KIPEs3 multi-evidence framework—sequence similarity, retention of ≥ 75% of essential functional residues, and maximum-likelihood tree-based orthology assignment within each gene family—we identified, from the 65,905 predicted proteins of the ‘Jingxun 2’ genome, ten structural genes (PAL, C4H, 4CL, CHS, CHI, F3H, F3′H, F3′5′H, DFR, ANS), three branch enzymes (FLS, FNS II, and ANR, the last acting in the competing flavan-3-ol branch rather than in anthocyanin biosynthesis), and one arGST encoding a protein implicated in both catalytic activity and vacuolar sequestration. Residue retention ranged from 87.0% to 100% (Figure S3), and all candidates clustered with characterized eudicot enzymes (Figures S4–S15). Consistent with other plant species, phylogenetic analysis confirmed that these sequences are highly conserved orthologs of characterized enzymes, with no evidence of convergent evolution. Most structural genes peaked at the early flowering (EF) stage and declined thereafter, consistent with a temporal partition between early biosynthesis and later decoration. The high expression of FLS and FNS II, considered alongside the metabolite dynamics—kaempferol peaking at FF and declining by LF, whereas luteolin, anthocyanin aglycones, and methylated anthocyanins increased across the three stages—indicates a reallocation of flux between the flavonol/flavone and anthocyanin branches. Notably, FNS II-associated flavone branch activity was co-upregulated with, rather than simply competitive against, the anthocyanin branch, and the metabolic flux shifted from flavonol-oriented toward methylated anthocyanin-oriented accumulation at late flowering (Figure 3A).
Figure 3.
Multi-evidence identification and integrated expression–metabolite analysis of anthocyanin biosynthetic genes and candidate MYB regulators in lavender. (A) Heatmap of expression of identified structural genes across flowering stages (EF, FF, and LF). (B) KIPEs3-based evaluation of functional residue retention for anthocyanin modification genes; filled circles indicate candidates retaining ≥75% of key functional residues (red dashed line, threshold), open circles indicate candidates below the threshold (retained to capture potential pseudogenes), and numbers beside clusters indicate the fraction of genes passing the threshold out of the total number for each enzyme family. (C–E) Integrated analysis of metabolite accumulation (bars, left axis) and gene expression (lines, right axis) for three modification steps: (C) OMT-mediated methylation, (D) 3AT-mediated acylation, and (E) glycosylation. (F) Maximum-likelihood phylogenetic tree of R2R3-MYB proteins from Arabidopsis and lavender. Bootstrap support values (>50%) are shown at the nodes, and the scale bar (0.2) represents the number of amino acid substitutions per site. Through homologous sequence alignment, red text indicates other lavender MYB members that do not cluster within the target subgroup 6. Green highlights the candidate activators MYB90 and MYB114, which cluster tightly with the Arabidopsis subgroup 6 activators (PAP1/PAP2).
Because FlavonoidBioSynBaits v3.4 does not supply conserved-residue definitions for downstream decoration families, we defined family-specific residues in a function-motif-driven manner and scored all candidates uniformly with KIPEs3 (v0.38). For A5GT, 37 UDP-sugar donor-binding positions within the 44-amino-acid PSPG box were used. For BAHD acyltransferases (3AT/5MAT/3MAT), the HXXXD catalytic motif, the DFGxG motif, and four-residue flanking windows were combined (15/31/29 positions). For class II OMTs, 143 positions that were 100% conserved across 12 characterized homologs were applied. Candidates passing the ≥75% retention threshold were initially filtered by expression level (TPM ≥ 10). To identify the most reliable representatives for visualization (Figure 3C–E), we further selected genes exhibiting highly concordant trends between transcript abundance and metabolite accumulation across developmental stages. Three other OMT genes (La23G02304, La22G02323, and La00G04809) also increased with development but were phylogenetically assigned to the phenylpropanoid/lignin branch and are therefore not involved in anthocyanin methylation; F3GT (La11G00779), 3AT (La04G00792), and 5MAT (La12G00251) declined in parallel with glycosylated/acylated products (three-stage rank correlation *r* ≥ +0.5). The expression–product pairs of all six candidates changed in the same direction across the three developmental stages, supporting their consideration as candidate enzymes for the respective decoration steps.
To identify upstream regulators of the anthocyanin pathway, R2R3-MYB genes were retrieved from the full proteome using MYB_annotator (Table S5), and a maximum-likelihood tree was constructed with Arabidopsis subgroup 4/5/6/7/15 reference sequences (Figure 3F). Within the Subgroup 6 clade, two candidates, La02G01755 (MYB114) and La16G01215 (MYB90), were highly expressed in the corolla and strongly correlated with multiple anthocyanins (r = 0.81–0.92, FDR < 0.05; see correlation network analysis).
To validate the transcriptomic data, RT-qPCR was performed with gene-specific primers on four genes that were deliberately selected to represent both the transcriptomic results and the biological pathway investigated, as they collectively span the successive functional levels of the anthocyanin biosynthetic pathway and its upstream precursor supply, as well as its regulation (Figure S2). The results demonstrated that the directional trends (up- or down-regulation) of these genes were highly consistent with the RNA-seq data.
3.4. Co-Expression Networks and Key Regulators of Anthocyanin Biosynthesis
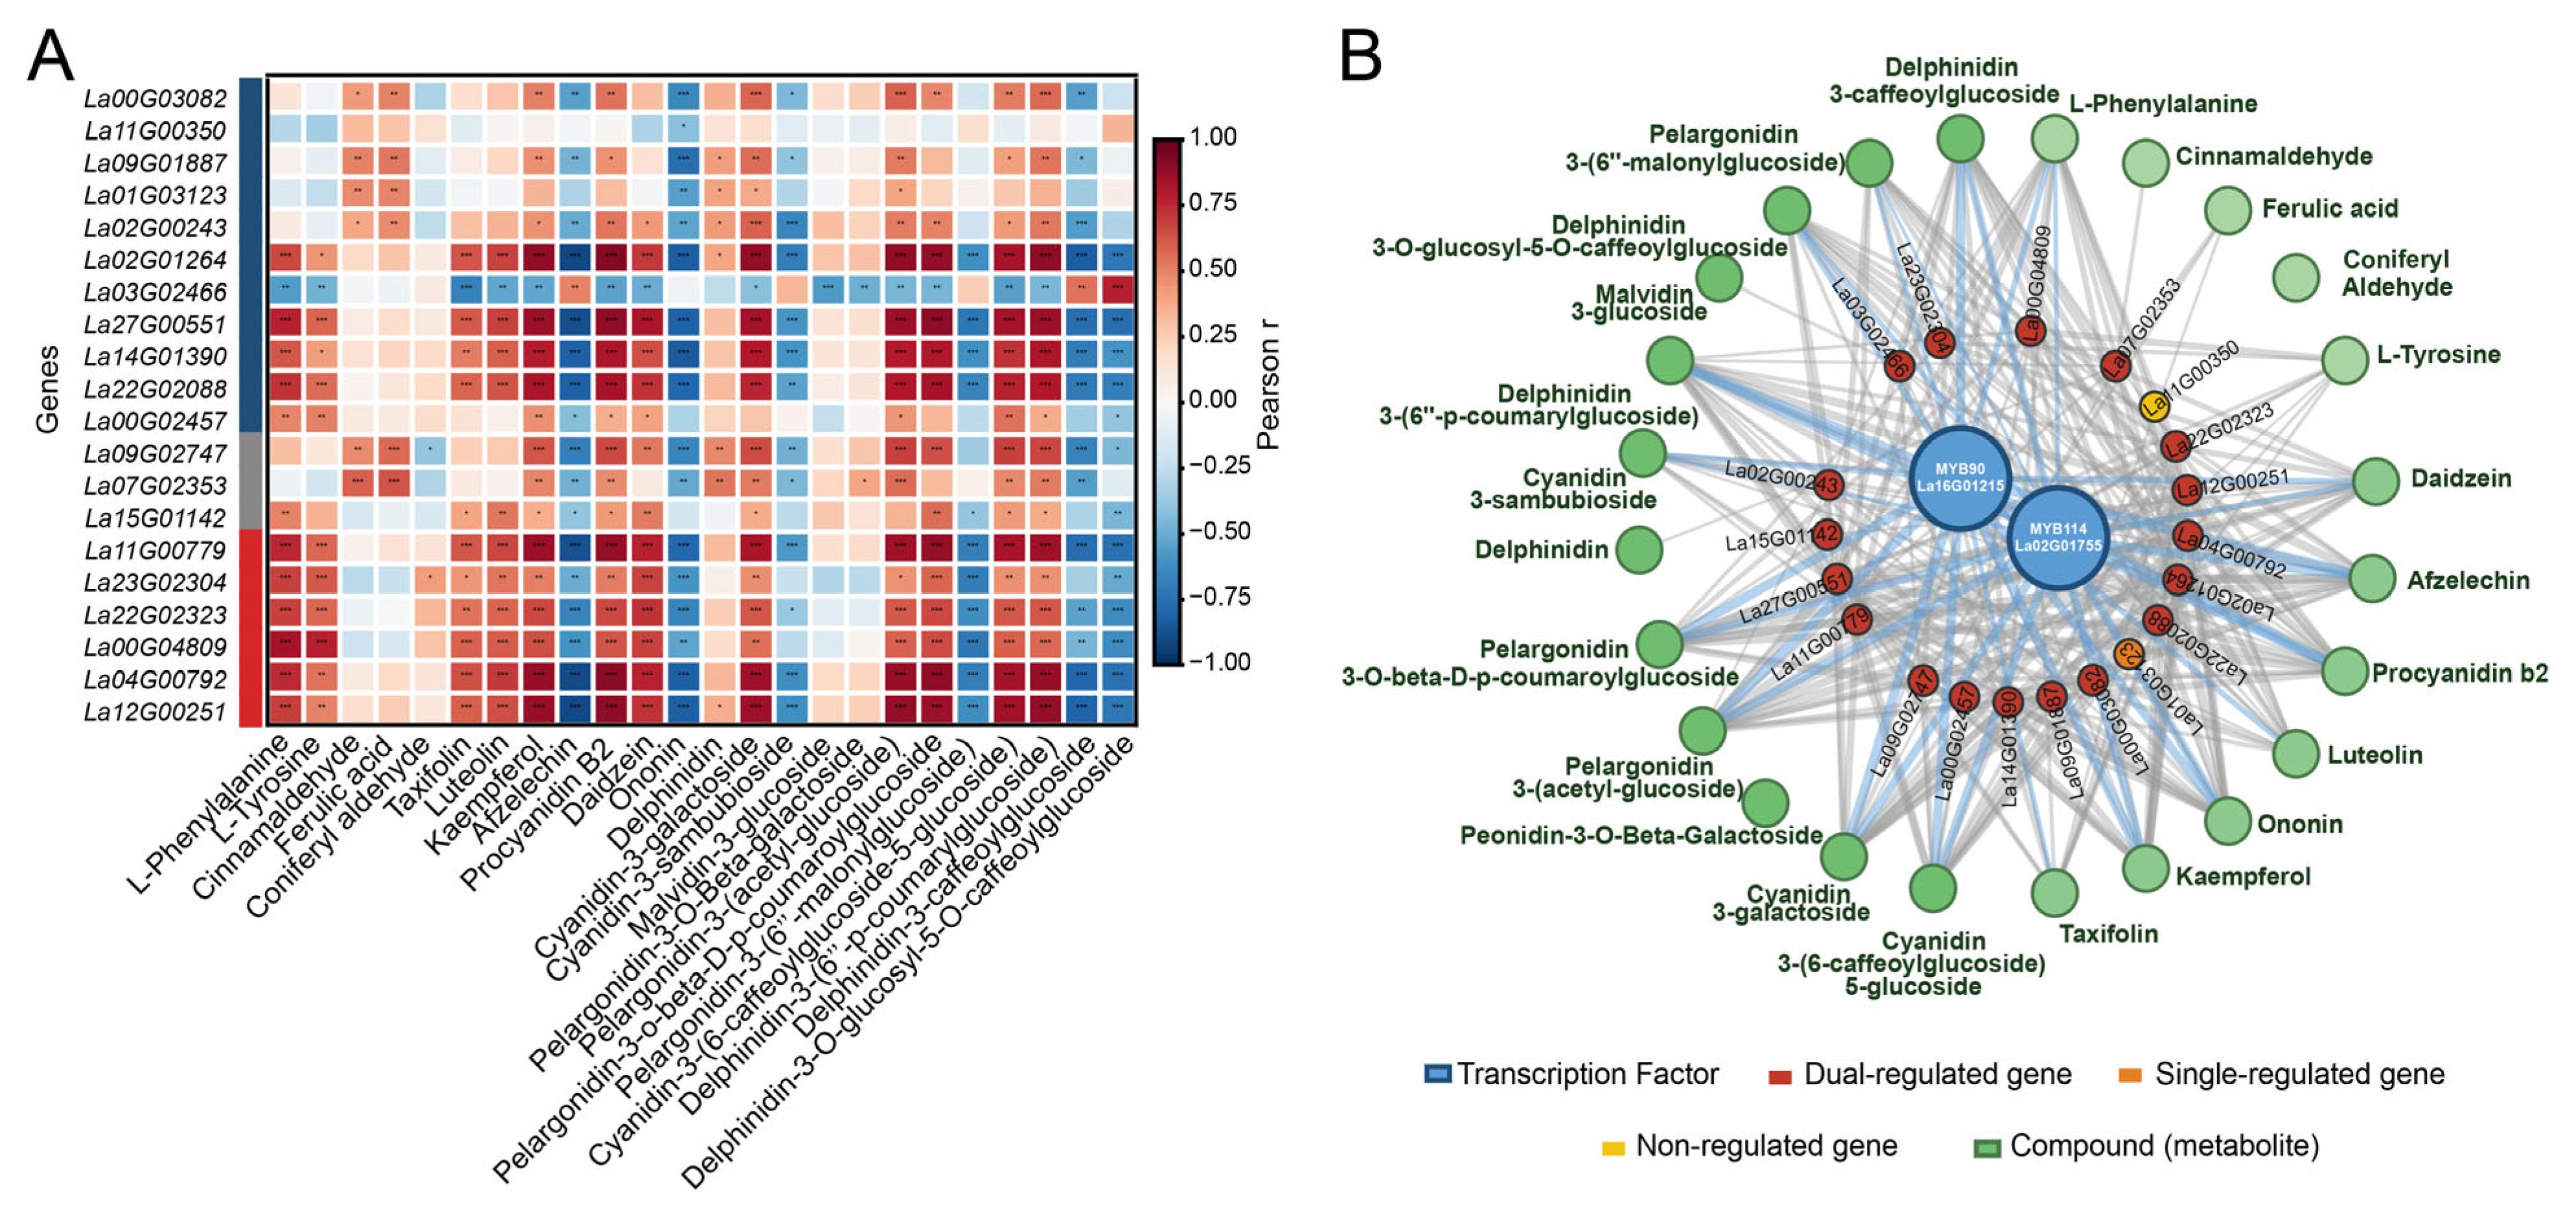
To dissect the coordination between structural gene expression and metabolite accumulation in lavender anthocyanin biosynthesis and to screen candidate transcriptional regulators, we integrated quantitative data for 20 anthocyanin biosynthesis-related enzyme genes and 24 core metabolites and performed Pearson correlation analysis (Figure 4A). The correlation matrix showed a clear hierarchical structure. Upstream skeleton genes (PAL, C4H, 4CL, CHS, CHI, F3H, F3′H, F3′5′H, DFR, ANS, GST) were generally moderately to relatively strongly positively correlated with phenylpropanoid precursors (L-phenylalanine, cinnamic acid, ferulic acid, etc.) and flavonoid/flavonol compounds (kaempferol, luteolin, apigenin) (*r* = 0.5–0.8, FDR < 0.05), consistent with the expected role of upstream genes in substrate flux supply. In contrast, late decoration genes (F3GT, OMT, 3AT, 5MAT) showed stronger product specificity: their expression was strongly positively correlated with various anthocyanins (delphinidin, cyanidin, and malvidin derivatives and their malonylated/coumaroylated derivatives) (*r* = 0.6–0.9) but weakly correlated with upstream precursors, suggesting that late decoration steps are highly coordinated with end-product accumulation across tissues. This is consistent with the classical pattern in Arabidopsis and other species in which early and late structural genes are differentially regulated.
Figure 4.
Pearson correlation analysis and regulatory network of anthocyanin-related genes, MYB transcription factors, and metabolites. This figure demonstrates highly coordinated transcriptional and metabolic regulation of lavender anthocyanin biosynthesis. (A) Pearson correlation analysis heatmap showing the correlation coefficients between 20 core anthocyanin-related genes and 24 key metabolites. Red and blue indicate positive and negative correlations, respectively. Asterisks indicate the level of statistical significance (* p < 0.05, ** p < 0.01, *** p < 0.001). (B) Gene–metabolite regulatory network. The network highlights two transcription factors, MYB90 and MYB114, as central hub nodes that link structural genes to specific metabolite accumulation.
We further constructed a gene–metabolite association network based on significant correlation pairs (|*r*| ≥ 0.5, FDR < 0.05), comprising 22 gene nodes and 24 metabolite nodes (Figure 4B). Two R2R3-MYB transcription factors, La16G01215 (MYB90-like) and La02G01755 (MYB114-like), occupied high-degree hub positions in the network: both were strongly positively correlated with multiple anthocyanin metabolites and significantly co-expressed with most late structural genes, consistent with the classical regulatory feature of activating MYBs that coordinately activate late structural genes through the MBW regulatory module, suggesting that they may be candidate positive regulators of the anthocyanin biosynthesis pathway. Regarding node degree distribution, 18 of the 20 structural genes were significantly correlated with metabolites from two or more classes, reflecting coordinated variation in their expression with multiple metabolic branches.
3.5. Potential Metabolic Pathways Related to Anthocyanin Biosynthesis
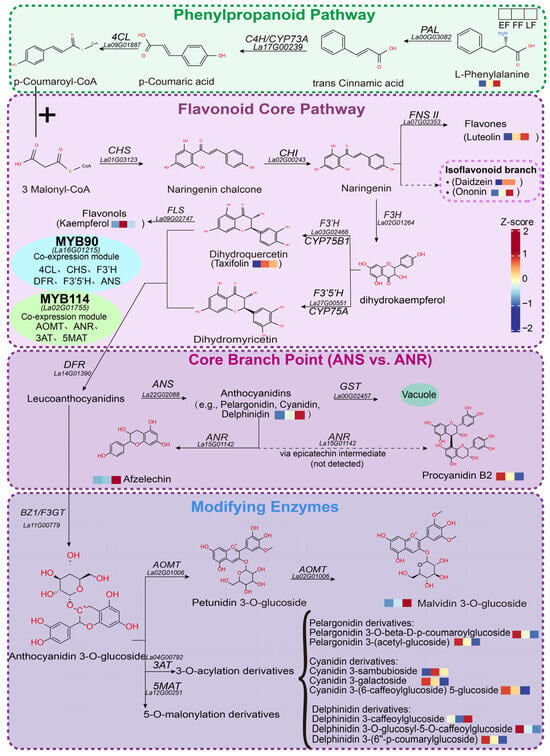
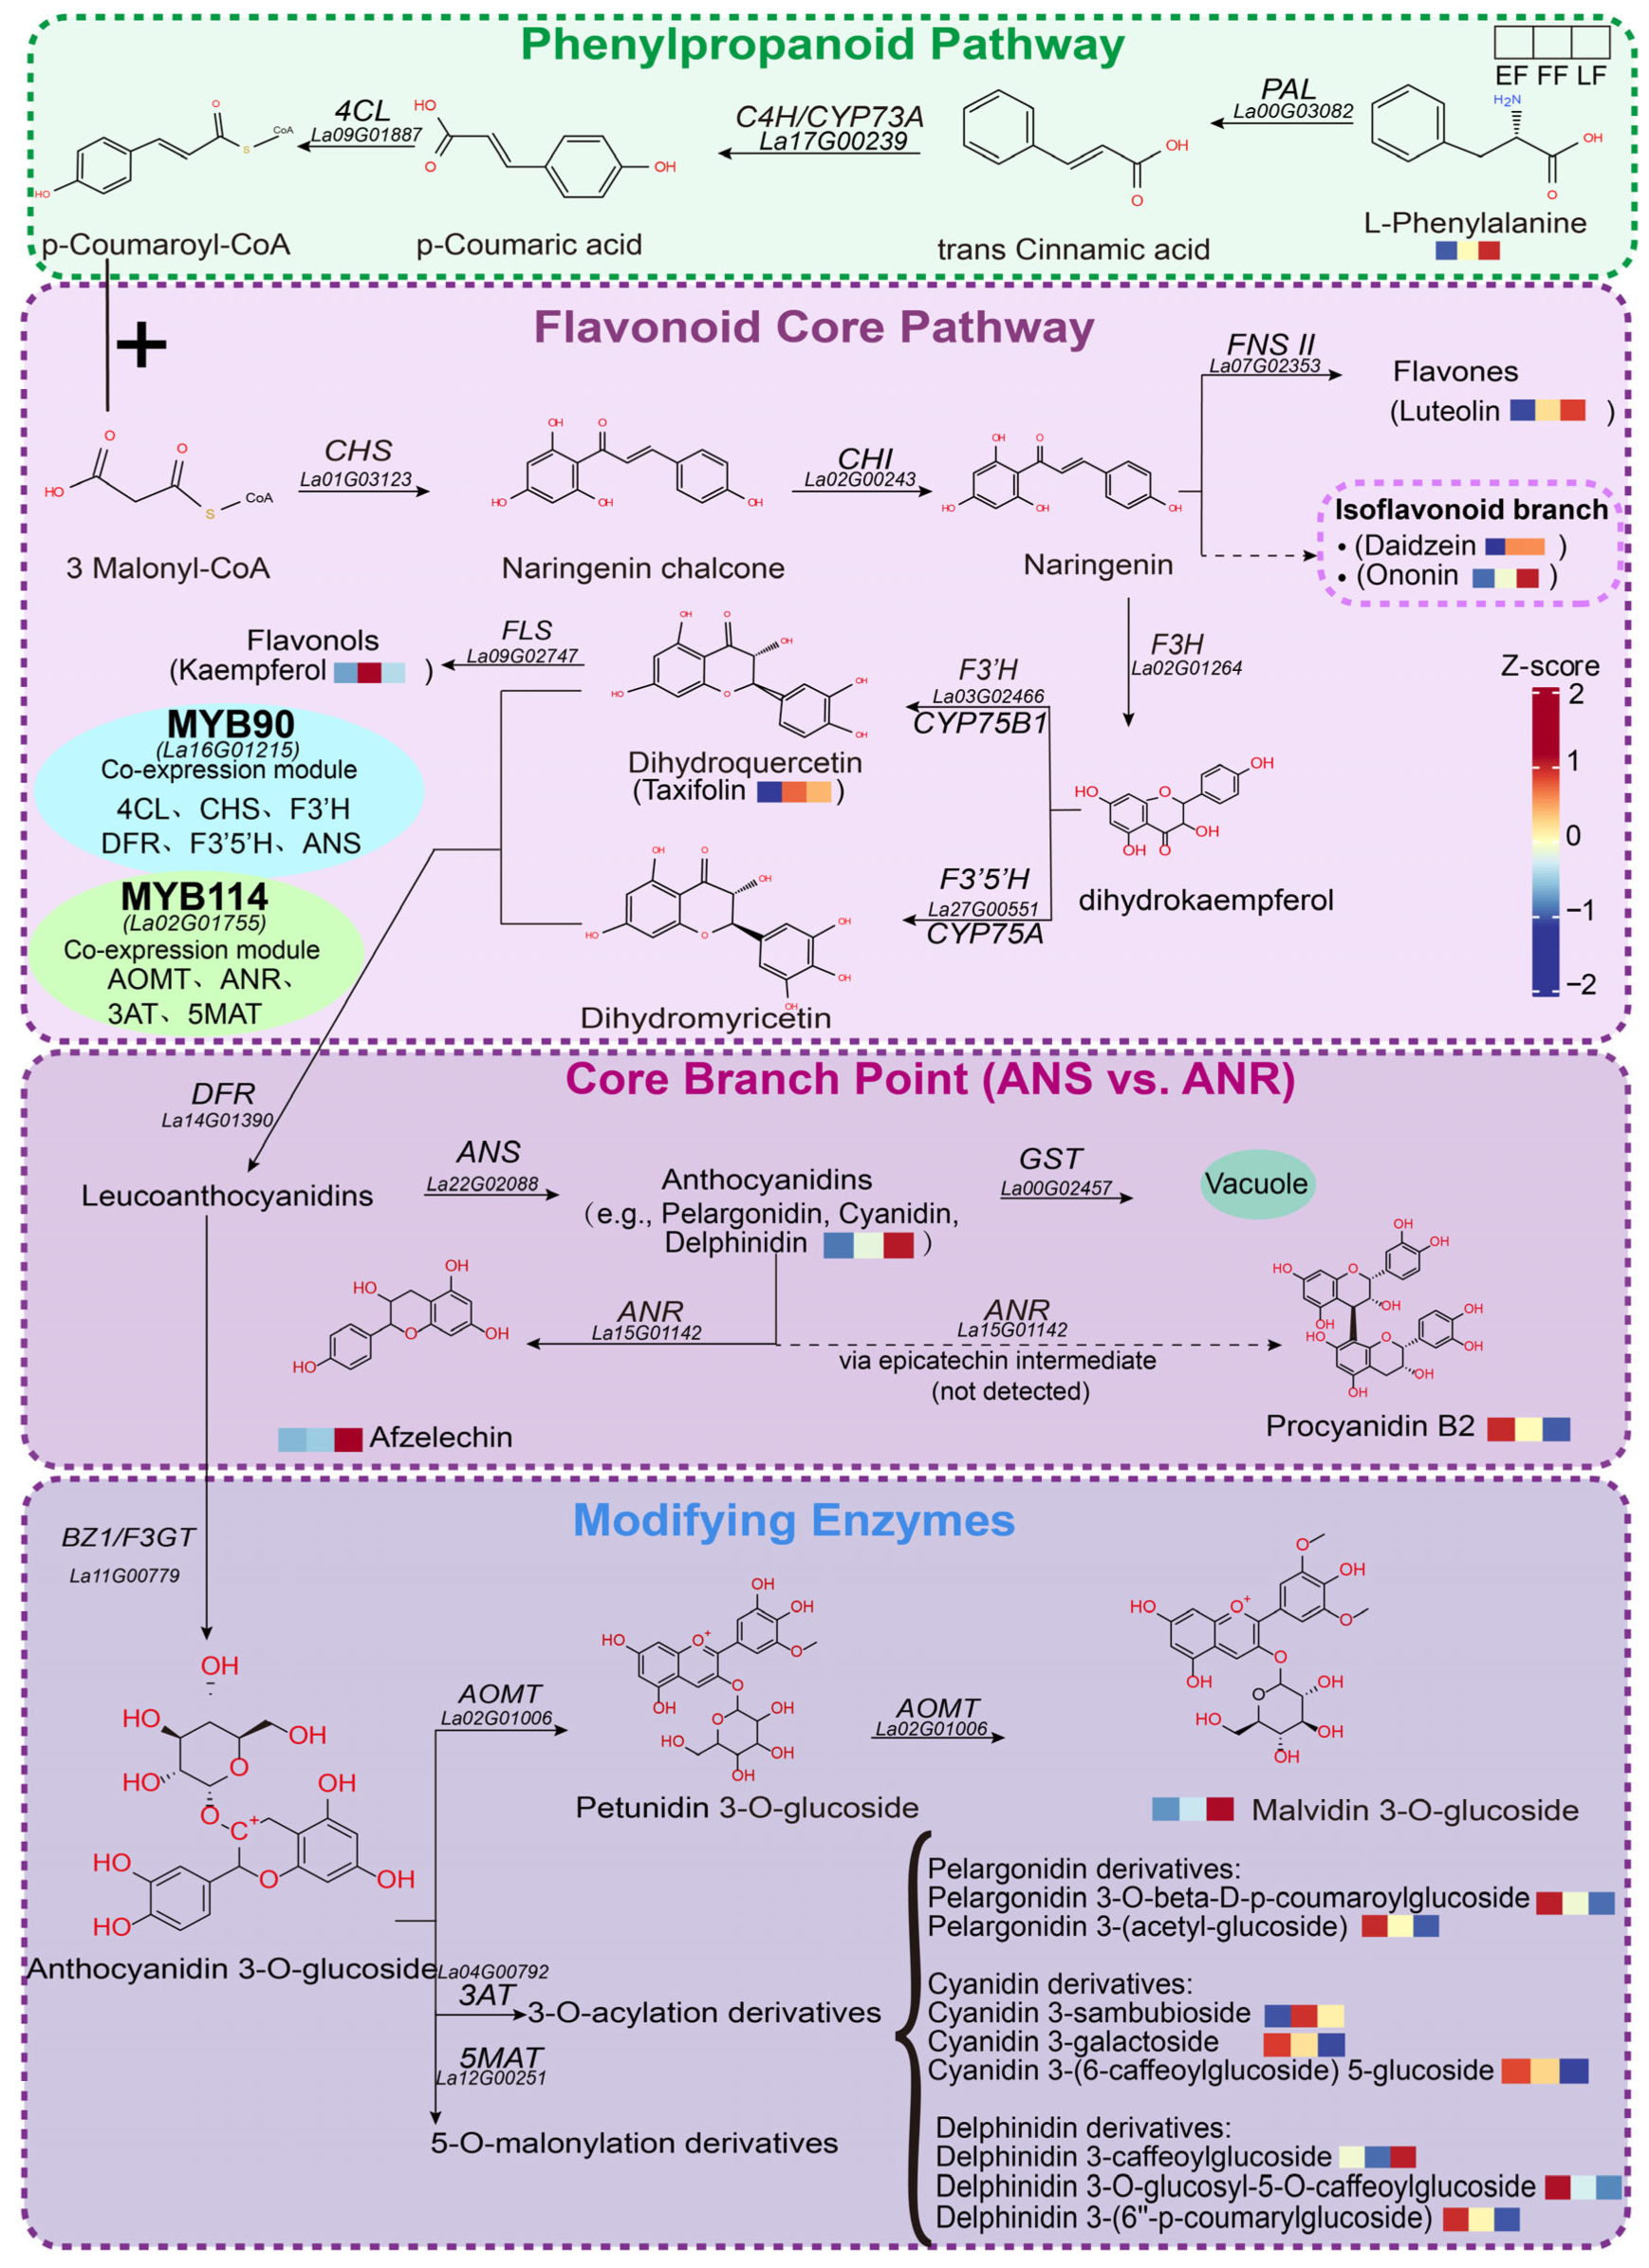
Using the predicted proteins from the chromosome-level genome of lavender “Jingxun 2,” we reconstructed the corolla anthocyanin biosynthetic pathway by integrating three lines of evidence: sequence similarity to characterized references, conservation of key functional residues, and orthology validation via maximum-likelihood phylogenies (Figure 5). Upstream phenylpropanoid and flavonoid core genes (PAL, C4H, 4CL, CHS, CHI, F3H, F3′H, F3′5′H, DFR, and ANS) were identified and showed clear orthology to characterized dicot enzymes; branch enzymes FNS II, FLS, and ANR were also identified. In total, 17 biosynthetic enzyme genes were assigned to catalytic steps, including four late-stage-modifying enzymes (F3GT, AOMT, 3AT, and 5MAT), and one anthocyanin-related GST (arGST) was identified as an enzyme/carrier involved in vacuolar sequestration. B-ring hydroxylation of anthocyanin aglycones is determined by F3′H and F3′5′H: F3′H yields mono-hydroxylated cyanidin-type aglycones, whereas F3′5′H yields tri-hydroxylated delphinidin-type aglycones. AOMT (La02G01006) was identified as the canonical anthocyanin methyltransferase, methylating delphinidin-type aglycones at the 3′ and 5′ positions to sequentially produce petunidin- and malvidin-type pigments; three other OMTs (La23G02304, La22G02323, and La00G04809) act in phenylpropanoid/lignin branches and are not involved in anthocyanin methylation.
Figure 5.
Integrated anthocyanin biosynthetic pathway and regulatory network in lavender. The dashed box on the right shows the isoflavonoid branch (Daidzein, Ononin), a competing pathway not contributing to flower color. At the core branch point, ANR (La15G01142) acts as a competing flavan-3-ol branch enzyme, not part of anthocyanin biosynthesis. The dashed arrow to Procyanidin B2 indicates an undetected epicatechin intermediate. The light blue and light green ellipses represent the co-expression genes of MYB90 and MYB114, respectively, based on transcriptome correlation, rather than validated direct targets. Small heatmaps show relative metabolite accumulation across EF, FF, and LF stages (Z-score), where red indicates relatively high accumulation and blue indicates relatively low accumulation. Abbreviations: GST, glutathione S-transferase; BZ1, bronze 1; F3GT, flavonoid 3-O-glucosyltransferase; AOMT, anthocyanin O-methyltransferase; 3AT, anthocyanin 3-O-acyltransferase; 5MAT, anthocyanin 5-O-malonyltransferase.
Integrated transcriptomic and metabolomic analyses revealed a stage-specific expression architecture. Upstream phenylpropanoid and core structural genes peaked at EF (e.g., CHS 662.3, F3′5′H 739.9, and ANS 472.9 TPM), establishing early substrate supply. At FF, while most structural genes declined, AOMT (La02G01006), a late anthocyanin-modifying gene, was specifically upregulated; ANR (La15G01142), a competing flavan-3-ol branch enzyme, was also induced. Consistently, delphinidin-type aglycones and their methylated derivatives accumulated across the three flowering stages; kaempferol peaked at FF and then declined; at LF, methylated anthocyanins (e.g., malvidin 3-glucoside) and afzelechin continued to accumulate. These results indicate progressive methylation of early synthesized anthocyanin aglycones and partial flux redirection to flavan-3-ols. MYB90 (La16G01215) and MYB114 (La02G01755) expression correlated significantly with multiple anthocyanins, suggesting them as candidate pathway activators.
4. Discussion
The violet hue of lavender is not set by pigment abundance alone but by a developmentally programmed, spatially partitioned, and hierarchically controlled process. Our integrated metabolomic and transcriptomic analyses reveal an initiation–peak–plateau pigmentation program, in which anthocyanin content rises sharply from the bud to the full-flowering (FF) stage and is thereafter maintained at near-peak levels at late flowering (LF). Two observations indicate that pigment quantity and perceived color are regulated at distinguishable levels. First, the pigments are confined to the vacuoles of a dedicated epidermal cell layer, whose enlarged, centrally vacuolated cells and papillate surface jointly provide the storage compartment and the optical interface for visible coloration. Second, although total anthocyanin content plateaued at LF, the corolla continued to shift toward purple–blue. While this visual difference is subtle and barely perceptible to the naked eye, this decoupling of quantity from hue suggests that the blue coloration in lavender may depend on the stabilization of the anthocyanin chromophore in its quinoidal base anion form, which can be achieved without increasing pigment abundance through three non-exclusive mechanisms: vacuolar alkalinization, co-pigmentation, and metal complexation [47,48,49]. The pH mechanism is classically demonstrated in Ipomoea tricolor, in which the tonoplast K+/H+ exchanger ItNHX1 raises vacuolar pH from 6.6 in the red–purple bud to 7.7 in the blue open flower, converting the same polyacylated anthocyanin (heavenly blue anthocyanin) from red to blue [50,51]. Notably, vacuolar pH is set not only by tonoplast pumps but also by mitochondrial energy supply: in petunia, the mitochondrial F-ATPase subunit PhDC regulates vacuolar acidification such that its silencing blue-shifts petal color without changing anthocyanin content or composition [52,53]. Co-pigmentation—stacking of colorless co-pigments (intermolecular) or pendant aromatic acyl groups (intramolecular) with the chromophore—produces hyperchromic and bathochromic shifts, whereas metal complexation (Fe3+ with cyanidin-type, Mg2+ with delphinidin-type pigments) underpins blue color in numerous species [49]. Consistent with this capacity, the lavender pathway co-expresses F3′5′H (a prerequisite for tri-hydroxylated, delphinidin-type B-rings), the acyltransferases 3AT and 5MAT, and FLS (a source of flavonol co-pigments), although direct measurement of vacuolar pH and co-pigment/metal content across BS–LF is required to confirm whether these mechanisms are indeed involved and which mechanism predominates [49,50,51,53].
The position of lavender on the purple-to-blue axis is set primarily by B-ring hydroxylation and downstream decoration. Unlike rose, carnation, and chrysanthemum—in which the absence of a functional F3′5′H precludes delphinidin-based blue coloration [54]—lavender operates both hydroxylation branches, and the strong induction of F3′5′H (La27G00551), together with the enrichment of delphinidin-type derivatives in the corolla metabolome, identifies the delphinidin branch as the principal contributor to the violet phenotype. Downstream of the aglycone, AOMT (La02G01006) methylates delphinidin-type aglycones at the 3′ and 5′ positions to sequentially generate petunidin- and malvidin-type pigments, a step shown to be a key determinant of purple coloration in tree peony [55]. The co-occurrence of glycosylated, methylated, and acylated derivatives therefore indicates that the lavender hue is the combined output of B-ring hydroxylation, methylation, and decoration rather than the product of a single dominant pigment. This multi-level control is reminiscent of the stepwise diversification of anthocyanin chemistry reported across Lamiaceae, in which aromatic acylation stabilizes the chromophore and shifts absorption bathochromically toward blue [7].
The developmental program is executed by a modular division of labour consistent with the conserved architecture of flavonoid metabolism [56]. Consistent with other plant species, the structural genes identified here are highly conserved orthologs with no evidence of convergent evolution, and they peaked at early flowering (EF) and declined thereafter, whereas AOMT (La02G01006), a late anthocyanin-modifying gene, was specifically upregulated at FF. ANR (La15G01142), a competing flavan-3-ol branch enzyme rather than an anthocyanin biosynthetic gene, was also induced at FF, temporally matching the progressive accumulation of methylated anthocyanins and the flavan-3-ol afzelechin. This partition suggests that aglycones synthesized during early flowering are progressively methylated during late development, with a fraction of the flux redirected toward the flavan-3-ol branch. Such a temporal separation of early biosynthesis from late decoration parallels the stage-resolved dynamics reported in Gloriosa superba and Sophora japonica, where the trajectory of individual cyanidin- and delphinidin-type glycosides, rather than their mere presence, dictates color intensity at full bloom [21,22]. Two subgroup-6 R2R3-MYB transcription factors, MYB90 (La16G01215) and MYB114 (La02G01755), showed strong correlation with multiple anthocyanins (r = 0.81–0.92) and occupied hub positions in the gene–metabolite network, positioning them as candidate activators within the conserved MBW regulatory module [57]. Although the direct transactivation remains to be tested, this study identifies MYB90 and MYB114 as the key candidate regulators in lavender, establishing them as central transcriptional hubs that orchestrate structural gene expression and anthocyanin accumulation.
This study identified an anthocyanin-related glutathione S-transferase, arGST (La00G02457), in lavender corollas, which is orthologous to Arabidopsis TT19 (55.1% sequence similarity and 100% conservation of functionally important residues). TT19 and petunia AN9 have been shown to function primarily as catalytic enzymes, while also acting as carrier/ligandin proteins that deliver anthocyanins to the tonoplast. The final transmembrane import is mediated by MATE/ABC transporters [58,59,60]. By this orthology, La00G02457 is predicted to participate in anthocyanin vacuolar sequestration via a similar mechanism. In addition, arGST exhibited an expression trend similar to that of the late anthocyanin biosynthetic genes, suggesting a possible transcriptional coupling of synthesis and sequestration—a pattern reminiscent of the RcMYB75–RcGSTFL11 feedforward module in rose [19]; a direct regulatory relationship between these factors, however, remains to be experimentally established.
From an applied perspective, these findings carry direct implications for lavender breeding. Because lavender already possesses a functional F3′5′H branch, shifting the corolla toward true blue is unlikely to require the introduction of an entire heterologous delphinidin pathway—the strategy needed in rose, carnation, and chrysanthemum—but may instead be achievable by targeted modification of the decoration and regulatory genes identified here, including AOMT, the acyltransferases, and the candidate MYB activators [54,61]. The full-flowering stage, at which both ornamental value and pigment content peak, represents the optimal window for pigment extraction. Several limitations should nonetheless be acknowledged. The regulatory relationships are correlational and require functional validation through dual-luciferase, yeast one-hybrid, or genome-editing approaches; the relative contributions of F3′H and F3′5′H to the cyanidin-to-delphinidin ratio remain to be quantified at the enzyme level; and the pH-differential method may underestimate acylated anthocyanins. Resolving the physicochemical basis of the late-flowering blue shift and functionally validating the candidate regulators represent the next steps toward a mechanistic and, ultimately, applied control of floral color in lavender.
5. Conclusions
By integrating untargeted metabolomics, RNA-seq, phylogenetic analysis, and phenotypic analysis across three flowering stages, this study establishes that the violet–purple coloration of lavender is a developmentally programmed and spatially partitioned process rather than a simple reflection of pigment abundance. Anthocyanin content follows an initiation–peak–plateau trajectory, peaking at full flowering; at late flowering, however, the corolla exhibits a subtle shift toward purple–blue despite stable pigment levels. It is important to note that the visual difference between these stages is barely perceptible, suggesting that this shift may reflect an internal physicochemical adjustment of the vacuolar microenvironment (pH and/or co-pigmentation) rather than a distinct visual signal. The delphinidin branch (F3′5′H) is the principal determinant of the violet phenotype, and the pathway is temporally partitioned, with structural genes peaking at early flowering, the late anthocyanin-modifying gene AOMT induced at full flowering, and the competing flavan-3-ol branch enzyme ANR also up-regulated at this stage; two subgroup-6 R2R3-MYB transcription factors (MYB90, MYB114) are candidate activators of this program. These results identify full flowering as the optimal window for pigment extraction; because lavender already harbors a functional F3′5′H branch, obtaining a true-blue corolla by targeted engineering of the decoration and regulatory genes reported here is more feasible than introducing an entire heterologous delphinidin pathway. The proposed regulatory relationships remain correlational and await functional validation. Collectively, this study provides a stage-resolved molecular framework for floral pigmentation in lavender and concrete targets for advancing flower-color regulation from mechanistic understanding toward application.
Supplementary Materials
The following supporting information can be downloaded at: https://www.mdpi.com/article/10.3390/horticulturae12111370/s1, Table S1: Anthocyanin content in lavender at different stages; Table S2: Detailed identification information of the 24 representative metabolites related to anthocyanin biosynthesis; Table S3: Sequence statistics of the lavender transcriptome; Table S4: Primer sequences; Table S5: Genome-wide identification of MYB and bHLH transcription factors in the Lavandula angustifolia genome; Figure S1: Metabolomic analysis of lavender at different developmental stages; Figure S2: RT-qPCR validation of the transcriptomic data for four core structural genes across floral developmental stages; Figure S3: Functional residue retention of candidate genes involved in the anthocyanin pathway and its competing branches. Figures S4–S15: Amino acid-based maximum-likelihood phylogenetic trees of structural and modifying genes from Lavandula angustifolia and other representative plant species.
Author Contributions
J.H. Conceptualization, Methodology, Supervision, Funding acquisition, Project administration, Writing—review & editing. N.W. and J.N. Investigation, Formal analysis, Validation, Visualization, Writing—original draft. R.L. and Y.Z. Data curation, Software, Formal analysis. J.X. and X.Z. Writing—review & editing. All authors have read and agreed to the published version of the manuscript.
Funding
This work was supported by the Science Foundation for the Introduction of Ph.D. Scholars at YiLi Normal University (grant no. 2023RCYG14), the Youth Doctoral Talent Program of the “Tianchi Yingcai” Project under the third batch of the ‘2 + 5’ Key Talent Program in Xinjiang (grant no. 2025QNBS003), and the Open Project Funding of the Xinjiang Key Laboratory of Lavender Conservation and Utilization (grant no. XJRCXYCTD2025-4, LCUY2408), and the Yili Normal University Science and Technology Project (grant no. 2024YSZD007).
Data Availability Statement
The sequencing data supporting the findings of this study have been deposited in the GenBank database under accession number PRJNA1545451.
Conflicts of Interest
The authors declare no conflicts of interest.
References
- Li, H.; Li, J.; Dong, Y.; Hao, H.; Ling, Z.; Bai, H.; Wang, H.; Cui, H.; Shi, L. Time-series transcriptome provides insights into the gene regulation network involved in the volatile terpenoid metabolism during the flower development of lavender. BMC Plant Biol. 2019, 19, 313. [Google Scholar] [CrossRef] [Scilit]
- Hamilton, J.P.; Vaillancourt, B.; Wood, J.C.; Wang, H.; Jiang, J.; Soltis, D.E.; Buell, C.R.; Soltis, P.S. Chromosome-scale genome assembly of the ‘Munstead’ cultivar of Lavandula angustifolia. BMC Genom. Data 2023, 24, 75. [Google Scholar] [CrossRef] [Scilit]
- Habán, M.; Korczyk-Szabó, J.; Čerteková, S.; Ražná, K. Lavandula species, their bioactive phytochemicals, and their biosynthetic regulation. Int. J. Mol. Sci. 2023, 24, 8831. [Google Scholar] [CrossRef] [Scilit]
- Mekapogu, M.; Song, H.-Y.; Lim, S.-H.; Jung, J.-A. Genetic engineering and genome editing advances to enhance floral attributes in ornamental plants: An update. Plants 2023, 12, 3983. [Google Scholar] [CrossRef] [Scilit]
- Zhou, L.J.; Sasaki, N.; Mizuno, T.; Gao, X.; Miyahara, T. Polyacylated anthocyanins: Nature’s strategy for blue flower coloration and their application in genetic engineering. Ornam. Plant Res. 2026, 6, e020. [Google Scholar] [CrossRef] [Scilit]
- Venter, A.; Fisher, H.; Stafford, G.I.; Duodu, K.G. Pigmented flower extracts of plant species from the Geraniaceae and Lamiaceae families as natural food colourants: Anthocyanin composition, thermal and oxidative stability. Int. J. Food Sci. Technol. 2022, 57, 4347–4355. [Google Scholar] [CrossRef] [Scilit]
- Mizuno, T.; Seto, H.; Nakane, T.; Murai, Y.; Tatsuizawa, F.; Iwashina, T. Anthocyanin and flavones from the flowers of Tripora divaricata (Lamiaceae) and their contribution to blue violet color. Bull. Natl. Mus. Nat. Sci. Ser. B 2023, 49, 57–64. [Google Scholar] [CrossRef]
- Bruni, S.; Longoni, M.; Minzoni, C.; Basili, M.; Zocca, I.; Pieraccini, S.; Sironi, M. Resonance Raman and visible micro-spectroscopy for the in-vivo and in-vitro characterization of anthocyanin-based pigments in blue and violet flowers: A comparison with HPLC-ESI-MS analysis of the extracts. Molecules 2023, 28, 1709. [Google Scholar] [CrossRef] [Scilit]
- Sendri, N.; Bhandari, P. Anthocyanins: A comprehensive review on biosynthesis, structural diversity, and industrial applications. Phytochem. Rev. 2024, 23, 1913–1974. [Google Scholar] [CrossRef] [Scilit]
- Marin-Recinos, M.F.; Pucker, B. Genetic factors explaining anthocyanin pigmentation differences. BMC Plant Biol. 2024, 24, 627. [Google Scholar] [CrossRef] [Scilit]
- Winkel-Shirley, B. Flavonoid biosynthesis. A colorful model for genetics, biochemistry, cell biology, and biotechnology. Plant Physiol. 2001, 126, 485–493. [Google Scholar] [CrossRef] [Scilit]
- Choudhary, N.; Khatun, N.; Pucker, B. Almost 200 years of anthocyanin research: What we know, what we assume and what remains unknown. Plant Biol. 2026, Early View. [Google Scholar] [CrossRef] [Scilit]
- Johnson, E.T.; Ryu, S.; Yi, H.; Shin, B.; Cheong, H.; Choi, G. Alteration of a single amino acid changes the substrate specificity of dihydroflavonol 4-reductase. Plant J. 2001, 25, 325–333. [Google Scholar] [CrossRef] [Scilit]
- Choudhary, N.; Pucker, B. Conserved amino acid residues and gene expression patterns associated with the substrate preferences of the competing enzymes FLS and DFR. PLoS ONE 2024, 19, e0305837. [Google Scholar] [CrossRef] [Scilit]
- Lu, C.; Qu, J.; Li, Y.; Cui, Y.; Ren, J.; Qi, F.; Zhang, F.; Huang, H.; Dai, S. Isolation and functional analysis of genes involved in polyacylated anthocyanin biosynthesis in blue Senecio cruentus. Front. Plant Sci. 2021, 12, 640746. [Google Scholar] [CrossRef] [Scilit]
- Eichenberger, M.; Schwander, T.; Hüppi, S.; Kreuzer, M.; Mittl, P.R.E.; Ernst, B. The catalytic role of glutathione transferases in heterologous anthocyanin biosynthesis. Nat. Catal. 2023, 6, 927–938. [Google Scholar] [CrossRef] [Scilit]
- Kaur, S.; Sharma, N.; Kapoor, P.; Chunduri, V.; Pandey, A.K.; Garg, M. Spotlight on the overlapping routes and partners for anthocyanin transport in plants. Physiol. Plant. 2021, 171, 868–881. [Google Scholar] [CrossRef] [Scilit]
- Li, X.X.; Wang, Y.K.; Ye, J.J.; Dong, S.L.; Wang, K.R.; Liang, Y.R.; Zhang, L.J.; Li, M.; Lu, J.L.; Ye, J.H.; et al. Mechanism of GST-mediated anthocyanin transport in purple leaf color formation revealed by multicolored tea plant (Camellia sinensis). Ind. Crops Prod. 2026, 242, 122912. [Google Scholar] [CrossRef] [Scilit]
- Ma, M.; Li, R.; Li, Y.; Dai, W.; Shang, J.; He, Y.; Xiang, F.; Yang, Y.; Wang, J.; Huang, Z.; et al. Anthocyanin biosynthesis and transport synergistically modulated by RcMYB75 and RcGSTFL11 play a pivotal role in the feedforward loop in response to drought stress in rose. Plant J. 2025, 121, e17240. [Google Scholar] [CrossRef] [Scilit]
- Cao, X.; Chen, M.; Zhang, J.; Gong, J.; Pan, W.; Du, L. Glutathione transferase MaGST1 mediates anthocyanin accumulation and influences flower color in grape hyacinth. Hortic. Plant J. 2025, 12, 447–459. [Google Scholar] [CrossRef] [Scilit]
- Sun, Y.; Hu, P.; Jiang, Y.; Li, J.; Chang, J.; Zhang, H.; Shao, H.; Zhou, Y. Integrated metabolome and transcriptome analysis of petal anthocyanin accumulation mechanism in Gloriosa superba ‘Rothschildiana’ during different developmental stages. Int. J. Mol. Sci. 2023, 24, 15034. [Google Scholar] [CrossRef] [Scilit]
- Guan, L.; Ji, X.; Sun, T.; Mu, Y.; Wang, Y.; Han, Y.; Sun, Y.; Li, X.; Xie, K.; Zhang, S.; et al. Differential metabolite analysis of anthocyanins in variously colored petal types during different developmental stages of Sophora japonica L. Horticulturae 2025, 11, 143. [Google Scholar] [CrossRef] [Scilit]
- Xuan, Y.; Ren, J.; Chen, Z.; Shi, D. Integrated transcriptome and metabolome analyses provide molecular insights into the transition of flower color in the rose cultivar ‘Juicy Terrazza’. BMC Plant Biol. 2025, 25, 883. [Google Scholar] [CrossRef] [Scilit]
- Gonzalez, A.; Zhao, M.; Leavitt, J.M.; Lloyd, A.M. Regulation of the anthocyanin biosynthetic pathway by the TTG1/bHLH/Myb transcriptional complex in Arabidopsis seedlings. Plant J. 2008, 53, 814–827. [Google Scholar] [CrossRef] [Scilit]
- Xu, W.; Dubos, C.; Lepiniec, L. Transcriptional control of flavonoid biosynthesis by MYB-bHLH-WDR complexes. Trends Plant Sci. 2015, 20, 176–185. [Google Scholar] [CrossRef] [Scilit]
- Jaakola, L. New insights into the regulation of anthocyanin biosynthesis in fruits. Trends Plant Sci. 2013, 18, 477–483. [Google Scholar] [CrossRef] [Scilit]
- Li, J.; Li, H.; Wang, Y.; Zhang, W.; Wang, D.; Dong, Y.; Ling, Z.; Bai, H.; Jin, X.; Hu, X.; et al. Decoupling subgenomes within hybrid lavandin provide new insights into speciation and monoterpenoid diversification of Lavandula. Plant Biotechnol. J. 2023, 21, 2084–2099. [Google Scholar] [CrossRef] [Scilit]
- Dong, Y.; Zhang, W.; Li, J.; Wang, D.; Bai, H.; Li, H.; Shi, L. The transcription factor LaMYC4 from lavender regulates volatile terpenoid biosynthesis. BMC Plant Biol. 2022, 22, 289. [Google Scholar] [CrossRef] [Scilit]
- Zhang, Y.; Wang, D.; Li, H.; Bai, H.; Sun, M.; Shi, L. Formation mechanism of glandular trichomes involved in the synthesis and storage of terpenoids in lavender. BMC Plant Biol. 2023, 23, 307. [Google Scholar] [CrossRef] [Scilit]
- Kelimujiang, K.; Zhang, W.; Zhang, X.; Waili, A.; Tang, X.; Chen, Y.; Chen, L. Genome-wide investigation of WRKY gene family in Lavandula angustifolia and potential role of LaWRKY57 and LaWRKY75 in the regulation of terpenoid biosynthesis. Front. Plant Sci. 2024, 15, 1449299. [Google Scholar] [CrossRef] [Scilit]
- Shi, P.; Liu, Y.; Wang, Y.; Li, L.; Liang, Y.; Lin, H.; Yuan, Z.; Ding, G. Physiological and molecular regulatory mechanism of flavonoid metabolite biosynthesis during low temperature adaptation in Lavandula angustifolia Mill. BMC Plant Biol. 2024, 24, 1263. [Google Scholar] [CrossRef] [Scilit]
- Park, C.H.; Yeo, H.J.; Park, Y.E.; Kim, Y.J.; Park, C.; Kim, J.K.; Park, S.U. Integrated analysis of transcriptome and metabolome and evaluation of antioxidant activities in Lavandula pubescens. Antioxidants 2021, 10, 1027. [Google Scholar] [CrossRef] [Scilit]
- Li, P.; Wang, A.; Huang, J.; Chen, Y.; Zhang, M.; Su, X. Cloning and functional analysis of LaCHS gene related to anthocyanin biosynthesis in Lavandula angustifolia. J. Zhejiang A&F Univ. 2025, 42, 1048–1058. [Google Scholar] [CrossRef]
- Lee, J.; Durst, R.W.; Wrolstad, R.E. Determination of total monomeric anthocyanin pigment content of fruit juices, beverages, natural colorants, and wines by the pH differential method: Collaborative study. J. AOAC Int. 2005, 88, 1269–1278. [Google Scholar] [CrossRef] [Scilit]
- Chen, S.; Zhou, Y.; Chen, Y.; Gu, J. fastp: An ultra-fast all-in-one FASTQ preprocessor. Bioinformatics 2018, 34, i884–i890. [Google Scholar] [CrossRef] [Scilit]
- Kim, D.; Paggi, J.M.; Park, C.; Bennett, C.; Salzberg, S.L. Graph-based genome alignment and genotyping with HISAT2 and HISAT-genotype. Nat. Biotechnol. 2019, 37, 907–915. [Google Scholar] [CrossRef] [Scilit]
- Pertea, M.; Pertea, G.M.; Antonescu, C.M.; Chang, T.C.; Mendell, J.T.; Salzberg, S.L. StringTie enables improved reconstruction of a transcriptome from RNA-seq reads. Nat. Biotechnol. 2015, 33, 290–295. [Google Scholar] [CrossRef] [Scilit]
- Love, M.I.; Huber, W.; Anders, S. Moderated estimation of fold change and dispersion for RNA-seq data with DESeq2. Genome Biol. 2014, 15, 550. [Google Scholar] [CrossRef] [Scilit]
- Rempel, A.; Choudhary, N.; Pucker, B. KIPEs3: Automatic annotation of biosynthesis pathways. PLoS ONE 2023, 18, e0294342. [Google Scholar] [CrossRef] [Scilit]
- Choudhary, N.; Hagedorn, M.; Pucker, B. Out of the blue: Family-wide loss of anthocyanin biosynthesis in Cucurbitaceae. Plant J. 2026, 127, e71136. [Google Scholar] [CrossRef] [Scilit]
- Pucker, B. Automatic identification and annotation of MYB gene family members in plants. BMC Genom. 2022, 23, 220. [Google Scholar] [CrossRef] [Scilit]
- Katoh, K.; Rozewicki, J.; Yamada, K.D. MAFFT online service: Multiple sequence alignment, interactive sequence choice and visualization. Brief. Bioinform. 2019, 20, 1160–1166. [Google Scholar] [CrossRef] [Scilit]
- Brown, J.W.; Walker, J.F.; Smith, S.A. Phyx: Phylogenetic tools for unix. Bioinformatics 2017, 33, 1886–1888. [Google Scholar] [CrossRef] [Scilit]
- Minh, B.Q.; Schmidt, H.A.; Chernomor, O.; Schrempf, D.; Woodhams, M.D.; von Haeseler, A.; Lanfear, R. IQ-TREE 2: New models and efficient methods for phylogenetic inference in the genomic era. Mol. Biol. Evol. 2020, 37, 1530–1534, Correction in Mol. Biol. Evol. 2020, 37, 2461. https://doi.org/10.1093/molbev/msaa131. [Google Scholar] [CrossRef] [Scilit]
- Kalyaanamoorthy, S.; Minh, B.Q.; Wong, T.K.F.; von Haeseler, A.; Jermiin, L.S. ModelFinder: Fast model selection for accurate phylogenetic estimates. Nat. Methods 2017, 14, 587–589. [Google Scholar] [CrossRef] [Scilit]
- Livak, K.J.; Schmittgen, T.D. Analysis of relative gene expression data using real-time quantitative PCR and the 2−ΔΔCT method. Methods 2001, 25, 402–408. [Google Scholar] [CrossRef] [Scilit]
- Yoshida, K.; Mori, M.; Kondo, T. Blue flower color development by anthocyanins: From chemical structure to cell physiology. Nat. Prod. Rep. 2009, 26, 884–915. [Google Scholar] [CrossRef] [Scilit]
- Dangles, O.; Fenger, J.-A. The chemical reactivity of anthocyanins and its consequences in food science and nutrition. Molecules 2018, 23, 1970. [Google Scholar] [CrossRef] [Scilit]
- Yoshida, K. Chemical and biological study of flavonoid-related plant pigment: Current findings and beyond. Biosci. Biotechnol. Biochem. 2024, 88, 705–718. [Google Scholar] [CrossRef] [Scilit]
- Yoshida, K.; Kondo, T.; Okazaki, Y.; Katou, K. Cause of blue petal colour. Nature 1995, 373, 291. [Google Scholar] [CrossRef] [Scilit]
- Fukada-Tanaka, S.; Inagaki, Y.; Yamaguchi, T.; Saito, N.; Iida, S. Colour-enhancing protein in blue petals. Nature 2000, 407, 581. [Google Scholar] [CrossRef] [Scilit]
- Quattrocchio, F.; Verweij, W.; Kroon, A.; Spelt, C.; Mol, J.; Koes, R. PH4 of Petunia Is an R2R3 MYB Protein That Activates Vacuolar Acidification through Interactions with Basic-Helix-Loop-Helix Transcription Factors of the Anthocyanin Pathway. Plant Cell 2006, 18, 1274–1291. [Google Scholar] [CrossRef] [Scilit]
- Yuan, J.; Yang, W.; Zhao, Z.; Cao, J.; Yang, W.; Deng, W.; Zhong, S.; Liu, J.; Yu, Y. A new small subunit of the mitochondrial F-ATPase, PhDC, determines flower color by acidifying vacuoles. New Phytol. 2025, 249, 232–251. [Google Scholar] [CrossRef] [Scilit]
- Tanaka, Y. Flower colour and cytochromes P450. Phytochem. Rev. 2006, 5, 283–295. [Google Scholar] [CrossRef] [Scilit]
- Du, H.; Wu, J.; Ji, K.X.; Zeng, Q.Y.; Bhuiya, M.W.; Su, S.; Shu, Q.Y.; Ren, H.X.; Liu, Z.A.; Wang, L.S. Methylation mediated by an anthocyanin O-methyltransferase is involved in purple flower coloration in Paeonia. J. Exp. Bot. 2015, 66, 6563–6577. [Google Scholar] [CrossRef] [Scilit]
- Koes, R.; Verweij, W.; Quattrocchio, F. Flavonoids: A colorful model for the regulation and evolution of biochemical pathways. Trends Plant Sci. 2005, 10, 236–242. [Google Scholar] [CrossRef] [Scilit]
- Albert, N.W.; Davies, K.M.; Lewis, D.H.; Zhang, H.; Montefiori, M.; Brendolise, C.; Schwinn, K.E. A conserved network of transcriptional activators and repressors regulates anthocyanin pigmentation in eudicots. Plant Cell 2014, 26, 962–980. [Google Scholar] [CrossRef] [Scilit]
- Kitamura, S.; Shikazono, N.; Tanaka, A. TRANSPARENT TESTA 19 is involved in the accumulation of both anthocyanins and proanthocyanidins in Arabidopsis. Plant J. 2004, 37, 104–114. [Google Scholar] [CrossRef] [Scilit]
- Sun, Y.; Li, H.; Huang, J.R. Arabidopsis TT19 functions as a carrier to transport anthocyanin from the cytosol to tonoplasts. Mol. Plant 2012, 5, 387–400. [Google Scholar] [CrossRef] [Scilit]
- Mueller, L.A.; Goodman, C.D.; Silady, R.A.; Walbot, V. AN9, a petunia glutathione S-transferase required for anthocyanin sequestration, is a flavonoid-binding protein. Plant Physiol. 2000, 123, 1561–1570. [Google Scholar] [CrossRef] [Scilit]
- Noda, N. Recent advances in the research and development of blue flowers. Breed. Sci. 2018, 68, 79–87. [Google Scholar] [CrossRef] [Scilit]
Disclaimer/Publisher’s Note: The statements, opinions and data contained in all publications are solely those of the individual author(s) and contributor(s) and not of MDPI and/or the editor(s). MDPI and/or the editor(s) disclaim responsibility for any injury to people or property resulting from any ideas, methods, instructions or products referred to in the content. |
© 2026 by the authors. Licensee MDPI, Basel, Switzerland. This article is an open access article distributed under the terms and conditions of the Creative Commons Attribution (CC BY) license.