


Highlights
What are the main findings?
- Cultivar and planting date were the most consistent sources of variation across the two seasons; Jacaranda produced the heaviest heads, whereas Green Magic, Monty, and Gypsy formed heads on 77–78% of transplanted plants and had marketable heads on 70–75% of plants.
- The number of days between transplanting and the first frost injury was closely correlated with head formation (r = 0.74) and yield per transplanted plant (r = 0.81); Romanesco formed no curds at any planting date in either environment and is not suited to fall production in this region.
- The high tunnel delayed frost injury by 21 days; increased plant height, stomatal conductance, and transpiration; increased head formation and marketable heads, the latter mainly at late plantings; and increased marketable yield per transplanted plant in the season with an early frost (2023).
What are the implications of the main findings?
- For fall broccoli in the Northern Great Plains, transplanting in early July with reliable, early-maturing cultivars (Green Magic, Monty, and Gypsy) is the most dependable strategy; late-August transplanting is not recommended in either environment.
- High tunnels act mainly as frost insurance for late plantings; for early-July plantings, the open field gave similar percentages of marketable heads, and tunnels must be ventilated to limit heat-related defects such as bolting.
- Yield per harvested head alone overstates the value of cultivars with low head formation or poor head quality; head formation and marketability should be reported alongside yield.
Abstract
Fall production can extend the broccoli (Brassica oleracea var. italica) season, but suitable cultivars, transplanting dates, and the value of high tunnels are uncertain. Six cultivars were transplanted on four dates (10 July–25 August) in a high tunnel and the open field in Fargo, North Dakota, in 2023 and 2024, and growth, physiology, roots, yield, and marketability were analyzed with mixed models including year. Romanesco formed no curds at any planting date and is not suited to fall production. Jacaranda produced the heaviest heads (592 g) but formed heads on 53% and marketable heads on 48% of transplanted plants; Green Magic, Monty, and Gypsy reached 77–78% and 70–75%, respectively. Marketable yield per transplanted plant was highest for the 10 July (365 g plant−1) and lowest for the 25 August planting (87 g plant−1). Days from transplanting to the first frost injury were closely correlated with head formation (r = 0.74) and yield per transplanted plant (r = 0.81). The high tunnel delayed frost injury by 21 days and increased marketable heads, mainly at late plantings, but its marketable-yield advantage depended on the season. Early transplanting of these three reliable cultivars is recommended in the Northern Great Plains.
Keywords:
broccoli; cultivar; planting date; high tunnel; frost; head formation; marketability; Romanesco; mixed model 1. Introduction
Vegetables of the Brassicaceae family, such as cabbage (Brassica oleracea var. capitata), cauliflower (B. oleracea var. botrytis), kale (B. oleracea var. acephala), and broccoli (B. oleracea var. italica), are valued for their nutritional quality and their high content of secondary metabolites [1]. They are rich in carotenoids, flavonoids, phenolics, glucosinolates, and vitamins C and E, which contribute to antioxidant capacity [2,3] and have been associated with a lower risk of several chronic diseases [4]. Broccoli, however, is sensitive to temperature throughout its development, and seasonal temperature extremes reduce yield and head quality [5]. Heat during head initiation and development causes uneven bud size, loose and deformed heads, and lower market value [6,7,8], whereas freezing temperatures injure young heads and growing points [9]. Because the planting date determines the temperatures that a crop experiences at each developmental stage, it is one of the main management tools for matching broccoli development to favorable conditions [10,11,12,13].
North Dakota has short, warm summers, long, cold winters, and large temperature fluctuations in spring and fall [14]. In this setting, fall production is attractive because transplants set in mid-summer can mature during the cooler weeks of September and October, when temperatures are closer to the 15–25 °C range that favors broccoli yield [5,11], and because locally grown produce is scarce at that time of year. The same strategy, however, exposes late plantings to a short and unpredictable frost-free period.
High tunnels are increasingly used to extend the season, protect crops from wind and low temperatures, and improve yield and quality [15,16]. Unheated tunnels raise air temperature at crop height by a few degrees on average and by considerably more on the coldest days [17,18], but they also produce higher daytime temperatures, which can be harmful to cool-season brassicas. Winter broccoli and cauliflower have been grown successfully in high tunnels in a humid subtropical climate, where marketability was high but heat during head development increased the incidence of loose and flowering heads and the time to harvest exceeded catalog estimates by 8–45 days [17]. In the northeastern United States, an additional low tunnel with heavy row cover improved the winter survival, yield, and earliness of fall-planted winter sprouting broccoli in unheated high tunnels, and cultivars differed in maturity, yield, and shoot quality [19]. Fall broccoli production in high tunnels has also been described for the U.S. Midwest [20]. These studies, however, evaluated cultivars only inside tunnels; direct comparisons of the same broccoli cultivars in a high tunnel and the open field at several planting dates, which would show whether the best cultivars and planting dates differ between production systems, are lacking. Our group has evaluated planting date and cultivar effects on spring broccoli [13] and on spring and fall cauliflower in North Dakota [12,21]. The present study is, to our knowledge, the first to evaluate broccoli cultivars at four fall planting dates in both a high tunnel and the open field over two seasons, and it extends our earlier designs by testing the consistency of treatment effects between years, expressing yield and marketability per transplanted plant, and relating performance to the length of the frost-free period after transplanting.
Three gaps therefore remain. First, it is unclear whether cultivar × planting date × environment interactions are important for fall broccoli production. Second, high tunnels change temperature, humidity, and light simultaneously; their net effect on plant physiology, head formation, and marketable yield in a short northern fall season, and the conditions under which they are worth their cost, have not been quantified. Third, cultivar evaluations usually report yield per harvested head, which can overstate the value of cultivars that fail to form heads or produce heads of low quality. To address these gaps, we evaluated six cultivars transplanted on four dates in a high tunnel and in the open field over two seasons. Our objectives were to (i) quantify the effects of cultivar, planting date, and production environment, and their interactions with year, on growth, leaf gas exchange, root traits, head yield, head formation, and marketability; (ii) relate crop performance to the thermal environment and to the length of the frost-free period after transplanting; and (iii) identify cultivar × planting date × environment combinations that are reliable for fall broccoli production in North Dakota.
2. Materials and Methods
2.1. Experimental Site and Design
The experiment was conducted in 2023 and 2024 at the North Dakota State University (NDSU) Agricultural Experiment Station in Fargo, ND, USA (46.900° N, 96.814° W; USDA Plant Hardiness Zone 4 [22]). The soil is a Fargo silty clay (fine, smectitic, frigid Typic Epiaquert) [23]. Each year, the experiment was established in two production environments located at the same station: an unheated high tunnel and an adjacent open field (Figure S1). The high tunnel was 22 m long, 9 m wide, and 4.5 m high at the center and was covered with a double layer of white polyethylene. It was ventilated through a front window and roll-up side walls that were opened automatically by a temperature controller whenever the air temperature exceeded 30 °C. Within each environment, the treatments were arranged as a randomized complete block design with four replications. The treatments were the factorial combinations of four transplanting dates (10 July, 25 July, 10 August, and 25 August) and six cultivars (Green Magic, Gypsy, Jacaranda, Monty, Purple Peacock, and Romanesco; Table S1), which were selected on the basis of earlier spring trials [13]. Each experimental unit was a single plant, so each environment contained 96 plants per year (4 planting dates × 6 cultivars × 4 replications), and the experiment comprised 384 plants in total (320 plants of the five broccoli cultivars and 64 plants of Romanesco). Because each plot consisted of one plant, plant values and plot means are identical, and the individual plant was the unit of analysis.
2.2. Field and Crop Management
Fields were prepared in July with one pass of a field cultivator followed by a rotary tiller (John Deere 655; Horicon, WI, USA). Soil samples were collected at 0–15 cm and 15–30 cm and analyzed by the NDSU Soil Testing Laboratory. In the open field, soil pH was 7.2 (0–15 cm) and 7.1 (15–30 cm), and organic matter was 7.2% and 7.3%; in the high tunnel, soil pH was 7.7 and 7.6, and organic matter was 4.4% and 4.7%, respectively. Five-week-old transplants raised in a greenhouse were set on raised beds covered with black plastic mulch, with drip irrigation beneath the mulch. Plants were spaced 45 cm within rows and 90 cm between rows. Management was identical in both environments: drip irrigation was applied for 2 h three times per week (the irrigation volume was not metered), and a water-soluble 20–20–20 fertilizer (JR Peters Inc., Allentown, PA, USA) was applied at 100 mg L−1 N at 20-day intervals after transplanting (three applications per planting date). Weed, pest, and disease management were the same in both environments. Air and soil temperatures were recorded hourly in each environment with data loggers (WatchDog 1000 Series, Spectrum Technologies, Aurora, IL, USA); monthly minimum, mean, and maximum values are given in Table S2. The date on which frost injury was first observed on plants and the date of the last harvest were recorded for each environment and year (Table S2). Because frost damage depends on the duration of exposure and on the developmental stage of the plants rather than on a single logger reading, the frost-free period was defined by the first observed frost injury on plants rather than by the minimum logger temperature.
2.3. Data Collection
Plant height (cm) and the number of leaves were recorded on every plant at 20, 30, 40, 50, and 60 days after transplanting (DAT). Leaf gas exchange was measured with a portable open-flow system (CIRAS-3, PP Systems, Amesbury, MA, USA) on the youngest fully expanded, healthy leaf at the same five dates. Because each measurement required about 30 min per plant, one plant per cultivar × planting date combination was measured in each environment and year, and the same plant was measured repeatedly until harvest. In 2023, additional readings (from a second plant or repeated readings) were taken in some combinations at 20–50 DAT; all readings from the same year × environment × planting date × cultivar combination and date were averaged before analysis. The cuvette was set to 100 mL min−1 airflow, a photosynthetic photon flux density of 1200 μmol m−2 s−1, a CO2 concentration of 390 ± 5 μmol mol−1, and an atmospheric pressure of 99.9 kPa, and measurements were taken between 10:00 and 15:00. Stomatal conductance (gs, mmol m−2 s−1), transpiration rate (E, mmol m−2 s−1), instantaneous water-use efficiency (WUE = net CO2 assimilation/E, mmol CO2 mol−1 H2O) [24], and the efficiency of photosystem II in light-adapted leaves (Fv′/Fm′) [25] were recorded.
Throughout this paper, “head” refers to the harvested broccoli inflorescence; “curd” is used for Romanesco and cauliflower (botrytis types). Heads were harvested at commercial maturity, defined as a compact head at least 10 cm in diameter; smaller heads (mostly buttoned heads) were harvested when they were judged to be mature, and heads that had not reached harvest size by the end of the season were harvested at the last harvest date of each environment (Table S2). Days to harvest, head fresh weight (g), and head diameter (cm) were recorded for each harvested head. Heads were graded following the USDA standards for Italian sprouting broccoli [26] as adapted for this study: U.S. No. 1, compact, well-formed heads at least 10 cm in diameter without defects or disease; U.S. No. 2, heads that otherwise met the U.S. No. 1 criteria, regardless of size, but had defects (bolting, buttoning, or frost injury) on more than 10% of the head while remaining edible and marketable; and non-marketable, heads with serious defects and small or loose heads. The following defects were recorded: buttoning (premature formation of a small head, often with leaf growth within or around it [27]), bolting (loose head with premature elongation and flowering), and frost injury. Plants that died before forming a head, were killed by frost, or remained vegetative (blindness) produced no harvestable head. After harvest, the root system was excavated, and root fresh weight (g), taproot length (cm), and root system width (cm) were measured. For each plant, four variables were derived from these records: head formation (1 if a head was harvested, otherwise 0), marketable head (1 if the head was U.S. No. 1 or No. 2, otherwise 0), yield per transplanted plant (head weight, or 0 for plants without a head), and marketable yield per transplanted plant (head weight of marketable heads, otherwise 0). Head formation and marketable heads are therefore expressed as percentages of transplanted plants. Market grades and defect classes were re-checked against the field records before analysis (Section 2.4).
2.4. Data Quality Control
Before analysis, the data set was checked for entry errors and implausible values, and every correction was documented (Table S3). The market grade and defect classification of the harvested heads were re-checked by the person who graded them, and the corrected classification (defect class changed for 51 and grade for 50 of the 220 heads) was used in all analyses. Three root-length values that had been entered with a misplaced decimal during conversion from inches (e.g., 215.9 instead of 21.59 cm), one leaf count (242 instead of 24), and one Romanesco plant height (1270 instead of 127.0 cm) were corrected; the corrected root-length values are consistent with the root-length means of the original analysis, so the error was confined to the data file. Three growth records that had been entered twice under replication 4, while the corresponding replication 3 record of the same plant and date was missing, were assigned to replication 3. Two leaf counts that were more than twice both the preceding and the following count on the same plant, zero values recorded for missing Romanesco plants, and one zero root width were treated as missing. For gas exchange, WUE was treated as missing when net CO2 assimilation was zero or negative (WUE ≤ 0; 117 of 448 broccoli readings, mostly from the 2023 season) or when the implied net assimilation (WUE × E) reached the upper limit of the instrument (>90 μmol m−2 s−1; 14 readings), because WUE is not defined or not physiologically meaningful under these conditions [28,29]; the same rules removed 27 Romanesco WUE readings. Stomatal conductance was missing in the original records for 38 broccoli readings. E and Fv′/Fm′ were retained for all readings. In total, 317 valid WUE readings and 410 gs readings of broccoli were analyzed.
2.5. Statistical Analysis
All analyses were performed in R software (version 4.3.3; R Core Team, 2024) [30] with the packages lme4 [31], lmerTest [32], emmeans [33], and multcomp [34]. Because only two growing seasons were available, year was treated as a fixed factor; variance components for factors with so few levels cannot be estimated reliably [35]. Days to harvest, head weight, head diameter, root traits, and yield and marketable yield per transplanted plant were analyzed with linear mixed models that included year, environment, planting date, cultivar, and all their interactions as fixed effects and blocks nested within year × environment as a random effect. Including year and its interactions in these models allowed us to test whether treatment effects were consistent between seasons, instead of assuming that the two years could be pooled. To check that the conclusions did not depend on this choice, the models were refitted with year, year × environment, and all year × treatment interactions as random effects [36]; in this sensitivity analysis, treatment effects are tested against their variation between years (Table S4). Type III F tests with Satterthwaite degrees of freedom and sum-to-zero contrasts were used. Days to harvest, head weight, and head diameter were analyzed for harvested heads (n = 220); root traits for all plants with root measurements (n = 236); and yield and marketable yield per transplanted plant for all 320 plants. Because some cultivar × planting date combinations produced no heads (Jacaranda at the 25 August planting in both years), marginal means of the harvested-head traits were weighted by the number of observations in each cell; these means therefore also reflect the cultivars and planting dates that produced heads, and differences between them were interpreted only where the corresponding F test was significant.
Gas-exchange traits were analyzed with a repeated-measures mixed model with year, environment, planting date, cultivar, the interactions among environment, planting date, and cultivar, DAT, and environment × DAT as fixed effects and the individual plant (year × environment × planting date × cultivar) as a random effect; year × treatment interactions were not included because each year × environment × planting date × cultivar combination was represented by one plant, so that these interactions could not be separated from plant-to-plant variation. Plant height and leaf number were analyzed with a model in which year, environment, planting date, cultivar, and all their interactions, DAT, and the interactions of DAT with environment, planting date, and cultivar were fixed effects and block and plant were random effects; their trajectories were described with quadratic regressions on DAT for each environment × planting date and environment × cultivar combination (Table S5). Head formation and marketable head were analyzed with binomial generalized linear mixed models (logit link) with year, environment, planting date, cultivar, and environment × planting date as fixed effects and block as a random effect; interactions with year and cultivar were not included because many of these combinations contained only zeros or only ones (complete separation), which prevents stable estimation. For these two traits, observed percentages are reported, and the models were used for tests and multiple comparisons; their results are given together with those of the linear mixed models in Table 1. Estimated marginal means were compared with Tukey’s honestly significant difference test (p < 0.05), and comparisons within the levels of another factor are shown only for interactions that were significant in the F test (or, for the binomial models, the Wald χ2 test). Distributions of market grades and head defects among harvested heads were compared among environments, planting dates, and cultivars with Pearson χ2 tests whose p-values were obtained by Monte Carlo simulation (20,000 replicates). Romanesco, which formed no curds, was excluded from the yield analyses; it was compared with each of the five broccoli cultivars for growth, gas exchange, and root traits with Dunnett’s test in models that included all six cultivars.
Table 1.
Results (p-values) of the mixed models for days to harvest, head weight, head diameter, head formation, marketable heads, yield and marketable yield per transplanted plant, and root traits of five broccoli cultivars grown in a high tunnel and the open field at four planting dates in 2023 and 2024.
To relate performance to the thermal environment, the number of days from transplanting to the first observed frost injury was calculated for each year × environment × planting date combination and correlated with head formation and yield per transplanted plant (n = 16). Multivariate relationships were examined across the means of the year × environment × planting date × cultivar combinations (n = 80; 67 combinations with complete data for principal component analysis, PCA) rather than across five cultivar means, which provide too few observations for stable estimates [37]; because each cultivar and planting date occurs in several combinations, these means are not fully independent, and the multivariate results are treated as exploratory. Pearson correlations were adjusted for multiple testing with the Benjamini–Hochberg procedure. PCA was performed on standardized variables; the number of meaningful components was assessed with parallel analysis (1000 random data sets), and the stability of variance explained and loadings was assessed with 2000 bootstrap resamples aligned to the original solution by orthogonal Procrustes rotation (Python 3.13 with NumPy, SciPy, and pandas). Data are presented as estimated marginal means ± standard error unless stated otherwise.
3. Results
3.1. Thermal Environment and Frost-Free Period
The high tunnel was warmer than the open field throughout both seasons (Figure 1a–d; Table S2). Monthly mean air temperature was 1.2–7.3 °C higher and monthly mean soil temperature 2.0–8.3 °C higher in the tunnel, with the largest differences in October. Daytime peaks were also higher in the tunnel in most months, reaching 43.2 °C in September 2023 and 45.8 °C in August 2024 (33.4 °C in the open field in August 2024). In 2023, the open-field logger recorded sub-zero air temperatures in September (minimum −5.5 °C), and frost injury was first observed on 14 October; in 2024, it was first observed on 28 October. In the high tunnel, frost injury was first observed on 4 November 2023 and 18 November 2024, that is, 21 days later than in the open field in both years. Consequently, the time from transplanting to the first frost injury ranged from 50 days (open field, 25 August 2023) to 131 days (high tunnel, 10 July 2024). Across the 16 year × environment × planting date combinations, this frost-free period was closely correlated with the percentage of plants that formed a head (r = 0.74, p < 0.001) and with yield per transplanted plant (r = 0.81, p < 0.001; Figure 1e,f).
Figure 1.
Thermal environment and frost-free period in the high tunnel and the open field in Fargo, ND. (a,b) Monthly air temperature and (c,d) monthly soil temperature in 2023 (a,c) and 2024 (b,d); symbols show monthly means and vertical bars show the monthly minimum–maximum range of hourly logger records (Table S2). Triangles mark the four transplanting dates; vertical lines mark the date on which frost injury was first observed (first frost injury) in the high tunnel (solid) and the open field (dashed); light shading marks the period after the first frost injury in the open field and darker shading marks the period after frost injury in both environments. November temperatures were not available. (e) Proportion of transplanted plants that formed a harvestable head and (f) mean yield per transplanted plant (plants without a head counted as 0 g) in relation to the number of days from transplanting to the first observed frost injury; each symbol is one year × environment × planting date combination (n = 16; each based on 20 plants of five cultivars). Lines are least-squares regressions drawn over the range of the data; r, Pearson correlation coefficient.
3.2. Consistency of Treatment Effects Between Years
Year affected days to harvest, head formation, marketable heads, taproot length, and yield and marketable yield per transplanted plant, and interacted with the treatments for several traits (Table 1). Plants reached harvest 14 days later in 2023 than in 2024 (70.3 ± 1.6 vs. 56.3 ± 1.4 days), whereas head weight and head diameter did not differ between years. The year × planting date × cultivar interaction was significant for head weight, yield and marketable yield per transplanted plant, and root system width; the year × environment interaction was significant for yield and marketable yield per transplanted plant; and further year interactions were significant for head weight (year × cultivar), taproot length (year × environment × planting date), and yield and marketable yield per transplanted plant (Table 1). These responses could therefore not be pooled across years without qualification, and head weight and marketable yield per transplanted plant are presented separately by year (Section 3.6 and Section 3.7). When year and all its interactions were treated as random effects (Table S4), the cultivar effect remained significant for all eight traits analyzed with linear mixed models (p ≤ 0.031); the planting-date effect remained significant for head diameter, root fresh weight, root system width, and yield and marketable yield per transplanted plant; the environment × planting date interaction was significant for head diameter and head weight (for head weight, p = 0.043 in this analysis and p = 0.092 in the main model); the planting date × cultivar interaction was significant for yield and marketable yield per transplanted plant; and the environment × planting date × cultivar interaction was significant for yield and marketable yield per transplanted plant. These effects can therefore be regarded as consistent across seasons, whereas the main effect of environment on yield per transplanted plant was not (p = 0.355 in the sensitivity analysis). Interactions between environment and cultivar were rare: among the traits for which they were tested, the environment × cultivar interaction was significant only for root fresh weight, and the environment × planting date × cultivar interaction only for yield and marketable yield per transplanted plant (p = 0.009 and p = 0.011; Table 1), so the cultivar rankings were largely similar in the two production systems.
3.3. Vegetative Growth
Plant height and leaf number increased with DAT and were well described by quadratic functions (R2 = 0.35–0.69; Figure 2; Table S5). Plants grown in the high tunnel were taller than those in the open field (61.6 ± 1.0 vs. 52.4 ± 1.0 cm averaged over DAT; p < 0.001), and the difference increased from 3.9 cm at 20 DAT to 14.9 cm at 60 DAT (environment × DAT, p < 0.001). Leaf number did not differ between environments (p = 0.99) but decreased with later planting, from 24.5 ± 0.6 leaves for the 10 July planting to 16.1 ± 0.5 leaves for the 25 August planting (p < 0.001). Among cultivars, Gypsy was the tallest (63.4 ± 1.2 cm) and Purple Peacock the shortest (47.5 ± 1.3 cm), and Green Magic produced the most leaves (25.2 ± 0.6) and Jacaranda the fewest (16.6 ± 0.7).
Figure 2.
Plant height (a–d) and leaf number (e–h) of five broccoli cultivars from 20 to 60 days after transplanting in the high tunnel (left) and the open field (right). (a,b,e,f) Means by planting date, averaged over cultivars and years; (c,d,g,h) means by cultivar, averaged over planting dates and years. Symbols show raw means ± SE across plants (n = 8–40 plants per symbol, depending on plant survival) and are slightly offset horizontally to avoid overlap; lines are quadratic regressions fitted to the individual-plant data (coefficients and R2 in Table S5).
3.4. Leaf Gas Exchange
Stomatal conductance and transpiration were higher in the high tunnel than in the open field (gs, 683 ± 19 vs. 528 ± 20 mmol m−2 s−1; E, 6.10 ± 0.16 vs. 4.50 ± 0.17 mmol m−2 s−1; both p < 0.001), whereas WUE was higher in the open field (7.26 ± 0.37 vs. 5.31 ± 0.35 mmol CO2 mol−1 H2O; p < 0.001; Table 2). The environment × DAT interaction was not significant for these three traits (p ≥ 0.063), indicating that the environment effects were consistent over the measurement period (Figure 3). gs and E declined from 20 to 60 DAT, whereas WUE was highest at 60 DAT (DAT, p < 0.001). Transpiration was highest in plants transplanted on 10 July (6.53 ± 0.24 mmol m−2 s−1) and similar among the later plantings (4.52–5.14 mmol m−2 s−1). Fv′/Fm′ decreased from 0.61 ± 0.01 for the 10 July planting to 0.54 ± 0.01 for the 10 and 25 August plantings (p = 0.007) and did not differ between environments overall (p = 0.75), although the environment × DAT interaction was significant (p = 0.014) without a consistent direction (Figure 3d). Cultivars differed only in gs (p = 0.020), which was higher in Gypsy (675 ± 30 mmol m−2 s−1) than in Jacaranda (540 ± 33 mmol m−2 s−1); E, WUE, and Fv′/Fm′ did not differ among cultivars. E, WUE, and Fv′/Fm′ were higher in 2024 than in 2023 (Table 2).
Table 2.
Leaf gas exchange of five broccoli cultivars grown in a high tunnel and the open field at four planting dates in 2023 and 2024 (estimated marginal means ± SE and p-values of the repeated-measures mixed model).
Figure 3.
Leaf gas exchange of broccoli in the high tunnel and the open field from 20 to 60 days after transplanting: (a) stomatal conductance (gs), (b) transpiration rate (E), (c) instantaneous water-use efficiency (WUE, net CO2 assimilation/E), and (d) efficiency of photosystem II in light-adapted leaves (Fv′/Fm′). Values are estimated marginal means ± SE from a repeated-measures mixed model, averaged over five cultivars, four planting dates, and two years (n = 39–40 cultivar × planting date × year units per environment, depending on the trait; readings from the same unit and date were averaged). WUE excludes readings with zero, negative, or saturated net assimilation (Section 2.4). The p-values in each panel are for the environment main effect (Env) and the environment × days after transplanting interaction (Env × D) (Table 2); because Env × D was not significant for gs, E, and WUE, differences between environments at individual dates were not tested. For Fv′/Fm′, Env × D was significant, but the environments did not differ consistently over time.
3.5. Root Traits
Root fresh weight was affected by cultivar (p < 0.001), planting date (p = 0.003), and the environment × cultivar interaction (p = 0.008) (Table 1; Figure 4a). Jacaranda had the heaviest roots, particularly in the high tunnel (133.8 ± 6.0 g vs. 91.1 ± 6.8 g in the open field), whereas the root fresh weight of the other cultivars was 54–82 g and did not differ between environments. Root fresh weight decreased with later planting, from 89.5 ± 3.4 g for the 10 July planting to 60.6 ± 4.1 g for the 25 August planting. Taproot length and root system width were affected by cultivar, planting date, and the planting date × cultivar interaction (Figure 4b,c); taproot length was also affected by year, environment, and year × environment × planting date, and root system width by year × planting date × cultivar (Table 1). Jacaranda had the widest root system at the first two plantings (34.6 ± 1.4 cm on 10 July) and the longest taproot at the first planting, but its roots became progressively smaller with later planting, whereas Purple Peacock had relatively long and wide roots from the 25 July planting onward, and Gypsy had the smallest root systems at most dates. Taproot length and root system width were smallest at the 25 August planting (15.4 ± 0.6 and 21.5 ± 0.8 cm). Means for the main effects are given in Table S6.
Figure 4.
Root traits of five broccoli cultivars. (a) Root fresh weight by environment and cultivar (environment × cultivar interaction, p = 0.008); (b) taproot length and (c) root system width by planting date and cultivar (planting date × cultivar interaction, p = 0.007 and p < 0.001, respectively). Bars show estimated marginal means ± SE from the linear mixed model, averaged over years and over planting dates (a) or environments (b,c); dots show individual plants (n = 236 plants; 16–28 per bar in (a) and 4–15 per bar in (b,c)). Means with the same letter do not differ (Tukey’s HSD, p < 0.05): in (a) among all ten environment × cultivar combinations, and in (b,c) among cultivars within each planting date. Root system width also showed a year × planting date × cultivar interaction (p = 0.044; Table 1), so the letters in (c) describe the pattern averaged over the two years.
3.6. Head Weight, Head Diameter, and Days to Harvest
Head weight, head diameter, and days to harvest of harvested heads were strongly affected by cultivar and planting date (Table 1 and Table 3). Jacaranda produced the heaviest heads (592 ± 24 g; this mean excludes the 25 August planting, at which Jacaranda formed no heads), followed by Green Magic, Monty, and Gypsy (376–418 g), whereas Purple Peacock produced small heads (137 ± 23 g) with the smallest diameter (12.1 ± 0.4 cm vs. 14.8–15.3 cm). Jacaranda also needed the longest time to harvest (77.0 ± 1.9 days), and Monty the shortest (53.7 ± 1.7 days) (Figure 5e). Heads from the 25 August planting were lighter (252 ± 26 g) and smaller (12.0 ± 0.4 cm) than those from the earlier plantings (385–441 g; 14.4–15.4 cm), and plants of this planting needed the longest time to harvest (68.6 ± 2.0 days). The cultivar ranking for head weight differed between years (year × planting date × cultivar, p < 0.001; Figure 5a,b). In 2023, Jacaranda transplanted on 10 July produced exceptionally large heads (1085 ± 56 g), but its heads from the 10 August planting were among the lightest (189 ± 68 g); in 2024, Jacaranda produced the heaviest or equally heavy heads at the first three plantings (528–561 g). Jacaranda formed no heads at the 25 August planting in either year. The environment × planting date interaction was significant for head diameter (p = 0.016): at the 25 August planting, heads were larger in the high tunnel than in the open field (13.2 ± 0.5 vs. 9.2 ± 0.8 cm, p < 0.001), whereas earlier plantings did not differ between environments (Figure 5d). Days to harvest were not affected by environment or by its interactions with planting date or cultivar (p ≥ 0.281).
Table 3.
Days to harvest, head weight and diameter, head formation, marketable heads, and yield per transplanted plant of five broccoli cultivars grown in a high tunnel and the open field at four planting dates in 2023 and 2024.
Figure 5.
Head weight, head diameter, and days to harvest of harvested heads. Head weight by planting date and cultivar in (a) 2023 and (b) 2024 (year × planting date × cultivar interaction, p < 0.001); (c) head diameter by planting date and cultivar, averaged over environments and years; (d) head diameter by environment and planting date, averaged over cultivars and years (environment × planting date interaction, p = 0.016); (e) days to harvest by cultivar, averaged over environments, planting dates, and years. Bars show estimated marginal means ± SE; dots show individual heads (n = 220 heads; 2–8 per bar in (a,b), 4–15 in (c), 9–39 in (d), and 34–50 in (e)). NH, no harvestable head (Jacaranda at the 25 August planting in both years and Purple Peacock at the 25 August planting in 2024). In (a–c), means with the same letter within a planting date do not differ, and in (e), means with the same letter do not differ (Tukey’s HSD, p < 0.05). In (d), asterisks indicate differences between environments within a planting date: *** p < 0.001; ns, not significant. Panels (a,b) share the same y-axis scale to allow comparison between years.
3.7. Head Formation, Marketability, and Yield per Transplanted Plant
Of the 320 broccoli plants, 220 (68.8%) produced a harvested head and 100 did not, because they died, were killed by frost, or failed to form a head. Head formation was affected by year (56% of plants in 2023 vs. 81% in 2024), environment (80% in the high tunnel vs. 58% in the open field), planting date, and cultivar (all p < 0.001; Table 1 and Table 3; Figure 6a). It decreased from 86% of plants for the 10 July planting to 38% for the 25 August planting, which differed from the three earlier plantings (Figure 6a); the advantage of the high tunnel was largest at the 10 August (98% vs. 60%) and 25 August plantings (53% vs. 23%), although the environment × planting date interaction was not significant (p = 0.073). Green Magic, Gypsy, and Monty formed heads on 77–78% of plants, compared with 59% for Purple Peacock and 53% for Jacaranda. The percentage of plants with a marketable head was affected by year (45% in 2023 vs. 71% in 2024), environment (69% in the high tunnel vs. 47% in the open field), planting date, and cultivar (all p < 0.001), and by the environment × planting date interaction (p = 0.008; Table 1): the high tunnel had more plants with a marketable head at the 10 August (85% vs. 53%) and 25 August plantings (48% vs. 8%; both p < 0.001), whereas the environments did not differ at the earlier plantings (Figure 6b). Monty (75%), Green Magic (73%), and Gypsy (70%) had the highest percentages of plants with a marketable head, whereas Jacaranda had 48% and Purple Peacock 23%.
Figure 6.
Head formation, marketability, and yield per transplanted plant. (a) Percentage of transplanted plants that formed a harvestable head and (b) percentage of transplanted plants with a marketable (U.S. No. 1 or No. 2) head, by environment and planting date (observed percentages ± binomial SE, pooled over cultivars and years; n = 40 plants per bar). The text above each panel gives the significance of the environment (Env) and planting date (P) effects and of their interaction (Env × P) in the binomial generalized linear mixed model (Table 1; ** p < 0.01; *** p < 0.001; ns, not significant). In (a), the interaction was not significant, so planting dates are compared averaged over environments (bars with the same uppercase letter do not differ; Tukey’s HSD, p < 0.05); in (b), the interaction was significant, and asterisks compare the environments within each planting date. (c) Yield per transplanted plant by cultivar (n = 64 plants per cultivar; plants without a head counted as 0 g), divided into marketable (solid) and non-marketable (hatched) yield; values next to the bars give the marketable yield, letters compare the total yield per transplanted plant averaged over environments, planting dates, and years (Tukey’s HSD, p < 0.05; marketable yield showed the same grouping; cultivar also interacted with these factors, Table 1), and the three numbers below each cultivar give the observed percentages of transplanted plants that formed a head (HF), had a marketable head (MH), and had a U.S. No. 1 head. (d,e) Difference in marketable yield per transplanted plant between the high tunnel (HT) and the open field (OF) by planting date in (d) 2023 and (e) 2024 (estimate ± 95% confidence interval, averaged over cultivars; n = 20 plants per environment and planting date in each year); the year × environment interaction was significant (p = 0.006), and the text in each panel gives the environment difference averaged over planting dates in that year, whereas the year × environment × planting date interaction was not (p = 0.111), so the values for individual planting dates are descriptive (dark bars, higher in the high tunnel; light hatched bars, higher in the open field).
When plants without a head were counted as zero, the other four cultivars no longer differed in yield per transplanted plant (Green Magic 327, Monty 316, Jacaranda 315, and Gypsy 289 g plant−1) or in marketable yield per transplanted plant (278–317 g plant−1), whereas Purple Peacock remained far lower (81 and 36 g plant−1, respectively; Table 3; Figure 6c). Marketable yield per transplanted plant was highest for the 10 July planting (365 ± 21 g plant−1), intermediate for the 25 July and 10 August plantings (260–286 g plant−1), and lowest for the 25 August planting (87 ± 21 g plant−1). Averaged over years, marketable yield per transplanted plant was higher in the high tunnel than in the open field (292 vs. 208 g plant−1; p = 0.002), but this effect differed between years (year × environment, p = 0.006; Figure 6d,e). In 2023, when the open field was exposed to sub-zero temperatures from September and frost injury began on 14 October, the high tunnel produced 156 g plant−1 more marketable yield than the open field (p < 0.001), whereas in 2024, when frost injury in the open field began two weeks later, the environments did not differ (12 g plant−1; p = 0.695). The year × environment × planting date interaction was not significant (p = 0.111); descriptively, the tunnel advantage in 2023 was largest at the 10 August planting, and in 2024, a positive tunnel difference was observed only at the 25 August planting (Figure 6d,e). When year and its interactions were treated as random effects, the environment effect on marketable yield per transplanted plant was not significant (p = 0.337).
3.8. Market Grade and Head Defects
Of the 220 harvested heads, 139 (63.2%) were U.S. No. 1, 47 (21.4%) were U.S. No. 2, and 34 (15.5%) were non-marketable (Figure 7). The distribution of grades differed between environments (p = 0.005) and among cultivars (p < 0.001) but not among planting dates (p = 0.58), whereas the distribution of defects differed among planting dates and cultivars (both p < 0.001) but not between environments (p = 0.20); both distributions differed among cultivar × planting date combinations within each environment (all p < 0.001).
Figure 7.
Distribution of (a,b) market grades and (c,d) head defects among harvested heads by planting date and cultivar in the high tunnel (a,c) and the open field (b,d), pooled over the two years. Numbers above the bars are the numbers of harvested heads (maximum 8: two years × four replications). NH, no harvestable head. Grade and defect distributions differed among cultivar × planting date combinations in both environments (χ2 tests with Monte Carlo p-values, p < 0.001). GM, Green Magic; GY, Gypsy; JA, Jacaranda; MO, Monty; PP, Purple Peacock.
The proportion of non-marketable heads was similar in the high tunnel (13%; 17 of 128 heads) and the open field (18%; 17 of 92 heads), but more tunnel heads were graded U.S. No. 2 (29% vs. 11%; 37 vs. 10 heads), mainly because of bolting (17 of the 37 tunnel heads), frost injury (9), and buttoning (8). Frost injury affected 15 heads (11 in the high tunnel and 4 in the open field), more than half of them from the 25 August planting (8 of 15). Buttoning was the main defect of Purple Peacock (20 of 38 heads), and only 4 of 38 Purple Peacock heads and 17 of 34 Jacaranda heads were free of defects, compared with 40–42 of 49–50 heads for the other cultivars. In the open field, Green Magic, Gypsy, and Monty transplanted on 10 July produced only U.S. No. 1 heads.
3.9. Romanesco
None of the 64 Romanesco plants formed a curd at any planting date in either environment or year, although the plants grew vigorously (Figure 8). At 60 DAT, Romanesco plants were taller (94.3 cm) than those of every broccoli cultivar (62.4–81.0 cm) but had the fewest leaves (20.4 vs. 24.1–36.3 leaves per plant). Averaged over the season, Romanesco was 7.0–21.6 cm taller than the broccoli cultivars (Dunnett’s test, p < 0.001) and had 2.3–10.0 fewer leaves (p ≤ 0.010; Table S7). In the six-cultivar model, its root fresh weight (114.2 ± 5.8 g) was similar to that of Jacaranda (111.5 ± 5.9 g) and 40–56 g greater than that of the other cultivars (p < 0.001). Stomatal conductance, transpiration, WUE, and Fv′/Fm′ of Romanesco did not differ from those of any broccoli cultivar (p ≥ 0.085).
Figure 8.
Comparison of Romanesco, which formed no curds, with the five broccoli cultivars. (a) Plant height and (b) leaf number from 20 to 60 days after transplanting (estimated marginal means ± SE). (c) Root fresh weight, (d) root system width, (e) stomatal conductance (gs), and (f) Fv′/Fm′ (bars, estimated marginal means ± SE; dots, individual plants in (c,d) and plant means over measurement dates in (e,f)). Asterisks above the broccoli bars indicate differences from Romanesco (Dunnett’s test: *** p < 0.001; ns, not significant; Table S7). Values are averaged over environments, planting dates, and years (n = 64 plants per cultivar for growth, 37–54 plants per cultivar with root data, and 15–16 plants per cultivar for gs and Fv′/Fm′) and come from a model that includes Romanesco; they therefore differ slightly from the five-cultivar estimates in Table 2 and Table S6. RO, Romanesco; GM, Green Magic; GY, Gypsy; JA, Jacaranda; MO, Monty; PP, Purple Peacock.
3.10. Trait Associations and Multivariate Structure
Across the 80 year × environment × planting date × cultivar combinations, 37 of 91 pairwise correlations remained significant after correction for multiple testing (Figure 9a). Head weight was closely correlated with head diameter (r = 0.82), and yield per transplanted plant was correlated with head weight (r = 0.78), marketable heads (r = 0.83), head formation (r = 0.73), and head diameter (r = 0.68). Taproot length and root system width were correlated (r = 0.80), and gs was correlated with E (r = 0.69). WUE was negatively correlated with both gs (r = −0.43) and E (r = −0.44). The number of days to the first frost injury was positively correlated with E (r = 0.72), head formation (r = 0.59), marketable heads (r = 0.55), yield per transplanted plant (r = 0.52), Fv′/Fm′ (r = 0.50), gs (r = 0.44), head diameter (r = 0.36), and root fresh weight (r = 0.31), and negatively with WUE (r = −0.32). At the level of individual plants, head weight was correlated with head diameter (r = 0.76, n = 220) and root fresh weight (r = 0.40, n = 214).
Figure 9.
Multivariate relationships among traits. (a) Network of Pearson correlations among 14 traits calculated across the 80 year × environment × planting date × cultivar combinations (n = 67–80 per pair); only correlations that remained significant after Benjamini–Hochberg correction (q < 0.05; 37 of 91 pairs) are drawn, line width increases with |r|, line color indicates the sign, and node size increases with the number of significant correlations of each trait. (b) Principal component analysis of ten traits (n = 67 combinations with complete data): small symbols are combinations (filled, high tunnel; open, open field), large symbols are cultivar centroids, and ellipses enclose 68% of the combinations of each cultivar; arrows show the loadings (scaled ×4) of traits whose loading on PC1 or PC2 was stable across 2000 Procrustes-aligned bootstrap samples (95% interval excluding zero); RL and RW, and gs and E, have nearly identical loadings and share a label. (c) Cultivar means standardized across the five cultivars (z-scores); filled symbols, traits with a significant cultivar effect; open symbols, no significant cultivar effect; asterisks give the significance of the cultivar effect (* p < 0.05; *** p < 0.001; ns, not significant); marketable heads are observed percentages of transplanted plants. DTH, days to harvest; HW, head weight; HD, head diameter; RFW, root fresh weight; RL, taproot length; RW, root system width; gs, stomatal conductance; E, transpiration rate; WUE, water-use efficiency; Fv′/Fm′, efficiency of photosystem II in light-adapted leaves.
The first two principal components explained 27.1% (bootstrap 95% confidence interval 26.0–35.1%) and 25.7% (20.4–28.1%) of the variation (Figure 9b). Three components exceeded the parallel-analysis threshold, so the variation was distributed over several dimensions rather than concentrated in one or two. The first component was associated with root size and maturity (loadings: root system width 0.85, taproot length 0.78, root fresh weight 0.70, days to harvest 0.58), and the second with head size and gas exchange (head diameter 0.76, E 0.72, gs 0.68, head weight 0.67) in opposition to WUE (−0.62). The loadings of Fv′/Fm′ were not stable in the bootstrap. Jacaranda was separated from the other cultivars along the first component, and Purple Peacock was shifted toward lower scores on the second component. Standardized cultivar means (Figure 9c) summarize these contrasts: Purple Peacock ranked lowest for yield per transplanted plant, marketable heads, head weight, and head diameter; Jacaranda ranked highest for head weight, days to harvest, and the root traits but low for marketable heads; and Green Magic, Monty, and Gypsy had intermediate to high values for most productivity traits.
4. Discussion
4.1. Consistency of Effects Between Seasons
The two seasons differed considerably: in the open field, sub-zero temperatures were recorded in September 2023 and frost injury began two weeks earlier than in 2024, whereas August 2024 brought the highest tunnel temperatures of the study (Table S2). Including year in the model showed that some responses, particularly the cultivar ranking for head weight at individual planting dates and the effect of the high tunnel on yield per transplanted plant, depended on the season. Pooling the two years without testing these interactions would have concealed this dependence. At the same time, the cultivar effect on all eight yield and root traits and the planting-date effect on head diameter, root fresh weight, root system width, and yield and marketable yield per transplanted plant remained significant when the year-to-year variation was used as the error term (Table S4), so the main conclusions regarding cultivars and planting dates are robust. With only two seasons, the year effect could not be modeled as a random effect with confidence [35], and the treatment × year interactions observed here indicate that recommendations should be confirmed over additional seasons.
4.2. Temperature, Frost, and Planting Date
The planting-date effects are consistent with the thermal environment. Broccoli head initiation is fastest at moderate temperatures, with optimum values of about 15–16 °C reported in temperature-response models, and the time from transplanting to head initiation increases considerably as temperatures fall toward 5 °C [5,38]. Head yield is determined mainly by the time that plants spend between 15 and 25 °C after transplanting and before harvest [11], and in south-east Queensland, temperature rather than photoperiod was found to determine broccoli yield and quality across planting dates [39]. In Fargo, monthly mean air temperatures in the open field fell from 21 to 22 °C in August to 15 °C (2023) or 21 °C (2024) in September and to 3 °C (2023) or 13 °C (2024) in October (Table S2). Plants transplanted on 10 July therefore developed during favorable temperatures and formed heads before the first frost, whereas plants transplanted on 25 August initiated heads in increasingly cold weather, developed more slowly, and were overtaken by frost. This sequence, together with cooler soils that restrict root growth [40], is consistent with the lower leaf numbers, smaller roots, lower transpiration and Fv′/Fm′, smaller heads, and much lower head formation of the last planting. The close correlations of the frost-free period with head formation (r = 0.74, r2 = 0.55) and with yield per transplanted plant (r = 0.81, r2 = 0.66) indicate that the length of the growing window after transplanting is a major constraint on fall broccoli in this region; because the frost-free period varies with planting date and environment, these correlations describe the combined effect of both factors and do not by themselves establish causation. Freezing temperatures are particularly damaging when they occur during head initiation, when −1 to −3 °C reduce head yield and −5 °C kill the growing point, whereas plants with visible small heads tolerate lower temperatures but produce heads with uneven bud size [9]. The concentration of frost injury in the 25 August planting and the failure of most open-field plants at this date to form heads are consistent with this sensitivity. In practical terms, transplanting in early July (10 July in this study) gave the highest marketable yield, transplanting in late July or early August remained acceptable (260–286 g plant−1 marketable yield), and transplanting at the end of August was not viable in either environment.
4.3. Cultivar Performance: Yield Versus Marketability
Jacaranda produced the heaviest heads, which agrees with its high yield in our spring trials [13], and its large root system is consistent with the positive association between root biomass and head weight observed here. However, three findings qualify this advantage under fall conditions. First, Jacaranda needed 77 days to reach harvest, much longer than the 50 days listed by the seed supplier (Table S1); maturity estimates from catalogs are derived from summer production and often underestimate the time required in cool autumn conditions [17,41]. As a result, Jacaranda formed no heads at the 25 August planting in either environment and, in 2023, none in the open field at the 25 July and 10 August plantings. Second, Jacaranda formed heads on only 53% of plants, and many of its heads were affected by buttoning, bolting, or frost injury, so only 48% of its plants produced a marketable head. Third, its head weight was highly variable between years at a given planting date. When yield was expressed per transplanted plant, the advantage of Jacaranda disappeared, and its marketable yield per plant was similar to that of Green Magic, Monty, and Gypsy (302 vs. 278–317 g). These three cultivars were less spectacular but more reliable: they formed heads on most plants and produced the highest proportions of U.S. No. 1 heads; in the open field, Green Magic, Gypsy, and Monty transplanted on 10 July produced only U.S. No. 1 heads. Monty, the earliest cultivar (54 days to harvest), had the largest head diameter at the 25 August planting, although it did not differ significantly from Green Magic (Figure 5c). Purple Peacock, a broccoli × kale type, combined small heads with frequent buttoning and is not suited to fall production for the fresh-head market in this region.
These differences show that yield per harvested head, the variable most often reported in cultivar trials, can overstate the value of cultivars with low head formation or poor head quality. Buttoning is typically triggered when plants beyond the juvenile stage are exposed to cold, water stress, or nutrient shortage [27]; bolting and loose heads are associated with high temperatures during head development [5,6], and frost injury reduces grade because U.S. No. 1 heads must be free of freezing damage [9,26]. Each of these defects reduced marketability in the present study, and their frequency depended on cultivar, planting date, and environment. For growers, the most relevant measures are therefore head formation, the proportion of plants with a marketable head, and marketable yield per transplanted plant, which together indicate that Green Magic, Monty, and Gypsy are the most dependable cultivars for fall production in North Dakota.
4.4. When Is a High Tunnel Advantageous?
The high tunnel created a warmer environment that increased plant height, stomatal conductance, and transpiration and delayed frost injury by 21 days in both years, consistent with the microclimate of unheated tunnels in other regions [17,18]. Its benefit, however, depended on the season and, for marketable heads, on the planting date. The tunnel increased head formation (80% vs. 58% of plants) and the percentage of plants with a marketable head (69% vs. 47%), and the advantage was largest at the 10 and 25 August plantings, when the frost-free period was most limiting (for marketable heads, environment × planting date, p = 0.008); at the 25 August planting, it also produced larger heads. Marketable yield per transplanted plant was 156 g higher in the tunnel in 2023, when sub-zero temperatures were recorded in the open field from September onward, but did not differ between environments in 2024, when the first frost injury in the open field occurred two weeks later. The tunnel advantage for marketable yield was therefore not consistent between seasons, as the sensitivity analysis also showed. The tunnel did not reduce head defects: the proportion of non-marketable heads was similar in both environments (13% vs. 18%), buttoning was about equally frequent (15% vs. 13% of harvested heads), and bolting was somewhat more frequent in the tunnel (16% vs. 10%), so that more tunnel heads were downgraded to U.S. No. 2. By keeping late-planted plants alive longer, the tunnel also allowed heads to be harvested until 19 November in 2023, some of which were frost-injured. Bolting and loose heads are associated with high temperatures during head development [5,6]; in broccoli, one week at 35 °C during floral initiation arrests inflorescence development and causes uneven bud size, and production is generally restricted to areas where summer temperatures rarely exceed 30 °C [6]. Although the tunnel was ventilated automatically above 30 °C, its air temperature reached 43.2 °C in September 2023 and 45.8 °C in August 2024 (Table S2), and such short heat peaks may have contributed to the higher incidence of bolting in the tunnel. The cultivar rankings were largely similar in the two environments: among the traits for which it was tested, the environment × cultivar interaction was significant only for root fresh weight, and the environment × planting date × cultivar interaction only for yield and marketable yield per transplanted plant, so the cultivars that performed best in the open field also performed best in the tunnel.
The economic value of a high tunnel should be assessed against these conditions. High tunnels require a substantial investment, and their production costs and labor requirements are several times higher than those of open-field production; returns therefore depend strongly on the crop, the season, and the market [42,43,44]. Our results indicate that, for fall broccoli in the Northern Great Plains, a tunnel is most valuable as frost insurance for plantings made after mid-July and in seasons with an early frost, and for extending harvest later into November (as in 2023), when locally grown broccoli is scarce. For plantings in early July, the open field produced similar percentages of marketable heads at a lower cost, and tunnel space may be better used for higher-value crops in that period. Where broccoli is grown in a tunnel in late summer, aggressive ventilation or shading should be used to keep temperatures below about 30 °C during head initiation and to limit bolting.
4.5. Failure of Romanesco to Form Curds
The complete failure of Romanesco to form curds is one of the clearest results of this study. Romanesco plants were taller than all broccoli cultivars, had root systems as large as those of Jacaranda, and did not differ from the broccoli cultivars in stomatal conductance, transpiration, WUE, or Fv′/Fm′. The absence of curds was therefore not caused by poor growth or by physiological stress detectable with leaf gas exchange, but by a failure of the transition from vegetative to reproductive development. The term blindness is used for two different phenomena in B. oleracea: the loss of the shoot apical meristem in young plants, which is often triggered by low temperatures [45], and the failure of an otherwise vegetative plant to differentiate an inflorescence [5]. Our observations correspond to the second case, because the plants continued to produce leaves until the end of the season.
In cauliflower, the transition to curd formation requires a vernalization period at moderate temperatures after a juvenile phase, and the length of this requirement differs strongly among maturity types; late and winter types need the longest inductive period and form many more leaves before curd initiation [46,47]. Curd induction is most effective at about 9–15 °C and is delayed or inhibited above about 20 °C [46,48], and non-vernalized plants may fail to form curds at 20–25 °C [49]. Romanesco is a late botrytis type (78 days to maturity according to the supplier, the longest of the six cultivars; Table S1), and it has been found to be the most sensitive cauliflower type with respect to curd defects [50]. We therefore propose, as an inference that requires experimental confirmation, that in Fargo the warm weeks after transplanting in July and August delayed the satisfaction of its vernalization requirement, and that the subsequent cool period was too short and too quickly interrupted by frost to complete curd induction and growth. The fewer leaves that Romanesco produced, compared with the broccoli cultivars, may also have delayed the end of its juvenile phase. For growers in the Northern Great Plains, these results indicate that Romanesco is not suited to fall production from July–August transplanting in either the open field or an unheated tunnel; its thermal requirements for curd induction should be established in controlled experiments before other planting dates or production systems are recommended.
4.6. Physiological Responses
The higher gs and E in the high tunnel are consistent with the warmer air and soil inside the structure, which favor stomatal opening and increase transpiration [51,52]. Instantaneous WUE is the ratio of net assimilation to transpiration and decreases when evaporative demand increases [24]; the lower WUE in the tunnel therefore reflects a higher water loss per unit of carbon gain, as indicated by the negative correlations of WUE with gs and E. The decline in E and Fv′/Fm′ with later planting is consistent with lower temperatures and irradiance late in the season, which reduce PSII efficiency in B. oleracea and other species [53,54]. Nevertheless, Fv′/Fm′ did not differ between environments or among cultivars, which suggests that the photosynthetic apparatus of broccoli was not seriously damaged by the autumn temperatures, in agreement with the relatively high chilling tolerance of broccoli transplants [55]. Cultivars differed only in gs (Gypsy > Jacaranda), and they did not differ in E, WUE, or Fv′/Fm′, so the cultivar differences in yield and marketability cannot be attributed to differences in leaf gas exchange. Many readings late in the 2023 season showed zero or negative net assimilation, which reflects low assimilation rates at cold temperatures and the sensitivity of portable gas-exchange systems to leaks and respiration under these conditions [28,29]. These readings were excluded from the WUE analysis, and the gas-exchange results should be interpreted as relative comparisons between treatments measured under the same conditions.
4.7. Trait Associations and Limitations
The multivariate analyses identified two partly independent groups of traits: one related to root size and maturity, in which Jacaranda dominated, and one related to head size and gas exchange. Head weight was closely associated with head diameter, as reported for broccoli genotypes [56], and yield per transplanted plant depended as much on head formation and marketability as on head weight. However, when the analyses were based on the means of the 80 year × environment × planting date × cultivar combinations rather than on five cultivar means, the correlations were weaker (for example, gs–WUE, r = −0.43, compared with r = −0.95 for five cultivar means in our original analysis and r = −0.86 for five cultivar means recalculated from the corrected data) and the first two principal components explained only 53% of the variation. Correlations and PCA based on very few observations are unstable and tend to overestimate the strength of relationships [37]; because the 80 combinations are not fully independent either, the multivariate results should be interpreted as exploratory, and a larger panel of genotypes would be required to generalize the trait relationships. Further limitations of this study are the use of a single high tunnel and a single open field, so that environment effects are confounded with the specific location of each production system, including differences in soil (higher pH and lower organic matter in the tunnel); the measurement of gas exchange on one plant (occasionally two) per treatment combination; monthly rather than daily temperature summaries; and the evaluation of only two seasons.
5. Conclusions
Cultivar and planting date were the most consistent sources of variation in fall broccoli in North Dakota, and the planting-date and environment effects were closely associated with the length of the frost-free period after transplanting. Transplanting in early July (10 July in this study) gave the highest marketable yield, and transplanting at the end of August was not viable. Jacaranda produced the heaviest heads but had low head formation, few plants with marketable heads, and a long time to harvest, so its marketable yield per transplanted plant was not higher than that of Green Magic, Monty, and Gypsy, which were the most reliable cultivars. Purple Peacock was poorly adapted to fall production, and Romanesco, which formed no curds, is not suited to fall production from July–August transplanting in this region, possibly because its thermal requirements for curd induction were not met before frost. The high tunnel delayed frost injury by three weeks and increased head formation and marketable heads (the latter mainly at late plantings) and marketable yield per transplanted plant in the season with an early frost, whereas it offered no advantage in marketable heads for early-July plantings and did not reduce head defects. High tunnels should therefore be used mainly to protect late plantings from frost and must be ventilated effectively in late summer. Future studies should evaluate additional seasons and genotypes, quantify the thermal requirements of Romanesco and other late cultivars, and assess the economic return of tunnel production for fall brassicas.
Supplementary Materials
The following supporting information can be downloaded at: https://www.mdpi.com/article/10.3390/horticulturae12111361/s1, Figure S1: Experimental sites: open field (left) and high tunnel (right) at the NDSU Agricultural Experiment Station, Fargo, ND; Table S1: Cultivars, seed source, and days to maturity; Table S2: Monthly air and soil temperatures, dates of first observed frost injury, and dates of last harvest in the high tunnel and the open field in 2023 and 2024; Table S3: Data corrections and exclusions; Table S4: Results of the sensitivity analysis with year and year × treatment interactions as random effects; Table S5: Quadratic regression coefficients for plant height and leaf number; Table S6: Root traits by environment, planting date, cultivar, and year; Table S7: Comparison of Romanesco with the broccoli cultivars (Dunnett’s test).
Author Contributions
Conceptualization, H.H.-V. and A.D.; methodology, H.H.-V. and A.D.; validation, H.H.-V., A.D. and O.K.; formal analysis, A.D. and O.K.; investigation, A.D. and S.S.; resources, A.D. and S.S.; data curation, A.D., O.K. and S.S.; writing—original draft preparation, A.D., S.S., O.K. and H.H.-V.; writing—review and editing, A.D., S.S., O.K. and H.H.-V.; supervision, H.H.-V.; project administration, H.H.-V.; funding acquisition, H.H.-V. All authors have read and agreed to the published version of the manuscript.
Funding
This study received partial financial support from the North Dakota Specialty Crop Block Grant Program (Grant No. NOGA 22-224).
Data Availability Statement
The data presented in this study, including the cleaned data set and the analysis scripts, are available upon reasonable request from the corresponding author.
Acknowledgments
The authors would like to thank Collin Auwarter, the High-value Crops Project Research Specialist, and project graduate students for their research assistance.
Conflicts of Interest
The authors declare no conflict of interest.
References
- Kapusta-Duch, J.; Szeląg-Sikora, A.; Sikora, J.; Niemiec, M.; Gródek-Szostak, Z.; Kuboń, M.; Leszczyńska, T.; Borczak, B. Health-Promoting Properties of Fresh and Processed Purple Cauliflower. Sustainability 2019, 11, 4008. [Google Scholar] [CrossRef] [Scilit]
- Wu, X.; Beecher, G.R.; Holden, J.M.; Haytowitz, D.B.; Gebhardt, S.E.; Prior, R.L. Lipophilic and Hydrophilic Antioxidant Capacities of Common Foods in the United States. J. Agric. Food Chem. 2004, 52, 4026–4037. [Google Scholar] [CrossRef] [Scilit] [PubMed]
- Podsędek, A. Natural Antioxidants and Antioxidant Capacity of Brassica Vegetables: A Review. LWT Food Sci. Technol. 2007, 40, 1–11. [Google Scholar] [CrossRef] [Scilit]
- Jahangir, M.; Kim, H.K.; Choi, Y.H.; Verpoorte, R. Health-Affecting Compounds in Brassicaceae. Compr. Rev. Food Sci. Food Saf. 2009, 8, 31–43. [Google Scholar] [CrossRef] [Scilit]
- Siomos, A.S.; Koularmanis, K.; Tsouvaltzis, P. The Impacts of the Emerging Climate Change on Broccoli (Brassica oleracea L. var. italica Plenck.) Crop. Horticulturae 2022, 8, 1032. [Google Scholar] [CrossRef] [Scilit]
- Björkman, T.; Pearson, K.J. High Temperature Arrest of Inflorescence Development in Broccoli (Brassica oleracea var. italica L.). J. Exp. Bot. 1998, 49, 101–106. [Google Scholar] [CrossRef]
- Batool, I.; Ayyaz, A.; Qin, T.; Wu, X.; Chen, W.; Hannan, F.; Zafar, Z.U.; Naeem, M.S.; Farooq, M.A.; Zhou, W. Morphological, Physiological, and Molecular Responses to Heat Stress in Brassicaceae. Plants 2025, 14, 152. [Google Scholar] [CrossRef] [Scilit] [PubMed]
- Koularmanis, K.; Tsouvaltzis, P.; Siomos, A. Impact of Elevated Temperature and Solar Radiation on Broccoli (Brassica oleraceae var. italica Plenck) Cultivation. Horticulturae 2025, 11, 187. [Google Scholar] [CrossRef] [Scilit]
- Tan, D.K.Y.; Joyce, D.C.; Wearing, A.H.; Rickert, K.G.; Birch, C.J. Freeze-Induced Reduction of Broccoli Yield and Quality. Aust. J. Exp. Agric. 1999, 39, 771–780. [Google Scholar] [CrossRef] [Scilit]
- Prasad, P.V.V.; Staggenborg, S.A.; Ristic, Z. Impacts of Drought and/or Heat Stress on Physiological, Developmental, Growth, and Yield Processes of Crop Plants. In Response of Crops to Limited Water: Understanding and Modeling Water Stress Effects on Plant Growth Processes; Ahuja, L.R., Reddy, V.R., Saseendran, S.A., Yu, Q., Eds.; Advances in Agricultural Systems Modeling; ASA, CSSA, SSSA: Madison, WI, USA, 2008; Volume 1, pp. 301–355. [Google Scholar] [CrossRef] [Scilit]
- Kałużewicz, A.; Krzesiński, W.; Knaflewski, M. Effect of Temperature on the Yield and Quality of Broccoli Heads. Veg. Crops Res. Bull. 2009, 71, 51–58. [Google Scholar] [CrossRef] [Scilit]
- Dhukuchhu, A.; Kaya, O.; Hatterman-Valenti, H. Planting Date and Cultivar Selection Effects on Cauliflower Growth, Physiology, and Yield Performance in North Dakota Growing Conditions. Horticulturae 2025, 11, 1314. [Google Scholar] [CrossRef] [Scilit]
- Dhukuchhu, A.; Ghimire, B.; Khan, A.; Hatterman-Valenti, H. Broccoli Growth, Physiology, and Yield Response to Planting Date and Cultivar under North Dakota Conditions. HortScience 2026, 61, 588–600. [Google Scholar] [CrossRef] [Scilit]
- Dai, S.; Shulski, M.D.; Hubbard, K.G.; Takle, E.S. A Spatiotemporal Analysis of Midwest US Temperature and Precipitation Trends during the Growing Season from 1980 to 2013. Int. J. Climatol. 2016, 36, 517–525. [Google Scholar] [CrossRef] [Scilit]
- Carey, E.E.; Jett, L.; Lamont, W.J.; Nennich, T.T.; Orzolek, M.D.; Williams, K.A. Horticultural Crop Production in High Tunnels in the United States: A Snapshot. HortTechnology 2009, 19, 37–43. [Google Scholar] [CrossRef] [Scilit]
- Bruce, A.B.; Farmer, J.R.; Maynard, E.T.; Valliant, J.C.D. Using High Tunnels to Extend the Growing Season and Improve Crop Quality and Yield: Assessing Outcomes for Organic and Conventional Growers in the U.S. Midwest. Int. J. Agric. Manag. 2019, 8, 45–55. [Google Scholar] [CrossRef]
- O’Connell, S.; Tate, R. Winter Broccoli and Cauliflower under Organic High Tunnels in a Humid, Subtropical Climate. HortScience 2017, 52, 1511–1517. [Google Scholar] [CrossRef] [Scilit]
- Blomgren, T.; Frisch, T. High Tunnels: Using Low-Cost Technology to Increase Yields, Improve Quality and Extend the Season; University of Vermont Center for Sustainable Agriculture: Burlington, VT, USA, 2007; Available online: https://www.sare.org/wp-content/uploads/HighTunnels_UVM.pdf (accessed on 15 October 2026).
- Martin, C.A.; Sideman, R.G. Survival and Yields of Fall-Planted Winter Sprouting Broccoli Grown in High Tunnels for Spring Harvest in the Northeastern United States. HortTechnology 2012, 22, 345–352. [Google Scholar] [CrossRef] [Scilit]
- Guan, W. Fall Broccoli Production in High Tunnels. In Vegetable Crops Hotline; Purdue University: West Lafayette, IN, USA, 2017; Available online: https://vegcropshotline.org/?p=4287 (accessed on 15 October 2026).
- Dhukuchhu, A.; Kaya, O.; Hatterman-Valenti, H. Cauliflower Yield, Growth, and Physiological Responses to Environments, Fall Planting Dates, and Cultivars in North Dakota. Horticulturae 2026, 12, 318. [Google Scholar] [CrossRef] [Scilit]
- USDA Agricultural Research Service. 2023 USDA Plant Hardiness Zone Map. Available online: https://planthardiness.ars.usda.gov/ (accessed on 15 October 2026).
- USDA Soil Conservation Service. Soil Survey of Cass County Area, North Dakota; USDA Soil Conservation Service in cooperation with the North Dakota Agricultural Experiment Station: Washington, DC, USA, 1985. Available online: https://archive.org/details/CassND1983 (accessed on 15 October 2026).
- Hatfield, J.L.; Dold, C. Water-Use Efficiency: Advances and Challenges in a Changing Climate. Front. Plant Sci. 2019, 10, 103. [Google Scholar] [CrossRef] [Scilit] [PubMed]
- Baker, N.R. Chlorophyll Fluorescence: A Probe of Photosynthesis In Vivo. Annu. Rev. Plant Biol. 2008, 59, 89–113. [Google Scholar] [CrossRef] [Scilit] [PubMed]
- USDA Agricultural Marketing Service. United States Standards for Grades of Italian Sprouting Broccoli; USDA AMS: Washington, DC, USA, 2006. Available online: https://www.ams.usda.gov/sites/default/files/media/Broccoli%2C_Italian_Sprouting_Standard%5B1%5D.pdf (accessed on 15 October 2026).
- UC Statewide IPM Program. Buttoning in Broccoli and Cauliflower; University of California Agriculture and Natural Resources. Available online: https://ipm.ucanr.edu/home-and-landscape/buttoning-in-broccoli-and-cauliflower/ (accessed on 15 October 2026).
- Long, S.P.; Bernacchi, C.J. Gas Exchange Measurements, What Can They Tell Us about the Underlying Limitations to Photosynthesis? Procedures and Sources of Error. J. Exp. Bot. 2003, 54, 2393–2401. [Google Scholar] [CrossRef] [Scilit] [PubMed]
- Wang, Q.; Fleisher, D.H.; Timlin, D.; Reddy, V.R.; Chun, J.A. Quantifying the Measurement Errors in a Portable Open Gas-Exchange System and Their Effects on the Parameterization of Farquhar et al. Model for C3 Leaves. Photosynthetica 2012, 50, 223–238. [Google Scholar] [CrossRef] [Scilit]
- R Core Team. R: A Language and Environment for Statistical Computing, Version 4.3.3; R Foundation for Statistical Computing: Vienna, Austria, 2024; Available online: https://www.R-project.org/ (accessed on 15 October 2026).
- Bates, D.; Mächler, M.; Bolker, B.; Walker, S. Fitting Linear Mixed-Effects Models Using lme4. J. Stat. Softw. 2015, 67, 1–48. [Google Scholar] [CrossRef] [Scilit]
- Kuznetsova, A.; Brockhoff, P.B.; Christensen, R.H.B. lmerTest Package: Tests in Linear Mixed Effects Models. J. Stat. Softw. 2017, 82, 1–26. [Google Scholar] [CrossRef] [Scilit]
- Lenth, R.V. Emmeans: Estimated Marginal Means, Aka Least-Squares Means. R Package Version 1.10.0. 2024. Available online: https://CRAN.R-project.org/package=emmeans (accessed on 15 October 2026).
- Hothorn, T.; Bretz, F.; Westfall, P. Simultaneous Inference in General Parametric Models. Biom. J. 2008, 50, 346–363. [Google Scholar] [CrossRef] [Scilit] [PubMed]
- Bolker, B.M.; Brooks, M.E.; Clark, C.J.; Geange, S.W.; Poulsen, J.R.; Stevens, M.H.H.; White, J.-S.S. Generalized Linear Mixed Models: A Practical Guide for Ecology and Evolution. Trends Ecol. Evol. 2009, 24, 127–135. [Google Scholar] [CrossRef] [Scilit] [PubMed]
- Blouin, D.C.; Webster, E.P.; Bond, J.A. On the Analysis of Combined Experiments. Weed Technol. 2011, 25, 165–169. [Google Scholar] [CrossRef] [Scilit]
- Schönbrodt, F.D.; Perugini, M. At What Sample Size Do Correlations Stabilize? J. Res. Pers. 2013, 47, 609–612. [Google Scholar] [CrossRef] [Scilit]
- Kałużewicz, A.; Krzesiński, W.; Knaflewski, M.; Lisiecka, J.; Spiżewski, T.; Frąszczak, B. Broccoli (Brassica oleracea var. italica) Head Initiation Under Field Conditions. Acta Agrobot. 2012, 65, 93–98. [Google Scholar] [CrossRef] [Scilit][Green Version]
- Tan, D.K.Y.; Wearing, A.H.; Rickert, K.G.; Birch, C.J. Broccoli Yield and Quality Can Be Determined by Cultivar and Temperature but Not Photoperiod in South-East Queensland. Aust. J. Exp. Agric. 1999, 39, 901–909. [Google Scholar] [CrossRef] [Scilit]
- Calleja-Cabrera, J.; Boter, M.; Oñate-Sánchez, L.; Pernas, M. Root Growth Adaptation to Climate Change in Crops. Front. Plant Sci. 2020, 11, 544. [Google Scholar] [CrossRef] [Scilit] [PubMed]
- Wurr, D.C.E.; Fellows, J.R.; Hiron, R.W.P. Relationships Between the Times of Transplanting, Curd Initiation and Maturity in Cauliflower. J. Agric. Sci. 1990, 114, 193–199. [Google Scholar] [CrossRef] [Scilit]
- Galinato, S.P.; Miles, C.A. Economic Profitability of Growing Lettuce and Tomato in Western Washington Under High Tunnel and Open-Field Production Systems. HortTechnology 2013, 23, 453–461. [Google Scholar] [CrossRef] [Scilit]
- Waldman, K.B.; Conner, D.S.; Biernbaum, J.A.; Hamm, M.W.; Montri, A.D. Determinants of Hoophouse Profitability: A Case Study of 12 Novice Michigan Farmers. HortTechnology 2012, 22, 215–223. [Google Scholar] [CrossRef] [Scilit]
- Conner, D.; Montri, A.; Waldman, K.; Biernbaum, J.; Hamm, M.W. Hoophouse Contributions to Farm Profitability and Food System Sustainability: Lessons from Michigan. J. Ext. 2011, 49, 32. [Google Scholar] [CrossRef] [Scilit]
- de Jonge, J.; Kodde, J.; Severing, E.I.; Bonnema, G.; Angenent, G.C.; Immink, R.G.H.; Groot, S.P.C. Low Temperature Affects Stem Cell Maintenance in Brassica oleracea Seedlings. Front. Plant Sci. 2016, 7, 800. [Google Scholar] [CrossRef] [Scilit] [PubMed]
- Wurr, D.C.E.; Fellows, J.R. Temperature Influences on the Plant Development of Different Maturity Types of Cauliflower. Acta Hortic. 2000, 539, 69–74. [Google Scholar] [CrossRef] [Scilit]
- Matschegewski, C.; Zetzsche, H.; Hasan, Y.; Leibeguth, L.; Briggs, W.; Ordon, F.; Uptmoor, R. Genetic Variation of Temperature-Regulated Curd Induction in Cauliflower: Elucidation of Floral Transition by Genome-Wide Association Mapping and Gene Expression Analysis. Front. Plant Sci. 2015, 6, 720. [Google Scholar] [CrossRef] [Scilit] [PubMed]
- Rosen, A.; Hasan, Y.; Briggs, W.; Uptmoor, R. Genome-Based Prediction of Time to Curd Induction in Cauliflower. Front. Plant Sci. 2018, 9, 78. [Google Scholar] [CrossRef] [Scilit] [PubMed]
- Fujime, Y.; Hirose, T. Studies on Thermal Conditions of Curd Formation and Development in Cauliflower and Broccoli. I. Effects of Low Temperature Treatment of Seeds. J. Jpn. Soc. Hortic. Sci. 1979, 48, 82–90. [Google Scholar] [CrossRef] [Scilit]
- Cebula, S. The Effect of Pot Size and Transplant Age on the Yield and Quality of White, Green and Romanesco Cauliflower Curds. J. Fruit Ornam. Plant Res. 2009, 70, 101–110. [Google Scholar] [CrossRef] [Scilit]
- Driesen, E.; Van den Ende, W.; De Proft, M.; Saeys, W. Influence of Environmental Factors Light, CO2, Temperature, and Relative Humidity on Stomatal Opening and Development: A Review. Agronomy 2020, 10, 1975. [Google Scholar] [CrossRef] [Scilit]
- Sadok, W.; Lopez, J.R.; Smith, K.P. Transpiration Increases under High-Temperature Stress: Potential Mechanisms, Trade-Offs and Prospects for Crop Resilience in a Warming World. Plant Cell Environ. 2021, 44, 2102–2116. [Google Scholar] [CrossRef] [Scilit] [PubMed]
- Rodríguez, V.M.; Soengas, P.; Alonso-Villaverde, V.; Sotelo, T.; Cartea, M.E.; Velasco, P. Effect of Temperature Stress on the Early Vegetative Development of Brassica oleracea L. BMC Plant Biol. 2015, 15, 145. [Google Scholar] [CrossRef] [Scilit] [PubMed]
- Neri, P.; Gu, L.; Song, Y. The Effect of Temperature on Photosystem II Efficiency across Plant Functional Types and Climate. Biogeosciences 2024, 21, 2731–2758. [Google Scholar] [CrossRef] [Scilit]
- Wojciechowska, R.; Kalisz, A.; Sękara, A.; Nosek, M.; Cebula, S.; Miszalski, Z.; Kunicki, E.; Grabowska, A. Alterations in Chlorophyll a Fluorescence and Pigments Concentration in the Leaves of Cauliflower and Broccoli Transplants Subjected to Chilling. Not. Bot. Horti Agrobot. Cluj-Napoca 2016, 44, 17–24. [Google Scholar] [CrossRef] [Scilit]
- Nandhini, D.; Arumugam, T.; Ganesan, K.N.; Subramanian, K.S.; Lourdusamy, D.K. Determining the Contribution of Different Yield Components in Broccoli (Brassica oleracea var. italica L.) Through Character Association. J. Pharmacogn. Phytochem. 2019, 8, 1508–1512. [Google Scholar]
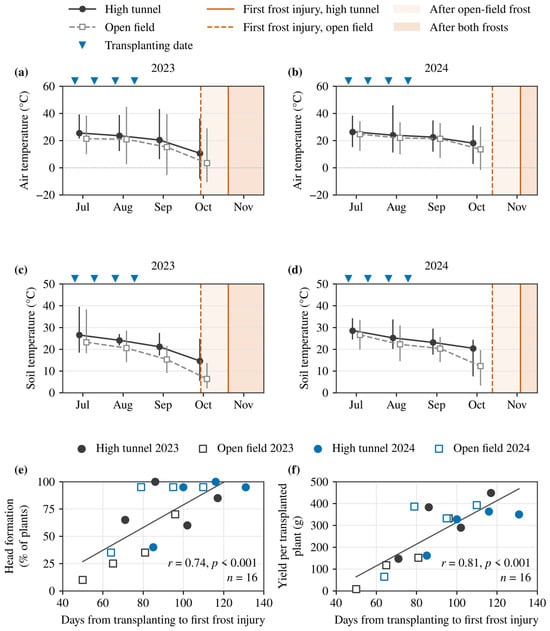
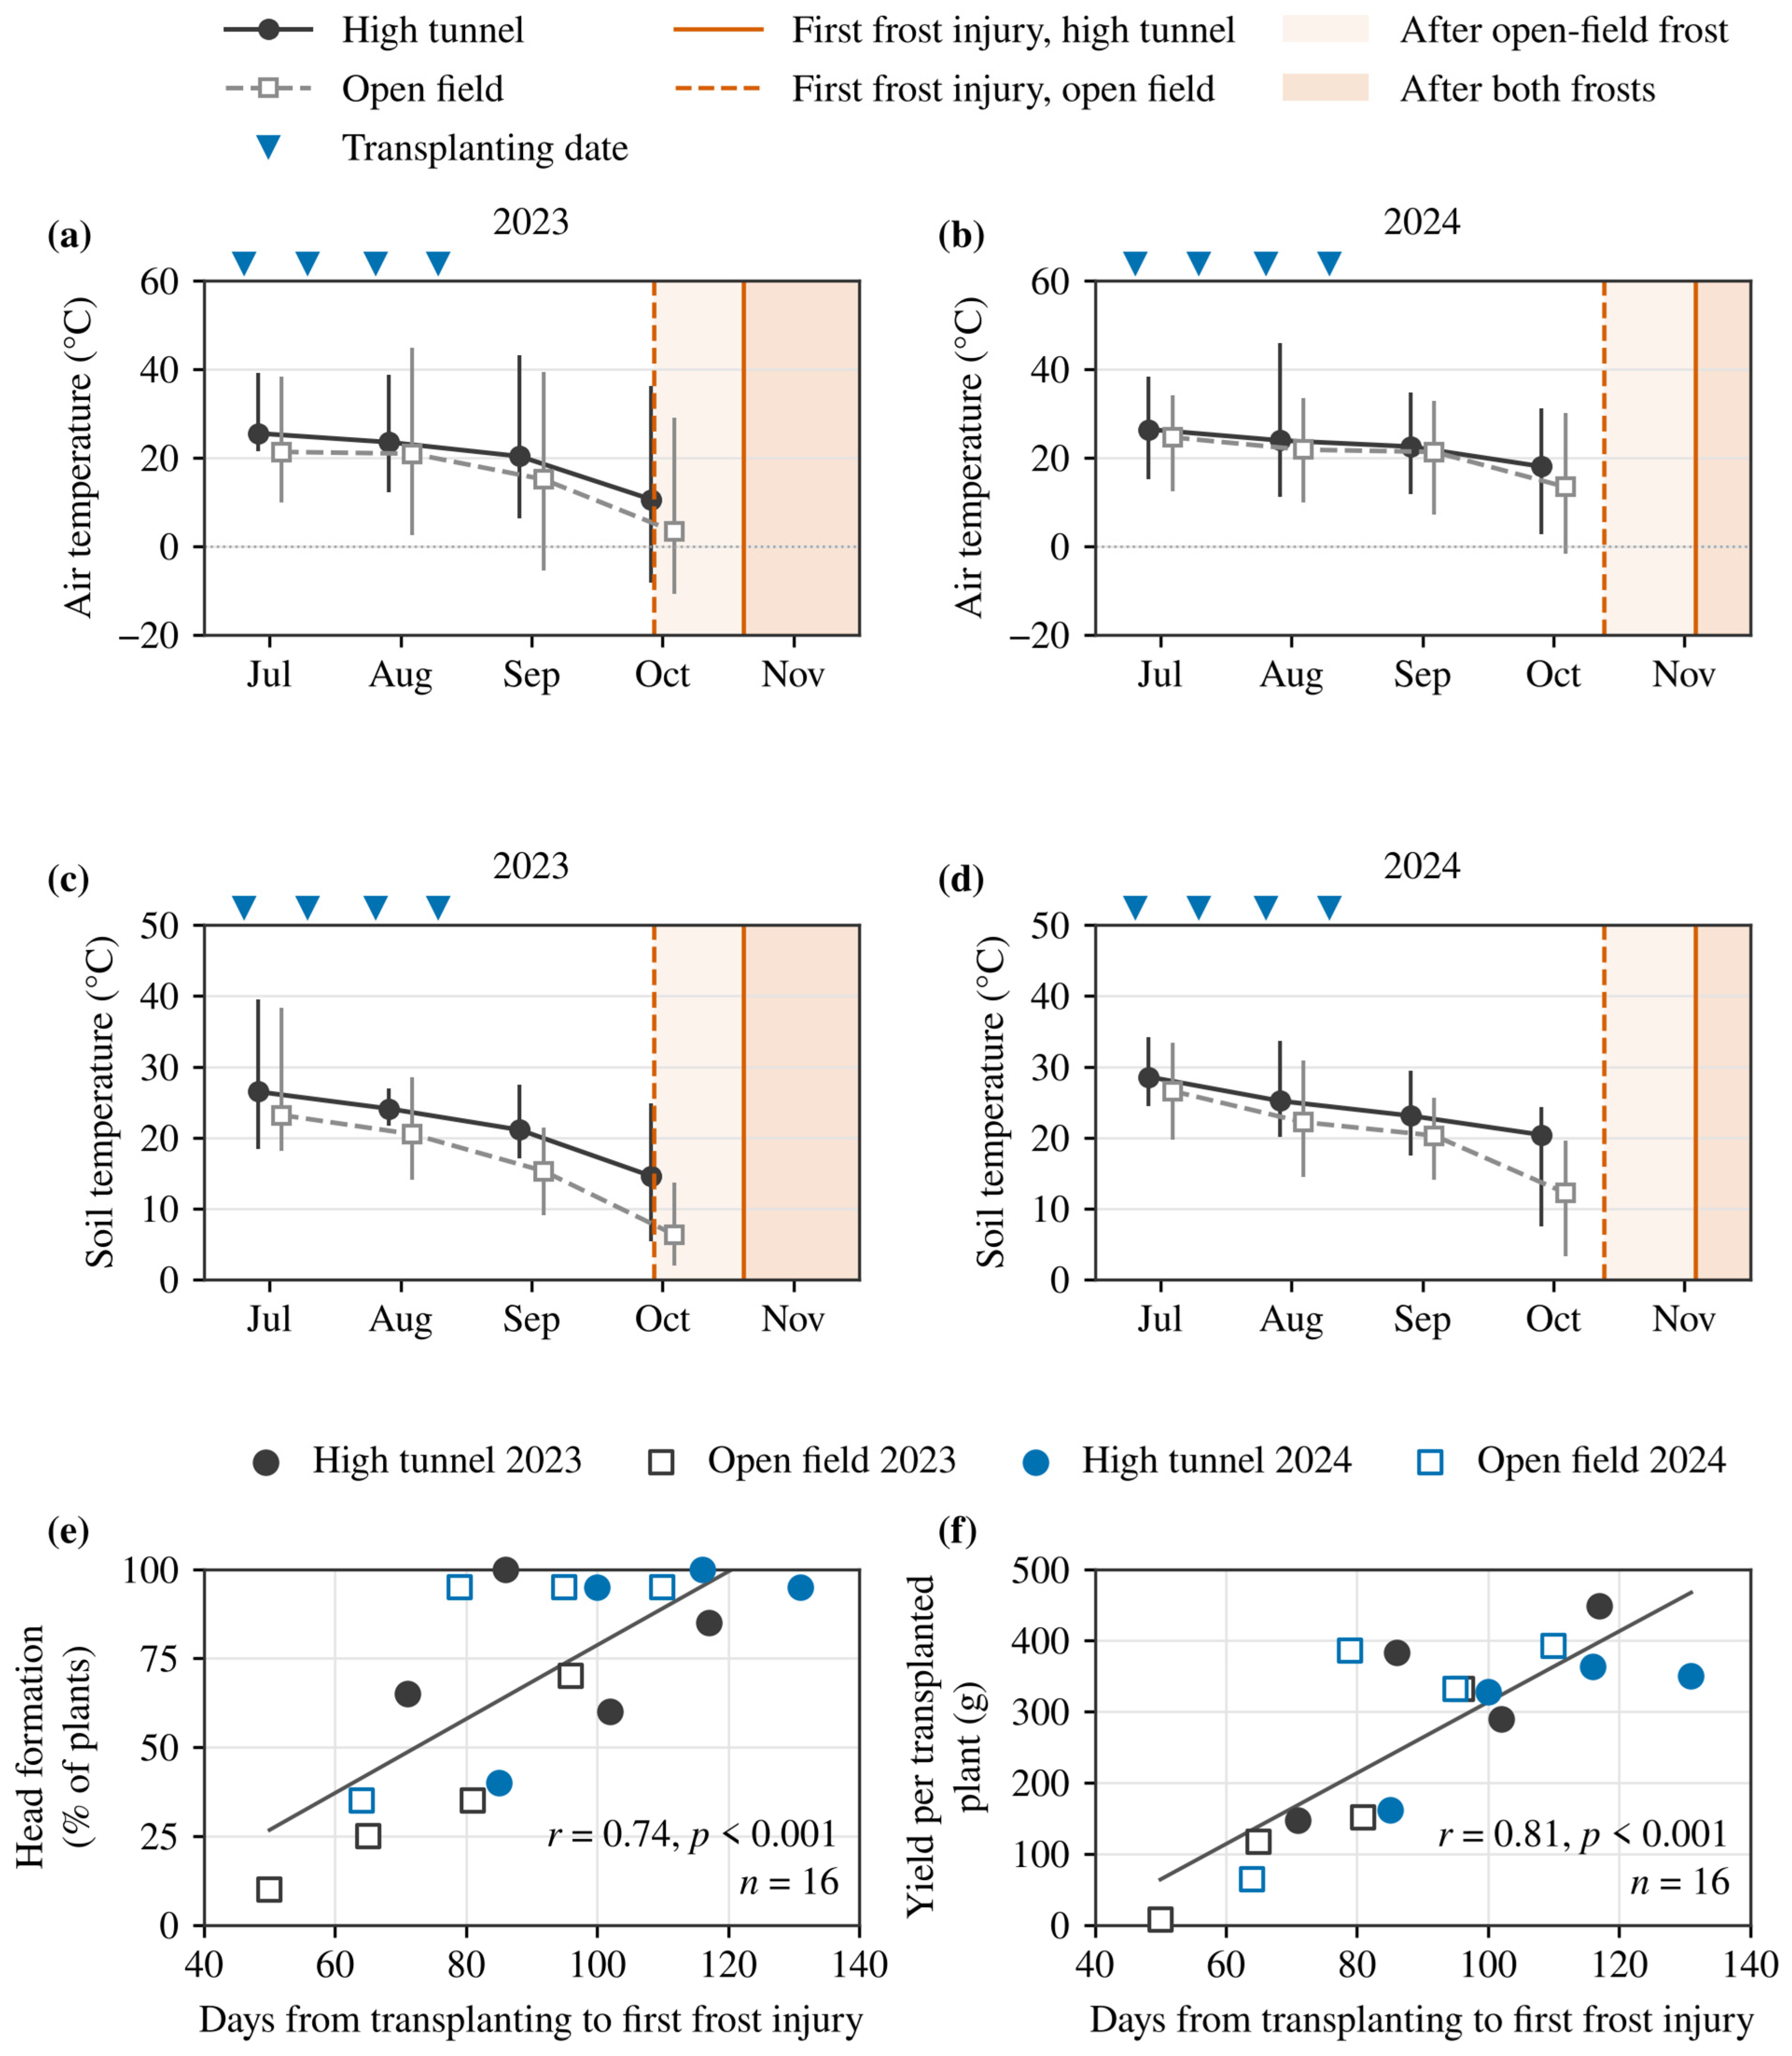
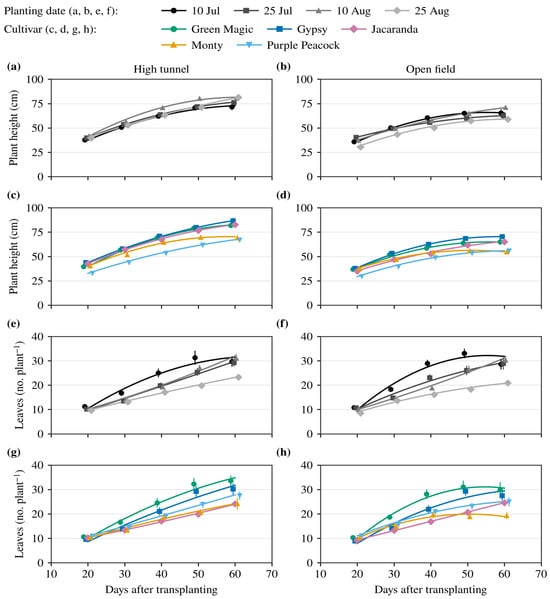
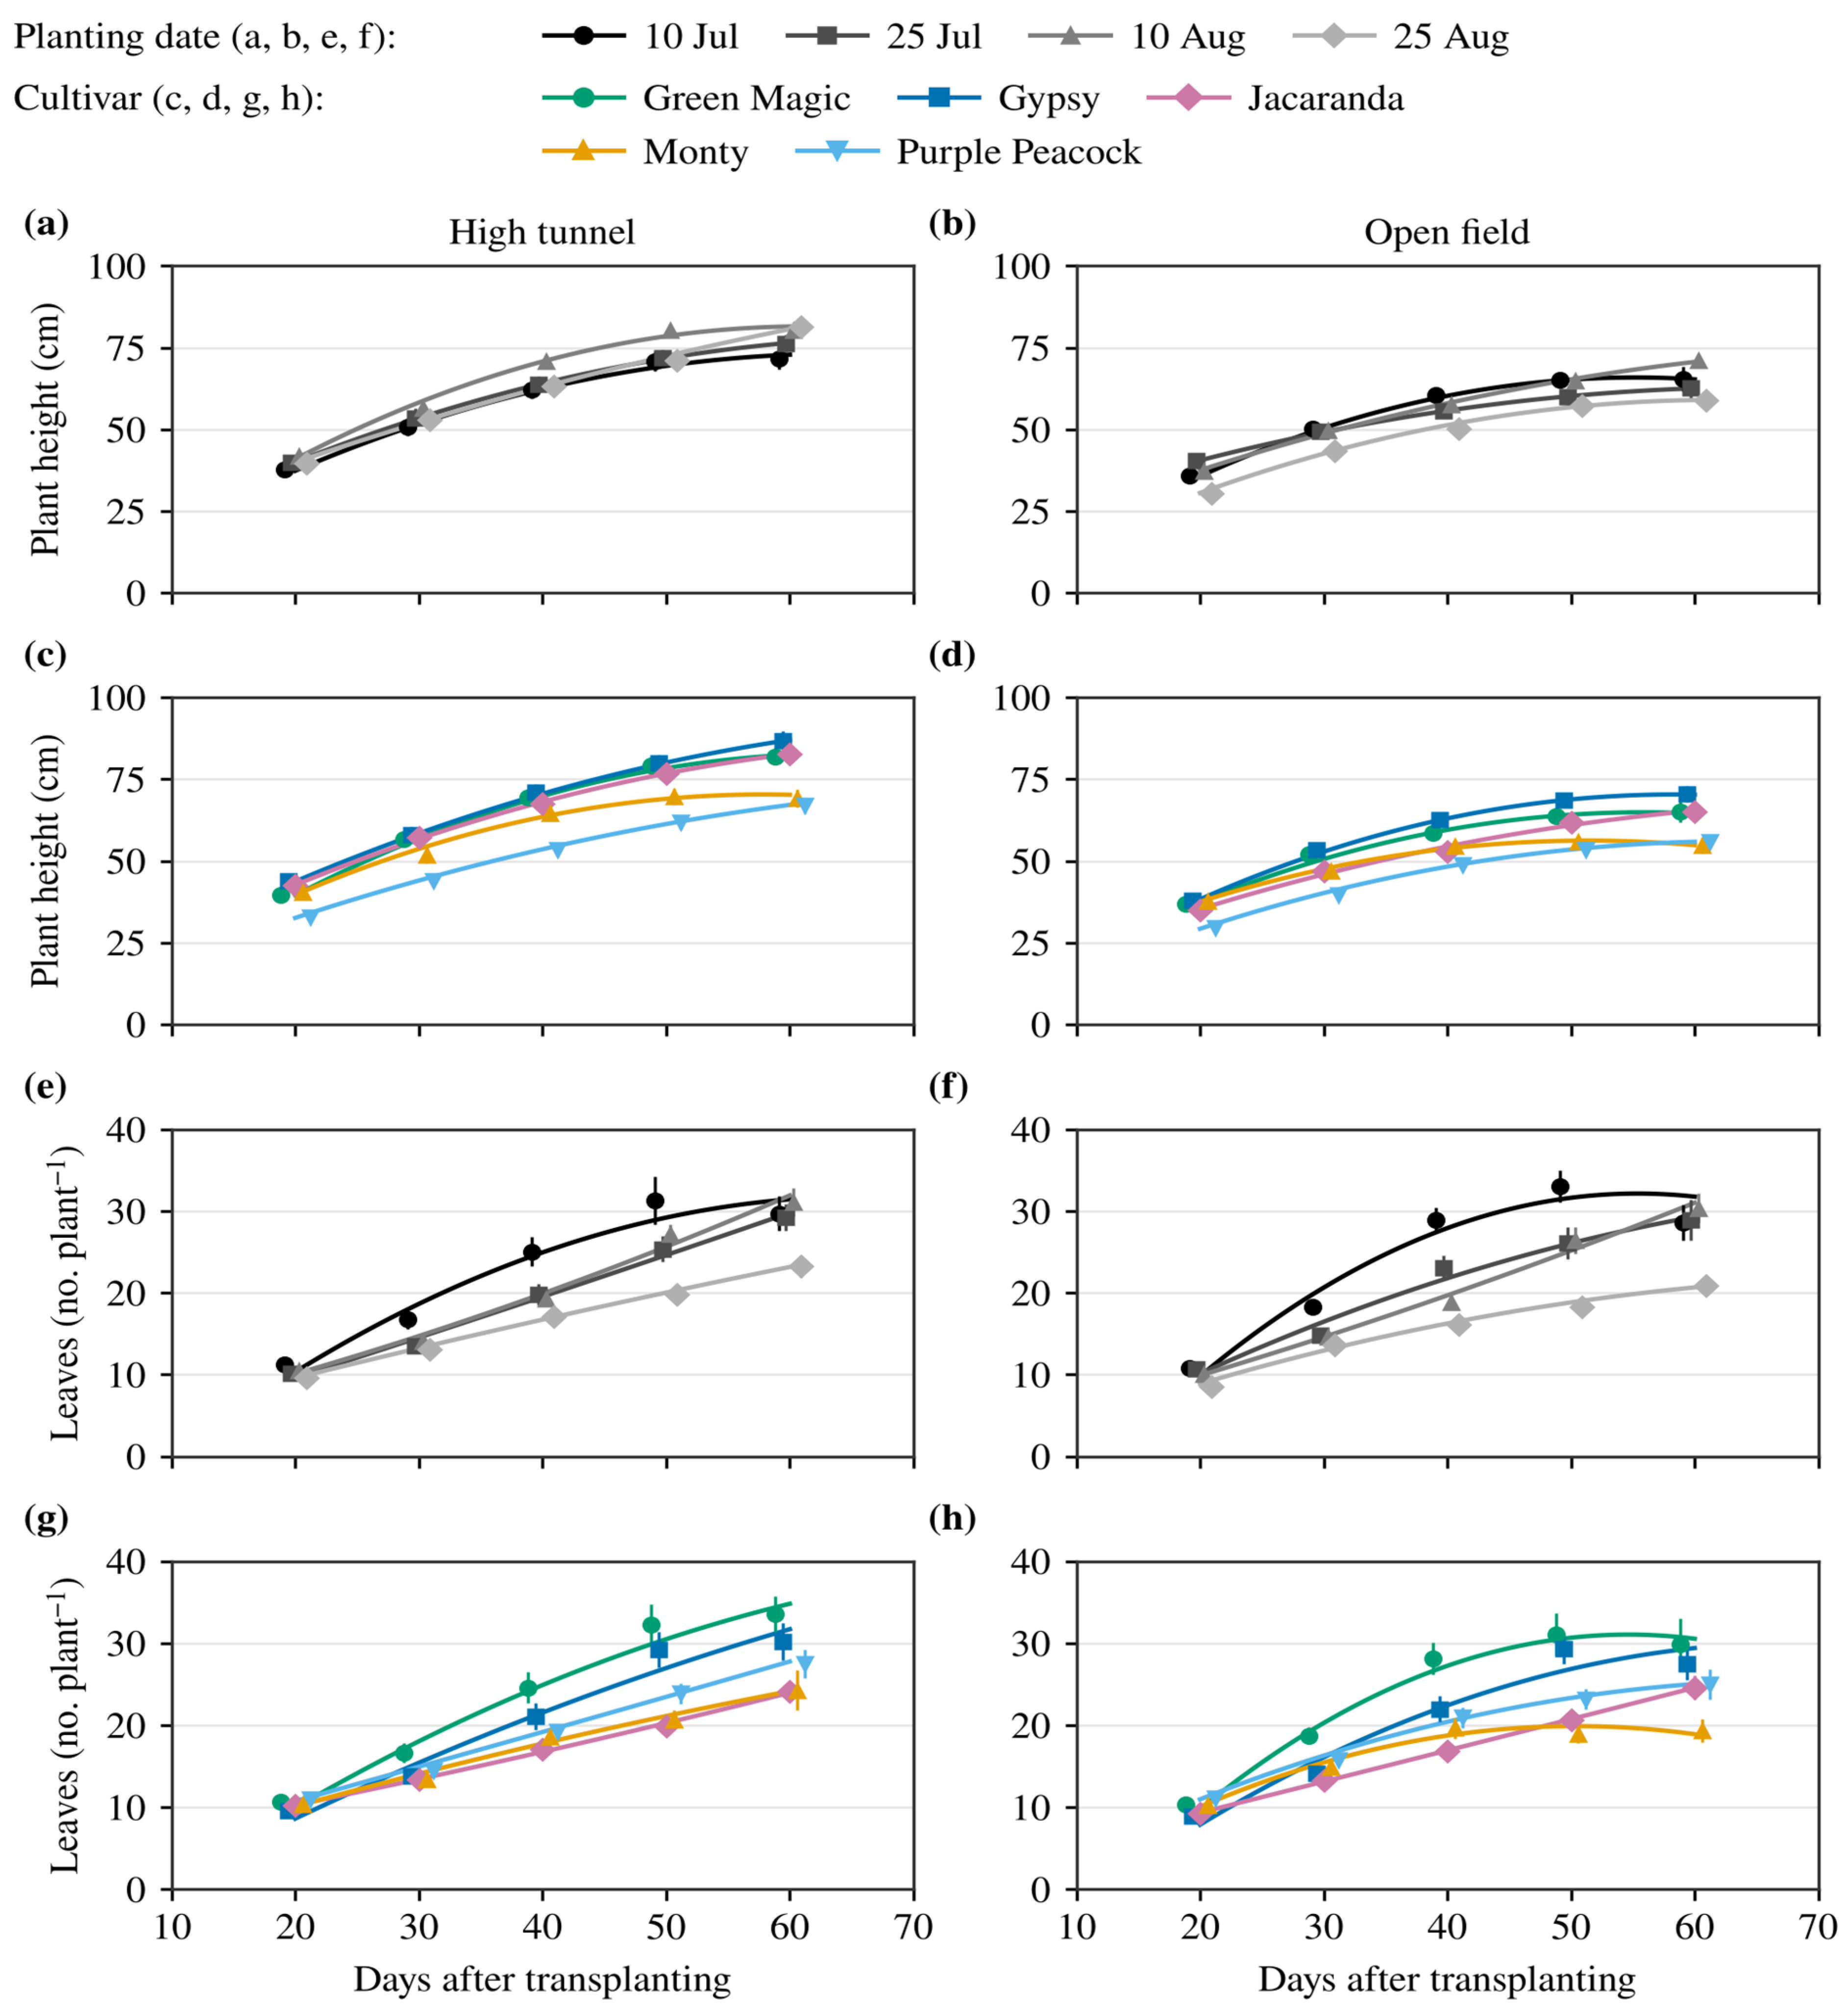
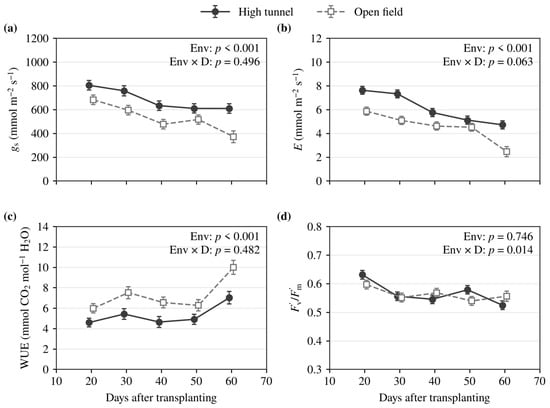
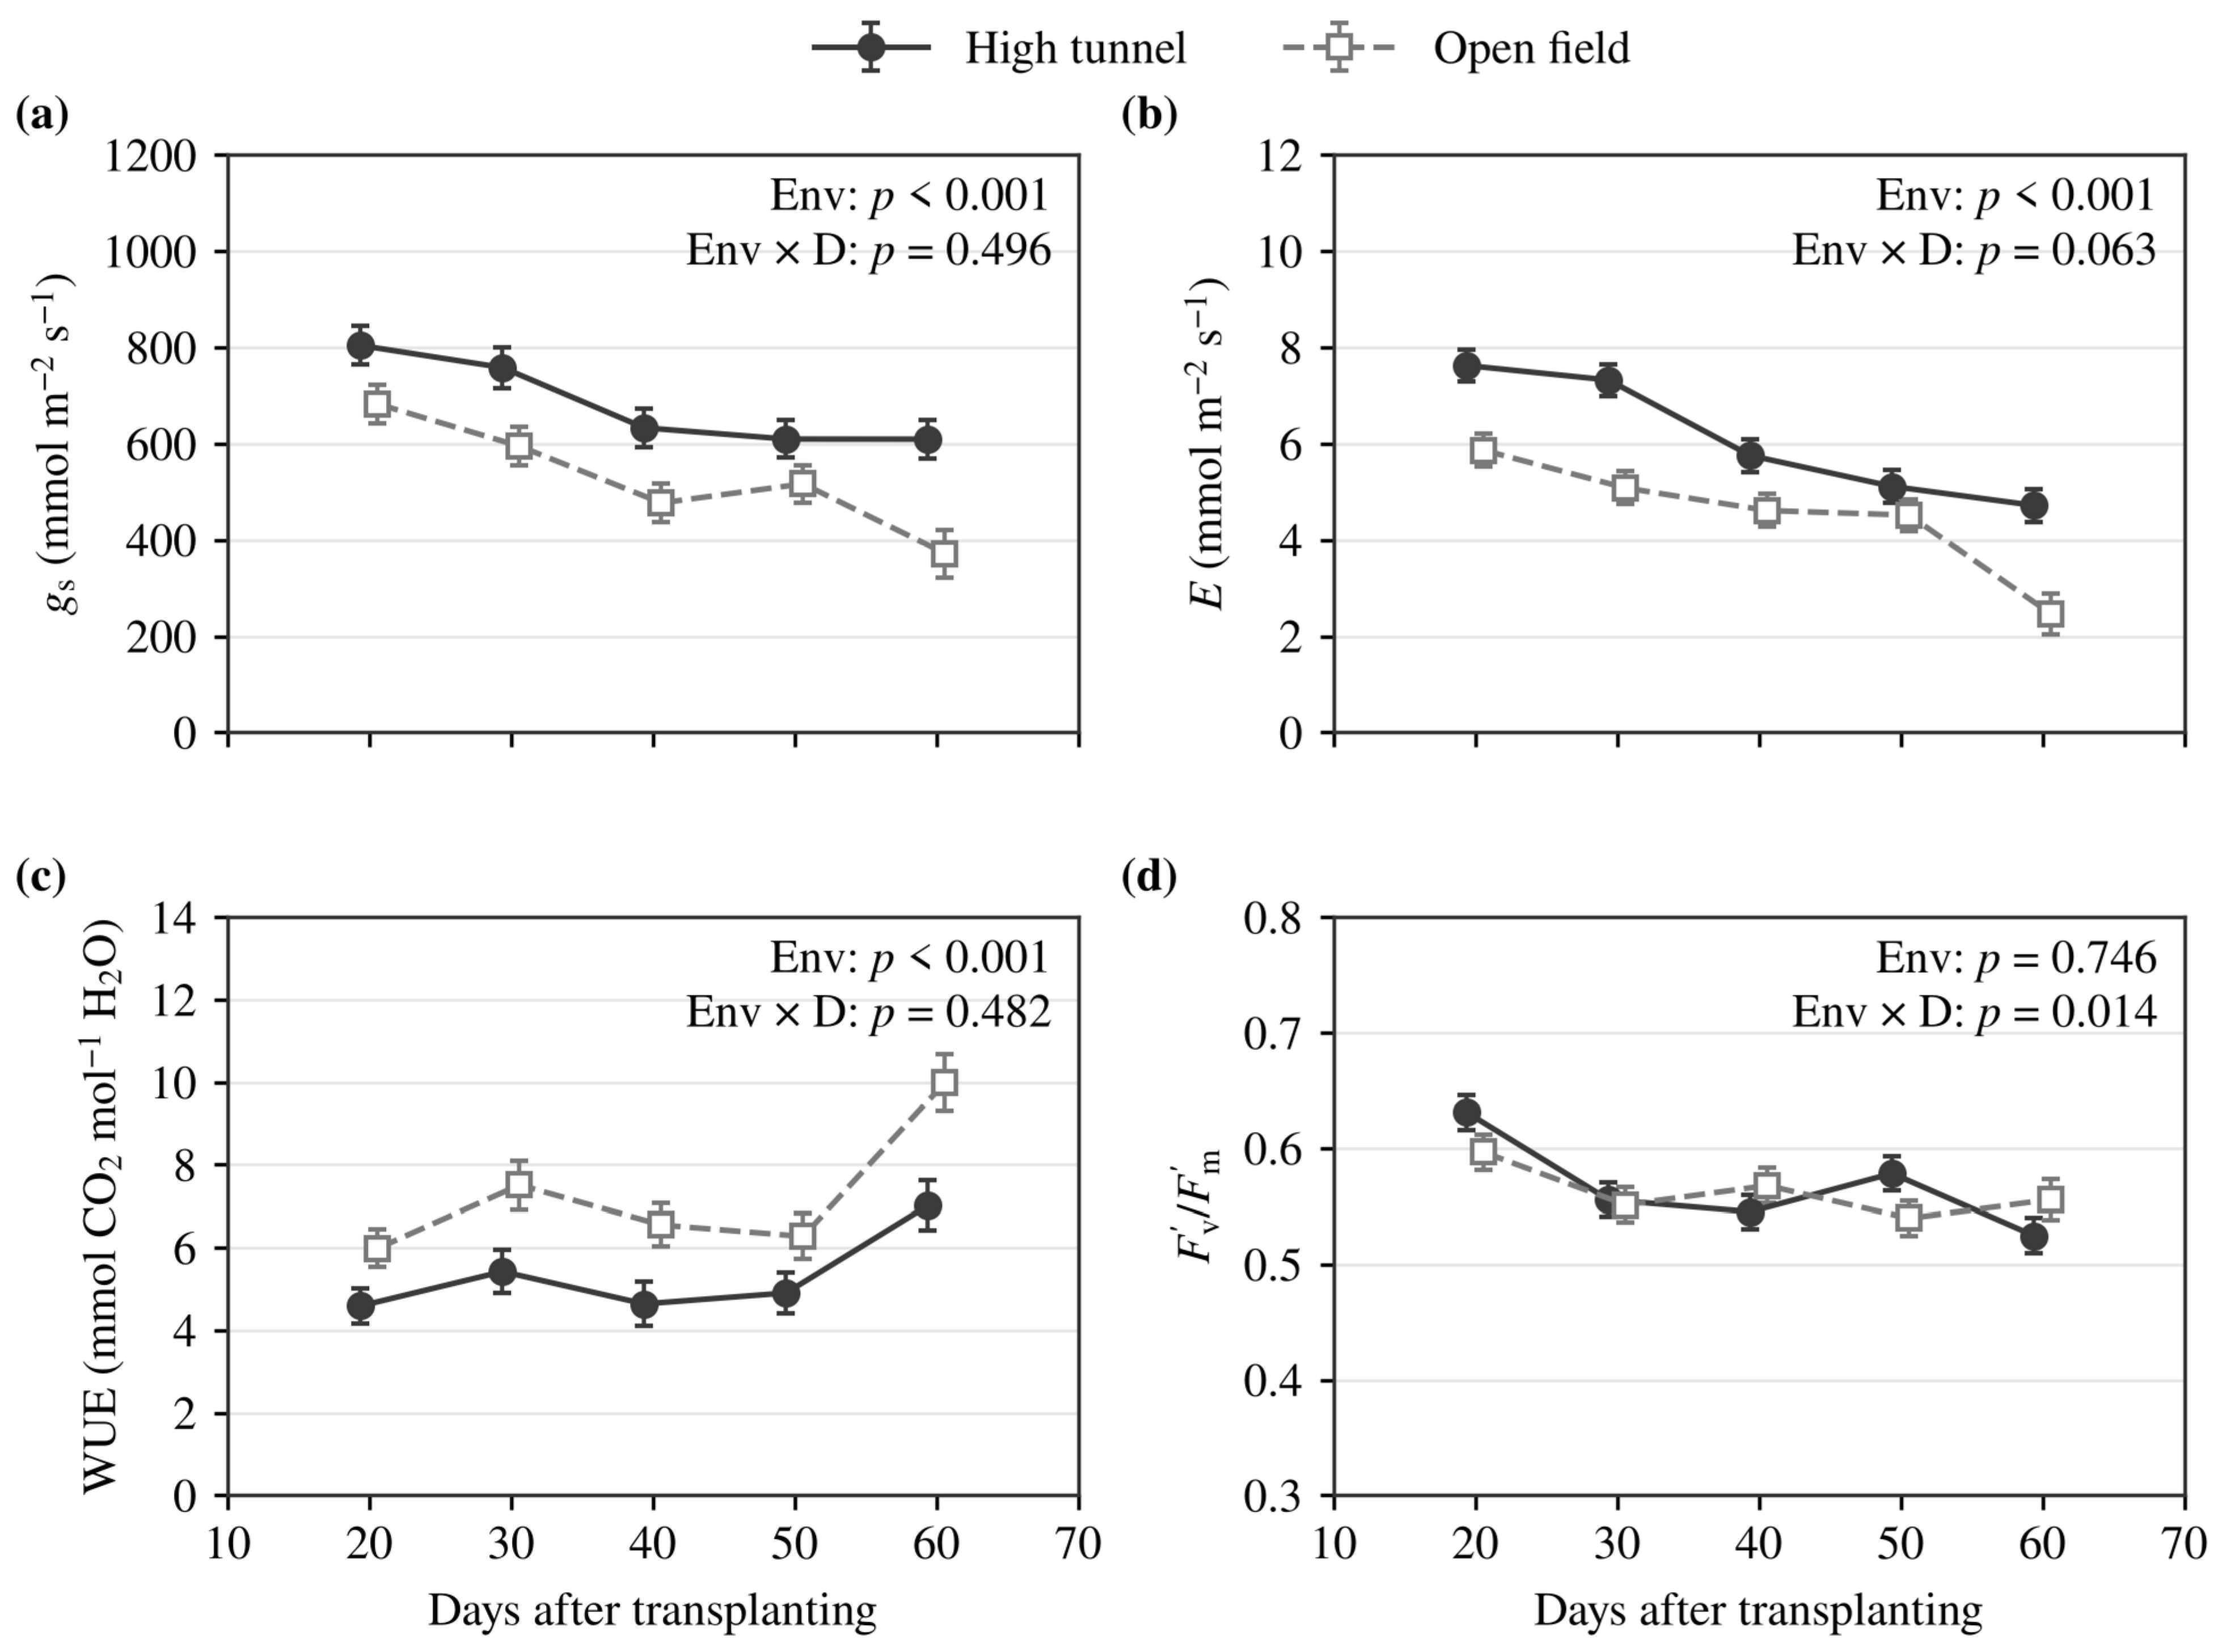
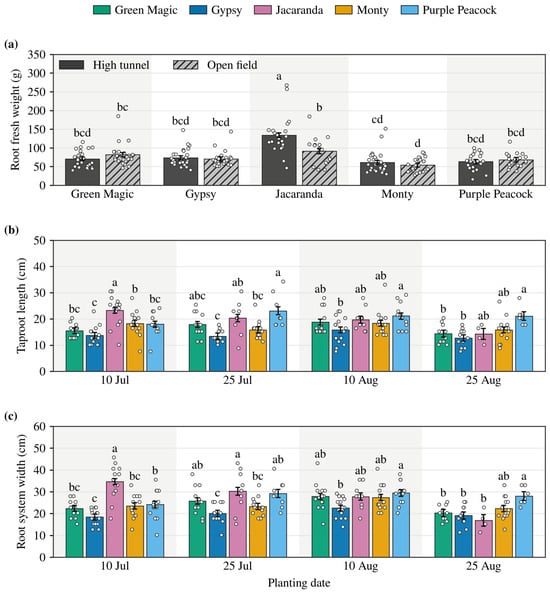
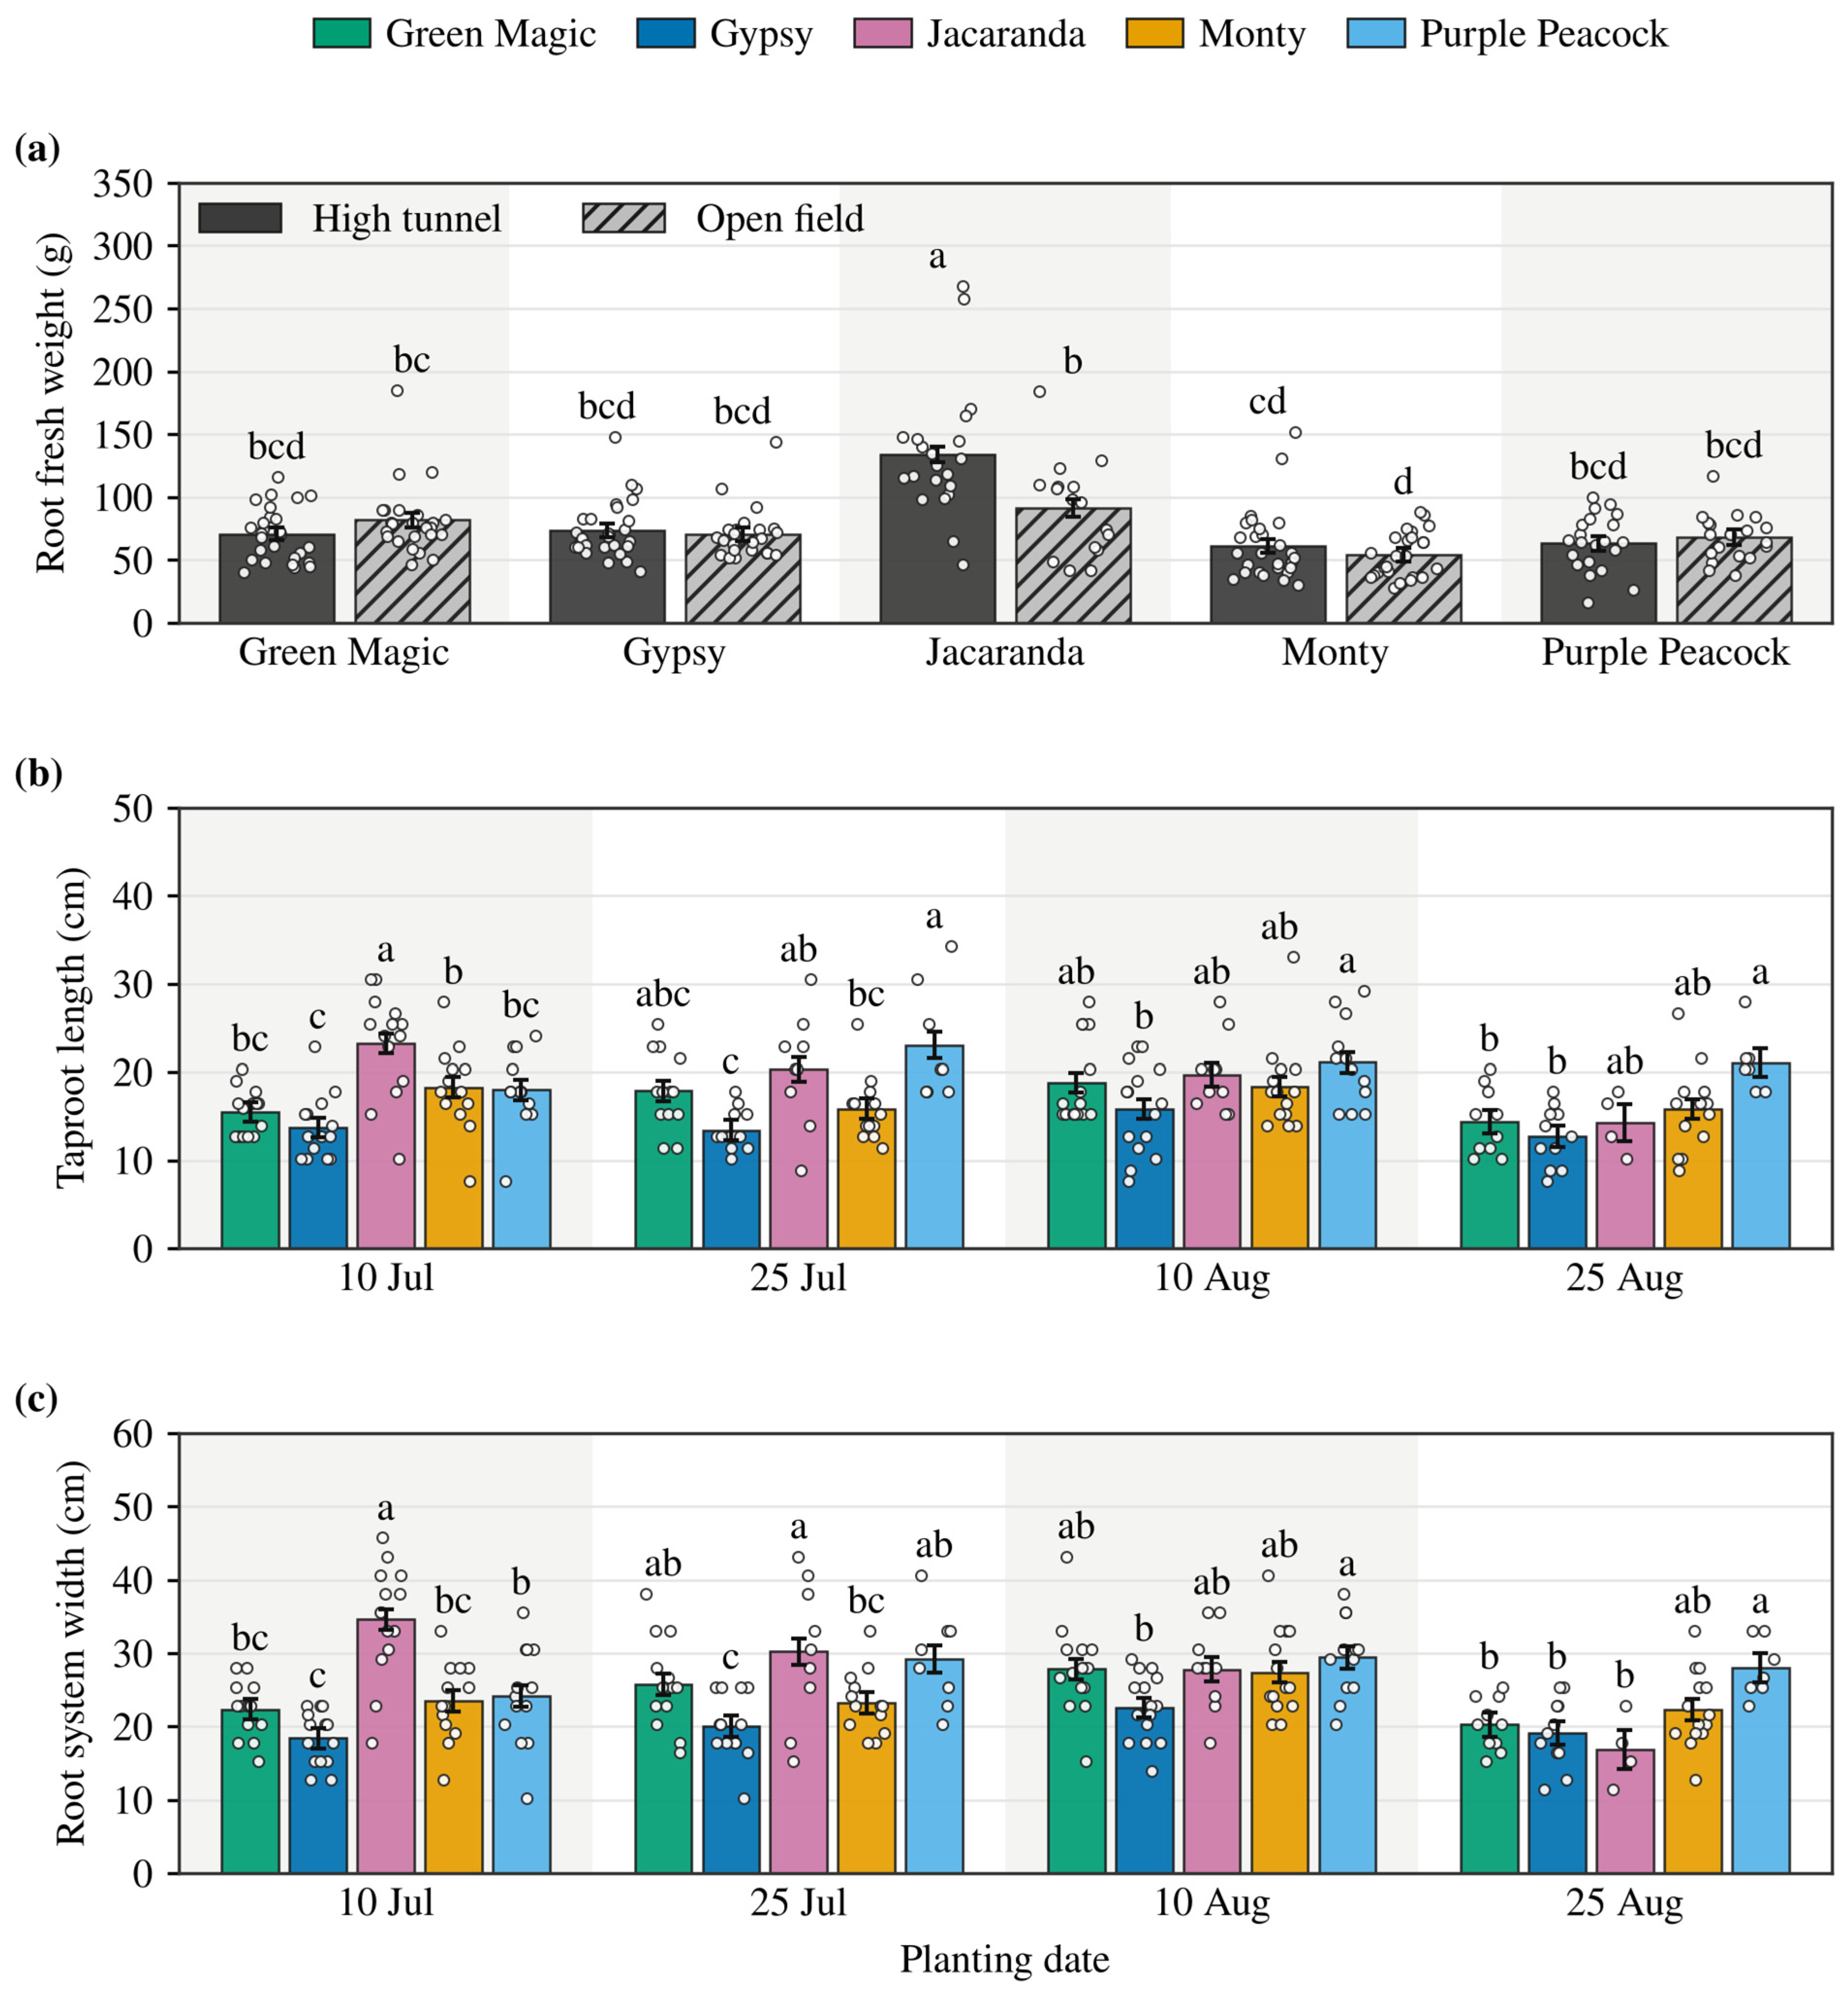
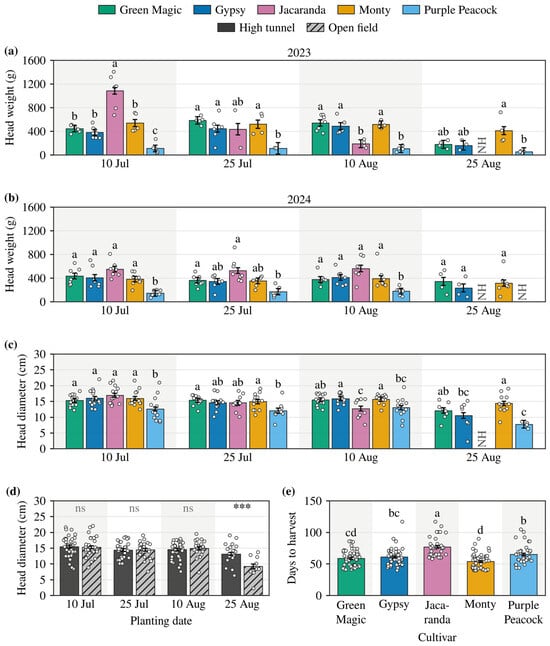
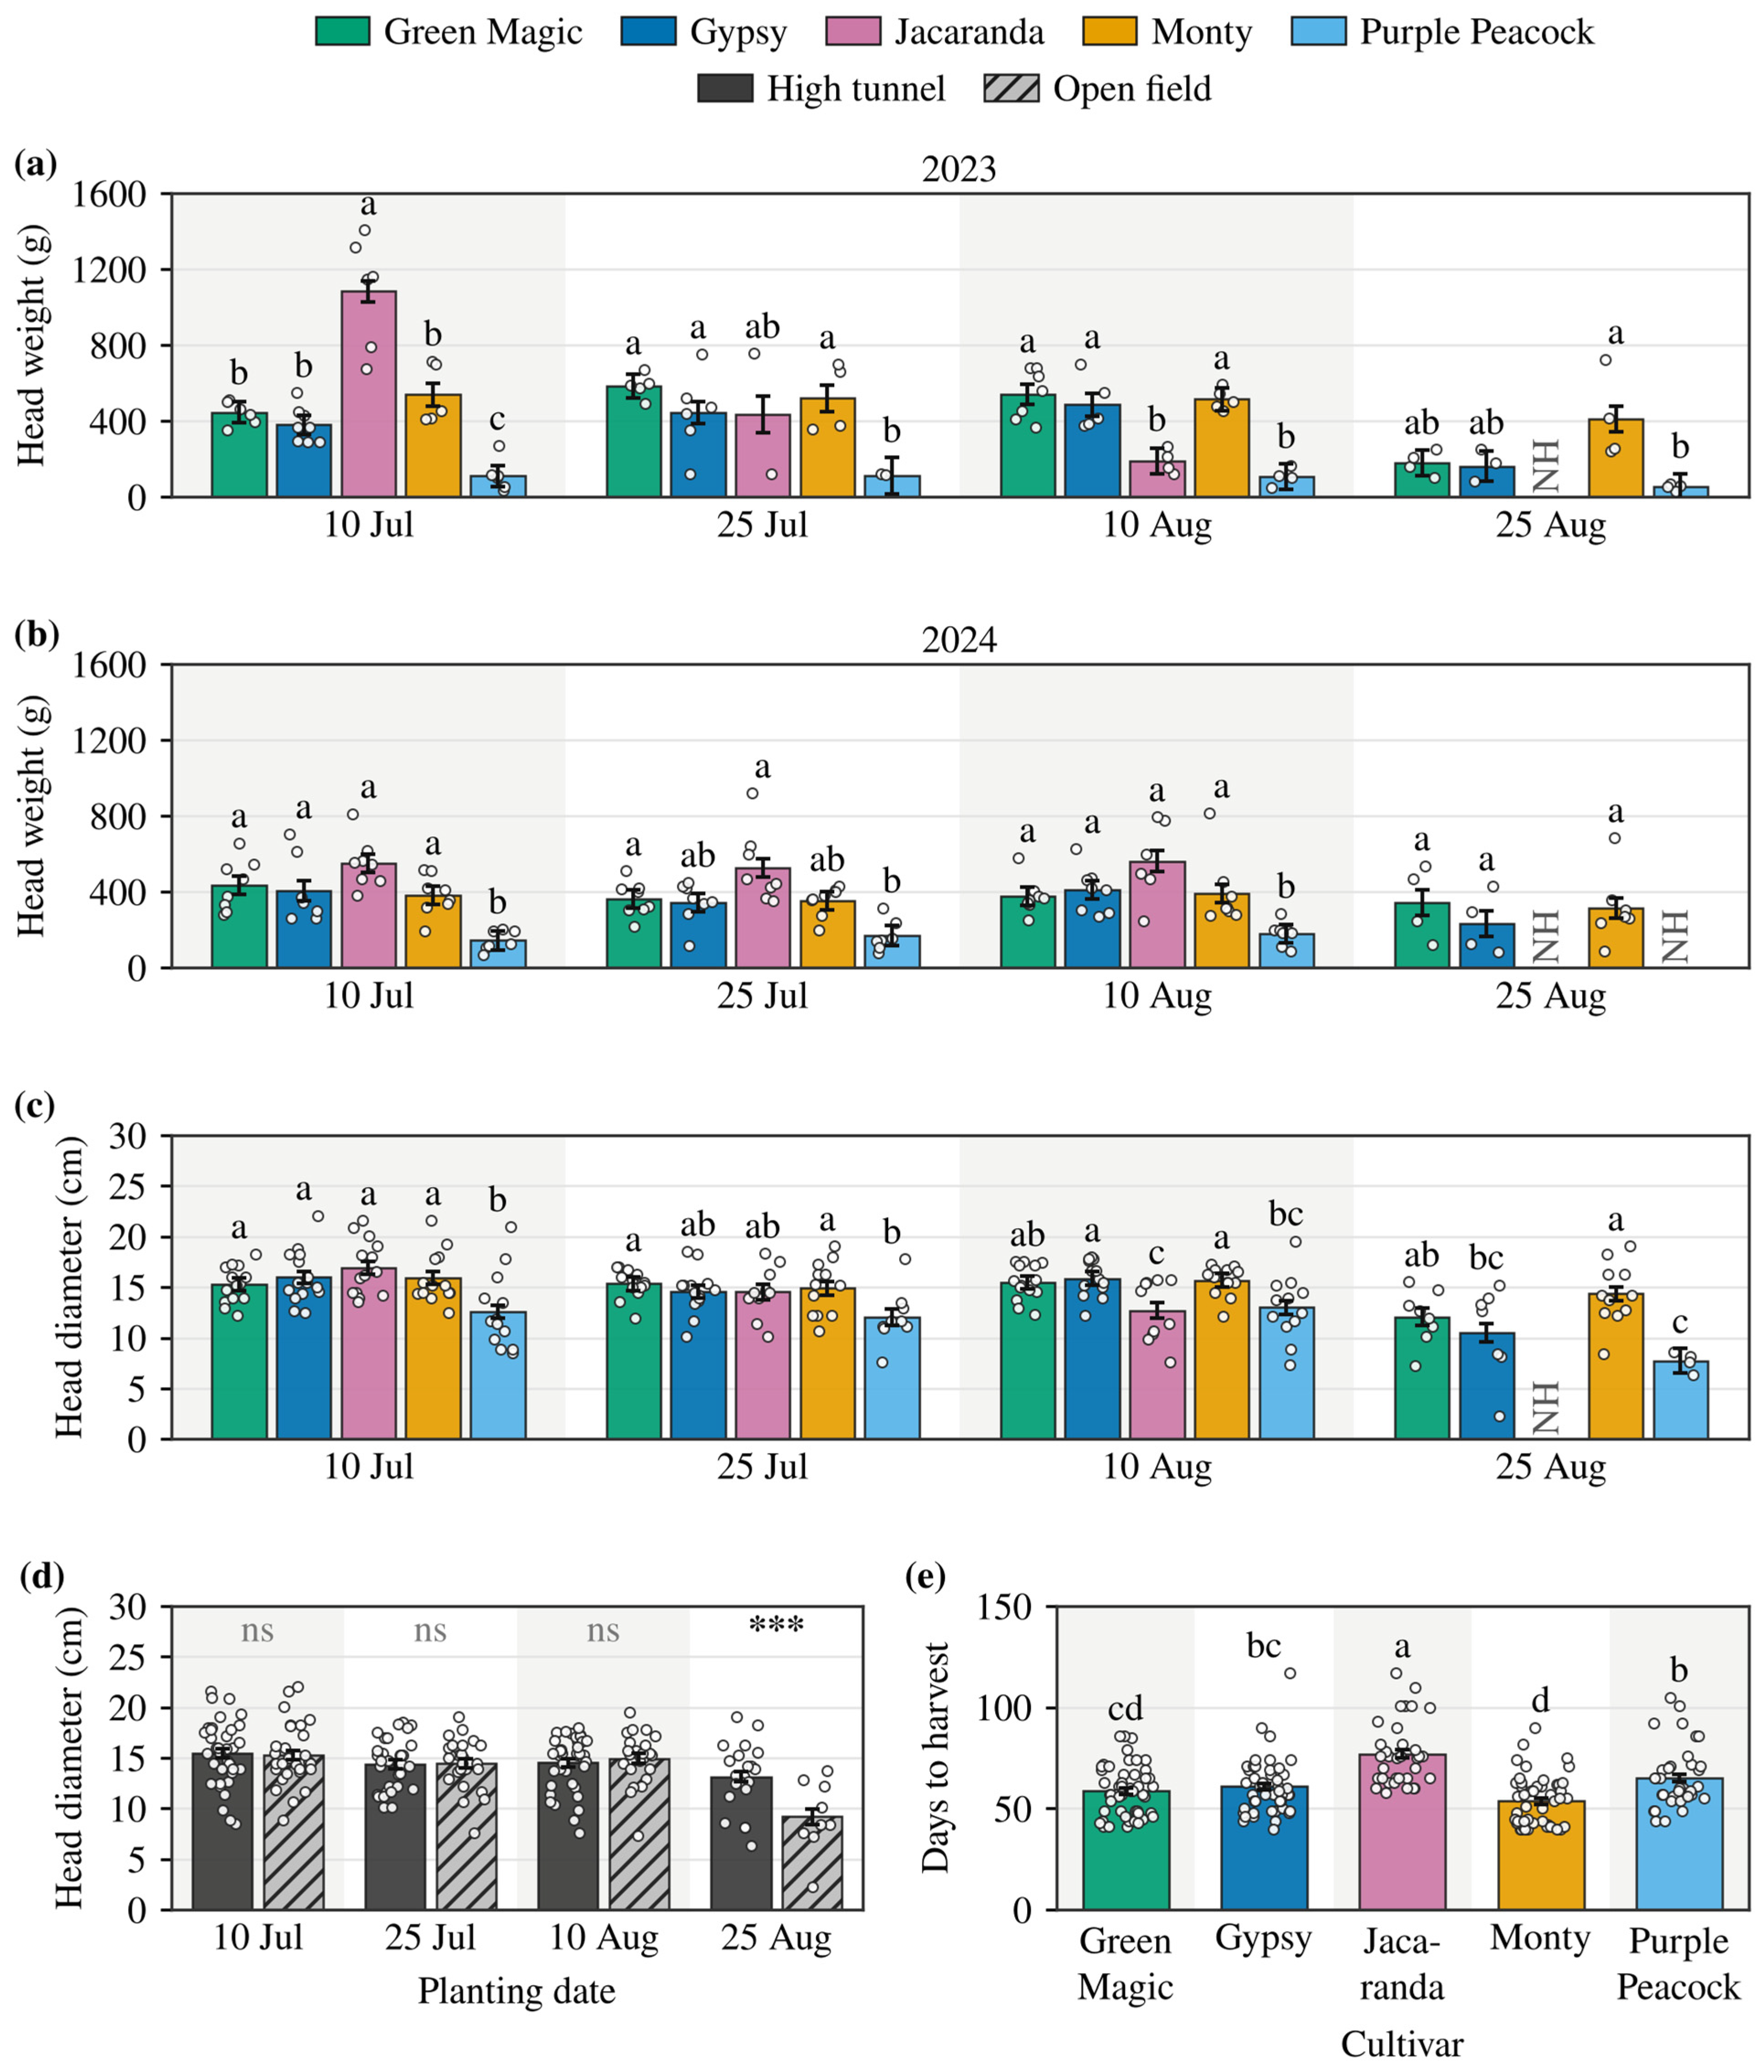
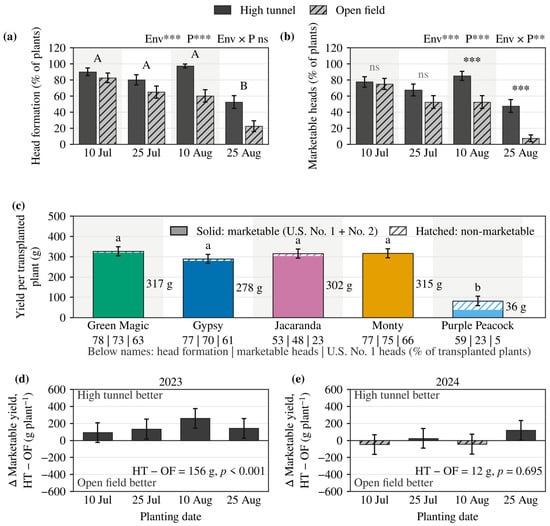
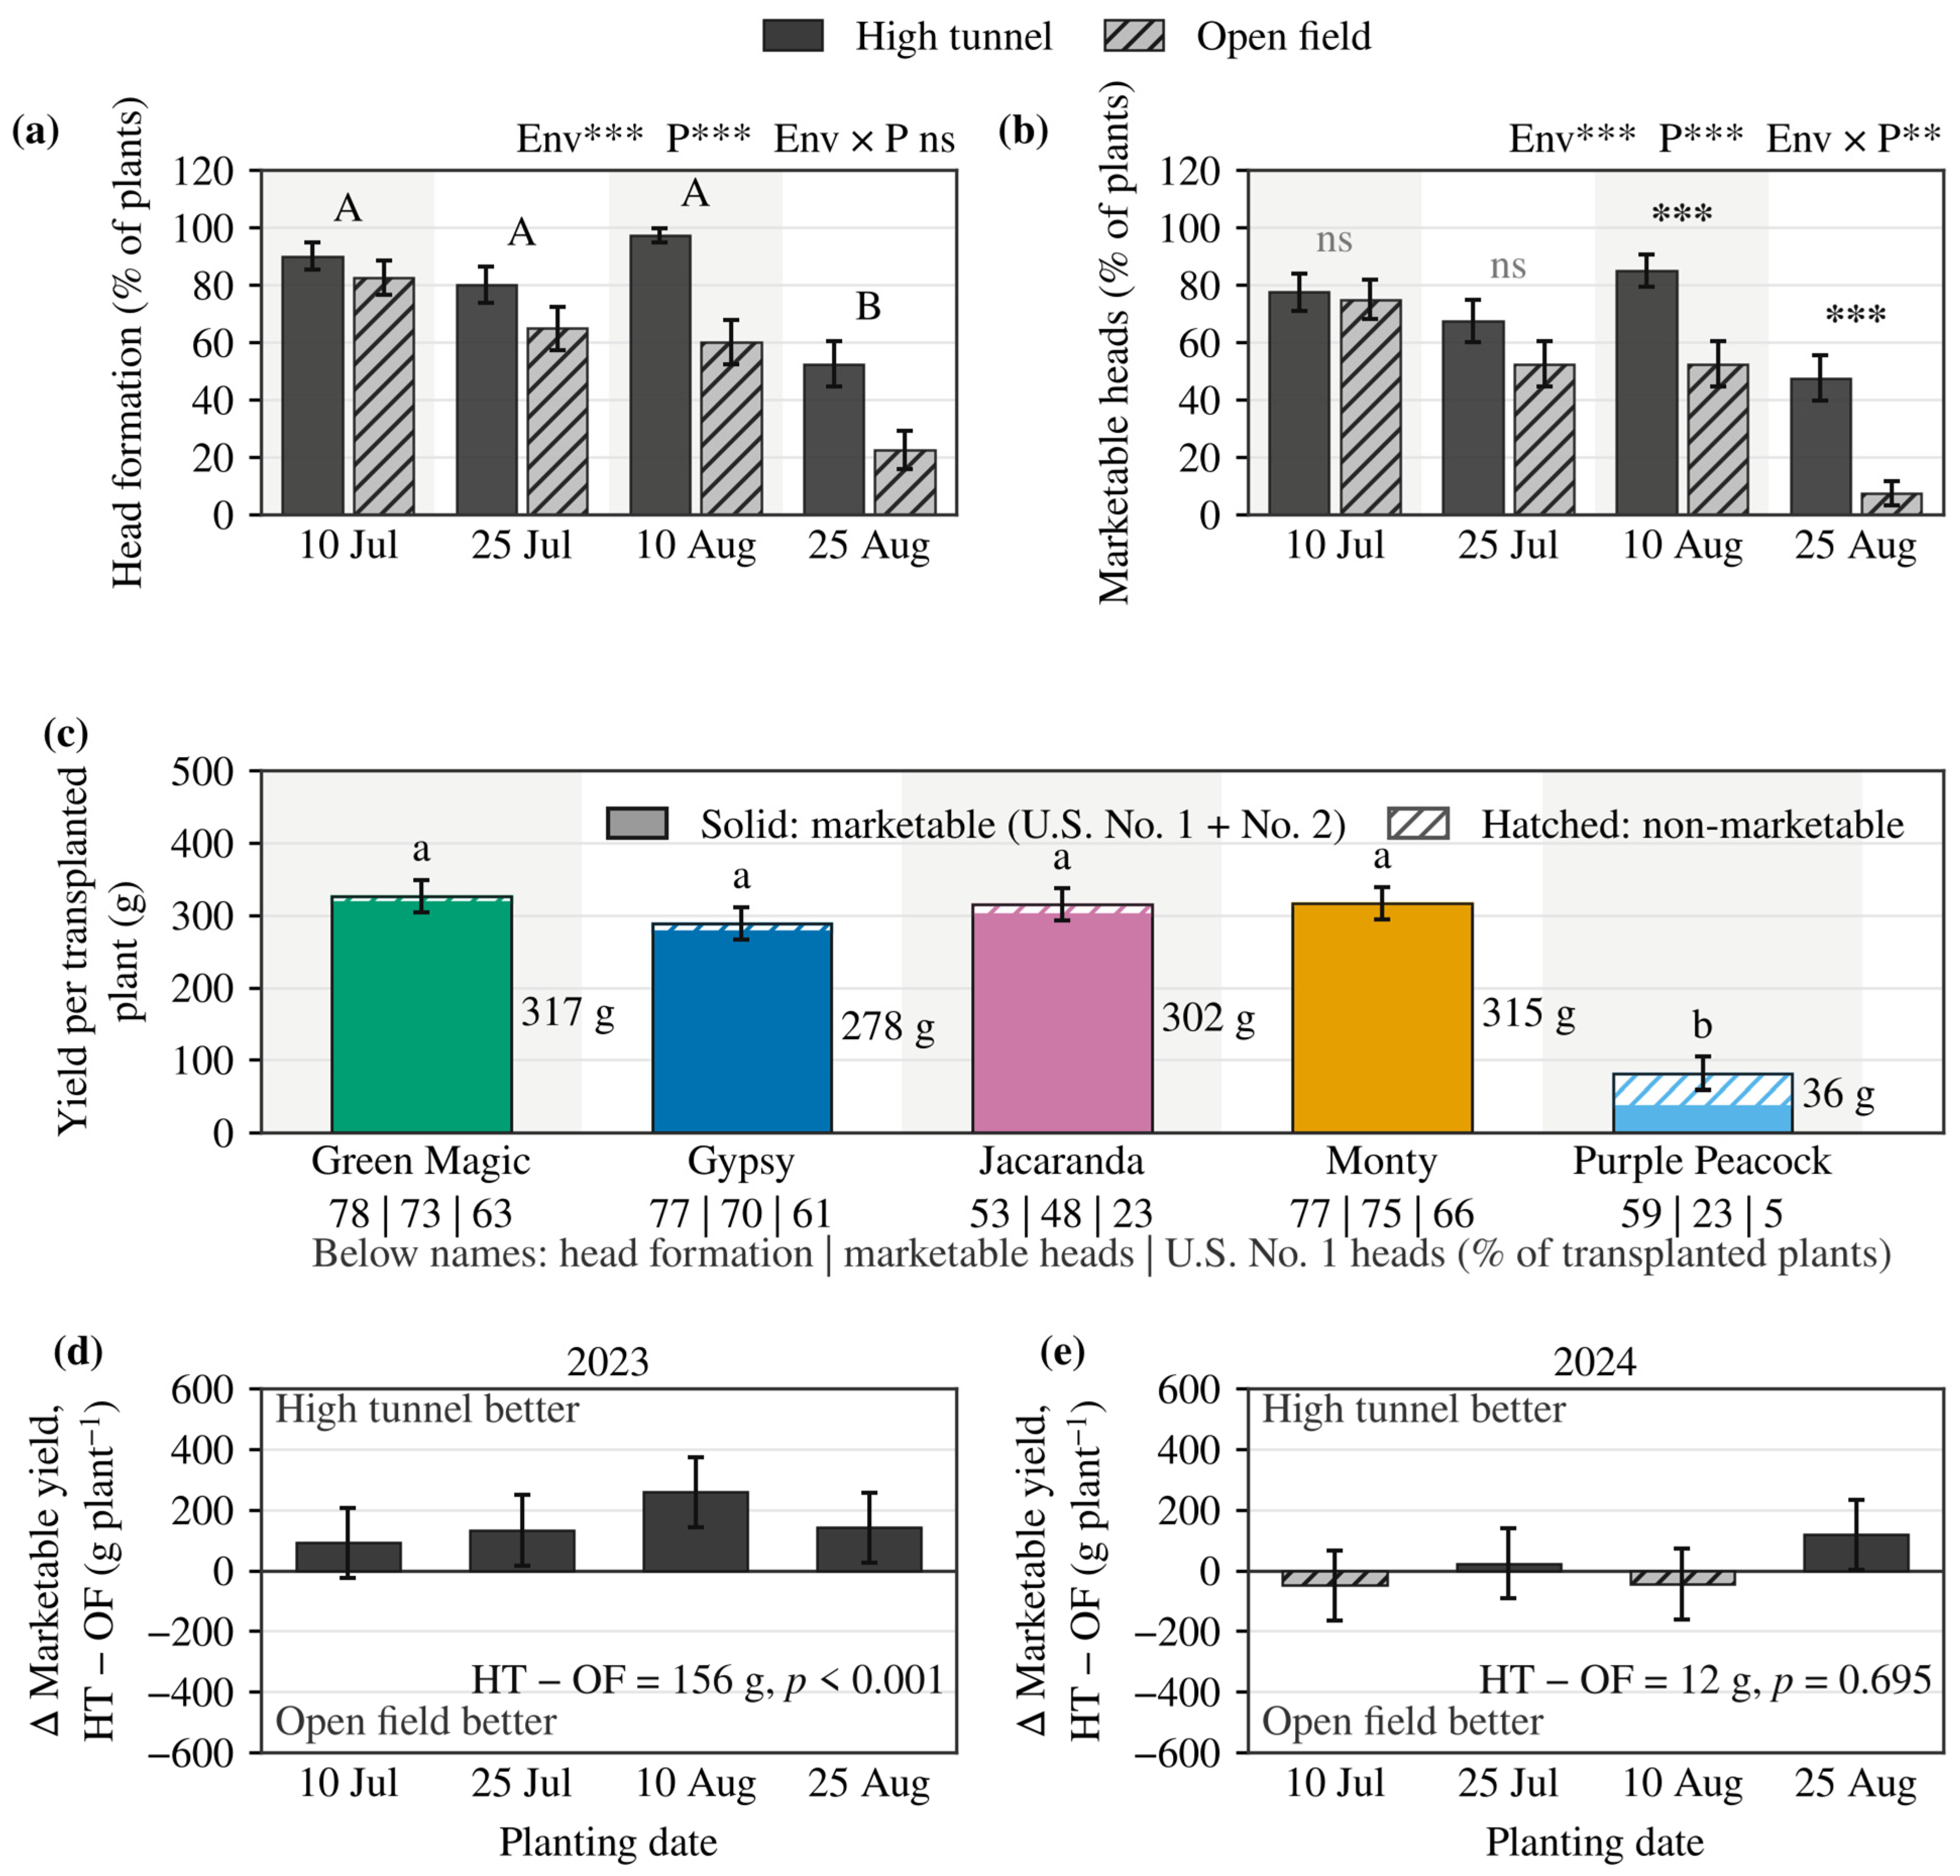
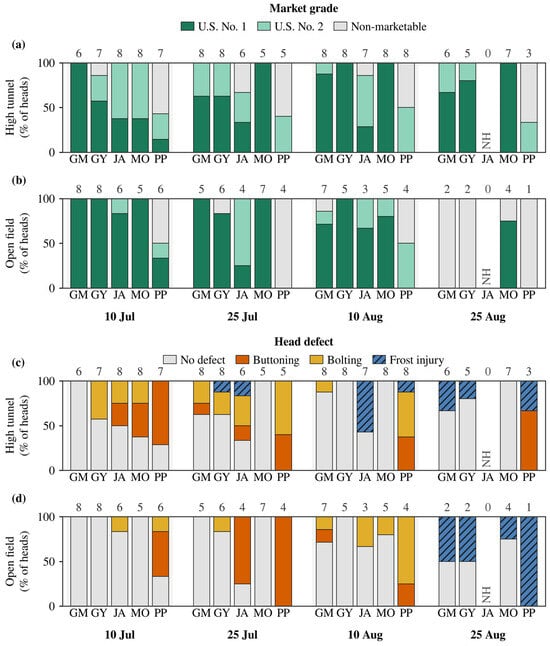
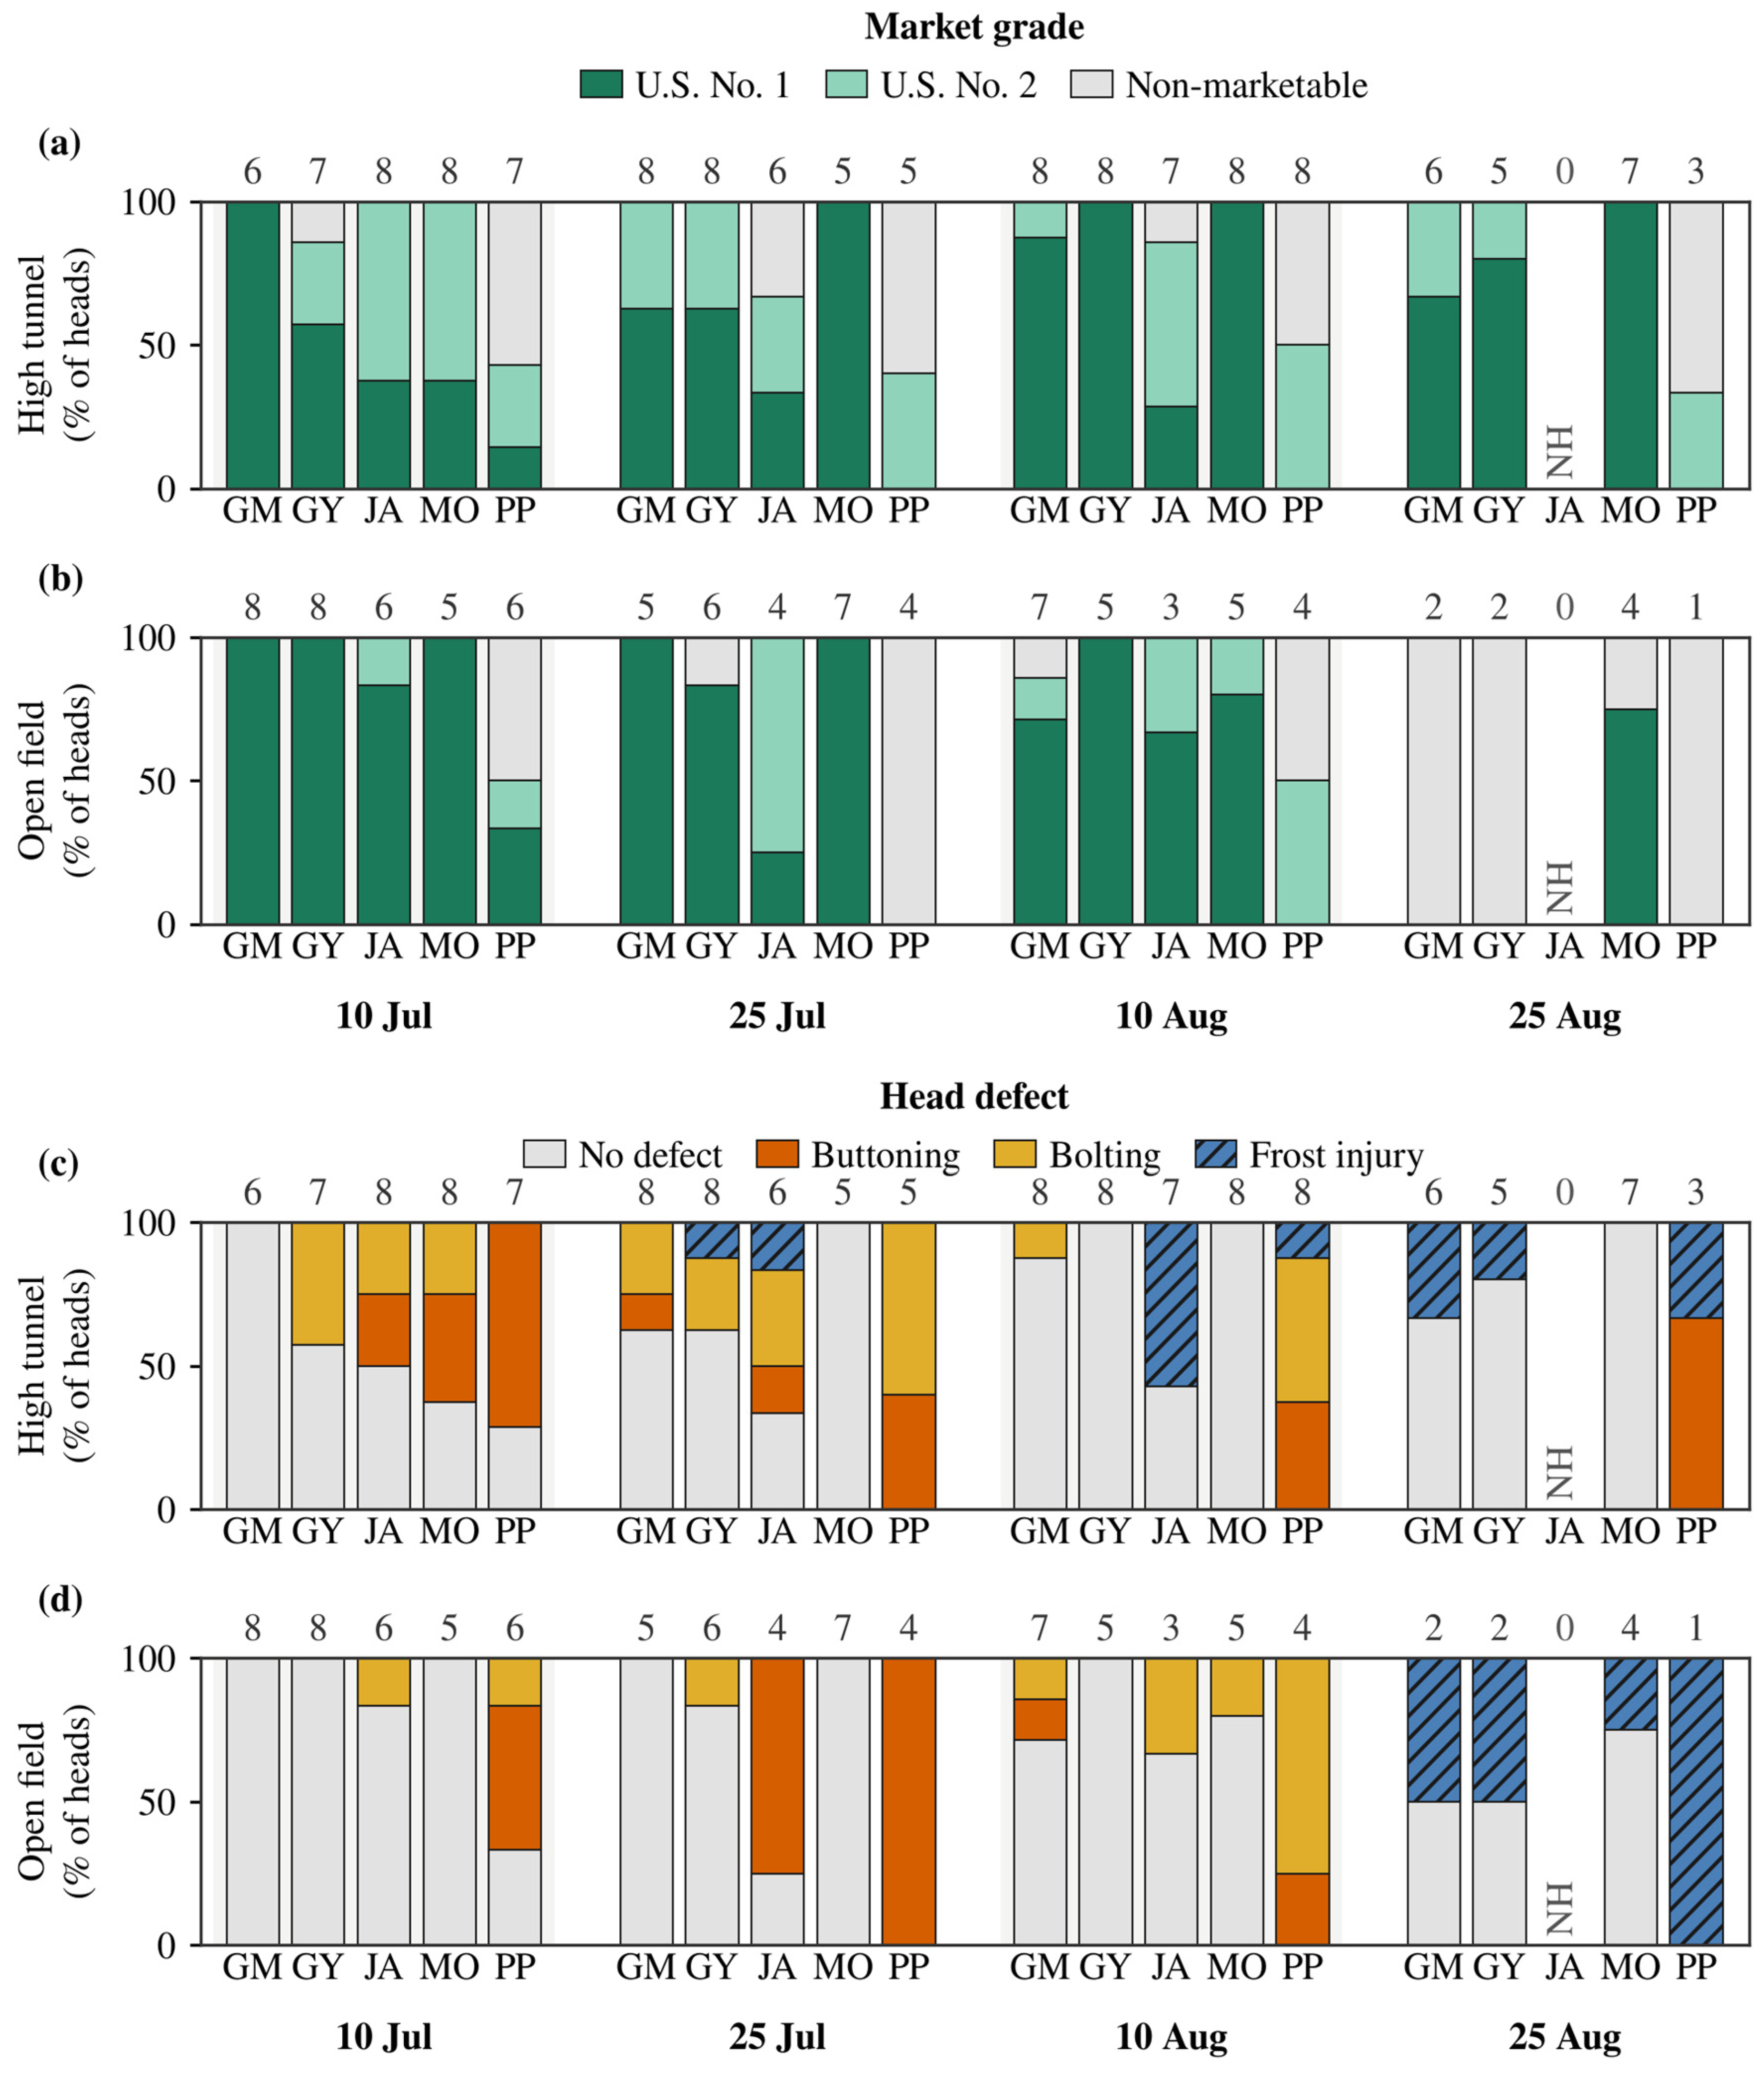
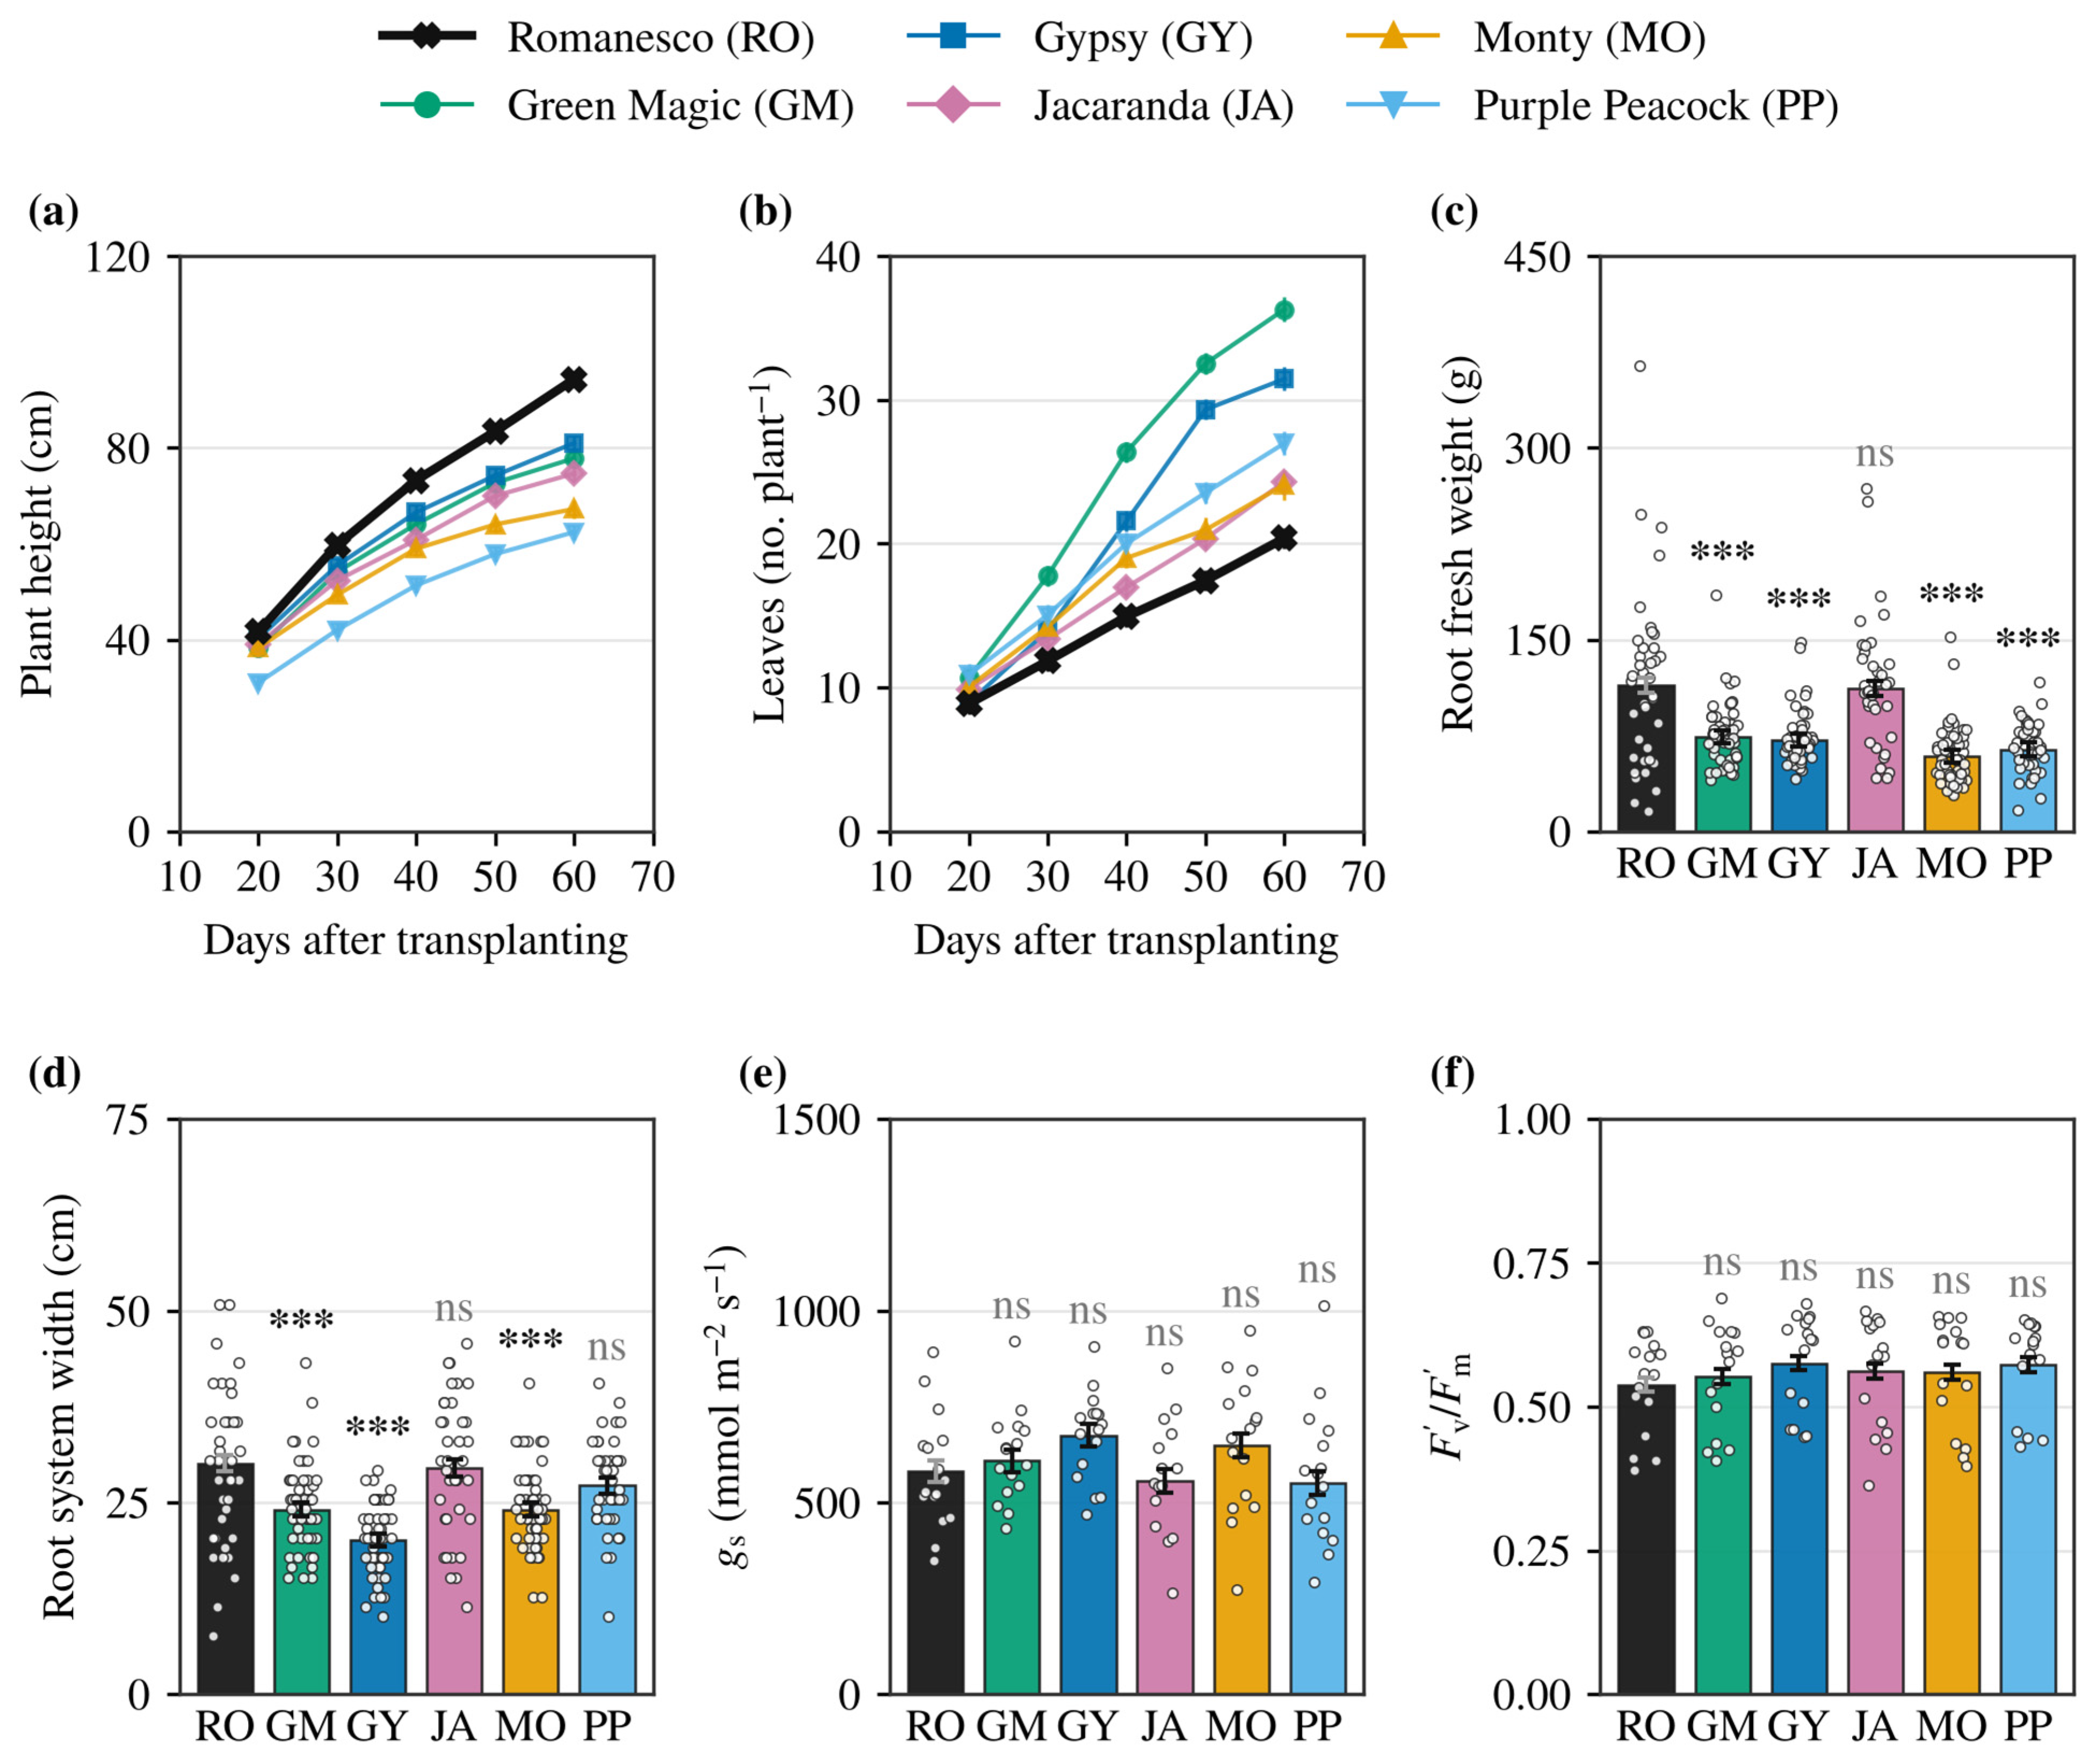
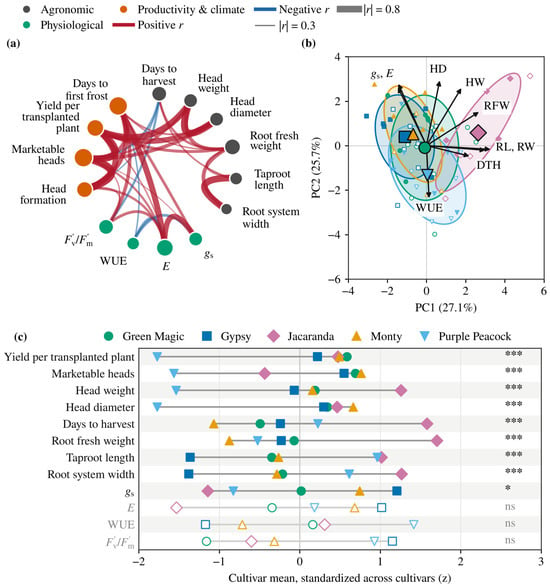
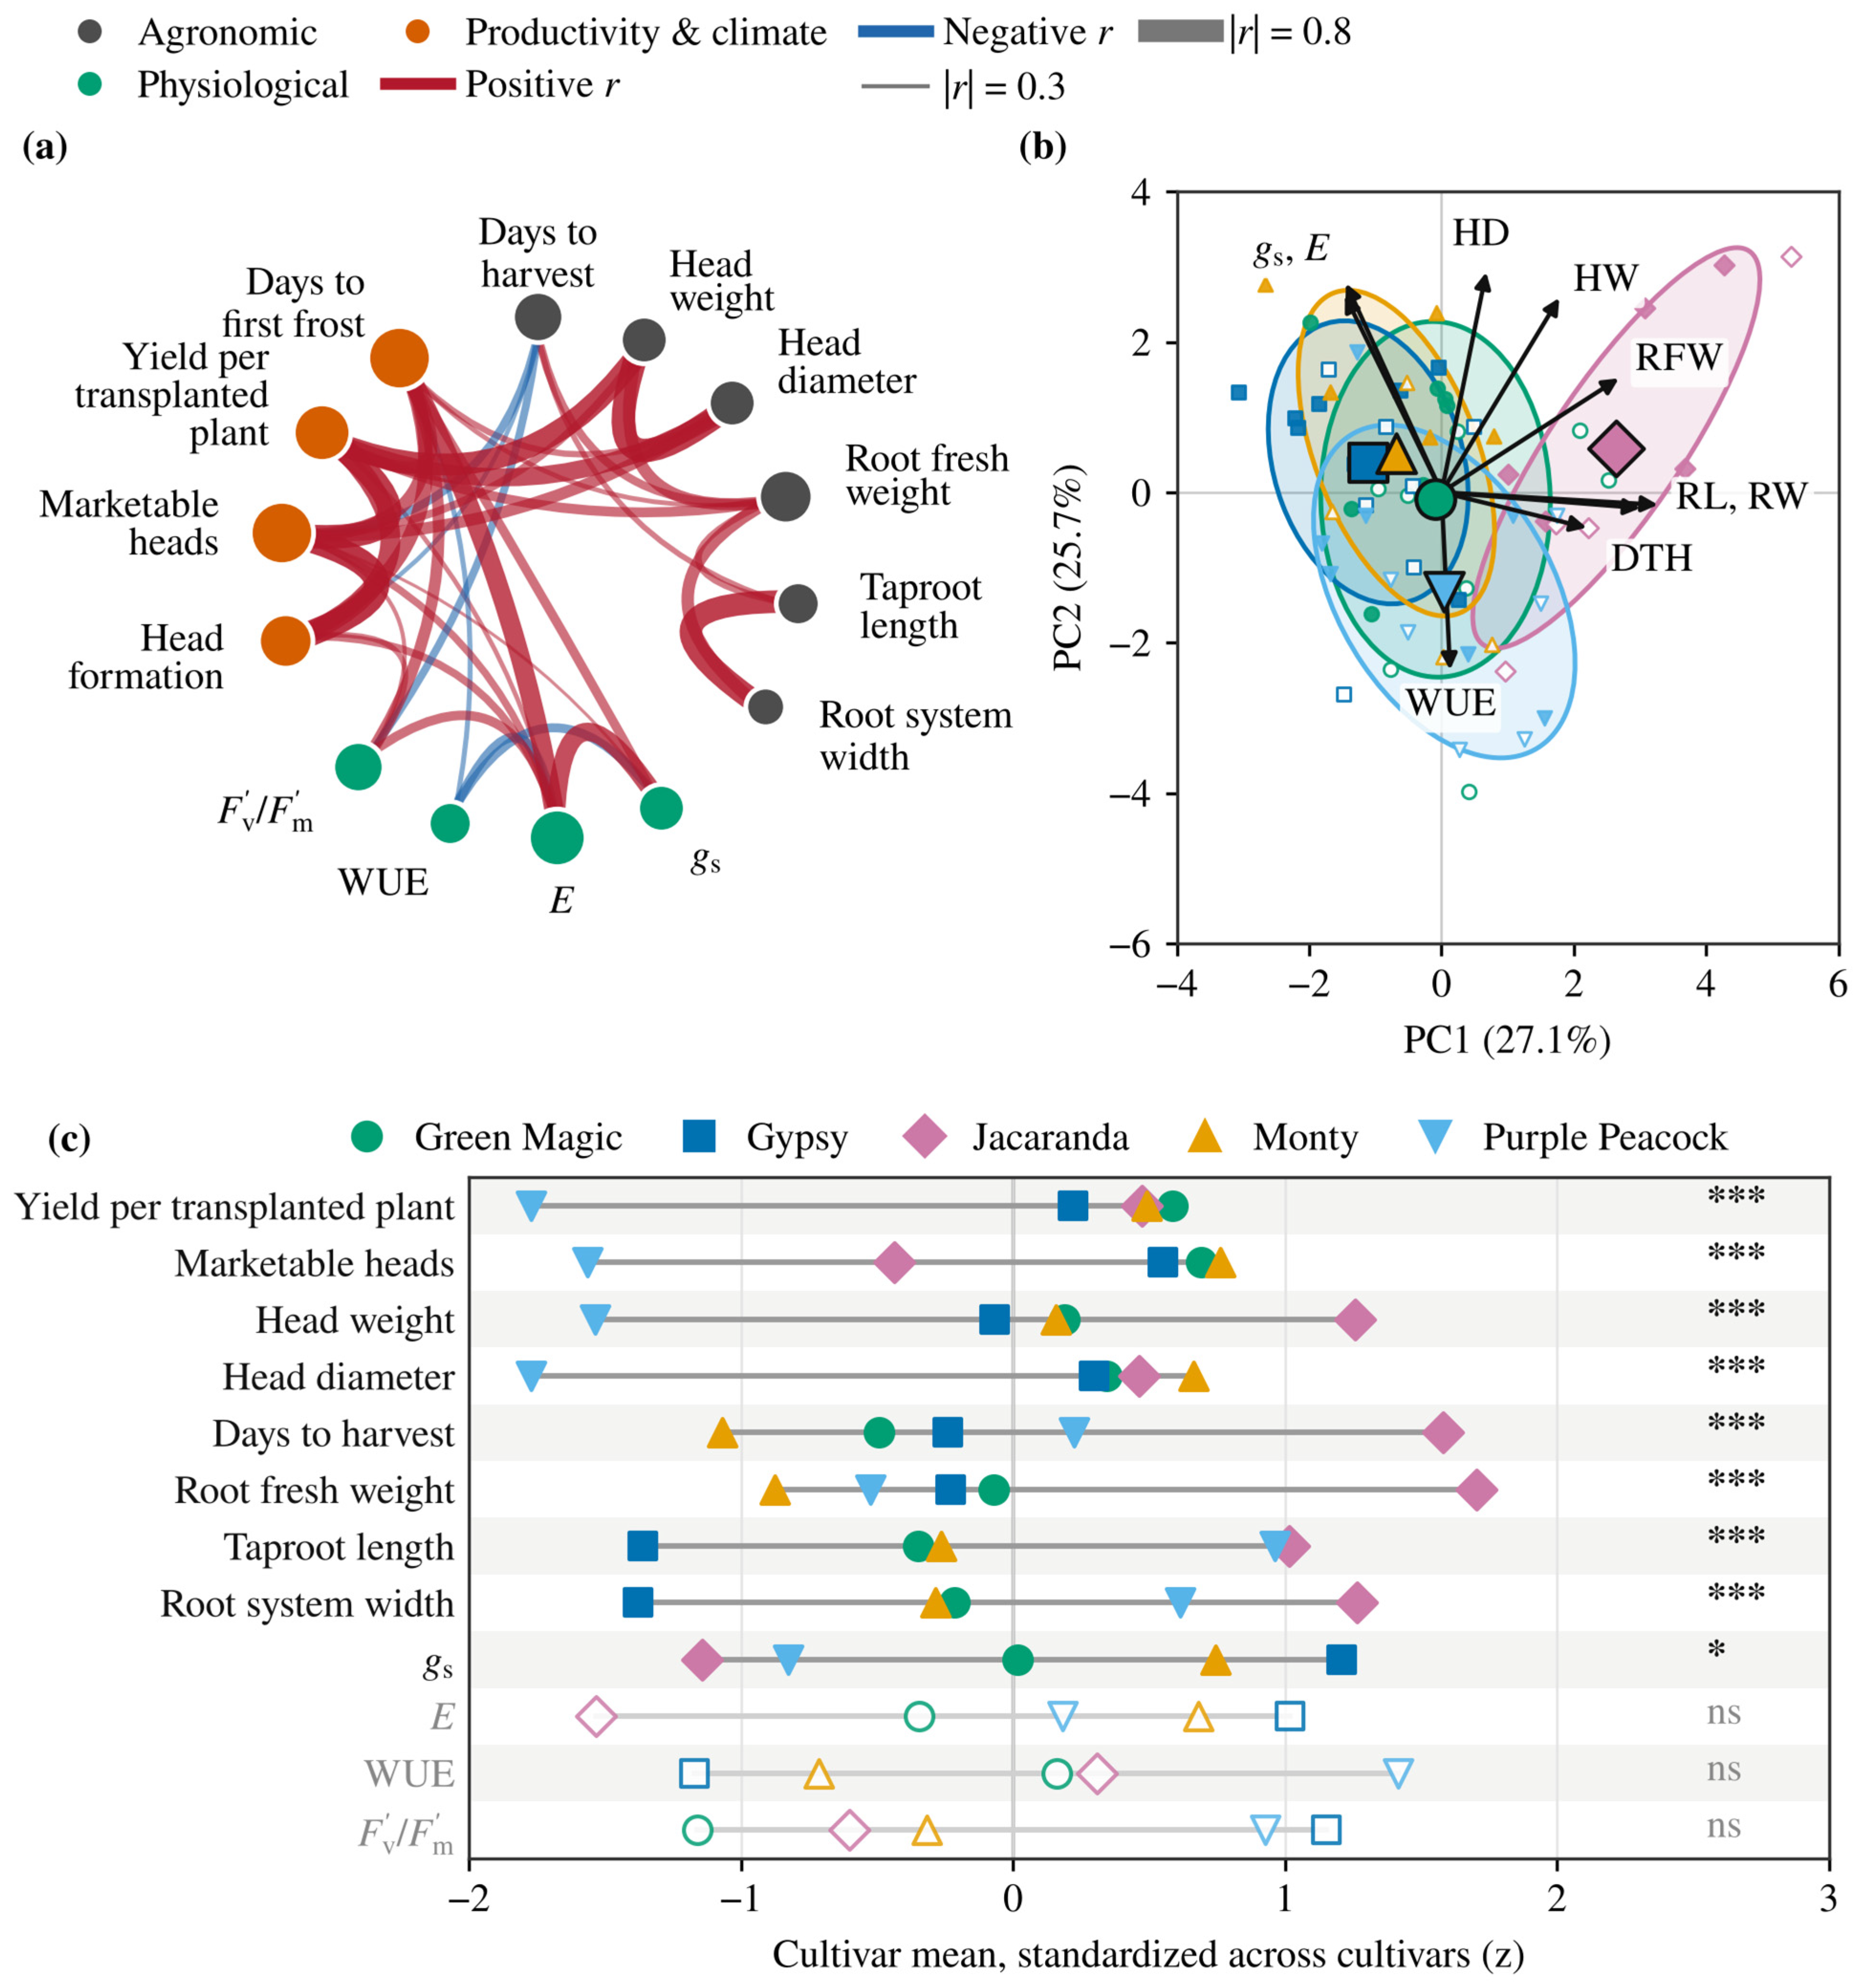

Disclaimer/Publisher’s Note: The statements, opinions and data contained in all publications are solely those of the individual author(s) and contributor(s) and not of MDPI and/or the editor(s). MDPI and/or the editor(s) disclaim responsibility for any injury to people or property resulting from any ideas, methods, instructions or products referred to in the content. |
© 2026 by the authors. Licensee MDPI, Basel, Switzerland. This article is an open access article distributed under the terms and conditions of the Creative Commons Attribution (CC BY) license.