


Abstract
Common bean (Phaseolus vulgaris L.) production is severely constrained by water deficit, affecting approximately 60% of global production. Identifying genotypes that combine high yield with phenotypic stability under rainfed and water-limited conditions is critical for sustainable production in climate-variable regions. One hundred bean genotypes were evaluated across six environments defined by two locations (Celaya, Guanajuato, and La Llave, Querétaro), two growing seasons (2023–2024), and two moisture regimes at Celaya (rainfed and rainfed plus rescue [2023] or supplemental drip [2024] irrigation), using a randomized complete block design (RCBD) with three replications per environment. Drought tolerance indices (GMP, STI, DSI) calculated from the Celaya 2023 rainfed versus rescue-irrigation contrast and GGE biplot analysis were applied to characterize genotypic adaptation and stability. The environment explained 44.1% of the total sum of squares for grain yield, and the G × E interaction (22.5%) exceeded the genotype effect (12.5%). Compared with 2024, a moisture deficit (14.7 mm vs. 88.2 mm in 2024) in September 2023 reduced the mean rainfed yield at Celaya by 24%, and rescue irrigation increased the yield by 57.3%. STI and GMP identified genotypes with high productive capacity under contrasting moisture conditions (STI > 1.30 and rainfed yield > 1450 kg ha−1): FJ 6X6 T33 (STI = 2.169), GPO 69 1E 18 FM (STI = 1.769), FR21 Gpo 69 8 L7 FJ (STI = 1.697), SCR 16 (STI = 1.679), G69 SEL 16 FM (STI = 1.558), Trat 9 SEG 61 FJ (STI = 1.480), and FR-21 GP 061 60 L-7 (STI = 1.322). Among these, G69 SEL 16 FM, Trat 9 SEG 61 FJ, and FR-21 GP 061 60 L-7 also showed lower relative susceptibility to moisture deficit (DSI = 0.785, 0.958, and 0.997, respectively), a performance dimension not captured by STI or GMP alone. The Celaya 2023 stress-tolerance ranking showed a significant positive association with grain yield performance across four additional, independent environments not used in the index calculation (Spearman’s ρ = 0.495, p < 0.001), and SCR 16 ranked first among all 100 genotypes in terms of both the independent and overall six-environment means. Interspecific lines P. SaltilloXTA-245-1-2-2 and P. SaltilloXTA-245-1-2-4 showed superior specific adaptation under severely limiting rainfed conditions at La Llave in 2023. GGE biplot analysis differentiated three preliminary environmental groupings in the Bajío region, suggesting differential patterns of genotypic adaptation across contrasting production conditions. Multi-environment evaluation revealed germplasm accessions with both broad and specific adaptations to rainfed and water-limited conditions in the Bajío region. The integrated approach combining tolerance indices, independent-environment validation, and GGE biplot analysis provides a useful methodological framework for the breeding of drought-resilient common bean.
1. Introduction
Common bean (Phaseolus vulgaris L.) is among the most important grain legumes for human nutrition worldwide, particularly in Eastern Africa and Latin America, where it serves as a primary plant source of protein, essential minerals, dietary fiber, and bioactive compounds [1,2]. It represents a critical source of income and food security for smallholder farmers in developing countries, and its adaptability to diverse edaphoclimatic conditions permits cultivation across multiple agroecosystems [3].
Rainfed agriculture faces increasing limitations and climatic variability characterized by erratic and unpredictable precipitation within and between growing seasons [4]. Approximately 60% of global bean production experiences some degree of water deficit during development, a challenge intensified by climate change through increasingly frequent and severe drought events in semiarid regions [5], which can manifest as intermittent or terminal drought [6]. Water deficit during reproductive stages limits pod set and filling, seed development, and photoassimilate partitioning, causing yield losses exceeding 50% [7,8,9]. This challenge demands breeding strategies focused on yield stability under fluctuating environmental conditions.
Genetic diversity constitutes the foundation of any breeding program, and breeding progress depends on both the breadth of the available genetic base and appropriate evaluation methods [10,11]. Multi-environment evaluations are necessary to quantify the genotype–environment (G × E) interaction, which can explain up to 48% of the phenotypic variability in yield and enables the identification of genotypes with broad adaptation (stable across environments) or specific adaptation (superior under particular conditions) [12]. The development of varieties that maintain acceptable yields under abiotic stress without sacrificing their productive potential in favorable years requires direct selection in target environments [13]. Tolerance indices such as the geometric mean productivity (GMP), stress tolerance index (STI), and drought susceptibility index (DSI) enable the classification of genotypes on the basis of their yield response under contrasting moisture conditions: GMP and STI identify genotypes with high absolute productivity under both stressed and non-stressed environments, whereas DSI quantifies the proportional yield reduction under stress compared with the population mean [14,15]. The combined use of these complementary indices, together with GGE biplot analysis, is more effective for identifying high-yielding and drought-tolerant genotypes than any single criterion alone [16].
In Mexico, common bean is cultivated on approximately 1.37 million hectares annually, with a national mean rainfed yield of approximately 551 kg ha−1, rainfed systems accounting for over 86% of the total sown area [17]. The Bajío region of Guanajuato and Querétaro represents one of the most important bean-producing zones of central Mexico, where historical mean rainfed yields average 400–570 kg ha−1 [18,19]. Drought is the primary yield-limiting factor in this region, reducing rainfed bean yield by approximately 53 kg ha−1 per event [20], with significant rainfall deficits occurring in approximately three out of every five production years [18]. In 2023, drought alone caused the loss of 26.4% of the national bean sown area, contributing to a 23% decline in production relative to the previous cycle [21]. Although regionally adapted varieties have been developed at CEBAJ-INIFAP [19], their performance under contrasting multi-year drought scenarios remains insufficiently characterized, limiting their reliability under the increasingly variable precipitation patterns of semiarid agroecosystems.
Crop drought resistance involves complex regulatory mechanisms, including stomatal regulation, osmotic adjustment, photosynthetic protection, and the transcriptional activation of stress-responsive genes; however, the translation of these molecular mechanisms into effective breeding strategies remains challenging [22]. In recent years, advances have been made in understanding the physiological responses to water deficit in common bean [11,23]; however, these studies have largely been conducted under controlled conditions, limiting their direct applicability to the natural variability of rainfed production systems. Furthermore, an important gap remains in systematic multi-environment evaluations that (i) incorporate extensive germplasm collections representative of available diversity; (ii) assess phenotypic responses under real climatic variability across years and locations; and (iii) integrate complementary methodologies such as tolerance indices, G × E analysis, and phenotypic stability to comprehensively characterize genotypic responses. In the present study, 100 common bean genotypes were characterized across six contrasting environments in the Bajío region of Mexico over two growing seasons (including rainfed and supplementally irrigated conditions at Celaya and exclusively rainfed conditions at La Llave), with the aim of identifying outstanding genotypes for yield, stability, and adaptation under variable moisture availability.
2. Materials and Methods
2.1. Plant Material
One hundred common bean genotypes were selected on the basis of the genetic diversity available in the breeding program of Campo Experimental Bajío (CEBAJ) of the National Institute of Forestry, Agricultural and Livestock Research (INIFAP). The set included 40 improved varieties, 35 experimental lines, and 25 native varieties, predominantly from the Mesoamerican gene pool and spanning commercial market classes: Flor de Mayo, Flor de Junio, Pinto, Negro, Azufrado, Bayo, and Rojo, among others (Table S1, Supplementary Material).
The materials exhibited diverse growth habits, including determinate bush (Type I), indeterminate bush (Type II), indeterminate prostrate (Type III), and indeterminate climbing (Type IV) types, with a predominance of Type III. The set included three experimental lines derived from interspecific crosses with Phaseolus acutifolius (tepary bean), identified as P. SaltilloXTA-245-1-1-3, P. SaltilloXTA-245-1-2-2, and P. SaltilloXTA-245-1-2-4, developed specifically for adaptation to moisture-limited environments. Germplasm selection was based on previous evaluations demonstrating variability in yield, agronomic traits, and differential response to rainfed conditions [19]. The complete list of genotypes, including unique identifiers, market classes, growth habits, and origins, is provided in Table S1 of the Supplementary Material; the genotype names used throughout the manuscript correspond exactly to those listed in Table S1.
2.2. Experimental Locations
Experiments were conducted at two locations in the Bajío region with contrasting edaphoclimatic conditions during the 2023 and 2024 growing seasons. Campo Experimental Bajío (CEBAJ), Celaya, Guanajuato, is located at 20°34′21.4″ N, 100°49′31.5″ W at 1752 m a.s.l. Its climate is semi-dry semi-warm (BS1hw, modified Köppen classification), with a mean annual temperature of 18.4 °C and a mean annual precipitation of 578 mm concentrated in summer (June–September). The soil is a Pellic Vertisol with a clay loam texture, a pH of 8.13, and 1.3% organic matter, with a field capacity of 20.9% and a plant-available water content of 8.5%. Soil characterization was based on composite samples collected at 0–30 cm depth prior to sowing, with five subsamples per site composited into a single representative sample; analyses were performed by the soil laboratory of INIFAP-CEBAJ following standard methods (pH in water 1:2, organic matter by Walkley–Black, available Fe by DTPA extraction, available P by the Bray–Kurtz method, and cation exchange capacity by ammonium acetate at pH 7.0). The experimental site La Llave, San Juan del Río, Querétaro (Mexico), is located at 20°27′02.3″ N, 100°01′29.4″ W at 1920 m a.s.l., with a semidry temperate climate (BS1k), a mean annual temperature of 17.5 °C, and a mean annual precipitation of 512 mm. During 2023 and 2024, the accumulated precipitation at La Llave was 186.8 and 377.2 mm, respectively, both below the historical mean. The soil is a Haplic Phaeozem with a loam texture (47.9% sand, 27.4% silt, 24.7% clay), an alkaline pH of 8.11, and 1.63% organic matter. The field capacity is 32.1%, with a permanent wilting point of 16.9%, yielding 15.2% plant-available water. The alkaline pH severely limits iron availability (Fe = 2.07 mg kg−1, very low) and reduces phosphorus solubility (P-Bray not detectable), whereas the elevated calcium saturation (82.8% of the cation exchange capacity of 24.1 cmol kg−1) may antagonize the uptake of Fe, Mg, and Mn. These edaphic constraints are consistent with conditions that may limit crop productivity under rainfed conditions independent of moisture availability, although their individual contributions were not experimentally quantified in this study.
2.3. Experimental Design
Genotypes were evaluated across six environments resulting from the combination of two locations, two years, and two moisture conditions at one location. At Celaya, two moisture conditions were established each year: rainfed and rainfed plus supplemental irrigation applied during the reproductive stage, with the specific irrigation method differing between years as described below. Supplemental irrigation was applied when water deficit threatened crop development, as determined by visual monitoring of stress symptoms (incipient wilting, leaf rolling) and the absence of rainfall for more than 10 consecutive days during flowering and grain filling. At La Llave, the genotypes were grown exclusively under rainfed conditions in both years because of the absence of an irrigation infrastructure at that site.
In each environment, the germplasm was evaluated using a randomized complete block design (RCBD) with three replications. The experimental unit consisted of a 5-m row with 0.75-m interrow spacing (3.75 m2 total area). Sowing was performed manually at 12 seeds per linear meter, which is equivalent to a plant density of 160,000 plants ha−1. The entire row was harvested as the experimental plot. Sowing dates were determined by the occurrence of precipitation at each location using the traditional tierra venida approach (sowing into moist soil following sufficient rainfall to ensure uniform germination and emergence): Celaya 2023 (16 July), Celaya 2024 (11 July), La Llave 2023 (20 July), and La Llave 2024 (26 July).
In Celaya 2023, supplemental irrigation consisted of a single 30 mm application delivered by gravity irrigation at 55 days after sowing, which coincided with the flowering-to-pod-formation stage (rainfed + rescue irrigation). In Celaya 2024, drip irrigation (emitters spaced 20 cm apart; flow rate of 1 L h−1) was used to apply two irrigation events per week of 10 mm each, applied over approximately 30 days (days 45–75 after sowing), resulting in a cumulative of approximately 80 mm (rainfed + supplemental drip irrigation).
2.4. Agronomic Management
Fertilization was applied at sowing at both locations at a rate of 250 kg ha−1 using a commercial 18-24-12 (N-P-K) blend formulated from granular ammonium sulfate, single calcium superphosphate, and sulfate-based multinutrient fertilizer (MicroEssential) supplemented with micronutrients. The same fertilization rate and formulation were applied uniformly across all the environments and years.
Weed management required intensive intervention due to the high infestation pressure of Johnson grass (Sorghum halepense) at both experimental sites, which is favored by the summer sowing date during which this species reaches peak establishment in the region. The weed control program included a pre-emergence application of nicosulfuron + mesotrione (Calibre 90 + Elumis, respectively) targeting grass species, complemented with 2,4-D amine for broadleaf weed control; these applications were made at 3–5 days after sowing at both sites and in both years. Additional management included the application of 1.0 L ha−1 Fusiflex® (fluazifop-p-butyl, 125 g a.i. L−1) as a post-emergence treatment to control grassy weeds, mechanical cultivation, and manual weeding. Weed pressure was effectively controlled across all the environments, and no differential weed interference among genotypes or environments was observed that could have confounded the yield comparisons.
Pest monitoring was conducted weekly through zigzag field scouting, in which 10 randomly selected plants were inspected per plot. Leafhoppers (Empoasca kraemeri Ross & Moore) and whiteflies (Bemisia tabaci Gennadius) were controlled when the incidence exceeded the threshold of 30% of plants with nymph presence or 50 adults per yellow sticky trap. Both species represented the dominant phytosanitary pressure throughout the growing season, which was favored by the high temperatures characteristic of the summer-sowing period, and are currently among the most important phytosanitary constraints in the main common bean production areas of Mexico. A preventive rotation of insecticides was applied, including imidacloprid (17.8% a.i., 350 mL ha−1), diazinon (25% a.i., 1.0 L ha−1), and cypermethrin (25% a.i., 300 mL ha−1), with a total of six applications per cycle depending on pest pressure in each environment: two applications were performed using an agricultural drone, and four were applied manually at a spray volume of 60 L ha−1 per application. The insecticide rotation protocol was applied uniformly across all the environments; no phytotoxicity symptoms attributable to pesticide application were observed in any environment. No critical levels of foliar or root diseases requiring chemical control were recorded during the evaluated cycles.
2.5. Evaluated Variables
2.5.1. Phenological Variables
Days to flowering (DF): Recorded as the number of days from sowing until 50% of the plants in the plot had at least one open flower.
Days to physiological maturity (DM): Recorded when 50% of the plants exhibited completely dry pods whose coloration changed from green to yellow–brown, indicating that the seeds had reached the maximum dry weight and a moisture content of approximately 18–20%. At Celaya 2023, physiological maturity was recorded at the treatment level: rainfed and rescue-irrigated plots reached maturity approximately 30 and 40 days after flowering, respectively, and these intervals were applied to the plot-level flowering dates.
2.5.2. Yield Components
Grain yield (GY): Plants from the entire experimental plot were harvested at physiological maturity, manually threshed, and cleaned. The grain moisture content was determined using a forced-air oven at 105 °C for 24 h, and the grain weight was adjusted to 14% moisture content using the following equation: Adjusted weight = Observed weight × [(100 − % measured moisture)/(100 − 14)] and expressed as kg ha−1 based on the net harvest area of the experimental unit (3.75 m2).
The 100-seed weight (100 SW): Three random samples of 100 seeds per plot were weighed at 14% moisture content, and the results are expressed in grams.
2.6. Determination of Drought Tolerance Indices
Three indices were calculated on the basis of data from Celaya 2023, a season in which differential moisture availability during the reproductive stage clearly discriminated among moisture treatments. Indices were not calculated for the other environments because a valid stress versus non-stress contrast within the same location and season was not available: in 2024, no moisture stress occurred at Celaya (mean rainfed yield of 1333.8 kg ha−1 vs. 1289.6 kg ha−1 under supplemental drip irrigation), resulting in a negative stress intensity (SI = −0.034) for which the DSI cannot be meaningfully interpreted, and at La Llave, both years were evaluated exclusively under rainfed conditions, without a non-stressed control. These four environments were instead used to assess the consistency of the STI-based ranking (Section 2.7). These indices were selected on the basis of their complementary utility and consistent performance for discriminating genotypic responses under contrasting moisture conditions in common bean and related legumes [6,18,24,25,26]. The index values for all 100 evaluated genotypes are provided in Table S2 of the Supplementary Material.
Geometric mean productivity (GMP): GMP = (Ys × Yp)^½, where Ys is the yield under rainfed conditions and Yp is the yield under rainfed + rescue irrigation conditions. This index identifies genotypes with high mean productivity under both moisture conditions [14].
Stress tolerance index (STI): STI = (Ys × Yp)/(Ȳp)2, where Ȳp is the grand mean of all genotypes under rainfed + rescue irrigation conditions. High STI values indicate genotypes that maintain acceptable yields under limiting conditions while responding favorably to more favorable moisture conditions [14].
Drought susceptibility index (DSI): DSI = [1 − (Ys/Yp)]/[1 − (Ȳs/Ȳp)], where Ȳs is the grand mean of all genotypes under rainfed conditions. Genotypes were classified as relatively tolerant (DSI < 1.0) or susceptible (DSI > 1.0) on the basis of their proportional yield reduction relative to the population mean [15,25]. The genotypes were further characterized according to their productive capacity (STI) and rescue irrigation response pattern to provide a comprehensive classification, as described in Section 3.5. These indices reflect genotypic responses under the specific stress contrast available at Celaya 2023 and should not be interpreted as stable drought tolerance rankings without replication across additional stress events and seasons, although their consistency with genotype performance in independent environments was subsequently assessed (Section 2.7).
2.7. Statistical Analysis
Analysis of variance was performed for all evaluated traits using a randomized complete block design (RCBD) model with three replications per environment, which is consistent with the experimental design described in Section 2.3. Unadjusted genotypic means were used in all comparisons. For the combined across-environment analysis, the following model was fitted using PROC GLM (SAS v9.4):
In this model, genotype was treated as a fixed effect to allow direct mean comparisons among genotypes for selection purposes; this approach is appropriate when the objective is to characterize the specific materials evaluated rather than to make inferences about a broader population of genotypes. The environment was also treated as a fixed effect, consistent with the objective of characterizing genotypic responses in the specific target environments evaluated; replication was included as a nested source of variation within the environments. Mean comparisons were performed using Fisher’s least significant difference (LSD) test (p ≤ 0.05), applied to genotypic means within each environment; given the large number of genotypes evaluated (n = 100), LSD comparisons served as an exploratory tool to identify outstanding materials rather than to support formal pairwise inference among all possible combinations. Genotype selection for breeding purposes was based primarily on agronomic thresholds and the integrated interpretation of tolerance indices and GGE biplot results rather than on statistical significance alone.
Genotype × environment interaction was further analyzed using GGE biplot analysis across the six environments. The biplot was generated using environment-centered data with genotype-focused singular value partitioning (SVP = 1). Unadjusted environment-specific genotypic means were used as inputs for GGE biplot analysis. To assess whether the stress tolerance index (STI) values calculated from the Celaya 2023 contrast were representative of genotype performance beyond that single stress event, Spearman’s rank correlation coefficient was calculated between the STI and the mean grain yield of each genotype across four additional, independent environments not used in the index calculation (La Llave 2023, La Llave 2024, Celaya rainfed 2024, and Celaya rainfed + supplemental drip irrigation 2024), which differed from the index-calculation environment in terms of location, growing season, and/or year. Spearman’s correlation was used rather than Pearson’s correlation because the STI values were not normally distributed (Shapiro–Wilk test, p < 0.001), which is consistent with their calculation as the product of two yield variables. All the statistical analyses were conducted using SAS v9.4 (SAS Institute Inc., Cary, NC, USA) and Genotype-Environment Analysis in R software (GEA-R, v4.1; CIMMYT, Texcoco, Mexico). Supplementary graphics and calculations were performed in Microsoft Excel 2016 (Microsoft Corp., Redmond, WA, USA). The genotypic means reported in Table S2 correspond to unadjusted arithmetic means across three replications within each environment, which were calculated from individual plot observations using PROC MEANS in SAS v9.4.
3. Results
3.1. Climatic Conditions
Climatic conditions during the growing season varied considerably across locations and years (Table 1). Climate data were obtained from automatic weather stations located within each experimental site. In Celaya during 2023, the accumulated precipitation was 318.9 mm, distributed across 47 rainfall events, with an irregular pattern characterized by prolonged dry periods, particularly in September, when only 14.7 mm were recorded during the critical stages of pod development and grain filling. The mean maximum temperature was 29.8 °C, and the mean minimum temperature was 14.9 °C. In contrast, Celaya 2024 accumulated 370.8 mm across 60 events, with a better temporal distribution, notably 88.2 mm in September, which coincided with the reproductive stage of the crop. The temperatures were cooler than those in 2023, with a mean maximum of 27.8 °C and a mean minimum of 13.9 °C.
Table 1.
Climatic conditions during the growing season at the two locations across the two growing seasons.
La Llave experienced limiting conditions for crop production in both years. During 2023, the total precipitation was 186.8 mm across 23 events, with a mean maximum temperature of 30.8 °C and a mean minimum of 15.3 °C. The July–September period was the most critical for crop development: only 119.9 mm accumulated, barely one-third of the 370.0 mm recorded during the same months in 2024, and this window included the longest dry spell of the entire study (33 consecutive days without rainfall; Table 1), while the maximum temperatures remained consistently above 30 °C. Conditions in 2024 were more favorable, with 377.2 mm recorded across 35 events, including 164.8 mm in September. The temperatures were slightly lower than those in 2023 (mean maximum of 29.3 °C and mean minimum of 15.5 °C). The greater precipitation and better temporal distribution at La Llave in 2024 did not translate into proportional yield increases at this location, a pattern attributed to inherent edaphic constraints discussed in Section 3.6 and Section 4.1.
3.2. Agronomic Response by Environment
The mean trait values markedly differed across the six environments (Table 2). The days to flowering ranged from 39.5 days (Celaya 2024 rainfed) to 50.1 days (Celaya 2023, under both rainfed and rainfed + rescue irrigation conditions), whereas days to maturity ranged from 80.1 (Celaya 2023 rainfed) to 103.8 (La Llave 2024 rainfed). In 2023, compared with the rescue-irrigated plots, the rainfed plots reached physiological maturity approximately 10 days earlier (80.1 vs. 90.1 days); because maturity at Celaya 2023 was recorded at the treatment level (Section 2.5.1), this difference reflects treatment-level observations. This difference is consistent with the acceleration of maturity under the September moisture deficit (14.7 mm) in the rainfed plots, whereas the rescue irrigation applied at 55 days after sowing restored soil moisture during pod filling, generating a more favorable microenvironment (higher soil water availability and lower canopy temperature) that delayed senescence and extended the grain-filling period. In 2024, when no moisture deficit occurred and when drip irrigation coincided with adequate rainfall, soil moisture was not limiting in either treatment; the smaller difference in the opposite direction (96.7 vs. 92.4 days) was accompanied by high variability among genotypes within both environments (SD = 12.2 and 14.6 days), suggesting that genotypic responses in phenology to the microenvironmental conditions of each treatment (G × E) contributed to the difference that year, although an effect of irrigation management cannot be excluded. The 100-seed weight was highest in the two Celaya 2024 environments (30.9 and 30.8 g), which did not differ from each other, followed by La Llave 2024 and 2023 (29.5 and 28.3 g), and was lowest under rainfed conditions at Celaya 2023 (23.6 g; LSD at p ≤ 0.05 = 1.1 g; Table 2).
Table 2.
Descriptive statistics for four agronomic traits (means ± SD of 100 genotypes) across the six evaluation environments.
The mean grain yield varied widely among environments, ranging from 344.5 kg ha−1 at La Llave in 2023 to 1590.5 kg ha−1 at Celaya in 2023 under rainfed + rescue irrigation. In Celaya in 2023, compared with rainfed conditions, supplemental irrigation increased yield by 57.3%. This positive response was absent in 2024, when the mean rainfed yield (1333.8 kg ha−1) slightly exceeded that under supplemental irrigation (1289.6 kg ha−1), a result attributed to sufficient and well-distributed precipitation that met crop water requirements throughout the season. La Llave environments were the most limiting for crop production (evaluated exclusively under rainfed conditions), with mean yields representing approximately one-third of the overall mean (34.9% in 2023 and 35.6% in 2024).
3.3. Analysis of Variance and Main Effects
The combined analysis of variance across the six environments revealed highly significant differences (p < 0.01) for environment, genotype, and the G × E interaction for all the evaluated variables (Table 3). The environment was the greatest source of variation for days to flowering and grain yield, explaining 43.1% and 44.1% of the total sum of squares, respectively. With respect to days to maturity, environment (32.7%), the G × E interaction (31.3%), and genotype (30.4%) contributed similarly, whereas for 100-seed weight, genotype was the dominant source of variation (56.0%), followed by the G × E interaction (20.8%) and environment (16.5%). With respect to grain yield, the G × E interaction explained nearly twice the variation attributable to genotype (22.5% vs. 12.5%), indicating frequent changes in genotype ranking across environments and justifying the GGE biplot analysis (Section 3.7). Although significant for all the variables, the G × E interaction was smaller in magnitude than the environment effect for days to flowering, days to maturity, and grain yield, whereas genotype predominated for 100-seed weight; however, for grain yield, the G × E interaction remained nearly twice as large as the genotypic effect, indicating that changes in genotype ranking across environments were agronomically relevant. Genotype was treated as a fixed effect to allow direct mean comparisons among genotypes for selection purposes, as the objective of the study was to characterize the specific materials evaluated rather than to make inferences about a broader population of genotypes. The environment was likewise treated as a fixed effect, which is consistent with the goal of describing genotypic responses in the specific target environments included in the trial. The combined analysis was conducted using a randomized complete block design (RCBD) model with replications nested within environments. Unadjusted genotypic means were used in all comparisons. The percentages of the total sum of squares attributed to each source were calculated by multiplying each mean square by its corresponding degrees of freedom relative to the total corrected sum of squares.
Table 3.
Mean squares and statistical significance from the combined analysis of variance for four agronomic traits evaluated in 100 common bean genotypes across six environments.
Comparisons of means among genotypes were performed using Fisher’s least significant difference (LSD) test (p ≤ 0.05). Given the large number of genotypes evaluated (n = 100), LSD comparisons were used as an exploratory tool to identify outstanding materials rather than to make formal pairwise inferences among all possible combinations. Genotype selection for breeding purposes was based primarily on agronomic thresholds and the integrated interpretation of tolerance indices and GGE biplot results rather than on statistical significance alone.
The coefficients of variation (CVs) were acceptable for days to flowering (7.1%), days to maturity (3.3%), and 100-seed weight (7.0%), indicating adequate experimental precision. The coefficient of variation (CV) for grain yield was 39.4%, which is considered high but is expected in multi-environment field evaluations under rainfed conditions with contrasting environments. The elevated yield CV reflects environmental heterogeneity and an irregular rainfall distribution, as well as the quantitative nature of yield, which results in greater phenotypic plasticity and sensitivity to G × E interactions than phenological or morphological traits do.
3.4. Response to Contrasting Irrigation Treatments
The genotypic response to the irrigation treatments differed markedly between years. In 2023, rescue irrigation increased the mean yield by 57.3%, from 1011.5 ± 358 kg ha−1 under rainfed conditions to 1590.5 ± 571 kg ha−1 with rescue irrigation, a difference consistent with the highly significant environment effect (p < 0.01) detected in the combined ANOVA (Table 3). This contrast corresponds to a stress intensity index of 0.364 (SI = 1 − Ȳs/Ȳp, where Ȳs and Ȳp are the grand means under rainfed and rescue irrigation conditions, respectively). The genotypes showing the greatest yield increase under rescue irrigation were FM Anita (+564.8%), Actopan (+355.6%), Bayo INIFAP (+320.0%), and Bayo Berrendo (+243.1%), as calculated from the genotype yields reported in Table 4. In 2024, no yield-limiting moisture deficit conditions were apparent; the mean rainfed yield (1334 kg ha−1) slightly exceeded that under supplemental drip irrigation (1290 kg ha−1). Rainfed yield in 2024 (1334 kg ha−1) exceeded that in 2023 (1011 kg ha−1), which is consistent with a more favorable precipitation distribution. The higher rainfed + rescue irrigation yield in 2023 (1590 kg ha−1) relative to rainfed + supplemental drip irrigation yield in 2024 (1290 kg ha−1) reflects the greater yield response when rescue irrigation is applied at a critical moisture-deficit stage, compared with supplemental drip irrigation applied under already adequate soil moisture conditions. These two irrigation regimes differed in method, volume, and phenological timing and should therefore be interpreted as distinct moisture management treatments rather than directly comparable irrigated conditions. Among the outstanding genotypes, SCR 16 produced rainfed yields above 1500 kg ha−1 in both years (1526 kg ha−1 in 2023 [Table 4] and 2879 kg ha−1 in 2024 [Table S2]), whereas Dalia yielded only 1043 kg ha−1 under rainfed conditions but 2800 kg ha−1 under rainfed + rescue irrigation (Table 4). Genotypes FR21 G 69 11 L7 FJ (2671 kg ha−1) and G 9703 (2546 kg ha−1) achieved yields above 2500 kg ha−1 under rainfed conditions in 2024 (Table S2), demonstrating high yield potential under favorable moisture conditions. The genotype-level values for all the environments are provided in Table S2.
Table 4.
Drought tolerance indices for outstanding bean genotypes, Celaya 2023.
3.5. Drought Tolerance Indices
Drought tolerance indices calculated for Celaya 2023 (the environment in which contrasting moisture conditions most clearly differentiated genotypic responses) enabled the classification of genotypes according to three distinct performance criteria (Table 4): absolute yield under moisture-limiting conditions, relative susceptibility to yield reduction, and plasticity or positive response to supplemental irrigation. These indices reflect genotypic responses under this specific stress scenario and should not be interpreted as a general or stable drought tolerance ranking across all environments.
Genotypes were identified as having high productive capacity on the basis of STI values above 1.0, indicating above-average productivity under both rainfed and rainfed + rescue irrigation conditions at Celaya in 2023. Among these, FJ 6X6 T33 (STI = 2.169, GMP = 2342.3 kg ha−1), GPO 69 1E 18 FM (STI = 1.769, GMP = 2115.7 kg ha−1), FR21 Gpo 69 8 L7 FJ (STI = 1.697, GMP = 2072.1 kg ha−1), and SCR 16 (STI = 1.679, GMP = 2060.7 kg ha−1) showed the highest productive capacity across moisture conditions; however, their DSI values above 1.0 (1.122, 1.146, 1.095, and 1.240, respectively) indicate proportionally greater yield reductions under rainfed conditions relative to the population mean, reflecting greater relative susceptibility to moisture deficit despite their high absolute yields. Genotypes G69 SEL 16 FM (STI = 1.558, DSI = 0.785), Trat 9 SEG 61 FJ (STI = 1.480, DSI = 0.958) and FR-21 GP 061 60 L-7 (STI = 1.322, DSI = 0.997) combined high productive capacity with proportionally smaller yield reductions under moisture-limiting conditions (DSI < 1.0), representing the most favorable combinations of yield potential and relative stress tolerance identified in this study within the Celaya 2023 contrast (see below for validation against independent environments). Dalia (STI = 1.155, DSI = 1.724) also showed high productive capacity but with a disproportionately high yield reduction under rainfed conditions, which is consistent with strong irrigation-dependent plasticity rather than stress tolerance.
Genotypes FM Anita, Actopan, Bayo INIFAP, and Bayo Berrendo 2 presented DSI values above 1.9, reflecting disproportionately large yield reductions under rainfed conditions and strong positive responses to supplemental irrigation. These materials represent a distinct agronomic type—high-plasticity or irrigation-responsive genotypes—suited for environments where supplemental irrigation is available but not recommended for exclusively rainfed production. The GMP confirmed that the mean productivity of the genotypes was greatest in FJ 6X6 T33 (2342.3 kg ha−1), GPO 69 1E 18 FM (2115.7 kg ha−1), FR21 Gpo 69 8 L7 FJ (2072.1 kg ha−1), SCR 16 (2060.7 kg ha−1), G69 SEL 16 FM (1985.1 kg ha−1), Trat 9 SEG 61 FJ (1935.1 kg ha−1), and FR-21 GP 061 60 L-7 (1829.0 kg ha−1) across both moisture conditions in this environment and season. The index values for all 100 evaluated genotypes are provided in Table S2 of the Supplementary Material.
To evaluate whether this classification, derived from a single stress contrast, was representative of genotype performance beyond Celaya 2023, STI values were compared with mean grain yield across four additional, independent environments not used in index calculations (La Llave 2023, La Llave 2024, Celaya rainfed 2024, and Celaya rainfed + supplemental drip irrigation 2024; Section 2.7). A significant positive association was detected (Spearman’s ρ = 0.495, p < 0.001, n = 100), indicating that genotypes with higher STI values tended to also perform well across different locations, growing seasons, and years. SCR 16 provided the strongest confirmation of this pattern, ranking first among all 100 genotypes in terms of both the four-environment independent mean and the overall six-environment mean. Agreement between the two rankings was, however, only partial: just 2 of the top 10 genotypes by STI (SCR 16 and G 6953) also ranked among the top 10 for independent-environment yield, and Trat 9 SEG 61 FJ and FR-21 GP 061 60 L-7 (despite their favorable DSI values under the Celaya 2023 contrast) ranked 36th and 51st, respectively, for mean yield across the independent environments. This finding indicates that the STI-based classification is not simply an artifact of the single 2023 contrast but that the favorable yield–tolerance combination identified for some genotypes may be specific to that stress event rather than broadly expressed across additional site-years.
3.6. Agronomic Performance at La Llave
La Llave environments severely limited crop production, with mean yields of 344.5 and 351.7 kg ha−1 in 2023 and 2024, representing 34.0% and 26.4% of the same-year mean rainfed yield at Celaya, respectively. Despite more than double the total precipitation at La Llave in 2024 (377.2 mm vs. 186.8 mm in 2023), the mean yield increased only marginally (351.7 vs. 344.5 kg ha−1). This disproportionate response suggests that factors other than moisture availability constrained productivity. The alkaline soil pH (8.11), low organic matter content (1.63%), and limited iron availability (2.07 mg kg−1) of the Haplic Phaeozem soil are consistent with this interpretation, although their independent contributions to yield limitation could not be quantified within the current experimental design (see Section 4.1). The limiting environmental conditions at La Llave extended the crop cycle, with days to maturity of 90.1 (2023) and 103.8 (2024), compared with 80–96 days at Celaya. Despite these limiting conditions, certain genotypes exhibited specific adaptations. In 2023, the highest-yielding genotypes were P. SaltilloXTA-245-1-2-2 (1330 kg ha−1), G 9967 (1303 kg ha−1), P. SaltilloXTA-245-1-2-4 (1160 kg ha−1), and Negro Perla 90 (1044 kg ha−1). In 2024, the best-performing genotypes were Arriaga-2-Ng-Opaco (1037 kg ha−1), AP. 20 7116 (969 kg ha−1), Granada (947 kg ha−1) and Huitel-143 (891 kg ha−1). The 100-seed weight at La Llave (28.3–29.5 g) was close to or slightly above the overall mean (28.1 g); it exceeded that of both Celaya 2023 environments but was lower than that of both Celaya 2024 environments (30.8–30.9 g; Table 2). The maintenance of 100-seed weight at La Llave despite low yields may reflect compensatory relationships among yield components under reduced pod load per plant [11].
3.7. Genotype × Environment Interaction
GGE biplot analysis (Figure 1) revealed that the first two principal components explained 72.71% of the total variation (PC1 = 52.39%, PC2 = 20.32%) and allowed the identification of clear patterns of genotypic response across environments. Because this analysis integrates grain yield data from all six environments spanning two years, two locations, and contrasting moisture regimes, the resulting genotype and environment patterns inherently reflect the consistency of the response across these independent conditions rather than resting on a single environmental contrast, unlike the Celaya-2023-only drought tolerance indices (Section 3.5), for which ranking consistency was assessed separately against independent environments. The Celaya 2024 environments (rainfed and rainfed + supplemental drip irrigation) clustered closely in quadrant I with long vectors, indicating high genotypic discrimination and similar genotypic behavior under adequate precipitation. In contrast, Celaya 2023 rainfed + rescue irrigation resulted in the longest vector among all the environments, which was located in quadrant IV with the highest mean yield (1590 kg ha−1), with a strongly negative PC2 component, forming a wide angle with the Celaya 2024 environments and reflecting the contrasting conditions imposed by the reproductive-stage moisture deficit followed by rescue irrigation.
Figure 1.
GGE biplot based on environment-centered data with genotype-focused singular value partitioning (SVP = 1) for the grain yield of 100 common bean genotypes evaluated across six environments in the Bajío region, Mexico (2023–2024). PC1 and PC2 explained 52.39% and 20.32% of the GGE variation, respectively. Vectors represent test environments (RF = rainfed; RF+I = rainfed + rescue irrigation [2023] or rainfed + supplemental drip irrigation [2024]); points represent individual genotypes. Labeled genotypes showed outstanding performance, with either specific or broad adaptation across environments. The environmental groupings shown are preliminary and are based on the six environments evaluated.
La Llave environments (2023 and 2024) were positioned together in quadrant I with short vectors, in contrast to the long vectors of the Celaya 2024 environments in the same quadrant, indicating low genotypic response variability across years. Celaya rainfed 2023 showed a shorter vector than the other Celaya environments and a direction close to that of the La Llave environments, indicating greater similarity with La Llave environments than with the other Celaya environments; this suggests that genotypic responses under moderate moisture-limiting conditions were relatively consistent across these three environments. The short vectors of La Llave 2023 and 2024, and to a lesser extent, the intermediate-length vector of Celaya rainfed 2023, indicate limited genotypic discrimination; at La Llave, this was likely because the combined effect of moisture limitation and edaphic constraints at La Llave (including alkaline pH, Fe deficiency, and low organic matter (Section 3.6)) suppressed yield potential expression more uniformly across genotypes, reducing the phenotypic variance available for discrimination.
Genotypes located near the biplot origin showed a low contribution to the G × E interaction, indicating relative stability across environments; however, proximity to the origin does not necessarily imply high mean yield, and full interpretation of stability and mean performance requires complementary views such as the which-won-where polygon biplot (Figure 2) and the mean vs. stability biplot. The average environment coordination (AEC) direction aligned closely with PC1 (mean projection on PC1 = 0.496; on PC2 = 0.001), confirming that PC1 effectively captures the mean yield across environments; therefore, a separate mean vs. stability biplot was not required. SCR 16 was positioned at the positive extreme of PC1, nearly on the horizontal axis (PC2 ≈ 0), indicating that its consistently high yield is primarily associated with the genotypic main effect captured by PC1, suggesting broad adaptation across the evaluated environments. FR21 G 69 21 L7 FM showed specific adaptation to La Llave 2024 (vector angle = 8.4°), positioned in quadrant I in close proximity to that environment. Its association with La Llave 2023 was weak (vector angle = 83.5°), which is consistent with the very short vector length of that environment noted above and is not interpreted as evidence of adaptation. Dalia, Bayo INIFAP, Actopan, and FM Anita were associated with Celaya 2023 rainfed + rescue irrigation in quadrant IV, reflecting a positive response to rescue irrigation under moisture-limiting conditions. Genotypes G 1398 and Amarillo 155 were positioned far from the origin in quadrants II and III, respectively, indicating generally low yields.
Figure 2.
Which-won-where GGE polygon biplot for grain yield of 100 common bean genotypes across six environments in the Bajío region, Mexico (2023–2024). Vertices of the polygon represent genotypes with the highest yield in one or more environments. Dashed lines delineate sectors; the environment falling within each sector identifies the winning genotype for that environment group.
The analysis revealed three preliminary environmental groupings, considered tentative given the limited number of sites and seasons evaluated, and pending validation across additional cycles: (1) Celaya under rescue irrigation following reproductive-stage moisture deficit, characterized by high genotypic discrimination and a strong negative PC2 component; (2) Celaya rainfed and rainfed + supplemental drip irrigation under favorable water conditions (2024), with high PC1 discrimination; and (3) La Llave 2023 and 2024 together with Celaya rainfed 2023, characterized by limiting environmental conditions and limited genotypic discrimination. These groupings should be interpreted as exploratory response patterns based on the evaluated environments rather than as definitive mega-environments.
3.8. Outstanding Genotypes
On the basis of the results of the integrated analysis of all the variables and environments, outstanding genotypes were identified for different breeding and production purposes (Table 5). In rainfed environments with moisture-limiting conditions, as observed at Celaya, SCR 16 excelled across both years, with yields above 1500 kg ha−1 and the highest mean yield across all six environments (1711 kg ha−1), which is consistent with broad adaptation across the evaluated environments, as confirmed by its near-zero PC2 score in the GGE biplot (STI = 1.679, GMP = 2060.7 kg ha−1).
Table 5.
Outstanding bean genotypes identified according to different selection criteria.
Genotypes Trat 9 SEG 61 FJ, FR-21 GP 061 60 L-7, and G69 SEL 16 FM combined high productive capacity (STI > 1.32) with proportionally smaller yield reductions under moisture-limiting conditions (DSI < 1.0); among these, G69 SEL 16 FM showed both the highest STI (1.558) and lowest DSI (0.785) of the three and ranked highest in the independent-environment validation (23rd of 100, versus 36th and 51st for Trat 9 SEG 61 FJ and FR-21 GP 061 60 L-7, respectively; Section 3.5), making it the strongest candidate of the group for combined yield potential and relative stress tolerance. FJ 6X6 T33 had the highest STI (2.169), GMP (2342.3 kg ha−1), and rainfed yield (1802 kg ha−1) recorded at Celaya 2023, although its DSI (1.122) also indicated above-average relative susceptibility. GPO 69 1E 18 FM presented one of the highest STI (1.769) and GMP (2115.7 kg ha−1) values recorded in this study, reflecting its exceptional productive capacity under both moisture conditions at Celaya 2023 despite its above-average relative susceptibility (DSI = 1.146), and could be incorporated into adaptation and yield trials for variety registration or used as a parent in breeding programs. Dalia stood out for combining high productive capacity under rainfed + rescue irrigation (2800 kg ha−1, STI = 1.155) with large seed size (>30 g), making it well suited for production systems where supplemental irrigation is available; however, its DSI of 1.724 indicates strong relative susceptibility to yield reduction under rainfed-only conditions.
Under severely limiting rainfed conditions at La Llave in 2023, genotypes P. SaltilloXTA-245-1-2-2, G 9967, and P. SaltilloXTA-245-1-2-4 demonstrated specific adaptation patterns, with yields three to four times above the environmental mean. The P. SaltilloXTA lines, derived from interspecific crosses with yellow tepary bean (Phaseolus acutifolius), showed superior performance under severely limiting rainfed conditions, supporting the potential value of interspecific breeding between common bean and tepary bean for adaptation to moisture-limited environments. These experimental lines represent valuable genetic resources for breeding programs targeting limited rainfed environments.
4. Discussion
4.1. Environmental Influence on Yield
These results underscore the dominant influence of the environment on bean yield under rainfed and water-limited conditions. Despite comparable total precipitation (318.9 mm in 2023 vs. 370.8 mm in 2024, a 14% difference), the marked difference in yield between years at Celaya highlights the critical importance of precipitation timing during phenologically sensitive stages. Reproductive-stage precipitation deficit, with only 14.7 mm in September 2023 coinciding with pod development and grain filling, reduced yield by 24.1% compared with 2024, when 88.2 mm were recorded during the same period; this nearly sixfold contrast in September precipitation, well beyond the 14% difference in seasonal totals, supports timing rather than the total seasonal amount as the primary driver of the yield difference between years. These findings are consistent with studies reporting that water stress during reproductive stages causes greater yield reductions than does stress during vegetative stages does [27]. Rosales et al. [11] reported that water stress during the reproductive stage in common bean triggers flower and small-pod abortion, resulting in reductions in yield and 100-seed weight. This pattern was not clearly observed at La Llave, where the 100-seed weight remained relatively stable despite limiting environmental conditions, possibly due to a compensatory effect under reduced pod load [28]. Despite greater precipitation in 2024, the limited yield response at La Llave is consistent with the inherent edaphic constraints of the Haplic Phaeozem soil, including its alkaline pH (8.11), which is known to limit iron availability (Fe = 2.07 mg kg−1) and phosphorus solubility (P-Bray not detectable) in calcareous soils [29], its moderately low organic matter content (1.63%), and its high calcium saturation (82.8% of the cation exchange capacity), which may antagonize the uptake of Fe, Mg, and Mn. These edaphic characteristics likely limit crop productivity independent of the increase in precipitation recorded in 2024 and should be considered jointly with moisture availability when interpreting yield performance at this site. However, the experimental design did not independently quantify the contributions of individual edaphic factors to yield limitation, and these interpretations should be considered agronomic inference rather than direct experimental evidence.
The differential irrigation response between years (57.3% yield increase in 2023 vs. −3.3% in 2024) is consistent with the principle that the benefit of supplemental irrigation is substantial only under water-limited conditions. It should be noted, however, that these two irrigation regimes differed in method, total volume, and application timing (a single 30 mm gravity event in 2023 versus approximately 80 mm applied via drip irrigation in 2024) and therefore represent distinct moisture management treatments rather than directly comparable irrigated conditions. In 2024, supplemental irrigation coincided with adequate natural precipitation and therefore did not provide a yield advantage. This variability in response to supplemental irrigation is characteristic of semiarid regions of Mexico; Cid-Ríos et al. [18] reported that in Zacatecas, within the semiarid Altiplano Basin, rainfall deficits leading to water stress occur in three out of every five years, manifesting as terminal drought at some sites and intermittent drought at others. In Celaya, mean maximum temperatures 2 °C lower in 2024 (27.8 °C vs. 29.8 °C in 2023) further contributed to improved crop performance. The combination of well-distributed precipitation and cooler temperatures in 2024 resulted in rainfed yields 31.9% higher than those in 2023.
4.2. Genetic Diversity and Breeding Potential
The highly significant genotype effects for all the traits evaluated (p < 0.01) confirm meaningful phenotypic differences among genotypes, a fundamental prerequisite for genetic progress through selection. The model coefficients of determination (R2 = 0.83–0.96) for phenological traits and seed weight indicate that these variables were explained with high precision by the fitted model, and for 100-seed weight in particular, genotype was the dominant source of variation (56.0% of the total sum of squares; Table 3), which is consistent with the intermediate to high heritability reported for these traits in common bean [18], suggesting that selection is likely to be effective. The moderate R2 for grain yield (0.81) reflects the highly quantitative nature of this trait and its greater sensitivity to environmental variation than to phenological and morphological traits. Mwale et al. [24] reported a broad-sense heritability of 0.79 for seed yield in tepary bean evaluated across environments with and without stress, confirming that despite strong environmental influence, sufficient genetic variation exists to achieve selection gains. Additionally, Cid-Ríos et al. [18] reported that 100-seed weight, a trait with intermediate to high heritability, can serve as an effective selection criterion in regions where seed size is a commercially important attribute.
The rainfed yields of the outstanding genotypes FJ 6X6 T33, G69 SEL 16 FM, GPO 69 1E 18 FM, FR21 Gpo 69 8 L7 FJ, SCR 16, Trat 9 SEG 61 FJ, and FR-21 GP 061 60 L-7 exceeded the overall rainfed mean observed in 2023 by 44–78%, demonstrating high productive capacity under moisture-limiting conditions at Celaya. Among these, G69 SEL 16 FM, Trat 9 SEG 61 FJ, and FR-21 GP 061 60 L-7 additionally showed proportionally smaller yield reductions relative to the population mean (DSI < 1.0), reflecting a more favorable combination of yield potential and relative stress tolerance; this distinction is agronomically relevant, as high absolute yield under stress does not necessarily coincide with low relative susceptibility to moisture deficit. In contrast, in FJ 6X6 T33, GPO 69 1E 18 FM, FR21 Gpo 69 8 L7 FJ, and SCR 16, despite their high absolute yields, the DSI values were above 1.0, indicating greater proportional susceptibility to moisture-limiting conditions. Under rainfed conditions in 2023, the grain yield ranged from 295.3 to 1801.6 kg ha−1 across all 100 genotypes, reflecting the substantial phenotypic diversity available for selection. Among the high-STI genotypes (STI > 1.3, n = 8), the rainfed + rescue irrigation yields were concentrated in a relatively high range (2291.6–3045.3 kg ha−1), indicating that differences in water availability across years and locations amplify G × E interaction effects. This pattern supports the evaluation of germplasm accessions across rainfed environments with contrasting precipitation levels to identify genotypes with broad adaptability and yield stability across the evaluated environments. These results are consistent with those of Mwale et al. [24], who reported that the environment contributed 52.62% of the total yield variation in tepary bean under severe drought, whereas genotype and G × E interactions explained 33.56% and 13.82%, respectively. This confirms that although the environment is the dominant factor, sufficient exploitable genetic variability exists.
The superior performance of P. SaltilloXTA lines at La Llave supports the potential value of interspecific breeding for transferring adaptation to limiting environments from tepary bean to common bean. Phaseolus acutifolius evolved under extreme aridity in the Sonoran Desert and has been reported to possess adaptive mechanisms, including early stomatal closure, efficient osmotic adjustment, and reduced leaf area, that minimize water loss [10]; these physiological traits were not directly assessed in the present study and are cited here as plausible mechanisms consistent with the superior field performance observed under severely limiting rainfed conditions at La Llave, rather than as direct findings of this work. Mwale et al. [24] reported that these mechanisms allow P. acutifolius to maintain yields above 600 kg ha−1 under severe drought, whereas P. vulgaris produces less than 200 kg ha−1. The successful introgression of these traits into the P. vulgaris genetic background represents a promising strategy, warranting further physiological and molecular characterization, for developing varieties adapted to severely water-limited rainfed environments.
4.3. Tolerance Indices as Selection Tools
GMP, STI, and DSI demonstrated complementary utility for classifying genotypes according to their response to contrasting moisture conditions in Celaya 2023. The GMP and STI were selected to identify genotypes with high absolute productivity under both moisture regimes, whereas the DSI was included to quantify relative susceptibility (the proportional yield reduction under limiting conditions relative to the population mean), providing a dimension of evaluation not captured by the GMP or STI alone [16]. The selection of these three indices over other available alternatives was informed by their consistent performance in discriminating genotypic responses under contrasting moisture conditions in common bean and related legumes [6,18,24,25,26]. STI was particularly effective for identifying genotypes with high yields under both conditions (FJ 6X6 T33, STI = 2.169; GPO 69 1E 18 FM, STI = 1.769). Selection based on multiple indices is essential since genotypes cannot be reliably discriminated using a single criterion [16]. Among the high-STI genotypes, G69 SEL 16 FM (DSI = 0.785), Trat 9 SEG 61 FJ (DSI = 0.958) and FR-21 GP 061 60 L-7 (DSI = 0.997) presented DSI values less than 1.0, indicating proportionally smaller yield reductions relative to the population mean under moisture-limiting conditions (a desirable characteristic under unpredictable rainfed conditions where stress severity varies between years). In contrast, in FJ 6X6 T33 (DSI = 1.122), GPO 69 1E 18 FM (DSI = 1.146), FR21 Gpo 69 8 L7 FJ (DSI = 1.095), and SCR 16 (DSI = 1.240), despite their high absolute yields and STI values, the proportional susceptibility was greater than the population mean, indicating that high productive capacity does not necessarily coincide with low relative susceptibility. Acosta-Díaz et al. [30] recommend combining a yield-reduction index (such as DSI) with a productivity index across moisture conditions (such as STI or GMP) to simultaneously select for high yield potential and relative stress tolerance. However, recognizing the inherent limitations of these indices is important. These indices were calculated from a single stress contrast (Celaya 2023) and should not be extrapolated as stable tolerance rankings across environments or seasons. The DSI assumes a linear relationship between stressed and nonstressed yield, which may not hold in all cases; moreover, these indices capture final yield outcomes but not the underlying physiological mechanisms conferring tolerance. Complementary characterization of physiological traits, including water use efficiency, osmotic adjustment, root architecture, and photosynthetic rate, in the identified genotypes would be valuable for understanding the mechanisms underlying their field-based responses; these traits were not assessed in the present study and represent a priority for future characterization.
The results illustrate the fundamental distinction between high absolute yield under moisture-limiting conditions and low relative susceptibility as captured by the DSI. FJ 6X6 T33 and GPO 69 1E 18 FM achieved the two highest STI values recorded at Celaya 2023 (2.169 and 1.769) and high rainfed yields (1802 and 1615 kg ha−1, respectively; Table 4), yet their DSI values (1.122 and 1.146) indicate proportionally above-average yield reductions under rainfed conditions, a pattern consistent with genotypes whose high yield potential comes at the cost of greater sensitivity to moisture deficit. Trat 9 SEG 61 FJ and FR-21 GP 061 60 L-7, by contrast, combined high rainfed yields (1561 and 1460 kg ha−1, respectively) with DSI values just below 1.0, and G69 SEL 16 FM (rainfed yield = 1678 kg ha−1) combined an even higher STI (1.558) with the lowest DSI of the three (0.785). Together, these three genotypes represent the most favorable combinations of yield potential and relative stress tolerance identified in this study, with G69 SEL 16 FM showing the strongest overall balance of the two. Estrada-Prado et al. [31] reported that varieties with greater drought tolerance (lower DSI) are not necessarily those with the highest yields under stress; rather, the highest-yielding varieties are those whose yield decreases proportionally less when they transition from rainfed + irrigation to exclusively rainfed conditions. For breeding purposes, it is therefore desirable to identify genotypes that combine competitive absolute yields with minimal proportional yield reduction.
4.4. Genotype × Environment Interaction and Breeding Strategies
The significant G × E interaction (22.5% yield variation) is consistent with the results of previous studies on common bean in Mexico. López-Salinas et al. [32] reported that in black bean evaluated across 15 locations, the G × E interaction explained 23% of the variability, whereas the environment and genotype accounted for 59% and 7%, respectively, confirming that the environment exerted the greatest influence on yield, followed by the G × E interaction. Acosta-Díaz et al. [30] reported that G × E interactions can explain up to 48% of the phenotypic variability in rainfed bean yield, underscoring the importance of multi-environment evaluations to identify genotypes with broad or specific adaptations.
The identification of three preliminary environmental groupings (considered tentative given the limited number of sites and seasons evaluated and pending validation across additional cycles) suggests that selection should be conducted in environments representative of target production conditions rather than in a single favorable site. Genotypes with specific adaptation patterns (Actopan and FM Anita for rainfed + rescue irrigation conditions; P. SaltilloXTA lines as observed at La Llave in 2023 for severely limiting rainfed conditions) can outperform broadly adapted genotypes in their target environments, justifying the development of specialized varieties for specific niches. SCR 16 showed the best combination of high yield and consistent performance across environments, with yields above the environmental mean in five of the six evaluated environments (the exception being La Llave 2023, where it ranked 55th of 100), which is consistent with the limited genotypic discrimination noted for that environment in Section 3.7), a consistency that is particularly valuable for rainfed farmers facing high interannual climatic variability. Its performance pattern is consistent with that of the variety Negro Papaloapan, which showed the highest mean yield (1.4 t ha−1) and one of the smallest G × E interactions in a 15-location study in Mexico [32], supporting the characterization of SCR 16 as a broadly adapted genotype within the evaluated network. Acosta-Díaz et al. [30] reported that, without exception, the best-performing varieties under both irrigated and drought conditions were those originating from the testing region, confirming that local adaptation is critical under water deficit conditions.
Differential Effects of Growing Season and Water Deficit
It is important to distinguish between the effects of the growing season and water deficit on the magnitude of G × E. Romero-Félix et al. [33] demonstrated that the growing season (encompassing year, planting date, and soil moisture availability) had a greater effect on yield than did the within-season water deficit per se, with yield reductions of 65% between seasons (spring-summer vs. summer-autumn) compared with only 17% for water deficit between rainfed + irrigation and rainfed conditions within the same season. In the present study, La Llave 2023 represented both a contrasting season and a severely limiting rainfed environment, suggesting that the large phenotypic variance observed results from a combined effect of seasonal factors, including cumulative water deficit duration, soil water retention capacity, and possible nutritional limitations, rather than from moisture deficit alone. The independent contributions of these factors could not be separated within the current experimental design and should be considered agronomic inference.
GGE biplot analysis confirmed that La Llave 2023 showed the greatest environmental contrast with Celaya rainfed + rescue irrigation 2023, forming the widest angle among all 15 environment pairs in the biplot (154.4°) with that environment. Although severely limiting environments reduce overall phenotypic variance, as evidenced by the short vectors associated with La Llave environments in the biplot, indicating limited genotypic discrimination, they remain valuable for identifying genotypes with field-based stress adaptation rather than mere yield potential [13]. The GGE biplot approach used here complements the AMMI analysis previously reported for Mesoamerican bean [32]; both methods enable the identification of discriminating environments and genotypes with broad or specific adaptation patterns and together constitute effective complementary tools for multi-environment breeding strategies in the Bajío and other bean-producing regions of Mexico.
4.5. Research Limitations
The present study provides a multi-environment characterization of 100 common bean genotypes across six environments defined by two locations, two growing seasons, and two moisture regimes at one location. While the results offer a useful foundation for breeding decisions in the Bajío region, several limitations should be considered when the findings are interpreted.
First, the evaluation was conducted at two sites within the Bajío region of central Mexico. Although these sites represent contrasting edaphoclimatic conditions (a high-productivity Vertisol environment at Celaya and a restrictive Haplic Phaeozem environment at La Llave), they do not capture the full range of rainfed production environments in Mexico where common bean is grown. Replication across additional representative sites in the Altiplano, the Valleys of the South, and the Gulf Coast regions would be necessary to validate broad adaptation claims and the preliminary environmental groupings identified by GGE biplot analysis.
Second, the trial period spans two growing seasons (2023–2024). While contrasting precipitation patterns between years provided meaningful environmental differentiation, two cycles are insufficient to fully characterize long-term genetic stability or to confirm the repeatability of the identified genotypic rankings. The G × E interaction patterns and preliminary environment groupings reported here should be considered exploratory until validated across additional cycles, ideally including both favorable and unfavorable years under independent conditions.
Third, the abiotic stress characterization was limited to moisture availability, as inferred from precipitation records and yield responses to contrasting irrigation treatments. Other abiotic stresses relevant to the target environments (including heat stress, soil alkalinity-induced micronutrient deficiency, and terminal heat at grain filling) were present but not independently assessed. In particular, the La Llave site exhibited edaphic constraints (alkaline pH, Fe deficiency, P unavailability) that may have interacted with moisture limitation, but their independent contributions to yield reduction could not be quantified within the current design. Future studies incorporating multiple stress evaluations and physiological characterization would more fully explain the genotypic responses observed.
Fourth, the 100 genotypes evaluated represent a curated subset of the germplasm available in the CEBAJ-INIFAP breeding program and do not encompass the full diversity of common bean germplasm available for the Bajío region or Mexico. While the set was selected to maximize representation across commercial market classes, gene pools, and material types, conclusions about the relative performance of unrepresented accessions cannot be drawn from these results. This sample size was adequate to detect the highly significant genotype and G × E effects reported in Section 3.3, but no independent genotype validation population (a separate set of genotypes evaluated under the same conditions to confirm the identified rankings) was included in this study; this is a relevant constraint when interpreting individual genotype rankings or the preliminary environmental groupings discussed throughout this section. Broader germplasm screening incorporating additional materials from national and international gene banks would strengthen the scope of future multi-environment evaluations.
Finally, drought tolerance indices (GMP, STI, DSI) were calculated exclusively from Celaya 2023 data, the only environment in which a clearly differentiated rainfed versus rescue irrigation contrast was available within the same season and location. These indices therefore reflect genotypic responses under a specific stress scenario and should not be generalized as stable tolerance rankings without replication across multiple stress events and seasons. To partially address this limitation, the ranking consistency of the Celaya-2023-derived stress-tolerance index was evaluated against the grain yield performance in four additional, independent environments not used in the index calculation (Section 3.5), providing supporting evidence for the practical relevance of the identified rankings beyond the original stress contrast. This approach validates ranking consistency across independent environments rather than substituting for replication of the stress contrast itself or for evaluation against an independent genotype population across additional stress events and seasons.
5. Conclusions
Multi-environment evaluation under contrasting moisture conditions enabled the identification of germplasm accessions with differential adaptation patterns to the climatic variability of the Bajío region. The significance of the G × E interaction confirms that effective selection for common bean under variable moisture availability requires evaluation in target environments, where the temporal distribution of precipitation, more than its total amount, determines crop performance.
Genotypes FJ 6X6 T33, GPO 69 1E 18 FM, FR21 Gpo 69 8 L7 FJ, SCR 16, G69 SEL 16 FM, Trat 9 SEG 61 FJ, and FR-21 GP 061 60 L-7 demonstrated high productive capacity under moisture-limiting conditions (STI ≥ 1.32), as evaluated at Celaya 2023. Among these, G69 SEL 16 FM, Trat 9 SEG 61 FJ, and FR-21 GP 061 60 L-7 additionally showed proportionally smaller yield reductions under rainfed conditions (DSI < 1.0); together, these three genotypes represent the most favorable combinations of yield potential and relative moisture-deficit tolerance identified in this study, with G69 SEL 16 FM showing the strongest overall balance of the two (STI = 1.558, DSI = 0.785). These two performance dimensions (high absolute yield and low relative susceptibility) are distinct and should be considered jointly when selecting materials for rainfed breeding programs. These materials can be incorporated as parents in common bean breeding programs, contributing to the development of high-yielding genotypes adapted to variable rainfed conditions.
Field-based evidence from La Llave in 2023 supports the potential value of interspecific breeding with Phaseolus acutifolius as a promising strategy for adaptation to severely limiting rainfed environments, providing new opportunities to expand the genetic base of common bean and develop varieties adapted to marginal environments. These results should be considered preliminary, as they are based on a single site-year observation, and further evaluation across additional cycles and environments is needed to confirm the consistency of this response. This interspecific germplasm constitutes a strategic genetic resource for breeding programs focused on climatic resilience.
The combined use of drought tolerance indices and G × E interaction analysis through a GGE biplot provides a useful methodological framework for characterizing germplasm adaptation and response patterns within the evaluated network, with the main contribution being the multi-environment dataset and the preliminary identification of promising genotypes for the Bajío region and similar rainfed production systems. The identified environmental groupings and genotypic rankings should be validated across additional sites and seasons before being used as the basis for regional variety recommendations.
Supplementary Materials
The following supporting information can be downloaded at: https://www.mdpi.com/article/10.3390/horticulturae12111326/s1, Table S1: List of the 100 common bean genotypes evaluated, including type (improved variety, experimental line, or native variety), commercial market class, growth habit, and origin. Table S2: Unadjusted genotypic means (arithmetic means of three replications) for grain yield (kg ha−1), days to flowering, days to maturity, and 100-seed weight for each of the 100 common bean genotypes across the six evaluation environments and drought tolerance indices (GMP, STI, and DSI) for each genotype calculated for Celaya 2023.
Author Contributions
Conceptualization, A.A.P.-G. and J.A.A.-G.; methodology, A.A.P.-G., J.A.A.-G. and V.M.-T.; software, A.A.P.-G. and C.L.A.-M.; validation, A.A.P.-G., J.A.A.-G. and C.L.A.-M.; formal analysis, A.A.P.-G., C.L.A.-M. and J.G.R.-P.; investigation, A.A.P.-G., V.M.-T. and C.L.A.-M.; resources, J.A.A.-G. and R.Y.-L.; data curation, A.A.P.-G.; writing—original draft preparation, A.A.P.-G.; writing—review and editing, J.A.A.-G., C.L.A.-M., V.M.-T. and R.Y.-L.; visualization, A.A.P.-G. and J.G.R.-P.; supervision, C.L.A.-M. and R.Y.-L.; project administration, J.A.A.-G.; funding acquisition, J.A.A.-G. All authors have read and agreed to the published version of the manuscript.
Funding
This research was funded by the National Institute of Forestry, Agricultural and Livestock Research (INIFAP) through the project “Development of Improved Bean Cultivars for Mexico” (SIGI funding number: 16215236227).
Data Availability Statement
The original contributions presented in this study are included in the article and Supplementary Material. Further inquiries can be directed to the corresponding author.
Acknowledgments
The authors thank the technical staff of the Bajío Experimental Station for their assistance in managing the experiment. The first author acknowledges the Tecnológico Nacional de México-Instituto Tecnológico de Roque for the support provided during his postgraduate studies and acknowledges the Secretariat of Science, Humanities, Technology and Innovation (SECIHTI), formerly Conahcyt, for the national scholarship granted to pursue Ph.D. studies in Agri-Food Production Sciences.
Conflicts of Interest
The authors declare no conflicts of interest. The funders had no role in the design of the study; in the collection, analyses, or interpretation of data; in the writing of the manuscript; or in the decision to publish the results.
Abbreviations
The following abbreviations are used in this manuscript:
| GMP | Geometric Mean Productivity |
| STI | Stress Tolerance Index |
| DSI | Drought Susceptibility Index |
| G × E | Genotype × Environment Interaction |
| GGE | Genotype + Genotype × Environment |
| PC1 | First Principal Component |
| PC2 | Second Principal Component |
| DF | Days to Flowering |
| DM | Days to Maturity |
| 100 SW | 100-Seed Weight |
| GY | Grain Yield |
| CEBAJ | Campo Experimental Bajío |
| INIFAP | National Institute of Forestry, Agricultural and Livestock Research |
| CV | Coefficient of Variation |
| LSD | Least Significant Difference |
| RCBD | Randomized Complete Block Design |
| AEC | Average Environment Coordination |
References
- Farrow, A.; Muthoni-Andriatsitohaina, R. (Eds.) Atlas of Common Bean Production in Africa, 2nd ed.; Pan-Africa Bean Research Alliance (PABRA); International Center for Tropical Agriculture (CIAT): Rome, Italy, 2020; Available online: https://alliancebioversityciat.org/publications-data/atlas-common-bean-production-africa-2nd-ed (accessed on 19 October 2026).
- Carović-Stanko, K.; Liber, Z.; Vidak, M.; Barešić, A.; Grdiša, M.; Lazarević, B.; Šatović, Z. Genetic diversity of Croatian common bean landraces. Front. Plant Sci. 2017, 8, 604. [Google Scholar] [CrossRef] [Scilit] [PubMed]
- Lone, A.A.; Khan, M.N.; Gul, A.; Dar, Z.A.; Iqbal, A.M.; Lone, B.A.; Nisar, F. Common beans and abiotic stress challenges. Curr. J. Appl. Sci. Technol. 2021, 40, 41–53. [Google Scholar] [CrossRef] [Scilit]
- Masson-Delmotte, V.; Zhai, P.; Pirani, A.; Connors, S.L.; Péan, C.; Berger, S.; Caud, N.; Chen, Y.; Goldfarb, L.; Gomis, M.I.; et al. (Eds.) Climate Change 2021: The Physical Science Basis; Contribution of Working Group I to the Sixth Assessment Report of the Intergovernmental Panel on Climate Change; Cambridge University Press: Cambridge, UK, 2021. [Google Scholar]
- Jha, U.C.; Bohra, A.; Nayyar, H.; Varshney, R. Advances in “omics” approaches to tackle drought stress in grain legumes. Plant Breed. 2020, 139, 1–27. [Google Scholar] [CrossRef] [Scilit]
- Tay, K.; Zapata, N.; Urrea, C.A.; Elazab, A.; Garriga, M.; León, L. Detection of terminal drought tolerance in bean genotypes and commercial bean cultivars in Chile. Agronomy 2025, 15, 1499. [Google Scholar] [CrossRef] [Scilit]
- Labastida, D.; Ingvarsson, P.K.; Rendón-Anaya, M. Dissecting the genetic basis of drought responses in common bean using natural variation. Front. Plant Sci. 2023, 14, 1143873. [Google Scholar] [CrossRef] [Scilit] [PubMed]
- Rao, I.M. Advances in improving adaptation of common bean and Brachiaria forage grasses to abiotic stresses in the tropics. In Handbook of Plant and Crop Physiology; Pessarakli, M., Ed.; CRC Press; Taylor and Francis Group: Boca Raton, FL, USA, 2014; pp. 847–889. [Google Scholar]
- Villordo-Pineda, E.; Gonzalez-Chavira, M.M.; Giraldo-Carbajo, P.; Acosta-Gallegos, J.A.; Caballero-Perez, J. Identification of novel drought-tolerant-associated SNPs in common bean (Phaseolus vulgaris). Front. Plant Sci. 2015, 6, 546. [Google Scholar] [CrossRef] [Scilit] [PubMed]
- Jiménez-Galindo, J.C.; Acosta-Gallegos, J.A. Caracterización de genotipos criollos de frijol tepari (Phaseolus acutifolius A. Gray) y común (Phaseolus vulgaris L.) bajo temporal. Rev. Mex. Cienc. Agríc. 2012, 3, 1565–1577. [Google Scholar] [CrossRef] [Scilit][Green Version]
- Rosales, M.A.; Ocampo, E.; Rodríguez-Valentín, R.; Olvera-Carrillo, Y.; Acosta-Gallegos, J.; Covarrubias, A.A. Physiological analysis of common bean (Phaseolus vulgaris L.) cultivars uncovers characteristics related to terminal drought resistance. Plant Physiol. Biochem. 2012, 56, 24–34. [Google Scholar] [CrossRef] [Scilit] [PubMed]
- Tapia, G.; Méndez, J.; Inostroza, L.; Lozano, C. Water Shortage Affects Vegetative and Reproductive Stages of Common Bean (Phaseolus vulgaris) Chilean Landraces, Differentially Impacting Grain Yield Components. Plants 2022, 11, 749. [Google Scholar] [CrossRef] [Scilit] [PubMed]
- Beebe, S.E.; Rao, I.M.; Devi, M.J.; Polania, J. Common beans, biodiversity, and multiple stress: Challenges of drought resistance in tropical soils. Crop Pasture Sci. 2014, 65, 667–675. [Google Scholar] [CrossRef] [Scilit]
- Fernandez, G.C.J. Effective selection criteria for assessing plant stress tolerance. In Adaptation of Food Crops to Temperature and Water Stress: Proceedings of an International Symposium; Kuo, C.G., Ed.; Asian Vegetable Research and Development Center: Taiwan, China, 1992; pp. 257–270. [Google Scholar]
- Fischer, R.A.; Maurer, R. Drought resistance in spring wheat cultivars. I. Grain yield responses. Aust. J. Agric. Res. 1978, 29, 897–912. [Google Scholar] [CrossRef] [Scilit]
- Boicet, T.; Secada, Y.; Chaveco, O.; Bouder, A.; Gómez, Y.; Barroso, Y. Respuesta a la sequía de genotipos de frijol común utilizando diferentes índices de selección. Cent. Agrícola 2011, 38, 69–73. [Google Scholar]
- SIAP (Servicio de Información Agroalimentaria y Pesquera). Avance de Siembras y Cosechas: Frijol; Secretaría de Agricultura y Desarrollo Rural: Mexico City, Mexico, 2025. Available online: https://www.gob.mx/siap/acciones-y-programas/produccion-agricola-33119 (accessed on 19 October 2026).
- Cid-Ríos, J.Á.; Acosta-Gallegos, J.A.; Echavarría-Cháirez, F.G.; Bañuelos-Valenzuela, R.; Prado-García, A.A. Identification of bean lines (Phaseolus vulgaris) with low genotype–environment interactions under rainfed conditions in two semiarid sites of north-central Mexico. Agronomy 2025, 15, 1160. [Google Scholar] [CrossRef] [Scilit]
- Prado-García, A.A.; Acosta-Gallegos, J.A.; Montero-Tavera, V.; Yáñez-López, R.; Ramírez-Pimentel, J.G.; Aguirre-Mancilla, C.L. Identification of common bean genotypes tolerant to the combined stress of terminal drought and high temperature. Agronomy 2025, 15, 1624. [Google Scholar] [CrossRef] [Scilit]
- Prieto-Cornejo, M.R.; Matus-Gardea, J.A.; Gavi-Reyes, F.; Omaña-Silvestre, J.M.; Brambila-Paz, J.J.; Sánchez-Escudero, J.; Martínez-Damián, M.Á. Evolución de la superficie cultivada de frijol e impacto económico de la sequía sobre su rendimiento bajo condiciones de temporal en México. Rev. Fitotec. Mex. 2019, 42, 173–182. [Google Scholar] [CrossRef] [Scilit]
- SIAP (Servicio de Información Agroalimentaria y Pesquera). Panorama Agroalimentario: Frijol 2024; Secretaría de Agricultura y Desarrollo Rural: Mexico City, Mexico, 2024. Available online: https://www.gob.mx/siap (accessed on 22 May 2026).
- He, Z.; Zhang, P.; Jia, H.; Zhang, S.; Nishawy, E.; Sun, X.; Dai, M. Regulatory mechanisms and breeding strategies for crop drought resistance. New Crops 2024, 1, 100029. [Google Scholar] [CrossRef] [Scilit]
- Polania, J.; Rao, I.M.; Cajiao, C.; Rivera, M.; Raatz, B.; Beebe, S. Physiological traits associated with drought resistance in Andean and Mesoamerican genotypes of common bean (Phaseolus vulgaris L.). Euphytica 2017, 210, 17–29. [Google Scholar] [CrossRef] [Scilit]
- Mwale, S.E.; Shimelis, H.; Nkhata, W.; Sefasi, A.; Fandika, I.; Mashilo, J. Genotype-by-environment interaction in tepary bean (Phaseolus acutifolius A. Gray) for seed yield. Agronomy 2023, 13, 12. [Google Scholar] [CrossRef] [Scilit]
- Bhandari, R.; Paudel, H.; Alharbi, S.A.; Ansari, M.J.; Poudel, M.R.; Neupane, M.P.; Solanki, P.; Kushwaha, U.K.S. Evaluating stress tolerance indices for their comparative validity to access terminal heat stress and heat drought tolerance of winter wheat (Triticum aestivum L.) genotypes. J. Agric. Food Res. 2024, 18, 101506. [Google Scholar] [CrossRef] [Scilit]
- Rosielle, A.A.; Hamblin, J. Theoretical aspects of selection for yield in stress and non-stress environments. Crop Sci. 1981, 21, 943–946. [Google Scholar] [CrossRef] [Scilit]
- Suárez, A.D.; Rodríguez, R.D.; Dávalos, Y.M. Respuesta productiva de cultivares comerciales de Phaseolus vulgaris en condiciones de sequía. Cent. Agrícola 2022, 49, 4. [Google Scholar]
- Rosales-Serna, R.; Almaraz Abarca, N.; Sierra Zurita, D.; Chaidez Ayala, A.I.; Delgado Alvarado, E.A. Diversidad genética en el complejo poblacional de la raza Durango de frijol Phaseolus vulgaris L. Polibotánica 2025, 59, 313–327. [Google Scholar] [CrossRef] [Scilit]
- López-Millán, A.F.; Grusak, M.A.; Abadía, A.; Abadía, J. Iron deficiency in plants: An insight from proteomic approaches. Front. Plant Sci. 2013, 4, 254. [Google Scholar] [CrossRef] [Scilit] [PubMed]
- Acosta-Díaz, E.; Hernández-Torres, I.; Rodríguez-Guerra, R.; Pedroza-Flores, J.; Amador-Ramírez, M.D.; Padilla-Ramírez, J.S. Efecto de la sequía en la producción de biomasa y grano de frijol. Rev. Mex. Cienc. Agríc. 2011, 2, 249–263. [Google Scholar]
- Estrada-Prado, W.; Jerez-Mompie, E.; Nápoles-García, M.C.; Sosa-Rodríguez, A.; Maceo-Ramos, Y.C.; Cordoví-Dominguez, C. Respuesta de cultivares de frijol (Phaseolus vulgaris L.) a la sequía utilizando diferentes índices de selección. Cultiv. Trop. 2016, 37, 79–84. [Google Scholar]
- López-Salinas, E.; Acosta-Gallegos, J.A.; Tosquy-Valle, O.H.; Salinas-Pérez, R.A.; Sánchez-García, B.M.; Rosales-Serna, R.; González-Rivas, C.; Moreno-Gallegos, T.; Villar-Sánchez, B.; Cortinas-Escobar, H.M.; et al. Estabilidad de rendimiento en genotipos mesoamericanos de frijol de grano negro en México. Rev. Mex. Cienc. Agríc. 2011, 2, 29–40. [Google Scholar]
- Romero-Félix, C.S.; López-Castañeda, C.; Kohashi-Shibata, J.; Martínez-Rueda, C.G.; Miranda-Colín, S.; Aguilar-Rincón, V.H. Ambiente y genotipo: Efectos en el rendimiento y sus componentes, y fenología en frijol común. Acta Univ. 2018, 28, 20–32. [Google Scholar] [CrossRef] [Scilit]
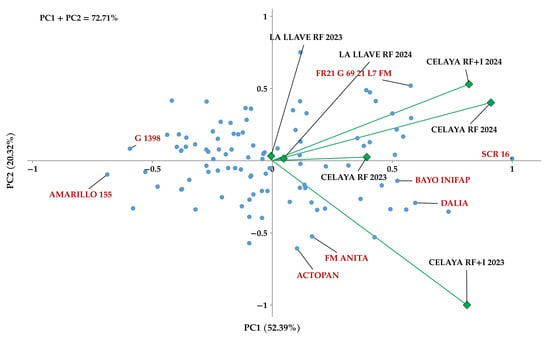
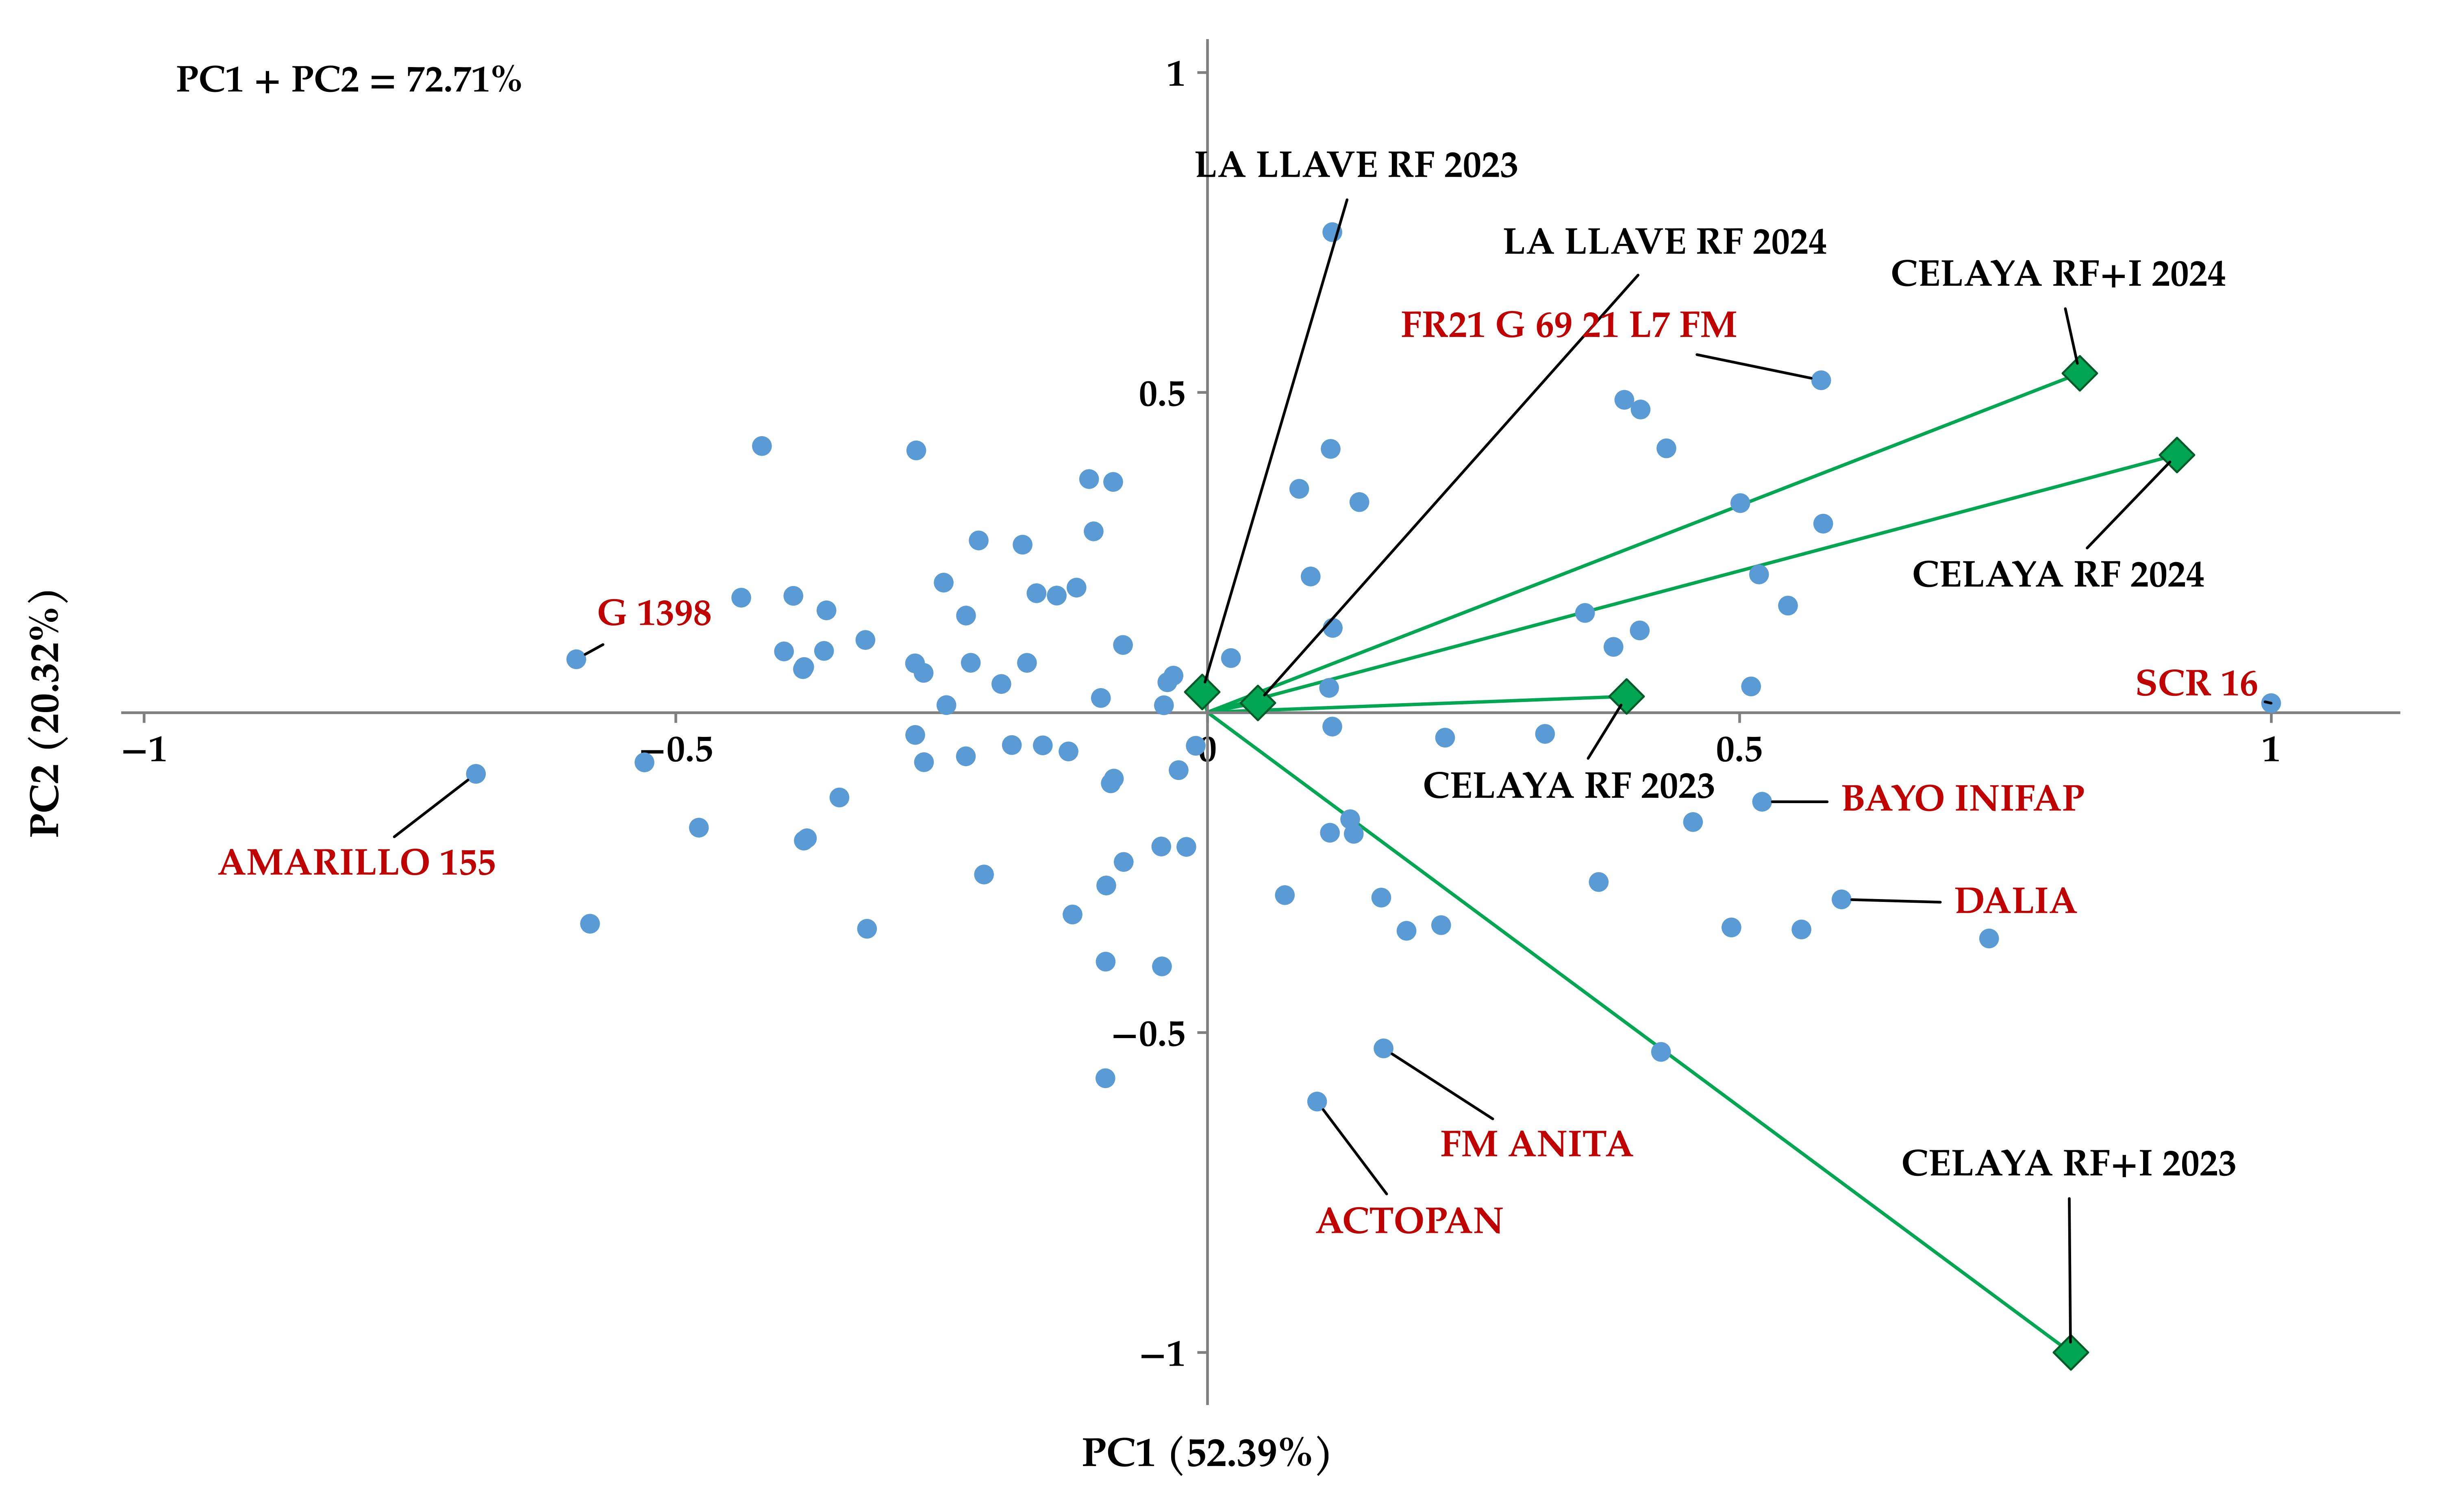
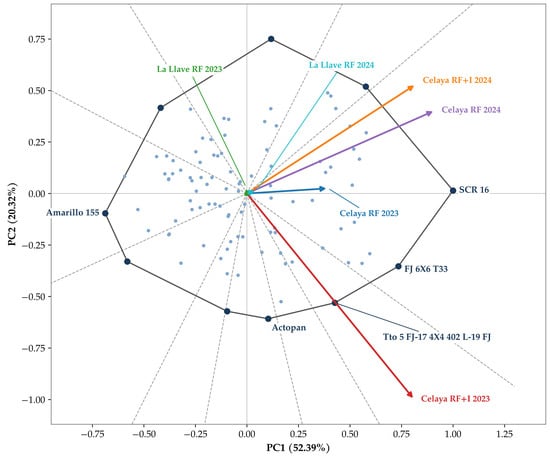
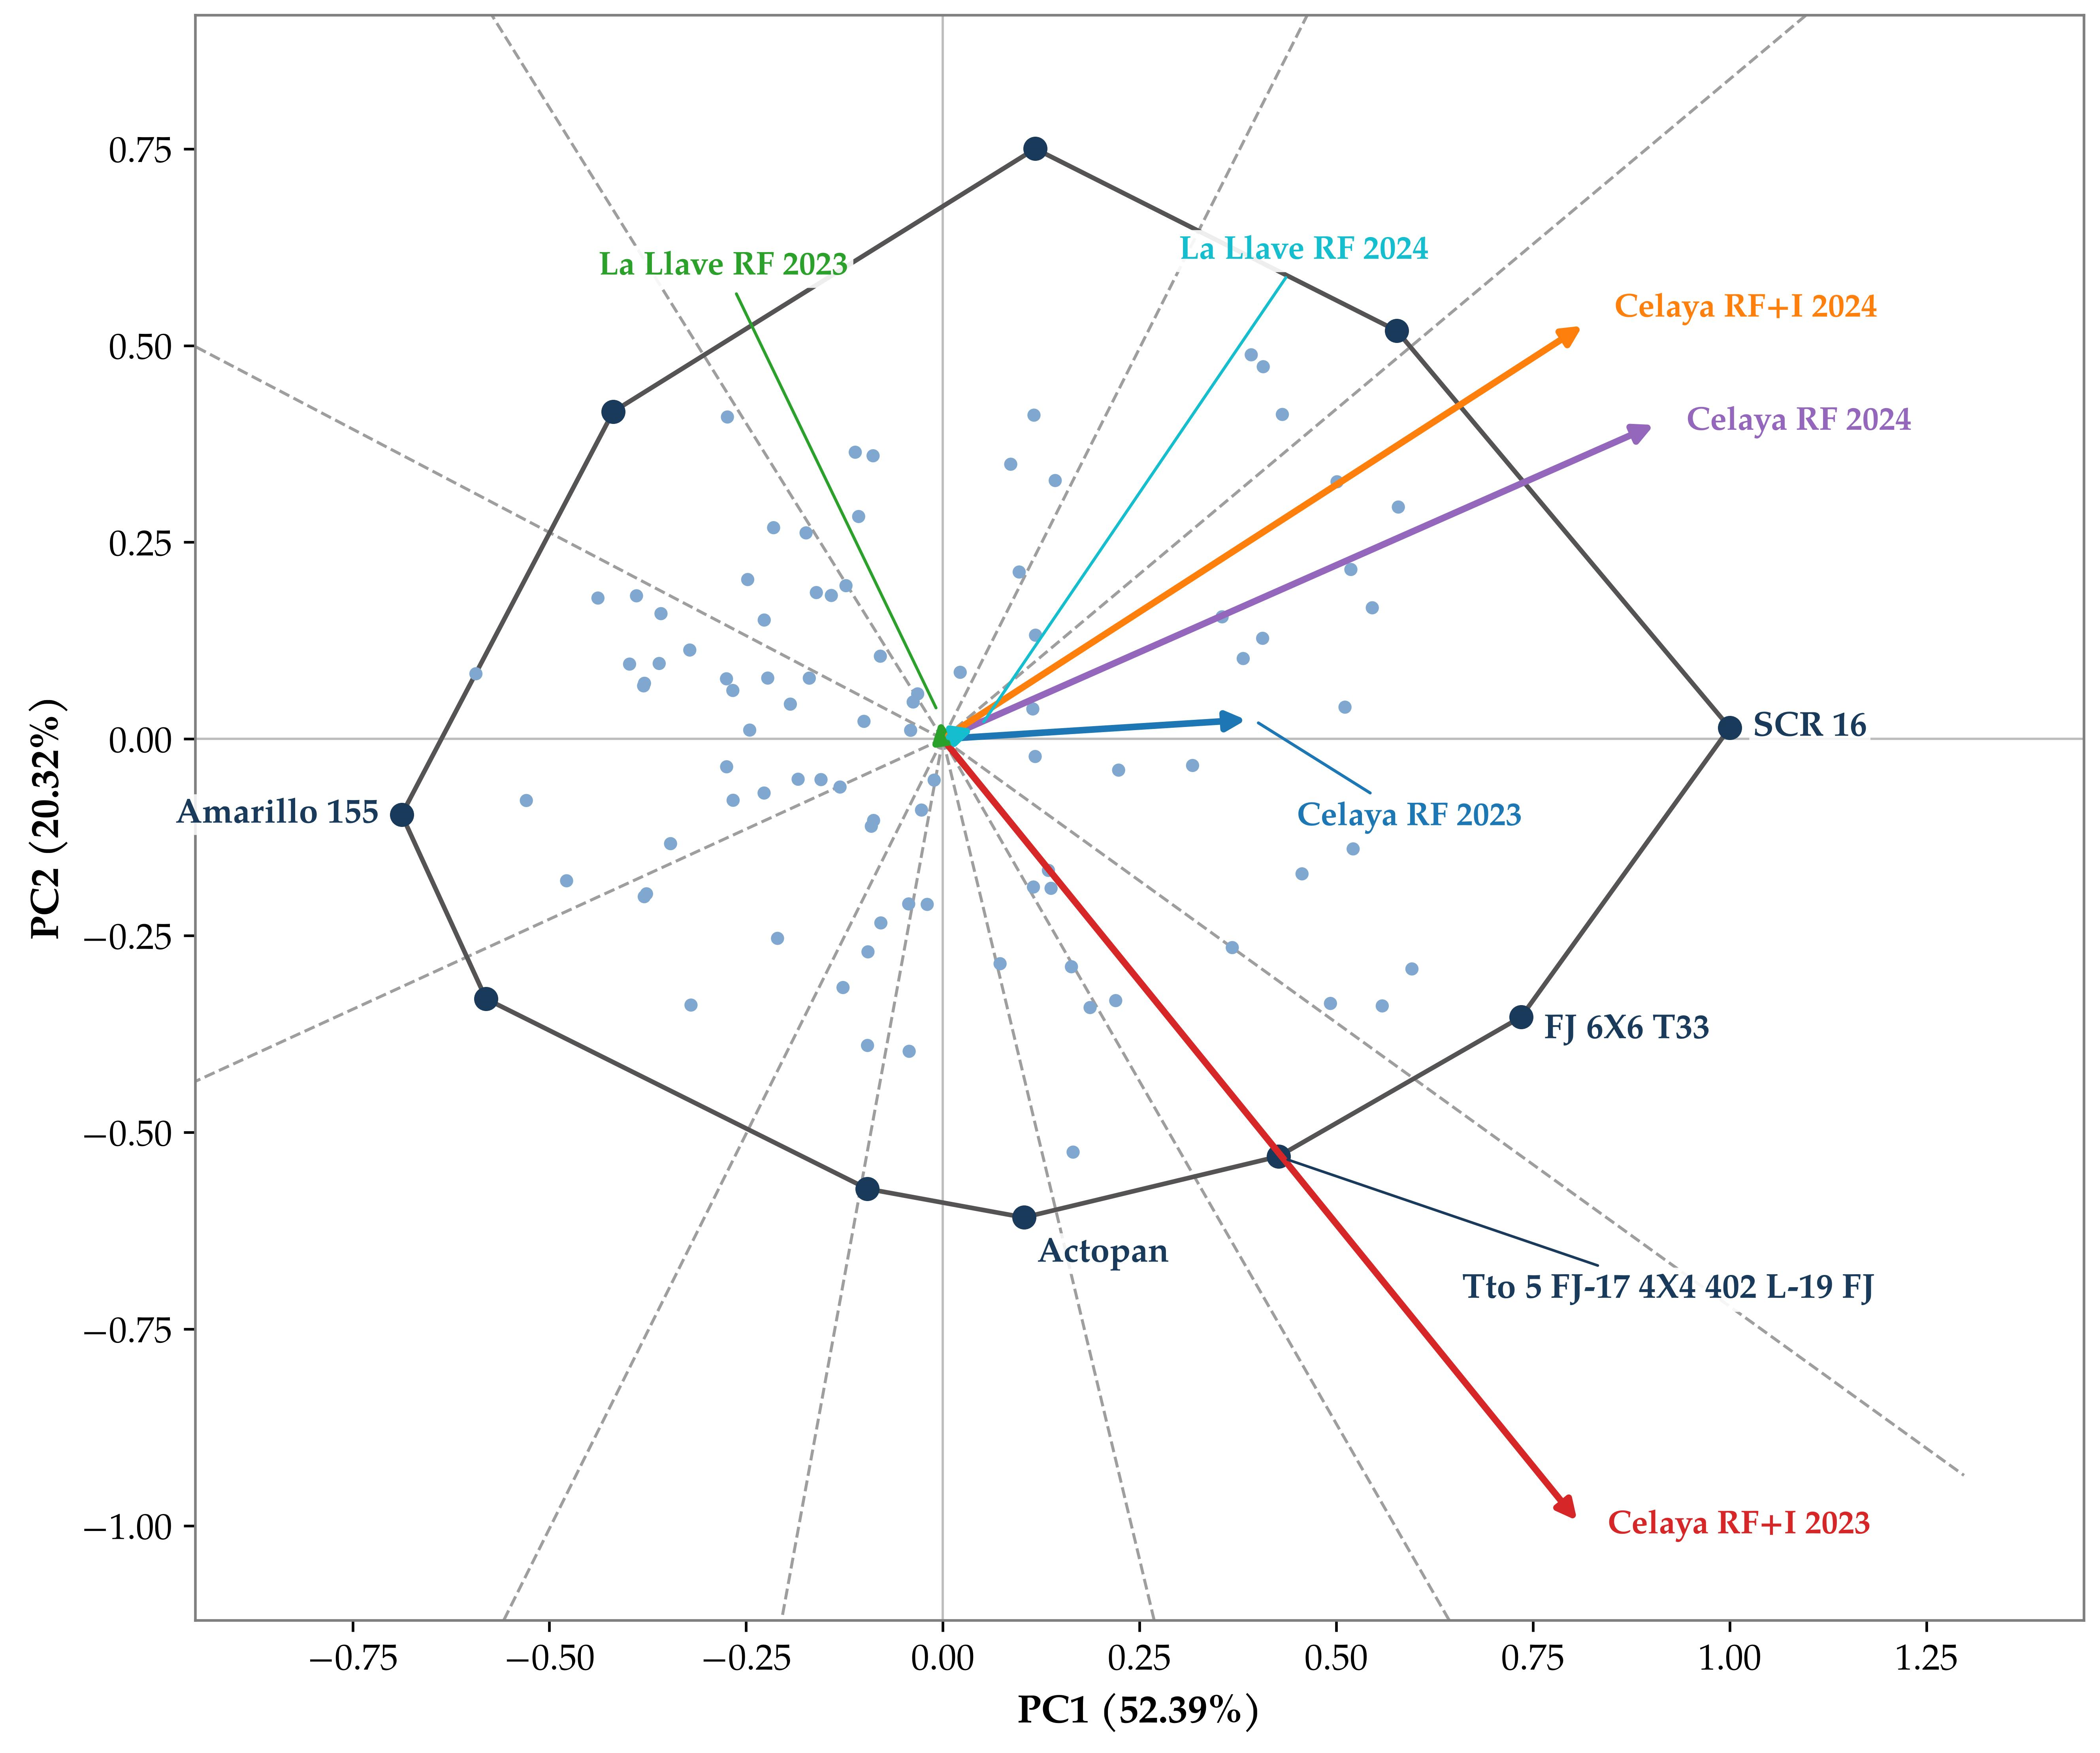

Disclaimer/Publisher’s Note: The statements, opinions and data contained in all publications are solely those of the individual author(s) and contributor(s) and not of MDPI and/or the editor(s). MDPI and/or the editor(s) disclaim responsibility for any injury to people or property resulting from any ideas, methods, instructions or products referred to in the content. |
© 2026 by the authors. Licensee MDPI, Basel, Switzerland. This article is an open access article distributed under the terms and conditions of the Creative Commons Attribution (CC BY) license.