


Highlights
What are the main findings?
- •
- Preplant soaking for 24, 48, or 72 h resulted in better growth of ‘Bartlett’ pear trees on quince ‘Eline’ rootstock than 0 or 96 h.
- •
- Different preplant soaking times did not have an observable effect on tree health in the first year.
- •
- Trees soaked for 96 h exhibited more water stress across the first season than those soaked for 24 or 72 h.
What are the implications of the main findings?
- •
- This study confirms the benefit of preplant soaking for bare-root fruit trees and highlights the 24-to-72 h range as most beneficial.
Abstract
Quince ‘Eline’ (Cydonia oblonga L.) is a cold-hardy rootstock for pear (Pyrus communis L.) that could potentially be adopted by the U.S. pear industry if it can be shown to perform under conditions that have prevented prior quince rootstock adoption. These conditions include colder winters and hotter, drier summers than the European regions where quince ‘Eline’ is currently used. Preplant soaking, the practice of submerging bare-root tree roots in water to rehydrate them following cold storage, will potentially be a critical component of preventing transplant shock if pear orchards grafted to quince ‘Eline’ are to be established in hot or dry areas. This study tested five soaking treatments for ‘Bartlett’ pear grafted on quince ‘Eline’ with a ‘Beurre Hardy’ pear interstem, and measured multiple factors related to tree establishment success throughout the first growing season. The treatments included a 0 h control as well as 24, 48, 72, and 96 h soaking times. The tree weight decreased when not soaked and increased when soaked for 48 or 72 h. Tree health remained similar among the soaking treatments, with all trees surviving, though the health assessment was limited by the use of an ordinal scale. The growth varied, with the 24, 48, and 72 h treatments showing the greatest trunk cross-sectional area and leader length increase. Stomatal-conductance-to-water-vapor measurements, used as a proxy for tree water stress, showed that the 96 h treatment resulted in more highly stressed trees. Altogether, this study identifies the benefit of preplant soaking for ‘Bartlett’ grafted to quince ‘Eline’, and highlights the 24 to 72 h range as a best practice for establishment for U.S. pear growers.
1. Introduction
The majority of European pear (Pyrus communis L.) trees in commercial production are grown on rootstocks. In the U.S., the P. communis semi-dwarfing clonal rootstocks ‘Old Home’ x ‘Farmingdale’ 87 and 97 (OHxF 87 and OHxF 97) are the most prevalent, though minor production also occurs with other P. communis and Pyrus spp. cultivars and crosses. Because OHxF only dwarfs trees to 70% to 90% of their full size and does not infer precocity, the domestic pear industry will need to adopt new rootstocks in order to transition to more efficient high-density plantings that occur in other tree fruit systems like apple [1].
Quince (Cydonia oblonga L.) is a pome fruit tree species in the Malinae subtribe of the family Rosaceae [2]. It is an important rootstock for pear, especially in the European growing regions of The Netherlands (NL), Belgium (BE), Italy and Spain, where several quince rootstock cultivars are used commercially. In general, quince rootstocks are used to infer dwarfing, precocity, productivity, a large fruit size, good fruit quality, and resistance to pear decline, making them significantly beneficial to the European pear industry. However, they can also suffer from poor anchorage, poor tolerance of calcareous soil, a lack of cold-hardiness, and poor graft compatibility with pear [3,4].
Quince’s low cold-hardiness precludes its widespread commercial adoption in the U.S., as the main pear-growing regions of the U.S. (central Washington (WA) and Oregon (OR)) experience colder winter temperatures than European pear-growing regions. Quince ‘Eline’ is a relatively new quince cultivar, released by Fleuren Tree Nursery (Boomkwekerij Henri Fleuren B.V.) in the NL in 2013. It is marketed as more cold-hardy than other quince cultivars (hardy to −25 °C), indicating that it might be an ideal rootstock for U.S. production. However, cold is not the only challenge to quince use in the U.S., as WA and OR are also typically hotter and drier in the summer season than northern European countries (NL, BE) where quince ‘Eline’ has been adopted.
Pear trees are typically provided to the grower from the nursery as pre-grafted, bare-root, one- to three-year-old trees. After removal from the ground, they are often held in cold storage prior to being transported to the orchard where they will be planted. Growers then often also store trees in cold conditions prior to planting. The recommendations to keep trees from becoming too dehydrated while in storage include periodic wetting and packing in a moist substrate such as sawdust, peat moss, or paper. Practices prior to planting also sometimes include preplant soaking, the act of submerging the root systems in a container of water to hydrate the trees and hopefully help mitigate transplant shock. This practice appears to be much more prevalent in Europe than in the U.S. [5]. For quince ‘Eline’ specifically, the soaking recommendations from European growers and nurserymen range from 48 to 96 h (personal communications, 2024). In the U.S., if growers opt to preplant soak, the typical length of time is 24 h or less.
Though preplant soaking is a recognized practice in many specialty crop industries, formal studies into its effect on bare-root trees or plants are lacking. The benefits of related horticultural practices, like the preplant soaking of seeds [6,7,8,9] and preplant soaking of tree stem cuttings [10,11,12,13], have been much more thoroughly explored. It is likely that bare-root soaking helps to mediate transplant shock by allowing trees to rehydrate, increasing the tissue water content before exposure to stressful field conditions. Over the winter, cold-driven dehydration is a natural occurrence in temperate tree species, which have evolved various dormancy-related adaptations to withstand cellular damage [14,15]. Allowing trees to maximize their water content before being planted in a potentially desiccating environment should allow for better survival. It should also improve growth, as plant cells need adequate water for metabolic processes that paused in the winter to resume in order for buds to burst and any vegetative and floral growth to proceed [16].
In order to determine whether quince ‘Eline’ is a viable option for use as a pear rootstock in the U.S., this study focused on the establishment success of ‘Bartlett’ grafted to quince ‘Eline’ by exploring the role of preplant soaking times on tree performance. Formal research into the preplant soaking of bare-root fruit trees is limited, but grower practices and industry recommendations were combined to formulate a plan to test soaking times of 0, 24, 48, 72, and 96 h. The tree weight change was assessed after soaking to measure the rehydration. The tree health and growth were measured throughout the first growing season, which occurred from planting in May to the time at which the trees began to enter dormancy at the end of September. To investigate the tree performance in more detail, stomatal conductance was also measured throughout the season to determine the tree water stress for different soaking-time treatments.
2. Materials and Methods
2.1. Plant Materials
‘Bartlett’ pear (Pyrus communis) trees on quince ‘Eline’ (Cydonia oblonga) with ~50 cm ‘Beurre Hardy’ P. communis interstems were used for this study. Interstems are commonly used when pear scions are grafted to quince rootstocks, to overcome the vascular tissue incompatibility that is common in interspecific grafts. ‘Beurre Hardy’ was selected because of its broad compatibility with both pear and quince cultivars and because of its widespread commercial use; it is possible that another interstem genotype could alter the soaking results. The trees were stored bare-root in a cold room (1.1 °C) for approximately two weeks after delivery from the nursery, prior to soaking and planting, with the roots packed in moist pine sawdust.
2.2. Preplant Soaking, Planting, and Growing Conditions
The trees were soaked for 96, 72, 48, or 24 h prior to planting. A 0 h control that received no soaking was included and was planted directly from moist sawdust. For each of the five soaking-length treatments, 15 trees were randomly grouped into five replicates of three trees each. The trees were removed from the moist sawdust bins in cold storage and placed in plastic bins with tap water (average temperature: 14.6 °C) covering the root portion. The soaking trees were held at ambient air temperature (average: 15.7 °C) in an unheated outbuilding until planting; the 0 h control trees were not soaked and were removed from the cooler and held in the same building in moist sawdust for 96 h. The trees were planted on 20 May 2025 and grown at the Mid-Columbia Agricultural Research and Extension Center in Hood River, Oregon, on Van Horn fine sandy loam. The study was laid out as a randomized complete-block design (RCBD) with five soaking-length treatments applied across five replicate blocks, giving a total of 25 experimental units. Each experimental unit consisted of three consecutive trees. The spacing was 0.91 m (3 ft) between trees and 3.66 m (12 ft) between rows. The trees were hand-irrigated, with water applied until visible soil saturation was achieved, for approximately one month. Following this, the trees were irrigated for a duration of eight hours, every three days, using overlapping Supernet 050 micro sprinklers (Netafim, Fresno, CA, USA) with a discharge rate of 50 L h−1 installed center to center (4.57 m) to ensure uniform coverage. Thus, for each irrigation event, 400 L of water was applied uniformly throughout the cultivation area. The irrigation volume and scheduling frequency was based upon standard industry practices within the region (personal communications). Irrigation ended at the end of September.
There were no extreme weather events or abnormal patterns in the Hood River 2025 growing season. The overall trend consisted of hotter, drier, windier conditions in June, July and August, as is typical for the region. The average maximum and minimum air temperatures (°C) were 16.7, 19.6, 22.7, 22.6, 19.3 and 15.9, 18.5, 21.9, 21.8, 18.5, respectively, for the months of May (after planting), June, July, August and September. The average relative humidity (%) by month was 62.1, 56.4, 53.5, 57.5, and 64.8. The average solar radiation (Langleys/hour) by month was 41.2, 41.9, 41.5, 38.7, and 32.0. The average wind speed (kilometers/hour) by month was 9.5, 11.2, 10.7, 9.0, and 7.5. The total precipitation (cm) by month was 0.7, 0.1, 0.1, 0.7, and 0.7. Detailed weather information is listed in Table S1.
2.3. Tree Weight—Rehydration
To evaluate the effects of different soaking times on tree hydration, whole trees were weighed prior to and following soaking. Soil and the remnants of fabric growing containers were removed by hand and with a high-pressure water nozzle prior to soaking. To account for the weight of the surface water after washing, the roots were also sprayed with water prior to the post-soaking weighing. The trees were weighed individually, using a cylindrical container to hold them vertically. The percent change was calculated as follows: % change = ((weight after soak − weight before soak)/weight before soak) × 100.
2.4. Tree Health
To assess their health in the first year, the trees were rated every two weeks, beginning one month after planting and continuing until the end of September when the irrigation water was shut off and the trees started to enter dormancy. Ratings were performed using a 1–4 scale adopted from the Historic Orchard and Fruit Tree Stabilization Handbook [17]. The ratings followed the following criteria: 1. Dead—The tree is dead. 2. Poor—The tree is in a general state of decline with little or no new growth, major physical damage, defects, disease or insect damage, or major dieback or deadwood present. Yellow or otherwise discolored leaves. Sparse canopy. 3. Fair—The tree has decreased new growth with moderate physical damage, defects, disease or insect damage, or moderate dieback or dead shoots present. Some green leaves, possible yellowing or discolored leaves. Possible sparse canopy. 4—Good. The tree has new growth at the terminal ends of shoots and only minor physical damage, defects, disease or insect damage, and/or only minor dieback or dead shoots present. Green, healthy leaves. Full canopy. The presence of suckers from the quince ‘Eline’ rootstock were also evaluated at the end of the season.
2.5. Tree Growth
To measure the growth in the first year, the trunk cross-sectional area (TCSA) was calculated from the circumference (C) using the formula TCSA = C2/4π immediately after planting in May and at the end of October, after the end of the growing season. The circumference measurements were taken 30 cm above the rootstock/interstem union and 10 cm above the interstem/scion union. The main leader length was measured once a month, beginning one month after planting. For trees with multiple leaders or when the main leader was ambiguous, the longest was measured. The monthly leader length measurements were used instead of the final (end-of-season) in case the treatment effects on growth were temporary.
2.6. Tree Stress
To measure tree stress, the stomatal conductance to water vapor (gsw) was measured for four timepoints, every three weeks beginning one month after planting, using an LI-600 Porometer (LI-COR, Lincoln, NE, USA). For each timepoint, the measurements were recorded on the day prior to and the day following an irrigation event. The measurements were collected between 13:00 and 15:00 Pacific Daylight Time (PDT). On each tree in the three-tree replicates, three fully expanded, undamaged, sun-exposed leaves were measured from the mid-canopy position on the west side of the tree. Different leaves were used at each timepoint and were chosen based on their position, maturity, and condition. The environmental conditions were generally full-sun during measurements, but some did occur on partly cloudy days. For this reason, the vapor pressure deficit (VPD) was included as a covariate in the statistical analysis. The gsw and VPD were recorded one day before and one day after irrigation events on the 6th (July 15), 9th (August 5), 12th (August 26), and 15th (September 16) weeks post-irrigation initiation.
2.7. Statistical Analysis
The data were analyzed using generalized linear mixed-effects models (GLMMs) fitted with the lme4 package of R [18]. Model assumptions were assessed using simulated residual diagnostics from the DHARMa package, version 0.5.0 [19]. Fixed effects were tested using a type III analysis of variance (ANOVA), and the treatment means were compared using Tukey-adjusted pairwise comparisons of the estimated marginal means at α = 0.05.
For the weight change analysis, the soaking treatment was included as a fixed factor. For tree health, because no trees received a health rating of 1 (dead) or 2 (poor health) and all trees remained in fair to good condition throughout the study, the data showed minimal variation. Consequently, the treatment effects were difficult to detect and the tree health data are presented descriptively as average values for each soaking treatment at each rating date. For the interstem and scion TCSA, the soaking treatment was included as a fixed effect, while the block and tree nested within experimental unit were included as random effects. The leader growth models additionally included the month and the treatment × month interaction as fixed effects to assess seasonal trends and examine treatment responses throughout the growing season. For gsw, fixed effects included the soaking treatment, the timing (before vs. after irrigation), the sampling week, the VPD, and their interactions, with replication and the tree nested within replication included as random effects. The VPD was included as a covariate to improve the model fit by factoring in environmental condition differences. The data presented in the tables and figures were averaged across five experimental units within each soaking treatment. For the leader length and gsw data, seasonal means were calculated by averaging the measurements across the season (four timepoints) once the treatment x month (leader length) and sampling week (gsw) interactions were determined to be non-significant. The tables and figures present observed means ± standard errors, whereas the significance groupings were derived from model-based estimated marginal means.
3. Results
3.1. Change in Tree Weight Caused by Length of Preplant Soaking
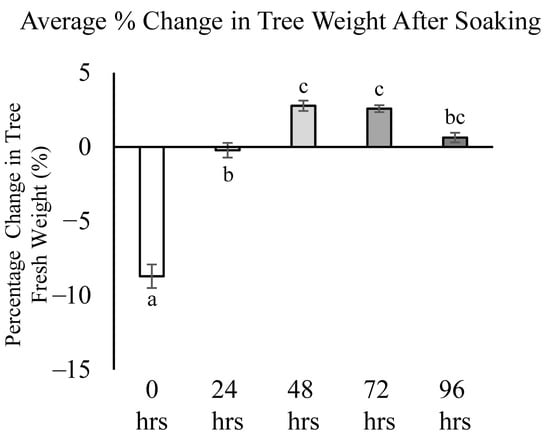
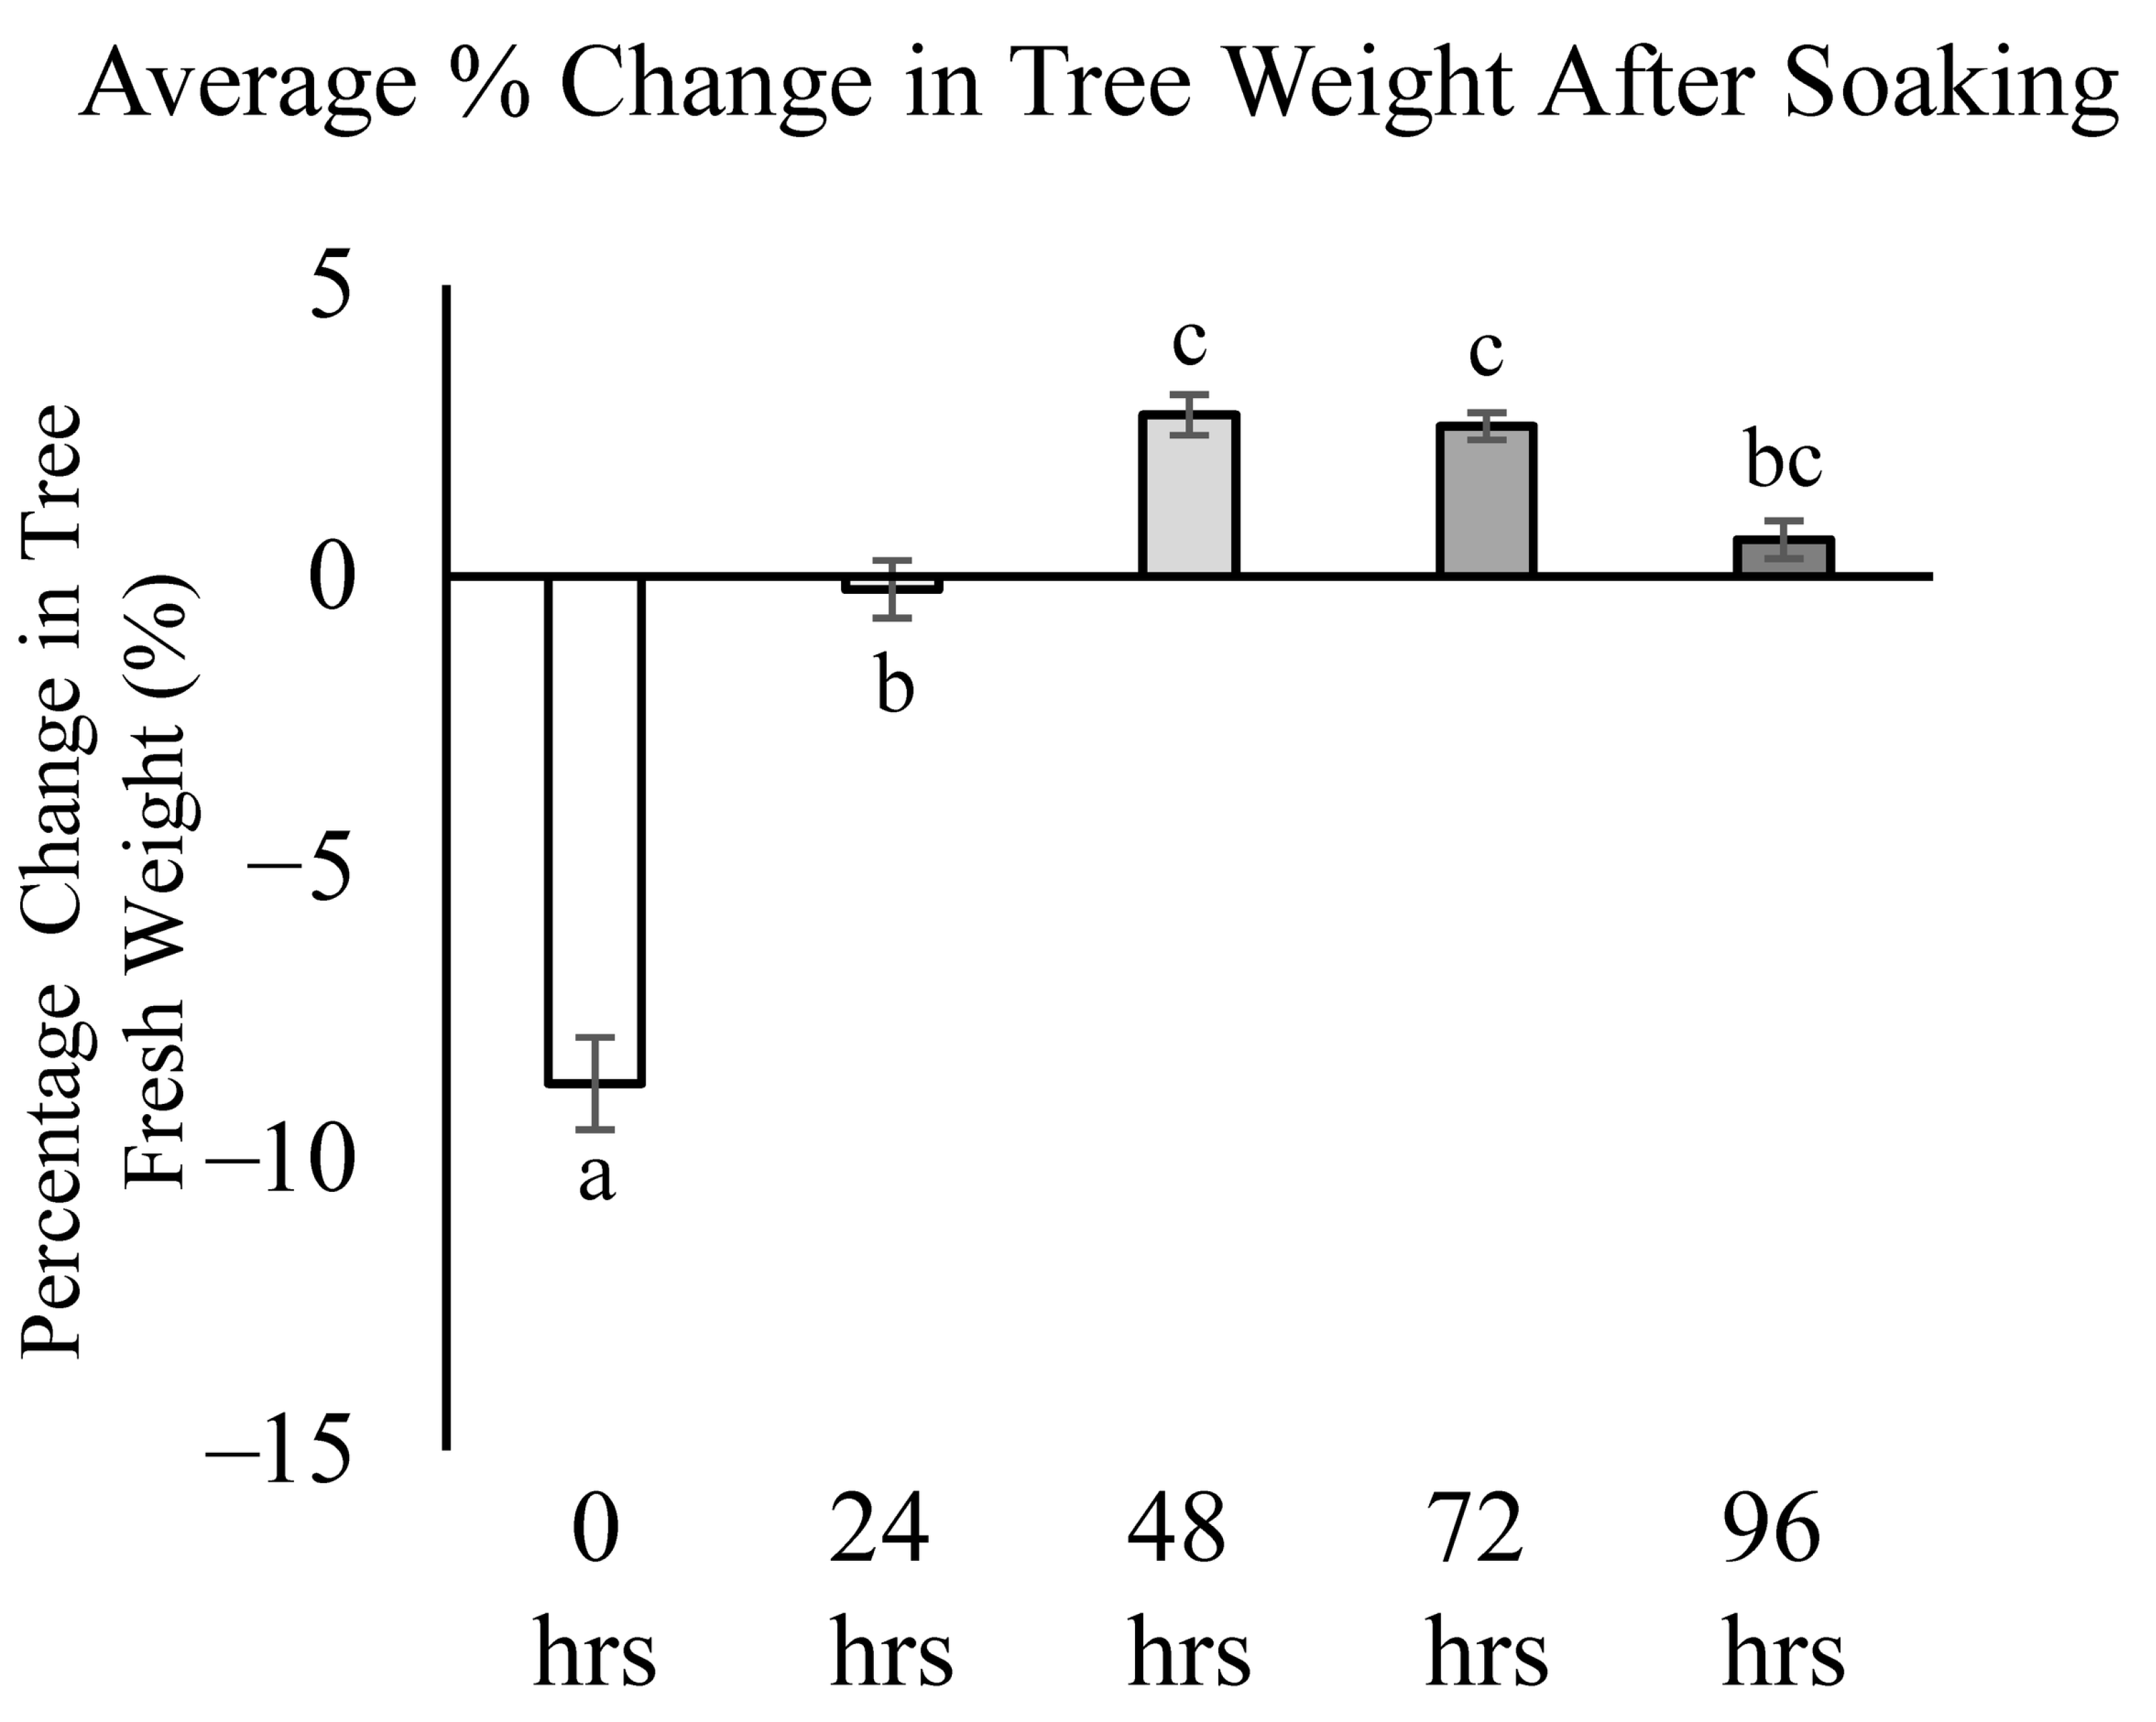
The soaking duration significantly influenced the tree weight due to either the dehydration or rehydration of bare-root trees (Figure 1). Trees in the 0 h control lost an average of 8.7% of the original tree weight, and the 24 h soak lost 0.2%. Trees in the 48, 72, or 96 h soak treatments gained an average of 2.8, 2.6, and 0.6%, respectively, and this weight increase was notably non-linear. The weight loss present in the 0 h control was statistically different than all other treatments, exhibiting a large amount of dehydration. The weight gain from rehydration in the 48 and 72 h treatments was statistically higher than that in the 24 h treatment, but not the 96 h treatment.
Figure 1.
Average percent (%) change in weight of ‘Bartlett’ pear trees on quince ‘Eline’ rootstock with a ‘Beurre Hardy’ interstem after different soaking times of 0, 24, 48, 72, or 96 h, planted in 2025 in Hood River, Oregon. For each mean value, n = 5. Error bars = standard error. Different letters indicate statistical differences by Tukey-adjusted mean separation based on estimated marginal means from the mixed-effects model (p ≤ 0.05).
3.2. Tree Health in the First Growing Season
The health was rated on a 1-to-4 scale (dead, poor, fair, and good) every two weeks, starting one month after planting (Table 1). All trees in all soaking treatments were rated 4 (good) for the first two ratings, with differences only appearing roughly two months after planting. The average ratings oscillated slightly throughout the growing season, mostly due to insect damage that occurred and then was outgrown in a small number of trees. The final average rating values were 3.87 for the 0 h, 3.93 for the 24 h, 3.80 for the 48 h, 3.93 for the 72 h and 3.80 for the 96 h treatments. The percentage of trees with quince root suckers at the end of the growing season was 33.3% in the 0 h, 24 h, and 72 h treatments and 26.7% in the 48 h and 96 h treatments.
Table 1.
Average tree health ratings for ‘Bartlett’ pear trees on quince ‘Eline’ rootstock with a ‘Beurre Hardy’ interstem after different soaking times of 0, 24, 48, 72, or 96 h. Trees were planted in 2025 in Hood River, Oregon. Trees were rated every 2 weeks following planting, on a scale from 1 (dead) to 4 (healthy). The presence of root suckers was also recorded as present or absent, and the percentage of trees with root suckers was calculated at the end of the season. Data represent means for each treatment (n = 5).
3.3. Tree Growth in the First Growing Season
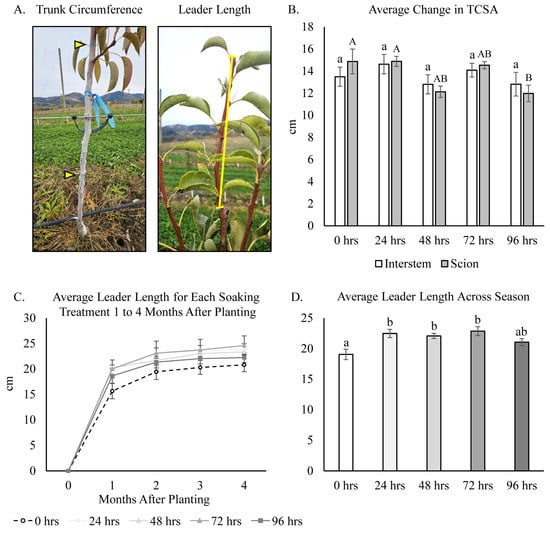
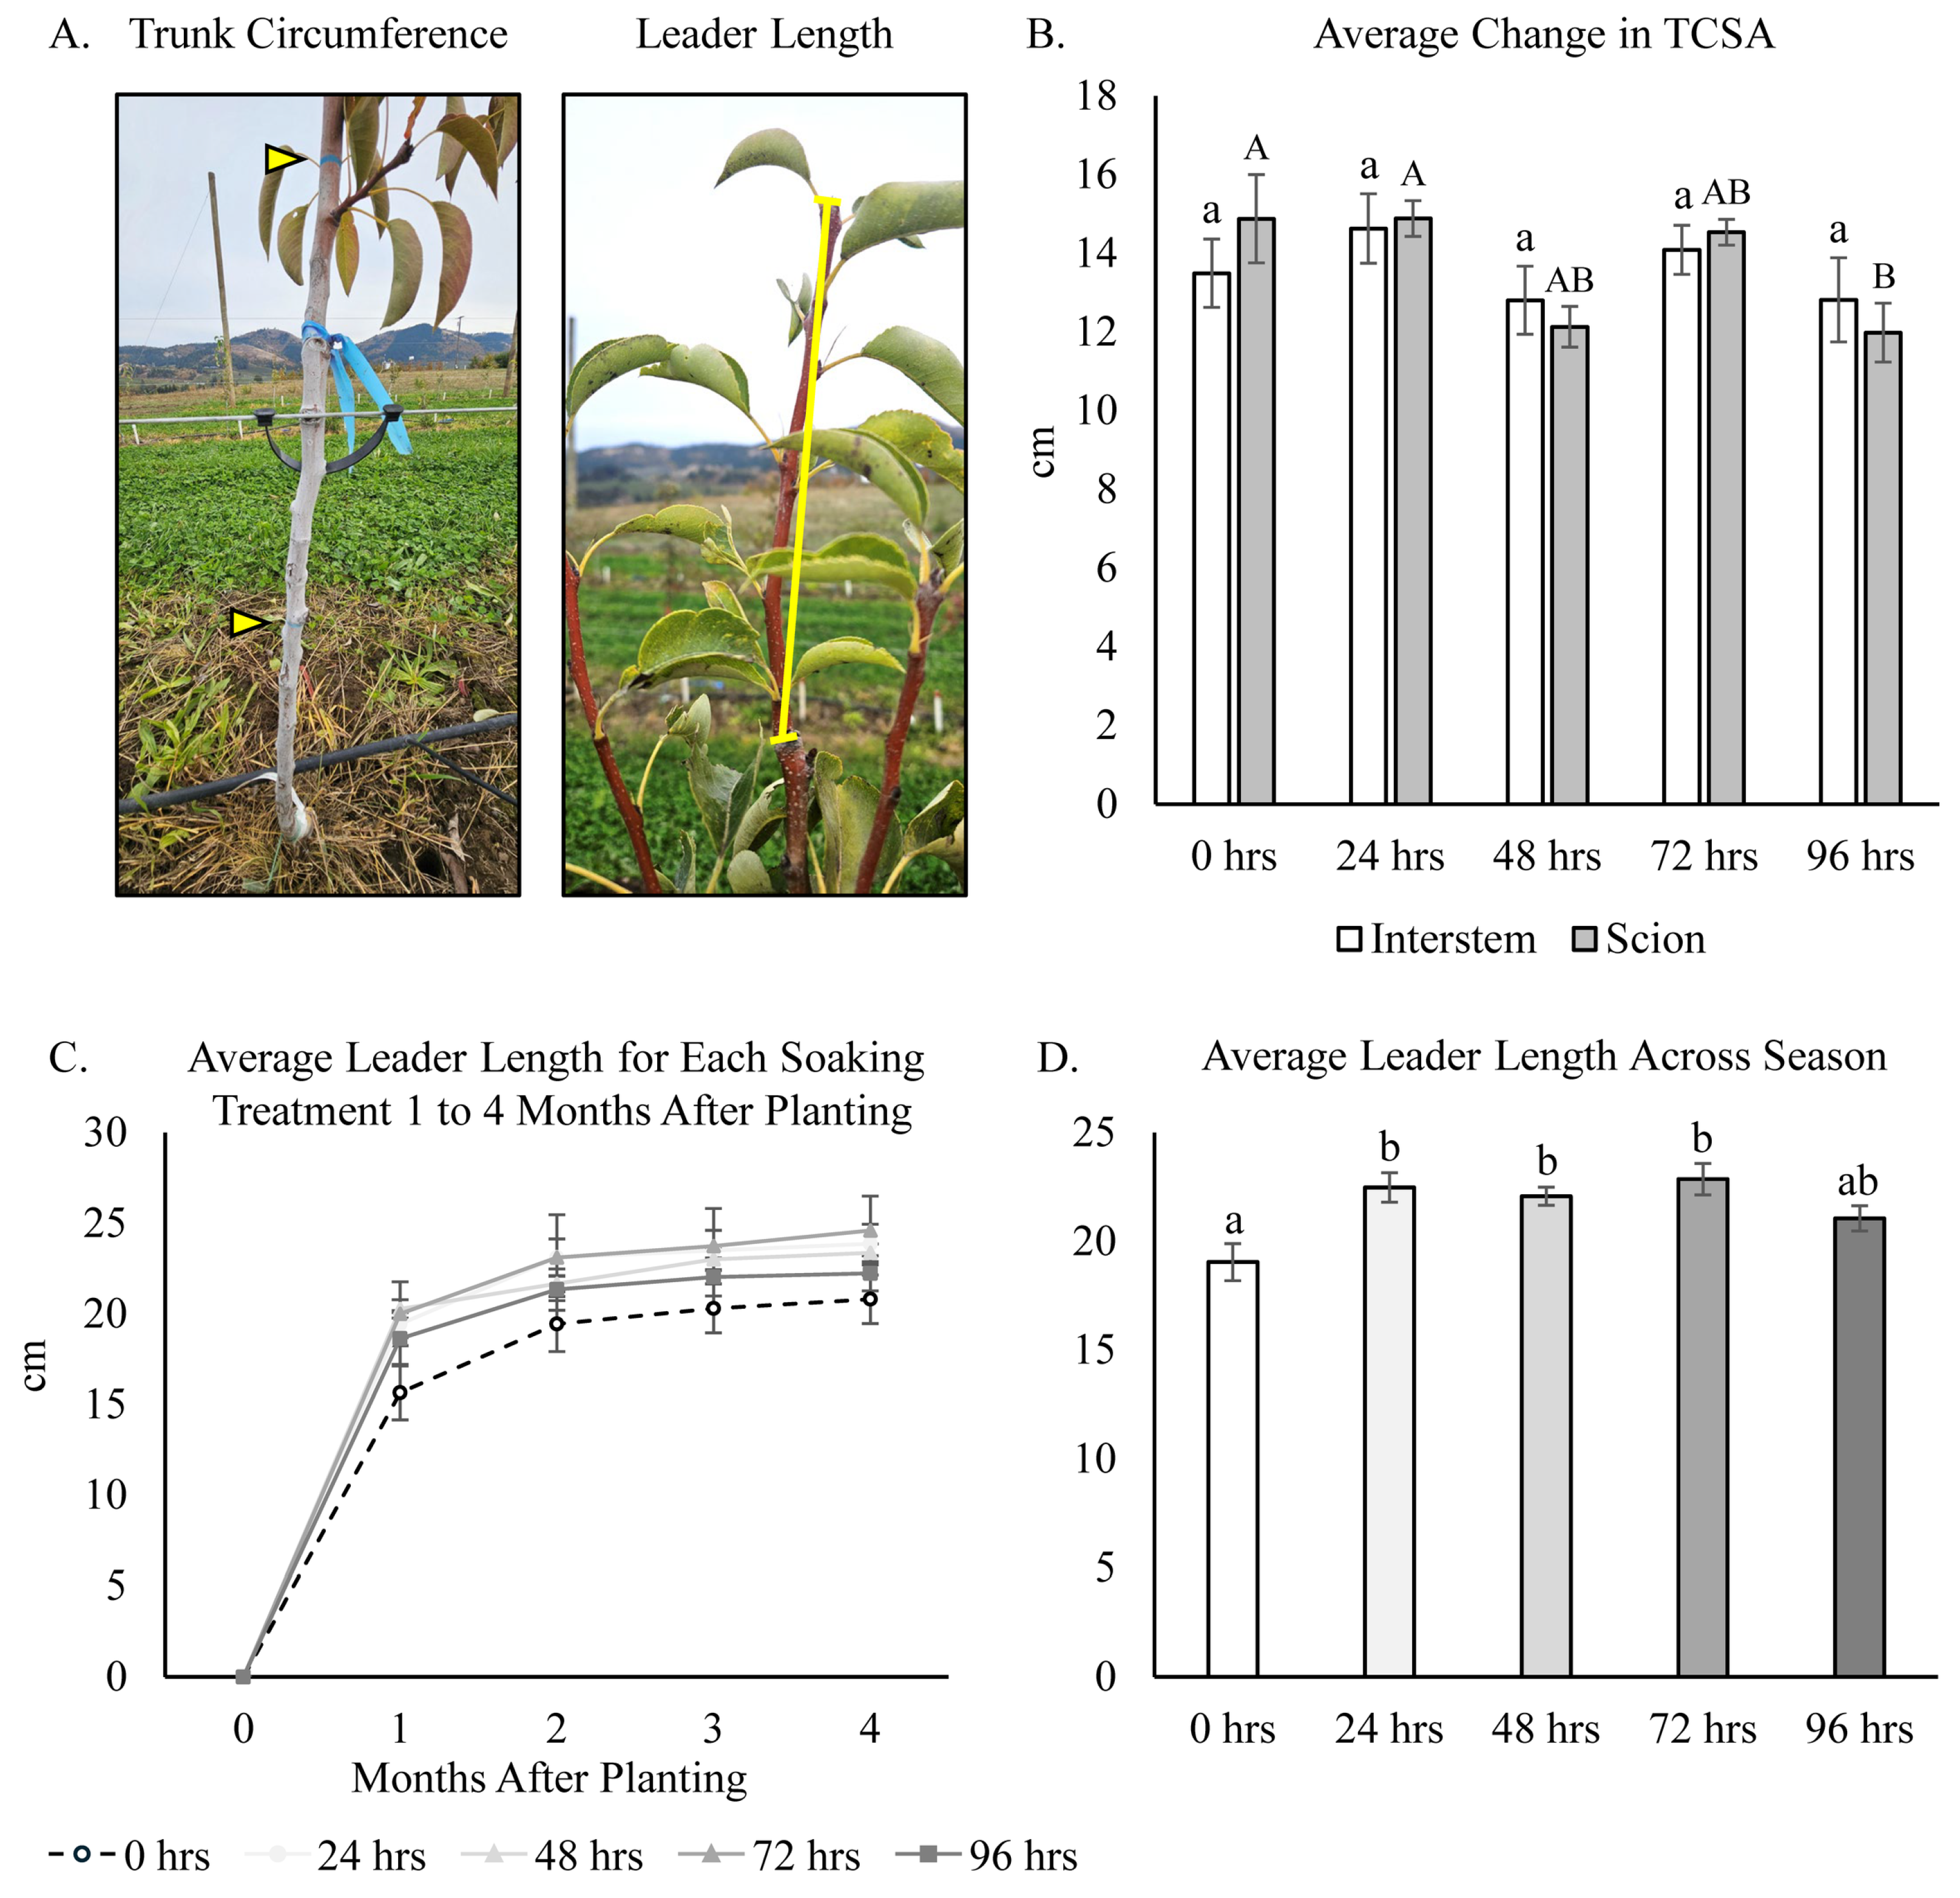
Growth in the first season was measured as the increase in the TCSA and main leader length (Figure 2A), and all treatments exhibited an increase for both during the first growing season (Figure 2B). The average increase in the interstem TCSA was 13.49, 14.63, 12.81, 14.09 and 12.82 cm2 for the 0, 24, 48, 72, and 96 h soaking treatments, respectively (Figure 2B). The average increase in the scion TCSA was 14.88, 14.88, 12.13, 14.53, and 11.98 cm2 for the 0, 24, 48, 72, and 96 h soaking treatments, respectively. There were no statistical differences among the treatments for the interstem TCSA growth. However, the scion TCSA did exhibit differences, with the 96 h treatment showing significantly less growth than the 0 and 24 h treatments.
Figure 2.
Growth in the first year of ‘Bartlett’ pear trees on quince ‘Eline’ rootstock with a ‘Beurre Hardy’ interstem, subjected to five pre-plant soaking times (0, 24, 48, 72, or 96 h), planted in 2025 in Hood River, Oregon. (A). Regions measured: height of interstem and scion trunk circumference measurements (yellow arrows) used for TCSA, and leader length (line) used for leader growth measurement. (B). Average TCSA change in the first growing season for each soaking treatment for the interstem and scion. (C). Average leader length in months one to four after planting for each soaking treatment. For each mean value, n = 5. (D). Leader length for each soaking treatment averaged across the season (four dates). Error bars = standard error. Different letters indicate statistical differences by Tukey-adjusted mean separation based on estimated marginal means from the mixed-effects model (p ≤ 0.05).
The leader length was measured once a month following planting (Figure 2C, Table S2) and then averaged across the season following the statistical analysis (Figure 2D, Table S2). The mean leader length was 19.04, 22.48, 22.08, 22.86, and 21.06 cm for the 0, 24, 48, 72, and 96 h soaking treatments, respectively. The leaders in the 24, 48, and 72 h treatments were statistically significantly longer than those in the 0 h control. Leader growth in general was slow after the first month; the cause of this is currently unknown.
3.4. Tree Stress in the First Growing Season
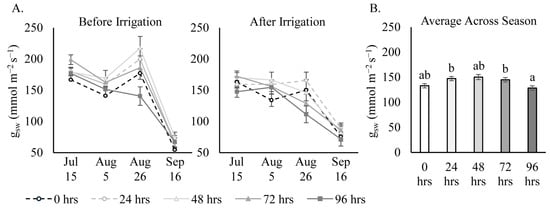
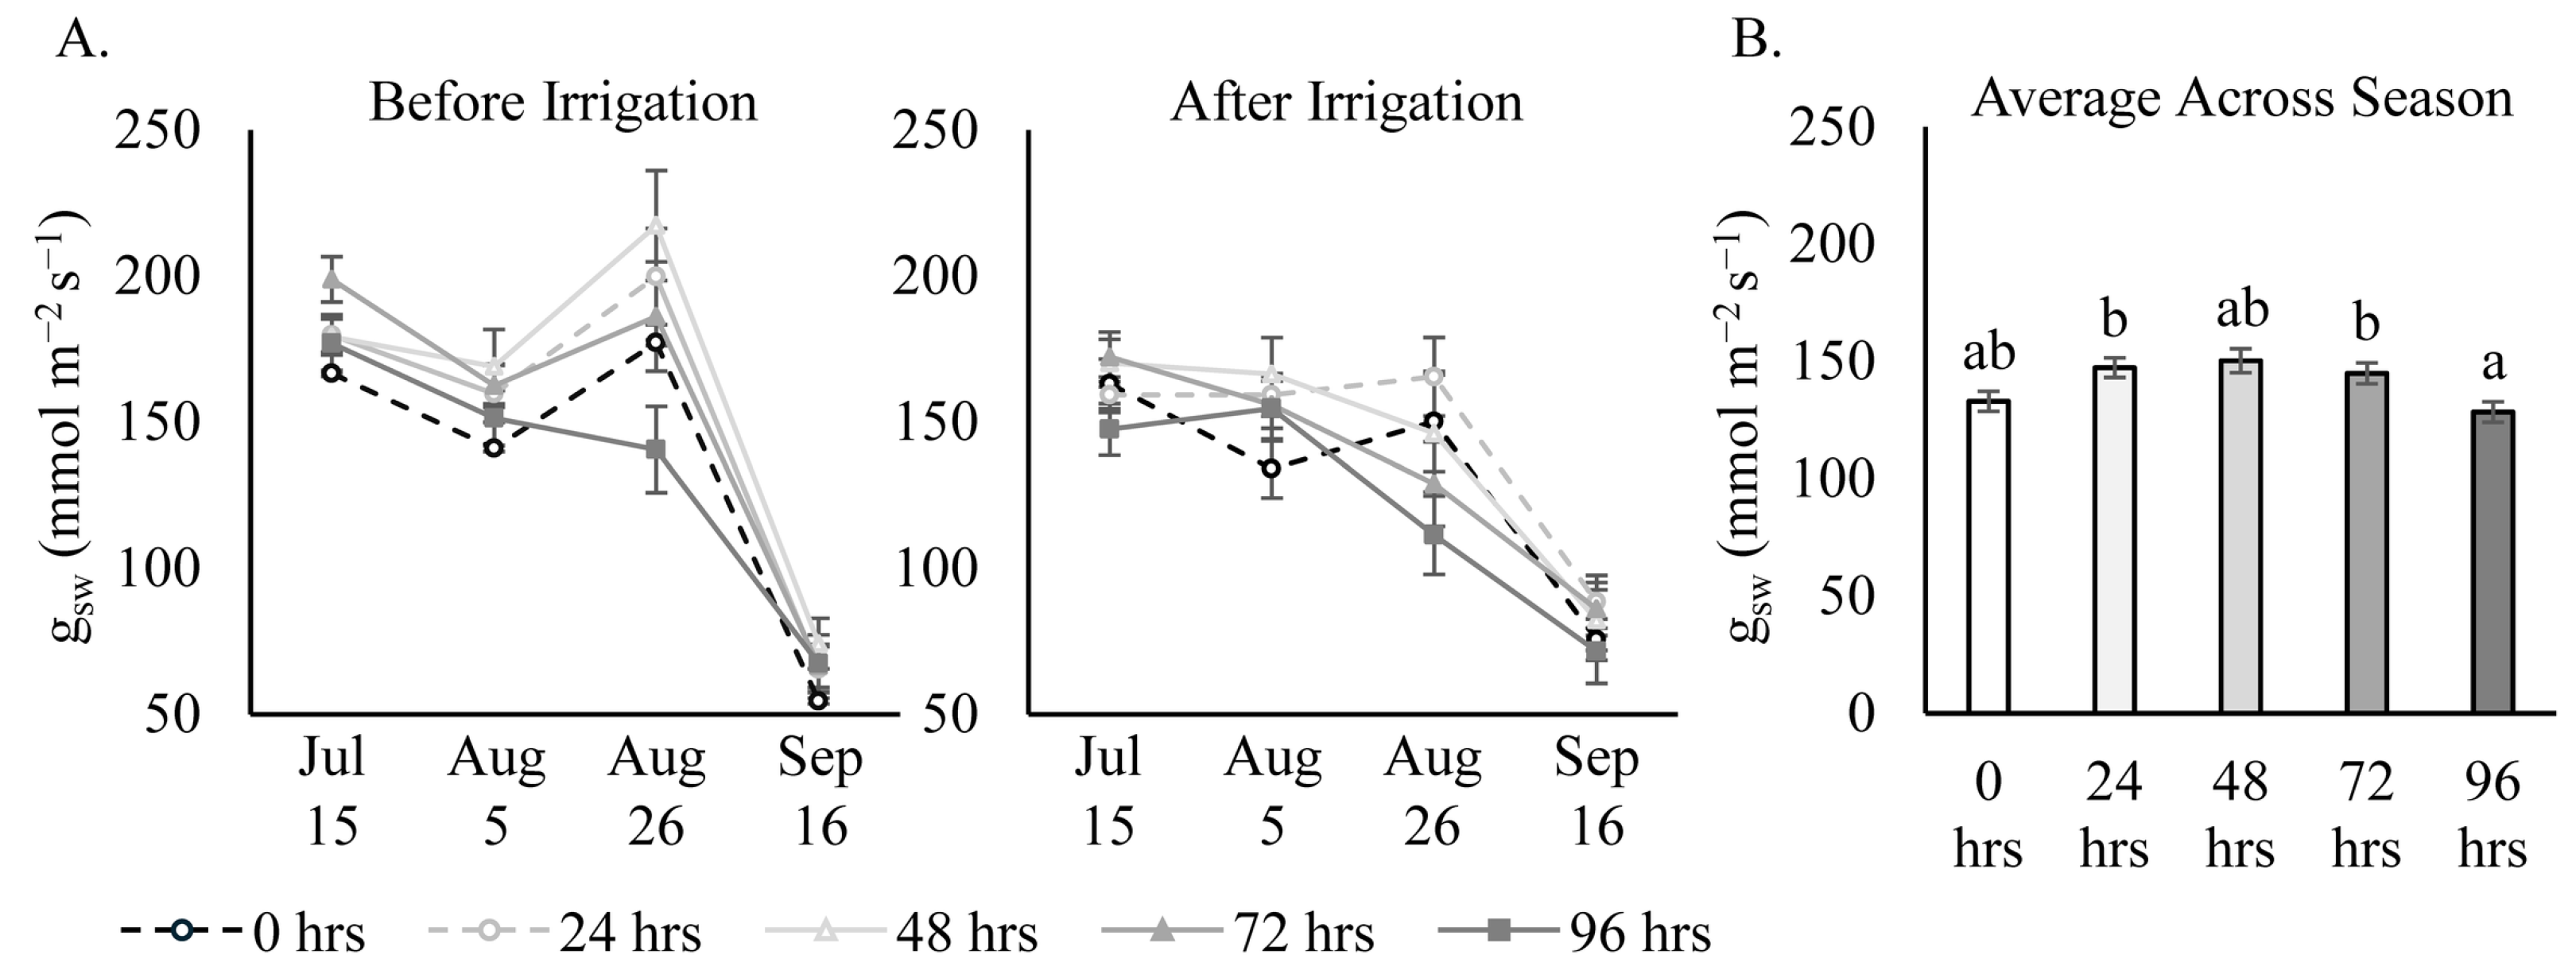
No significant interactions were detected between the soaking time and the irrigation timing, the sampling week, or their three-way interaction, indicating that the relative treatment responses were generally consistent across irrigation timing and sampling weeks (Figure 3A). Therefore, the gsw values were averaged across the season for presentation. After accounting for the irrigation timing, sampling week, and VPD, the gsw differed among the soaking times (Figure 3B). Trees subjected to the 96 h soaking treatment tended to exhibit a lower gsw than trees that received a 24 h or 72 h soaking, whereas the 0 and 48 h treatments exhibited intermediate responses. In addition to the treatment effects, the gsw varied significantly with the irrigation timing (before and after irrigation) and sampling week. In general, during the first three sampling weeks, starting early July through late August, the gsw followed similar seasonal trends, both before and after irrigation, with the values generally slightly higher before irrigation than after irrigation. In contrast, the gsw declined sharply during the final sampling week in mid-September.
Figure 3.
Average stomatal conductance to water vapor (gsw) of ‘Bartlett’ pear trees on quince ‘Eline’ rootstock with a ‘Beurre Hardy’ interstem, subjected to five pre-plant soaking times (0, 24, 48, 72, or 96 h), planted in 2025 in Hood River, Oregon (A). (gsw) values for each soaking treatment measured one day before irrigation (left panel) and one day after irrigation (right panel) on four dates throughout the growing season. (B). (gsw) values for each soaking treatment averaged across the season (four dates). For each mean value, n = 5. Error bars = standard error. Different letters indicate statistical differences by Tukey-adjusted mean separation based on estimated marginal means from the mixed-effects model (p ≤ 0.05).
4. Discussion
The spring conditions in Hood River, OR, were considered mild to normal in 2025. The daytime maximum temperature ranged from 15.5 °C to 36.4 °C in the first month after planting, with an average of 24.3 °C (Table S1). There were a total of two days that experienced light rain, with a total precipitation amount of 0.7 cm. Because of these mild weather conditions, the trees in this trial were assumed to be relatively unstressed immediately after planting, which may have moderated any transplant shock that may be experienced by trees in the hotter and/or drier spring conditions that often occur throughout the pear-growing regions of the U.S.
The dehydration that occurred in the 0 h control trees while they were stored in the unheated outbuilding for 96 h was much more extreme than anticipated, given that the trees were completely ecodormant and the tree roots remained in moist sawdust. This illustrates the importance of keeping bare-root trees in refrigeration until immediately prior to planting, which is the typical practice. Repeating this experiment without removing the control trees until the last day may result in fewer differences in hydration, and this limitation to the experimental design should also be acknowledged when considering the growth results. However, a small amount of dehydration was also observed in the 24 h soaked trees. This could indicate that they were losing moisture in the cooler as well, and that the water they regained in 24 h was insufficient to make up for the dehydration of the previous 72 h. In the remaining treatments, the weight increased, but longer soaking times did not result in a greater % change. In the trees soaked for 48, 72, or 96 h, the weights were statistically similar, though the 96 h treatment had the least amount of increase out of the three. It is possible that this represents a pattern of reduced gain when soaked for longer, though further, more extensive studies would be needed to verify this and to determine a causal mechanism.
The preplant moisture content has been shown to have an effect on plant health and growth in multiple horticultural commodities [20]. In roses (Rosa spp.), moisture loss is correlated with cane dieback as well as slower growth and flowering [21], while noble fir (Abies procera Rehd.) survival and growth is reduced when bare-root trees experience desiccation prior to planting [22]. In this study, the pear tree health was similar among the soaking treatments, which could be a direct effect of the mild spring conditions that buffered any transplant shock. Unlike the health assessments, the growth measurements did expose differences between the soaking-time treatments, indicating that the soaking time has a lasting effect on establishment. Trends in the TCSA among the treatments were similar between interstem and scion TCSAs. However, the interstem TCSA was statistically similar among the treatments while the scion TCSA was statistically lower in the 96 h compared to the 0 h and 24 h soaking treatments. In order to capture any temporary effects of different soaking treatments, we took leader measurements every month, instead of only at the end of the season. The 0 h trees also had less leader growth at the first measurement, and this trend remained throughout the season, with the 24, 48, and 72 h treatments all showing significantly more leader growth than 0 h when averaged across the season. Taken together, the TCSA and leader length differences indicate that the 24, 48, and 72 h preplant soaking times have better growth outcomes than not soaking or soaking for too long.
While the exact mechanism responsible for the reduced scion TCSA in the 96 h treatment was not identified in this study, it is possible that the hypoxic conditions that the roots experienced were a factor. Reduced oxygen in the root zone has been shown to have the universal effect of limiting root and vegetative growth in fruit trees, though this is usually attributed to the reduction in water and nutrient uptake by oxygen-deprived roots growing in waterlogged soils [23]. It is possible that even a relatively brief period (>72 h) of hypoxia limits aerobic respiration enough to cause a lasting effect once the trees are planted. This is supported by research in willows (Salix nigra L.) showing that soaking treatments with highly oxygenated water improve shoot and root growth compared to soaking in standard water [24]. It is also possible that soaking in tap water for an extended period of time caused solute leakage from the root cells, which has been identified as a potential issue confounding the research results in other plant studies [25,26]. Further research would be needed to determine any causal mechanisms, as this study did not measure the direct effects of soaking on root health or metabolism.
Stomatal conductance was used in this study to determine the relationship between the soaking time and the plant water status throughout the growing season, with the assumption that either transplant shock resulting in delayed root growth or damage from excessive soaking could result in trees more sensitive to water stress. Trees experiencing water stress were expected to exhibit lower gsw values, particularly directly prior to an irrigation event, with lower gsw values potentially affecting growth by limiting CO2 uptake [27,28,29,30]. However, it should be noted that this is a proxy and that the water potential was not measured directly. Other factors such as physical root damage or other forms of stress (e.g., high temperatures, salinity, pathogens, etc.) can also cause lower stomatal conductance independent of hydraulic water stress. Comparing the treatments on four different sampling dates did not show large differences between the before- and after-irrigation gsw values; however, there was an overall trend of values becoming lower as the season progressed, with stomatal conductance being the lowest in September. This could be explained by seasonal weather changes, with less solar radiation in September than the previous three months. Alternatively (or additionally), the reduction in active vegetative growth due to the onset of dormancy could have caused the decrease in the gsw values for this month. When averaged across the season, the 96 h treatment exhibited a lower gsw than the 24 and 72 h treatments, reinforcing the likelihood that 96 h is an excessive soaking time that has a negative effect on tree performance.
It should be noted that this study was conducted over a single season and at a single location, and that further research would be valuable for the formulation of useable recommendations regarding preplant soaking practices for the pear industry. It is possible that the optimal soaking window would change in hotter and drier environments, potentially constricting if negative effects of longer soaking times were obscured in this study by mild conditions. An expansion of the soaking window is less likely, given the negative effects we observed in the 96 h treatment; however, this could be affected by different pear and/or interstem cultivars. The issues caused by soaking too long could also be exasperated in more extreme climates, where stress is more severe.
5. Conclusions
This study investigated numerous factors related to the establishment success of ‘Bartlett’ pear trees on quince ‘Eline’ following preplant soaking times of 0, 24, 48, 72, or 96 h. The rehydration weights highlighted the benefit of soaking versus only holding in moist substrate, while the health assessments throughout the year showed a similar health status of the trees independent of soaking time. The TCSA and leader growth measurements considered together showed more growth in the 24, 48, and 72 h treatments, suggesting that these options are superior to not soaking or soaking for too long. The stomatal conductance measurements to test the tree water stress throughout the season supported these options. Collectively, these results suggest that growers could optimize orchard establishment by increasing early growth and decreasing plant stress, when utilizing a preplant soaking period of 24 to 72 h.
Supplementary Materials
The following supporting information can be downloaded at: https://www.mdpi.com/article/10.3390/horticulturae12101301/s1, Table S1. Maximum air temperature, minimum air temperature, average relative humidity, average solar radiation (daylight hours only), average wind speed and total precipitation amount experienced by the experimental block each 24 h day, at planting (20 May 2025) and for the remainder of the growing season until irrigation shut-off (30 September 2025). Data taken from (HOXO) Agrimet Weather Station, located in Hood River, Oregon, accessed on 14 October 2026 (https://www.usbr.gov/pn/agrimet/). Table S2. Average leader length measurements in cm in the first year for ‘Bartlett’ pear trees on quince ‘Eline’ rootstock with a ‘Beurre Hardy’ interstem after different soaking times of 0, 24, 48, 72, or 96 h. Average leader length in months one to four after planting for each soaking treatment and leader length for each soaking treatment averaged across the season (four dates) are presented. For each mean value, n = 5. Different letters indicate statistical differences by Tukey-adjusted mean separation based on estimated marginal means from the mixed-effects model (p ≤ 0.05).
Author Contributions
Conceptualization, K.D.G., A.A.T. and S.K.; Methodology, K.D.G., A.A.T., S.K., N.M. and B.J.P.; Software, N/A; Validation, K.D.G.; Formal Analysis, K.D.G., S.K. and N.M.; Investigation, K.D.G. and S.K.; Resources, K.D.G.; Data Curation, K.D.G. and S.K.; Writing—Original Draft Preparation, K.D.G. and S.K.; Writing—Review and Editing, K.D.G., S.K., A.A.T., N.M. and B.J.P.; Visualization, K.D.G. and S.K.; Supervision, K.D.G.; Project Administration, K.D.G.; Funding Acquisition, K.D.G. and A.A.T. All authors have read and agreed to the published version of the manuscript.
Funding
This research was funded by Columbia Gorge Fruit Growers (Hood River, OR).
Data Availability Statement
The raw data supporting the conclusions of this article will be made available by the authors upon request.
Acknowledgments
We would like to thank Travis Monahan, Claire Pierce, Jacob Wiessner and Vivian Olson for assisting with field planting and measurements, as well as Geoff LaGoe and Jack Brennan for field/block planting and maintenance. We would also like to acknowledge Tree Connection and Gold Crown Nursery for providing trees for this study.
Conflicts of Interest
The authors report no conflicts of interest.
Abbreviations
The following abbreviations are used in this manuscript:
| U.S. | United States |
| NL | Netherlands |
| BE | Belgium |
| WA | Washington |
| OR | Oregon |
| RCBD | Randomized Complete-Block Design |
| TCSA | Trunk Cross-Sectional Area |
| ANOVA | Analysis of Variance |
| VPD | Vapor Pressure Deficit |
References
- Elkins, R.; Bell, R.; Einhorn, T. Needs Assessment for Future US Pear Rootstock Research Directions Based on the Current State of Pear Production and Rootstock Research. J. Am. Pomol. Soc. 2012, 66, 153–163. [Google Scholar] [CrossRef] [Scilit]
- Zhang, L.; Morales-Briones, D.F.; Li, Y.; Zhang, G.; Zhang, T.; Huang, C.-H.; Guo, P.; Zhang, K.; Wang, Y.; Wang, H.; et al. Phylogenomics Insights into Gene Evolution, Rapid Species Diversification, and Morphological Innovation of the Apple Tribe (Maleae, Rosaceae). New Phytol. 2023, 240, 2102–2120. [Google Scholar] [CrossRef] [Scilit] [PubMed]
- Webster, A.D. A Brief Review of Pear Rootstock Development. Acta Hortic. 1998, 475, 135–142. [Google Scholar] [CrossRef] [Scilit]
- Wertheim, S.J. Rootstocks for European Pear: A Review. Acta Hortic. 2002, 596, 299–309. [Google Scholar] [CrossRef] [Scilit]
- Schwallier, P.; Irish-Brown, A. Hydrating New Bare Root Trees for Planting. Fruit Nuts Mich. State Univ. Ext. 2012. Available online: https://www.canr.msu.edu/news/hydrating_new_bare_root_trees_for_planting (accessed on 17 August 2026).
- Chakraborty, P.; Dwivedi, P. Seed Priming and Its Role in Mitigating Heat Stress Responses in Crop Plants. J. Soil Sci. Plant Nutr. 2021, 21, 1718–1734. [Google Scholar] [CrossRef] [Scilit]
- Fu, Y.; Ma, L.; Li, J.; Hou, D.; Zeng, B.; Zhang, L.; Liu, C.; Bi, Q.; Tan, J.; Yu, X.; et al. Factors Influencing Seed Dormancy and Germination and Advances in Seed Priming Technology. Plants 2024, 13, 1319. [Google Scholar] [CrossRef] [Scilit] [PubMed]
- Paparella, S.; Araújo, S.S.; Rossi, G.; Wijayasinghe, M.; Carbonera, D.; Balestrazzi, A. Seed Priming: State of the Art and New Perspectives. Plant Cell Rep. 2015, 34, 1281–1293. [Google Scholar] [CrossRef] [Scilit] [PubMed]
- Rhaman, M.; Rauf, F.; Tania, S.; Khatun, M. Seed Priming Methods: Application in Field Crops and Future Perspectives. Asian J. Res. Crop Sci. 2020, 5, 8–19. [Google Scholar] [CrossRef] [Scilit]
- Phipps, H.M.; Hansen, E.A.; Fege, A.S. Pre-Plant Soaking of Dormant Populus Hardwood Cuttings; North Central Forest Experiment Station Forest Service-U.S. Department of Agriculture: St. Paul, MN, USA, 1983; pp. 13–78.
- Peterson, L.; Phipps, H. Water Soaking Pretreatment Improves Rooting and Early Survival of Hardwood Cuttings of Some Populus Clones. Tree Plant. Notes 1976, 27, 12–22. [Google Scholar]
- Pezeshki, S.R.; Shields, F.D., Jr. Black Willow Cutting Survival in Streambank Plantings, Southeastern United States. JAWRA J. Am. Water Resour. Assoc. 2006, 42, 191–200. [Google Scholar] [CrossRef] [Scilit]
- Schaff, S.D.; Pezeshki, S.R.; Shields, F.D., Jr. Effects of Pre-Planting Soaking on Growth and Survival of Black Willow Cuttings. Restor. Ecol. 2002, 10, 267–274. [Google Scholar] [CrossRef] [Scilit]
- Arakawa, K.; Kasuga, J.; Takata, N. Mechanism of Overwintering in Trees. In Survival Strategies in Extreme Cold and Desiccation: Adaptation Mechanisms and Their Applications; Iwaya-Inoue, M., Sakurai, M., Uemura, M., Eds.; Springer: Singapore, 2018; pp. 129–147. ISBN 978-981-13-1244-1. [Google Scholar]
- Volaire, F.; Barkaoui, K.; Grémillet, D.; Charrier, G.; Dangles, O.; Lamarque, L.J.; Martin-StPaul, N.; Chuine, I. Is a Seasonally Reduced Growth Potential a Convergent Strategy to Survive Drought and Frost in Plants? Ann. Bot. 2023, 131, 245–254. [Google Scholar] [CrossRef] [Scilit] [PubMed]
- de Faÿ, E.; Vacher, V.; Humbert, F. Water-Related Phenomena in Winter Buds and Twigs of Picea abies L. (Karst.) until Bud-Burst: A Biological, Histological and NMR Study. Ann. Bot. 2000, 86, 1097–1107. [Google Scholar] [CrossRef] [Scilit]
- NPS Pacific West Region, Cultural Landscapes Program; California Department of Parks and Recreation, Archeology, History, and Museums Division. Historic Orchard and Fruit Tree Stabilization Handbook; U.S. Department of the Interior, National Park Service: Seattle, WA, USA, 2012.
- Brooks, M.; Kristensen, K.; Benthem, K.; van Magnusson, A.; Berg, C.; Nielsen, A.; Skaug, H.; Mächler, M.; Bolker, B. glmmTMB Balances Speed and Flexibility Among Packages for Zero-Inflated Generalized Linear Mixed Modeling. R J. 2017, 9, 378–400. [Google Scholar] [CrossRef] [Scilit]
- Hartig, F. DHARMa: Residual Diagnostics for Hierarchical (Multi-Level/Mixed) Regression Models, CRAN Contributed Packages, version 0.5.0; Vienna University of Economics and Business: Vienna, Austria, 2016. [Google Scholar] [CrossRef] [Scilit]
- Goyette, B.; Piché, M.; Brownbridge, M.; McGrath, D. Impact of Handling Practices on the Quality of Bare-Root Plants: A Review. J. Environ. Hortic. 2014, 32, 103–112. [Google Scholar] [CrossRef] [Scilit]
- Schuch, U.K.; Pemberton, H.B.; Kelly, J.J. Postharvest Moisture Loss from Bare-Root Roses Affects Performance of Containerized Plants. HortScience 2007, 42, 622–625. [Google Scholar] [CrossRef] [Scilit]
- Brønnum, P. Preplanting Indicators of Survival and Growth of Desiccated Abies Procera Bareroot Planting Stock. Scand. J. For. Res. 2005, 20, 36–46. [Google Scholar] [CrossRef] [Scilit]
- Rowe, R.N.; Beardsell, D.V. Waterlogging of Fruit Trees. Hortic. Abstr. 1973, 43, 533–548. [Google Scholar] [CrossRef] [Scilit]
- Martin, L.T.; Pezeshki, S.R.; Shields, F.D., Jr. High Oxygen Level in a Soaking Treatment Improves Early Root and Shoot Development of Black Willow Cuttings. Sci. World J. 2004, 4, 899–907. [Google Scholar] [CrossRef] [Scilit] [PubMed]
- Marchin, R.M.; Ossola, A.; Leishman, M.R.; Ellsworth, D.S. A Simple Method for Simulating Drought Effects on Plants. Front. Plant Sci. 2020, 10, 1715. [Google Scholar] [CrossRef] [Scilit] [PubMed]
- Arndt, S.K.; Irawan, A.; Sanders, G.J. Apoplastic Water Fraction and Rehydration Techniques Introduce Significant Errors in Measurements of Relative Water Content and Osmotic Potential in Plant Leaves. Physiol. Plant. 2015, 155, 355–368. [Google Scholar] [CrossRef] [Scilit] [PubMed]
- Kozlowski, T.T. Water Deficits and Plant Growth—Soil Water Measurement, Plant Responses, and Breeding for Drought Resistance. In Water Deficits and Plant Growth; Academic Press: New York, NY, USA, 1976; Volume IV, ISBN 978-0-323-15227-3. [Google Scholar]
- West, D.W.; Gaff, D.F. The Effect of Leaf Water Potential, Leaf Temperature and Light Intensity on Leaf Diffusion Resistance and the Transpiration of Leaves of Malus Sylvestris. Physiol. Plant. 1976, 38, 98–104. [Google Scholar] [CrossRef] [Scilit]
- Syvertsen, J.P. Integration of Water Stress in Fruit Trees. HortScience 1985, 20, 1039–1043. [Google Scholar] [CrossRef] [Scilit]
- Faralli, M.; Matthews, J.; Lawson, T. Exploiting Natural Variation and Genetic Manipulation of Stomatal Conductance for Crop Improvement. Curr. Opin. Plant Biol. 2019, 49, 1–7. [Google Scholar] [CrossRef] [Scilit] [PubMed]

Disclaimer/Publisher’s Note: The statements, opinions and data contained in all publications are solely those of the individual author(s) and contributor(s) and not of MDPI and/or the editor(s). MDPI and/or the editor(s) disclaim responsibility for any injury to people or property resulting from any ideas, methods, instructions or products referred to in the content. |
© 2026 by the authors. Licensee MDPI, Basel, Switzerland. This article is an open access article distributed under the terms and conditions of the Creative Commons Attribution (CC BY) license.