


Highlights
What are the main findings?
- Jinggang honey pomelo cultivars followed distinct, multidimensional quality trajectories during ripening.
- ‘Jinsha’ showed strongest growth and juice yield, whereas ‘Taoxi’ had highest soluble solids and seed load.
What are the implications of the main findings?
- Integrated PCA (82.51% variance) distinguishes cultivars and informs future grading studies.
- Harvest evaluation should consider acidity accumulation, not soluble solids alone.
Abstract
Jinggang honey pomelo (Citrus maxima (Burm.) Merr.), a regional cultivar group from Jiangxi Province, China, remains insufficiently characterized. This study evaluated morphological, peel-color, structural, edible, and physicochemical traits of ‘Jinlan’, ‘Jinsha’, and ‘Taoxi’ at immature (July) and commercial maturity (October–November) stages. The cultivars showed distinct developmental trajectories. At maturity, ‘Jinsha’ had the strongest late-stage growth (~186% fruit-weight increase; 9.0-fold flesh-weight gain) and high juice yield and edible rate. ‘Taoxi’ produced large fruits with the highest soluble solids content and titratable acidity, but retained substantial seed loads (69.15 ± 7.73 seeds per fruit). ‘Jinlan’ showed moderate enlargement but the highest mature-stage vitamin C content and retention. Peel-color development was cultivar-specific, with total color change following ‘Jinsha’ > ‘Taoxi’ > ‘Jinlan’. Within the local commercial harvest window, both soluble solids and titratable acidity increased, but the proportional increase in TA exceeded that of SSC, so the sugar–acid ratio declined in all three cultivars. Integrated principal component analysis (PCA) of 17 quantitative traits explained 82.51% of total variance in the first three components, confirming multidimensional quality differentiation jointly shaped by developmental stage and cultivar. These findings characterize cultivar-specific quality profiles, inform targeted market positioning, and provide a basis for future studies on harvest optimization and quality grading of Jinggang honey pomelo.
1. Introduction
Pomelo (Citrus maxima (Burm.) Merr.) is an important citrus fruit valued for its distinctive flavor, nutritional composition, and economic importance [1,2]. Jinggang honey pomelo is a regional cultivar group developed in Jiangxi Province, China, where favorable subtropical monsoon conditions, abundant rainfall, and red-soil resources support pomelo production. In Ji’an City, three cultivars—‘Jinlan’, ‘Jinsha’, and ‘Taoxi’—are widely cultivated and have become representative materials for local pomelo production [3]. These cultivars differ markedly in fruit morphology, peel appearance, seed characteristics, edible proportion, and physicochemical traits, indicating substantial potential for cultivar-specific production and market positioning.
Fruit quality formation is a dynamic process jointly shaped by genotype and developmental stage [4]. In citrus, commercial quality is commonly evaluated using external traits such as peel color, fruit size, and fruit shape, together with internal indicators such as edible rate, juice yield, soluble solids content, titratable acidity, sugar–acid balance, and vitamin C content [5]. However, these indicators do not always change synchronously during ripening. For example, peel color development may not accurately reflect internal maturity in all cultivars, and soluble solids accumulation may be accompanied by parallel changes in acidity or nutritional components. Therefore, cultivar-specific evaluation is necessary for reliable maturity assessment and quality grading [6,7].
Previous studies on pomelo and related citrus species have provided useful information on fruit physicochemical composition [1,8], peel color development [9], sugar and organic acid metabolism [10], and nutritional quality [5,11]. These studies indicate that fruit quality is regulated by multiple interacting processes, including assimilate allocation, juice sac development, pigment transition, organic acid accumulation or degradation, and antioxidant metabolism. Nevertheless, many available studies focus on single cultivars, isolated quality traits, or mature-stage fruit comparisons [12]. Integrated analyses that combine morphological, structural, edible, and physicochemical traits across developmental stages remain limited, particularly for regional cultivar groups [13].
For Jinggang honey pomelo, systematic comparative information on the three main cultivars remains insufficient. It is still unclear how ‘Jinlan’, ‘Jinsha’, and ‘Taoxi’ differ in their developmental trajectories, which traits best distinguish cultivar and maturity effects, and whether external appearance indicators can be used together with internal quality traits for cultivar-specific evaluation. In addition, seed characteristics, flesh development, juice yield, soluble solids, acidity, and vitamin C retention have rarely been assessed within a unified framework for this germplasm. These knowledge gaps limit the establishment of cultivar-specific harvest standards, quality grading criteria, and targeted utilization strategies.
To address these gaps, this study systematically compared fruit quality traits of ‘Jinlan’, ‘Jinsha’, and ‘Taoxi’ at the immature and commercial maturity stages. Morphological traits, peel color, peel smoothness, internal structure, seed characteristics, edible quality, juice-related traits, soluble solids, titratable acidity, sugar–acid ratio, and vitamin C content were evaluated. Univariate and multivariate analyses were used to identify key cultivar- and stage-dependent quality patterns [14]. The objectives were to: (1) characterize fruit-quality changes between two key developmental stages; (2) identify key traits distinguishing cultivars and developmental stages; and (3) lay the groundwork for future cultivar-specific harvest optimization and quality grading studies and inform market positioning of Jinggang honey pomelo.
2. Materials and Methods
2.1. Plant Materials and Sampling
Fruit samples of three major cultivars (‘Jinlan’, ‘Jinsha’, and ‘Taoxi’) of Jinggang honey pomelo (Citrus maxima (Burm.) Merr.) were collected from a standardized pomelo orchard located in Jinggangshan Agricultural Science and Technology Park, Jizhou District, Ji’an City, Jiangxi Province, China. The park is located at approximately 27° N latitude and has a typical subtropical humid monsoon climate, with an average annual temperature of 14–23 °C and annual precipitation of 1400–2400 mm. The soil in this area is mainly red soil with a pH of 5.5–6.5, providing favorable ecological conditions for pomelo cultivation [3]. The sampling location is shown in Figure 1.
Figure 1.
Geographic location of the Jinggang honey pomelo sampling orchard in Jinggangshan National Agricultural Science and Technology Park, Jizhou District, Ji’an City, Jiangxi Province, China. The red marker indicates the sampling site. Basemap source: © tiantianditu.com (accessed date 1 September 2026). Scale bar = 1000 m; north is at the top.
Two key sampling time points were used in this study. Fruits harvested in mid-July, specifically on 10 July 2022, were defined as the immature stage, whereas fruits harvested from late October to late November, specifically from 26 October to 20 November 2022, represented the commercial maturity stage. Commercial maturity was defined according to the local conventional harvest standard for this production area, i.e., when the fruit peel had completed most of its green-to-yellow color transition and the fruit had reached its marketable size and typical flavor. Accordingly, both sampling stages were defined by practice-based commercial criteria rather than standardized maturity indices, and the resulting constraints on interpreting developmental comparisons are acknowledged in Section 4.6. These harvest dates are consistent with the optimal harvest windows previously reported for ‘Jinlan’, ‘Jinsha’, and ‘Taoxi’ pomelos grown in the Jinggangshan region (approximately 188, 206, and 192 days after full bloom, respectively [15]), although exact anthesis dates were not recorded for the sampled trees. Because the three cultivars differ in bloom date and in the duration of fruit development, the synchronized 10 July sampling represents a common calendar-based pre-maturity stage rather than an identical physiological age across cultivars. Likewise, the mature-stage samples of each cultivar were collected within that cultivar’s own commercial harvest window, so cross-cultivar comparisons at commercial maturity refer to a practice-based, cultivar-specific endpoint rather than to an identical physiological stage. Because this criterion reflects commercial practice rather than the completion of physiological ripening, fruits harvested at this stage may still be in the late phase of organic-acid accumulation (see Section 4.5). For each cultivar–stage group, 20 fruits were collected for fruit-level morphological, structural, and edible-quality measurements. Within each cultivar, five trees were selected by the five-point sampling method (the four corners and the centre of the orchard block), and one fruit was picked from each of the four canopy orientations (east, south, west, and north) of each tree, so that approximately four fruits were obtained per tree and 20 fruits per group. This scheme was used to capture natural variation within the orchard and reduce tree- and canopy-position bias.
Sample processing was performed following the separation and weighing procedure described in the National Standard of the People’s Republic of China: Inspection Method for Fresh Citrus Fruits (GB/T 8210-2011), clause 5.7.2 [16], with the modification that the segment walls were retained in the pulp fraction, because they are consumed together with the juice vesicles in fresh-eaten pomelo and this study focused on mass allocation rather than industrial juice yield. Prior to dissection, whole fruits were rinsed with distilled water, dried with a soft cloth, and analyzed at a constant temperature of 20 ± 2 °C. Each fruit was placed on a clean tray, and the peel was carefully removed using a stainless-steel knife; the peel fraction was defined as the flavedo together with the entire white albedo. The exposed endocarp was separated into its natural segments, and any residual albedo adhering to the segment surface was removed with stainless-steel tweezers. Seeds were not excised during the separation; they were counted for each fruit (Section 2.3), and their mass is included in the pulp fraction. No further removal of the segment walls was performed; therefore, the pulp fraction was operationally defined as the remaining endocarp tissue, including the segment walls and juice vesicles. The peel and pulp fractions were weighed separately to the nearest 0.01 g. All fruits were processed individually. The same three trained operators performed all dissections after a joint pretrial calibration using reference fruits to standardize the separation procedure across cultivars and developmental stages. When an index was measured in technical triplicate, the three technical readings were averaged for each fruit before statistical analysis. Individual fruits, rather than technical replicates, were treated as biological replicates.
2.2. Determination of Fruit Morphological and Peel-Appearance Characteristics
Single-fruit weight (FW, g) was measured using an electronic balance with an accuracy of 0.01 g (model CN-LQC30002, LENQi, Kunshan Youkewei Electronics Technology Co., Ltd., Kunshan, China). Longitudinal diameter (LD, mm) and transverse diameter (TD, mm) were measured with a digital vernier caliper. Fruit shape index (FSI) was calculated as:
FSI = LD∕TD
Fruit shape was classified according to FSI as follows: oblong (FSI > 1.0), nearly round (0.85 ≤ FSI ≤ 1.0), flat round (0.71 ≤ FSI ≤ 0.85), and flat (FSI ≤ 0.70) [17].
Peel color was measured using a portable colorimeter (model WF30, Shenzhen Wave Optoelectronics Technology Co., Ltd., Shenzhen, China) at three evenly distributed points around the fruit equator. The instrument was calibrated against a standard white plate before each measurement session. CIE L*, a*, and b* values were recorded under illuminant D65 and a 10° standard observer angle. Here, L* represents lightness (0 = black, 100 = white), a* represents the green–red axis (negative = green, positive = red) and b* represents the blue–yellow axis (negative = blue, positive = yellow). The average of the three equatorial measurements was used as the final peel color value for each fruit.
It should be noted that, on the CIELAB color sphere, chroma (C*) values below approximately 30 fall within a perceptual gray zone in which no distinct color can be discerned; color parameter values within this range therefore require cautious interpretation.
Chroma (C*) was calculated as:
Hue angle (h°) was calculated using the two-argument arctangent function and expressed in degrees:
h° = atan2(b*,a*) × 180∕π
Negative h° values obtained from the two-argument arctangent were corrected by adding 360° (i.e., if h < 0, h = h + 360), so that all hue angles were expressed within the 0–360° range.
The Citrus Color Index (CCI) was calculated as [18]:
CCI = (1000 × a*)∕(L* × b*)
The total color difference (ΔE) between the immature and commercial maturity stages for each cultivar was calculated based on the group mean L*, a*, and b* values:
where ΔL*, Δa*, and Δb* represent the differences in L*, a*, and b* between the two developmental stages.
Peel smoothness was visually evaluated and graded by three trained assessors who were blind to cultivar and stage information. Four grades were used, defined by the extent and severity of surface irregularities and following the categorical scale specified for citrus fruit-surface smoothness in the Chinese national standard NY/T 2930-2016, clause 4.2.36 [17], with the “medium” grade collapsed into the adjacent categories to keep the operational contrast clear: smooth, an even surface with no visible protrusions or wrinkles; relatively smooth, a few slight protrusions or wrinkles on part of the surface; relatively rough, obvious protrusions or wrinkles covering a moderate proportion of the surface; and rough, numerous pronounced protrusions and wrinkles over most of the fruit surface. Each assessor independently scored all fruit samples, and the final grade for each fruit was determined by majority consensus. Discrepancies were resolved through discussion to reach a unanimous decision.
2.3. Determination of Internal Structure and Seed Characteristics
The peel, including the albedo, was manually removed from each fruit and weighed using an electronic balance. After the fruit was cut horizontally, peel thickness (PT, mm) was measured at the equatorial region using a digital vernier caliper. The number of segments (SN) was then counted manually.
All seeds were manually removed and counted. Fruits in which no seeds were detected were recorded as having zero seeds. For subsequent analyses, fruits with a seed number of 0 were classified as seedless, whereas fruits with a seed number greater than 0 were classified as seeded.
2.4. Determination of Edible and Physicochemical Quality Indices
The pulp (flesh) was separated from each fruit as described in Section 2.1 and weighed to the nearest 0.01 g using an electronic balance. The edible rate (ER) was defined as the percentage of the total fresh fruit weight represented by the pulp fraction and was calculated as follows:
where pulp weight is the mass of the pulp (flesh) fraction and fruit weight is the total fresh mass of the same fruit; the pulp fraction comprised the endocarp tissue, including the segment walls, juice vesicles, and seeds, and excluded only the peel (Section 2.1). The seeds were counted separately (Section 2.3), but their mass remained part of the pulp weight.
To determine juice yield, a 20-g portion of fresh pulp was homogenized in a portable blender cup (a household-grade personal blender). The resulting pulp–juice slurry was transferred to a Büchner funnel (100 mm inner diameter) fitted with qualitative filter paper (medium retention) and subjected to vacuum filtration using an SHZ-D(III) circulating-water vacuum pump (Shanghai Lingke Industrial Development Co., Ltd., Shanghai, China). After filtration, the collected juice was weighed, and juice yield (JY) was calculated as follows:
For moisture determination, 5 g of fresh pulp was placed in a labeled disposable aluminum dish and dried in a forced-air oven at 80 °C (model DHG-9070A, Shanghai Yiheng Scientific Instrument Co., Ltd., Shanghai, China) for 48 h until a constant weight was reached. Moisture content (MC) was calculated as:
The soluble solids content (SSC, °Brix) of the filtered juice was determined using a digital refractometer (PAL-1, ATAGO Co., Ltd., Tokyo, Japan). SSC was used as an indicator of total soluble-solids accumulation rather than as a direct measure of individual sugars.
Titratable acidity (TA) was determined by indicator titration according to the National Standard for the Determination of Titratable Acidity in Fruit and Vegetable Products (GB/T 12293-1990, superseded by GB 12456-2021) [19]. Fresh pulp was homogenized with an equal mass of distilled water, and a 20-g portion of the homogenate was rinsed into a 250-mL volumetric flask with distilled water, heated in an 80 °C water bath for 30 min with intermittent shaking, cooled to room temperature, diluted to volume, and filtered. A 50-mL aliquot of the filtrate was titrated with 0.1 mol/L sodium hydroxide standard solution (Sinopharm Chemical Reagent Co., Ltd., Shanghai, China) using phenolphthalein as the indicator (Sinopharm Chemical Reagent Co., Ltd., Shanghai, China) to a faint pink endpoint persisting for 30 s. TA was expressed as the percentage of citric acid monohydrate equivalents. The sugar–acid ratio (SAR) was calculated as:
Vitamin C (VC) concentration was determined using the 2,6-dichloroindophenol (Sinopharm Chemical Reagent Co., Ltd., Shanghai, China) titration method in accordance with the National Food Safety Standard for the Determination of Ascorbic Acid in Foods (GB 5009.86-2016, superseded by GB 5009.86-2025) [20]. The results were expressed as milligrams of ascorbic acid per 100 g of fresh pulp.
Unless otherwise stated, physicochemical measurements were performed in triplicate, and the mean value for each sample was used for subsequent statistical analyses.
2.5. Statistical Analysis and Visualization
All quantitative data are presented as mean ± standard error (SE). The experiment was conducted using a completely randomized design, with cultivar and developmental stage treated as fixed factors. Two-way analysis of variance (ANOVA) was used to evaluate the effects of cultivar, developmental stage, and their interaction on quantitative traits. When significant differences were detected, means were separated using Tukey’s honestly significant difference (HSD) test at p < 0.05.
For peel-smoothness data, Pearson’s chi-square test was used to evaluate differences among cultivars within each developmental stage and between developmental stages within each cultivar. When expected cell frequencies were small, likelihood-ratio G2 tests and Fisher’s exact tests based on collapsed 2 × 2 tables were used as supplementary analyses. The strength of association was expressed using Cramér’s V.
Because seed-number data were strongly zero-inflated in the near-seedless cultivars, the Kruskal–Wallis test was used for comparisons among the six cultivar–stage groups. Mann–Whitney U tests were additionally performed for pre-specified immature-versus-mature comparisons within each cultivar. For contingency analyses, fruits with a seed number of 0 were classified as seedless, and fruits with a seed number greater than 0 were classified as seeded.
Principal component analysis (PCA) was performed on the four morphological traits and on the integrated set of 17 quantitative quality traits. Before PCA, variables were standardized to z-scores. Multivariate analysis of variance (MANOVA), based on Pillai’s trace, was used to test the overall effects of cultivar and developmental stage on the combined quality profile. Pearson correlation analysis was used to assess pairwise relationships among major quantitative traits. Standardized group means were visualized using heatmaps.
Statistical analyses were performed using SPSS Statistics version 26.0 (IBM Corp., Armonk, NY, USA) and R version 4.2.1. Data processing and figure generation were performed in Python 3.13.14 using pandas 3.0.6, NumPy 2.5.4, SciPy 1.16.1, scikit-learn 1.7.1, matplotlib 3.11.2, seaborn 0.13.2, openpyxl 3.1.5, and Pillow 12.3.0. Statistical significance was defined as p < 0.05.
Generative AI tools were used during manuscript preparation in a supportive capacity. DeepSeek-V4.1-Flash was used for conceptual brainstorming and literature-screening support; WorkBuddy v5.3.5 was used for language refinement and manuscript-structure optimization; and OpenAI Codex based on GPT-5 was used to assist with the preparation and checking of data-analysis and visualization scripts. All experimental measurements, raw data collection, data curation, statistical decisions, biological interpretation, visualization outputs, and final conclusions were performed, checked, and approved by the authors. The AI tools were not used to generate experimental data, fabricate or alter raw data, manipulate results, or make autonomous scientific conclusions.
3. Results
3.1. Fruit Morphology and Appearance
3.1.1. Fruit Size, Weight and Shape Index
Significant differences were observed among the three cultivars and two developmental stages for all four morphological parameters (single-fruit weight, longitudinal diameter, transverse diameter, and fruit shape index). Two-way ANOVA revealed that cultivar, developmental stage, and their interaction all exerted significant effects on each parameter (p < 0.05), except that the cultivar × stage interaction for fruit shape index was weaker but still significant (F = 3.43, p = 0.036), indicating that the three cultivars followed divergent developmental trajectories in fruit shape (Table 1).
Table 1.
Morphological parameters of three Jinggang honey pomelo cultivars at immature and commercial maturity stages. Values are means ± SE (n = 20).
At the immature stage, single-fruit weight differed significantly among all three cultivars (Tukey’s HSD, p < 0.05), decreasing in the order ‘Taoxi’ (451.36 ± 16.42 g) > ‘Jinlan’ (311.56 ± 8.37 g) > ‘Jinsha’ (213.60 ± 9.99 g), with ‘Taoxi’ fruits weighing 2.11-fold more than ‘Jinsha’ fruits. By commercial maturity, however, this ranking changed: ‘Taoxi’ (648.33 ± 18.00 g) and ‘Jinsha’ (610.32 ± 30.60 g) reached comparable weights (Tukey HSD, p > 0.05), both significantly exceeding ‘Jinlan’ (501.16 ± 16.15 g). The most dramatic weight gain was recorded in ‘Jinsha’ (+185.73%), far surpassing ‘Jinlan’ (+60.86%) and ‘Taoxi’ (+43.64%), reflecting the strong cultivar × stage interaction (F = 21.13, p < 0.001). This indicates that ‘Jinsha’ Pomelo showed the greatest late-stage increase in fruit size under the present sampling conditions.
Longitudinal and transverse diameters increased during maturation in all cultivars except ‘Taoxi’, whose longitudinal diameter remained nearly unchanged (130.74 → 129.66 mm, −0.83%). ‘Jinsha’ exhibited the greatest expansion in both dimensions (length +25.94%, width +29.58%), consistent with its exceptional weight gain. All cultivars showed a longitudinal/transverse diameter ratio greater than 1.0 at the immature stage, indicating an elongated or oval fruit form, with ‘Jinlan’ showing the highest index (1.23 ± 0.02). During maturation, the shape index declined in all cultivars, with ‘Taoxi’ showing the most pronounced reduction (−10.90%, from 1.18 ± 0.02 to 1.05 ± 0.02), shifting from elongated to nearly globose. At maturity, ‘Taoxi’ was significantly distinguished from all other groups (Tukey HSD, p < 0.001), while the remaining five groups were statistically indistinguishable (Table 1).
Principal component analysis of the four morphological traits jointly summarized the cultivar and developmental stage effects visualized in Table 1 (Figure 2). PC1 (65.6% of variance) was positively loaded by fruit weight (FW, +0.59), longitudinal diameter (LD, +0.53), and transverse diameter (TD, +0.59), and negatively loaded by shape index (FSI, −0.15), representing an overall fruit-size gradient. All immature-stage groups clustered on the negative side of PC1, whereas all mature-stage groups clustered on the positive side, confirming a strong developmental shift in fruit size. PC2 (31.2% of variance) was driven primarily by fruit shape index (+0.87), with a secondary contribution from longitudinal diameter (+0.45), and therefore represented a shape-related axis rather than a simple size gradient. At maturity, ‘Taoxi’ Pomelo shifted markedly toward lower PC2 scores (mean PC2 = −1.61) relative to its immature counterpart (mean PC2 = +0.41), reflecting the pronounced reduction in shape index from 1.18 to 1.05, while ‘Jinlan’ and ‘Jinsha’ maintained similar PC2 positions across stages. The PCA thus provides a compact, integrative visualization of how the three Jinggang honey pomelo cultivars differ in size and shape during fruit development.
Figure 2.
Principal component analysis (PCA) biplot of four morphological traits (single-fruit weight, longitudinal diameter, transverse diameter, and shape index) measured on all 120 individual fruits (n = 20 per cultivar–stage group). Each point represents one fruit. PC1 (65.6% of variance) reflects overall fruit size, with positive loadings for fruit weight (FW), longitudinal diameter (LD), and transverse diameter (TD). PC2 (31.2% of variance) reflects fruit shape, with a positive loading for shape index (FSI). Filled symbols indicate commercial-maturity fruits and open symbols indicate immature fruits; colors indicate cultivar (orange = ‘Jinlan’; blue = ‘Jinsha’; green = ‘Taoxi’). Colored ellipses show 95% confidence regions for each cultivar–stage group, and group centroids are labelled (JLI, JSI, TXI, JLM, JSM, TXM). The clear separation along PC1 confirms a strong maturation gradient, whereas PC2 captures cultivar-specific shape differences, with ‘Taoxi’ showing the most negative PC2 scores at maturity.
3.1.2. Peel Smoothness
Peel smoothness showed clear cultivar- and stage-dependent variation among the three Jinggang honey pomelo cultivars (Figure 3, Table 2).
Figure 3.
Distribution of peel smoothness grades in three Jinggang honey pomelo cultivars at two developmental stages. (A) Immature stage; (B) commercial maturity stage. Bars show the percentage of fruits assigned to each smoothness grade (n = 20 per cultivar–stage group). Different colors represent smooth, relatively smooth, relatively rough, and rough categories.
Table 2.
Distribution of peel smoothness grades among three Jinggang honey pomelo cultivars at the immature (I, July) and commercial maturity (M, Oct–Nov) stages. Data are expressed as the number of fruits and the corresponding percentage in parentheses (n = 20 per cultivar–stage group).
At the immature stage, peel smoothness differed strongly among cultivars (χ2 = 47.48, df = 4, p < 0.001; Cramér’s V = 0.629), indicating a large cultivar effect. The “relatively rough” category was absent in all three cultivars at this stage and was therefore excluded from the contingency-table test. ‘Jinlan’ Pomelo had the highest proportion of smooth or relatively smooth fruits, with 35% classified as smooth and 55% as relatively smooth, whereas only 10% were classified as rough. In contrast, ‘Jinsha’ Pomelo was dominated by rough fruits (95%), with only one fruit classified as relatively smooth. ‘Taoxi’ Pomelo showed a uniformly rough peel surface at the immature stage, with all fruits classified as rough. The likelihood-ratio test supported the same conclusion (G2 = 54.93, df = 4, p < 0.001).
At commercial maturity, cultivar differences in peel smoothness remained significant, although the effect size was smaller than that observed at the immature stage (χ2 = 15.03, df = 6, p = 0.020; Cramér’s V = 0.354). The likelihood-ratio test also indicated significant cultivar-dependent differences (G2 = 18.64, df = 6, p = 0.0048). ‘Jinsha’ Pomelo showed the broadest distribution of peel smoothness grades at maturity, with all four categories represented: 10% smooth, 15% relatively smooth, 30% relatively rough, and 45% rough. ‘Jinlan’ Pomelo had no smooth or relatively rough fruits at maturity, and 70% of fruits were classified as rough. ‘Taoxi’ Pomelo also remained predominantly rough, with 75% rough, 20% relatively rough, and 5% relatively smooth fruits; no fruits were classified as smooth.
Within-cultivar comparisons revealed distinct developmental patterns. ‘Jinlan’ Pomelo showed a pronounced deterioration in peel smoothness during maturation (χ2 = 17.47, df = 2, p < 0.001; Cramér’s V = 0.661; G2 = 21.32, p < 0.001). The proportion of smooth or relatively smooth fruits decreased from 90% at the immature stage to 30% at maturity, while the proportion of rough fruits increased from 10% to 70%. This stage effect was also confirmed by Fisher’s exact test after collapsing the grades into smooth/relatively smooth versus relatively rough/rough categories (p < 0.001).
‘Jinsha’ Pomelo showed a significant change in the overall distribution of peel smoothness grades between stages (χ2 = 12.57, df = 3, p = 0.006; Cramér’s V = 0.561; G2 = 15.79, p = 0.001). However, the collapsed Fisher’s exact test was not significant (p = 0.182), indicating that the developmental change mainly reflected redistribution among adjacent grades rather than a clear shift between smooth and rough categories. Specifically, the proportion of rough fruits decreased from 95% to 45%, while relatively rough fruits increased from 0% to 30% and smooth fruits increased from 0% to 10%.
For ‘Taoxi’ Pomelo, evidence for a stage effect was weak and inconsistent. Pearson’s chi-square test did not reach significance (χ2 = 5.71, df = 2, p = 0.057), and the collapsed Fisher’s exact test was not significant (p = 1.000), although the likelihood-ratio test was nominally significant (G2 = 7.65, p = 0.022). Therefore, ‘Taoxi’ Pomelo was interpreted as maintaining a predominantly rough peel surface from the immature stage to commercial maturity.
Taken together, these results indicate that peel smoothness is strongly cultivar-dependent and follows cultivar-specific developmental trajectories. ‘Jinlan’ Pomelo showed the clearest maturation-associated decline in peel smoothness, ‘Jinsha’ Pomelo developed greater heterogeneity in peel texture, and ‘Taoxi’ Pomelo retained a consistently rough peel surface across both developmental stages.
3.1.3. Peel Color Characteristics
Beyond fruit size and surface texture, peel color is another critical external quality attribute that influences consumer acceptance and commercial value.
Peel color was characterized using the CIE L*a*b* color system and several derived descriptors, including chroma (C*), hue angle (h°), the Citrus Color Index (CCI), and total color difference (ΔE) (Section 2.2, Table 3).
Table 3.
Peel color parameters of three Jinggang honey pomelo cultivars at the immature (I, July) and commercial maturity (M, October–November) stages. Values are means ± SE (n = 20 per cultivar–stage group).
Notably, the immature-stage C* values (30.16–32.15) were close to the perceptual gray-zone threshold of approximately 30, indicating weakly saturated green coloration, whereas the mature-stage C* values (36.80–40.28) represented distinct yellow coloration.
Two-way ANOVA showed that developmental stage and the cultivar × stage interaction significantly affected all measured color parameters (p < 0.001; Table 3). The cultivar main effect was significant for L*, a*, h°, and CCI (p < 0.001), and for b* (p = 0.004), but not for C* (p = 0.060). For L*, the stage effect was dominant (F = 1551.83, p < 0.001), and the cultivar × stage interaction was also significant (F = 61.42, p < 0.001). Significant cultivar × stage interactions were similarly observed for a* (F = 66.92), b* (F = 25.14), C* (F = 21.56), h° (F = 80.61), and CCI (F = 90.02), all with p < 0.001, indicating cultivar-specific color trajectories during fruit development.
At the immature stage, ‘Jinlan’ Pomelo had the highest lightness value (L* = 51.10 ± 0.53), whereas ‘Taoxi’ Pomelo had the lowest value (L* = 45.98 ± 0.21). All three cultivars exhibited predominantly green peel coloration, with negative a* values ranging from −11.83 to −10.15, b* values ranging from 28.36 to 30.15, chroma values ranging from 30.16 to 32.15, and hue angles above 109°. At commercial maturity, ‘Jinsha’ Pomelo showed the greatest increase in lightness, reaching L* = 70.45 ± 0.53, an increase of 48.4% relative to the immature stage. In contrast, ‘Jinlan’ Pomelo had the lowest mature-stage lightness value (L* = 62.73 ± 0.72) and retained a strongly negative a* value (−8.55 ± 0.19), indicating greater residual greenness. b* increased in all cultivars, with ‘Taoxi’ Pomelo reaching the highest mature-stage value (b* = 40.15 ± 0.50), corresponding to a 41.6% increase. Chroma also increased during maturation, with mature-stage values ranging from 36.80 to 40.28. Hue angle decreased from 112.10° to 93.03° in ‘Jinsha’ Pomelo and from 109.89° to 92.11° in ‘Taoxi’ Pomelo, whereas the change in ‘Jinlan’ Pomelo was smaller, from 110.23° to 103.45°. These shifts indicate cultivar-dependent transitions from green toward yellow peel coloration during maturation (Figure 4A,B; Table 3).
Figure 4.
Integrated visualization of peel-color development in three Jinggang honey pomelo cultivars at two developmental stages. (A) CIE a*–b* color-space trajectories based on group means; arrows indicate the shift from the immature stage (I) to commercial maturity (M), and error bars indicate SE for a* and b*. (B) L* lightness. (C) Citrus Color Index (CCI). (D) Total color difference (ΔE) between immature- and mature-stage centroids for each cultivar. Values in panels (B,C) are means ± SE (n = 20 per cultivar–stage group), and different lowercase letters indicate significant differences among the six cultivar–stage groups (p < 0.05). Panel (D) shows a single ΔE value per cultivar, calculated from group centroids; therefore, no standard error is applicable. Colors indicate cultivar: orange = ‘Jinlan’, blue = ‘Jinsha’, green = ‘Taoxi’.
The CIE a*–b* trajectory plot directly visualizes the direction and magnitude of peel-color transition from the immature stage to commercial maturity (Figure 4A). ‘Jinsha’ and ‘Taoxi’ Pomelos shifted markedly toward less negative a* values and higher b* values, whereas ‘Jinlan’ Pomelo showed a shorter displacement and retained a stronger green component at maturity.
The CCI provided an integrated description of peel greenness and yellowness. All CCI values were negative, but values approached zero during maturation, indicating a reduction in the green component of the peel color (Figure 4C). At the immature stage, ‘Jinsha’ Pomelo had the lowest CCI (−8.57 ± 0.14), significantly lower than those of ‘Jinlan’ and ‘Taoxi’ Pomelos. At maturity, CCI values of ‘Jinsha’ and ‘Taoxi’ Pomelos approached zero (−0.83 and −0.54, respectively) and were not significantly different from each other. In contrast, ‘Jinlan’ Pomelo retained a substantially more negative CCI (−3.85 ± 0.15), significantly lower than those of the other two mature-stage groups, indicating a slower reduction in residual greenness.
The total color difference ΔE was calculated from the centroid differences between the immature and mature stages for each cultivar (Figure 4D). ‘Jinsha’ Pomelo showed the largest overall color change (ΔE = 26.1), driven by increases in L* (+23.0), a* (+9.7), and b* (+7.4). ‘Taoxi’ Pomelo had the second-largest color difference (ΔE = 21.5), mainly because it showed the greatest increase in b* (+11.8). ‘Jinlan’ Pomelo showed the smallest color difference (ΔE = 13.2), consistent with its more limited transition toward a brighter and less green peel color.
Taken together, the three cultivars followed distinct peel-color trajectories during fruit development. ‘Jinlan’ Pomelo showed the slowest reduction in greenness and retained the strongest green component at commercial maturity. ‘Jinsha’ Pomelo exhibited the largest overall color transition and the highest mature-stage lightness, whereas ‘Taoxi’ Pomelo developed the highest mature-stage yellowness and chroma. These color parameters provide useful non-destructive descriptors of external color development; however, their use as indicators of harvest maturity should be further validated against internal maturity and fruit-quality traits.
3.2. Internal Structure and Seed Characteristics
3.2.1. Peel Thickness and Segment Number
Peel thickness and segment number represent complementary structural traits of the fruit. Two-way ANOVA showed that developmental stage was the dominant factor affecting peel thickness (F = 372.24, p < 0.001); cultivar also had a significant effect (F = 5.02, p = 0.008), and the cultivar × stage interaction was significant (F = 7.12, p = 0.001). In contrast, segment number was not significantly affected by cultivar (F = 1.83, p = 0.165), developmental stage (F = 3.13, p = 0.079), or their interaction (F = 2.55, p = 0.083) (Table 4).
Table 4.
Peel thickness and segment number of three Jinggang honey pomelo cultivars at the immature (I, July) and commercial maturity (M, October–November) stages. Values are means ± SE (n = 20 per cultivar–stage group).
Peel thickness declined markedly during maturation in all three cultivars. At the immature stage, mean peel thickness ranged from 23.24 to 23.91 mm, and no significant differences were detected among cultivars (Tukey’s HSD, p > 0.05). At commercial maturity, ‘Jinsha’ Pomelo had the thinnest peel (12.11 ± 0.44 mm), significantly thinner than that of ‘Taoxi’ Pomelo (16.21 ± 0.61 mm), whereas ‘Jinlan’ Pomelo (14.16 ± 0.56 mm) did not differ significantly from either cultivar. Relative peel-thickness reductions were 39.1% in ‘Jinlan’, 49.4% in ‘Jinsha’, and 31.2% in ‘Taoxi’, indicating cultivar-dependent patterns of peel thinning during fruit development.
Segment number remained within a relatively narrow range across the six cultivar–stage groups (12.45–13.55 segments per fruit). No significant pairwise differences were detected after Tukey adjustment, and the absence of significant cultivar, stage, or interaction effects indicates that segment number was comparatively stable over the sampled developmental interval (Figure 5).
Figure 5.
Peel thickness and segment number of three Jinggang honey pomelo cultivars at two developmental stages. (A) Peel thickness; (B) segment number. Small points represent individual fruits, and larger symbols represent means ± SE (n = 20 per cultivar–stage group). Open symbols indicate the immature stage (I), and filled symbols indicate commercial maturity (M). Lines connect cultivar-specific stage means. Different lowercase letters in panel (A) indicate significant differences among the six cultivar–stage groups (p < 0.05). “ns” in panel (B) indicates no significant pairwise differences.
3.2.2. Seed Number and Seedless-Fruit Proportion
In addition to peel thickness and segment number (Section 3.2.1), seed characteristics represented a key component of internal fruit structure. Seed number differed significantly among the six cultivar–stage groups (Kruskal–Wallis H = 98.47, p < 0.001; Table 5).
Table 5.
Seed number and seedless-fruit proportion of three Jinggang honey pomelo cultivars at the immature (I, July) and commercial maturity (M, October–November) stages. Seed-number values are means ± SE (n = 20 per cultivar–stage group); seedless-fruit data are expressed as n/N.
The three cultivars exhibited sharply contrasting seed profiles. At the immature stage, all ‘Taoxi’ Pomelo fruits contained seeds, with a mean of 135.10 ± 6.40 seeds per fruit (range: 60–177). In contrast, ‘Jinlan’ and ‘Jinsha’ Pomelos were largely seedless: 85% (17/20) and 75% (15/20) of immature fruits, respectively, contained no seeds, and the few seeded fruits had at most 15 (‘Jinlan’) or 7 (‘Jinsha’) seeds. A chi-square test on the proportion of seedless versus seeded fruits across the six groups was highly significant (χ2 = 74.34, df = 5, p < 0.001; Cramér’s V = 0.787). Pairwise Fisher exact tests after pooling developmental stages by cultivar showed that ‘Jinlan’ and ‘Jinsha’ did not differ significantly from each other (p = 0.378), whereas both differed significantly from ‘Taoxi’ (p < 0.001 for both comparisons).
At commercial maturity, the near-seedless phenotype of ‘Jinlan’ and ‘Jinsha’ remained evident, with 90% (18/20) and 80% (16/20) of fruits being seedless, respectively. The few seeded fruits of ‘Jinsha’ contained up to 23 seeds, whereas no ‘Jinlan’ fruit contained more than one seed. In ‘Taoxi’ Pomelo, seed number decreased significantly from 135.10 ± 6.40 at the immature stage to 69.15 ± 7.73 at maturity (Mann–Whitney U = 372.5, p < 0.001), representing a 48.8% reduction. However, all mature ‘Taoxi’ fruits still contained seeds, with a minimum of 16 seeds per fruit, indicating that seed number declined during maturation but seed development was not eliminated (Table 5 and Figure 6).
Figure 6.
Seed-number characteristics of three Jinggang honey pomelo cultivars at the immature (I) and commercial maturity (M) stages. (A) Proportion of seedless and seeded fruits. (B) Seed number per fruit plotted on a log10(y + 1) scale. Small points represent individual fruits, and larger symbols represent means ± SE (n = 20 per cultivar–stage group). Open symbols indicate the immature stage, and filled symbols indicate commercial maturity.
Taken together, seed characteristics showed the most pronounced cultivar-dependent variation among the internal structural traits examined in this study. ‘Jinlan’ and ‘Jinsha’ Pomelos were consistently near-seedless throughout development, with 75–90% of fruits containing no seeds, whereas ‘Taoxi’ Pomelo was uniformly seeded despite a substantial reduction in seed number during maturation. These differences provide a clear basis for the discussion of consumer acceptance and commercial grading in Section 4.4.
3.3. Edible Yield and Mass Allocation
3.3.1. Peel–Flesh Mass Allocation and Edible Rate
Beyond the internal structural traits examined in Section 3.2, the distribution of fruit mass among peel and flesh components directly determines the edible value of pomelo fruits. Peel weight, flesh weight, and edible rate (flesh weight as a proportion of total fruit weight) were therefore analyzed using two-way ANOVA (Table 6). All three metrics showed significant effects of developmental stage and the cultivar × stage interaction (p < 0.001 for all). The cultivar main effect was significant for peel weight (F = 72.93, p < 0.001) and edible rate (F = 48.58, p < 0.001) but not for flesh weight (F = 1.35, p = 0.262), indicating that the three cultivars attained comparable flesh masses when averaged across stages but differed in peel mass and in the proportion of edible tissue.
Table 6.
Peel weight, flesh weight, and edible rate of three Jinggang honey pomelo cultivars at the immature (I, July) and commercial maturity (M, October–November) stages. Values are means ± SE (n = 20 per cultivar–stage group).
‘Taoxi’ Pomelo consistently had the highest peel weight at both stages (331.15 ± 11.08 g immature; 331.56 ± 9.68 g mature), reflecting its larger overall fruit size. ‘Jinsha’ Pomelo, by contrast, had the lowest immature peel weight (176.31 ± 8.31 g) but exhibited the greatest increase during maturation (+55.8%), reaching 274.67 ± 16.15 g at maturity. ‘Jinlan’ peel weight remained relatively stable (216.48 ± 6.17 g to 227.61 ± 7.12 g, +5.1%). The significant cultivar × stage interaction (F = 13.63, p < 0.001) reflected these divergent trajectories: peel growth was largely complete by the immature stage in ‘Jinlan’ and ‘Taoxi’, whereas ‘Jinsha’ continued to accumulate peel tissue through maturation.
Among the three mass-allocation traits, flesh weight showed the most pronounced developmental increase, rising 2.9-fold in ‘Jinlan’ (94.69 ± 3.81 g to 273.56 ± 11.64 g), 3.8-fold in ‘Taoxi’ (83.12 ± 4.68 g to 316.77 ± 12.19 g), and 9.0-fold in ‘Jinsha’ (37.29 ± 2.12 g to 335.65 ± 17.92 g). The cultivar main effect was not significant (F = 1.35, p = 0.262), because the low immature flesh weight of ‘Jinsha’ offset its high mature-stage value when stages were pooled. However, the significant interaction (F = 16.61, p < 0.001) confirmed that the rate of flesh expansion was cultivar-dependent: ‘Jinsha’ Pomelo, starting from a much smaller immature base, ultimately surpassed both ‘Jinlan’ and ‘Taoxi’ in absolute flesh weight at maturity, although the difference between ‘Jinsha’ and ‘Taoxi’ at maturity was not statistically significant (Tukey HSD, p > 0.05).
Edible rate mirrored the flesh weight trends, increasing significantly in all three cultivars during maturation (stage: F = 1674.34, p < 0.001). ‘Jinsha’ Pomelo showed the most dramatic improvement, from 17.45 ± 0.64% at the immature stage to 55.00 ± 1.23% at maturity (+37.6 percentage points, +215.1% relative increase), followed by ‘Taoxi’ (18.29 ± 0.68% to 48.75 ± 0.95%, +30.5 pp) and ‘Jinlan’ (30.35 ± 0.80% to 54.35 ± 1.06%, +24.0 pp). At the immature stage, ‘Jinlan’ already had a significantly higher edible rate than ‘Jinsha’ and ‘Taoxi’, which did not differ from each other. At commercial maturity, ‘Jinlan’ and ‘Jinsha’ achieved comparable edible rates (54.35% and 55.00%, respectively), both significantly exceeding ‘Taoxi’ (48.75%; Tukey HSD, p < 0.05).
Collectively, these results reveal a fundamental shift in mass allocation during pomelo maturation. In immature fruits, peel accounted for 69.5–82.5% of total fruit weight, whereas at commercial maturity this proportion decreased to 45.0–51.3%. Flesh became the dominant mass component in ‘Jinlan’ and ‘Jinsha’, while ‘Taoxi’ still retained a slightly higher peel proportion, consistent with its lower edible rate at maturity. Despite achieving comparable mature-stage flesh weights, the three cultivars differed in edible rate: ‘Jinlan’ and ‘Jinsha’ reached approximately 54–55% edible rate, while ‘Taoxi’ remained at 48.75%, constrained by its persistently thick and heavy peel. These differences have direct implications for fresh consumption and processing efficiency (Figure 7).
Figure 7.
Peel–flesh mass allocation and edible rate of three Jinggang honey pomelo cultivars at the immature (I, July) and commercial maturity (M, October–November) stages. (A) Peel weight, (B) flesh weight, and (C) edible rate. Small dots represent individual samples, and large circles with error bars represent means ± SE (n = 20 per cultivar–stage group). Open circles indicate the immature stage, and filled circles indicate commercial maturity. Lines connect the two developmental stages within each cultivar. Different lowercase letters above the means indicate significant differences among the six cultivar–stage groups (p < 0.05). Edible rate = flesh weight/total fruit weight × 100%.
3.3.2. Juice Yield and Moisture Content
Beyond the mass-allocation traits examined in Section 3.3.1, juice yield and moisture content were measured to further characterize the edible quality of the three cultivars. Both parameters were determined on the same subset of ten fruits per cultivar–stage group (n = 10) and analyzed by two-way ANOVA (Table 7). Juice yield showed significant cultivar (F = 14.93, p < 0.001), stage (F = 190.96, p < 0.001), and interaction effects (F = 8.79, p < 0.001). Moisture content similarly exhibited significant cultivar (F = 103.47, p < 0.001), stage (F = 172.76, p < 0.001), and interaction effects (F = 7.94, p < 0.001).
Table 7.
Juice yield and moisture content of three Jinggang honey pomelo cultivars at the immature (I, July) and commercial maturity (M, October–November) stages. Values are means ± SE (n = 10 per cultivar–stage group).
Juice yield increased significantly from the immature to mature stage in all three cultivars (Tukey HSD, p < 0.05). ‘Taoxi’ exhibited the highest relative increase (+138.0%, from 26.84 ± 3.34% to 63.88 ± 1.88%), followed by ‘Jinsha’ (+75.3%, from 39.94 ± 3.60% to 70.00 ± 1.00%) and ‘Jinlan’ (+33.2%, from 50.08 ± 2.37% to 66.71 ± 1.56%). At the immature stage, ‘Taoxi’ (26.84%) had significantly lower juice yield than ‘Jinlan’ (50.08%) and ‘Jinsha’ (39.94%), which did not differ from each other (Tukey HSD, p < 0.05). By commercial maturity, however, all three cultivars converged to a narrow range of 63.88–70.00% with no significant differences among them, indicating that the cultivar-dependent gap in juice extractability present at the immature stage was largely eliminated during ripening. The significant interaction (F = 8.79, p < 0.001) reflected this differential convergence: ‘Taoxi’ compensated for its initially low juice yield through the steepest developmental increase.
Moisture content, by contrast, declined significantly in all three cultivars during maturation (Tukey HSD, p < 0.05). ‘Jinlan’ decreased by 4.5% (from 89.30 ± 0.17% to 85.25 ± 0.40%), ‘Jinsha’ by 3.9% (from 89.20 ± 0.18% to 85.75 ± 0.19%), and ‘Taoxi’ by 2.1% (from 84.68 ± 0.20% to 82.87 ± 0.45%). ‘Taoxi’ consistently had the lowest moisture content at both stages. At the immature stage, ‘Jinlan’ and ‘Jinsha’ (89.30 and 89.20%) were significantly higher than ‘Taoxi’ (84.68%; Tukey HSD, p < 0.05). At maturity, ‘Jinsha’ (85.75%) and ‘Jinlan’ (85.25%) remained significantly higher than ‘Taoxi’ (82.87%), while the immature-stage value of ‘Taoxi’ (84.68%) was not significantly different from the mature-stage values of ‘Jinlan’ and ‘Jinsha’. The significant cultivar effect (F = 103.47, p < 0.001) indicated that moisture content was strongly cultivar-dependent, with ‘Taoxi’ maintaining lower moisture content throughout development (Figure 8).
Figure 8.
Juice yield and moisture content of three Jinggang honey pomelo cultivars at the immature (I, July) and commercial maturity (M, October–November) stages. (A) Juice yield; (B) moisture content. Small dots represent individual samples, and large circles with error bars represent means ± SE (n = 10 per cultivar–stage group). Open circles indicate the immature stage, and filled circles indicate commercial maturity. Lines connect the two developmental stages within each cultivar. Different lowercase letters above the means indicate significant differences among the six cultivar–stage groups (p < 0.05).
The developmental trends of juice yield and moisture content differed between the two traits. Juice yield increased markedly during maturation and converged among the three cultivars at commercial maturity, indicating that cultivar differences in juice extractability were most evident at the immature stage. In contrast, moisture content declined during maturation and remained cultivar-dependent, with ‘Taoxi’ consistently showing the lowest values. This pattern suggests that mature fruits became more extractable despite having lower overall moisture content, probably reflecting developmental changes in flesh extractability and soluble matter accumulation during ripening. At commercial maturity, ‘Jinsha’ combined the highest juice yield with relatively high moisture content, whereas ‘Taoxi’ maintained the lowest moisture content, consistent with its comparatively high SSC and titratable acidity values reported in Section 3.4.1.
3.4. Physicochemical Quality Indices
3.4.1. Soluble Solids Content, Titratable Acidity, and Sugar–Acid Ratio
Beyond the physical and structural attributes examined in Section 3.1, Section 3.2 and Section 3.3, the physicochemical properties of pomelo fruits are commonly characterized using three objective indicators: soluble solids content (SSC, °Brix), titratable acidity (TA, % citric acid monohydrate equivalents), and their ratio (SSC/TA, the sugar–acid ratio). These three parameters were measured on ten samples from each cultivar–stage group (n = 10) and analyzed by two-way ANOVA (Table 8). All three metrics showed significant cultivar and stage effects (p < 0.001 for all). The cultivar × stage interaction was significant for TA (F = 65.53, p < 0.001) and sugar–acid ratio (F = 5.02, p = 0.010) but not for SSC (F = 1.80, p = 0.175), indicating that the rate of total sugar accumulation was comparable among cultivars, whereas acid accumulation and the resulting sugar–acid balance were cultivar-dependent.
Table 8.
Soluble solids content (SSC), titratable acidity (TA), and sugar–acid ratio (SAR) of three Jinggang honey pomelo cultivars at the immature (I, July) and commercial maturity (M, October–November) stages. Values are means ± SE (n = 10 per cultivar–stage group).
SSC increased significantly in all three cultivars during maturation (stage: F = 142.60, p < 0.001), with ‘Jinsha’ showing the largest relative increase (+81.0%, from 6.59 ± 0.37 to 11.93 ± 0.25 °Brix), followed by ‘Taoxi’ (+54.6%, from 10.31 ± 0.91 to 15.94 ± 0.54 °Brix) and ‘Jinlan’ (+43.8%, from 8.77 ± 0.20 to 12.61 ± 0.44 °Brix). The cultivar main effect was also significant (F = 29.79, p < 0.001), with ‘Taoxi’ consistently ranking highest and ‘Jinsha’ lowest at both stages. The non-significant interaction (F = 1.80, p = 0.175) reflected the parallel SSC trajectories: all cultivars accumulated soluble solids at broadly comparable rates, even though their absolute levels differed. At commercial maturity, ‘Taoxi’ (15.94 ± 0.54 °Brix) significantly exceeded both ‘Jinlan’ (12.61 ± 0.44 °Brix) and ‘Jinsha’ (11.93 ± 0.25 °Brix; Tukey HSD, p < 0.05), indicating its superior capacity for soluble solids accumulation.
In contrast to the parallel SSC trajectories, TA exhibited a pronounced cultivar-dependent increase during maturation (cultivar × stage: F = 65.53, p < 0.001). All three cultivars showed significantly higher TA at maturity than at the immature stage (stage: F = 475.49, p < 0.001), but the magnitude of increase differed markedly among cultivars. ‘Taoxi’ showed the most dramatic rise, from 0.209 ± 0.024% to 0.533 ± 0.002% (+155.0%), whereas ‘Jinlan’ displayed the smallest increment (from 0.093 ± 0.003% to 0.192 ± 0.003%, +106.5%). ‘Jinsha’ occupied an intermediate position (from 0.123 ± 0.003% to 0.261 ± 0.008%, +112.2%). At commercial maturity, the three cultivars were statistically distinct (Tukey HSD, p < 0.05), with ‘Taoxi’ (0.533%) having approximately 2.0× and 2.8× the TA of ‘Jinsha’ (0.261%) and ‘Jinlan’ (0.192%), respectively. The cultivar main effect was highly significant (F = 261.99, p < 0.001), indicating that TA was strongly cultivar-dependent rather than showing a uniform developmental response among cultivars.
The sugar–acid ratio (SAR, calculated as SSC/TA) decreased significantly in all three cultivars during maturation (stage: F = 51.35, p < 0.001), indicating that acid accumulation outpaced sugar accumulation during ripening. The magnitude of this decline was cultivar-dependent (interaction: F = 5.02, p = 0.010): ‘Taoxi’ showed the steepest drop (–42.8%, from 52.33 ± 5.88 to 29.91 ± 1.03), ‘Jinlan’ the mildest (–30.8%, from 95.06 ± 3.32 to 65.79 ± 2.38), and ‘Jinsha’ an intermediate decrease (–15.0%, from 54.19 ± 3.81 to 46.08 ± 1.68). At the immature stage, ‘Jinlan’ exhibited a significantly higher ratio (95.06) than ‘Jinsha’ (54.19) and ‘Taoxi’ (52.33), which did not differ from each other. At commercial maturity, all pairwise comparisons among cultivars became significant (Tukey HSD, p < 0.05): ‘Jinlan’ retained the highest ratio (65.79), followed by ‘Jinsha’ (46.08) and ‘Taoxi’ (29.91). Despite achieving the highest SSC at maturity, ‘Taoxi’ had the lowest sugar–acid ratio, as its disproportionately high TA offset the sugar advantage.
Collectively, these results reveal divergent sugar–acid profiles among the three cultivars. ‘Taoxi’ accumulated the highest SSC but also the highest TA, resulting in the lowest sugar–acid ratio at commercial maturity. ‘Jinlan’, by contrast, maintained the highest sugar–acid ratio at both stages, indicating that its SSC was relatively high while its TA remained low compared with the other two cultivars. ‘Jinsha’ occupied an intermediate position, with moderate SSC, TA, and sugar–acid ratio values. The non-significant SSC interaction (p = 0.175) versus the significant TA interaction (p < 0.001) indicates that cultivar differences in sugar–acid balance were driven more strongly by differential TA accumulation than by SSC accumulation (Figure 9).
Figure 9.
Soluble solids content (SSC), titratable acidity (TA), and sugar–acid ratio (SAR) of three Jinggang honey pomelo cultivars at two developmental stages. (A) SSC–TA space. Small points represent individual samples; large circles represent group means; horizontal and vertical error bars indicate SE for SSC and TA, respectively; arrows connect immature and commercial maturity means within each cultivar. Gray dashed contours indicate constant SAR values (SAR = SSC/TA). (B) SAR values shown as individual points with mean ± SE (n = 10). Different lowercase letters indicate significant differences among the six cultivar–stage groups (p < 0.05). Colors indicate cultivar: orange = ‘Jinlan’ (JL), blue = ‘Jinsha’ (JS), green = ‘Taoxi’ (TX). Open circles = immature stage (I); filled circles = commercial maturity stage (M).
3.4.2. Vitamin C Content
In addition to the sugar–acid parameters examined in Section 3.4.1, vitamin C (VC) content is a key nutritional quality attribute of pomelo fruits. VC was measured on the same ten samples per cultivar–stage group (n = 10) and analyzed by two-way ANOVA (Table 9). Cultivar, developmental stage, and their interaction all had highly significant effects on VC content: cultivar (F = 19.55, p < 0.001), stage (F = 270.14, p < 0.001), and cultivar × stage interaction (F = 23.06, p < 0.001). The significant interaction indicated that the magnitude of VC change during maturation was cultivar-dependent.
Table 9.
Vitamin C content of three Jinggang honey pomelo cultivars at the immature (I, July) and commercial maturity (M, October–November) stages. Values are means ± SE (n = 10 per cultivar–stage group).
VC content declined significantly in all three cultivars during maturation. At the immature stage, VC ranged from 95.33 mg/100 g (‘Jinlan’) to 121.51 mg/100 g (‘Taoxi’), whereas at commercial maturity it declined to 34.04–74.32 mg/100 g. The magnitude of decline differed markedly among cultivars: ‘Jinsha’ showed the steepest decrease (–66.2%, from 100.67 ± 4.46 to 34.04 ± 1.57 mg/100 g), ‘Taoxi’ showed an intermediate decline (–52.4%, from 121.51 ± 5.55 to 57.88 ± 2.80 mg/100 g), and ‘Jinlan’ had the mildest reduction (–22.0%, from 95.33 ± 3.22 to 74.32 ± 3.66 mg/100 g; Tukey HSD, p < 0.05 for all within-cultivar immature–mature comparisons).
The relative cultivar ranking for VC content changed markedly between the two developmental stages. At the immature stage, ‘Taoxi’ (121.51 mg/100 g) had the highest VC content and significantly exceeded both ‘Jinsha’ (100.67 mg/100 g) and ‘Jinlan’ (95.33 mg/100 g; Tukey HSD, p < 0.05), whereas ‘Jinsha’ and ‘Jinlan’ were statistically indistinguishable from each other. At commercial maturity, the ranking shifted to ‘Jinlan’ > ‘Taoxi’ > ‘Jinsha’, with all three cultivars being statistically distinct (Tukey HSD, p < 0.05). Thus, although ‘Taoxi’ started with the highest VC content, its relatively large decline (–52.4%) placed it in an intermediate position at maturity. By contrast, ‘Jinlan’, despite having the lowest initial mean VC content, retained the highest mature-stage value because its relative decline was the smallest among the three cultivars.
Collectively, these results demonstrate that VC content decreased during pomelo maturation in all three cultivars, but the magnitude of this decline was cultivar-dependent. The significant cultivar × stage interaction (F = 23.06, p < 0.001) confirms that the cultivars differed not only in absolute VC levels but also in the extent of VC loss during maturation. ‘Jinlan’ exhibited the greatest VC retention, ‘Jinsha’ the most pronounced loss, and ‘Taoxi’ an intermediate pattern. Together with the significant TA interaction reported in Section 3.4.1, this result indicates that the vitamin C and sugar–acid traits responded to maturation in cultivar-specific ways rather than following a uniform developmental pattern (Figure 10).
Figure 10.
Vitamin C (VC) content and mature-stage VC retention in three Jinggang honey pomelo cultivars. (A) VC content at the immature stage (I) and commercial maturity stage (M). Small points represent individual samples, large circles represent group means, and error bars indicate SE (n = 10). Lines connect the immature and mature means within each cultivar. Different lowercase letters indicate significant differences among the six cultivar–stage groups (p < 0.05). (B) VC retention at commercial maturity, calculated as mature-stage mean/corresponding immature-stage mean × 100. Values labelled adjacent to each bar indicate the retention percentage and the corresponding VC loss relative to the immature-stage mean. Colors indicate cultivar: orange = ‘Jinlan’ (JL), blue = ‘Jinsha’ (JS), green = ‘Taoxi’ (TX). Open circles = immature stage; filled circles = commercial maturity stage.
3.5. Integrated Quality Differentiation Among Cultivars
To integrate the quantitative quality traits analyzed in Section 3.1, Section 3.2, Section 3.3 and Section 3.4, PCA was performed on 17 quantitative traits measured on ten samples from each cultivar–stage group (n = 60). Seed-number data were not included in this PCA because they showed a highly zero-inflated distribution and were therefore evaluated separately in Section 3.2.2. MANOVA confirmed that the overall quality profile differed significantly among cultivars (Pillai’s trace = 1.879, F(34, 78) = 35.68, p < 0.001), between developmental stages (Pillai’s trace = 0.957, F(17, 38) = 49.51, p < 0.001), and for the cultivar × stage interaction (Pillai’s trace = 1.829, F(34, 78) = 24.59, p < 0.001). PCA extracted three principal components with eigenvalues > 1, collectively explaining 82.51% of the total variance (Table 10, Figure 11).
Table 10.
Principal component analysis (PCA) eigenvalues, explained variance, and dominant loadings for the first three principal components (PC1–PC3) based on 17 quantitative traits measured on 60 individual samples (n = 10 per cultivar–stage group). Only loadings with |loading| ≥ 0.25 are listed. FLW = flesh weight; FW = fruit weight; a*/b*/L* = peel color parameters; SSC = soluble solids content; ER = edible rate; TA = titratable acidity; PT = peel thickness; MC = moisture content; PW = peel weight; LD/TD = longitudinal/transverse diameter; VitC = vitamin C; JY = juice yield; SAR = sugar–acid ratio; SN = segment number.
Figure 11.
Integrated quality differentiation among three Jinggang honey pomelo cultivars based on 17 quantitative fruit-quality traits. (A) PCA score plot of individual samples from six cultivar–stage groups. Each point represents one sample (n = 10 per group). Large symbols indicate group centroids, and ellipses indicate 95% group ellipses for each cultivar–stage group. Colors indicate cultivar: orange = ‘Jinlan’ (JL), blue = ‘Jinsha’ (JS), green = ‘Taoxi’ (TX). Open circles indicate immature fruits (I), and filled circles indicate commercial maturity fruits (M). PC1 and PC2 explained 57.1% and 18.8% of the total variance, respectively. (B) Standardized heatmap of group mean values for the 17 quantitative traits. Values were standardized as z-scores across all samples. Red indicates above-average values, blue indicates below-average values, and white indicates values close to the overall mean.
PC1 accounted for 57.07% of the total variance and primarily represented a maturation-related quality gradient. Positive loadings were observed for flesh weight (FLW, +0.30), fruit weight (FW, +0.29), peel color parameters a* (+0.29) and b* (+0.28), SSC (+0.27), edible rate (ER, +0.27), L* (+0.26), and TA (+0.26), whereas peel thickness (PT, –0.25) and moisture content (MC, –0.25) loaded negatively. Thus, fruits with higher PC1 scores were generally larger, and had greater flesh development and edible rate, more advanced peel coloration, and higher SSC and TA, but lower peel thickness and moisture content. Consistent with this interpretation, all immature groups had negative PC1 scores (JLI: –2.90, JSI: –4.10, TXI: –1.54), whereas all mature groups had positive scores (JLM: +1.17, JSM: +3.10, TXM: +4.27), indicating a clear separation of developmental stages along PC1.
PC2 explained 18.82% of the variance and was mainly associated with peel weight (PW, +0.46), longitudinal diameter (LD, +0.38), transverse diameter (TD, +0.28), and vitamin C (VitC, +0.27), while juice yield (JY, –0.34), L* (–0.27), and moisture content (MC, –0.26) loaded negatively. This component captured morphological size and peel-related structural variation that was not fully explained by the maturation gradient, particularly distinguishing the large-fruited ‘Taoxi’ at the immature stage (PC2 = +3.25). PC3 explained 6.62% of the variance and was mainly related to sugar–acid balance and segment-related structural variation, with strong contributions from sugar–acid ratio (SAR, –0.65), segment number (SN, –0.47), longitudinal diameter (LD, –0.32), and TA (+0.33).
Pearson correlation analysis further revealed coordinated relationships among major quality traits. Flesh weight, edible rate, and juice yield were strongly and positively associated, indicating that flesh development was closely linked with edible proportion and juice extractability. Peel thickness was negatively correlated with edible rate (r = –0.867), flesh weight (r = –0.815), and L* (r = –0.856), suggesting that peel thinning was associated with improved edible quality and peel color development. Vitamin C was negatively correlated with several maturity-associated traits, including L* (r = –0.851), edible rate (r = –0.798), juice yield (r = –0.788), and flesh weight (r = –0.773), consistent with the VC decline observed during maturation in Section 3.4.2. SSC was also strongly negatively correlated with moisture content (r = –0.827), indicating that soluble-solid accumulation was accompanied by reduced moisture content.
The standardized group-mean heatmap further illustrated the integrated quality profiles of the six cultivar–stage groups (Figure 11B). Immature fruits were generally characterized by higher peel thickness, moisture content, and vitamin C, but lower flesh weight, edible rate, peel color development, and SSC. At commercial maturity, the three cultivars showed distinct quality profiles. ‘Jinlan’ retained the highest mature-stage vitamin C content and maintained the highest sugar–acid ratio, indicating a favorable nutritional and sweetness–acidity balance. ‘Jinsha’ showed the highest L* value and the greatest flesh accumulation, suggesting strong development of edible yield and peel brightness at maturity. ‘Taoxi’ had the highest SSC and TA, as well as high a* and b* values, but the lowest sugar–acid ratio, indicating a high-sugar but high-acid profile. Collectively, the multivariate analysis indicates that quality differentiation in Jinggang honey pomelo involved coordinated changes in morphological, chromatic, edible, and physicochemical traits, with clear cultivar-dependent developmental trajectories.
4. Discussion
The formation of pomelo fruit quality is a complex developmental process shaped by genetic background, fruit growth dynamics, tissue allocation, and metabolic regulation. By comparing three representative Jinggang honey pomelo cultivars at immature and commercial maturity stages, this study revealed both shared ripening trends and clear cultivar-specific quality profiles. The following discussion follows an external-to-internal logic, progressing from fruit morphology and peel appearance to internal structure, edible yield, and physicochemical traits, and finally integrated cultivar differentiation.
4.1. Morphological Diversity and Developmental Plasticity
The morphological results demonstrate that fruit growth in Jinggang honey pomelo is not simply a uniform enlargement process, but a cultivar-dependent developmental trajectory [4]. Among the three cultivars, ‘Jinsha’ showed the most dramatic increase in single-fruit weight, rising by approximately 186% from the immature stage to commercial maturity. This large weight gain was accompanied by marked increases in both longitudinal and transverse diameters, indicating strong late-stage fruit expansion. In contrast, ‘Taoxi’ maintained a nearly unchanged longitudinal diameter while increasing mainly in transverse diameter, suggesting a shift toward a more globose fruit form during maturation. These contrasting patterns explain the significant cultivar × stage interaction observed for morphological traits.
The PCA biplot further decomposed fruit morphology into two major axes. PC1, which explained 65.6% of the variance, was mainly associated with fruit weight, longitudinal diameter, and transverse diameter, and therefore represented a fruit-size or developmental enlargement gradient. PC2, explaining 31.2% of the variance, was driven primarily by fruit shape index, with a secondary contribution from longitudinal diameter, and therefore represented a shape-related axis rather than a simple size gradient. The separation of immature and mature fruits along PC1 indicates that fruit enlargement is a common maturation-related process, whereas the position of mature ‘Taoxi’ along the PC2 axis highlights its cultivar-specific transition toward a more rounded fruit shape. Although the three cultivars differed markedly in early morphology, their fruit shape indices decreased during maturation, indicating a general developmental tendency toward reduced elongation. Similar cultivar-dependent morphological plasticity has been reported in citrus and pomelo germplasm, where fruit size and shape are strongly influenced by genotype and developmental stage [4,21]. These findings suggest that fruit morphology should be evaluated using both size-related and shape-related parameters rather than relying only on a single index [22].
4.2. Cultivar-Specific Peel Color Development and Maturity Indicators
Peel color development showed clear cultivar specificity during maturation. ‘Jinsha’ and ‘Taoxi’ displayed more pronounced color transitions, whereas ‘Jinlan’ retained relatively stronger greenness at commercial maturity. The magnitude of total color change followed the order ‘Jinsha’ (ΔE = 26.06) > ‘Taoxi’ (ΔE = 21.45) > ‘Jinlan’ (ΔE = 13.20), indicating that degreening and yellow coloration proceeded at different rates among cultivars. This supports the view that external peel color cannot be interpreted using a universal maturity threshold across Jinggang honey pomelo cultivars [9].
The combined changes in L*, a*, b*, CCI, and ΔE suggest that peel color parameters can provide useful non-destructive indicators of maturity, but only after cultivar-specific calibration. In particular, b* and hue angle are useful for capturing yellowing and hue transition, whereas CCI integrates the shift from green to yellow/orange coloration. However, because ‘Jinlan’ retained a relatively green peel even at commercial maturity, persistent greenness should not automatically be interpreted as immaturity in this cultivar. Therefore, cultivar-specific color charts or predictive models [22] are more appropriate than a single visual standard. This point is practically important for harvest grading, market sorting, and reducing misclassification of mature but green-retaining fruit [23,24,25].
4.3. Peel Texture Dynamics and Structural Changes
Changes in peel smoothness and peel thickness indicate that external texture and internal structural traits develop in a cultivar-dependent manner. ‘Jinlan’ showed the strongest decline in peel smoothness, whereas ‘Taoxi’ maintained a more stable peel texture across developmental stages. ‘Jinsha’ showed increased heterogeneity, suggesting that individual fruits within this cultivar may differ more strongly in peel surface development during maturation. These patterns indicate that peel texture is not merely a cosmetic trait but may reflect underlying structural remodeling of the peel during fruit growth.
Peel thickness decreased markedly during maturation, while segment number remained relatively stable. The reduction in peel thickness from the immature to mature stage suggests progressive dilution or structural reorganization of the flavedo and albedo as pulp tissues expand. The relatively thin peel of mature ‘Jinsha’ may partly explain its higher edible rate and processing suitability. In contrast, the stability of segment number indicates that carpel/segment formation is likely determined earlier in fruit development and is less sensitive to late-stage maturation [4]. Because this study did not directly examine peel anatomy, cuticle structure, or cell-wall degradation, the potential mechanisms—such as cuticular remodeling, albedo loosening, and cell expansion—should be interpreted cautiously and require anatomical or transcriptomic validation.
4.4. Seed–Pulp Trade-Off and Edible Quality Formation
Seed characteristics represented one of the most distinct cultivar differences in this study. ‘Jinlan’ and ‘Jinsha’ were nearly seedless, with a high proportion of seedless fruits, whereas ‘Taoxi’ retained a large number of mature seeds. In ‘Taoxi’, the reduction from a high immature seed count (135.10 ± 6.40) to fewer mature seeds (69.15 ± 7.73, a 48.8% reduction) indicates substantial seed or ovule abortion during development [26,27]. This may reflect genetic factors, fertilization success, embryo viability, or resource limitation [28], but the present data cannot distinguish among these mechanisms.
The strong seed load in ‘Taoxi’ may have contributed to its lower edible rate at maturity. Although ‘Taoxi’ produced large fruits and high SSC, its edible rate was lower than those of ‘Jinlan’ and ‘Jinsha’, suggesting that seed development and peel/flesh allocation jointly influence consumer-oriented quality. By contrast, ‘Jinsha’ showed an approximately 9.0-fold increase in flesh weight from the immature to mature stage, indicating strong sink capacity for pulp development [28]. This was consistent with its high edible rate and juice yield at commercial maturity. Across cultivars, fruit development involved a clear shift from peel-dominated mass allocation at the immature stage to flesh-dominated edible yield at maturity. Therefore, seedlessness, flesh accumulation, and peel reduction should be considered together when evaluating commercial fruit quality.
4.5. Physicochemical Properties: Metabolic Trade-Offs
The ripening process was accompanied by coordinated but not always parallel changes in juice yield, moisture content, soluble solids, acidity, sugar–acid ratio, and vitamin C. Juice yield generally increased during maturation, whereas moisture content decreased. This divergence may reflect changes in juice sac development, soluble-solid concentration, and tissue water distribution [29], although simple tissue dilution cannot be excluded; because these anatomical and physiological processes were not directly measured in the present study, these possibilities remain hypotheses. The concurrent increase in SSC is consistent with a concentration effect during ripening [8].
All cultivars accumulated soluble solids during maturation, with ‘Taoxi’ reaching the highest SSC at commercial maturity. However, TA also increased, and between the two sampling points the proportional increase in acidity exceeded that of soluble solids, leading to a decline in the sugar–acid ratio in all three cultivars [30,31]. This pattern is important because perceived flavor is determined not by SSC alone but by the balance between sugars and acids [10]. Notably, this decline in the sugar–acid ratio reflects the developmental window sampled rather than a general ripening pattern. The classical model of citrus fruit ripening describes organic acids as peaking during early fruit development and declining thereafter; however, a late-season decline in the sugar–acid ratio has been documented in pummelo germplasm from the same production region: in ‘HB’ pummelo (Citrus maxima), the sugar–acid ratio peaked in late September and then decreased slightly, so that harvesting after commercial maturity tended to increase sourness [32]. In the present study, the immature sampling point was taken in mid-July, which, for this germplasm and production region, may still fall on the ascending limb of the organic-acid accumulation curve. The results therefore suggest that organic-acid accumulation had not yet been completed within the local commercial harvest window, rather than that acidity increases continuously throughout ripening in general. Thus, although ‘Taoxi’ had the highest SSC, its high TA and lowest sugar–acid ratio indicate a high-sugar, high-acid profile rather than simple sweetness dominance. ‘Jinlan’, in contrast, maintained a higher sugar–acid ratio and a milder vitamin C loss, indicating a more balanced sugar–acid and vitamin C profile.
Vitamin C declined during maturation in all three cultivars, but the magnitude of decline differed substantially. ‘Jinsha’ showed the greatest loss, whereas ‘Jinlan’ retained the highest mature-stage vitamin C content. This decline may be associated with rapid pulp expansion, dilution effects, reduced ascorbate biosynthesis, or enhanced oxidative catabolism during ripening [33,34,35,36,37]. In addition, field-management factors such as irrigation frequency and rainfall amount may exert a further dilution effect on soluble metabolites, including ascorbate, as water availability has been shown to modulate soluble-metabolite accumulation in citrus fruits [30]. However, because the present study did not directly measure ascorbate metabolic enzymes or gene expression, nor record irrigation or rainfall data during fruit development, these explanations should be framed as plausible mechanisms rather than direct evidence. Overall, the results reveal a metabolic trade-off: maturation improved edible yield, juice yield, SSC, and peel coloration, but was accompanied by reduced moisture content and vitamin C retention. This trade-off supports cultivar-specific harvest strategies depending on whether the target is flavor intensity, juice yield, or nutritional value [38,39,40].
4.6. Integrated Quality Differentiation and Practical Implications
The integrated PCA based on 17 quantitative traits confirmed that Jinggang honey pomelo quality differentiation is multidimensional. PC1 primarily represented a maturation gradient, separating immature from mature fruits through coordinated changes in fruit size, flesh weight, peel color, SSC, edible rate, acidity, peel thickness, and moisture content. PC2 captured morphological and structural variation, particularly peel weight and fruit dimensions. These multivariate results demonstrate that no single trait is sufficient to define fruit quality [11,14]; instead, fruit quality emerges from coordinated changes among appearance, structure, edible proportion, and physicochemical traits.
The correlation structure further supports this integrated interpretation. The strong negative correlation between peel thickness and edible rate (r = −0.867) indicates that peel thinning is closely related to improved edible quality. The positive associations among flesh weight, edible rate, and juice yield suggest that pulp development is central to commercial value [5,8]. Additionally, the strong negative correlation between SSC and moisture content (r = −0.827) confirms that soluble-solid accumulation was accompanied by reduced moisture content, while the negative correlation between vitamin C and L* (r = −0.851) was consistent with the concurrent decline in vitamin C and advancement of peel coloration during maturation. The standardized heatmap also showed that mature fruits of the three cultivars formed distinct quality profiles. ‘Jinlan’ was characterized by better vitamin C retention and a favorable sugar–acid balance, making it suitable for health-oriented markets and consumers preferring a balanced sugar–acid profile. ‘Jinsha’ combined high flesh accumulation, edible rate, juice yield, and strong peel color development, supporting its suitability for fresh consumption and processing. ‘Taoxi’ showed high SSC and strong acidity, suggesting a concentrated high-sugar, high-acid profile that may suit consumers preferring intense sweet–acid taste or specific processing purposes.
Several limitations should be considered. First, only two developmental stages were sampled, which limits the resolution of dynamic changes during fruit development. Second, days post anthesis were not recorded, making precise developmental synchronization among cultivars difficult; in particular, the calendar-synchronized immature-stage sampling may correspond to different physiological ages across the three cultivars, and the mature-stage comparison reflects each cultivar’s own commercial harvest window rather than an identical physiological endpoint. Third, the study was based on one production season and one ecological region, so year-to-year environmental effects remain to be tested. Finally, sensory evaluation, anatomical observation, and transcriptomic or metabolomic analyses were not included. Future studies should combine continuous developmental sampling, DPA records, standardized photographic documentation of fruit appearance and internal structure, multi-year validation, sensory panels, and molecular analyses [4] to clarify the mechanisms underlying cultivar-specific fruit quality formation.
5. Conclusions
This study systematically compared the fruit quality profiles of three Jinggang honey pomelo cultivars (‘Jinlan’, ‘Jinsha’, and ‘Taoxi’) at the immature and commercial maturity stages, following an external-to-internal analytical framework spanning fruit morphology, peel color, peel texture and internal structure, edible yield and physicochemical properties, and integrated multivariate differentiation. The results demonstrate that pomelo fruit quality formation is not a uniform enlargement process but a multidimensional, cultivar-dependent developmental trajectory in which genotype, developmental stage, and their interaction jointly shape the final quality profile.
Fruit morphology exhibited cultivar-specific plasticity: ‘Jinsha’ showed the most dramatic weight gain (~186%) and dimensional expansion, whereas ‘Taoxi’ shifted toward a more globose form during maturation. Peel color development was also cultivar-specific (ΔE: ‘Jinsha’ > ‘Taoxi’ > ‘Jinlan’), indicating that a universal color-based maturity threshold is inadequate for this germplasm. Peel thickness decreased significantly during maturation while segment number remained stable, and a clear seed–pulp trade-off was observed: ‘Jinlan’ and ‘Jinsha’ were consistently near-seedless, whereas ‘Taoxi’ retained substantial seed loads (69.15 ± 7.73 mature seeds per fruit). These structural differences were closely associated with edible quality, with ‘Jinsha’ showing the strongest flesh accumulation (~9.0-fold increase) and a high mature-stage edible rate.
The ripening process was characterized by a metabolic trade-off: maturation improved peel coloration, edible yield, juice yield, and soluble solids content, but was accompanied by reduced moisture content and vitamin C retention. Importantly, TA increased more than SSC between the immature and commercial-maturity sampling points, leading to a decline in sugar–acid ratio across all cultivars. The integrated PCA based on 17 quantitative traits confirmed that quality differentiation is multidimensional (PC1–PC3 explaining 82.51% of total variance), with PC1 representing a maturation gradient and PC2 capturing cultivar-specific morphological and structural variation. The distinct mature-stage quality profiles suggest potential targeted applications: ‘Jinlan’ for health-oriented markets and consumers preferring a balanced sugar–acid profile by virtue of its better vitamin C retention and higher sugar–acid ratio; ‘Jinsha’ for fresh consumption and processing given its high edible rate, juice yield, and flesh accumulation; and ‘Taoxi’ for consumers preferring intense sweet–acid taste given its highest SSC and strong acidity. These results provide a reference for future harvest-optimization and quality-grading studies and inform targeted market positioning, contributing to the sustainable development of the Jinggang honey pomelo industry.
Author Contributions
Conceptualization, B.Z., X.Y. and H.Y.; methodology, Q.S.; software, H.Y.; validation, B.Z., X.Y. and Q.S.; formal analysis, H.Y.; investigation, Q.S. and H.C.; resources, H.C.; data curation, H.Y.; writing—original draft preparation, H.Y.; writing—review and editing, B.Z. and X.Y.; visualization, H.Y.; supervision, B.Z.; project administration, B.Z. and X.Y.; funding acquisition, B.Z. All authors have read and agreed to the published version of the manuscript.
Funding
This research was funded by the Major Scientific and Technological Projects of Jiangxi Province (20203ABC28W014-3), Operation Service/Research Project of National Horticultural Germplasm Resources Repository, Project of National Science and Technology Resource Sharing Service Platform, Ministry of Science and Technology & Ministry of Finance (NHGRC2024-NHC04, NHGRC2025-NHC04), and Key Laboratory of Jiangxi Province for Biological Invasion and Biosecurity (2023SSY02111).
Data Availability Statement
All data generated or analyzed during this study are included in this published article.
Acknowledgments
We thank Muhammad Umair Hassan for his professional linguistic revision and language polishing of this manuscript, which greatly improved the clarity and readability of this work. During the preparation of this manuscript, the authors used DeepSeek-V4.1-Flash for conceptual brainstorming and literature-screening support, WorkBuddy v5.3.5 for language refinement and manuscript-structure optimization, and OpenAI Codex based on GPT-5 for assistance with the preparation and checking of data-analysis and visualization scripts. The authors have reviewed and edited all AI-assisted output and take full responsibility for the content of this publication.
Conflicts of Interest
The authors declare no conflicts of interest.
References
- Deb, P.; Mukherjee, P.K.; Das, P. Morpho-biochemical characterization of pomelo (Citrus grandis L.) accessions and assessment of bioactive compounds under western part of West Bengal. Int. J. Minor Fruits Med. Arom. Plants 2024, 10, 112–124. [Google Scholar] [CrossRef] [Scilit]
- Yin, J.J.; Hu, X.D.; Hou, Y.L.; Liu, S.T.; Jia, S.G.; Gan, C.F.; Ou, Y.L.; Zhang, X.H. Comparative analysis of chemical compositions and antioxidant activities of different pomelo varieties from China. Food Chem. Adv. 2023, 2, 100180. [Google Scholar] [CrossRef] [Scilit]
- Liu, Y.M.; Liu, Y.X.; Zeng, G.X.; Huang, X.G. Climatic regionalization of Jinggang pomelo planting in Ji’an area based on GIS. Acta Agric. Jiangxi 2015, 27, 130–133. [Google Scholar] [CrossRef]
- Agustí, M.; Reig, C.; Martínez-Fuentes, A.; Mesejo, C. Advances in Citrus Fruit Set and Development: A Review. Horticulturae 2026, 12, 18. [Google Scholar] [CrossRef] [Scilit]
- Pei, Y.; He, C.X.; Liu, H.L.; Shen, G.P.; Feng, J.H. Compositional Analysis of Four Kinds of Citrus Fruits with an NMR-Based Method for Understanding Nutritional Value and Rational Utilization: From Pericarp to Juice. Molecules 2022, 27, 2579. [Google Scholar] [CrossRef] [Scilit]
- Gupta, A.K.; Medhi, M.; Chakraborty, S.; Yumnam, M.; Mishra, P. Development of rapid and non-destructive technique for the determination of maturity indices of pomelo fruit (Citrus grandis). J. Food Meas. Charact. 2020, 15, 1463–1474. [Google Scholar] [CrossRef] [Scilit]
- Hongwiangjan, J.; Terdwongworakul, A.; Krisanapook, K. Evaluation of pomelo maturity based on acoustic response and peel properties. Int. J. Food Sci. Technol. 2014, 50, 782–789. [Google Scholar] [CrossRef] [Scilit]
- Chen, J.J.; Luo, W.S.; Cheng, L.N.; Wu, J.J.; Yu, Y.S.; Li, L.; Xu, Y.J. Influence of Cultivar and Turbidity on Physicochemical Properties, Functional Characteristics and Volatile Flavor Substances of Pomelo Juices. Foods 2023, 12, 1028. [Google Scholar] [CrossRef] [Scilit]
- Tian, S.L.; Yang, Y.Y.; Fang, B.; Uddin, S.; Liu, X.G. The CrMYB33 transcription factor positively coordinate the regulation of both carotenoid accumulation and chlorophyll degradation in the peel of citrus fruit. Plant Physiol. Biochem. 2024, 209, 108540. [Google Scholar] [CrossRef] [Scilit]
- Pan, T.; Ali, M.M.; Gong, J.; She, W.; Pan, D.; Guo, Z.; Yu, Y.; Chen, F. Fruit Physiology and Sugar-Acid Profile of 24 Pomelo (Citrus grandis (L.) Osbeck) Cultivars Grown in Subtropical Region of China. Agronomy 2021, 11, 2393. [Google Scholar] [CrossRef] [Scilit]
- Huang, C.H.; Tao, J.J.; Liao, G.L.; Xie, M.; Qu, X.Y.; Chen, L.; Xu, X.B. Dynamic changes of phenol and antioxidant capacity during fruit development of three Actinidia species (kiwifruit). Sci. Hortic. 2020, 273, 109571. [Google Scholar] [CrossRef] [Scilit]
- Paudyal, K.P.; Haq, N. Variation of pomelo (Citrus grandis (L.) Osbeck) in Nepal and participatory selection of strains for further improvement. Agroforest Syst. 2008, 72, 195–204. [Google Scholar] [CrossRef] [Scilit]
- Duan, Y.Y.; Liu, Z.W.; Zhang, Q.Q.; Hu, J.Q.; Zheng, S.Y.; Mao, X.J.; Wang, Y.X. Dynamic changes in volatile and non-volatile components of Jinggang honey pomelo (Citrus maxima (L.) Osbeck) during growth revealed through an untargeted metabolomics approach. Food Chem. 2025, 478, 143654. [Google Scholar] [CrossRef] [Scilit]
- Coelho, E.M.; da Silva Haas, I.C.; de Azevedo, L.C.; Bastos, D.C.; Fedrigo, I.M.T.; dos Santos Lima, M.; de Mello Castanho Amboni, R.D. Multivariate chemometric analysis for the evaluation of 22 Citrus fruits growing in Brazil’s semi-arid region. J. Food Compos. Anal. 2021, 101, 103964. [Google Scholar] [CrossRef] [Scilit]
- Li, F.; Lin, X.; Zhan, M.; Li, H.; Chen, J.; Ma, Q. Changes in sugar and organic acid contents and sweet and sour flavor of three Jinggang honey pomelo varieties after harvest. Food Ferment. Ind. 2024, 50, 256–264. (In Chinese) [Google Scholar] [CrossRef]
- GB/T 8210-2011; Method for Inspection of Fresh Citrus Fruits. China Standard Press: Beijing, China, 2011.
- NY/T 2930-2016; Descriptors for Citrus Germplasm Resources. Ministry of Agriculture of the People’s Republic of China: Beijing, China, 2016.
- Jiménez-Cuesta, M.; Cuquerella, J.; Martínez-Jávega, J.M. Determination of a color index for citrus fruit degreening. Proc. Int. Soc. Citric. 1981, 2, 999–1002. [Google Scholar]
- GB/T 12293-1990 superseded by GB 12456-2021; National Standard for the Determination of Titratable Acidity in Fruit and Vegetable Products. China Standard Press: Beijing, China, 1990.
- GB 5009.86-2016, superseded by GB 5009.86-2025; National Food Safety Standard—Determination of Ascorbic Acid in Foods. China Standard Press: Beijing, China, 2016.
- Zhang, L.; Xu, Y.; Li, Y.; Zheng, S.; Zhao, Z.; Chen, M.; Yang, H.; Yi, H.; Wu, J. Transcription factor CsMYB77 negatively regulates fruit ripening and fruit size in citrus. Plant Physiol. 2024, 194, 867–883. [Google Scholar] [CrossRef] [Scilit]
- Yan, X.J.; Muneer, M.A.; Qin, M.T.; Ou, J.; Chen, X.H.; He, Z.Y.; Liu, Y.D.; Cheng, Z.H.; Su, D.; Liu, R.R.; et al. Establishing quality evaluation standards for pomelo fruit: The role of harvesting time and appearance characteristic. Postharvest Biol. Technol. 2024, 212, 112863. [Google Scholar] [CrossRef] [Scilit]
- Wang, Q.; Lu, J.Z.; Wang, Y.H.; Miao, F.J.; Liu, S.P.; Shui, Q.Y.; Gao, J.F.; Gao, Y.W. In situ nondestructive identification of citrus fruit ripeness via hyperspectral imaging technology. Plant Methods 2025, 21, 77. [Google Scholar] [CrossRef] [Scilit]
- Itakura, K.; Saito, Y.; Suzuki, T.; Kondo, N.; Hosoi, F. Estimation of Citrus Maturity with Fluorescence Spectroscopy Using Deep Learning. Horticulturae 2019, 5, 2. [Google Scholar] [CrossRef] [Scilit]
- Teerachaichayut, S.; Ho, H.T. Non-destructive prediction of total soluble solids, titratable acidity and maturity index of limes by near infrared hyperspectral imaging. Postharvest Biol. Technol. 2017, 133, 20–25. [Google Scholar] [CrossRef] [Scilit]
- Mesejo, C.; Muñoz-Fambuena, N.; Reig, C.; Martínez-Fuentes, A.; Agustí, M. Cell division interference in newly fertilized ovules induces stenospermocarpy in cross-pollinated citrus fruit. Plant Sci. Int. J. Exp. Plant Biol. 2014, 225, 86–94. [Google Scholar] [CrossRef] [Scilit]
- Chen, T.; Xie, M.; Jiang, Y.; Yuan, T. Abortion occurs during double fertilization and ovule development in Paeonia ludlowii. J. Plant Res. 2022, 135, 295–310. [Google Scholar] [CrossRef] [Scilit]
- CHALMERS, D.J.; VAN DEN ENDE, B. The Relation Between Seed and Fruit Development in the Peach (Prunus persica L.). Ann. Bot. 1977, 41, 707–714. [Google Scholar] [CrossRef] [Scilit]
- Goldenberg, D.; Yaniv, Y.; Porat, R.; Carmi, N. Mandarin fruit quality: A review. J. Sci. Food Agric. 2018, 98, 18–26. [Google Scholar] [CrossRef] [Scilit]
- Khan, M.A.; Liu, D.H.; Alam, S.M.; Zaman, F.; Luo, Y.; Han, H.; Ateeq, M.; Liu, Y.Z. Molecular physiology for the increase of soluble sugar accumulation in citrus fruits under drought stress. Plant Physiol. Biochem. 2023, 203, 108056. [Google Scholar] [CrossRef] [Scilit]
- Li, M.D.; Mao, Z.L.; Zhao, Z.Q.; Gao, S.Y.; Luo, Y.R.; Liu, Z.Y.; Sheng, X.W.; Zhai, X.W.; Liu, J.H.; Li, C.L. CBL1/CIPK23 phosphorylates tonoplast sugar transporter TST2 to enhance sugar accumulation in sweet orange (Citrus sinensis). J. Integr. Plant Biol. 2024, 67, 327–344. [Google Scholar] [CrossRef] [Scilit]
- Liu, R.L.; Li, J. Dynamic laws of several pulp inclusions during fruit development of Citrus maxima ‘HB You’. J. Cent. South Univ. For. Technol. 2012, 32, 14–20. [Google Scholar]
- Deng, H.H.; Xia, H.; Guo, Y.Q.; Liu, X.L.; Lin, L.J.; Wang, J.; Xu, K.F.; Lv, X.L.; Hu, R.P.; Liang, D. Dynamic Changes in Ascorbic Acid Content during Fruit Development and Ripening of Actinidia latifolia (an Ascorbate-Rich Fruit Crop) and the Associated Molecular Mechanisms. Int. J. Mol. Sci. 2022, 23, 5808. [Google Scholar] [CrossRef] [Scilit]
- Hancock, R.D.; Walker, P.G.; Pont, S.D.A.; Marquis, N.; Vivera, S.; Gordon, S.L.; Brennan, R.M.; Viola, R. L-Ascorbic acid accumulation in fruit of Ribes nigrum occurs by in situ biosynthesis via the L-galactose pathway. Funct. Plant Biol. 2007, 34, 1080–1091. [Google Scholar] [CrossRef] [Scilit]
- Cronje, C.; George, G.M.; Fernie, A.R.; Bekker, J.; Kossmann, J.; Bauer, R. Manipulation of L-ascorbic acid biosynthesis pathways in Solanum lycopersicum: Elevated GDP-mannose pyrophosphorylase activity enhances L-ascorbate levels in red fruit. Planta 2012, 235, 553–564. [Google Scholar] [CrossRef] [Scilit]
- Lee, S.K.; Kader, A.A. Preharvest and postharvest factors influencing vitamin C content of horticultural crops. Postharvest Biol. Technol. 2000, 20, 207–220. [Google Scholar] [CrossRef] [Scilit]
- Lv, D.N.; Huang, T.H.; Li, Y.L.; Zuo, X.X.; Wang, J.; Cai, Z.P.; Shen, Y.G.; Du, H.Y.; Zhang, W.; Liu, Z.L.; et al. Regulation of ascorbic acid metabolism in postharvest navel orange fruit during storage by exogenous hydrogen sulfide. Front. Nutr. 2026, 13, 1760332. [Google Scholar] [CrossRef] [Scilit]
- Park, H.; Kim, M.J.; Kim, C.W.; Han, N.; Lee, U. Harvest maturity highly affects fruit quality attributes of ethylene-treated ‘autumn sense’ hardy kiwifruit. For. Sci. Technol. 2022, 18, 1–6. [Google Scholar] [CrossRef] [Scilit]
- Manzoor, M.; Hussain, S.B.; Anjum, M.A.; Naseer, M.; Ahmad, R.; Ziogas, V. Effects of Harvest Time on the Fruit Quality of Kinnow and Feutrell’s Early Mandarins (Citrus reticulata Blanco). Agronomy 2023, 13, 802. [Google Scholar] [CrossRef] [Scilit]
- Jing, Y.Y.; Ma, X.; Jin, P.; Zhu, X. Effects of Harvest Maturity on Chilling Injury and Storage Quality of Apricots. J. Food Qual. 2018, 2018, 4954931. [Google Scholar] [CrossRef] [Scilit]
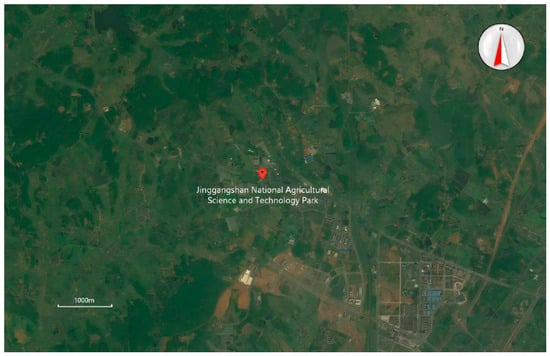
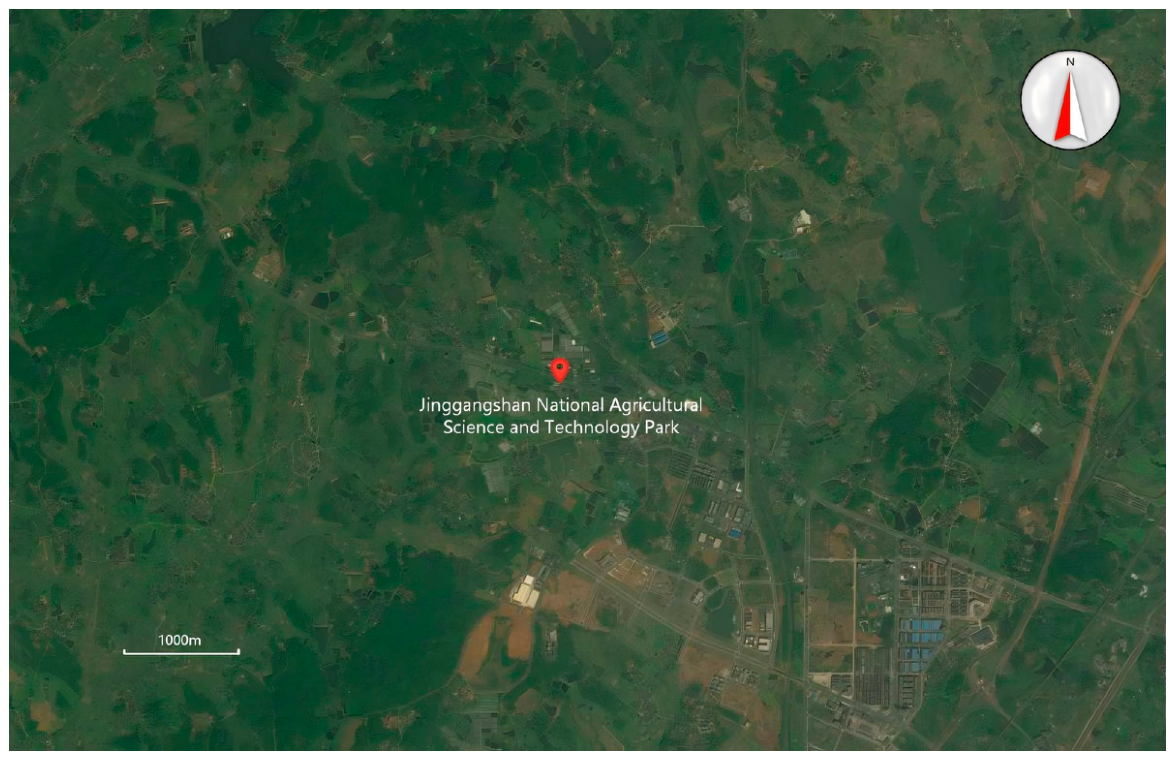
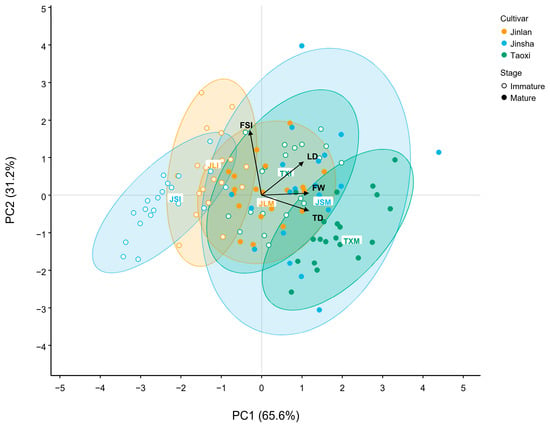
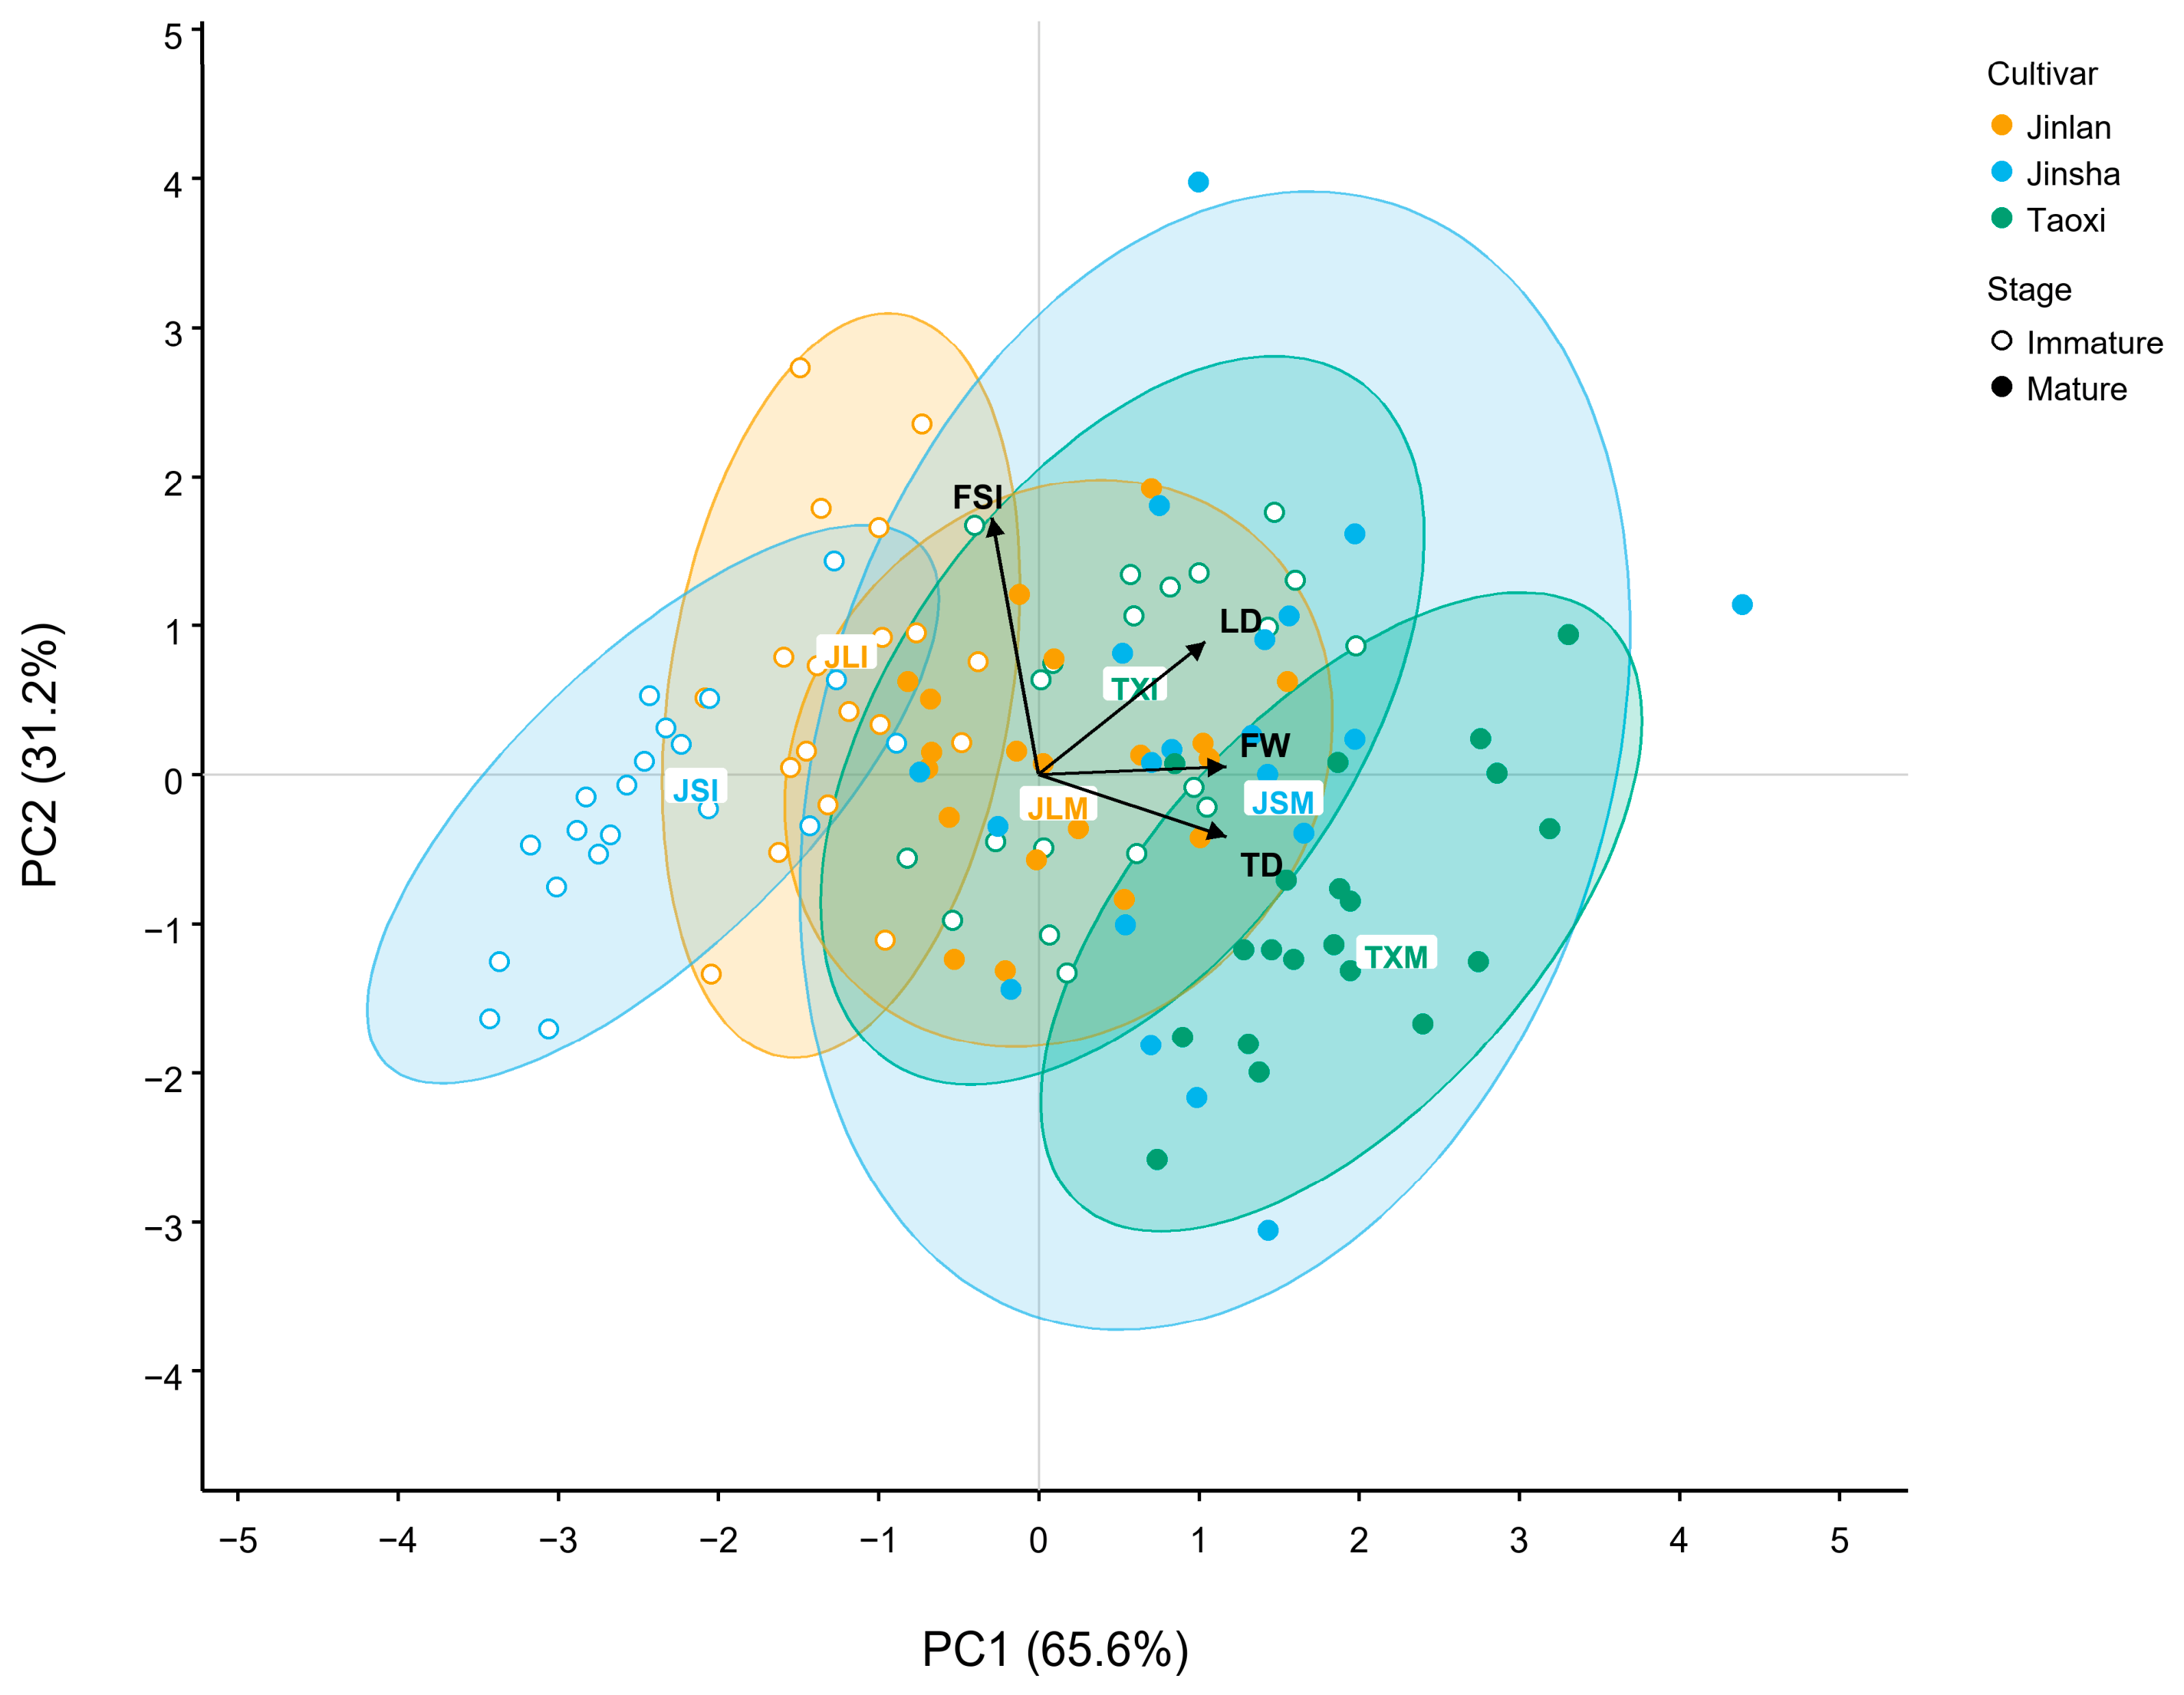
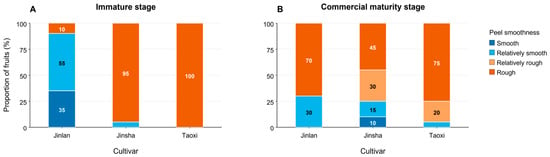
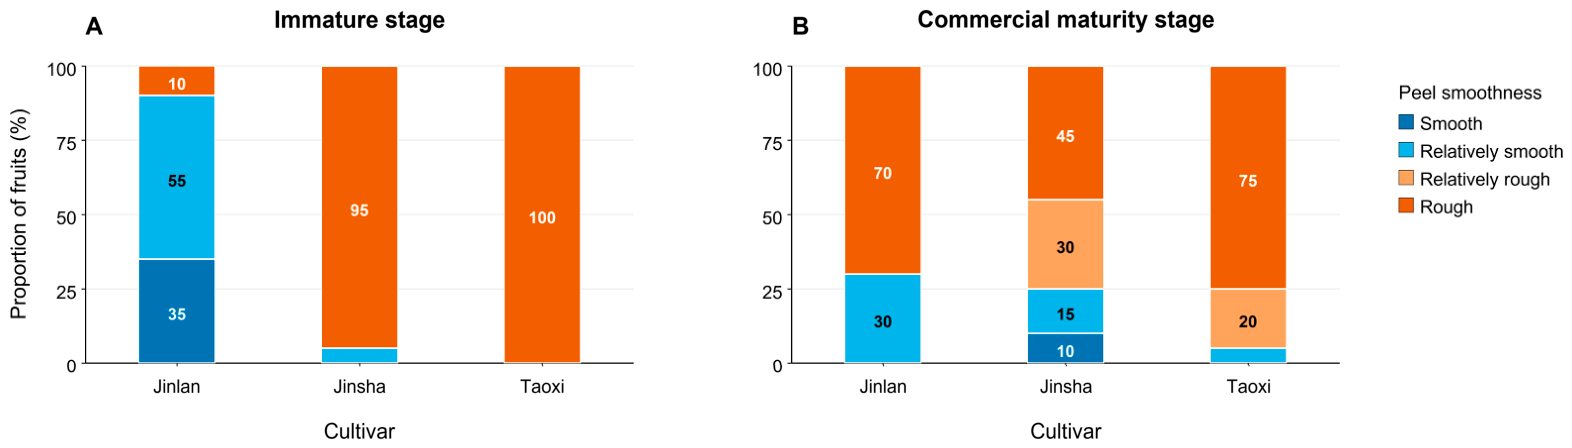
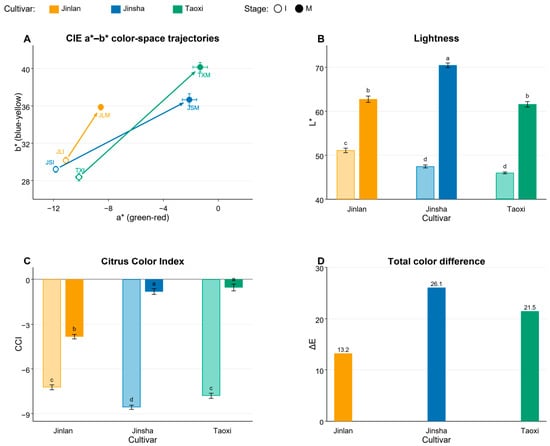
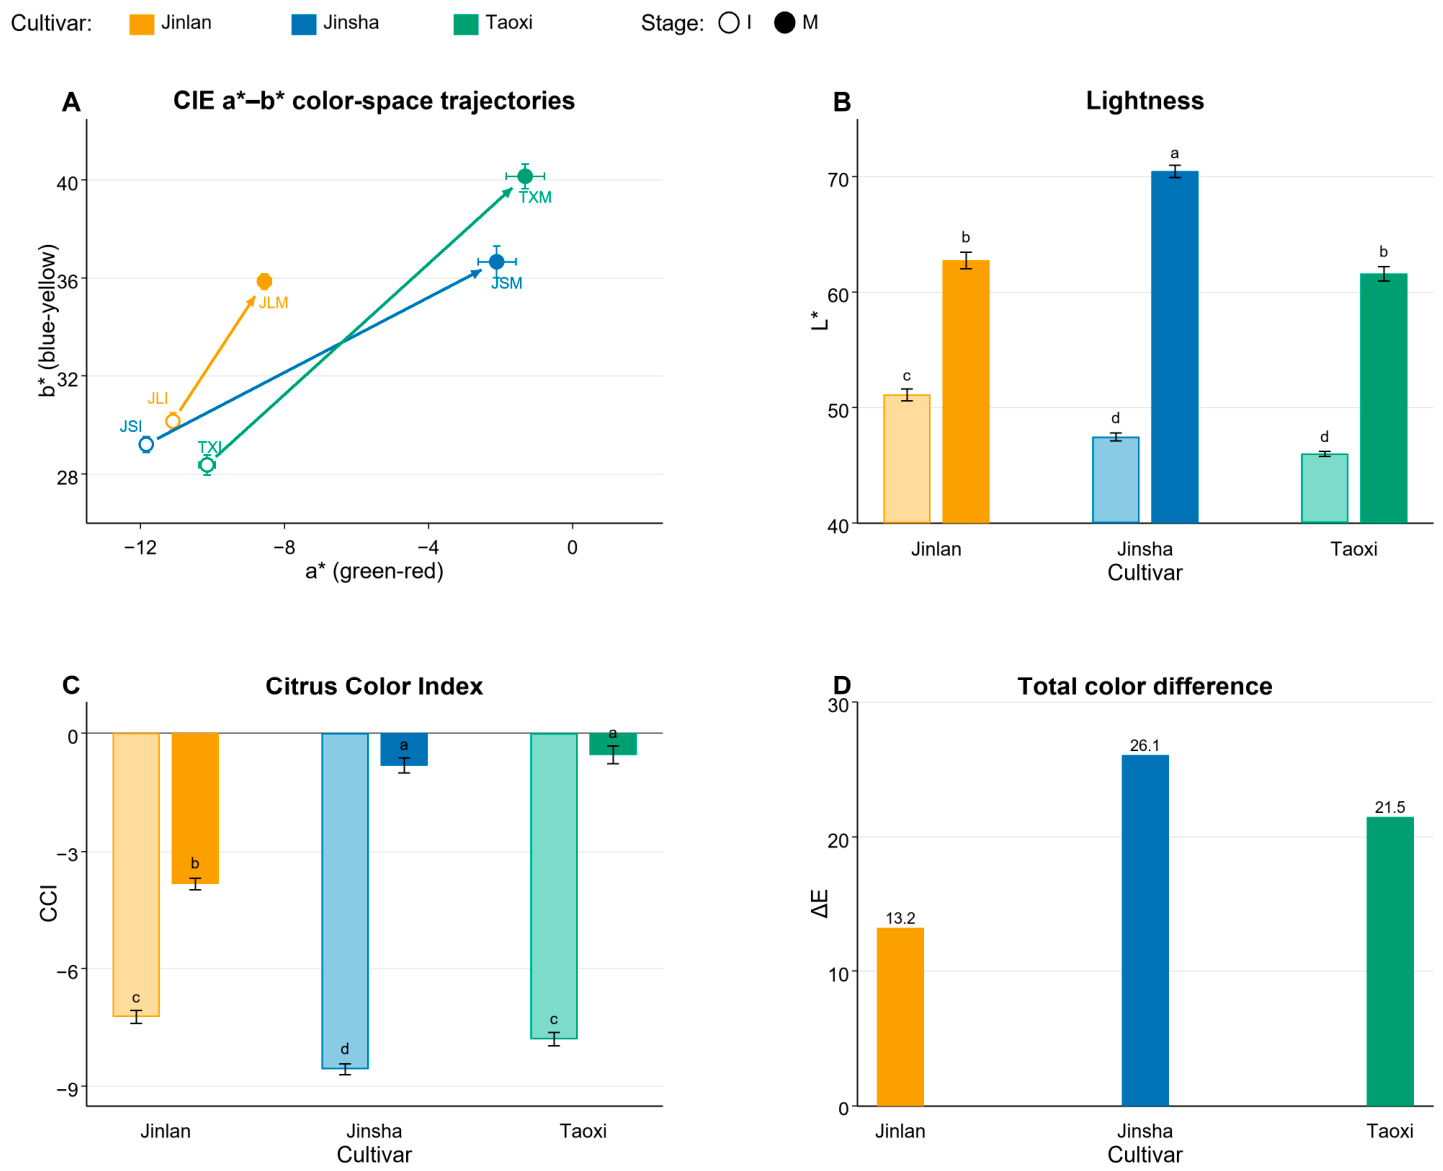
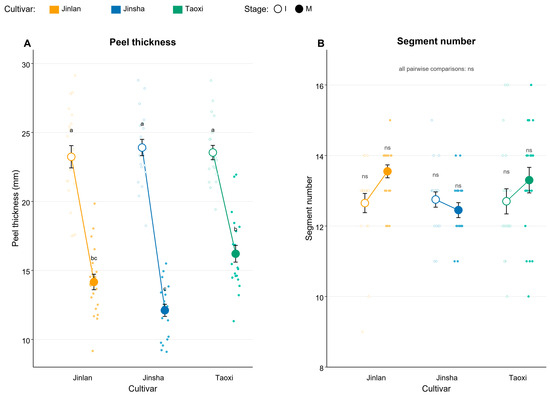
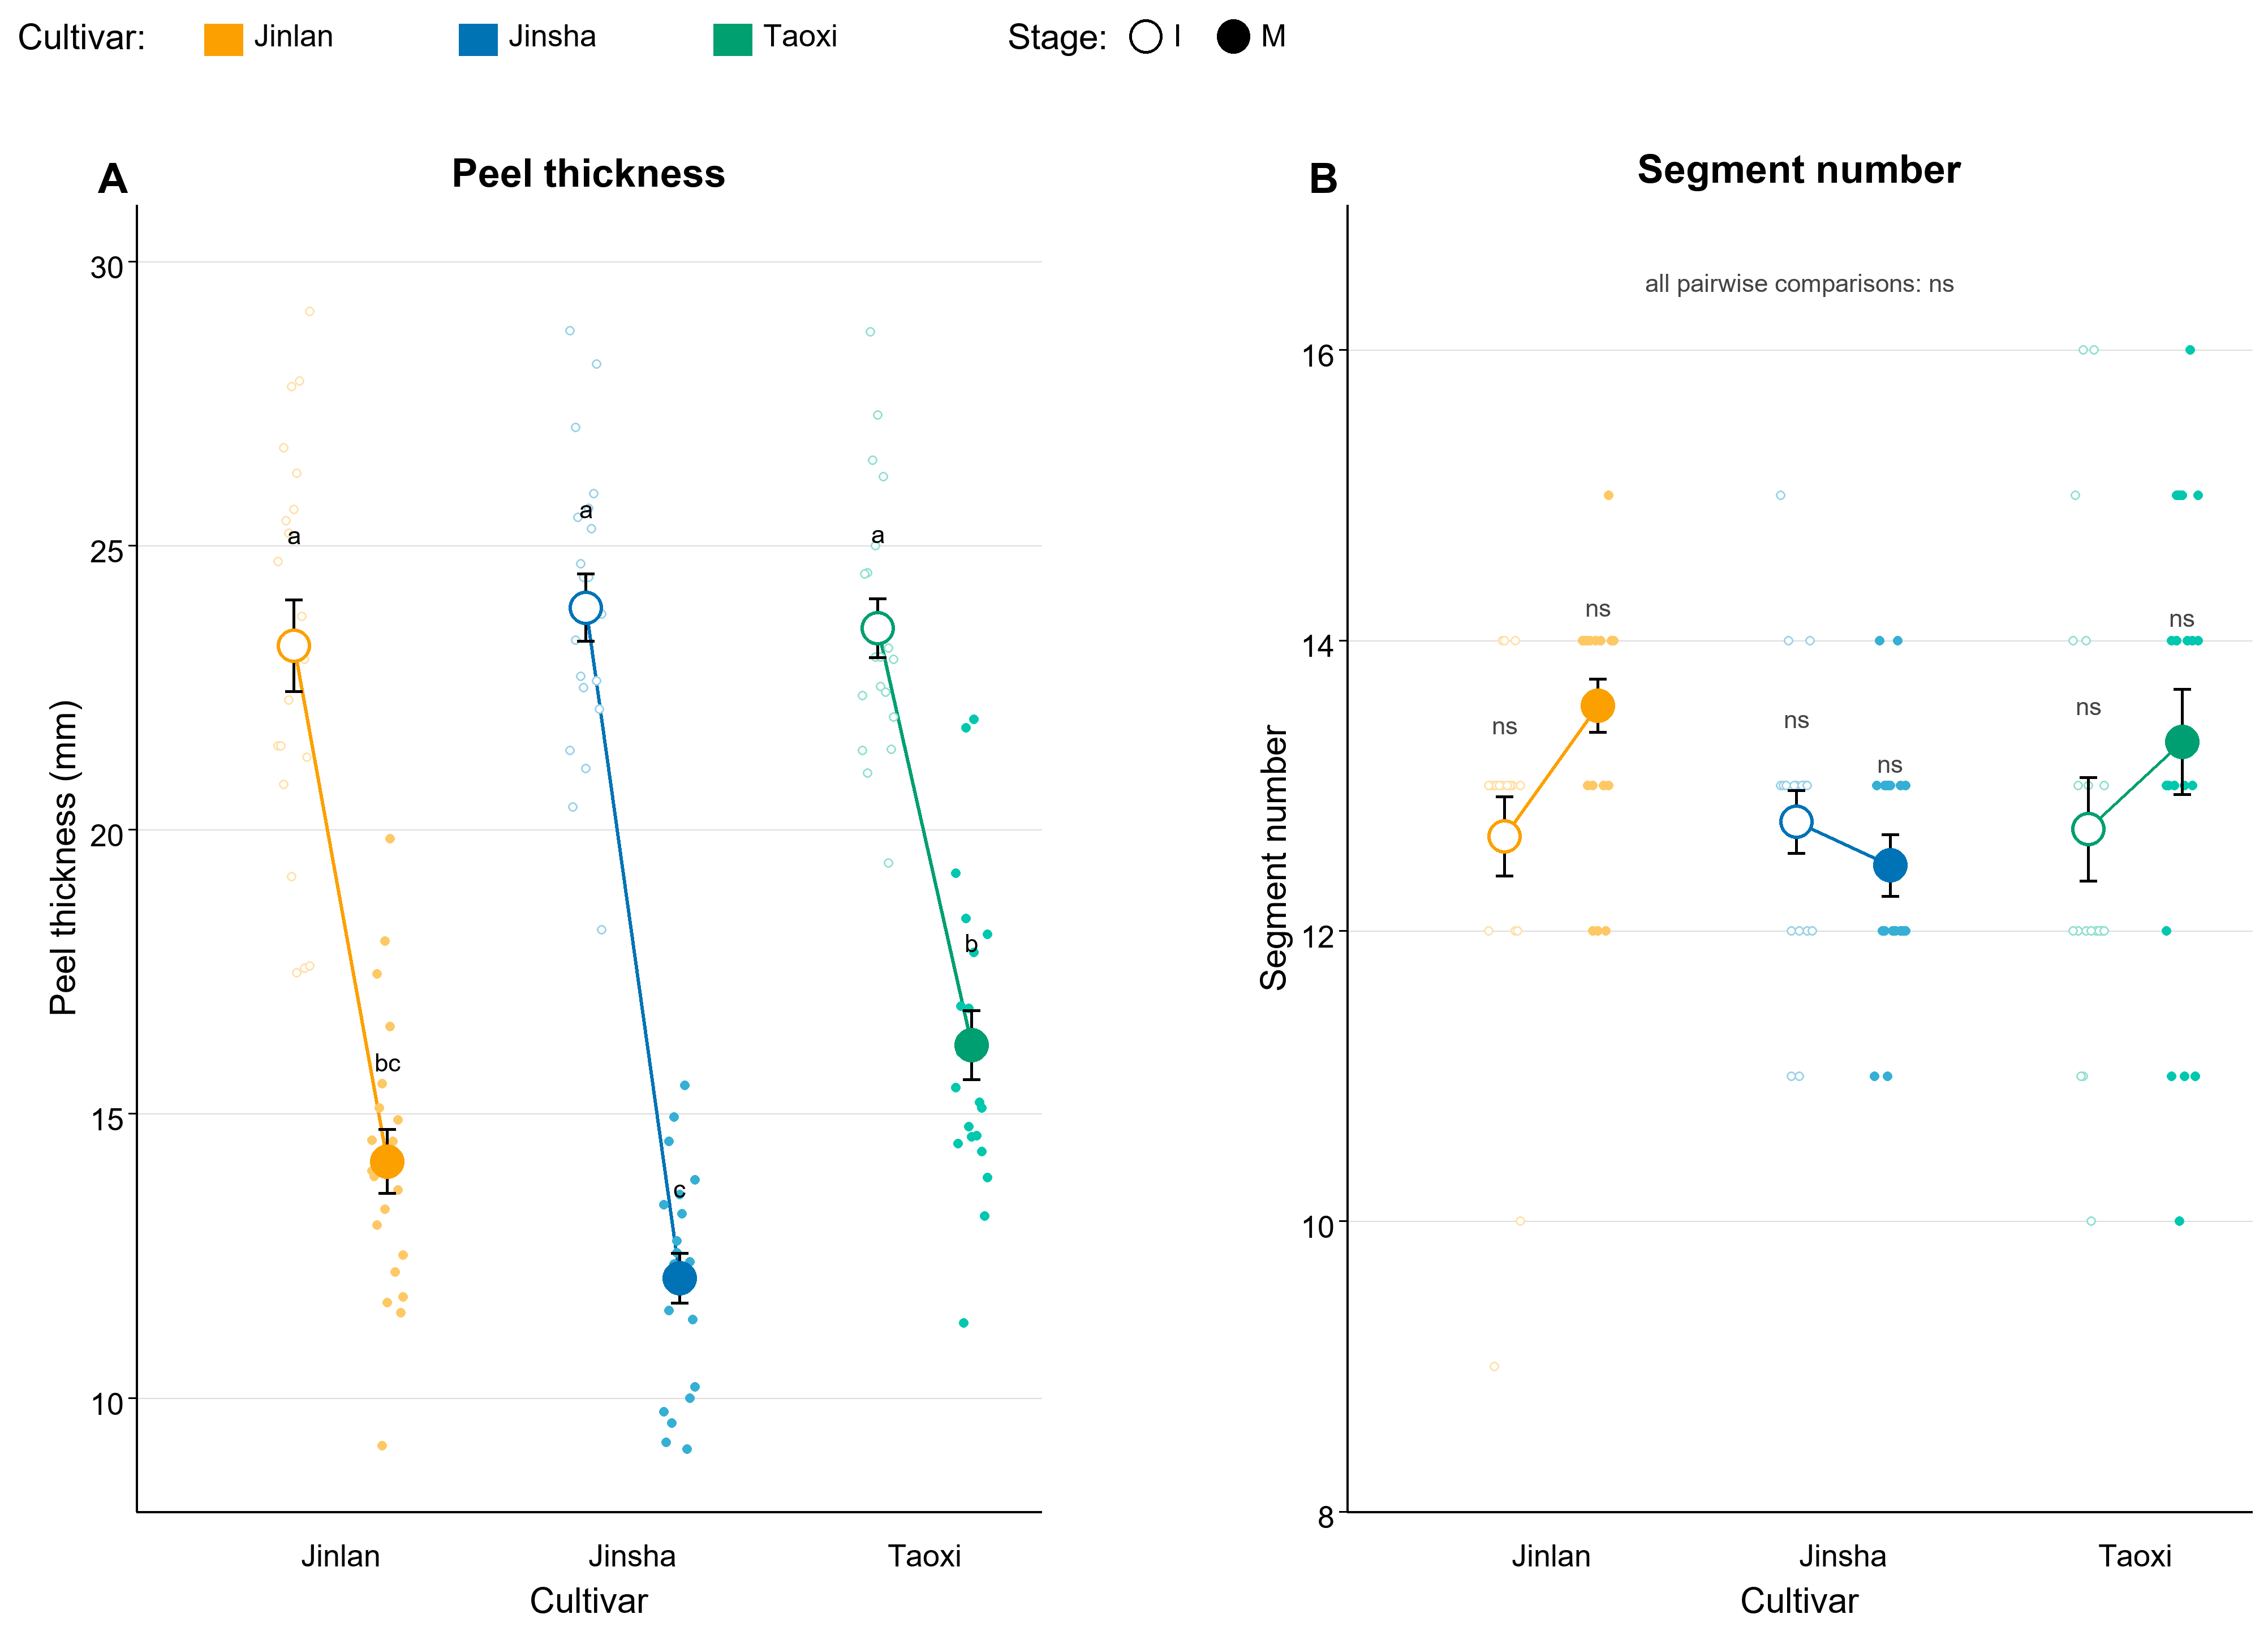
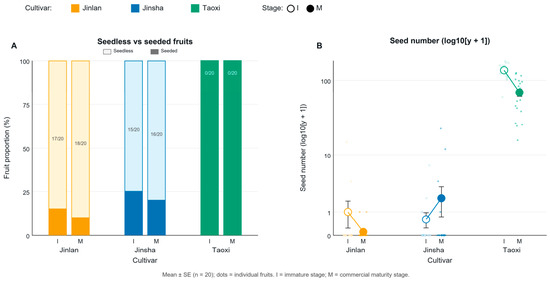
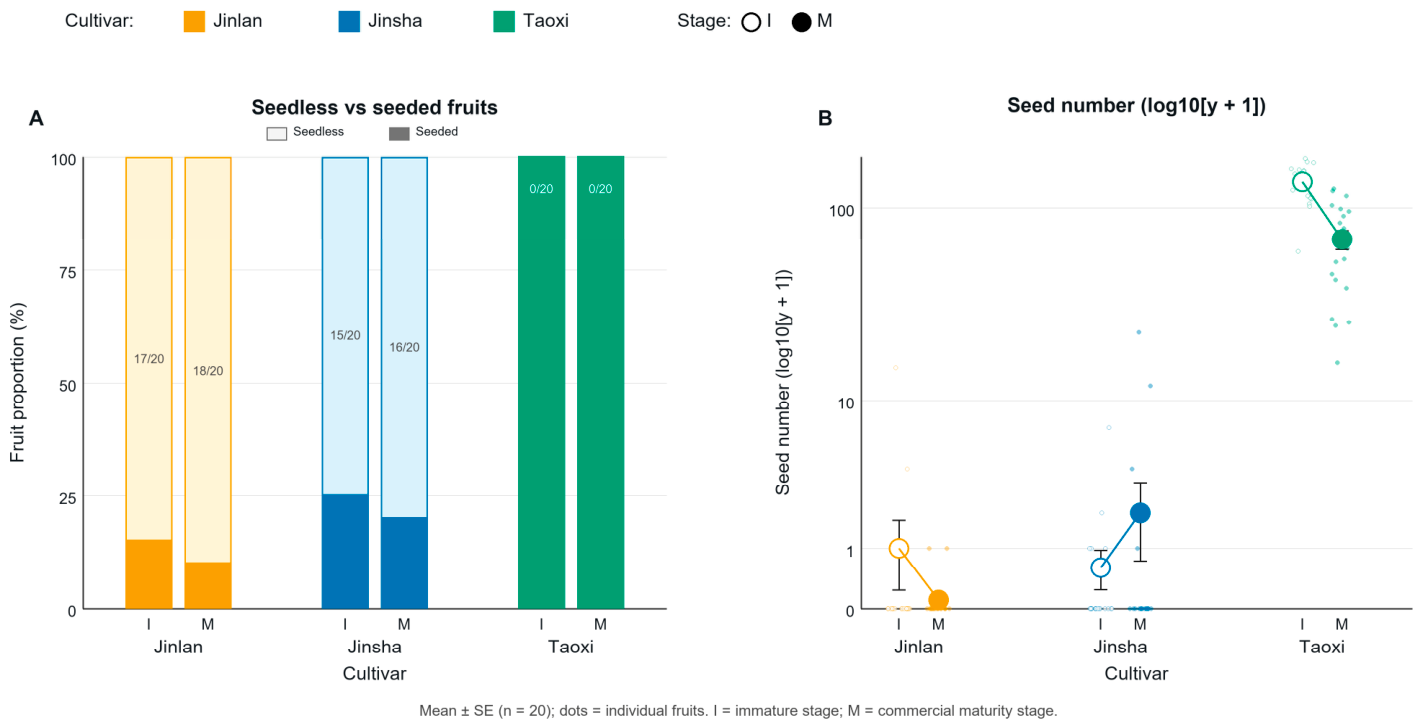
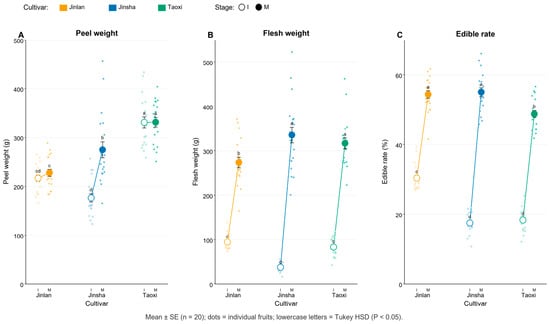
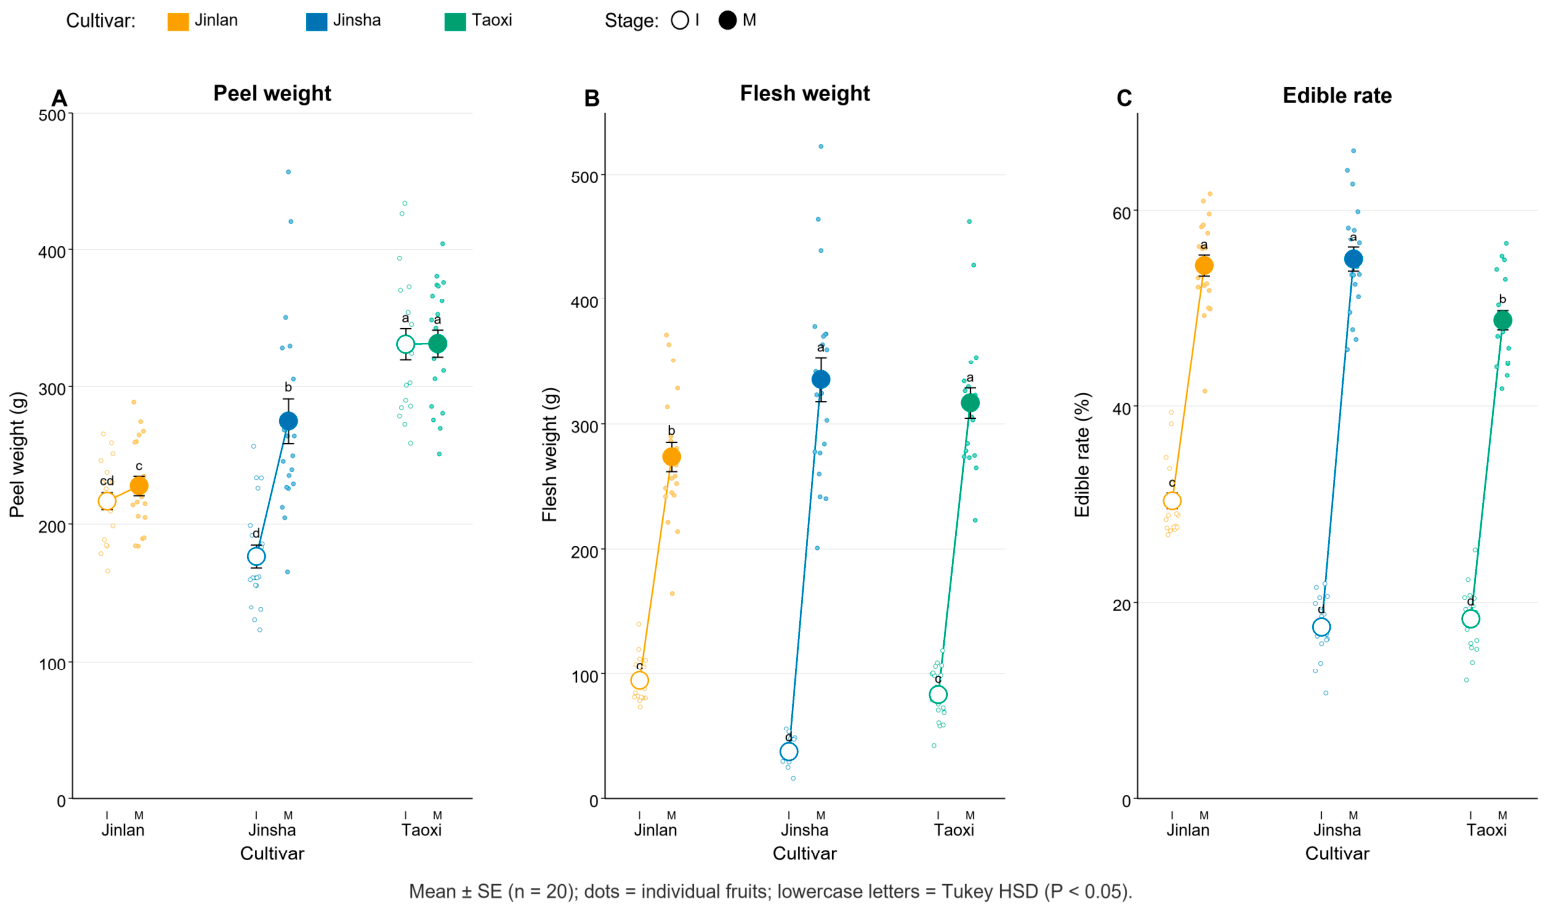
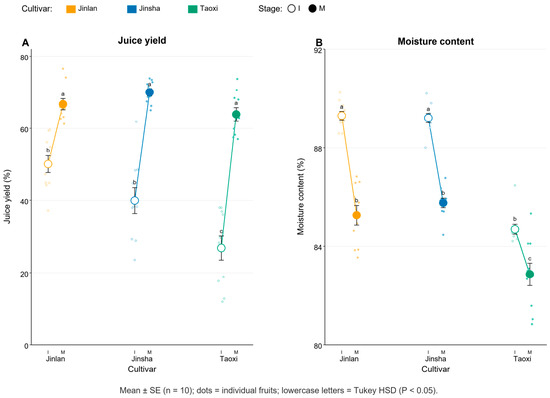
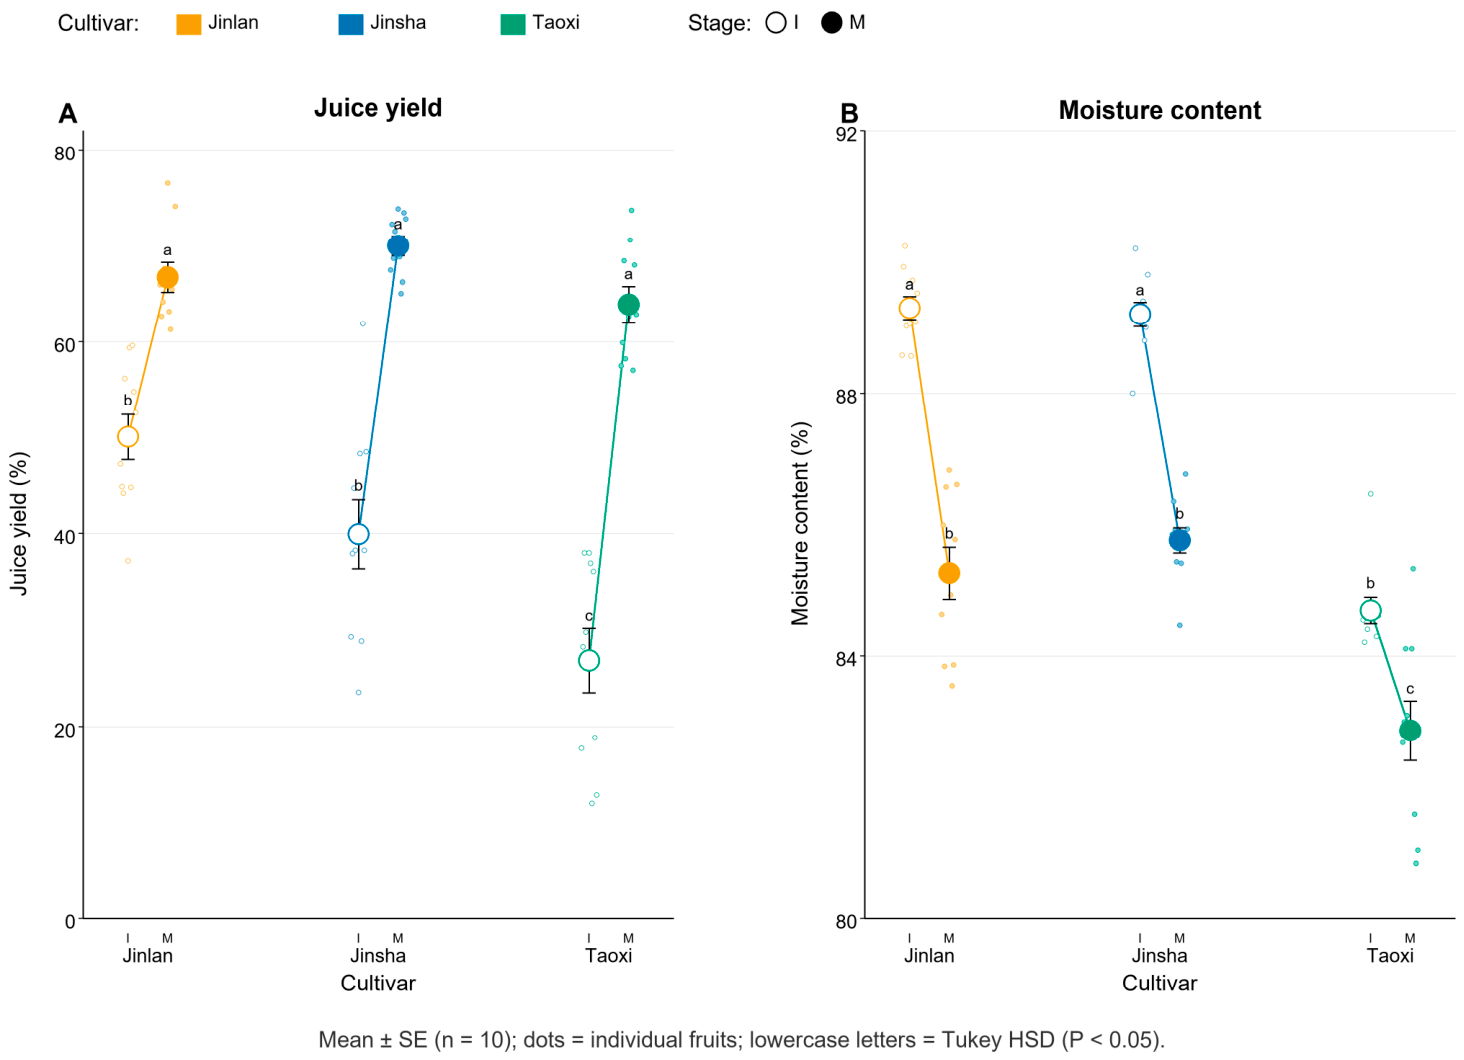
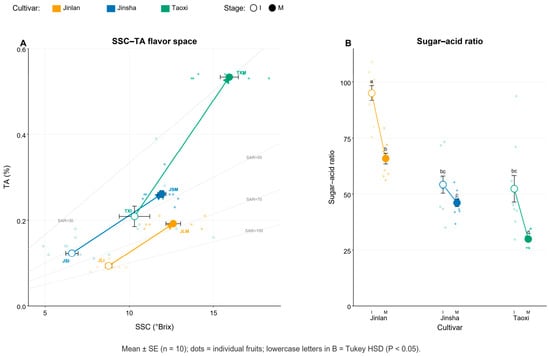
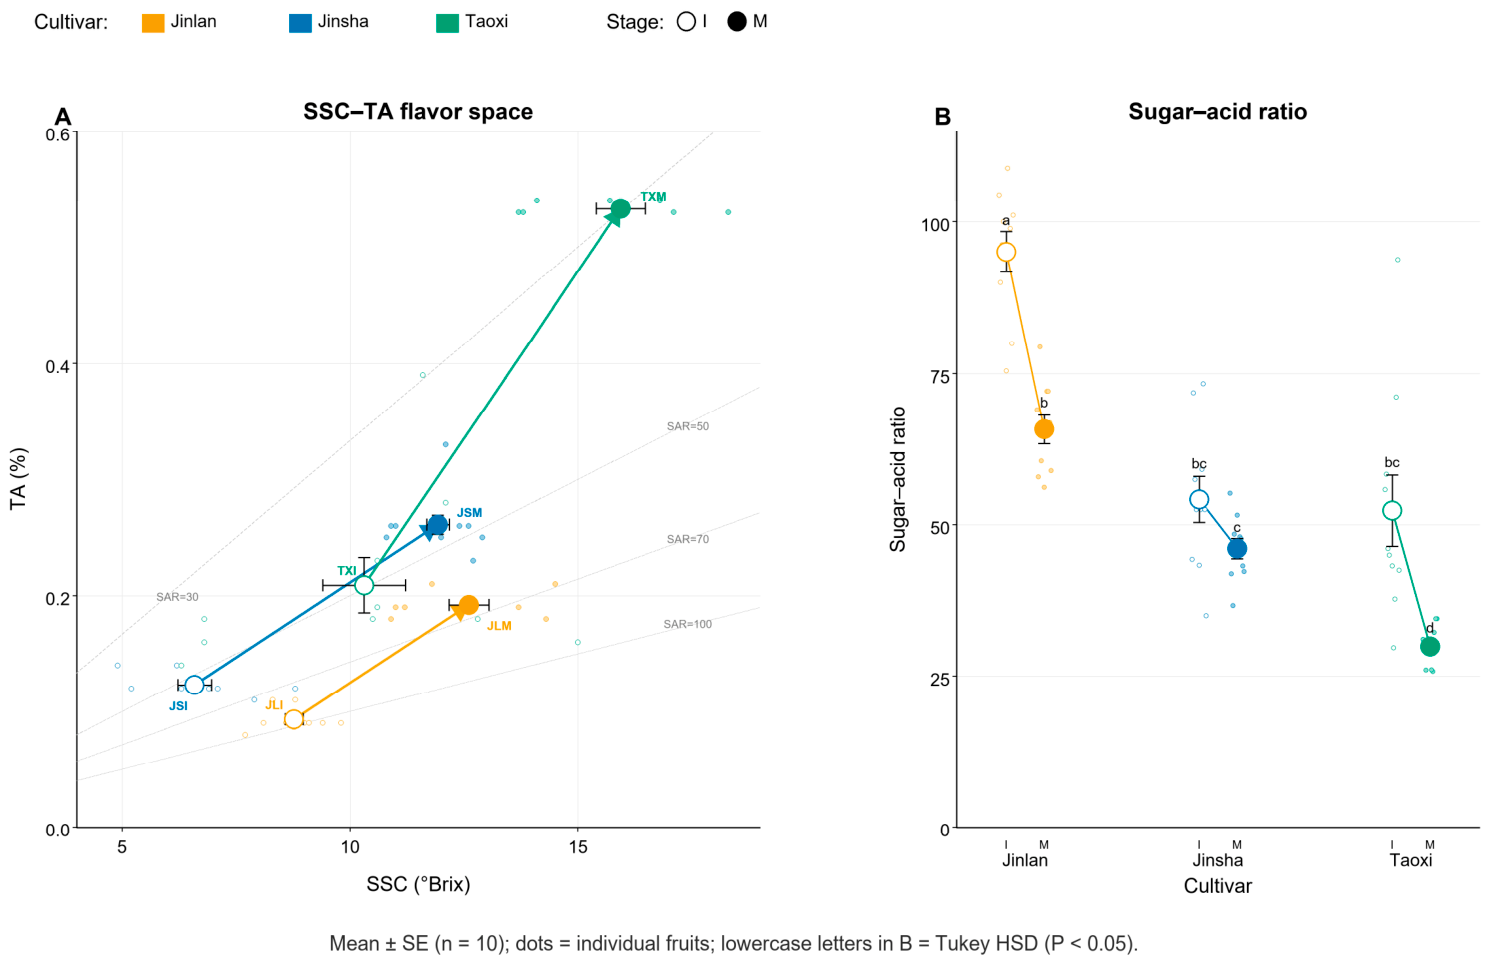
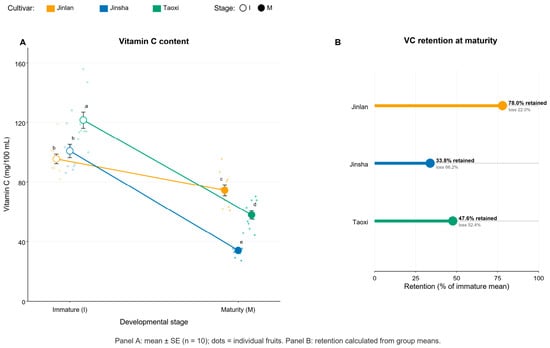
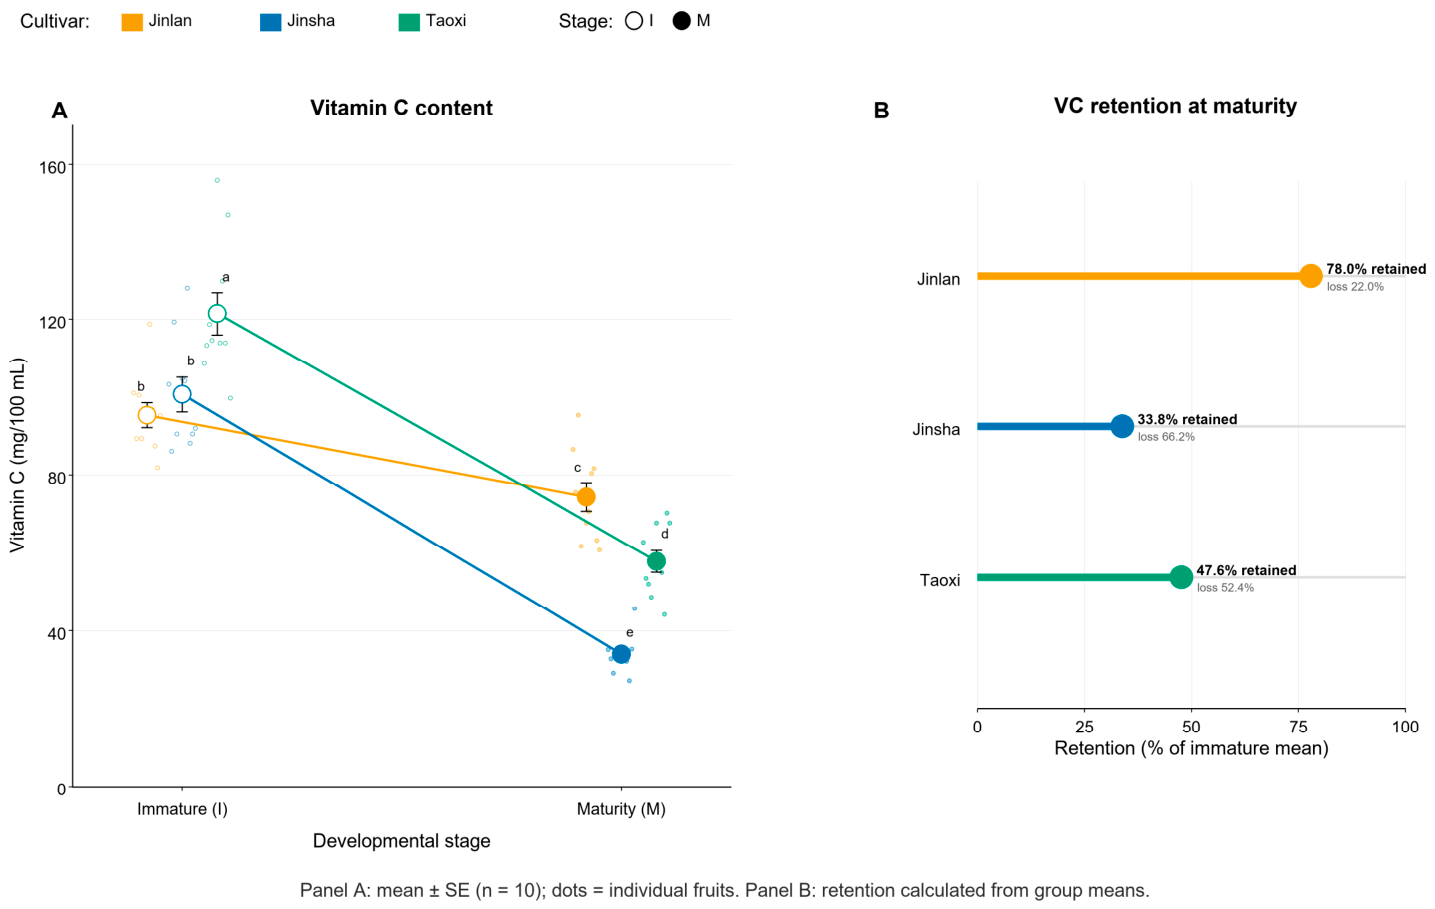
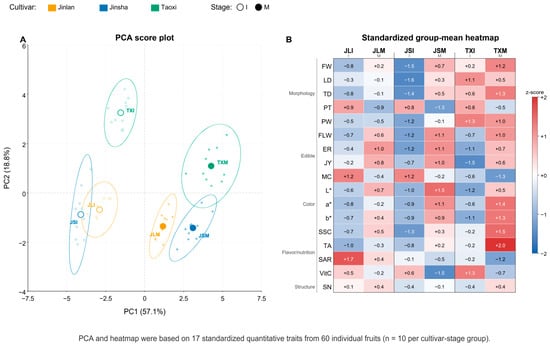
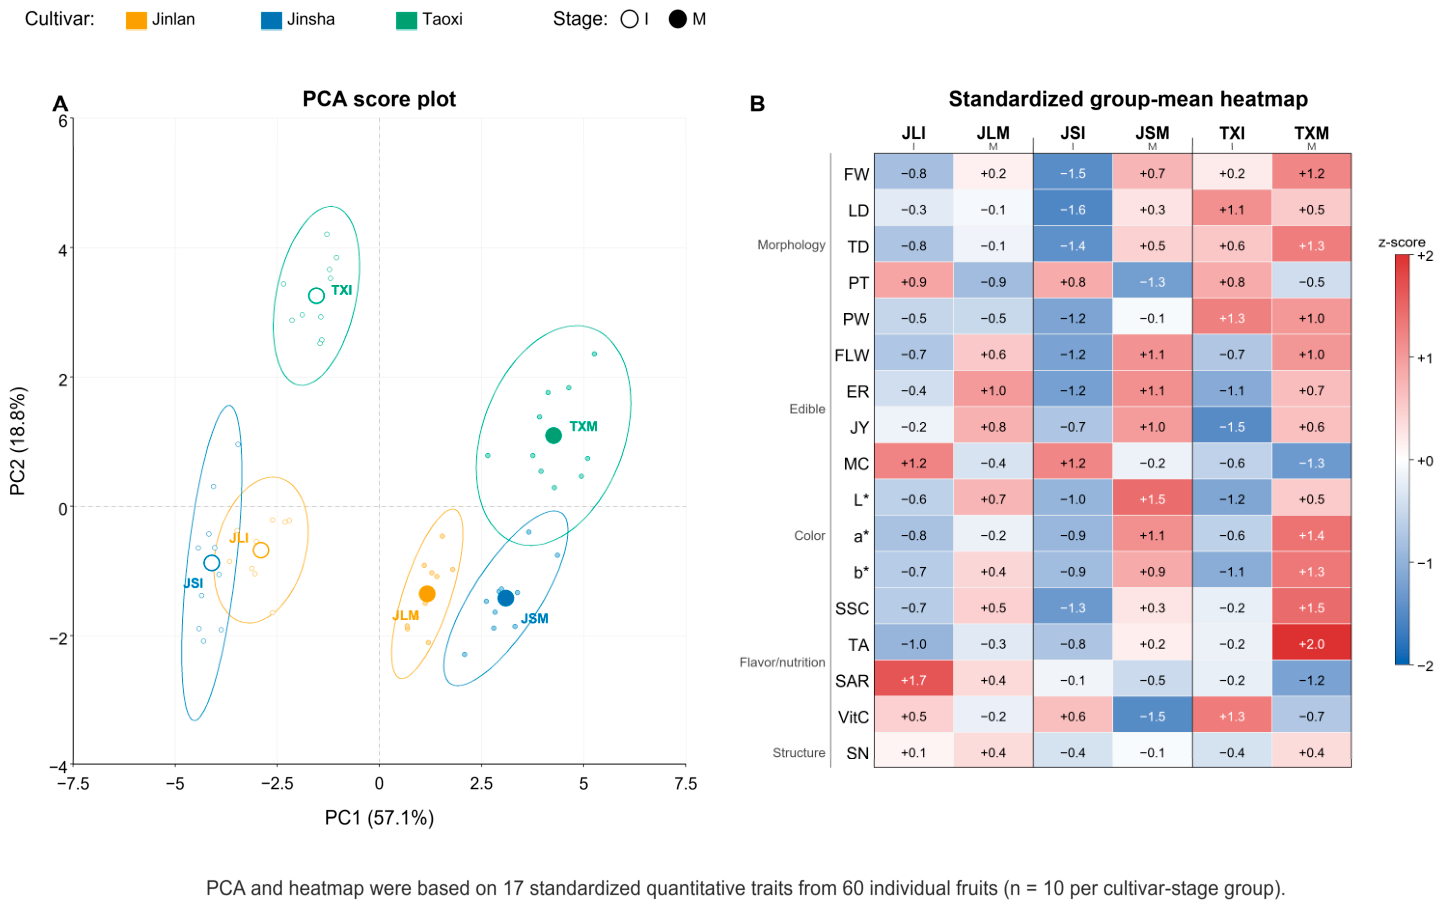

Disclaimer/Publisher’s Note: The statements, opinions and data contained in all publications are solely those of the individual author(s) and contributor(s) and not of MDPI and/or the editor(s). MDPI and/or the editor(s) disclaim responsibility for any injury to people or property resulting from any ideas, methods, instructions or products referred to in the content. |
© 2026 by the authors. Licensee MDPI, Basel, Switzerland. This article is an open access article distributed under the terms and conditions of the Creative Commons Attribution (CC BY) license.