


Abstract
This study elucidates the variations in phenolic acids, soluble sugars, and pinking development of midribs of two cultivars of Romaine lettuce (Keona—high pinking and Icarus—low pinking) under two light intensities (high L1—558 and low L2—244 µmol m−2 s−1) harvested at two harvest dates (M1—42 and M2—49 days after transplanting, DAT). The pinking index of Keona was higher than that of Icarus on 8 days of storage (5 °C). The concentrations of cinnamic acid were reduced in most treatments for both cultivars during storage, except for Keona grown in L2 with M2 harvest. Upon storage, the concentrations of coumaric acid in Keona were similar regardless of light intensities and harvest dates. Coumaric acid and caffeic acid concentrations in Icarus in L1 harvested at M2 were the highest. Low light intensity with M1 harvest enhanced the concentration of chlorogenic acid in Keona, but a similar situation reduced its content in Icarus during storage. Icarus contained higher initial concentrations of glucose under both light intensities, regardless of harvest dates, compared to Keona. In conclusion, high pinking was associated with high phenolic acids except for cinnamic acid. High light intensities and more advanced harvests increased the pinking of Keona but not of the Icarus.
1. Introduction
Fresh lettuce (Lactuca sativa L.) is a highly perishable product. Being a predominantly leafy vegetable with a relatively reduced fibrous structure, it is susceptible to slight damage, especially in terms of appearance, which may reduce consumer perception and acceptance. During storage, wilting, weight loss, and enzymatic oxidative discolouration are three quality-related attributes that are likely to appear on the lettuce products, especially when stored in opened or partially opened packages exposed to oxygen [1]. In the context of the food and beverage industry, this is exacerbated by the use of minimally processed pre-shredded lettuce, which increases the rate of degradation through stress and mixing of cell contents.
Enzymatic oxidative discolouration of fresh lettuce is induced by wounding, a phenomenon that cannot be avoided during the preparation of fresh-cut vegetables. Wounding releases polyphenol oxidases (PPOs), which are responsible for the conversion of phenolic acids, including cinnamic acid and coumaric acid, to caffeic acid that eventually produces caffeic acid o-quinones, which are pink in discolouration [2].
Differences in light intensities experienced by crops during growth and development produce marked effects on their soluble carbohydrates and secondary metabolites, which affect product quality [3]. Plant products with different biochemical and nutritional compositions would have different textures, colours, flavours, and shelf lives [4,5,6]. Lettuce produced at high light intensity was reported to enhance the biosynthesis of phytochemicals, including phenolic compounds [7], amino acids [8], and ascorbic acid [8]. Results of our previous study have demonstrated that increased light intensities elevated the concentration of phenolic acids, especially coumaric acid, caffeic acid, and chlorogenic acid, which correlated positively with the pinking index [9].
Atkinson et al. [10] showed that pinking development was highly variable among lettuce genotypes and greatly affected by growing seasons, and the degree of pinking development can change over the period of storage, suggesting that generalisation for a type of lettuce cannot be made with respect to pinking incidence and intensity. Apart from linking to the phenylpropanoid pathway, pink discolouration in lettuce has been linked to other pathways, which include flavonoid and terpenoid biosynthesis pathways, amino acid metabolism [11], and the lignification process, which could be associated with a higher expression of ferulic acid and sinapic acid [11,12,13,14].
The age of plants is known to affect whole head discolouration. In whole head lettuce, pre-bolting, over-mature lettuce heads displayed higher levels of discolouration than commercially mature heads [15]. The pinking of processed lettuce prepared from over-mature lettuce was found to be more widespread than in tissues from younger plants [16]. Despite dissimilarity in terms of discolouration of lettuce with different plant ages, Wurr et al. [17] reported that immature, mature, and over-mature lettuce heads contained similar levels of phenolic compounds. In contrast, Viacava et al. [18] found that there was a significant distribution gradient for phenolic compounds across the head of lettuce, with the outer leaves containing higher phenolic compounds than the inner leaves.
This paper reports the variations in phenolic acids, soluble sugars, and pinking of midribs in fresh-cut leaves of two cultivars of Romaine lettuce grown at two light intensities and harvested at two different harvest dates.
2. Materials and Methods
2.1. Plant Materials, Growing Conditions, and Light Treatment
This study was conducted in a glasshouse compartment at the Crop and Environment Laboratory, University of Reading, UK, involving two cultivars of Romaine lettuce (Keona—fast pinking, and Icarus—slow pinking; (Rijk Zwaan Netherlands B.V., De Lier, The Netherlands), two intensities of light—high light (L1) and low light (L2), and two harvest dates. The seeds were sown on 30 October 2023 in rockwool plugs (Grodan Industrieweg 15, 6045 JG, Roermond, The Netherlands) in plug trays of 77 cells, and the seedlings were raised under natural sunlight and LED supplementary lighting (125 µmol m−2 s−1, 16 h, from 0600 to 2200 h). The plants were then transplanted into a closed-recirculated hydroponic system on 18 November 2023, when they reached a three-leaf stage. Details on the growing system have been described earlier by Yahya et al. [9].
The plants were grown under similar lighting conditions as the seedlings for 20 days (until 8 December 2023), after which they were subjected to different light intensity treatments. The variations in light intercepted by plants were obtained by installing LED light panels (8:1 red/blue ratio, TungsramTM, Budapest, Hungary, Product ID: TUAS-GLIN) at one end of the bench of the whole growing system. It was noted that the choice of red/blue ratio of LED may affect the results reported, as growing light with different red/blue spectrums markedly influences the biochemical compositions of the plant materials [19,20]. The study reported here used an LED light source as a supplementary, not as a sole light source, as used by some other researchers when the study was conducted in a growth chamber.
The light panels were switched on for 16 h from 0600 to 2200 h throughout the treatment period. All treatments were replicated three times. The average light intensities for the light treatments measured at 15 cm above the plant canopy at the middle of the plots at 1200–1300 for 5 days during light treatment were 558 ± 52 µmol m−2 s−1 (L1) and 244 ± 5 µmol m−2 s−1 (L2) (n = 15). The measurement was carried out using a light metre (SKP2000191-3668, Skye Instruments Ltd., Llandrindod Wells, UK).
2.2. Harvesting, Sample Preparation, and Cold Storage
Two plants per plot were harvested at two different dates: 42 days after transplanting (42 DAT) (M1) and at 49 DAT (M2), on 20 and 27 December 2023, respectively. Immediately after harvest, the plants were kept in a cold room (5 °C) overnight before being processed on the following day. During sample preparation, two outer leaves of each plant were discarded, and five leaves for each plant were cut from the core using a regularly sterilised knife. Then, the midribs were separated from the leaves and used for analysis. The midribs were cut into 2.5 cm lengths, and 25 pieces of midribs for each plot were placed into a 150 mm × 200 mm, 20 micron microperforated polypropylene storage bag (Polybags Ltd., Greenford, UK).
Two sets of leaf samples were prepared: one for the day 0 postharvest timepoint and another for day 8. For day 0, the pinking index of the midribs was assessed immediately after processing, then the samples were freeze-dried and kept at −80 °C until required for further analysis. For the second set of samples, the midribs were stored at 5 °C in dark conditions for eight days before being scored for pinking indices, freeze-dried, and kept at −80 °C until further use for metabolite analysis.
2.3. Determination of Pinking Index
Determination of midrib discolouration in terms of pink index was carried out on day 0 and day 8 of storage. This was assessed using the objective discolouration on a 5-point scale, with early symptoms of discolouration being 0 (clean), 1 (slightly coloured), 2 (slight pink), 3 (mid pink), and 4 (intense pink) [10]. On the day of the pinking assessment, the number of midribs with signs of pinking discolouration (pinking incidence) for the 25 quadrat sections drawn on an acrylic sheet placed on top of the storage bags of midribs was counted, and the score of the most intense colour of each quadrat section was recorded. The pinking index was then calculated by multiplying pinking incidence (number of quadrats with pinking) and pinking intensity (pinking score).
2.4. Determination of Phenolic Acids
Phenolic acid determination in the midrib extracts was conducted using High-Performance Liquid Chromatography with Diode-Array Detector (HPLC-DAD) using Agilent 1100 with DAD system (Agilent, Santa Clara, CA, USA). The freeze-dried midrib samples were ground into fine powder using a Wiley Mini Mill (Thomas Scientific, Swedesboro, NJ, USA), sieved, and stored in a −80 °C freezer before extraction. The extraction of the samples was performed as follows: 40 mg of midrib powder were added with 1.5 mL of 90% aqueous methanol (v/v) before being vortexed for 10 sec and sonicated for 1 min, then centrifuged at 4 °C at 13,000× g for 20 min. The supernatant was filtered with a 0.2 μm filter into Eppendorf tubes. A total of 400 µL of extract was added to HPLC vials and stored at −80 °C. At the time of analysis, 20 µL of isovanillic acid (0.2 mg mL−1 in 90% aqueous MeOH) was added to the HPLC vials as an internal standard. HPLC-DAD analysis was performed using acetonitrile +0.1% formic acid (Solvent A) and HPLC-grade water +0.1% formic acid (Solvent B) as the mobile phase at an eluent gradient of A:B; 5:95 at 0–5 min, 50:50 at 40 min, 100:0 at 55–55.9 min, and 5:95 at 60 min at a 26 °C column temperature at 1.0 mL/min. The column used was ZORBAX Eclipse Plus C18 (2.1 × 150 mm, 3.5 µm) (Crawford Scientific, Strathaven, UK). DAD analysis wavelength was set at 280 nm for cinnamic acid and 320 nm for the rest of the phenolic acids. External standards used are methanol-diluted cinnamic acid, coumaric acid, caffeic acid, chlorogenic acid, ferulic acid, and sinapic acid.
2.5. Determination of Soluble Sugars
Soluble sugars were determined using Ion Chromatography Mass Spectrometry (IC-MS) using Dionex ICS 6000 (Thermo Fisher Scientific, Sunnyvale, CA, USA). A total of 1.5 mL of 0.01 M HCl was added to 40 mg of lettuce powder before being vortexed for 10 s and sonicated for 1 min, before being centrifuged at 4 °C at 13,000× g for 20 min. The supernatant was filtered with a 0.2 μm filter into Eppendorf tubes. A total of 500 µL of supernatant was added to amber HPLC vials and stored at −80 °C. Before analysis, 25 µL of 20 mM rhamnose was added to the HPLC vials as internal standards. The IC-MS analysis was performed using mobile phases 500 mM NaOH (Solvent A), 16 mM NaOH (Solvent B and C), and milli-Q distilled water (Solvent D). The eluent gradients of A:B:C:D were as follows: 0:50:50:0 at 0–30 min, 50:0:0:50 at 30–40 min, and 0:50:50:0 at 40–55 min at 20 °C column temperature at 1 mL/min flow rate. The column used was a Dionex CarbopacTM PA1 column (4 × 250 mm, Analytical) (Thermo Fisher Scientific, Sunnyvale, CA, USA). The electrochemical detector (ED) cell was set at palladium–hydrogen (PdH) for the reference electrode (CE); eluent type was Base; and detection was at 30 °C at 10 mM concentration. The waveform settings used were Gold, PdH RE, Carbon, and Quad. External standards used were glucose, galactose, fructose, and sucrose diluted in 0.01 M HCl. The same was performed for rhamnose as an internal standard.
2.6. Data Analysis
Data collected were subjected to ANOVA using the SAS Statistical Package ver. 9.4 (SAS Institute, Cary, NC, USA). The treatment factors were considered as arranged in a randomised complete block design (RCBD) with three replicates. Mean comparison between treatments was also compared using Tukey’s test at p < 0.01. To explore the association between independent variables, principal component analysis (PCA) was performed using Minitab ver. 22.2.1 (Minitab, LLC, State College, PA, USA). Principal components with eigenvalues of more than 1.0 were included in the report.
3. Results
3.1. Pinking Index
No plants presented observable pinking at day 0. On the eighth day of storage, cultivar and light intensities significantly affected the pinking index (Table 1). The pinking index of the midribs of plants grown in high light intensity (L1, 558 µmol m−2 s−1) was 2.76 compared to 1.85 (p < 0.001) for those grown in low light intensity (L2, 244 µmol m−2 s−1) across cultivars and harvest dates. The results suggest that the pinking of the midribs can be reduced remarkably when grown under lower light intensities. As expected, the pinking of midribs of Keona, a high-pinking cultivar, was higher than observed in Icarus by 1.9-fold, with their respective average values of 3.03 for Keona vs. 1.58 for Icarus across the two light intensities. As hypothesised, Keona grown in high light intensities and harvested at M2 (49 DAT) had the highest pinking index (3.87), while there was no difference in the pinking of Icarus between the two harvests under both light conditions. Under low light intensity (L2), the midrib pinking of both cultivars was not affected by harvest dates.
Table 1.
Pinking index of midribs of two cultivars of Romaine lettuce as affected by light intensity, harvest date, and period of storage.
3.2. Phenolic Acids
3.2.1. Cinnamic Acid
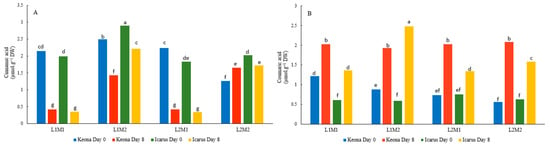
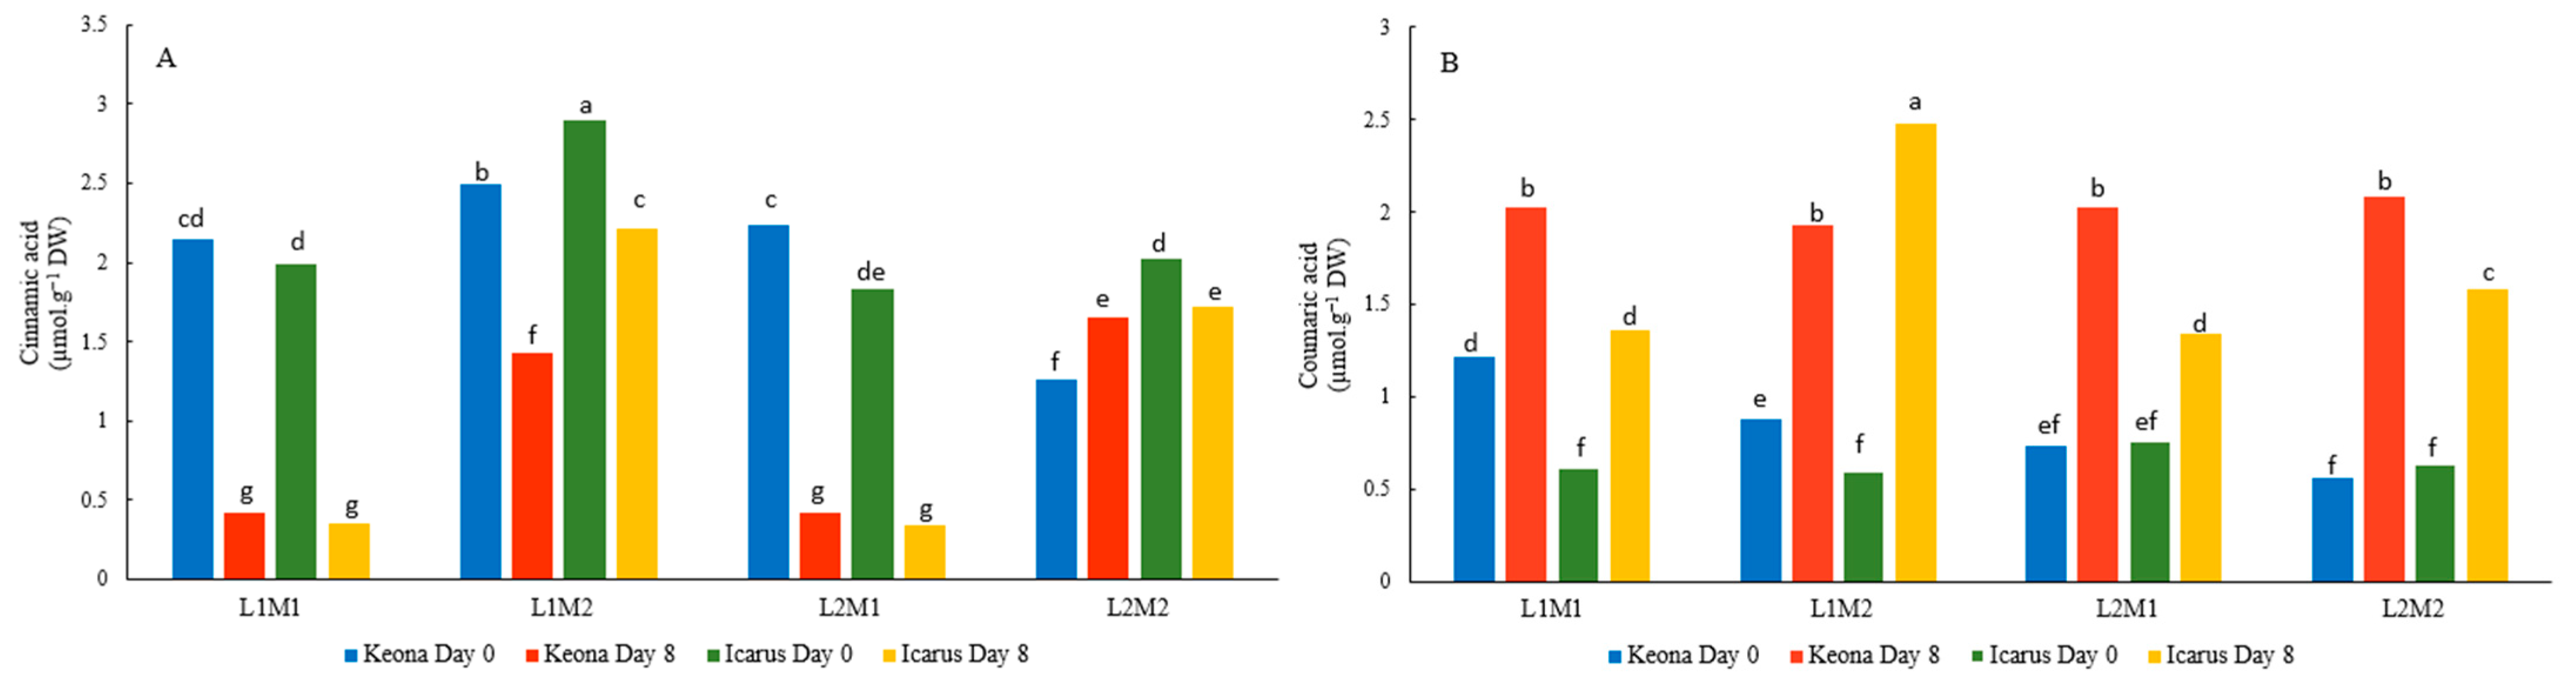
The leaf midribs of Icarus grown in high light intensity (L1, 558 µmol m−2 s−1) with a more advanced harvest date (M2, 49 DAT) contained the highest initial concentration of cinnamic acid (day 0 of storage), while Keona grown in low light intensity (L2, 244 µmol m−2 s−1) and harvested on M2 contained the lowest initial cinnamic acid concentration (Figure 1A). The concentration of cinnamic acid in Icarus decreased during storage for all light intensity levels and harvest dates. The concentration of cinnamic acid in Keona also decreased during storage for L1M1, L1M2, and L2M1. Unlike Icarus, the concentration of the metabolite in Keona increased during storage for L2M2, from 1.26 to 1.65 µmol g−1 DW.
Figure 1.
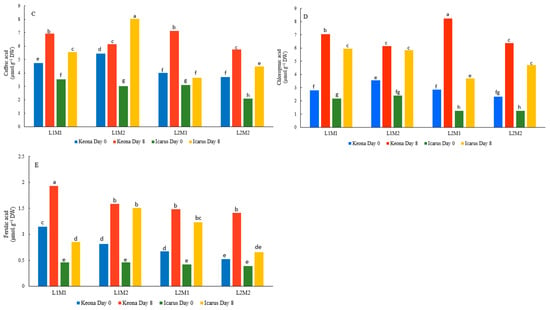
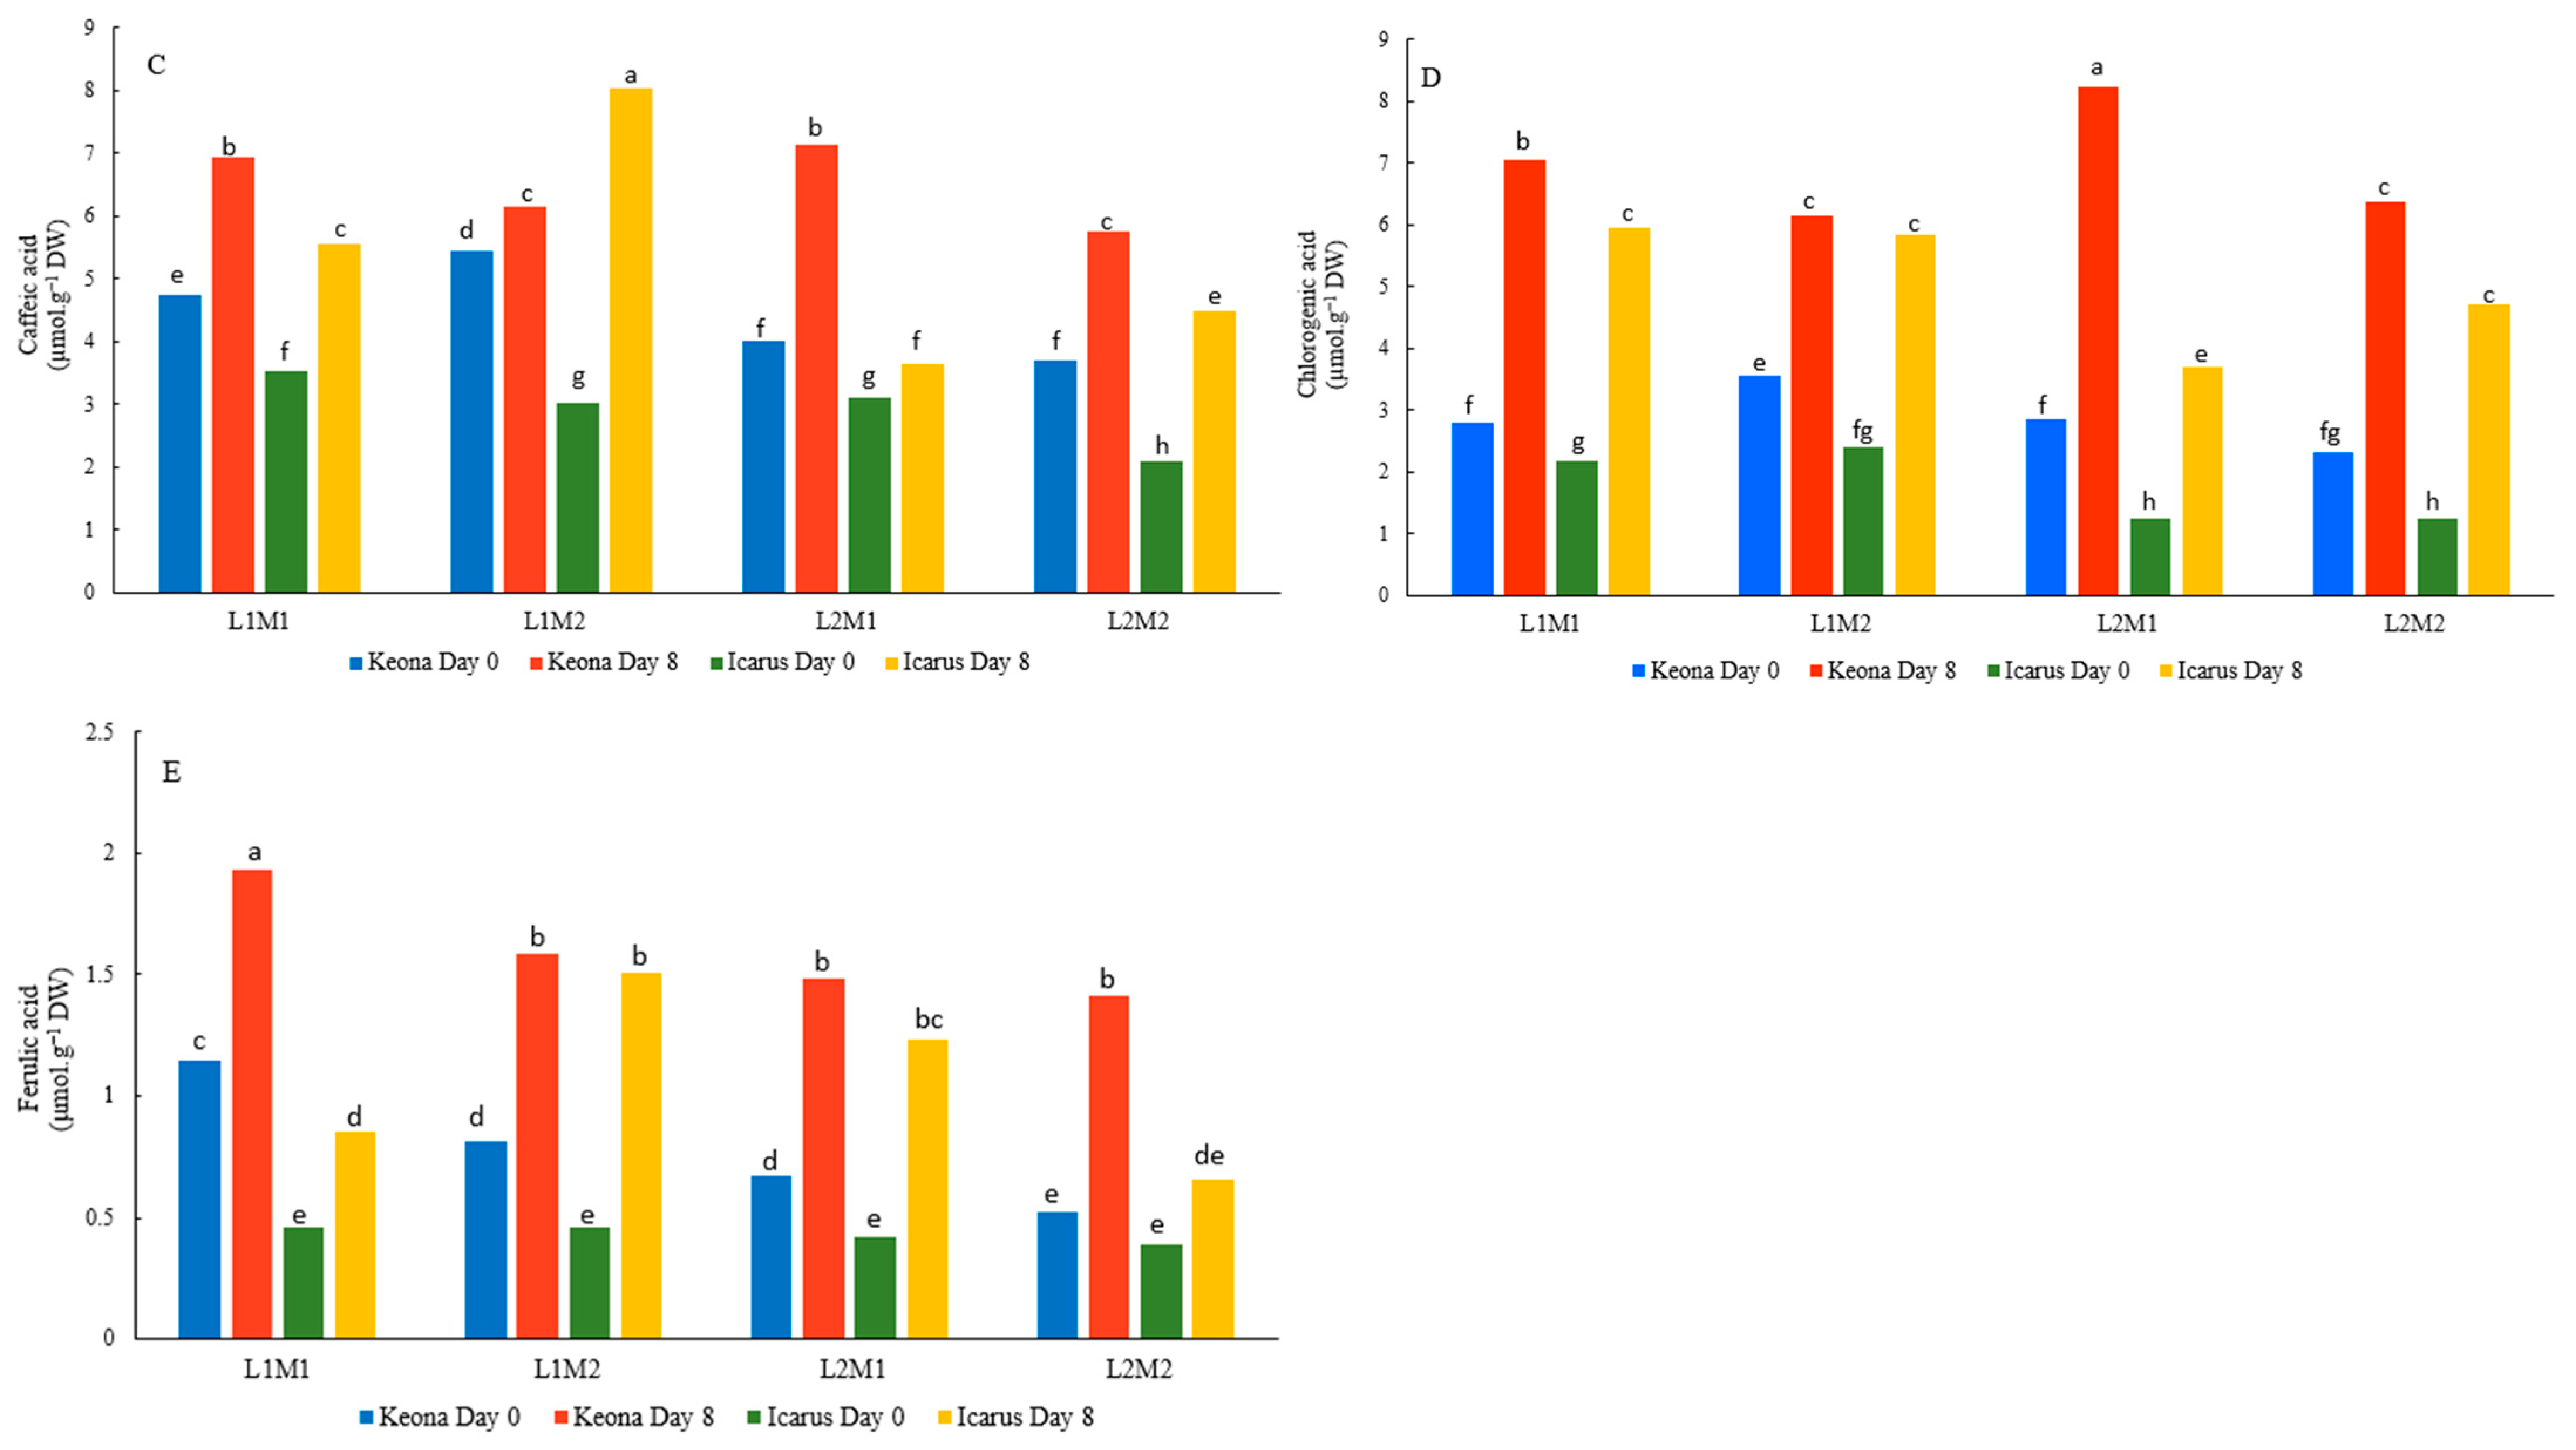
Concentrations of (A) cinnamic acid, (B) coumaric acid, (C) caffeic acid, (D) chlorogenic acid, and (E) ferulic acid of different harvest dates of two cultivars of Romaine lettuce with contrasting pinking sensitivity grown under different light intensities. Light intensity level: L1—558 µmol m−2 s−1, L2—244 µmol m−2 s−1; harvest date: M1—42 DAT, M2—49 DAT. Bars with similar letters indicate no significant difference according to Tukey’s HSD at p < 0.01.
3.2.2. Coumaric Acid
The initial concentration of coumaric acid in the midribs of Keona grown in high light intensity (558 µmol m−2 s−1) was higher than that of Icarus, regardless of harvest date (Figure 1B). In contrast, there were no differences in the concentration of coumaric acid in both cultivars when the plants were raised in low light intensity (244 µmol m−2 s−1) for both harvest dates.
The concentrations of coumaric acid increased significantly during storage, as shown by their values on day 8 of storage. The highest increase in coumaric acid upon storage occurred in Icarus in plants grown in high light intensity (L1) and harvested at M2 (49 DAT), with an increase of 4.2-fold from 0.59 to 2.48 µmol g−1 DW. The concentration of coumaric acid in L1M2 Icarus was 2.48 µmol g-1 DW, and this was significantly higher than its concentration in all other conditions. The final concentrations of coumaric acid in Keona measured on day 8 of storage were similar (not significantly different) for all treatments, with mean values ranging from 1.93 to 2.08 µmol g−1 DW.
3.2.3. Caffeic Acid
The overall trend of changes in caffeic acid in response to the treatment factors was similar to that of coumaric acid (Figure 1C). The initial concentration of caffeic acid in Keona was higher than that of Icarus, regardless of light intensity and harvest date. Overall, the average concentration of caffeic acid in both Keona and Icarus was 4.47 and 2.93 µmol g−1 DW, respectively, across light intensity and harvest date.
Similarly to coumaric acid, the concentration of caffeic acid was highest in Icarus grown under high light intensity (588 µmol m−2 s−1) and harvested at 49 DAT (M2), with its values of 8.04 µmol g−1 DW at day 8 of storage, which has increased from 3.03 µmol g−1 DW at day 0 of storage. The final concentration of caffeic acid for Icarus was lowest (3.63 µmol g−1 DW) in midribs of plants grown in low light with early harvest (M1, 42 DAT).
The concentrations of caffeic acid on day 8 of storage for Keona for L1M1 and L2M1 were similar (no significant difference), with their respective values 6.93 and 7.12 µmol g−1 DW, but the values were significantly higher than those of L1M2 and L2M2. There was no difference in the final concentration of caffeic acid in Keona harvested on 49 DAT (M2) regardless of light intensity, with their average value of 5.95 µmol g−1 DW.
3.2.4. Chlorogenic Acid
Light intensity, cultivar, and period of storage produced significant impacts on the concentration of chlorogenic acid (Figure 1D). The midribs of Keona from plants grown in high light intensity (L1, 558 µmol m−2 s−1) and harvested on 49 DAT (M2) contained the highest initial concentration of chlorogenic acid (3.55 µmol g−1 DW), and the value was significantly higher than the concentration of the metabolite in other treatment combinations for both Keona and Icarus. The initial concentration of the chlorogenic acid in Keona produced in other conditions (L1M1, L2M1, and L2M2) was not significantly different among themselves. For Icarus, there was no difference in the initial concentration of chlorogenic acid in L1M1 and L1M2 plants. Similarly, there were also no differences between the concentration of chlorogenic acid for Icarus plants in L2M1 and L2M2, suggesting that light intensity has a stronger influence on determining the concentration of chlorogenic acid than the date of harvest in Icarus.
Results in Figure 1D reveal that the concentration of chlorogenic acid increased markedly during storage. For Keona, the concentration of chlorogenic acid in midribs of early harvest leaves (M1, 42 DAT) was higher than that of M2 (49 DAT) leaves, regardless of light intensity. Midribs of Keona leaves harvested at M2, either grown in L1 or L2, contained similar concentrations of chlorogenic acid. Similarly to Keona, chlorogenic concentrations in Icarus also increased during the eight days of storage. The difference in the final concentrations of chlorogenic acid for L1M1, L1M2, and L2M2 was not significant, with their respective means of 5.94, 5.85, and 4.71 µmol g−1 DW. The concentration of the metabolite for L2M1 was the lowest (3.70 µmol g−1 DW).
3.2.5. Ferulic Acid
The initial concentration of ferulic acid in midribs of Keona was consistently higher than that in Icarus, except for L2M2, with the highest ferulic content (1.15 µmol g−1 DW) occurring in plants grown in high light intensity (L1, 558 µmol m−2 s−1) with early harvest (M1, 42 DAT) (Figure 1E). Keona grown in low light intensity (L2, 244 µmol m−2 s−1) with a more advanced harvest date (L2M2) contained the lowest initial ferulic acid. The initial concentration of ferulic acid in Icarus was similar for all light intensities and harvest dates.
The concentration of ferulic acid increased significantly during storage, and the final concentration of the compound was highest in L1M1 Keona (1.93 µmol g−1 DW). The final concentration of ferulic acid in other treatment combinations for Keona was not significantly different, ranging from 1.42 to 1.58 µmol g−1 DW. For Icarus, the increase in the concentration of ferulic acid on day 8 of storage occurred for plants grown in L1M1, L1M2, and L2M1 with their respective values of 0.86, 1.51, and 1.22 µmol g−1 DW. Compared with its initial concentration, the increase in ferulic acid during storage in Icarus, produced L2, and was harvested at 49 DAT, was not significant.
3.2.6. Sinapic Acid
Unlike other phenolic acids analysed, there was no interaction effect of affecting factors (light intensity, cultivar, harvest date, and period of storage) detected on the concentration of sinapic acid. As there was no significant interaction between the existing factors, the results are shown as a one-way table (Table 2). The results clearly showed that plants grown under high light intensity (L1, 558 µmol m−2 s−1) contained 16.6% more sinapic acid than those grown under low light intensity (244 µmol m−2 s−1). The high-pinking cultivar Keona was found to contain a higher concentration of sinapic acid compared to Icarus, a low-pinking cultivar. Midribs of plants harvested on 42 DAT contained a significantly higher concentration of sinapic acid (14.63 µmol g−1 DW) compared to its content in plants harvested at a more advanced stage (M2, 49 DAT). The concentration of sinapic acid increased by 72.6%, from 8.37 to 14.45 µmol g−1 DW on eight days of storage, across light intensity, cultivars, and date of harvest.
Table 2.
Concentration of sinapic acid in two cultivars of Romaine lettuce grown under two light intensities and two harvest dates and stored in cold storage for 8 days.
3.3. Soluble Sugars
3.3.1. Glucose
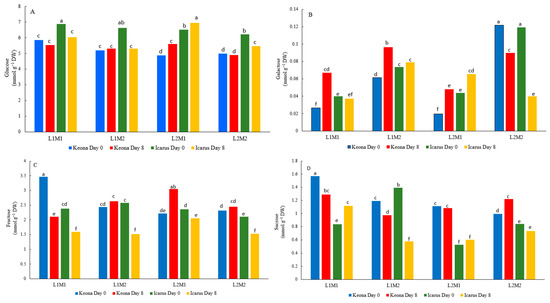
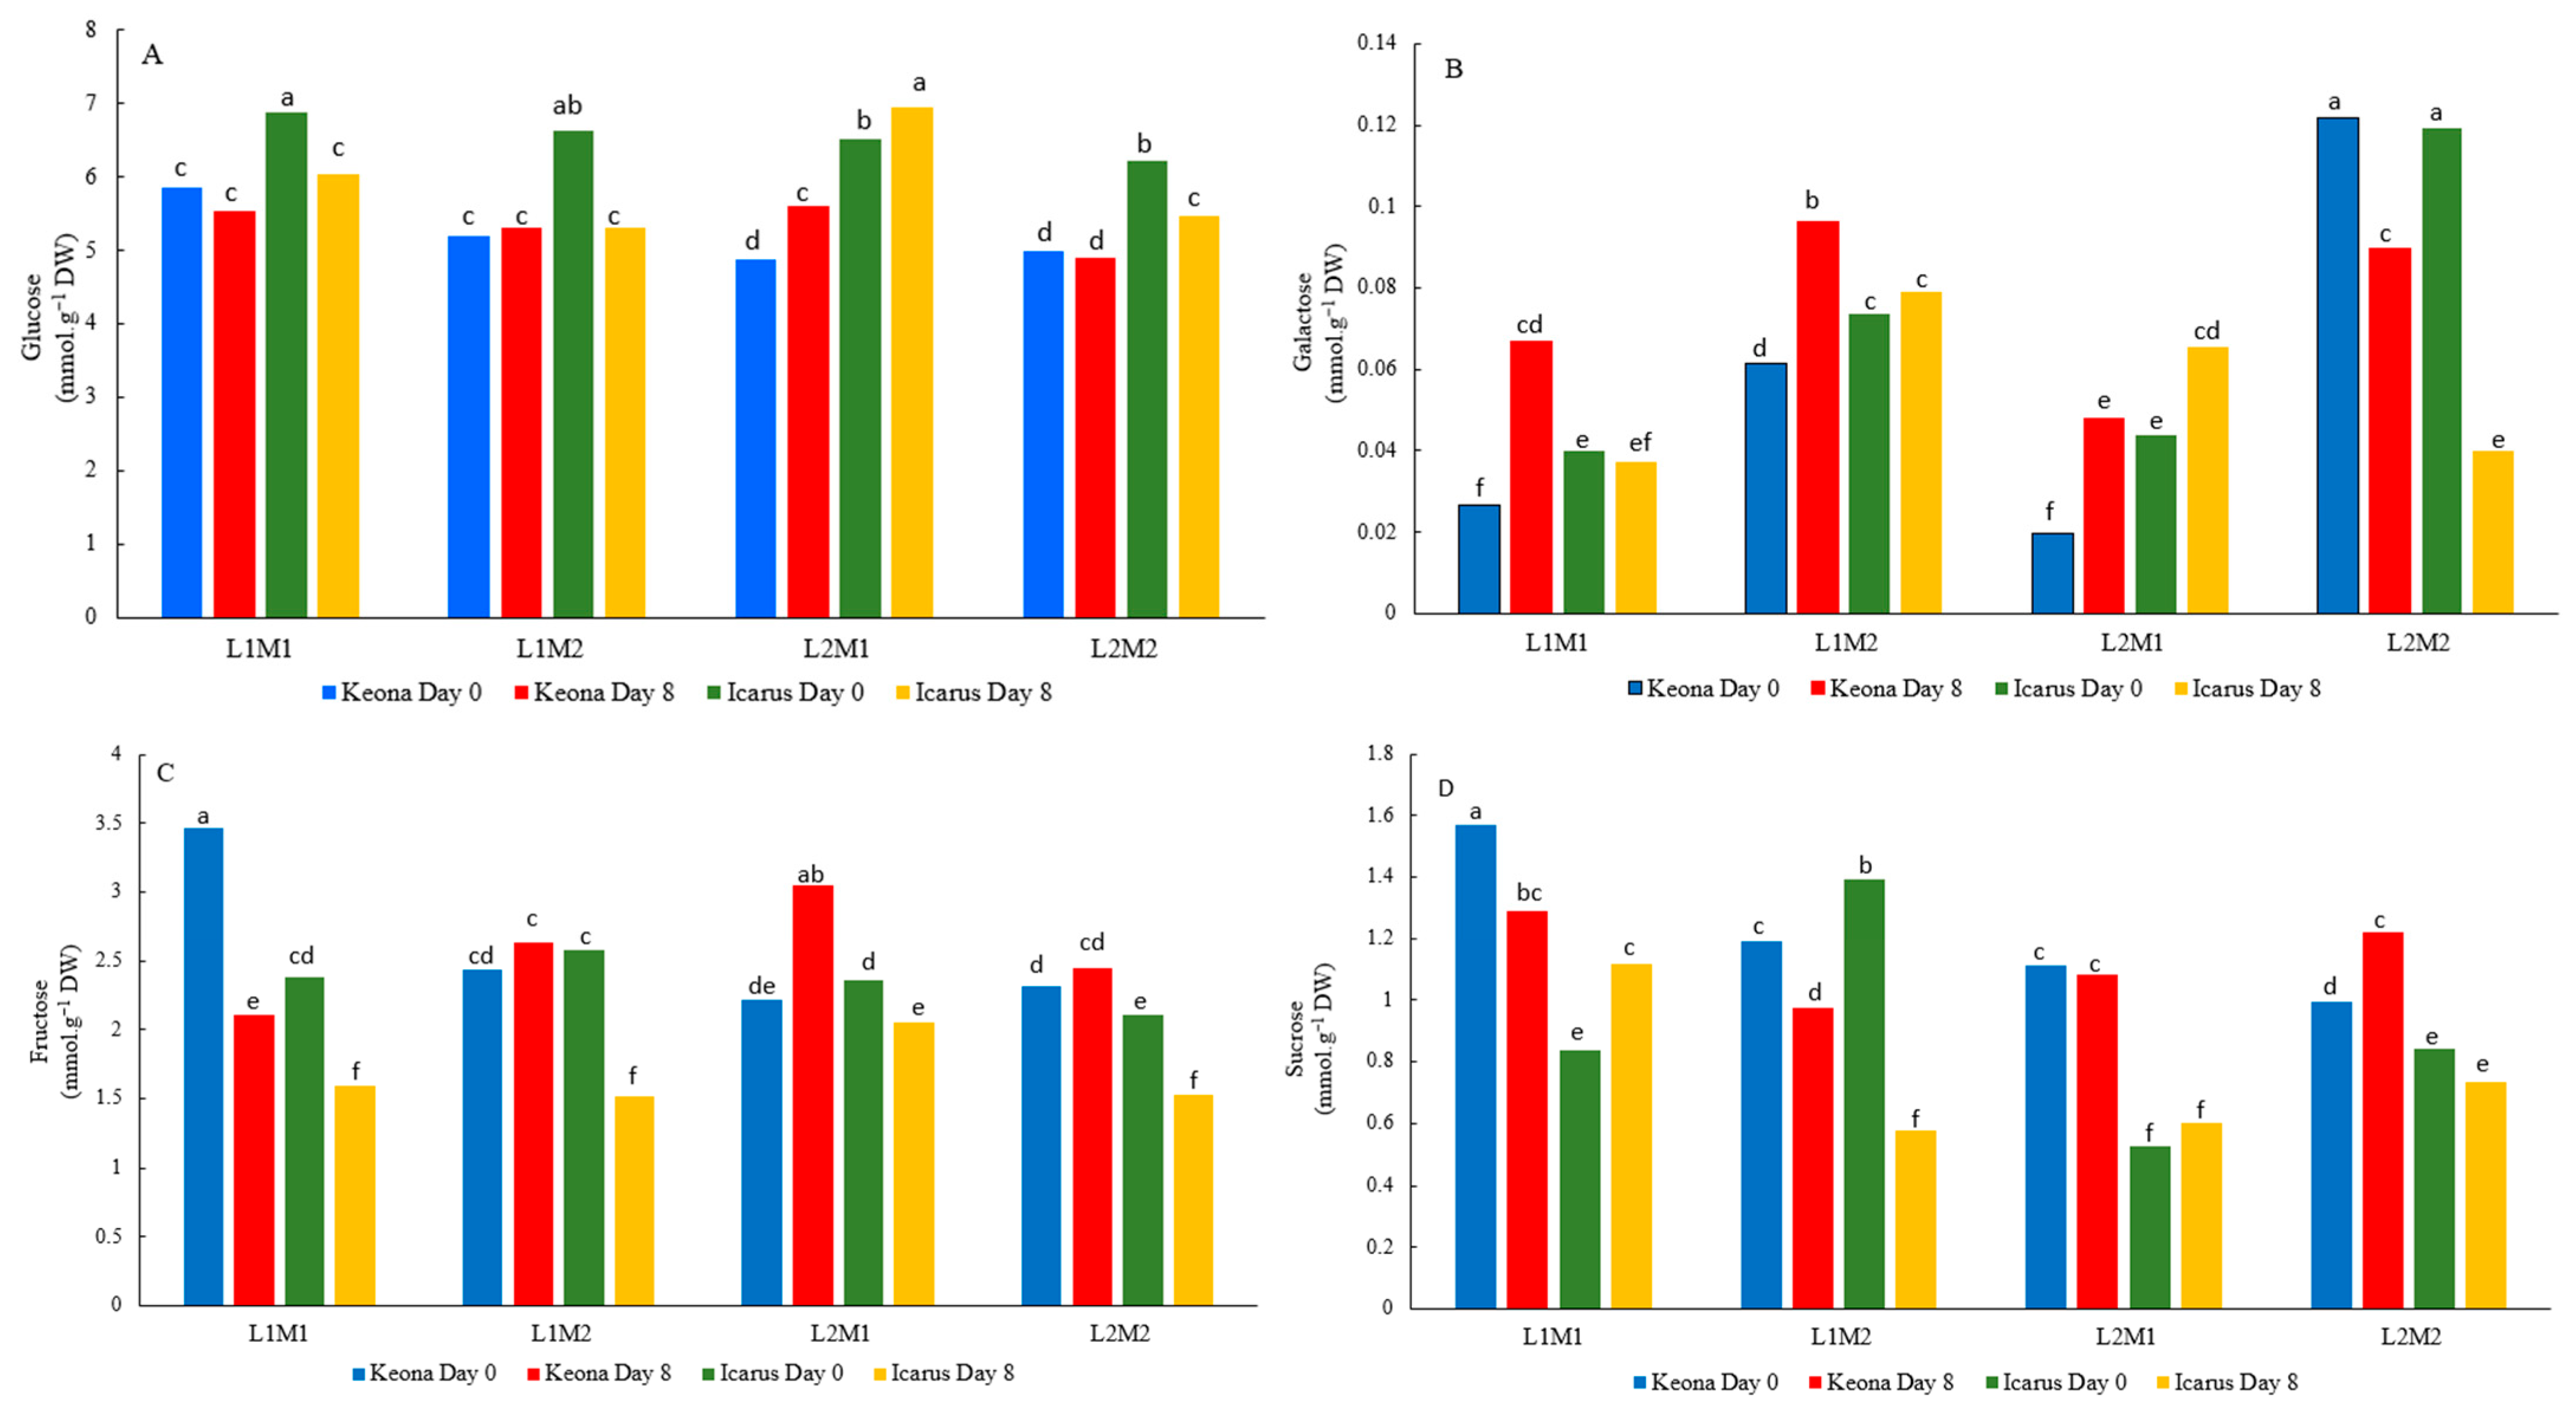
The initial concentration of glucose in midribs of Keona grown in L1 (558 µmol m−2 s−1) was higher than that of those grown in lower light intensity (L2, 244 µmol m−2 s−1) in both M1 (42 DAT) and M2 (49 DAT) (Figure 2A). However, there were no differences in the concentrations of glucose in the midribs between harvest dates at their respective light intensities. Midribs of Icarus consistently contained higher initial concentrations of glucose under all conditions. Icarus grown in L1 harvested at both dates possessed the highest concentration of glucose compared to other treatments.
Figure 2.
Concentrations of (A) glucose, (B) galactose, (C) fructose, and (D) sucrose in different harvest dates of two cultivars of Romaine lettuce with contrasting pinking sensitivity grown under different light intensities. Please refer to Figure 1 for details. Bars with similar letters indicate no significant difference according to Tukey’s HSD at p < 0.01.
Upon eight days of storage, the final glucose concentrations in Icarus were reduced significantly for L1M1, L1M2, and L2M2 treatments. In contrast, there was no significant reduction in the glucose levels L1M1, L1M2, and L2M2 for Keona during storage. For both cultivars, the glucose concentration in midribs of plants grown in low light with earlier harvest (M1) has increased upon storage.
3.3.2. Galactose
For both Keona and Icarus, the initial concentrations of galactose in the midribs were highest in plants grown in low light intensity (L2, 244 µmol m−2 s−1) with late harvest (M2, 49 DAT) (Figure 2B). This was followed by those grown in high light intensity (L1, 558 µmol m−2 s−1) and also with M2 harvest. Results in Figure 2B clearly show that M2 midribs contained consistently higher initial galactose concentrations than those harvested at M1 (42 DAT), regardless of light intensity.
Cold storage increased the concentration of galactose in the midribs of Keona produced in high light intensity (L1), regardless of harvest date (in both L1M1 and L1M2), as well as when the cultivar was raised in low light intensity with early harvest (L2M1). In contrast, the concentration of galactose in Icarus grown in high light intensities (L1), both for M1 and M2, did not increase during storage. An increase in galactose concentration in Icarus during storage occurred in the midribs of plants grown in L2 and harvested at M1. The final galactose concentrations in both Keona and Icarus grown in low light intensity with late harvest (L2M2) were reduced from their respective initial concentrations, from 0.122 to 0.090 mmol g−1 DW for Keona and from 0.119 to 0.040 mmol g−1 DW for Icarus.
3.3.3. Fructose
The initial concentration of fructose was highest (3.47 mmol g−1 DW) in Keona grown in the plant when grown in high light intensity (L1, 558 µmol m−2 s−1) and harvested on M1 (42 DAT) (Figure 2C). The initial fructose concentrations in Keona were similar for other treatment combinations. Unlike Keona, the initial concentrations of fructose in Icarus grown in high light with both harvest dates contained relatively higher concentrations of fructose than plants grown in low light. However, the difference in fructose concentration between L1M1 and L2M1 plants was not significant.
Changes in fructose concentration during the 8 days of storage for each cultivar varied significantly depending on growing light intensity and harvest date. Keona produced in high light intensity (L1) with M1 harvest displayed a significant reduction in fructose during storage, with a 39.5% reduction for eight days of storage. For other treatment combinations, the changes from initial concentration (day 0) to final concentration (day 8) were either unchanged (L1M2 and L2M2) or increased (L2M1). In contrast, the concentrations of fructose in Icarus were all decreased regardless of light intensity and harvest date. The largest decrease occurred in Icarus produced under L1 with M2 harvest (41.5%).
3.3.4. Sucrose
The midribs of both Keona contained the highest initial sucrose concentrations in plants grown in high light intensity with early harvest (L1M1). Initial sucrose contents in the midribs of Keona in L1M2 and L2M1 were similar, and their sucrose concentrations were higher than the concentration in plants grown in low concentration with a later harvest (L2M2) (Figure 2D). Contrarily, the concentrations of sucrose varied significantly among treatment combinations in Icarus, whereby the initial concentrations of glucose were in the order of L1M2 > L1M1 = L2M2 > L2M1, giving an indication that later harvest plants had enhanced the concentration of sucrose in the midribs for Icarus, regardless of light intensities.
The concentration of sucrose in midribs of Keona grown in high light intensity (L1M1 and L1M2) decreased significantly during storage, while the concentration of sucrose in Keona grown in low light either remained unchanged (L2M1) or increased (L2M2). At high light intensity, early harvest increased the sucrose content in Icarus during storage, but its concentration decreased with a later harvest. The concentration of sucrose for Icarus grown under low light intensity did not change during storage for both harvest dates.
3.4. Principal Component Analysis
Principal component analysis (PCA) was performed in order to deduce and track the changes in trait clusters in response to variation in light intensity, harvest date, and storage period for the two cultivars. Two separate analyses were carried out for phenolic acids and sugars. In each case, the pinking index was incorporated to explore the associations between the pinking index and phenolic acids and sugars, respectively.
3.4.1. Phenolic Acids
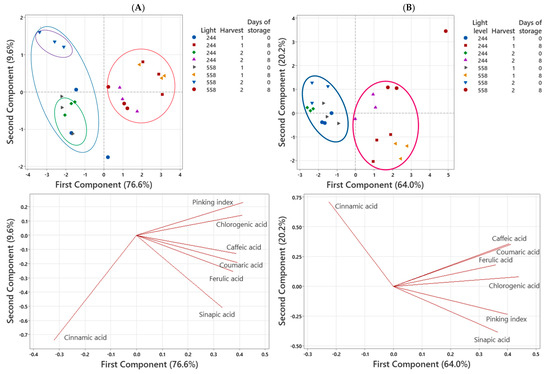
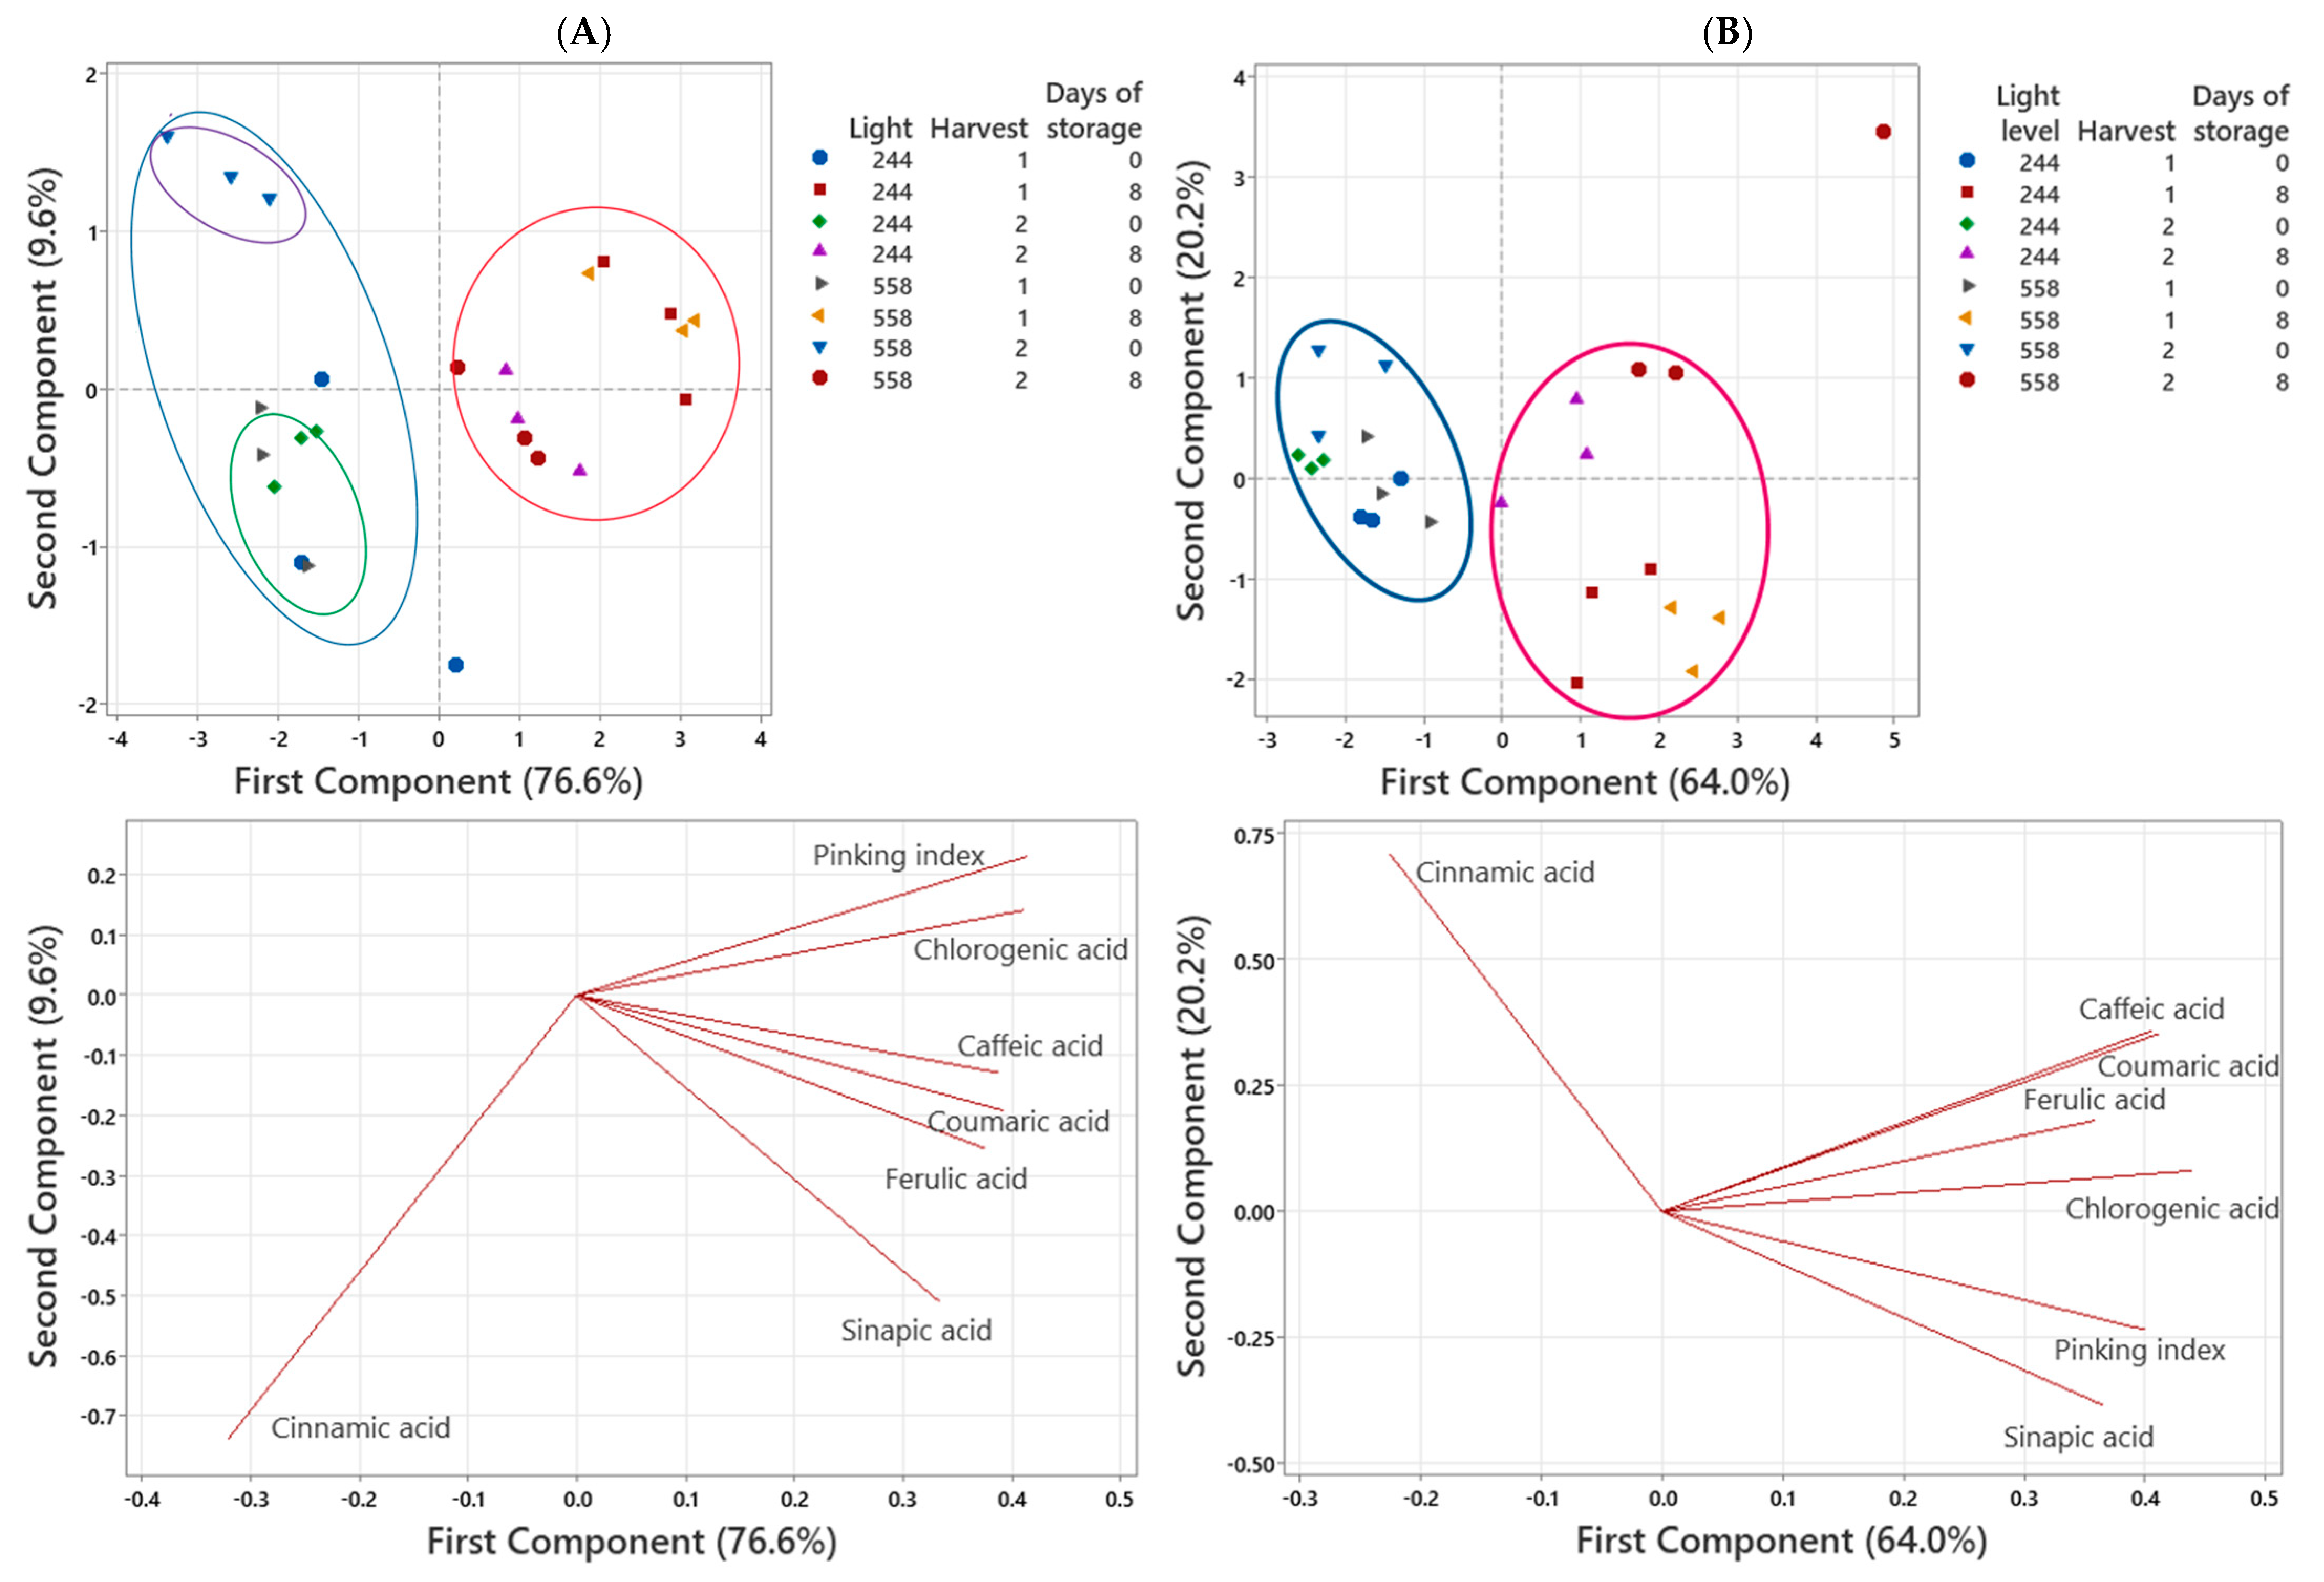
Results of PCA for phenolic acids and pinking are presented in Figure 3 and Table 3. The impacts of treatments on the distribution of individuals in the score plot was obvious. For both cultivars investigated, there was very clear separation between individuals that had undergone the 8 days of storage, which occupied the 1st and 2nd quadrants (red-circled) with positive correlation values in PC1, vs. those of day 0 of storage, which all the individuals are located in the 3rd and 4th quadrants (blue-circled) with negative correlation values in PC1 regardless of harvest date (Figure 3A,B). In Keona, on day 8 of storage, individuals grown in higher light intensity (L1) and harvested earlier (M1) had a higher score compared to those harvested later (M2) on PC1 (Figure 3A). Another example of clear separation among individuals recorded is for those grown in low light intensity harvested later (L2M2) with day 0 of storage (in the 4th quadrant, purple-circled) vs. those grown in similar light intensities and storage but with early harvest (M1), which are located in the 3rd quadrant (green-circled) on PC2 (Figure 3A). Some clear examples for Icarus include those grown in high light intensities (L1) and harvested later (M2) with 8 days of storage that have the highest score in PC1 vs. those grown under similar light intensity levels and storage but with earlier harvest (M1).
Figure 3.
Score plot (top) and loading plot (bottom) of principal component analysis (PCA) of phenolic acids and pinking index of two cultivars of Romaine lettuce grown at two light intensities, harvested at two different dates, and stored for two periods of storage. (A)—Keona, (B)—Icarus. Light level: L1—558 µmol m−2 s−1, L2—244 µmol m−2 s−1,; harvest: 1—42 DAT (M1), 2—49 DAT (M2). Period of storage: 0—0 days, 8—8 days. (Figure 3A): Data points grouped in coloured circles represent samples that had undergone 8 days of storage (red), 0 days of storage (blue), L2M2 at 0 days of storage (purple), and L2M1 at 0 days of storage (green). (Figure 3B): Data points grouped in coloured circles represent samples that had undergone 8 days of storage (red) and 0 days of storage (blue).
Table 3.
Eigenvectors (correlation coefficients) for phenolic acids and pinking index with respect to the two principal components (PCs).
The total variation in both PC1 and PC2 for Keona and Icarus is 86.2% and 84.1%, respectively (Figure 3). For Keona, chlorogenic acid, coumaric acid, caffeic acid, ferulic acid, and the pinking index were positively correlated with PC1, and this was clearly reflected in the loading plot. Cinnamic acid and sinapic acid were highly negatively correlated with PC2. For Icarus, the variations in correlations between phenolic acids with PC1 were similar to those shown for Keona, but with a weaker association. Coumaric acid, caffeic acid, chlorogenic acid, ferulic acid, sinapic acid, and the pinking index were positively associated with PC1. Cinnamic acid had a positive relationship, while sinapic acid and pinking are negatively associated with PC2.
3.4.2. Soluble Sugars
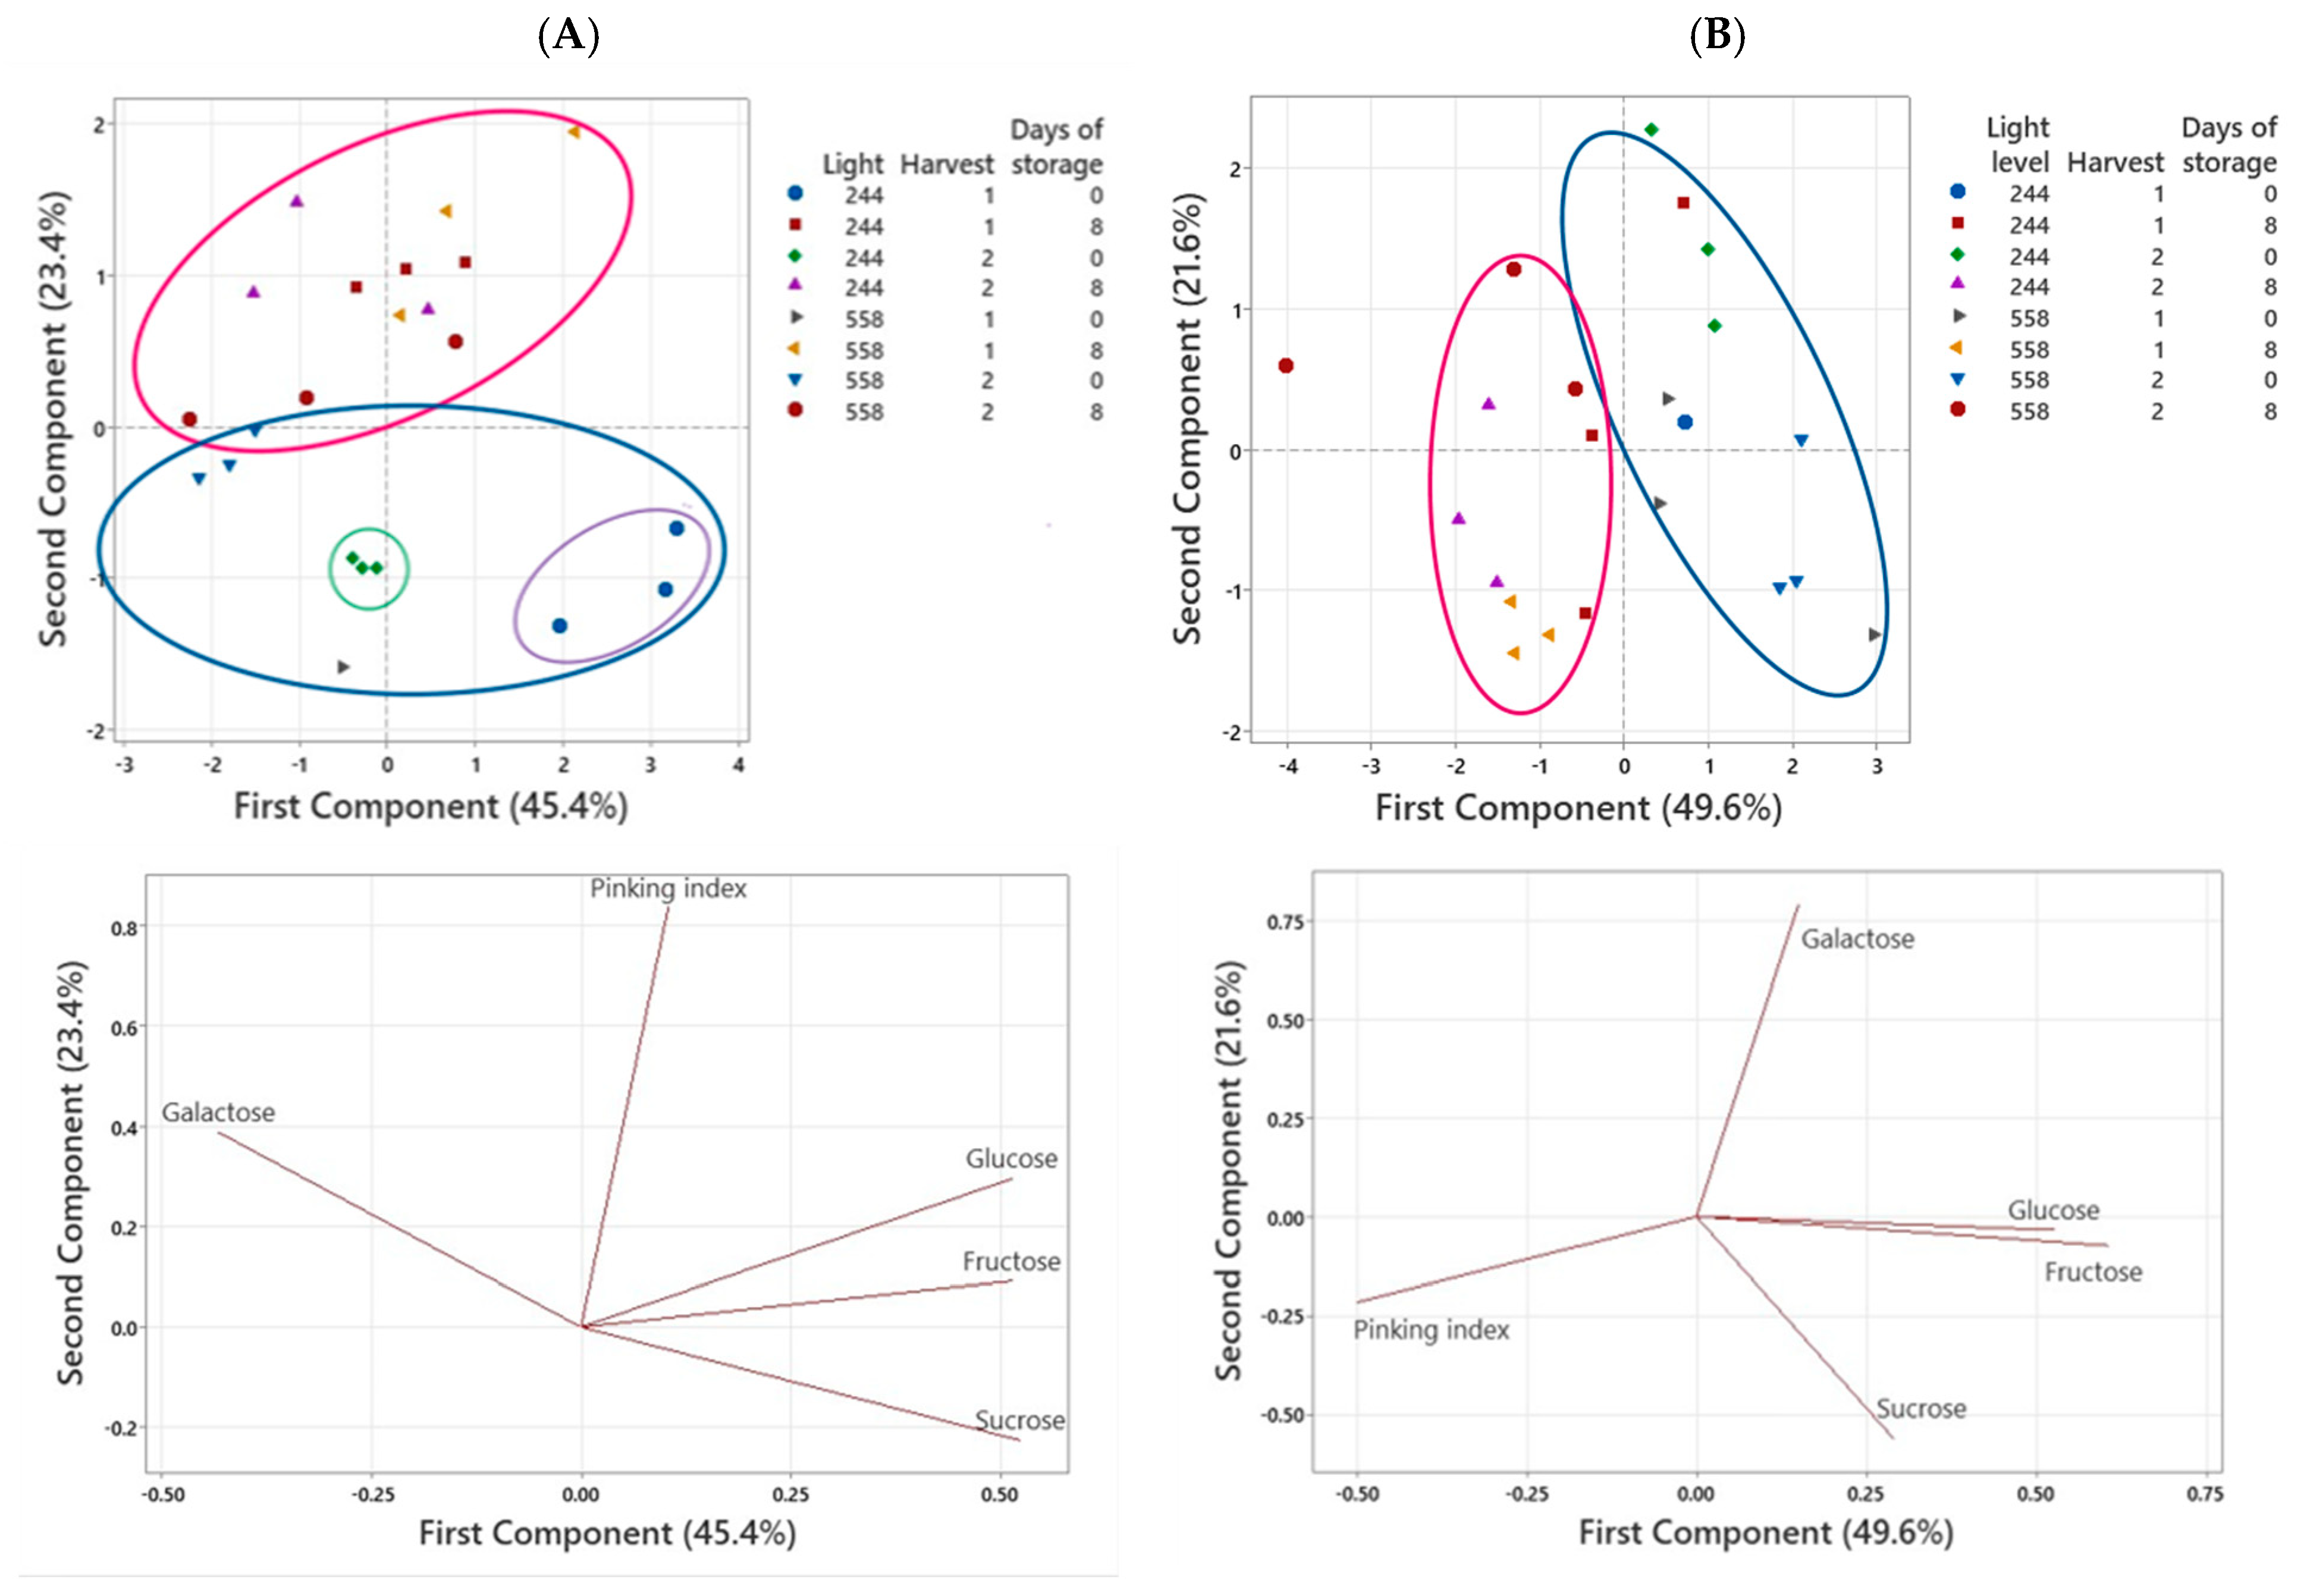
Figure 4 and Table 4 summarise the results of PCA for sugars for both cultivars. The total variance accounted for by PC1 and PC2 for Keona and Icarus was 68.8% and 71.2%, respectively. The score plot clearly shows that the distribution of elements for individuals can be grouped into several categories. In Keona, all individuals for 8 days of storage are situated in the 1st and 4th quadrants (red-circled) with a positive score on PC2, while those for 0 days of storage are located in the 2nd and 3rd quadrants (blue-circled) (Figure 4A). Midribs of leaves produced in high light intensities (L1), with early harvest (M1) and 0 days of storage, are located in the 2nd quadrant (purple-circled) (positive value in PC1, negative value in PC2), while those grown in similar light intensity (L1) and storage period but harvested later (M2) are located in the 3rd quadrant (green-circled) with negative PC1 and PC2 values (Figure 4A). Unlike Keona, individuals for Icarus that have been subjected to different storage periods were mainly separated along PC1, whereby all individuals with 8 days of storage are sequestered in the 3rd and 4th quadrants (red-circled), while those with 0 days of storage are situated in the 1st and 2nd quadrants (blue-circled) (Figure 4B).
Figure 4.
Score plot (top) and loading plot (bottom) of principal component analysis (PCA) of sugars and pinking index of two cultivars of Romaine lettuce grown at two light intensities, harvested at two different dates, and stored for two periods of storage. (A)—Keona, (B)—Icarus. Light level: L1—558 µmol m−2 s−1, L2—244 µmol m−2 s−1,; harvest: 1—42 DAT (M1), 2—49 DAT (M2). Period of storage: 0—0 days, 8—8 days. (Figure 4A): Data points grouped in coloured circles represent samples that had undergone 8 days of storage (red), 0 days of storage (blue), L1M1 at 0 days of storage (purple), and L1M2 at 0 days of storage (green). (Figure 4B): Data points grouped in coloured circles represent samples that had undergone 8 days of storage (red) and 0 days of storage (blue).
Table 4.
Eigenvectors (correlation coefficients) for sugars and pinking index with respect to the two principal components (PCs).
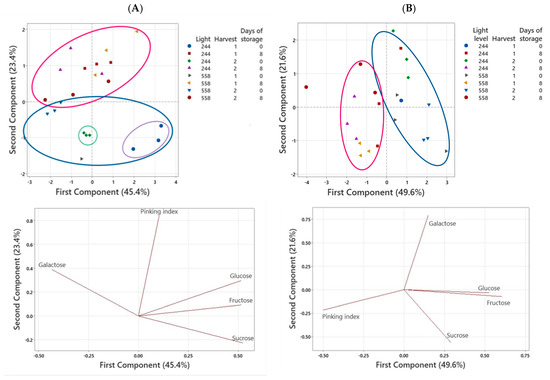
In Keona, glucose, fructose, and sucrose correlated positively with PC1, while galactose had a negative correlation (Table 4, Figure 4). All traits in PC1 did not correlate with the pinking index. The pinking index correlated positively with PC2. Contrary to Keona, glucose and fructose are positively correlated, while the pinking index is negatively correlated with PC1 in Icarus. This association did not exist in Keona, suggesting that Icarus with high glucose and fructose would be expected to have low pinking development.
4. Discussion
The pinking development in the midribs of the lettuce used in the study, after the 8 days of cold storage, prepared using Icarus was reduced compared to the one prepared using Keona. The use of Icarus would definitely be advantageous in reducing the extent of pinking in fresh-cut lettuce. However, the pinking development of midribs of the leaves during storage was clearly modified when the plants were harvested at different dates, especially using those grown under different light intensity levels. As observed in this study, harvesting Keona, a high-pinking cultivar, at an older stage of plants grown in high light intensities triggers a higher pinking development during storage. However, a contrasting result was obtained with Icarus, a low-pinking cultivar, whereby the pinking index after 8 days of cold storage was not significantly affected by harvest date when the plants were grown in similar high-light intensity levels.
Our results may explain the inconsistency of results on oxidative, enzymatic discolouration development of lettuce reported by earlier researchers. For browning discolouration, working with whole-head lettuce, Barg et al. [21] found that immature heads show a higher intensity of browning in whole-head discolouration than mature heads. Kang et al. [15] found young, immature heads of lettuce possessed the highest browning discolouration intensity compared to other heads harvested at more advanced stages, i.e., at the other three stages—mature, pre-bolting, and over-mature lettuce. In fresh-cut lettuce as used in this study, Hilton et al. [16] reported that pinking was more intense in processed lettuce prepared from over-mature lettuce than in tissues from young or mature plants.
Polyphenol oxidase (PPO) plays a central role in mediating enzymatic oxidation leading to pinking of lettuce [22,23,24]. However, there was evidence showing that increasing PPO activity was not coupled with the tissue discolouration [25,26]. The existence of discrepancies in the correlation between the activity of PPO and the discolouration of tissue in lettuce suggests an oversimplification of the processes involved in the phenylpropanoid pathway, as not all the precursors in the phenylpropanoid pathway will end up being red–pink-coloured compounds. In this study, PPO activity was not determined. In our earlier study involving leaves of different positions of the head core of Romaine lettuce, which could represent leaves of different ages, was conducted. The results obtained show that midribs of younger leaves had a significantly higher activity of PPO; however, the midribs of the leaves had the lowest index of pinking [27].
To further explain the variations in pinking development in fresh-cut lettuce, various phenolic acids and sugars were analysed. In the phenylpropanoid pathway, cinnamic acid is the first phenolic acid formed when phenylalanine is converted to the compound by PAL. Therefore, the reduction in cinnamic acid during storage is expected as the metabolite is being continuously converted to hydroxycinnamic acids, including coumaric acid, caffeic acid, chlorogenic acid, and ferulic acid. Therefore, higher initial concentrations of cinnamic acid would be an important precondition for the higher development of pinking discolouration in lettuce to occur. Under L1M1 and L2M1 conditions, a higher proportion of cinnamic acid could have been converted to other phenolic acids, as shown by their higher reduction on the 8th day of cold storage. Formation of a higher concentration of caffeic acid, which is then converted to caffeic acid o-quinone, would lead to higher pinking. For this reason, cinnamic acid displayed negative correlations with the pinking index and with other phenolic acids in the PCA (Figure 3).
It is interesting to note that the concentration of cinnamic acid in L2M2 Keona leaves increased after 8 days of cold storage. This was also coupled with a small but significant decrease in the metabolite in L2M2 Icarus leaves. The results recorded here are in contrast to the generally accepted knowledge that the concentration of the phenolic would generally be reduced during storage, but the present result showed otherwise. It was reported that low light, especially under low temperature, could induce the bound ortho-hydroxy-cinnamic acid in plants [28], and it will be released as the concentration of free cinnamic acid in cells is depleted. Enhancement of certain types of phenolic compounds at low-light conditions was also reported by Xu et al. [29] in Eleutherococcus senticosus and Zhang et al. [20] in many plant species. This could be the reason behind the unexpected increase in cinnamic acid during storage, despite being constantly converted to its derivatives, as shown in Figure 1A.
All other phenolic acids analysed increased over the cold storage and have positive correlations with the pinking index, affirming the role of phenolic acids in influencing the pinking development in lettuce. High-light intensity treatments promoted the biosynthesis of the phenolics, but their concentrations varied according to cultivars and harvest date. This phenomenon can be seen as changing light intensity had produced a more pronounced effect on coumaric acid in the high-pinking cultivar (Keona). Growing the low-pinking cultivar (Icarus) under high light intensities and harvesting it a week later has aggravated the increase in coumaric acid in its midribs during cold storage. A similar trend was also observed for caffeic acid. As the coumaric acid was positively correlated with caffeic acid, both phenolics will change together in a similar direction, as shown by PCA results. The high concentration of caffeic acid in Keona and its low concentration in Icarus could have directly contributed to the severity of pinking seen in the respective cultivar.
The increase in the concentrations of coumaric acid and caffeic acid during storage in the later harvest lettuce (M2) was higher than the corresponding values in the less mature plants (M1). This is in contrast to chlorogenic acid, where the increase in its concentration on day 8 of storage was higher in the tissue of leaf midribs prepared using immature plants compared to the tissues from more mature plants. The results suggest that there will be a higher affinity for caffeic acid to accumulate in more mature lettuce, while chlorogenic acid would be inclined to accumulate in immature heads. Therefore, as caffeic acid is responsible for the formation of caffeic acid o-quinone, which is associated with pinking discoloration, fresh-cut lettuce prepared from a more mature head would have a higher pinking intensity than those prepared using immature lettuce, as seen in the midribs of Keona produced in the L1M2 condition. On the other hand, chlorogenic acid is a colourless compound, and its o-quinones are green in colour. Further reactions of chlorogenic acid with other substances, such as amino acids, proteins, and other phenolic compounds, yielded polymers that contributed to the browning discolouration of lettuce [2]. Therefore, early harvest may contribute to higher browning, as reported by Barg et al. [21].
Differences in the pinking in the midribs of different leaves harvested at different harvest dates could be associated with cell flexibility. Cells of young tissues have flexible cell walls that can stretch and deform; therefore, these cells would have a lower degree of damage upon receiving similar wound cuts than the cells of old plant tissues.
In addition, two other types of phenolic acids, ferulic acid and sinapic acid, were also determined in this study. Both metabolites are precursors for lignin biosynthesis [12,14]. In the context of the fresh-cut industry of vegetables, lignification of tissues could be associated with wound-healing processes of the cut edges of the leaves. Biosynthesis of these two phenolics is derived from caffeic acid, thus competing for the same substrate for the formation of caffeic acid o-quinone. When the plants are grown under conditions favouring the synthesis of ferulic acid and sinapic acid, e.g., when the plants are subjected to stress conditions [30,31], less caffeic acid will be diverted into pinking-forming compounds, thus reducing pinking severity. Therefore, under such a situation, both phenolics (ferulic acid and sinapic acid) would have negative correlations with pinking, as seen in PC2 for both cultivars (Figure 3).
Clear separation among phenolic acids between day 0 and day 8, shown in Figure 3, was expected as it reflects the biochemical processes and formation of different phenylpropanoids. Overall, cinnamic acid was largely present on day 0, and other phenolic acids were mostly abundant on day 8, which reflects the conversion of cinnamic acid to its derivatives in the pathway, thus contributing to the pinking. Chlorogenic acid, although it appeared to be closely related to pinking, actually did not contribute to pinking development since the derivatives of chlorogenic acid are not red-pinkish in colour.
Among the sugars analysed, changes in glucose and sucrose concentrations reflect the photosynthetic capacity and carbohydrate assimilation in the leaves. Glucose is a primary product of photosynthesis and is required by plant tissues for the generation of energy during respiration, while sucrose is the major form of sugar stored in plants. Between the two cultivars used in the study, it seems that Icarus contained a higher initial concentration of glucose under both light intensity levels, regardless of harvest date, compared to Keona. As the measurement of glucose was taken in midribs more than 24 h after harvest, a higher concentration of glucose, however, did not reflect the photosynthetic capacity of the plants anymore but represented the results of interconversion between glucose and sucrose to satisfy their physiological needs. This is somewhat different from what was observed for sucrose, whereby Keona had a higher level of sugar in storage form (sucrose). Tissue discolouration is an indicative form of tissue damage, and cells need to counter-react to reduce the incidence; this repair process is an energy-demanding process [31,32], thus reducing the overall sugar level in plant tissues.
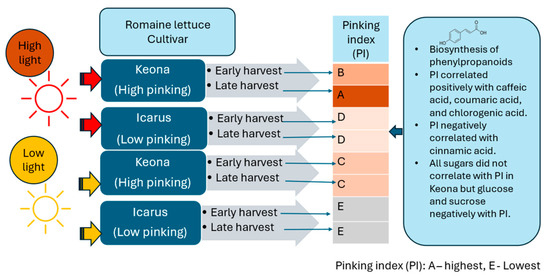
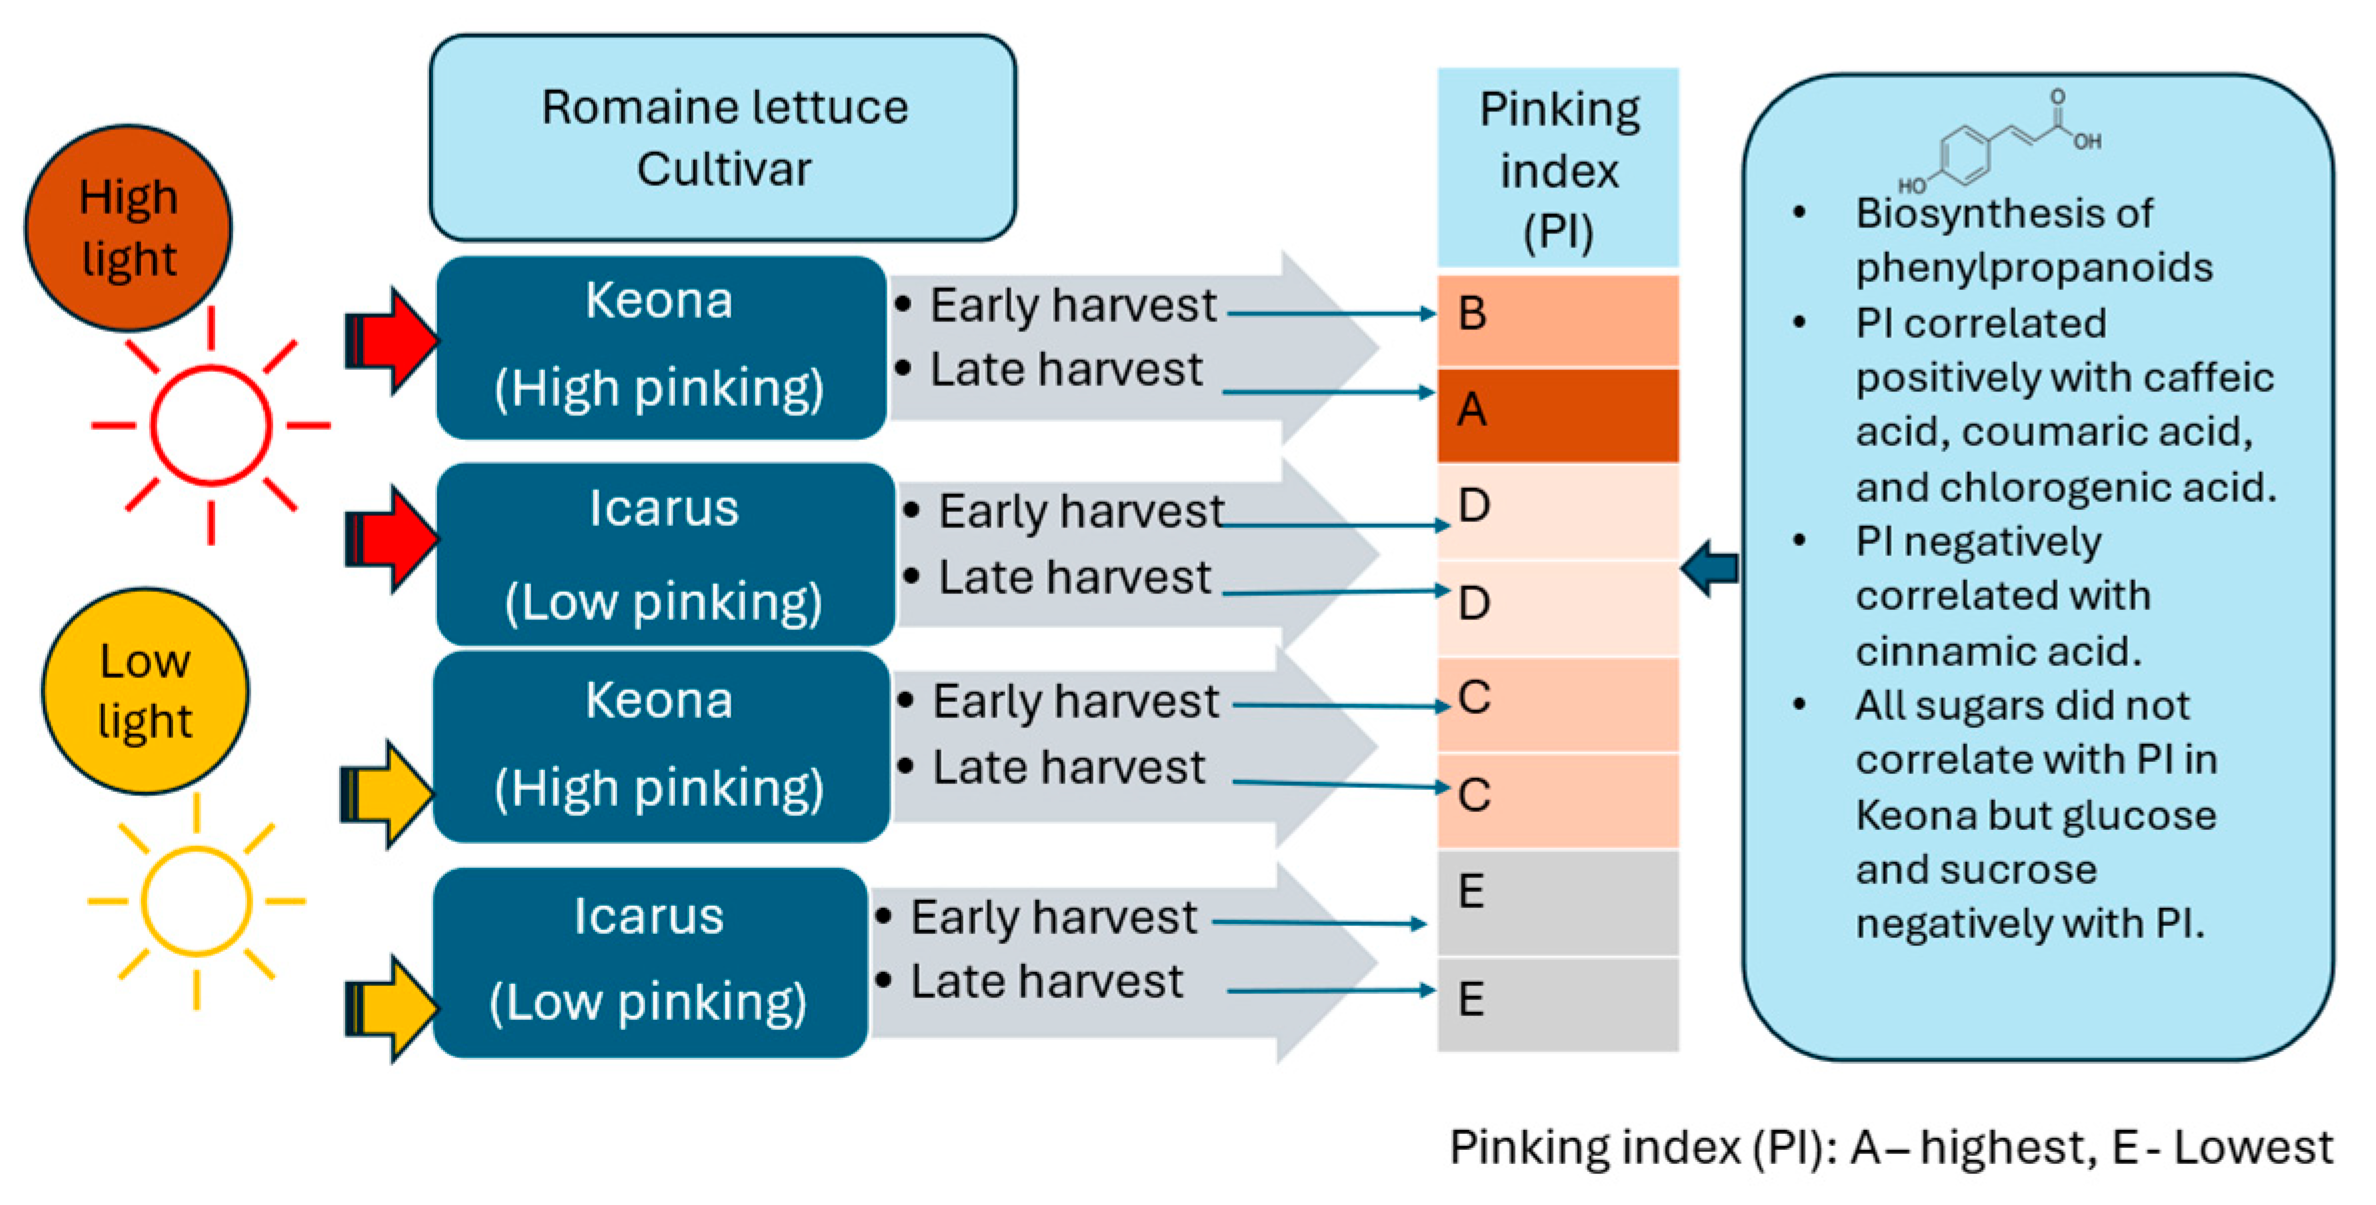
This could be one of the reasons for the low incidence of pinking discolouration in Icarus. This hypothesis is supported by the results of PCA (Figure 4). In Icarus, glucose, fructose, and sucrose were negatively correlated with the pinking index. The pinking index of Keona did not correlate with sucrose. The evidence indicates the complexity of tissue discolouration in lettuce. The levels of pinking are not only linked to the biosynthesis of hydroxycinnamic acids (coumaric acid, caffeic acid, chlorogenic acid, and ferulic acid), but they may also depend on the supply of energy. Perhaps for the same reason, Wurr et al. [17] reported that despite dissimilarity in browning discolouration of lettuce with different maturity levels, they observed that immature, mature, and over-mature lettuce heads contained similar levels of phenolic compounds (except for cinnamic acid). In our case, however, high pinking was associated with high phenolic compounds, which might contribute to high antioxidant capacity. In addition, fresh produce with high sugar content would have a longer shelf life [23] and taste sweeter, which are traits preferred by most consumers. To have a clear picture of the effects of light intensity, cultivar, and harvest date, a schematic diagram is presented in Figure 5.
Figure 5.
Schematic diagram summarising the effects of light intensity, cultivars, and harvest date on the pinking of Romaine lettuce and its possible relationship with phenolic acids.
5. Conclusions
Pinking development in plant tissue is a complex process. It involves the formation of many red-pinkish-coloured metabolites that are derived from phenylpropanoids. The relationship between pinking and the concentration of phenolic acids, particularly caffeic acid and its derivatives, could interplay with its physiological needs for wound healing, which is caused by leaf cutting and handling during processing. Apparently, tissues with high-soluble sugars may play a role in reducing their discolouration. For the fast, high-pinking cultivar, Keona, early harvest was found to be beneficial in reducing pinking development when the plants are grown in high-light conditions. Harvest date did not affect the pinking of the low-pinking cultivar (Icarus).
Author Contributions
Conceptualisation and methodology, M.H.Y., M.C. and C.W.; investigation and data analysis, M.H.Y.; supervision and monitoring, M.C. and C.W.; writing—original draft preparation, M.H.Y.; writing—review and editing, M.C. and C.W. All authors have read and agreed to the published version of the manuscript.
Funding
This research was made possible by the Majlis Amanah Rakyat (MARA), Ministry of Rural and Regional Development, Government of Malaysia, through financial support granted to M.H.Y.
Data Availability Statement
The original contributions presented in this study are included in the article. Further inquiries can be directed to the corresponding authors.
Acknowledgments
This study was funded by the MARA, Ministry of Rural and Regional Development, Government of Malaysia, granted to M.H.Y. for his PhD programme. Cooperations rendered by Rijk Zwaan Netherlands B.V. and Rijk Zwaan UK Ltd. are highly acknowledged for supplying the seeds used in the study. Special thanks to members of the Wagstaff group in the Department of Food and Nutritional Sciences, University of Reading, for research direction and technical assistance.
Conflicts of Interest
The authors declare no conflicts of interest.
References
- Damerum, A.; Chapman, M.A.; Taylor, G. Innovative breeding technologies in lettuce for improved postharvest quality. Postharvest Biol. Technol. 2020, 168, 111266. [Google Scholar] [CrossRef] [Scilit]
- Saltveit, M. Pinking of lettuce. Postharvest Biol. Technol. 2018, 45, 41–52. [Google Scholar] [CrossRef] [Scilit]
- Woltering, E.J.; Witkowska, I.M. Effects of pre- and postharvest lighting on quality and shelf life of fresh-cut lettuce. Acta Hortic. 2016, 1134, 357–365. [Google Scholar] [CrossRef] [Scilit]
- Suthumchai, W.; Toshiyuki, M.; Kawada, K.; Yusuke, K. Sugar metabolizing enzymes activities in lettuce head during low temperature storage. Asian J. Plant Sci. 2007, 6, 568–576. [Google Scholar] [CrossRef] [Scilit]
- Kim, M.J.; Moon, Y.; Tou, J.C.; Mou, B.; Waterland, N.L. Nutritional value, bioactive compounds and health benefits of lettuce (Lactuca sativa L.). J. Food Compos. Anal. 2016, 49, 19–34. [Google Scholar] [CrossRef] [Scilit]
- Peng, H.; Simko, I. Extending lettuce shelf life through integrated technologies. Curr. Opin. Biotechnol. 2023, 81, 102951. [Google Scholar] [CrossRef] [Scilit]
- Flores, M.; Urrestarazu, M.; Amorós, A.; Escalona, V. High intensity and red enriched LED lights increased the growth of lettuce and endive. Ital. J. Agron. 2022, 17, 1915. [Google Scholar] [CrossRef] [Scilit]
- Dai, M.; Tan, X.; Ye, Z.; Ren, J.; Chen, X.; Kong, D. Optimal light intensity for lettuce growth, quality, and photosynthesis in plant factories. Plants 2024, 13, 2616. [Google Scholar] [CrossRef] [Scilit]
- Yahya, M.H.; Chadwick, M.; Wagstaff, C. The effect of supplementary LED illumination of Romaine lettuce on midribs pinking after harvest. J. Hortic. Sci. Biotechnol. 2025, 101, 185–200. [Google Scholar] [CrossRef] [Scilit]
- Atkinson, L.D.; McHale, L.K.; Truco, M.J.; Hilton, H.W.; Lynn, J.; Schut, J.W.; Mitchelmore, R.W.; Hand, P.; Pink, D.A.C. An intra-specific linkage map of lettuce (Lactuca sativa) and genetic analysis of postharvest discolouration traits. Theor. Appl. Gen. 2014, 126, 2737–2752. [Google Scholar] [CrossRef] [Scilit] [PubMed]
- Hunter, P.J.; Chadwick, M.; Graceson, A.; Hambidge, A.; Hand, P.; Heath, J.; Lignou, S.; Oruna-Concha, M.J.; Pink, D.; Rada, B.; et al. Elucidation of the biochemical pathways involved in two distinct cutsurface discolouration phenotypes of lettuce. Postharvest Biol. Technol. 2022, 183, 111753. [Google Scholar] [CrossRef] [Scilit]
- Humphreys, J.H.; Hemm, M.R.; Chapple, C. New routes for lignin biosynthesis defined by biochemical characterization of recombinant ferulate 5-hydroxylase, a multifunctional cytochrome P450-dependent monooxygenase. Proc. Natl. Acad. Sci. USA 1999, 96, 10045–10050. [Google Scholar] [CrossRef] [Scilit]
- García, C.J.; Gil, M.I.; Tomás-Barberán, F.A. Targeted metabolomics analysis and identification of biomarkers for predicting browning of fresh-cut lettuce. J. Agric. Food Chem. 2019, 67, 5908–5917. [Google Scholar] [CrossRef] [Scilit]
- Almeida, A.M.; Reis, D.; Pilau, E.J.; Lima, R.B.; Constantin, R.P.; Marchiosi, R.; Ferrarese-Filho, O.; Santos, W.D. Soybean and maize differentially metabolize deuterated ferulic and sinapic acids before polymerizing them into the root cell wall. Curr. Plant Biol. 2024, 38, 100333. [Google Scholar] [CrossRef] [Scilit]
- Kang, Y.J.; Choi, J.H.; Jeong, M.C.; Kim, D.M. Effect of maturity at harvest on the quality of head lettuce during storage. Korean J. Hortic. Sci. Technol. 2008, 26, 272–276. [Google Scholar]
- Hilton, H.W.; Clifford, S.C.; Wurr, D.C.E.; Burton, K.S. The influence of agronomic factors on the visual quality of field-grown, minimally-processed lettuce. J. Hortic. Sci. Biotechnol. 2009, 84, 193–198. [Google Scholar] [CrossRef] [Scilit]
- Wurr, D.; Parr, A.; Feuerhelm, S.; Kennedy, S.; Pennings, H.; Oost, E.; Cornai, I.; Harriman, M.; Sawday, J.; Tucker, A. Improving the Quality and Shelf-Life of Cut Salad Products; DEFRA Final Rep. Project No. HLO142; (CSA 4969, HORT 232); Department for Environment, Food and Rural Affairs: London, UK, 2003.
- Viacava, G.E.; Gonzalez-Aguilar, G.; Roura, S.I. Determination of phytochemicals and antioxidant activity in butterhead lettuce related to leaf age and position. J. Food Biochem. 2014, 38, 352–362. [Google Scholar] [CrossRef] [Scilit]
- Chutimanukul, P.; Piew-ondee, P.; Dangsamer, T.; Thongtip, A.; Janta, S.; Wanichananan, P.; Thepsilvisut, O.; Ehara, H.; Chutimanukul, P. Effects of light spectra on growth, physiological responses, and antioxidant capacity in five radish varieties in an indoor vertical farming system. Horticulturae 2024, 10, 1059. [Google Scholar] [CrossRef] [Scilit]
- Zhang, S.; Zhang, L.; Zou, H.; Qiu, L.; Zheng, Y.; Yang, D.; Wang, Y. Effects of light on secondary metabolite biosynthesis in medicinal plants. Front. Plant Sci. 2021, 12, 781236. [Google Scholar] [CrossRef] [Scilit] [PubMed]
- Barg, M.; Aguero, M.V.; Yommi, A.; Rouira, S.I. Evolution of plant water status indices during butterhead lettuce growth and its impact on post-storage quality. J. Sci. Food Agric. 2009, 89, 422–429. [Google Scholar] [CrossRef] [Scilit]
- Martin-Diana, A.B.; Rico, D.; Barry-Ryan, C.; Frias, J.M.; Mulcahy, J.; Henehan, G.T.M. Calcium lactate washing treatments for salad-cut Iceberg lettuce: Effect of temperature and concentration on quality retention parameters. Food Res. Int. 2005, 38, 729–740. [Google Scholar] [CrossRef] [Scilit]
- Peng, L.; Yang, S.; Li, Q.; Jiang, Y.; Joyce, D.C. Hydrogen peroxide treatments inhibit the browning of fresh-cut Chinese water chestnut. Postharvest Biol. Technol. 2008, 47, 260–266. [Google Scholar] [CrossRef] [Scilit]
- Rico, D.; Martín-Diana, A.B.; Barry-Ryan, C.; Frías, J.M.; Henehan, G.T.M.; Barat, J.M. Optimisation of steamer jet-injection to extend the shelflife of fresh-cut lettuce. Postharvest Biol. Technol. 2008, 48, 431–442. [Google Scholar] [CrossRef] [Scilit]
- Martin-Diana, A.B.; Rico, D.; Frias, J.; Mulcahy, J.; Henehan, G.T.M.; Barry-Ryan, C. Whey permeate as a bio-preservative for shelf life maintenance of fresh-cut vegetables. Innov. Food Sci. Emerg. Technol. 2006, 7, 112–123. [Google Scholar] [CrossRef] [Scilit]
- Degl’Innocenti, E.; Pardossi, A.; Tognoni, F.; Guidi, L. Physiological basis of sensitivity to enzymatic browning in “lettuce”, “escarole” and “rocket salad” when stored as fresh-cut products. Food Chem. 2007, 104, 209–215. [Google Scholar] [CrossRef] [Scilit]
- Yahya, M.H.; Chadwick, M.; Wagstaff, C. Oxidative pinking discolouration of leaves of different position of lettuce head. In Proceedings of the Postharvest 2024: The IX ISHS International Postharvest Symposium, Roturoa, New Zealand, 11–15 November 2024. [Google Scholar]
- Janda, T.; Szalai, G.; Leskó, K.; Yordanova, R.; Apostol, S.; Petrova Popova, L.P. Factors contributing to enhanced freezing tolerance in wheat during frost hardening in the light. Phytochemistry 2007, 68, 1674–1682. [Google Scholar] [CrossRef] [Scilit]
- Xu, M.Y.; Wu, K.X.; Liu, Y.; Liu, J.; Tang, Z.H. Effects of light intensity on the growth, photosynthetic characteristics, and secondary metabolites of Eleutherococcus senticosus Harms. Photosynthetica 2020, 58, 881–889. [Google Scholar] [CrossRef] [Scilit]
- Iakimova, E.T.; Woltering, E.J. Nitric oxide prevents wound-induced browning and delays senescence through inhibition of hydrogen peroxide accumulation in fresh-cut lettuce. Innov. Food Sci. Emerg. Technol. 2015, 30, 157–169. [Google Scholar] [CrossRef] [Scilit]
- Savatin, D.V.; Gramegna, G.; Modesti, V.; Cervone, F. Wounding in the plant tissue: The defense of a dangerous passage. Front. Plant Sci. 2014, 5, 470. [Google Scholar] [CrossRef] [Scilit]
- Vega-Muñoz, I.; Duran-Flores, D.; Fernández-Fernández, Á.D.; Heyman, J.; Ritter, A.; Stael, S. Breaking bad news: Dynamic molecular mechanisms of wound response in plants. Front. Plant Sci. 2020, 11, 610445. [Google Scholar] [CrossRef] [Scilit]

Disclaimer/Publisher’s Note: The statements, opinions and data contained in all publications are solely those of the individual author(s) and contributor(s) and not of MDPI and/or the editor(s). MDPI and/or the editor(s) disclaim responsibility for any injury to people or property resulting from any ideas, methods, instructions or products referred to in the content. |
© 2026 by the authors. Licensee MDPI, Basel, Switzerland. This article is an open access article distributed under the terms and conditions of the Creative Commons Attribution (CC BY) license.