


Abstract
A two-factor experiment was conducted using the cultivar ‘Xin you No. 2’ (Citrullus lanatus) to identify an efficient and green production model for drip-irrigated watermelon under plastic mulch in Southern Xinjiang. A basal organic fertilizer was applied at 2250 kg·ha−1. The experimental design comprised three irrigation levels, maintaining soil moisture at 60–70% (W1), 70–80% (W2), and 80–90% (W3) of field capacity, and three nitrogen application rates: 180 (N1), 240 (N2), and 300 (N3) kg·ha−1. This study systematically investigated the effects of water–nitrogen coupling on watermelon yield, quality, water use efficiency, and nitrogen partial factor productivity. The W2N2 treatment achieved the highest yield of 64,617.59 kg·ha−1. Vine length, stem diameter, and dry matter accumulation increased with increasing nitrogen application under the W1 and W2 irrigation levels, but exhibited an initial increase followed by a decrease under the W3 condition. Water restriction combined with increased nitrogen application significantly enhanced the central sugar content, with the W1N3 treatment increasing it by 15.69% compared to CK. Conversely, the W1N1 treatment was most conducive to vitamin C accumulation, showing a 49.88% increase over CK. The total water consumption across the different treatments ranged from 362.12 to 493.92 mm. Both water use efficiency and irrigation water use efficiency reached their maximum values under the W1N3 treatment, at 21.94 kg·m−3 and 35.05 kg·m−3, respectively. In contrast, the highest partial factor productivity of nitrogen (NPFP) was observed under W3N1, reaching 239.33 kg·kg−1. A comprehensive multi-index evaluation using the Technique for Order Preference by Similarity to an Ideal Solution (TOPSIS) method indicated that the W1N3 treatment achieved the highest relative closeness (0.669), identifying it as the optimal water–nitrogen combination.
1. Introduction
Watermelon is a globally significant cash crop [1]. Valued as a summer fruit for relieving heat, it possesses crisp and tender flesh, a fresh sweet taste, and is rich in mineral salts and vitamins, making it highly popular among consumers. As a widely cultivated important cash crop, it plays an irreplaceable role in ensuring farmers’ income and meeting market demand. Xinjiang is one of China’s major watermelon-producing regions. In 2020, the total watermelon planting area in China was 1.5281 million hectares, with Xinjiang accounting for 116,460 hectares, approximately 7.62% of the national total [2]. Southern Xinjiang, surrounding the Tarim Basin, boasts abundant light and heat resources [3] and a significant diurnal temperature range, providing an excellent natural environment for watermelon cultivation. However, the region also faces challenges such as scarce freshwater resources and soil salinity/sandiness, which severely constrain agricultural development. Therefore, achieving efficient water resource utilization and scientific fertilizer application has become the core issue for the sustainable development of the watermelon industry in Southern Xinjiang.
Chemical fertilizers, as a crucial means of maintaining plant nutrition and soil fertility, play a vital role in increasing agricultural production. However, excessive use of chemical fertilizers has occurred in recent years; for instance, the nitrogen required to produce 1000 kg of watermelon can vary by up to 8.5 times between the highest and lowest recorded rates [4]. Over-fertilization reduces soil nutrient use efficiency, degrades soil structure, and leads to a decline in soil fertility, among other environmental problems, seriously hindering the development of the watermelon industry. Thus, optimizing fertilization management is key to the sustainable development of the watermelon industry.
As a traditional fertilization method, organic manure not only provides essential nutrients for plants but also improves soil physicochemical properties [5]. Owing to its advantages in enhancing soil health and plant growth, an increasing number of researchers have utilized organic manure to improve soil fertility and productivity in recent years [6]. Compared with the application of chemical fertilizer alone, the combined application of organic and inorganic fertilizers has been shown to significantly increase rice yield [7], enhance vitamin C content, soluble sugars, glucosinolates, and titratable acidity in radishes [8], and mitigate environmental risks such as greenhouse gas emissions and nutrient loss [9]. However, studies have found that organic manure alone often cannot meet the nutritional demands of crops due to its slow and time-consuming nutrient release rate. Therefore, the combined application of organic manure and chemical fertilizers is a compelling necessity.
As an efficient water-saving irrigation technology, drip irrigation under plastic mulch has been widely adopted in Southern Xinjiang. This technology delivers water and nutrients directly to the crop root zone, significantly improving the efficiency of water and fertilizer use [10]. Research indicates that compared to traditional irrigation methods, drip irrigation under plastic mulch can save 30–50% of water and increase yield by 20–30% [11]. However, in actual production, the lack of scientific irrigation and fertilization regimes often leads to issues such as excessively high irrigation quotas and over-application of nitrogen fertilizer [12]. These practices not only waste water and fertilizer resources and increase production costs but may also cause secondary soil salinization and groundwater pollution [13]. Suitable water and fertilizer conditions can promote crop growth and development while reducing agricultural costs, thereby enhancing the efficiency of water and fertilizer use [14]. Liu et al. [15] studied the effects of single and integrated nitrogen management practices on wheat production under different soil and climatic conditions, demonstrating that integrated nitrogen management could increase yield and nitrogen use efficiency by 5.4% and 55%, respectively, without reducing water use efficiency. Wang et al. [16] investigated the effects of different water and fertilizer rates on cotton yield and water/fertilizer use efficiency. They concluded that concluding that full irrigation combined with a fertilization strategy of 300-120-60 kg·ha−1 (N-P2O5-K2O) was the optimal water–fertilizer combination strategy in Xinjiang.
Numerous studies have been conducted on the effects of irrigation volume and different chemical fertilizer inputs on watermelon growth and yield under drip irrigation under plastic mulch, leading to the development of corresponding irrigation and fertilization schedules. However, relatively few studies have focused on the synergistic regulation of water and fertilizer under the combined application of drip irrigation under plastic mulch and organic fertilizer, specifically regarding watermelon growth, development, yield, quality, water use efficiency, and water consumption patterns. Furthermore, optimal water–fertilizer ratios and management measures vary due to differences in cultivars and cultivation environments. Therefore, targeting the specific climatic, ecological, and soil conditions of Southern Xinjiang, this study utilizes water and nitrogen regulation techniques under drip irrigation with plastic mulch and applies a basal dose of organic manure to study and analyze the responses of watermelon plant physiology and growth, water consumption characteristics, yield, and water–nitrogen use efficiency to water–nitrogen coupling. This study aims to provide a theoretical basis and technical support for high yield, high efficiency, water saving, and reduced fertilizer application in watermelon production in Southern Xinjiang.
2. Materials and Methods
2.1. Description of the Experimental Site
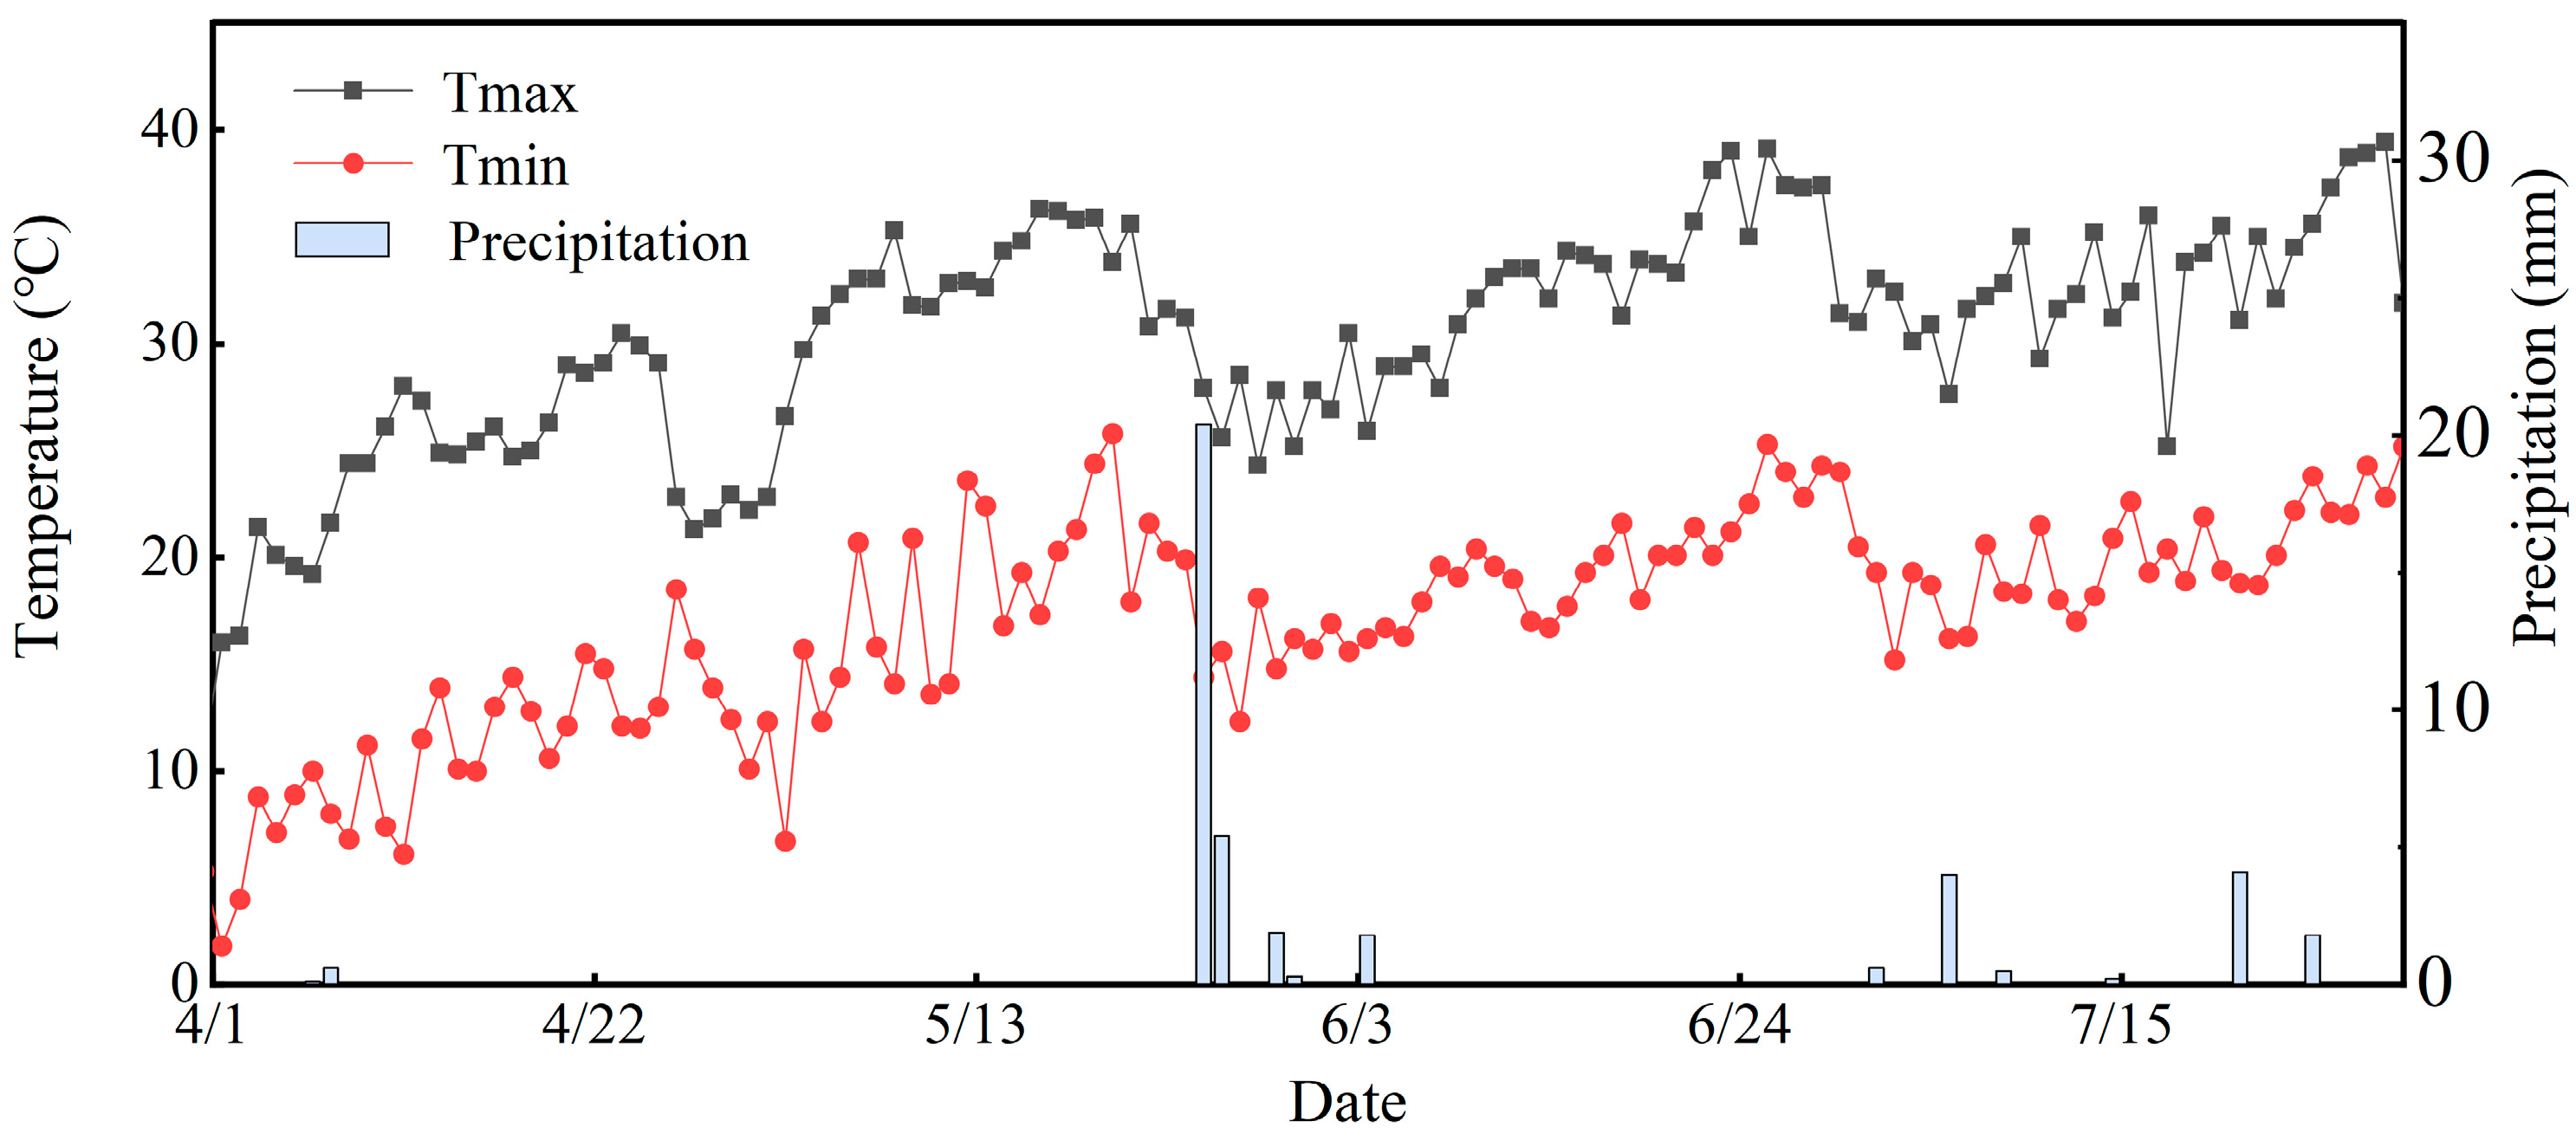
The experiment was conducted from April to July 2024 at the Alaer Experimental Base (40°36′20″ N, 81°18′45″ E) of the Cotton Research Institute, Chinese Academy of Agricultural Sciences. The soil texture is Sandy Loam, with clay, silt, and sand contents of 6.71%, 30.08%, and 63.21%, respectively. The site experiences a warm temperate, extreme continental, arid desert climate. The mean annual temperature is 10.7 °C, with an annual rainfall of approximately 50 mm and a mean annual evaporation exceeding 2000 mm. The daily minimum and maximum temperatures, along with precipitation data for the experimental period, are presented in Figure 1. Table 1 shows the initial soil physicochemical properties of the topsoil (0–20 cm) layer.
Figure 1.
Daily minimum and maximum temperatures, as well as rainfall in the study area.
Table 1.
Initial soil physicochemical properties.
2.2. Experimental Design
The watermelon cultivar used in the experiment was ‘Xinyou No. 2’, which was sown on 18 April and harvested on 10 July 2024, with a total growth period of 84 days. A two-factor experimental design involving irrigation and nitrogen fertilizer was adopted. Table 2 shows the specific irrigation volumes and nitrogen application rates for each treatment. The experiment was arranged in a completely randomized design with 10 treatments and 3 replications each, resulting in 30 experimental plots. Each plot was equipped with independent water and fertilizer supply and control capabilities, with precise irrigation control achieved through individual valves and water meters. The area of each experimental plot was 45 m2 (3 m × 15 m), with a row spacing of 50 cm and a plant spacing of 30 cm. Drip irrigation was performed under plastic mulch, with two rows of plants per mulch strip. Soil moisture content at the 20 cm depth was monitored for all treatments using soil moisture and temperature sensors (BC202, Hydra Probe Lite, Beijing, China). Irrigation was triggered when the soil moisture level fell below the target threshold specified for each treatment (Table 2). Fertilization involved the application of organic manure and chemical fertilizers. A commercial organic fertilizer (Jinxiu Grand Land Biotechnology Co., Ltd, Aksu, China.), with a specification of ≥30% organic matter and a guaranteed analysis of 2% N (Nitrogen), 1.5% P2O5 (Phosphorus pentoxide), and 0.5% K2O (Potassium oxide) was applied once as a basal dose before sowing at a rate of 2250 kg·ha−1 and incorporated into the soil by plowing to a depth of 40 cm. Chemical fertilizers supplying N, P2O5, and K2O were applied in three split applications via the drip irrigation system, aligned with key crop growth stages. The application schedule was as follows: 30% N, 60% P2O5, and 30% K2O as base fertilizer; 20% N, 20% P2O5, and 10% K2O during the vine elongation stage; 20% N, 10% P2O5, and 20% K2O during the flowering and fruit setting stages; and 30% N, 10% P2O5, and 40% of K2O during the fruit expansion stage.
Table 2.
Irrigation and nitrogen application rates across treatments.
2.3. Sampling and Measurements
2.3.1. Sample Collection
Before the commencement of the experiment, all treatment plots received a spring flood irrigation of 450 m3·ha−1 to mitigate soil salinity effects. Following this irrigation, soil samples were collected from the 0–20 cm depth using the five-point sampling method. After removing impurities, one portion of the soil was sieved and air-dried naturally, while other portion was preserved in a low-temperature freezer. Upon watermelon maturity and harvest, soil samples were again collected from the 0–20 cm depth across all treatments and processed identically as described above for subsequent determination of soil physicochemical properties in the laboratory.
Three plant samples were randomly selected from each treatment at different growth stages of the watermelon. The aboveground and belowground parts were separated, oven-sealed, dried, and weighed to determine the accumulation of plant dry matter. During the mature harvest period, three watermelons were randomly picked from each treatment to measure fruit quality indicators.
2.3.2. Measured Parameters and Methods
The soil pH was measured using a bench-top pH meter (PHSJ-3F, Leici Corporation, Shanghai, China) at a water-to-soil ratio of 2.5:1 (w/w). Soil electrical conductivity (EC) was determined with a conductivity meter (DDSJ-318, Leici Corporation, Shanghai, China) at a water-to-soil ratio of 5:1. Soil organic matter, total carbon, and total nitrogen were analyzed using an elemental analyzer (Varioisotope cube, Elementar, Langenselbold, Germany). Prior to analysis, soil samples were pretreated with hydrochloric acid to remove carbonates, then dried, ground, and sieved to obtain a homogeneous sample for measurement. NH4+-N and NO3−-N concentrations were determined by spectrophotometry (UV-5500PC, Shanghai Yuanxi Instrument Co., Ltd., Shanghai, China). Soil samples were extracted by oscillating with a 2 mol/L KCl solution at a 1:10 soil-to-water ratio, and the resulting filtrate was analyzed. At the end of each growth stage, the main vine length and stem diameter were measured. Vine length was measured using a steel tape with an accuracy of 1 mm, and stem diameter was measured using a digital vernier caliper with an accuracy of 0.001 mm. At maturity, well-shaped and uniformly ripe watermelons from each treatment were harvested and individually weighed. The total yield was converted to a per-hectare basis (kg·ha−1). The central sugar content of the fruit was measured using a refractometer (LH-T32, Zhejiang Luheng Environmental Technology Co., Ltd., Zhejiang, China). Soluble protein content was determined using the Coomassie Brilliant Blue G-250 staining method. Vitamin C content was measured using the molybdenum blue colorimetric method. Total watermelon water consumption was calculated using the water balance equation,
where ET is the water consumption during the watermelon growth period (mm), i is the soil layer number, is the thickness of the i-th soil layer (cm), is the bulk density of the i-th soil layer (g·cm−3), are the initial and final soil mass moisture content of the i-th layer, respectively (%), M is the irrigation amount (mm), P is the effective rainfall during the measurement period (mm), and K is the groundwater recharge (mm). In the experimental area, the groundwater table is deeper than 5 m, resulting in negligible groundwater recharge; thus, K = 0. C is the deep percolation (mm). The designed irrigation amount was maintained below the field capacity to prevent deep percolation; therefore, C = 0.
Water use efficiency (WUE) was calculated as
where Y is the watermelon yield (kg·ha−1), and ET is the total water consumption during the entire growth period (m3·ha−1).
Irrigation water use efficiency (IWUE) was calculated as
where is the watermelon yield (kg·ha−1), and is the total irrigation amount during the entire growth period (m3·ha−1).
Partial factor productivity of nitrogen was calculated as
where is the watermelon yield (kg·ha−1), and is the nitrogen application rate (kg·ha−1).
2.3.3. TOPSIS Model
The Technique for Order Preference by Similarity to an Ideal Solution (TOPSIS) is a comprehensive evaluation method used for multi-objective decision-making [17]. This method identifies the optimal alternative by calculating the Euclidean distances between each evaluation scheme and both the Positive Ideal Solution (PIS) and the Negative Ideal Solution (NIS), ultimately selecting the scheme closest to the PIS as the best option [18]. The specific computational procedure is as follows:
- (1)
- Construction of the Decision Matrix
Dry matter accumulation, yield, soluble protein content, central sugar content, water use efficiency, and partial factor productivity of nitrogen were selected as evaluation indicators for the comprehensive assessment of watermelon growth. Nine different water–nitrogen treatments were chosen as the decision alternatives. Let the set of decision alternatives be M = (M1, M2 … M9), and the set of indicators be D = (D1, D2 … D6). The value of alternative Mi on indicator Dj is denoted as aij, forming the decision matrix A = (aij)9×6.
- (2)
- Normalization of the Decision Matrix
To eliminate the influence of differing dimensions, all indicators were treated as benefit-type indicators (where larger values are preferable) and normalized, resulting in the normalized decision matrix.
- (3)
- Determination of Indicator Weights using the Coefficient of Variation Method
To avoid the influence of subjectivity on weight assignment, the coefficient of variation method was employed to determine the weights of the evaluation indicators. With 9 alternatives and 6 evaluation indicators, the coefficient of variation for the j-th indicator is calculated as
where is the standard deviation of the j-th indicator, and is the mean of the j-th indicator.
The weight of the j-th indicator is then given by
- (4)
- Construction of the Weighted Normalized Matrix
The weighted normalized matrix Z = (Zij)9×6
- (5)
- Determination of the Positive and Negative Ideal Solutions
The Positive Ideal Solution and the Negative Ideal Solution were determined. For benefit-type indicators,+ = max Zij, − = min Zij.
- (6)
- Calculation of Euclidean Distances and Relative Closeness
The Euclidean distances from each alternative to the PIS (di+) and to the NIS (di−), as well as the relative closeness (Si) of each alternative to the ideal solution, were calculated using the following equations:
3. Results
3.1. Effects of Different Treatments on Vine Length and Stem Diameter
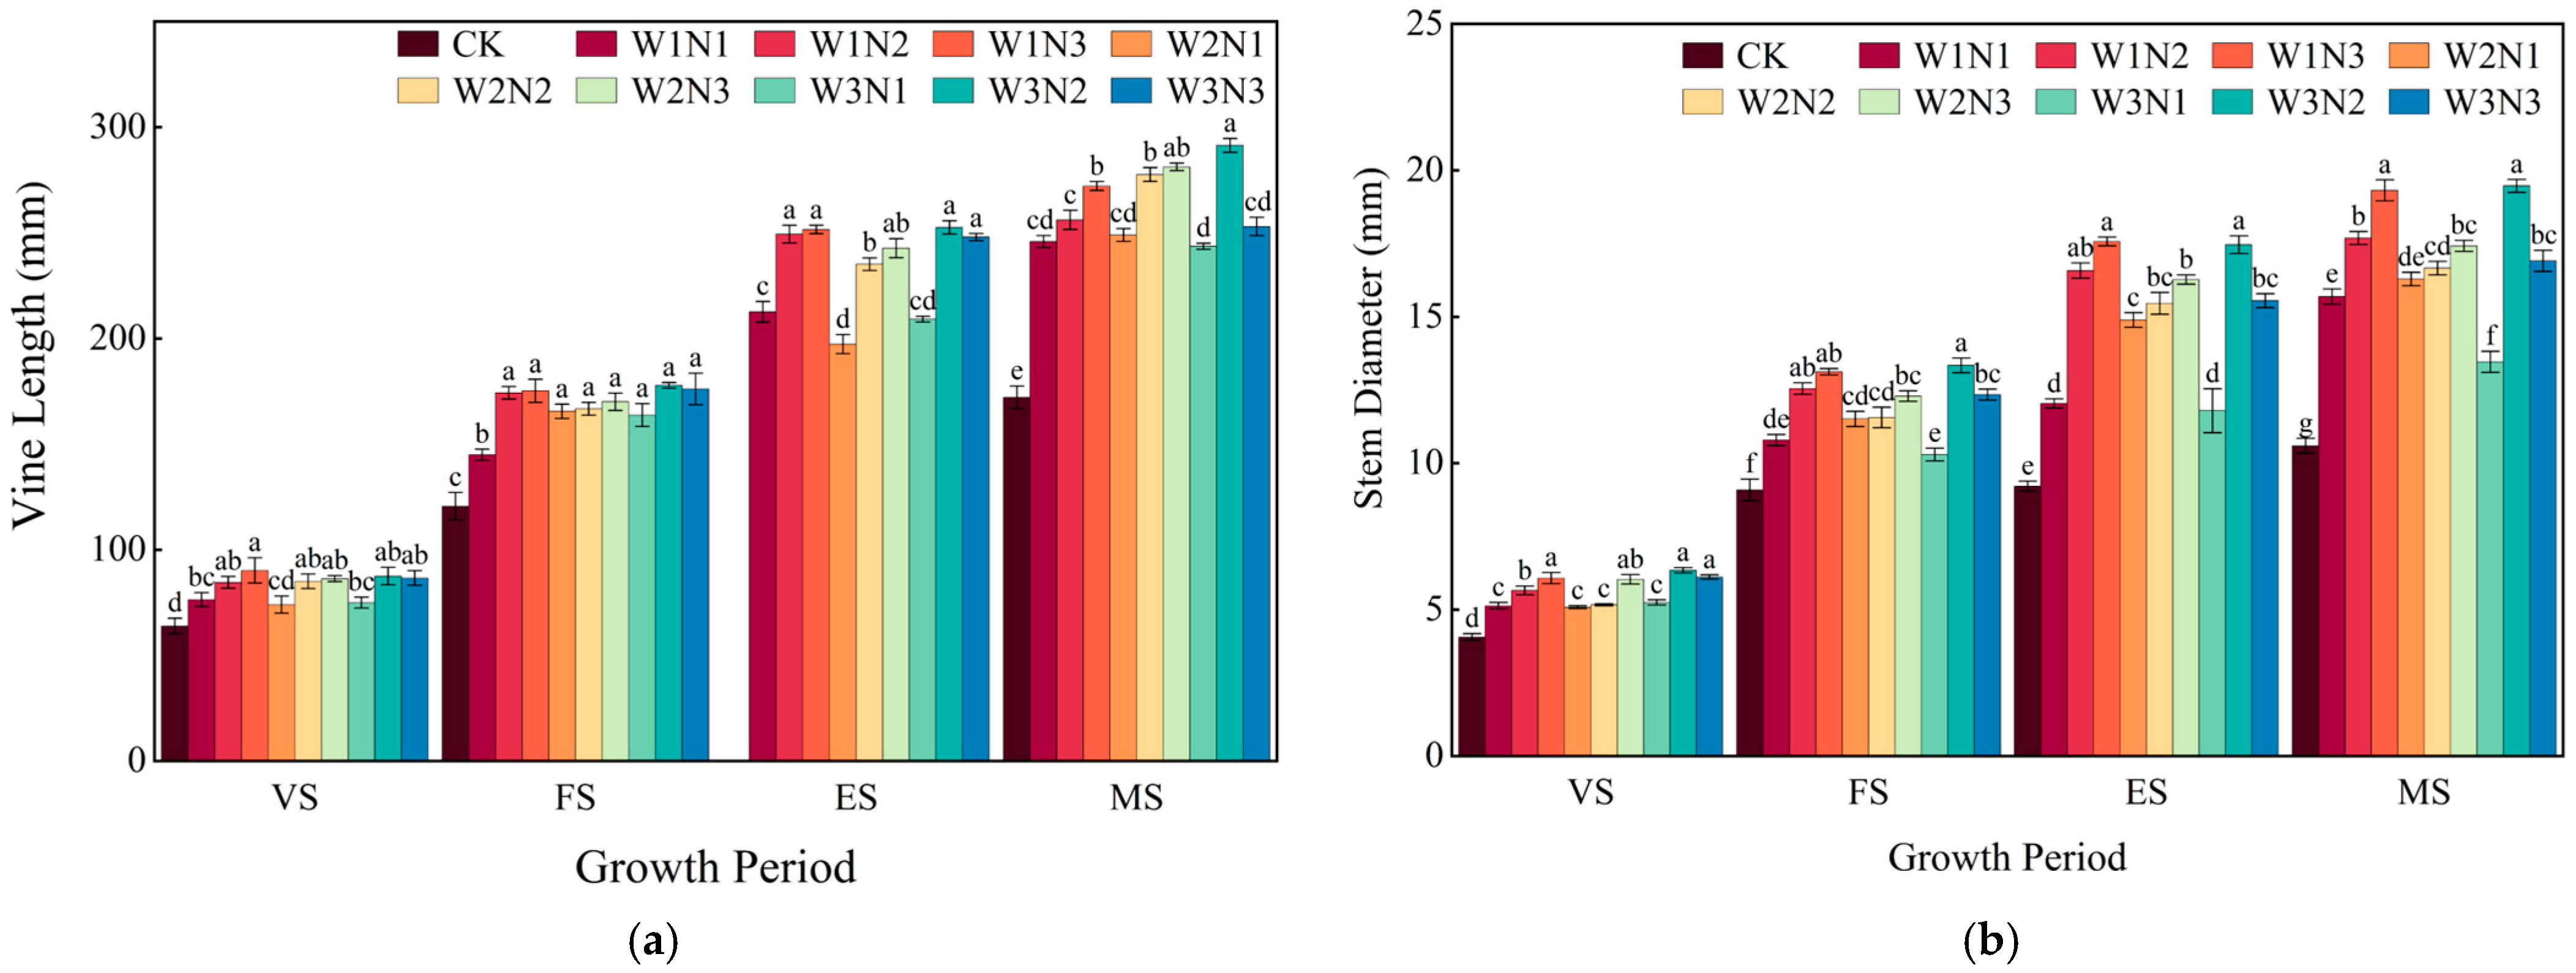
As shown in Figure 2, the patterns of change in vine length and stem diameter under different water and nitrogen treatments were consistent, indicating a continuous increase from the vine elongation stage to the fruit expansion stage. The most rapid growth rate occurred from the vine elongation stage to the flowering and fruit setting stages. Upon entering the maturity stage, the plant’s growth center shifted to the fruit, resulting in slowed main vine elongation.
Figure 2.
(a) Watermelon vine length under different water and nitrogen treatments; (b) watermelon stem diameter under different treatments. Note: VS: Vine Elongation Stage; FS: Flowering and Setting Stage; ES: Expansion Stage; MS: Maturity Stage. Different lowercase letters indicate significant differences between different treatments, p < 0.05.
Under the W1 and W2 irrigation levels, vine length exhibited a gradual increasing trend with increasing nitrogen application levels. In contrast, under the W3 irrigation level, vine length initially decreased and then increased with higher nitrogen rates. Specifically, compared with the N2 treatment, the N3 treatment under W3 resulted in reductions of 1.03%, 1.00%, 1.81%, and 13.18% in vine length during the vine elongation, flowering and fruit setting, fruit expansion, and maturity stages, respectively. Under the same nitrogen application rate, different irrigation levels had no significant effect on vine length.
The plant stem diameter under different treatments followed a trend similar to that of the vine length. The W2 irrigation level had a minor and non-significant effect on the stem diameter across all growth stages. Under the W1 irrigation level, stem diameter increased significantly with increasing nitrogen application. Under the W3 irrigation level, stem diameter initially increased and then decreased with higher nitrogen rates. The greatest stem diameters were observed in the W1N3 and W3N2 treatments, which showed significant increases of 44.49% and 46.92% (W1N3), and 90.77% and 89.58% (W3N2), respectively, compared to the CK treatment during the flowering and fruit setting stage and the fruit expansion stage. Similarly, different irrigation levels alone had no significant impact on stem diameter.
3.2. Effects of Different Treatments on Dry Matter Accumulation in Watermelon
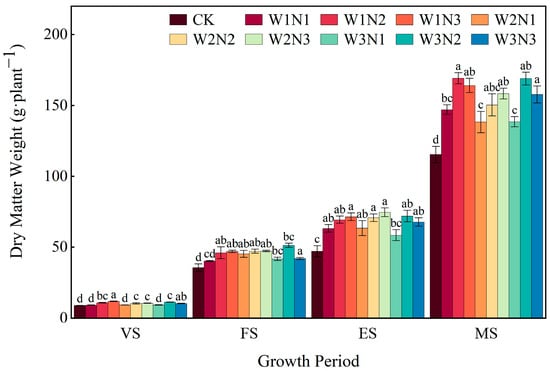
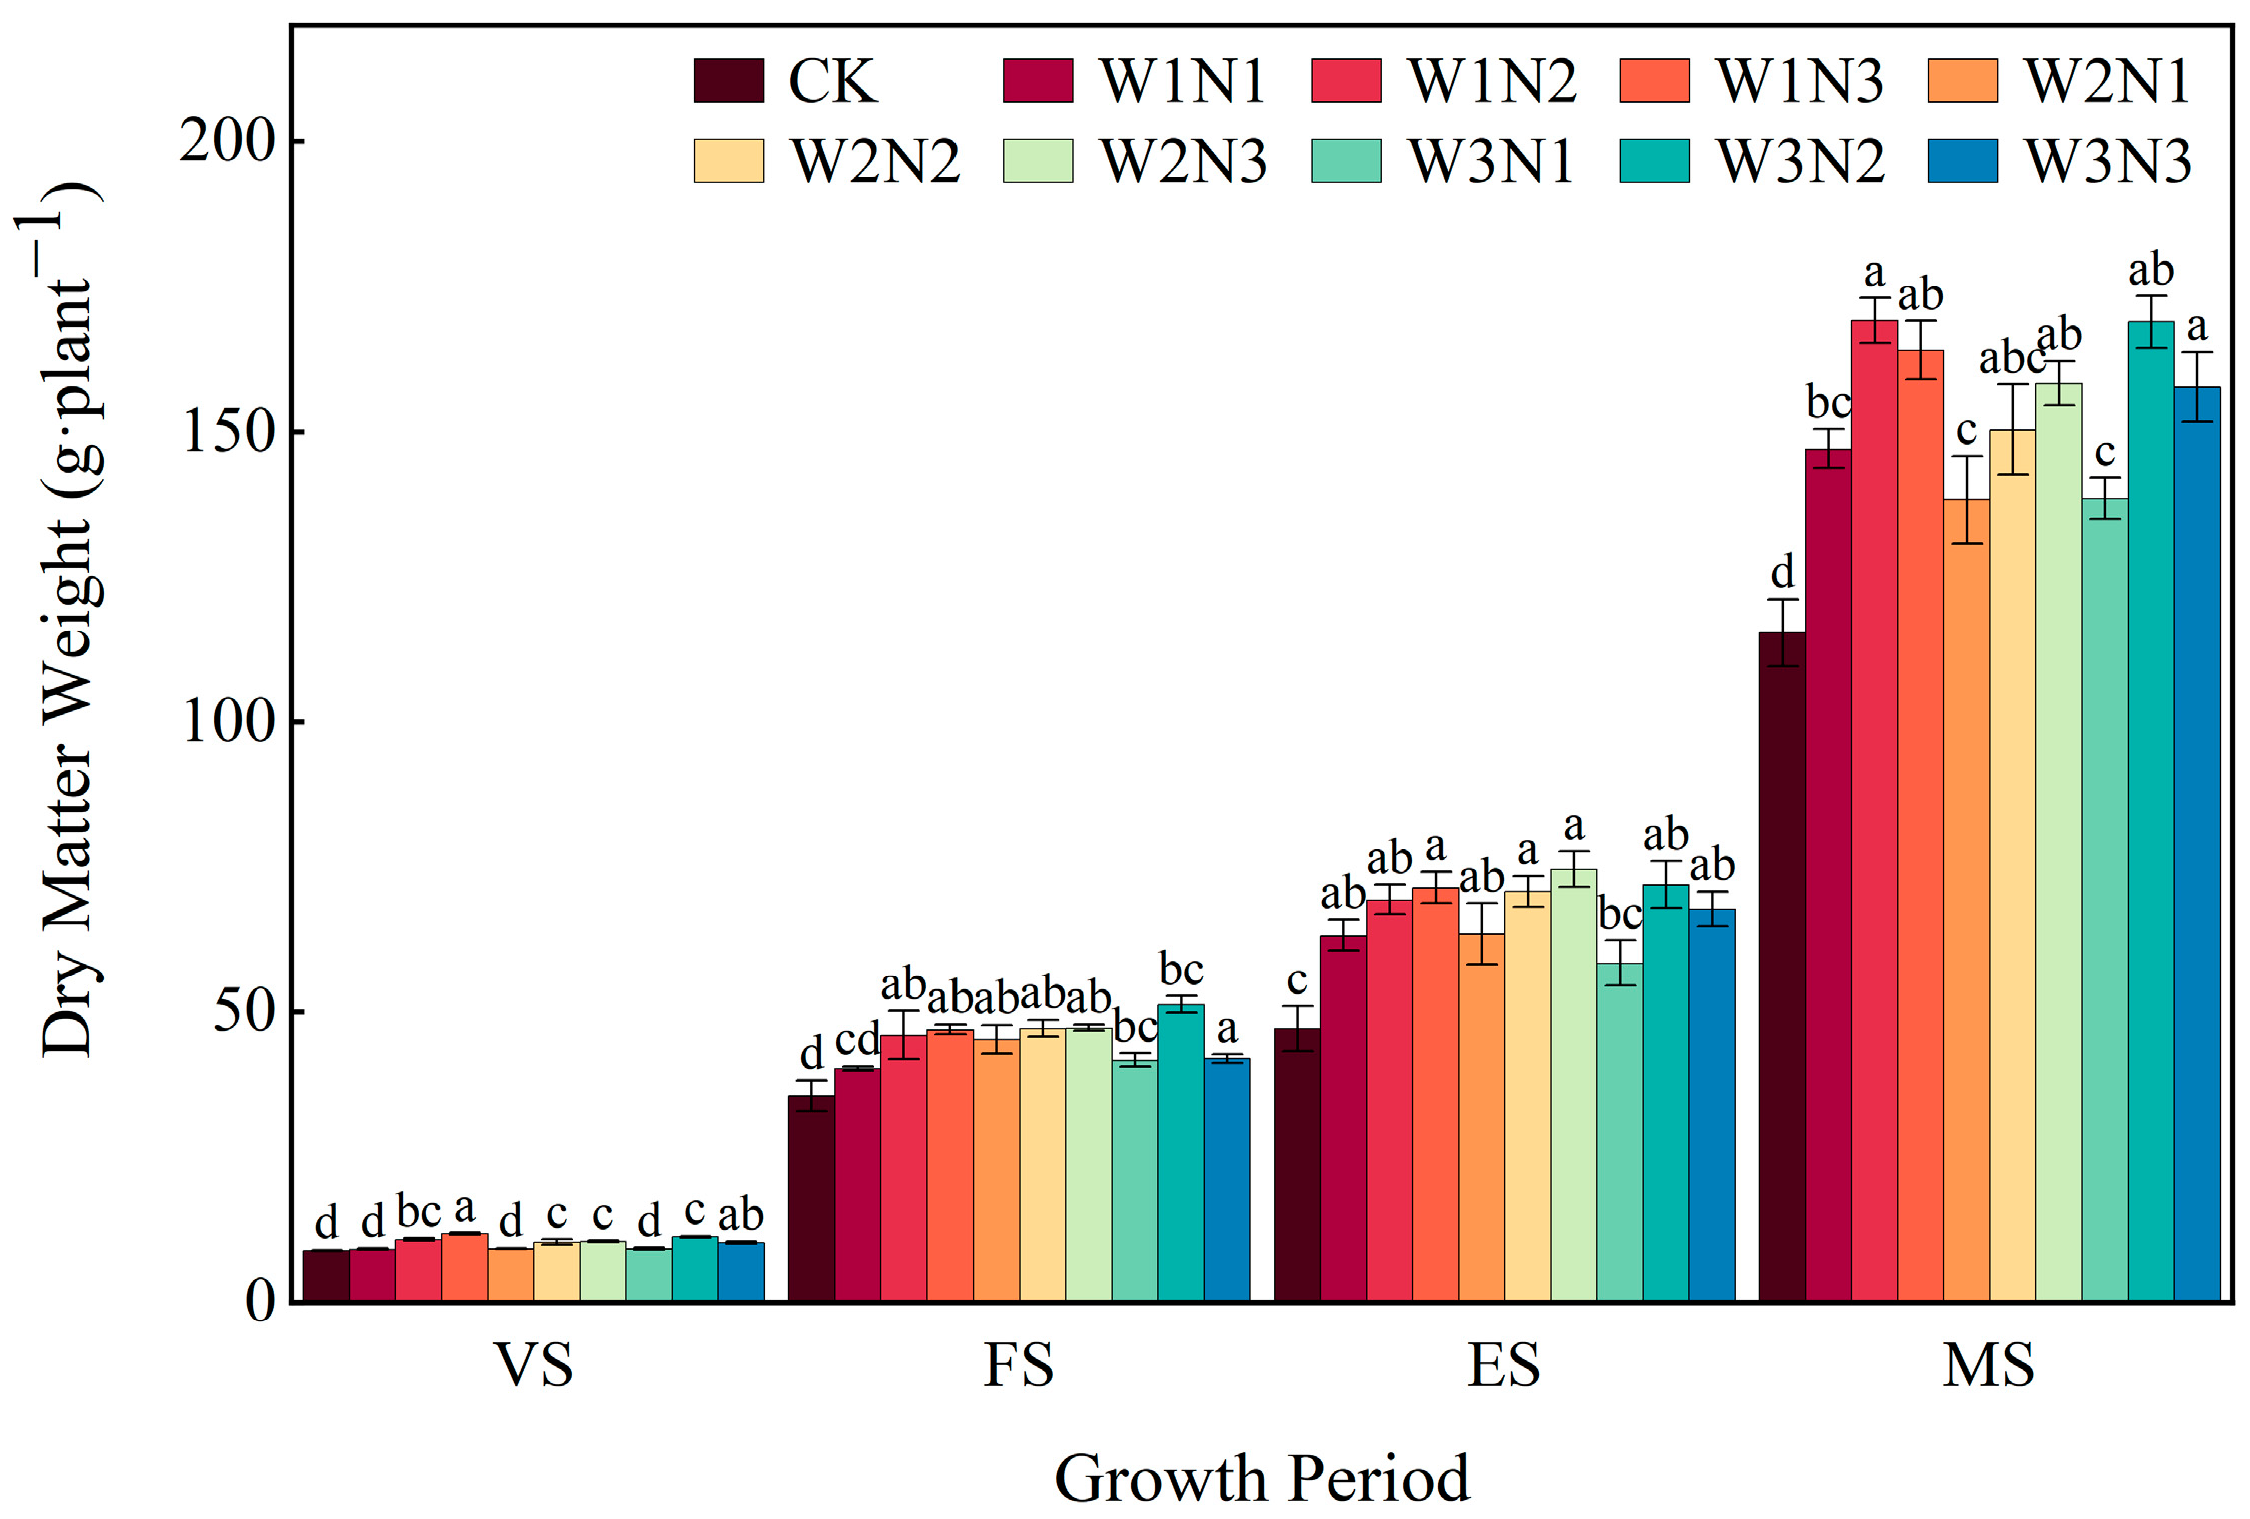
As shown in Figure 3, the different water and nitrogen treatments significantly influenced the dry matter accumulation of watermelon across all growth stages. Dry matter accumulation in all treatments was significantly higher than that in the CK treatment throughout the growth period. The most rapid increase in dry matter occurred during the maturity stage, accounting for 49.10% to 73.60% of total accumulation.
Figure 3.
Watermelon dry matter mass under different water and nitrogen treatments. Note: VS: Vine Elongation Stage; FS: Flowering and Setting Stage; ES: Expansion Stage; MS: Maturity Stage. Different lowercase letters indicate significant differences between different treatments, p < 0.05.
W1N3 treatment resulted in the highest dry matter mass at the vine elongation stage, which was significantly greater than the CK treatment. During the flowering and fruit setting stages, the W3N2 treatment achieved the maximum dry matter mass, representing a 44.18% increase compared to CK. At maturity, the W1N2 treatment exhibited the highest cumulative dry matter mass, with a 46.64% increase over CK, showing no significant difference from the W3N2 and W1N3 treatments.
Under irrigation levels W1 and W2, the dry matter mass gradually increased with increasing nitrogen application rates throughout the entire growth period. In contrast, under the W3 irrigation level, the dry matter mass initially increased and then decreased with increasing nitrogen application. Specifically, across all stages, the W3N3 treatment resulted in reductions of 8.90%, 18.15%, 5.80%, and 6.61% compared with the W3N2 treatment. These results indicate that excessively high nitrogen application rates can inhibit crop growth under sufficient irrigation conditions.
3.3. Effects of Different Treatments on Chlorophyll Content in Watermelon Plants
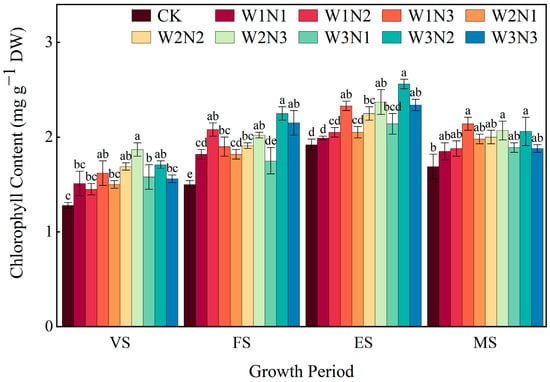
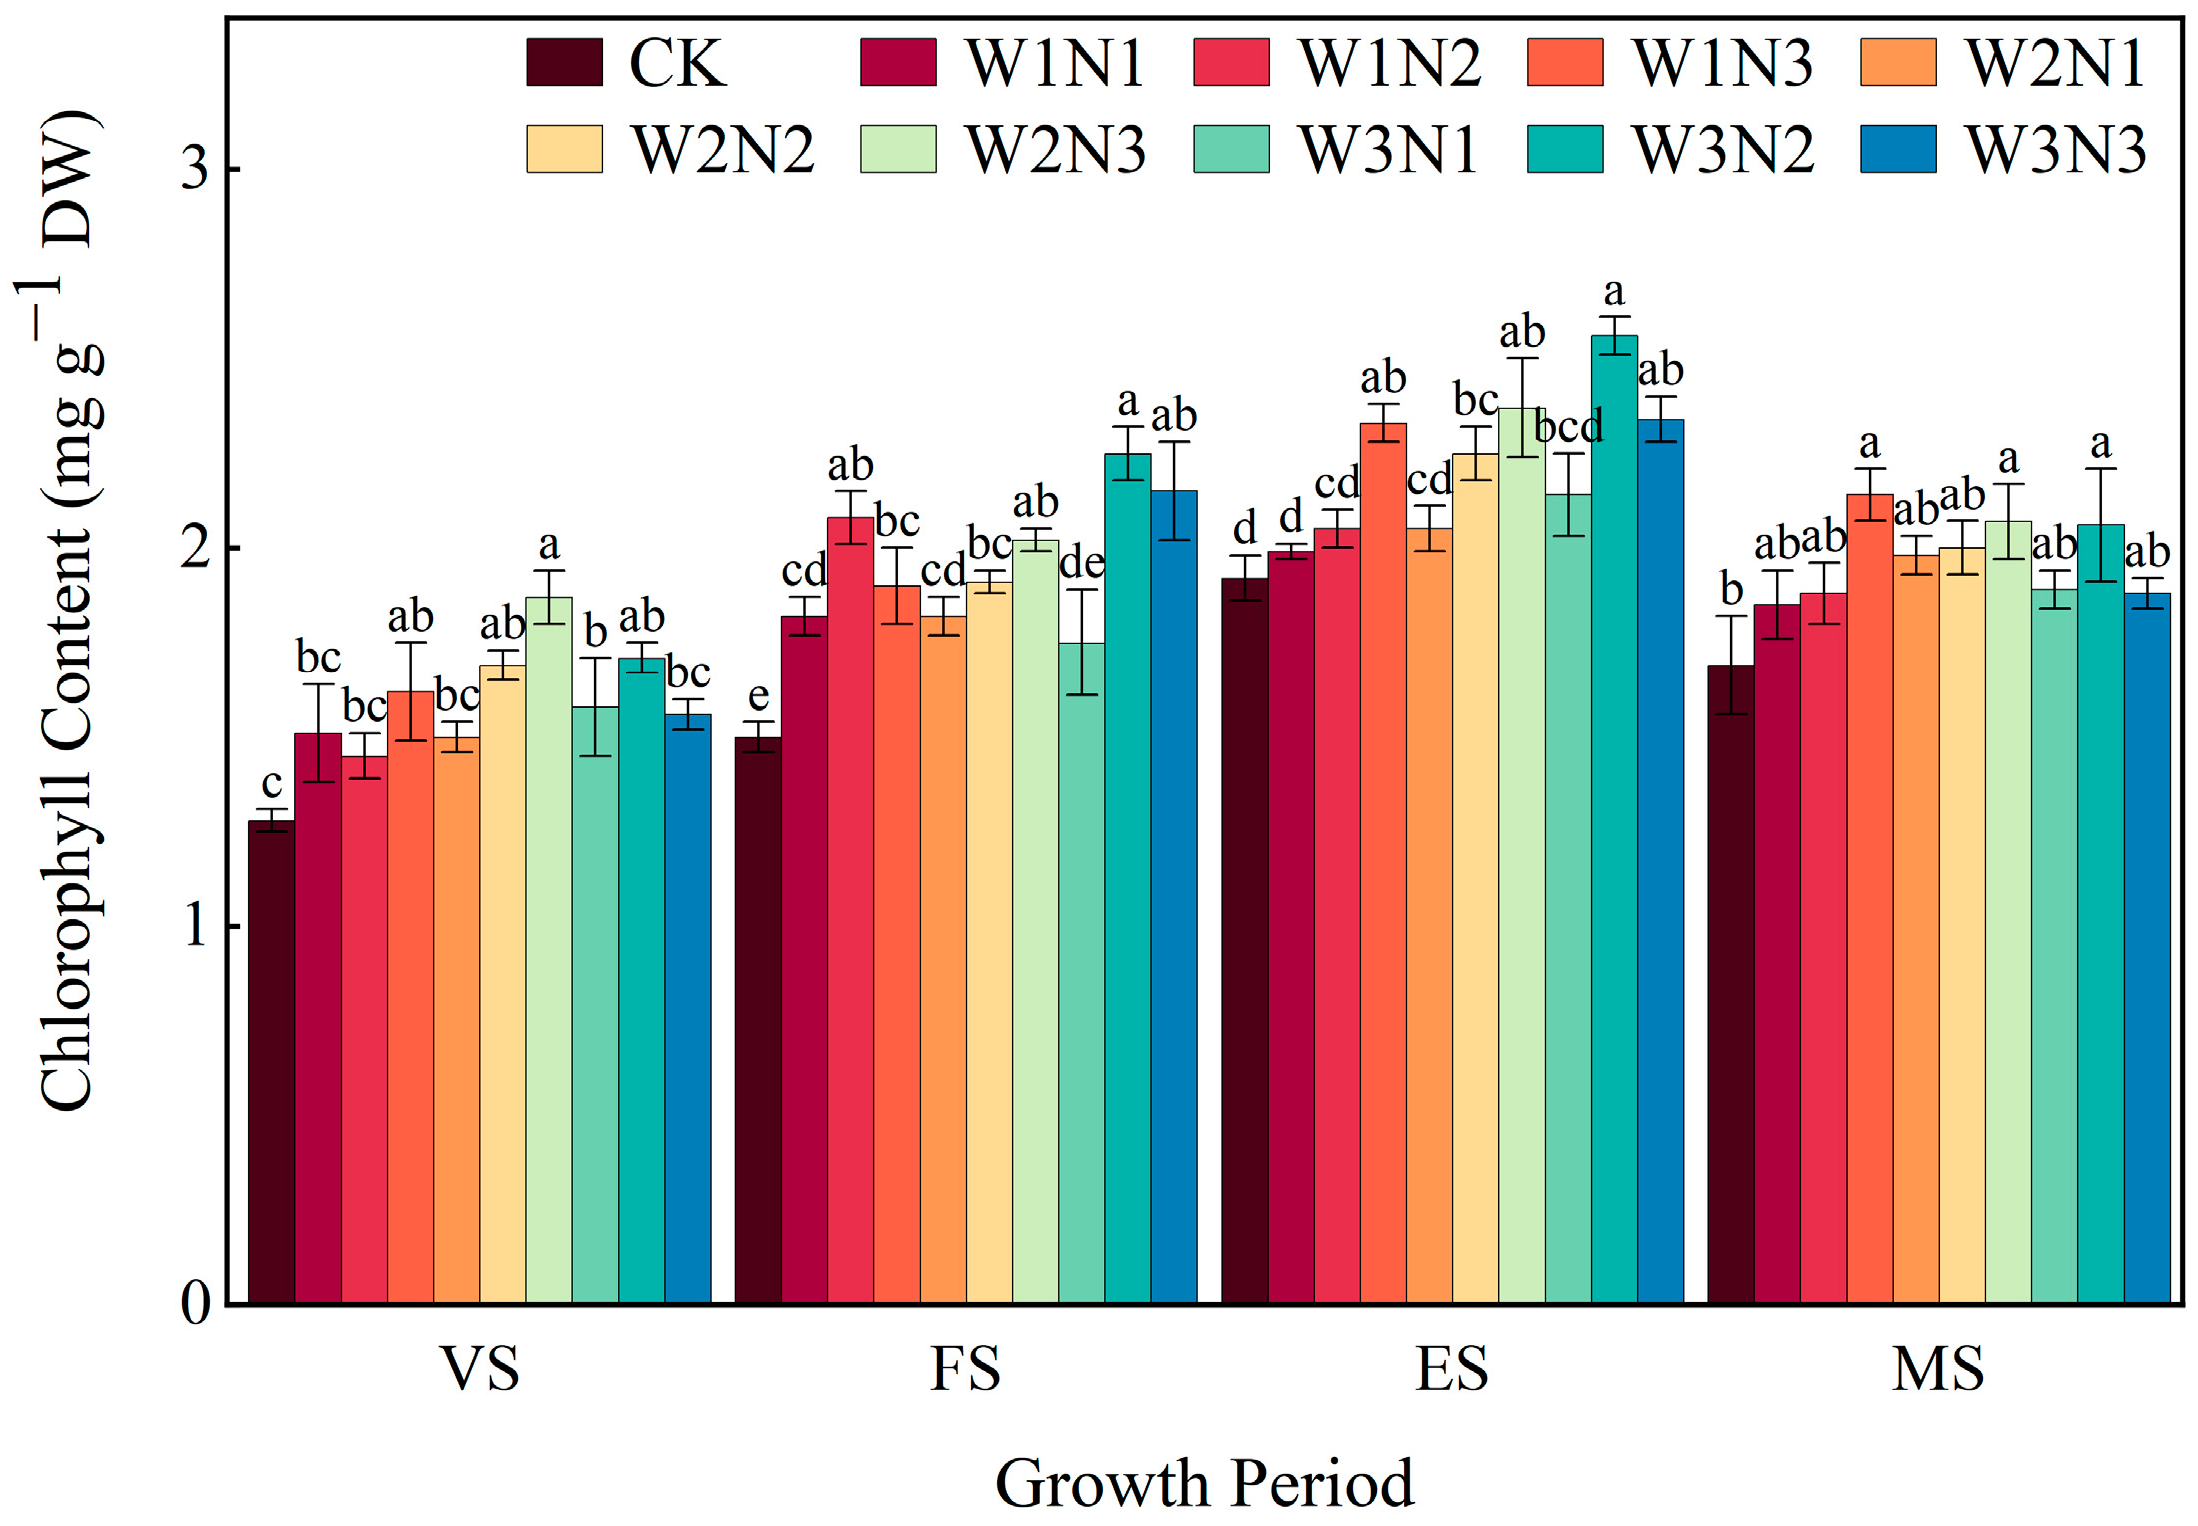
Figure 4 shows the chlorophyll content in watermelon leaves under different water and fertilizer treatments. Nitrogen was the key factor governing chlorophyll synthesis during the plant growth stages, with chlorophyll content increasing steadily with higher nitrogen application rates. The chlorophyll content in all treatments was significantly higher than that in the control (CK) throughout the growth period, and the water–nitrogen interaction effect was significant.
Figure 4.
Chlorophyll content in watermelon leaves under different water and nitrogen treatments. Note: VS: Vine Elongation Stage; FS: Flowering and Setting Stage; ES: Expansion Stage; MS: Maturity Stage. Different lowercase letters indicate significant differences between different treatments, p < 0.05.
Chlorophyll content gradually increased from the vine elongation stage to the fruit expansion stage but subsequently declined during the maturity stage. Notably, the W3N2 treatment reached a peak value of 2.56 mg·g−1 at the fruit expansion stage, representing a 33.34% increase compared with that of CK.
Chlorophyll content during the fruit expansion and maturity stages increased progressively with increasing nitrogen application under W1 and W2 irrigation levels. In contrast, the chlorophyll content initially increased and then decreased with higher nitrogen rates under the W3 irrigation level, peaking at the N2 level. During these stages, the N3 treatment resulted in reductions of 8.59% and 8.74% compared to the N2 treatment, respectively. The W3N3 treatment showed a 0.53% decrease compared to W3N1, indicating that excessive water and nitrogen can inhibit crop growth.
However, a completely different trend was observed under the W1 irrigation level during the vine elongation stages. At the vine elongation stage, the chlorophyll content initially decreased and then increased with rising nitrogen application, while at the flowering and fruit setting stage, it initially increased and then decreased.
Water regulation also had significant effects. Under the N2 treatment, the chlorophyll content gradually increased with higher irrigation levels. In contrast, under the N1 and N3 treatments, there were no significant differences in chlorophyll content between irrigation levels. These findings demonstrate that nitrogen availability primarily influences chlorophyll content.
3.4. Effects of Different Treatments on Watermelon Quality
Table 3 shows the effects of different water and nitrogen treatments on watermelon quality. Water and nitrogen management significantly regulated the sugar and vitamin C contents of watermelon fruits but had a minor influence on soluble protein content.
Table 3.
Watermelon quality as affected by different treatments.
The W1N3 treatment resulted in the highest central sugar content, reaching 11.80%, which was 15.69% higher than the CK treatment. Under the same irrigation level, the central sugar content of watermelon fruit increased steadily with increasing nitrogen application. Under low-water irrigation, the sugar content increased from 11.17% in the W1N1 treatment to 11.80% in the W1N3 treatment, representing an increase of 5.64%. In contrast, the central sugar content was lower under high-water conditions. The W3N1 and W3N2 treatments resulted in reductions of 2.83% and 6.68%, respectively, compared to the W2N1 and W2N2 treatments, indicating that moderate irrigation is more conducive to sugar accumulation.
The vitamin C content responded more sensitively to water and nitrogen. The W1N1 treatment yielded the highest vitamin C content, which was 49.88% higher than that of the CK treatment. Furthermore, under low-water irrigation, vitamin C content initially decreased and then increased with increasing nitrogen application, declining from 6.34 mg·100 g−1 in the W1N1 treatment to 5.68 mg·100 g−1 in the W1N2 treatment, before rising to 6.05 mg·100 g−1 in the W1N3 treatment. High-water irrigation significantly suppressed the accumulation of vitamin C. The W3N2 treatment exhibited 18.24% and 13.20% lower vitamin C content compared to the W2N2 and W1N2 treatments, respectively, suggesting that excessive irrigation is harmful to vitamin synthesis.
No significant differences in soluble protein content were observed among the different treatments. Under the same irrigation level, the soluble protein content gradually increased with nitrogen application. The W3N3 treatment showed the highest soluble protein content, which was 51.35% higher than of the CK treatment.
3.5. Effects of Different Treatments on Watermelon Yield
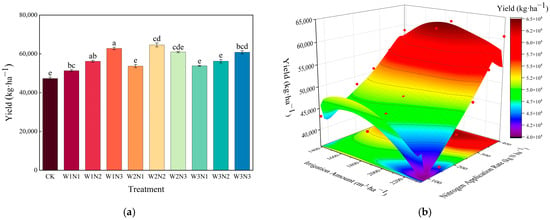
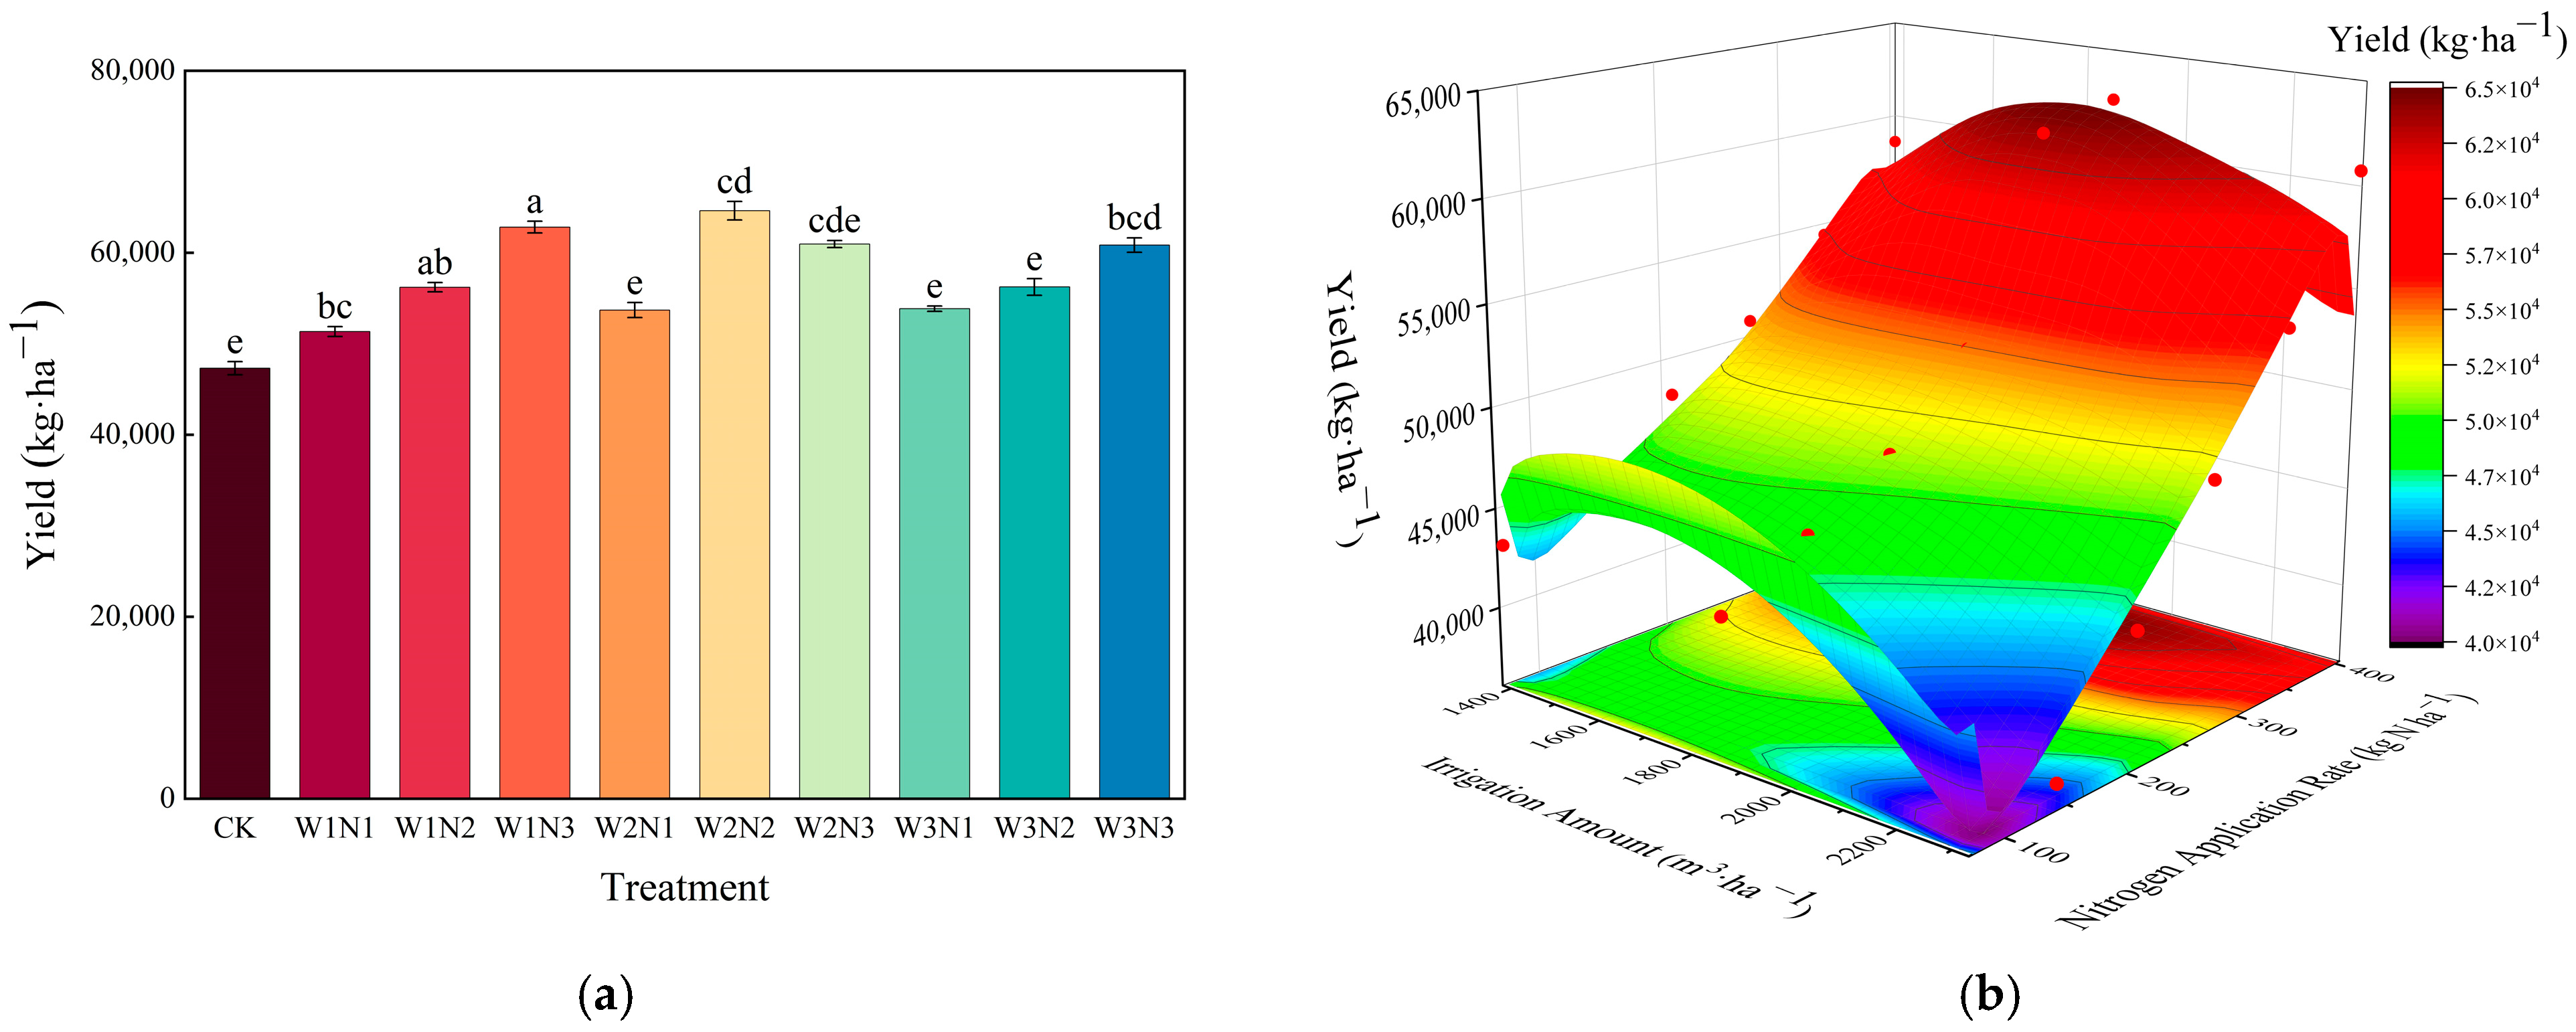
The watermelon yield and quality under different treatments are shown in Figure 5a. The yield of all treatments was significantly higher than that of the CK. The W2N2 treatment achieved the highest yield of 64,617.59 kg·ha−1, representing a significant increase of 36.60% compared with that of CK. In comparison, the W1N1 treatment yielded 51,332.35 kg·ha−1, only 8.51% higher than that of CK.
Figure 5.
(a) Effects of different water and nitrogen treatments on watermelon yield. (b) The fitted surface model of watermelon yield in relation to irrigation and nitrogen application rates under different treatments. Note: Different lowercase letters indicate significant differences between different treatments, p < 0.05.
Nitrogen application demonstrated a significant increase in yield. Under normal irrigation, the yield increased from 53,698.50 kg·ha−1 in W2N1 to 64,617.59 kg·ha−1 in W2N2, an increase of 20.33%. However, when the nitrogen application was further increased to W2N3,the yield decreased to 60,951.45 kg·ha−1, a reduction of 5.67%. This indicates that excessive nitrogen application can conversely limit yield improvement.
Under low nitrogen application, the yield increased with increasing irrigation volume. The W3N1 yield was 4.90% higher than that of W1N1. However, under high nitrogen conditions, the W3N1 yield was 3.23% higher than that of W3N3.
Notably, the medium-water, medium-nitrogen treatment (W2N2) not only achieved the highest yield among all treatments, it outperformed the high-nitrogen treatment under the same irrigation level (W2N3) and the high-water treatment (W3N2) under the same nitrogen level by 6.01% and 14.90%. This highlights the synergistic promoting effect of an appropriate water–nitrogen combination on yield, whereas increasing water or fertilizer input alone may reduce yield.
Based on the fitted response surface model, the results show in Figure 5b that the yield reached a maximum of 62,140 kg·ha−1 when the nitrogen application rate was 300 kg·ha−1 and the irrigation volume was 1800 m3·ha−1. However, excessive water and nitrogen inputs inhibited crop growth and reduced yield.
3.6. Effects of Different Treatments on Soil Nutrients in the Watermelon Root Zone
Table 4 shows the effects of different water and nitrogen treatments on soil nutrients in the watermelon root zone. Significant differences were observed in all soil physicochemical indicators in response to the water–nitrogen coupling.
Table 4.
Nutrient content in watermelon rhizosphere soil across treatments.
Water regulation primarily influenced changes in soil pH and electrical conductivity. As the irrigation amount increased, both pH and EC decreased. The pH was significantly lower under high-water irrigation treatments than under low-water irrigation treatments. High-water irrigation significantly reduced soil EC. The W3N3 treatment resulted in the lowest pH value, which was 2.12% lower than that of CK, whereas the W1N1 treatment led to a 3.36% increase compared with that of CK. This indicates that increasing the irrigation volume can effectively alleviate soil salinization.
Total soil nitrogen content exhibited a gradual increasing trend with higher nitrogen application rates across all irrigation levels. In the low-water irrigation treatment, TN in W1N3 was 50.70% higher than that in W1N1. Under medium-water irrigation, W2N3 showed a 64.71% increase compared with W2N1, and under high-water irrigation, W3N3 increased by 60.56% compared with W3N1. The W3N3 treatment yielded the highest TN content, representing a significant increase of 67.65% over the CK treatment.
Ammonium nitrogen (NH4+-N) was significantly positively correlated with the nitrogen application rate under both low- and high-water irrigation levels. The values increased by 13.15% from W1N1 to W1N3 and by 13.52% from W3N1 to W3N3. In contrast, under normal (medium) water irrigation, NH4+-N content initially increased and then decreased with increasing nitrogen application, peaking at the standard nitrogen treatment (likely N2).
The soil nitrate nitrogen (NO3−-N) content increased with rising nitrogen application and was also regulated by water. The accumulation of NO3−-N was most pronounced under high-water irrigation. The W3N3 treatment increased NO3−-N by 25.34% compared with CK and was 15.86% higher than the W3N1 treatment under the same water conditions. The medium-water treatment group displayed a unique pattern regarding NO3−-N content: the W2N3 treatment was significantly lower than other high-nitrogen treatments and showed little difference from W2N2. This suggests that medium-water conditions may inhibit NO3−-N accumulation by affecting the nitrification processes in the soil or the nitrate transformation rate.
Soil total carbon (TC) content exhibited an increasing trend with higher nitrogen application under low-water and medium-water conditions. W2N3 treatment increased TC by 11.1% compared with CK. In contrast, no significant differences in TC were observed under high-water conditions. The response of soil organic carbon (SOC) content to the water–nitrogen combination was consistent, showing significant increases with rising nitrogen application under both low- and high-water conditions, with increments of 22.7% and 25.0%, respectively. Furthermore, once a certain nitrogen level was reached, the water’s regulatory effect on SOC diminished.
3.7. Water Consumption Characteristics of Watermelon Under Different Treatments
3.7.1. Effects of Different Treatments on Total Water Consumption During the Entire Growth Period of Watermelon
Table 5 shows the water consumption during the watermelon growth period under different water and nitrogen treatments. The results indicate that the irrigation amount was the key factor determining plant water consumption, while the regulatory effect of nitrogen fertilizer application on the water consumption process exhibited significant water dependence.
Table 5.
Water consumption of watermelon across treatments.
The total water consumption during the entire growth period was significantly higher in the high-water irrigation treatments than in the medium- and low-water treatments. The total water consumption for W3N1, W3N2, and W3N3 treatments was 493.92, 484.48, and 489.93 mm, respectively, representing increases of 14.1% to 16.5% compared with the CK treatment. In contrast, the overall water consumption was relatively low in the medium-water treatments, with the W2N3 treatment consuming only 400.57 mm, a decrease of 5.34% compared to CK. All treatments under low-water irrigation were significantly lower than CK, with the W1N3 treatment showing the lowest water consumption, a reduction of 14.56% compared to CK.
Regarding water consumption distribution across growth stages, all treatments followed the following pattern: fruit expansion stage > vine elongation stage > flowering and fruit setting stage > maturity stage. The fruit expansion stage was identified as the critical period for determining water demand. Water consumption during this stage increased significantly under high-water irrigation. The W3N3 treatment reached 196.10 mm, a 15.46% increase over CK, whereas W1N2 and W1N3 were only 142.57 mm and 143.12 mm, respectively, representing decreases of 16.06% and 15.73%, respectively, in the low-water treatments. The regulation of water consumption by nitrogen fertilizer demonstrated a close interaction with water conditions. Under low-water irrigation, increasing nitrogen application did not increase total water consumption and even showed a suppressing trend; for instance, W1N3 was 1.35% lower than W1N1. However, under high-water conditions, increased nitrogen significantly affected distribution of stage-specific water consumption. The water consumption of W3N3 during the flowering and fruit setting stage reached 117.37 mm, which was significantly higher than that of W3N1. This indicates that increased nitrogen application can promote plant vegetative growth and physiological activities under sufficient water conditions, thereby enhancing water consumption intensity during specific stages.
3.7.2. Effects of Different Treatments on Water Use Efficiency in Watermelon
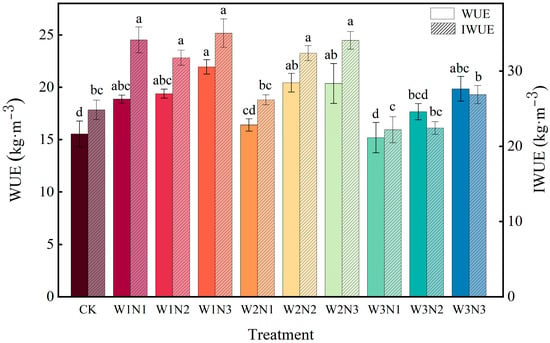
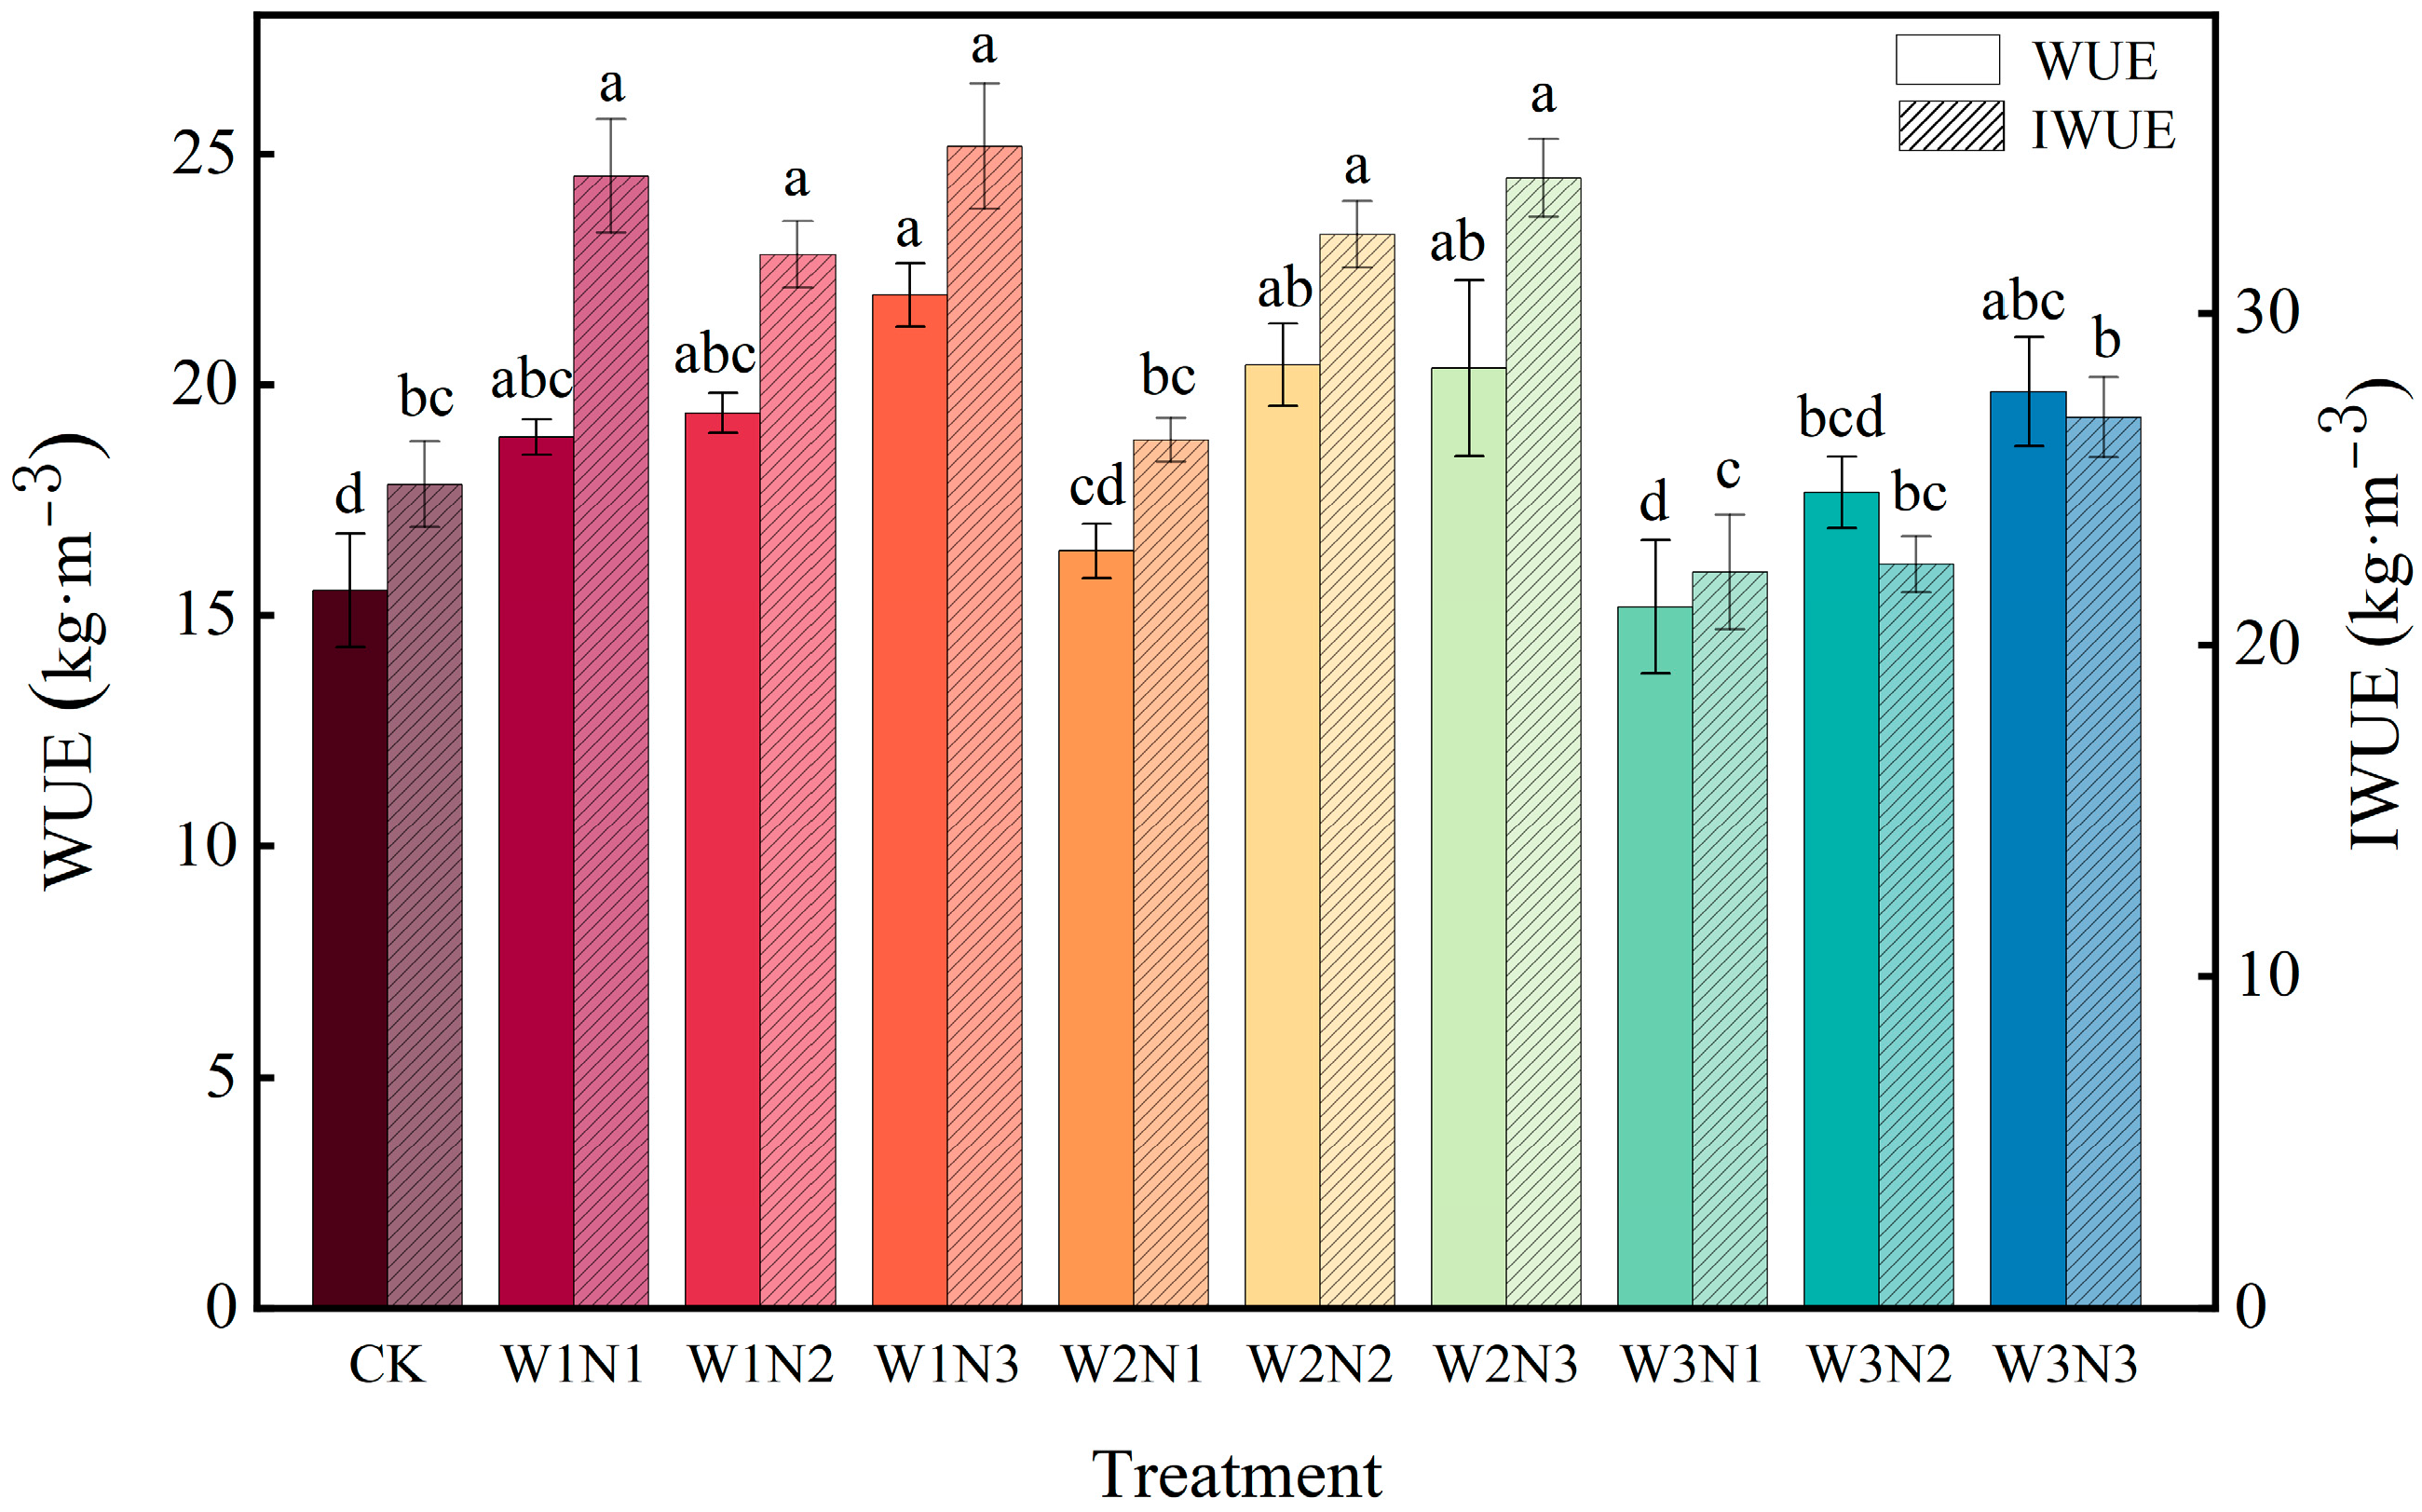
Figure 6 shows the analysis of WUE and irrigation water use efficiency (IWUE) under different water and nitrogen treatments. The results demonstrate that the irrigation amount was the dominant factor determining both efficiency indicators.
Figure 6.
Water use efficiency (WUE) and irrigation water use efficiency (IWUE) of watermelon across treatments. Different lowercase letters indicate significant differences between different treatments, p < 0.05.
WUE across all treatments ranged from 15.54 kg·m−3 to 21.94 kg·m−3. Overall, the WUE gradually decreased with increasing irrigation volume. The average WUE under the W3 irrigation level decreased by 7.82% and 12.46% compared to the W2 and W1 irrigation level, respectively. Under the same water conditions, increasing the nitrogen application generally improved the WUE. Under low-water conditions, WUE continuously increased with higher nitrogen rates, rising from 18.87 kg·m−3 in W1N1 to 21.94 kg·m−3 in W1N3, representing a 16.27% increase. Under medium-water conditions, WUE initially increased and then stabilized, reaching 20.43 kg/m3 in W2N2 and maintaining a similar level in W2N3. Under high-water conditions, WUE showed a steady increasing trend, growing from 15.19 kg·m−3 in W3N1 to 19.85 kg·m−3 in W3N3, an increase of 30.08%.
Pattern of variation in IWUE was generally consistent with that of WUE, but the differences were more pronounced. The IWUE of low-water treatments was significantly superior to that of other treatments. W1N1, W1N2, and W1N3 reached 34.15, 31.77, and 35.05 kg/m3, respectively, representing increases of 27.80% to 41.00% compared to the control treatment. The medium-water treatments followed, with W2N2 and W2N3 achieving 32.38 and 34.09 kg·m−3, respectively. High-water treatments showed the lowest IWUE, with W3N1 and W3N2 only reaching 22.20 and 22.43 kg·m−3, respectively, a decrease of 9.70% to 10.70% compared with the control.
The research findings indicate that while the decrease in water efficiency with increasing irrigation volume is an inevitable trend, optimizing nitrogen application strategies can effectively enhance water use efficiency. The low-water and high-nitrogen combination (W1N3) performed optimally in both efficiency indicators, representing the best water–nitrogen allocation scheme.
3.7.3. Effects of Different Water and Nitrogen Treatments on the Partial Factor Productivity of Nitrogen in Watermelon
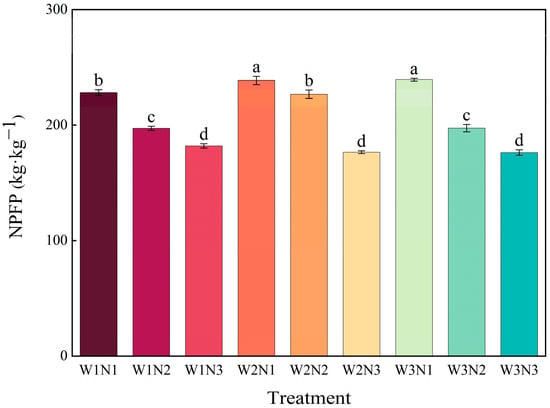
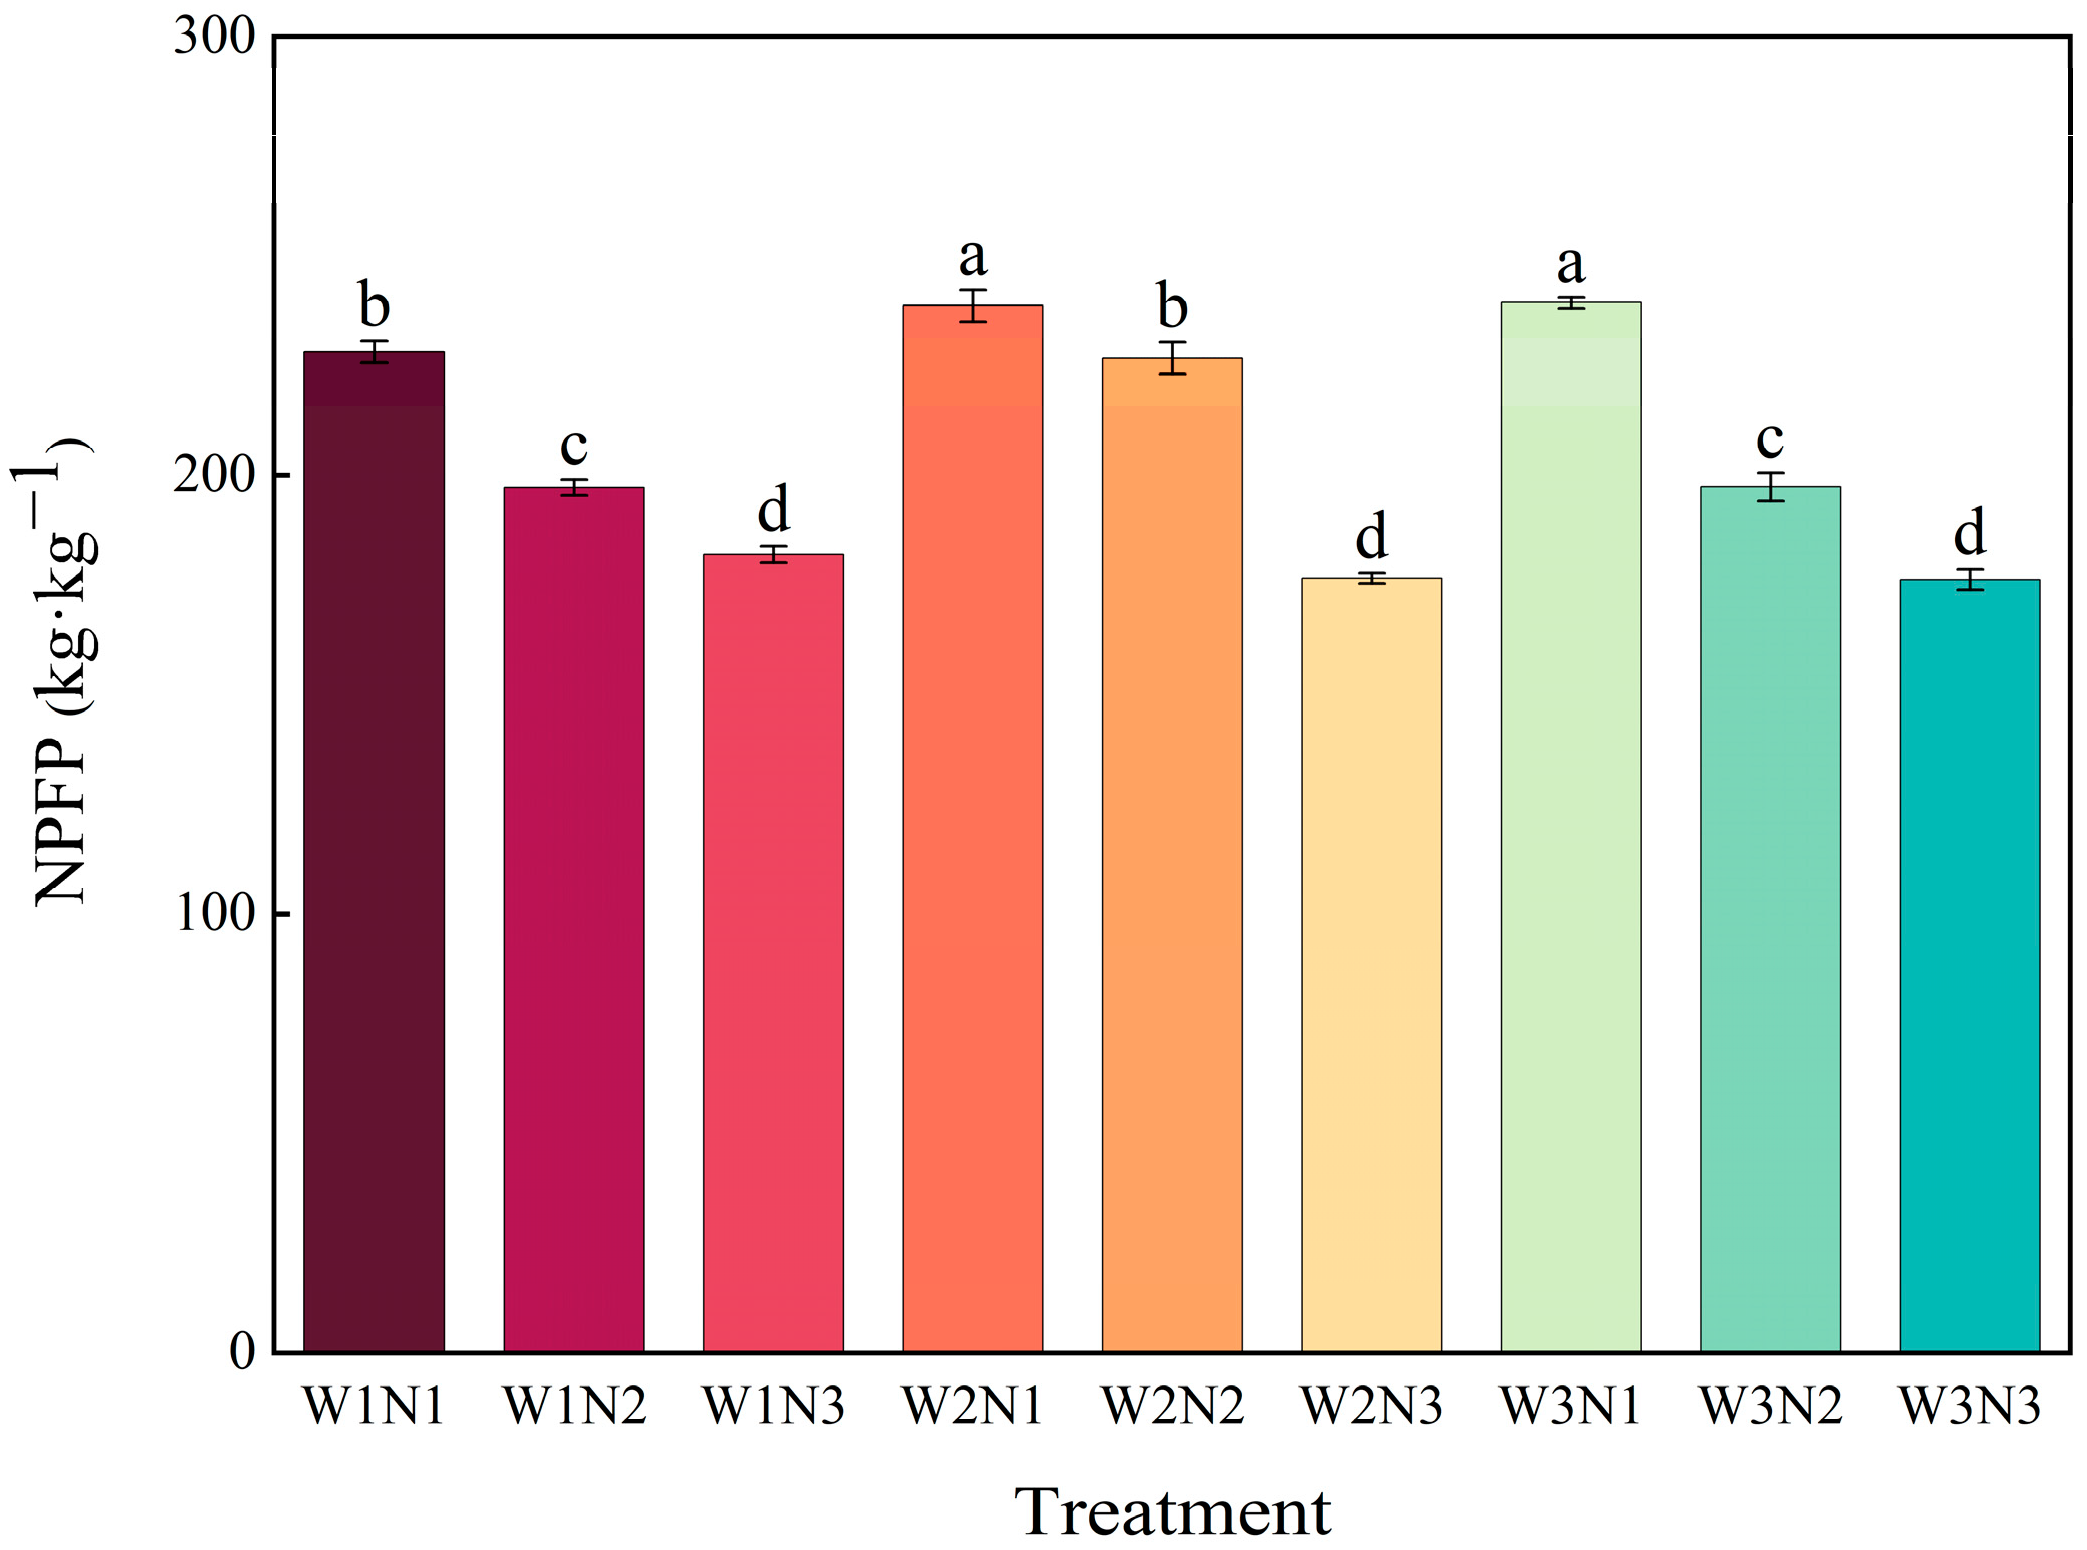
Different water and nitrogen treatments had significantly affected the partial factor productivity of nitrogen of watermelon, shown in Figure 7. Under the same irrigation condition, NPFP significantly decreased with increasing nitrogen application rate. Under low-water conditions, NPFP declined from 228.14 kg·kg−1 in W1N1 to 182.05 kg·kg−1 in W1N3, a reduction of 20.20%. Under medium-water conditions, it decreased from 228.66 kg·kg−1 in W2N1 to 176.76 kg·kg−1 in W2N3, a reduction of 26.32%. Under high-water conditions, its decrease was from 239.33 kg·kg−1 in W3N1 to 176.35 kg·kg−1 in W3N3, a reduction of 26.32%.
Figure 7.
Partial factor productivity of nitrogen in watermelon across treatments. Note: different lowercase letters indicate significant differences between different treatments, p < 0.05.
Notably, under the same nitrogen application level, the differences in NPFP among different water treatments were relatively small. Under the low-nitrogen level (N1), the NPFP for W1N1, W2N1, and W3N1 treatments were 228.14, 238.66, and 239.33 kg·kg−1, respectively, with a variation of less than 5%. Under medium-nitrogen-level conditions, the NPFP for each treatment remained between 197.20 and 226.73 kg·kg−1. Under high-nitrogen conditions, the values further converged to a range of 176.35–182.06 kg·kg−1.
Controlling nitrogen input is a key measure for maintaining a high NPFP. The NPFP of the low-nitrogen treatment (N1) resulted in a significantly higher NPFP than the medium- and high-nitrogen treatments. However, water management did not demonstrate a significant regulatory advantage under different nitrogen levels.
3.8. Comprehensive Evaluation of Watermelon Growth Based on the TOPSIS Method
Based on the TOPSIS method, this study selected dry matter accumulation, yield, soluble protein content, central sugar content, water use efficiency, and partial factor productivity of nitrogen as evaluation indicators to comprehensively assess watermelon growth under different water and nitrogen treatments. Since the CK treatment involved no nitrogen application, nine different water–nitrogen treatments were chosen as the decision alternatives. Firstly, the coefficient of variation method was employed to determine the weights of each indicator, and the comprehensive performance of watermelon growth under different water–nitrogen treatments was ranked accordingly, as shown in Table 6. Under this evaluation system, the top three treatments in terms of comprehensive ranking were W1N3 (low water, high nitrogen), with the highest score of 0.152, followed by W2N2 (medium water, medium nitrogen) and W3N3 (high water, high nitrogen), with scores of 0.146 and 0.136, respectively. Under the weight allocation based on the statistical variability of the indicators, the W1N3 treatment demonstrated optimal performance in balancing yield, quality, and water–nitrogen resource use efficiency.
Table 6.
Results of TOPSIS comprehensive evaluation for different water and nitrogen treatments based on coefficient of variation weight.
Using a subjective weight system with ‘marketable yield’ as the dominant factor, the TOPSIS evaluation was reconstructed, and the results are presented in Table 7. The ranking changed significantly under this scenario. Here, W2N2 (medium water, medium nitrogen) achieved the highest comprehensive score of 0.167, ranking first. The score for the W1N3 treatment also increased (0.156) but fell to second place. This indicates that when the decision-making objective shifts toward economic benefits, the W2N2 treatment exhibits stronger comprehensive advantages. Both evaluation systems consistently showed that the high-water, low-nitrogen combinations (W3N1 and W3N2) received the lowest comprehensive scores, representing the poorest water–nitrogen treatment combinations.
Table 7.
Results of TOPSIS comprehensive evaluation for different water and nitrogen treatments based on marketable yield-oriented weight.
4. Discussion
4.1. Regulatory Effects of Water–Nitrogen Coupling on Watermelon Plant Growth and Physiology
Water and nitrogen supply levels and their interaction have significant effects on the growth, development, and yield formation of watermelon. Moderate water stress combined with reasonable nitrogen fertilizer application can promote the vegetative growth of watermelon, increase chlorophyll content, enhance photosynthetic capacity, and create favorable conditions for dry matter accumulation [19]. Under low-water and normal-water irrigation conditions, increasing nitrogen application can effectively increase soil nitrogen content [20], thereby enhancing the root system’s absorption of soil nutrients [21], and consequently improving vine length, stem diameter, and dry matter accumulation. This is consistent with the research findings of Yousefi et al. [22]. Under conditions of high irrigation volume, as nitrogen fertilizer application increases, once the plant’s nitrogen absorption reaches saturation, excessive nitrogen fertilizer can instead inhibit the plant’s nitrogen uptake rate [23], leading to reductions in stem diameter, vine length, and dry matter mass. The accumulation and translocation of plant matter depend on its photosynthetic efficiency, a process primarily realized through the absorption and conversion of light energy by chlorophyll [24]. The chlorophyll content in watermelon leaves continuously increases from the vine extension stage to the fruit expansion stage and gradually declines upon reaching maturity. Yang et al. [25] investigated the effects of different nitrogen levels on watermelon growth and physiological indices, clarifying that chlorophyll content initially increases and then decreases with increasing nitrogen levels, which aligns with the results of the W3 treatment in this study. The absence of nitrogen application and excessive nitrogen application impose stress on chlorophyll, photosynthetic properties, and the photosynthetic apparatus [26], leading to stomatal closure [27], damage to the active centers of the photosystem [28], imbalance in energy conversion and distribution, and obstruction of electron transport [29]. In this study, under the W1N3 treatment, watermelon vine length, stem diameter, dry matter mass, and chlorophyll content were all maintained at relatively high levels; its physiological mechanism may be closely related to systemic nitrogen signal regulation. Adequate nitrogen supply in the root zone not only provides the structural basis for leaf area development and chlorophyll synthesis but may also inhibit the synthesis of the root nitrogen starvation signaling peptide (CEP1), thereby blocking the activation of the CEP1-CEPR2-BIK1 signaling pathway in guard cells [27]. The inhibition of this pathway helps maintain normal stomatal opening and closing responses, thereby preserving a higher photosynthetic carbon assimilation capacity under water-limited conditions, providing more photosynthetic products for the growth of vegetative organs, and ultimately promoting greater vine length. Stem diameter and dry matter accumulation were maintained at high levels.
4.2. Synergistic Effects of Water–Nitrogen Coupling on the Yield and Quality of Water
Rational fertilization and irrigation are fundamental for ensuring high crop yield and quality [30]. The results of this study indicate that an appropriate water–nitrogen combination synergistically optimizes watermelon morphogenesis and physiological metabolism, leading to significant yield improvement while effectively enhancing fruit quality. Under the same water conditions, watermelon yield, central sugar content, and soluble protein content gradually increased with rising nitrogen application, while vitamin C content exhibited an initial increase followed by a decrease. This suggests that excessive fertilization reduces watermelon vitamin C content, thereby compromising fruit quality. Under the same nitrogen application rate, yield initially increased and then decreased with increasing irrigation volume, with the W2N2 treatment producing the highest yield. This underscores the importance of rational water–nitrogen coupling.
The average watermelon yield in Southern Xinjiang is typically around 57,000 kg·ha−1. In this study, a fitted response surface model based on different water–nitrogen treatment combinations for irrigation amount, nitrogen application rate, and yield revealed that watermelon yield initially increased and then decreased with increasing water and fertilizer inputs. Yield reached its maximum when the irrigation volume and nitrogen application rate were 3700 m3·ha−1 and 240 kg·ha−1, respectively. This finding is largely consistent with the results reported by Li Jiale et al. [31].
However, Xue Liang et al. [32] found that maintaining soil moisture between 65% and 95% of field capacity and optimizing the nitrogen application rate to 200 kg·ha−1 could sustain high yield and quality. This discrepancy may be attributed to the high evaporation rates [33] and weak nutrient retention capacity of sandy soils in Southern Xinjiang [34], which lead to pronounced nitrogen losses. Additionally, the region’s abundant light and heat resources support high plant production potential, likely necessitating a higher nitrogen input to maximize yield. These differences highlight that optimal fertilization strategies are highly region-specific and must be tailored according to local climate, soil conditions, and production objectives.
4.3. Effects of Water–Nitrogen Coupling on the Rhizosphere Soil Environment and Water–Nitrogen Use Efficiency
The soils in the main watermelon and muskmelon production areas of Xinjiang commonly exhibit degraded characteristics of nutrient deficiency and a salt accumulation gradient [35]. Rational water–fertilizer coupling management, through the coordinated regulation of soil water–salt movement and nutrient supply, serves as a key approach to alleviating salt stress and improving soil fertility [8]. Organic fertilizer application can enhance soil nutrients and mitigate nutrient loss caused by excessive fertilization [36]. This study demonstrates that water–nitrogen management under organic fertilizer application has a significant regulatory effect on the physicochemical properties of the root zone soil. Notably, the W3N3 treatment significantly reduced soil pH. This is primarily because sandy loam soil has weak buffering capacity; after high-rate nitrogen fertilizer application, H+ produced during the nitrification process, under conditions of excessive irrigation promoting the leaching loss of base cations, is more likely to accumulate in soil colloids, leading to soil acidification and a decrease in pH [37]. Concurrently, soil electrical conductivity (EC) increased with rising nitrogen application under the same irrigation level, which is attributed to salt input. Under the same nitrogen application level, EC decreased with increasing irrigation volume, indicating a strong leaching effect of water on salts in sandy soil. Especially under the W1N3 treatment, insufficient effective water failed to leach salts accumulated in the root zone, resulting in salt concentration and increased EC [38]. The content of various nitrogen forms in the soil was positively correlated with the nitrogen application rate, indicating that external input is the direct source of the soil carbon pool [39]. However, the higher residual nitrate nitrogen under the W3N3 treatment is mainly attributed to the extremely high risk of nitrate leaching in sandy soil under excessive irrigation, where physical migration is the primary mechanism for nitrogen loss [40]. Organic carbon accumulation peaked under the W2N3 treatment, suggesting that moderate water stress creates optimal carbon stabilization conditions in a sandy soil environment [41]. Insufficient water under the W1 treatment limited microbial activity and crop growth, whereas excessive water under the W3 treatment may hinder organic matter accumulation by enhancing aerobic decomposition and increasing the risk of soluble organic carbon leaching [42]. Water use efficiency and irrigation water use efficiency peaked under the W1N3 treatment. This is mainly due to the inherently low water-holding capacity of sandy soil, which exacerbates plant water stress under water limitation, forcing crops to maintain higher photosynthetic productivity under limited water supply through physiological adaptation mechanisms such as stomatal regulation [43]. However, the improvement in water use efficiency was accompanied by a decrease in nitrogen fertilizer use efficiency. Nitrogen partial factor productivity showed a significant declining trend with increasing nitrogen application, indicating more complete nitrogen uptake and utilization by plants under conditions of sufficient water. The trade-off relationship between water and nitrogen use efficiencies stems from the crop’s resource allocation strategy in physiological metabolism. Under water stress conditions, plants require more nitrogen to participate in osmotic adjustment and antioxidant defense, whereas under nitrogen limitation, photosynthetic products are preferentially allocated to functional organs maintaining basic metabolism [44].
4.4. Validation and Application of the Optimal Water–Nitrogen Model Based on TOPSIS Comprehensive Evaluation
This study systematically analyzed the comprehensive effects of different water and nitrogen management strategies on watermelon growth and development from the two dimensions of statistical objectivity and market orientation using the TOPSIS comprehensive evaluation method. Both the W2N2 (medium water, medium nitrogen) and W1N3 (low water, high nitrogen) treatments performed excellently under different weight systems. However, the optimal ranking varied with the orientation of the evaluation objectives, reflecting the critical influence of goal-setting on scheme selection in agricultural management decision-making. If the aim is balanced development across all indicators, the low-water, high-nitrogen (W1N3) treatment shows certain advantages. Conversely, if economic return and market supply are the primary goals, the medium-water, medium-nitrogen (W2N2) treatment holds greater extension value.
Under both evaluation models, the high-water, low-nitrogen treatments (W3N1 and W3N2) performed poorly. This consistently indicates that under sandy loam soil conditions, nitrogen is a more critical growth-limiting factor than water. Excessive irrigation cannot alleviate nitrogen deficiency and may even exacerbate nutrient leaching, reducing resource use efficiency. Therefore, in water and fertilizer management in such ecological regions, priority should be given to ensuring adequate nitrogen supply, coupled with precise irrigation.
5. Conclusions
This study, through a multi-index comprehensive evaluation, confirms that in the arid and semi-arid watermelon production systems of Southern Xinjiang, adopting a management model with soil moisture maintained at 60–70% of field capacity combined with a nitrogen application rate of 300 kg·ha−1 can achieve the optimal balance between productivity and resource efficiency, demonstrating significant potential for widespread adoption. The total water consumption across different treatments ranged from 362.12 mm to 493.92 mm, with varying water requirements across growth stages. The fruit expansion stage demanded the most water, followed by the vine elongation and flowering–fruit setting stages, while the maturity stage exhibited a relatively lower water sensitivity index. Comprehensive analysis revealed that the W1N3 treatment achieved the best balance among the three key indicators: WUE, IWUE, and NPFP. This result verifies that moderate levels of water and nitrogen input can achieve synergistic optimization of resource utilization, providing a theoretical basis for the precise management of water and nitrogen in watermelon production within arid regions.
Author Contributions
Conceptualization, F.L.; methodology, Y.W.; software, Q.Y. and T.Z.; validation, M.R.; formal analysis, M.S.A.; resources, F.L.; writing—original draft preparation, Y.W.; supervision, S.Z.; project administration, F.L.; funding acquisition, F.L. All authors have read and agreed to the published version of the manuscript.
Funding
This work was supported by the Earmarked Fund for XJARS (XJARS-06), National Natural Science Foundation of China (42275014), Bingtuan Guiding Science and Technology Plan Program (2024ZD098), President’s foundation of Tarim University (TDZKCX202404).
Data Availability Statement
The original contributions presented in this study are included in the article. Further inquiries can be directed to the corresponding author(s).
Conflicts of Interest
All authors certify that they have no affiliations with or involvement in any organization or entity with any interest or non-financial interest in the subject matter or materials discussed in this manuscript.
References
- Yavuz, D.; Seymen, M.; Süheri, S.; Yavuz, N.; Türkmen, Ö.; Kurtar, E.S. How Do Rootstocks of Citron Watermelon (Citrullus lanatus Var. Citroides) Affect the Yield and Quality of Watermelon under Deficit Irrigation? Agric. Water Manag. 2020, 241, 106351. [Google Scholar] [CrossRef] [Scilit]
- Xinjiang Statistical Yearbook Editorial Committee. Xinjiang Statistical Yearbook; China Statistics Press: Beijing, China, 2021. Available online: https://tjj.xinjiang.gov.cn/tjj/nyypu/list_nj1.shtml (accessed on 20 October 2025). (In Chinese)
- Dhonde, M.; Sahu, K.; Murty, V.V.S. The Application of Solar-Driven Technologies for the Sustainable Development of Agriculture Farming: A Comprehensive Review. Rev. Environ. Sci. Biotechnol. 2022, 21, 139–167. [Google Scholar] [CrossRef] [Scilit]
- Kang, F.; Wang, Z.; Xiong, H.; Li, Y.; Wang, Y.; Fan, Z.; Zhao, H.; Kuang, D.; Chen, Z.; Wang, J.; et al. Estimation of Watermelon Nutrient Requirements Based on the QUEFTS Model. Agronomy 2020, 10, 1776. [Google Scholar] [CrossRef] [Scilit]
- Shakoor, A.; Shakoor, S.; Rehman, A.; Ashraf, F.; Abdullah, M.; Shahzad, S.M.; Farooq, T.H.; Ashraf, M.; Manzoor, M.A.; Altaf, M.M.; et al. Effect of Animal Manure, Crop Type, Climate Zone, and Soil Attributes on Greenhouse Gas Emissions from Agricultural Soils—A Global Meta-Analysis. J. Clean. Prod. 2021, 278, 124019. [Google Scholar] [CrossRef] [Scilit]
- Mahmood, F.; Khan, I.; Ashraf, U.; Shahzad, T.; Hussain, S.; Shahid, M.; Abid, M.; Ullah, S. Effects of Organic and Inorganic Manures on Maize and Their Residual Impact on Soil Physico-Chemical Properties. J. Soil Sci. Plant Nutr. 2017, 17, 22–32. [Google Scholar] [CrossRef] [Scilit]
- Wu, T.; Li, C.; Xing, X.; Pan, X.; Liu, C.; Tian, Y.; Wang, Z.; Zhao, J.; Wang, J.; He, B. Straw Return and Organic Fertilizers Instead of Chemical Fertilizers on Growth, Yield and Quality of Rice. Earth Sci. Inform. 2022, 15, 1363–1369. [Google Scholar] [CrossRef] [Scilit]
- Jin, D.; Lu, Z.; Song, X.; Ahammed, G.J.; Yan, Y.; Chen, S. Improvement of Yield and Quality Properties of Radish by the Organic Fertilizer Application Combined with the Reduction of Chemical Fertilizer. Agronomy 2024, 14, 1847. [Google Scholar] [CrossRef] [Scilit]
- Xing, Y.; Xie, Y.; Wang, X. Enhancing Soil Health through Balanced Fertilization: A Pathway to Sustainable Agriculture and Food Security. Front. Microbiol. 2025, 16, 1536524. [Google Scholar] [CrossRef] [Scilit]
- Naghdyzadegan Jahromi, M.; Razzaghi, F.; Zand-Parsa, S. Strategies to Increase Barley Production and Water Use Efficiency by Combining Deficit Irrigation and Nitrogen Fertilizer. Irrig. Sci. 2023, 41, 261–275. [Google Scholar] [CrossRef] [Scilit]
- Wang, Y.; Li, S.; Liang, H.; Hu, K.; Qin, S.; Guo, H. Comparison of Water- and Nitrogen-Use Efficiency over Drip Irrigation with Border Irrigation Based on a Model Approach. Agronomy 2020, 10, 1890. [Google Scholar] [CrossRef] [Scilit]
- Fan, Z.; Lin, S.; Zhang, X.; Jiang, Z.; Yang, K.; Jian, D.; Chen, Y.; Li, J.; Chen, Q.; Wang, J. Conventional Flooding Irrigation Causes an Overuse of Nitrogen Fertilizer and Low Nitrogen Use Efficiency in Intensively Used Solar Greenhouse Vegetable Production. Agric. Water Manag. 2014, 144, 11–19. [Google Scholar] [CrossRef] [Scilit]
- Zheng, W.; Wang, S.; Sun, H.; Shen, Y.; Cao, J. Rainfall Driven Nitrate Transport in Runoff of Hilly Area by Combining Time-Series Monitoring of Hydrochemistry and Stable Isotopes. J. Hydrol. 2025, 654, 132830. [Google Scholar] [CrossRef] [Scilit]
- Wang, H.; Wang, N.; Quan, H.; Zhang, F.; Fan, J.; Feng, H.; Cheng, M.; Liao, Z.; Wang, X.; Xiang, Y. Yield and Water Productivity of Crops, Vegetables and Fruits under Subsurface Drip Irrigation: A Global Meta-Analysis. Agric. Water Manag. 2022, 269, 107645. [Google Scholar] [CrossRef] [Scilit]
- Liu, H.; Mi, X.; Wei, L.; Kang, J.; He, G. Integrated Nitrogen Fertilizer Management for Improving Wheat Yield and the Efficiency of Water and Nitrogen Fertilizer Use. Eur. J. Agron. 2024, 159, 127264. [Google Scholar] [CrossRef] [Scilit]
- Wang, H.; Wu, L.; Cheng, M.; Fan, J.; Zhang, F.; Zou, Y.; Chau, H.W.; Gao, Z.; Wang, X. Coupling Effects of Water and Fertilizer on Yield, Water and Fertilizer Use Efficiency of Drip-Fertigated Cotton in Northern Xinjiang, China. Field Crops Res. 2018, 219, 169–179. [Google Scholar] [CrossRef] [Scilit]
- Behzadian, M.; Khanmohammadi Otaghsara, S.; Yazdani, M.; Ignatius, J. A State-of the-Art Survey of TOPSIS Applications. Expert Syst. Appl. 2012, 39, 13051–13069. [Google Scholar] [CrossRef] [Scilit]
- Zhou, X.; Tan, W.; Sun, Y.; Huang, T.; Yang, C. Multi-Objective Optimization and Decision Making for Integrated Energy System Using STA and Fuzzy TOPSIS. Expert Syst. Appl. 2024, 240, 122539. [Google Scholar] [CrossRef] [Scilit]
- Chiofalo, M.T.; Bekkai, D.; Mileto, S.; Furnari, P.; Genovese, G.; Trifilò, P. Early Water-Status Indicators under Combined Metal Toxicity and Drought in Tomato Leaves. Plant Physiol. Biochem. 2025, 229, 110367. [Google Scholar] [CrossRef] [Scilit]
- Chen, Y.; Xiao, C.; Wu, D.; Xia, T.; Chen, Q.; Chen, F.; Yuan, L.; Mi, G. Effects of Nitrogen Application Rate on Grain Yield and Grain Nitrogen Concentration in Two Maize Hybrids with Contrasting Nitrogen Remobilization Efficiency. Eur. J. Agron. 2015, 62, 79–89. [Google Scholar] [CrossRef] [Scilit]
- Li, C.; Li, Y.; Yang, J.; Lian, B.; Wang, J.; Zou, G. Regulating Root Structure of Potted Lettuce to Magnify Absorption from APP and UAN Fertilizers. Front. Plant Sci. 2024, 15, 1407984. [Google Scholar] [CrossRef] [Scilit]
- Yousefi, A.; Nabati, J.; Mirzaeetalarposhti, R.; Malakshahi Kurdestani, A. Optimizing Mung Bean Productivity and Root Morphology with Biofertilizers for Sustainable Farming. Sci. Rep. 2025, 15, 40333. [Google Scholar] [CrossRef] [Scilit]
- Barandalla, L.; Alvarez-Morezuelas, A.; Iribar, C.; Ritter, E.; Riga, P.; Lacuesta, M.; De Galarreta, J.I.R. Physiological Response to Nitrogen Deficit in Potato Under Greenhouse Conditions. Plants 2025, 14, 3237. [Google Scholar] [CrossRef] [Scilit]
- Nguyen, T.N.P.; Sung, J. Light Spectral-Ranged Specific Metabolisms of Plant Pigments. Metabolites 2024, 15, 1. [Google Scholar] [CrossRef] [Scilit]
- Yang, Z.; Kong, T.; Xie, J.; Yang, T.; Jiang, Y.; Feng, Z.; Zhang, Z. Appropriate Water and Fertilizer Supply Can Increase Yield by Promoting Growth While Ensuring the Soil Ecological Environment in Melon Production. Agric. Water Manag. 2023, 289, 108561. [Google Scholar] [CrossRef] [Scilit]
- Cun, Z.; Wu, H.-M.; Zhang, J.-Y.; Shuang, S.-P.; Hong, J.; Chen, J.-W. Responses of Linear and Cyclic Electron Flow to Nitrogen Stress in an N-Sensitive Species Panax Notoginseng. Front. Plant Sci. 2022, 13, 796931. [Google Scholar] [CrossRef] [Scilit]
- Wang, L.; Chen, S.; Shi, W.; Xing, S.; Han, C.; Bai, M.-Y.; Fan, M. Nitrate Starvation Inhibits Stomatal Opening via the Long-Distance CEP1-CEPR2 Signaling Cascade. Cell Rep. 2025, 44, 116424. [Google Scholar] [CrossRef] [Scilit]
- Li, Z.; Lan, T.; Zhang, J.; Gao, K.; Beardall, J.; Wu, Y. Nitrogen Limitation Decreases the Repair Capacity and Enhances Photoinhibition of Photosystem II in a Diatom. Photochem. Photobiol. 2021, 97, 745–752. [Google Scholar] [CrossRef] [Scilit]
- Shang, J.; Gao, T.; Wang, W.; Zhou, X.; Zong, Y. Effect of Nitrogen Addition for Two Consecutive Years on Photosynthetic Characteristics, Carbon and Nitrogen Distribution of Populus × euramericana ‘Zhongjin7’ Seedlings. SCI.SILV.SIN 2022, 58, 23–32. Available online: http://www.linyekexue.net/CN/10.11707/j.1001-7488.20220603 (accessed on 25 October 2025).
- Wang, J.; Wang, C.; Long, H.; Bryant, R.; Drohan, P.J.; Qu, F.; Liu, D.; Zhu, G.; Wang, Z.; Wang, L. Effects of Nitrogen Reduction on the Agronomic Characteristics, Quality, and Water and Fertilizer Use Efficiency of Tomato (Lycopersicon esculintum mill.) between Drip Fertigation and Negative-Pressure Fertigation. Irrig. Sci. 2025, 43, 305–319. [Google Scholar] [CrossRef] [Scilit]
- Li, J.; Wang, X.; Yang, X.; Li, H.; Yang, W. Regulation effects of different water and nitrogen combinations on watermelon growth, yield, and water and nitrogen use efficiency in sand removal field. Agric. Res. Arid. Areas 2025, 43, 180–191. Available online: http://ghdqnyyj.ijournal.cn/ghdqnyyj/ch/reader/view_abstract.aspx?file_no=20250119 (accessed on 25 October 2025).
- Xue, L.; Ma, Z.; Zhao, A.; Luo, S.; Xue, L.; Muhammad, A. Effects of water-nitrogen coupling on NH3 and N2O emissions from drip-irrigated watermelon in the Hexi irrigation area. Arid. Land. Geography 2025, 48, 801–811. Available online: http://alg.xjegi.com/CN/10.12118/j.issn.1000-6060.2024.377 (accessed on 25 October 2025).
- Li, X.; Shi, F. Salt Precipitation and Evaporative Flux on Sandy Soil with Saline Groundwater under Different Evaporation Demand Conditions. Soil Res. 2022, 60, 187–196. [Google Scholar] [CrossRef] [Scilit]
- Musei, S.K.; Kuyah, S.; Nyawira, S.; Ng’ang’a, S.K.; Karugu, W.N.; Smucker, A.; Nkurunziza, L. Sandy Soil Reclamation Technologies to Improve Crop Productivity and Soil Health: A Review. Front. Soil Sci. 2024, 4, 1345895. [Google Scholar] [CrossRef] [Scilit]
- Bai, Z.; Liu, H.; Li, J.; Li, M.; Gong, P.; Li, P.; Li, L. Eight-Year Comparison of Agroeconomic Benefits of Open Ditch and Subsurface Pipe Drainage in Mulched Drip Irrigated Saline–Sodic Farmland. Irrig. Sci. 2023, 41, 687–699. [Google Scholar] [CrossRef] [Scilit]
- Lu, W.; Hao, Z.; Ma, X.; Gao, J.; Fan, X.; Guo, J.; Li, J.; Lin, M.; Zhou, Y. Effects of Different Proportions of Organic Fertilizer Replacing Chemical Fertilizer on Soil Nutrients and Fertilizer Utilization in Gray Desert Soil. Agronomy 2024, 14, 228. [Google Scholar] [CrossRef] [Scilit]
- Wang, P.; Xu, D.; Lakshmanan, P.; Deng, Y.; Zhu, Q.; Zhang, F. Mitigation Strategies for Soil Acidification Based on Optimal Nitrogen Management. Front. Agric. Sci. Eng. 2024, 11, 229–242. [Google Scholar] [CrossRef] [Scilit]
- Hu, Q.; Xiao, Y.; Li, H.; Wang, X.; Lin, J.; Zhao, W.; Zhou, Z.; Chen, G.; Han, L.; Cao, N.; et al. Impact of “Dry Sowing and Wet Emergence” Water Regulation on Cotton Soil Water and Salt Dynamics, Root Growth and Yield. Front. Plant Sci. 2025, 16, 1685785. [Google Scholar] [CrossRef] [Scilit]
- Hasegawa, S.; Marshall, J.; Sparrman, T.; Näsholm, T. Decadal Nitrogen Addition Alters Chemical Composition of Soil Organic Matter in a Boreal Forest. Geoderma 2021, 386, 114906. [Google Scholar] [CrossRef] [Scilit]
- Campbell, T.; Ruark, M.; Boswell, E.; Lowery, B. Enhanced Efficiency Fertilizers, Potato Production, and Nitrate Leaching in the Wisconsin Central Sands. J. Environ. Qual. 2025, 54, 397–409. [Google Scholar] [CrossRef] [Scilit]
- Matteau, J.-P.; Célicourt, P.; Létourneau, G.; Gumiere, T.; Walter, C.; Gumiere, S.J. Association between Irrigation Thresholds and Promotion of Soil Organic Carbon Decomposition in Sandy Soil. Sci. Rep. 2021, 11, 6733. [Google Scholar] [CrossRef] [Scilit]
- Védère, C.; Lebrun, M.; Honvault, N.; Aubertin, M.-L.; Girardin, C.; Garnier, P.; Dignac, M.-F.; Houben, D.; Rumpel, C. How Does Soil Water Status Influence the Fate of Soil Organic Matter? A Review of Processes across Scales. Earth Sci. Rev. 2022, 234, 104214. [Google Scholar] [CrossRef] [Scilit]
- Yang, K.; Hu, J.; Ren, Y.; Zhang, Z.; Tang, M.; Shang, Z.; Zhen, Q.; Zheng, J. Enhancement of Soil Organic Carbon, Water Use Efficiency and Maize Yield (Zea mays L.) in Sandy Soil through Organic Amendment (Grass Peat) Incorporation. Agronomy 2024, 14, 353. [Google Scholar] [CrossRef] [Scilit]
- Li, Y.; Xu, X.; Chen, Z.; Xiong, Y.; Huang, Q.; Huang, G. A Process Simulation-Based Framework for Resource, Food, and Ecology Trade-off by Optimizing Irrigation and N Management. J. Hydrol. 2023, 617, 129035. [Google Scholar] [CrossRef] [Scilit]

Disclaimer/Publisher’s Note: The statements, opinions and data contained in all publications are solely those of the individual author(s) and contributor(s) and not of MDPI and/or the editor(s). MDPI and/or the editor(s) disclaim responsibility for any injury to people or property resulting from any ideas, methods, instructions or products referred to in the content. |
© 2026 by the authors. Licensee MDPI, Basel, Switzerland. This article is an open access article distributed under the terms and conditions of the Creative Commons Attribution (CC BY) license.