


Abstract
The Nepetoideae and the Lamioideae are the largest subfamilies of the family Lamiaceae comprising more than half of the family’s species including mostly shrubs or herbs, many of which are applied as culinary and medicinal herbs. The results of previous analysis of twenty-one species in the subfamily Nepetoideae indicated a relationship of nutlet size and shape with the taxonomic position, with larger nutlets in the tribe Elsholtzieae, intermediate in the tribe Ocimeae, and smaller in the tribe Mentheae, except for Salvia species. This work focuses on 49 species, 34 in the Nepetoideae and 15 in the Lamioideae, and shows differences in nutlet size and shape between both subfamilies. The nutlets of the Lamioideae are larger and have higher aspect ratio and lower circularity, roundness, and solidity values. Elliptic Fourier Transform equations were obtained allowing the representation of average outlines for each of these species. Curvature analysis indicates higher absolute values of maximum and average curvature in the subfamily Lamioideae. Morphometric analysis including geometric measurements, curvature, and the coefficients of Fourier equations reveals differences between genera and species in both subfamilies of the Lamiaceae that can be of applied interest in the taxonomy of this family.
1. Introduction
The Lamiaceae (syn. Labiatae) is a large family of mostly shrubby or herbaceous annual or perennial plants. It comprises over 7000 species and over 230 genera [1]. Many of these species are used as culinary or medicinal herbs [2,3]. The most recent taxonomic classification recognizes seven different subfamilies, plus ten genera not placed in any of the subfamilies. The subfamilies are the Symphorematoideae Wight, Viticoideae Briq., Ajugoideae Kostel, Prostantheroideae Luerss, Nepetoideae (Dumort.) Luerss, Scutellarioideae, and Lamioideae Harley [4]. The largest of these subfamilies is Nepetoideae, which contains close to 3700 species—about half of the total number of species in the Lamiaceae family. This includes well-known aromatic herbs, such as mint, basil, and lavender [4,5].
The subfamily: Lamioideae (Harley) is the second largest subfamily, comprising over 1200 species (approximately sixty genera) of shrubs or herbs with a widespread distribution [6,7]. Both subfamilies are monophyletic, as supported by molecular analyses [1,5,6,7]. According to the most recent phylogenomic studies, the tribal classification of the subfamily Nepetoideae (tribes Elsholtzieae, Mentheae and Ocimeae) is well defined. However, the tribal relationships within the subfamily Lamioideae are less clear [2,8], with tribes highly variable, such as the Leonurideae [9], and certain genera not yet assigned to a tribe.
Previous research in the Lamiaceae shows that nutlet morphology is valuable for identifying species in this family [10,11,12,13,14,15,16,17,18,19,20,21,22,23,24,25,26], either alone [10,11,12,13,14,15,17,18,19,20,21,23], or in combination with other characteristics such as pollen morphology [25] or other anatomical, morphological, or genetic properties [26]. A significant aspect under study focuses on the external morphology of the nutlets, as observed through optical and scanning electron microscopy (SEM) [11,12,13,14,15,17,18,19,20,23,24,25], with particular attention given to the size measurements (length, width, and length-to-width ratio). Shape descriptions often use non-quantitative, descriptive, classical geometric adjectives (e.g., elliptic, oblong, ovoid, prolate spheroidal, rounded, or rounded-trigonous) and highlight their potential as key taxonomic markers. A significant proportion of the published work on this subject focuses on species of Salvia L. [12,13,14,15,16,17], which is the largest genus in the family, as well as other genera in the subfam. Nepetoideae, such as Clinopodium L. [21], Nepeta L. [22], and Plectranthus L’Her. [23], or in the subfam. Lamioideae, such as Sideritis L. [24], and Marrubium L. [25].
In a recent study of twenty-one species belonging to nine genera of the Nepetoideae, a direct relationship was found between size and taxonomic position, with the smallest nutlets found in the tribe Mentheae, intermediate nutlets found in the tribe Ocimeae, and the largest nutlets found in the tribe Elsholtzieae [27]. An exception to this rule was the genus Salvia, which is the largest in this family, with around 1000 species of cosmopolitan distribution [28]. The range of sizes observed in Salvia nutlets was larger than that observed in other genera of the Mentheae and like that observed in Elsholtzieae. The study included a principal component analysis (PCA) showing that the variation could be grouped into two components as follows: size (PC1), including the measurements of length, width, area, and perimeter; and shape (PC2), including roundness, circularity, and solidity. Analysis of curvature in species of five genera—Mentha L., Salvia, and Thymus L. in the Mentheae tribe and Lavandula L. and Ocimum L. in the Ocimeae tribe—revealed that nutlet outlines exhibited partial negative curvature values in species of all genera except Salvia. The PCA revealed two principal components with average curvature associated with size measurements.
The work presented here describes the morphological analysis based on general measurements (area, perimeter, length, width, circularity, aspect ratio, roundness, and solidity) and curvature analysis in the nutlet outlines for the subfamilies Nepetoideae and Lamioideae. Additionally, Fourier coefficients were obtained and average outlines (Aos) resulting from these coefficients were drawn and compared to those obtained manually.
The representation of seed outlines based on Elliptic Fourier Transform (EFT) equations has been applied to diverse genera such as Vitis L. (Vitaceae) [29], the date palm Phoenix dactilifera L. (Arecaceae) [30], Papaver somniferum L. (Papaveraceae) [31], Silene L. (Caryophyllaceae) [32], and is here applied for the first time to the nutlets of the Lamiaceae. The method automatically extracts coordinates from outlines and provides equations that correspond to geometric figures representative of the outline of the seed or nutlet. This gives an idea of the basic geometry of seed/nutlet shape and helps with the quantitative analysis of shape, allowing comparisons to be made between different species or populations.
Any closed-plane curve may be approximated using sums of trigonometric functions as truncated Fourier expansions [33,34]. When the parametric components are piecewise linear functions these expansions are:
where and define the mean size of the contour, and the coefficients are calculated as
The coefficients of EFT equations can be extracted automatically with the software Momocs 1.4.1 [35]. The number N of harmonics determines the degree of precision in the adjustment of the closed curve to the image outline and it may vary depending on the objectives of the study as well as on the characteristics of the image under analysis. While the low-order coefficients ) define the basic structure of the curves, the higher-order coefficients are responsible for surface details. In addition, b and c coefficients determine the symmetry of the curve. Curves with bilateral symmetry may have .
The objectives of this study are (1) to investigate in detail the relationship between nutlet size and shape in the two largest subfamilies of the Lamiaceae, Nepetoideae, and Lamioideae; and (2) to explore the potential of EFT for the analysis of nutlet shape in this family. Factorial analysis using Principal Component Analysis (PCA), a data reduction technique, was applied to identify the relationship between Fourier coefficients and size and shape measurements, including curvature values.
2. Materials and Methods
2.1. Nutlets
A total of 50 Lamiaceae samples were studied from different taxa, including hybrids (Table 1). The selected taxa belong to the subfamilies Nepetoideae and Lamioideae, with 34 samples of 13 genera and 15 samples of 7 genera, respectively. The number of species analyzed per genus was variable from one (e.g., Agastache J. Clayton ex Gronov., Mentha, Nepeta, Origanum L.), two (e.g., Leonurus L., Stachys L.), three (e.g., Clinopodium, Dracocephalum L., Lavandula, Ocimum), four (e.g., Sideritis, Phlomis L.) to thirteen for the specific case of the genus Salvia.
Table 1.
List of the studied taxa in this work. Taxa from numbers 1 to 34 correspond to subfamily Nepetoideae, and from numbers 35 to 49 to subfamily Lamioideae. The studied material obtained from the germplasm collection of the Botanical Garden of Torretes (Spain) is mentioned as Collection Torretes. Species used in PCA are numbers 2, 3, 4, 8, 9, 10, 15, 16, 18- 21, 24, 25, 29, 30, 40–42, 45–47, 49, and 50 (FamLamiaceae 2 in Supplementary Materials).
2.2. Photography
Photographs of individual nutlets were taken using a Nikon stereomicroscope model SMZ1500 (Nikon, Tokyo, Japan) equipped with a TOUPTEK ToupCam X7CAM4K 16MPB (Hangzhou, Zhejiang, China). The photographs were saved as JPG images of 5440 × 3060 with 96 ppi. One image containing 20 nutlets was prepared for each species. The images are available in Zenodo (Supplementary Materials, Figure S1). Images for the PCA were made with six nutlets for each species (Supplementary Materials, Figure S2).
2.3. Morphological Measurements
Nutlet image area (A), perimeter (P), major axis length (L), minor axis length (W), aspect ratio (AR = L/W), circularity (C), roundness (R), and solidity (S) were measured using the ImageJ program v1.8.0 [36]. The program converts pixels into mm according to a ruler contained in the images. Thus, the measurements refer to the nutlet images in the photographs. Circularity is the ratio:
where A is the area and P is the perimeter. The aspect ratio is the quotient L/W, where L is the length, and W is the width. The roundness is given by:
Solidity is a property of closed-plane curves related to their convexity. It expresses the ratio of the area of an object to the area of its convex Hull (i.e., the smallest convex set that contains the plane figure).
2.4. Average Outlines for Each Species
Average outlines (Aos) are single images of continuous, closed curves that give an idea of nutlet shape in each species. Here, they are created by the following two methods: (i) manually, based on image analysis by Corel PhotoPaint 24.5.0.731 (Corel Corporation; Ottawa, ON, Canada) from JPG containing 20 nutlets of each species, as described by Cervantes et al. [37]; and (ii) based on Fourier coefficients.
2.5. Extraction of Fourier Coefficients from the Images with Momocs
Images containing 20 nutlets were converted into .TPS files, with the coordinates for each outline extracted in accordance with the protocol outlined in Momocs v1.4.0 [35]. The corresponding coefficients were then applied to Mathematica equations to determine the Aos relative to each specimen. In the parametric equations representing the curves, only coefficients belonging to harmonics were considered. Also, values were fixed, thus leaving a total of 6 × 4 − 3 = 21 varying coefficients. Equations with 21 coefficients were used for the average outlines. Nevertheless, and coefficients were shown not to have a significant effect in the final shape and in the PCA were discarded.
2.6. Curvature Analysis
Curvature indicates the rate of change in the slope along the points in a curve. Maximum, minimum, and average curvatures were determined for the nutlet outlines departing from a series of points delineating the nutlets’ profiles, automatically obtained using the Analyze Line Graph function in ImageJ 1.54 g software. From the list of points defining the outline, the corresponding Bézier curve and curvature measurements were obtained according to published protocols [38]. Curvature is provided in mm−1; thus, a curvature of 1 corresponds to a circumference of 1 mm and a curvature of 10 to a circumference of 100 µm (0.1 mm). Maximum and minimum curvature values indicate major changes in slope of the curve. Curvature equals 0 in a straight line and is constant in a circumference. Therefore, the greater the difference between the maximum and minimum curvature values and the average curvature, the greater the departure from circularity. A low maximum-to-average curvature ratio indicates more constant curvature values, which are associated with figures approaching a circumference. Negative values indicate changes in slope direction and thus non-convex regions. The results of curvature analysis are given in Zenodo (Supplementary Materials, Figure S3). For the general statistical analysis curvature was calculated automatically on the Aos for each species (Supplementary Materials, Table S1), while for genera and species comparison and PCA curvature is based on individual nutlet images (six images per species).
2.7. Statistical Analysis
Statistical analysis was performed with IBM SPSS statistics v28 (SPSS 2021) and PCA was performed with R [39]. As some of the measurements did not follow a Gaussian distribution, non-parametric tests were applied for the comparisons. Kruskal–Wallis tests were performed in the cases involving three or more populations and Mann–Whitney U-test in the cases involving two populations. Statistical analysis for the comparison between subfamilies and between genera within each subfamily included the variables area, perimeter, length, width, circularity, aspect ratio, roundness, solidity, and curvature and was based on twenty nutlets per species (see Table S1 in the Supplementary Materials). The comparisons between species included general morphometry measurements (area, perimeter, length, width, circularity, aspect ratio, roundness, and solidity), Fourier coefficients, and curvature data from six nutlets per species (Table S2 in the Supplementary Materials). The species for this analysis are indicated in the legend to Table 1. PCA was performed on this group, and the objectives were to test the association between general morphometric measurements, curvature values, and the Fourier coefficients [40].
3. Results
3.1. Average Outlines for Each Species
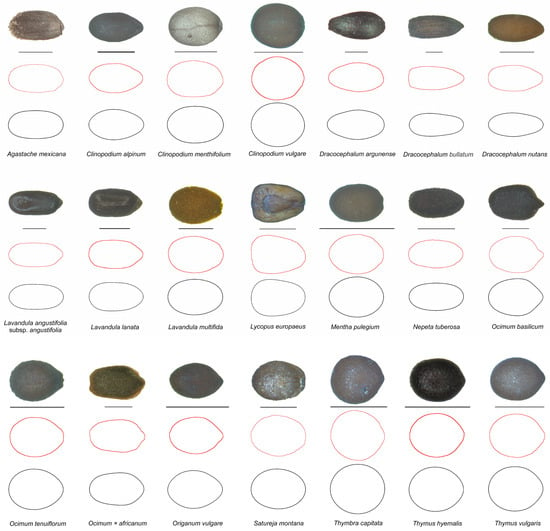
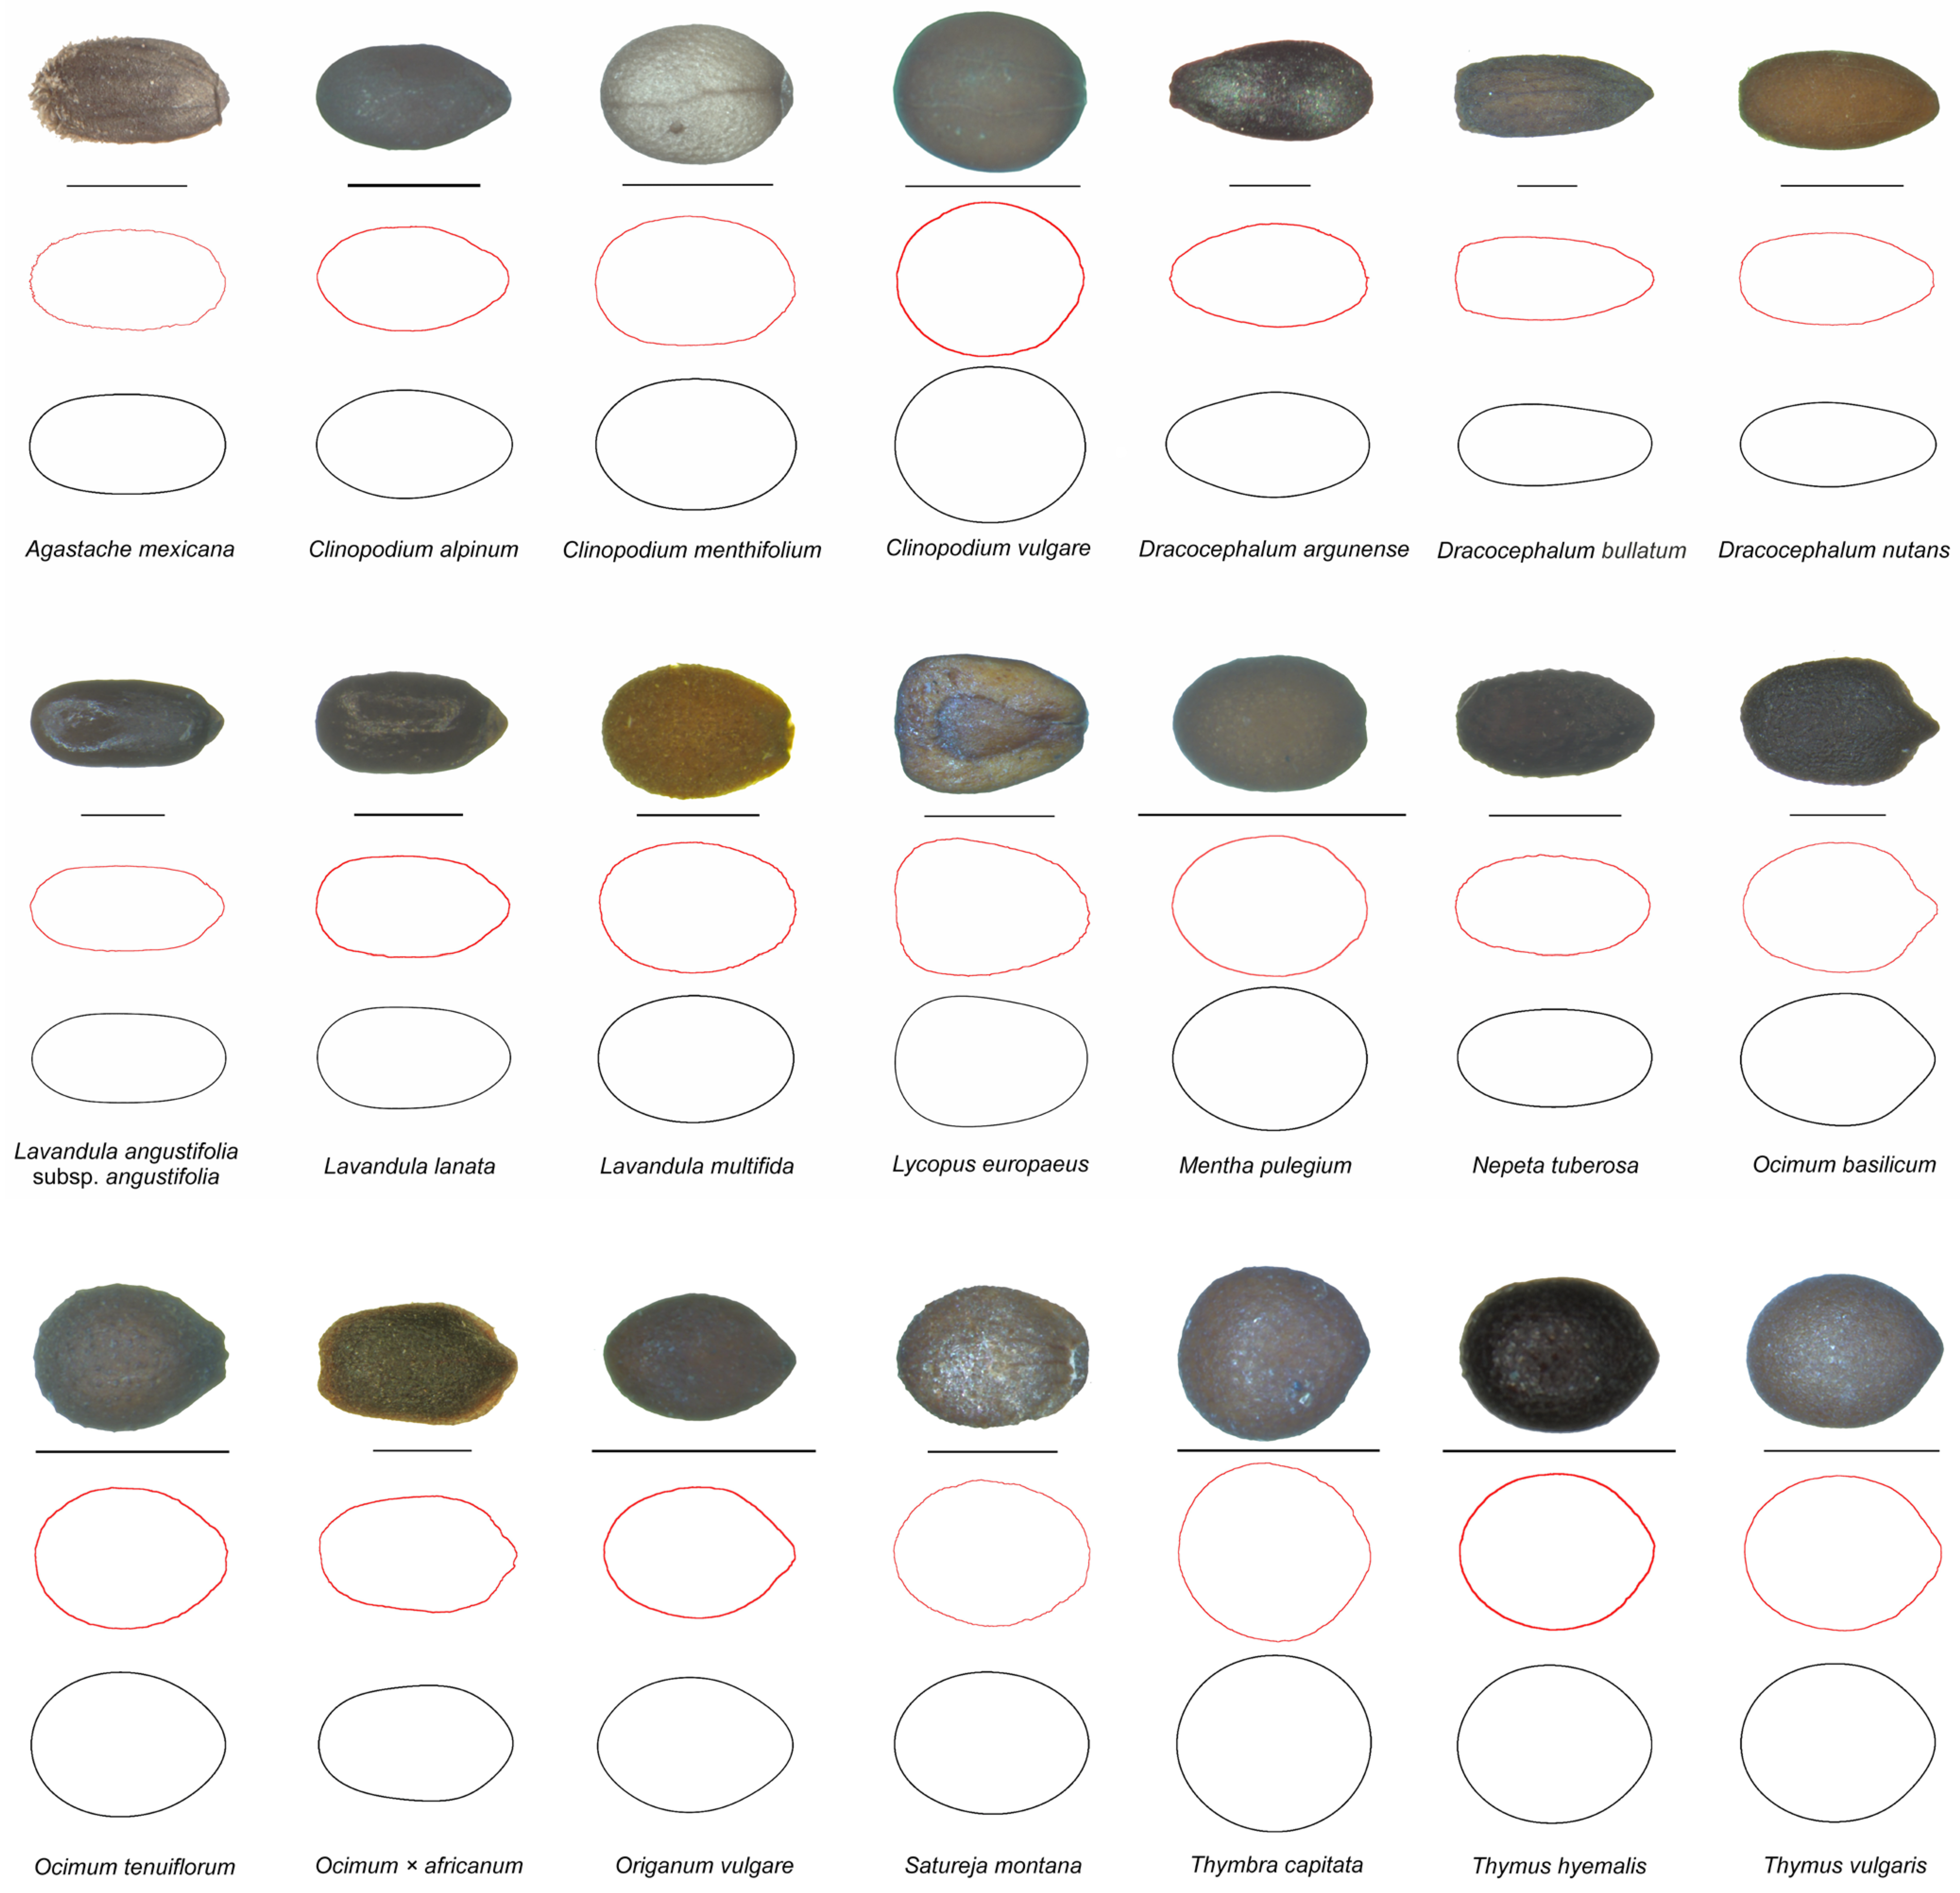
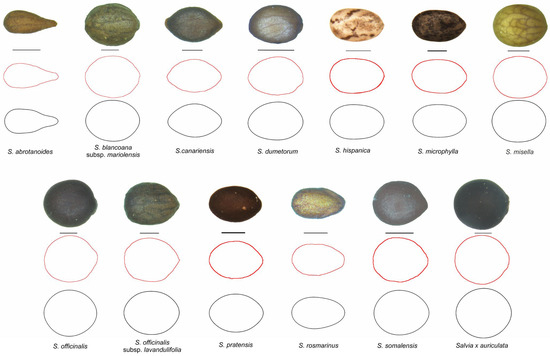
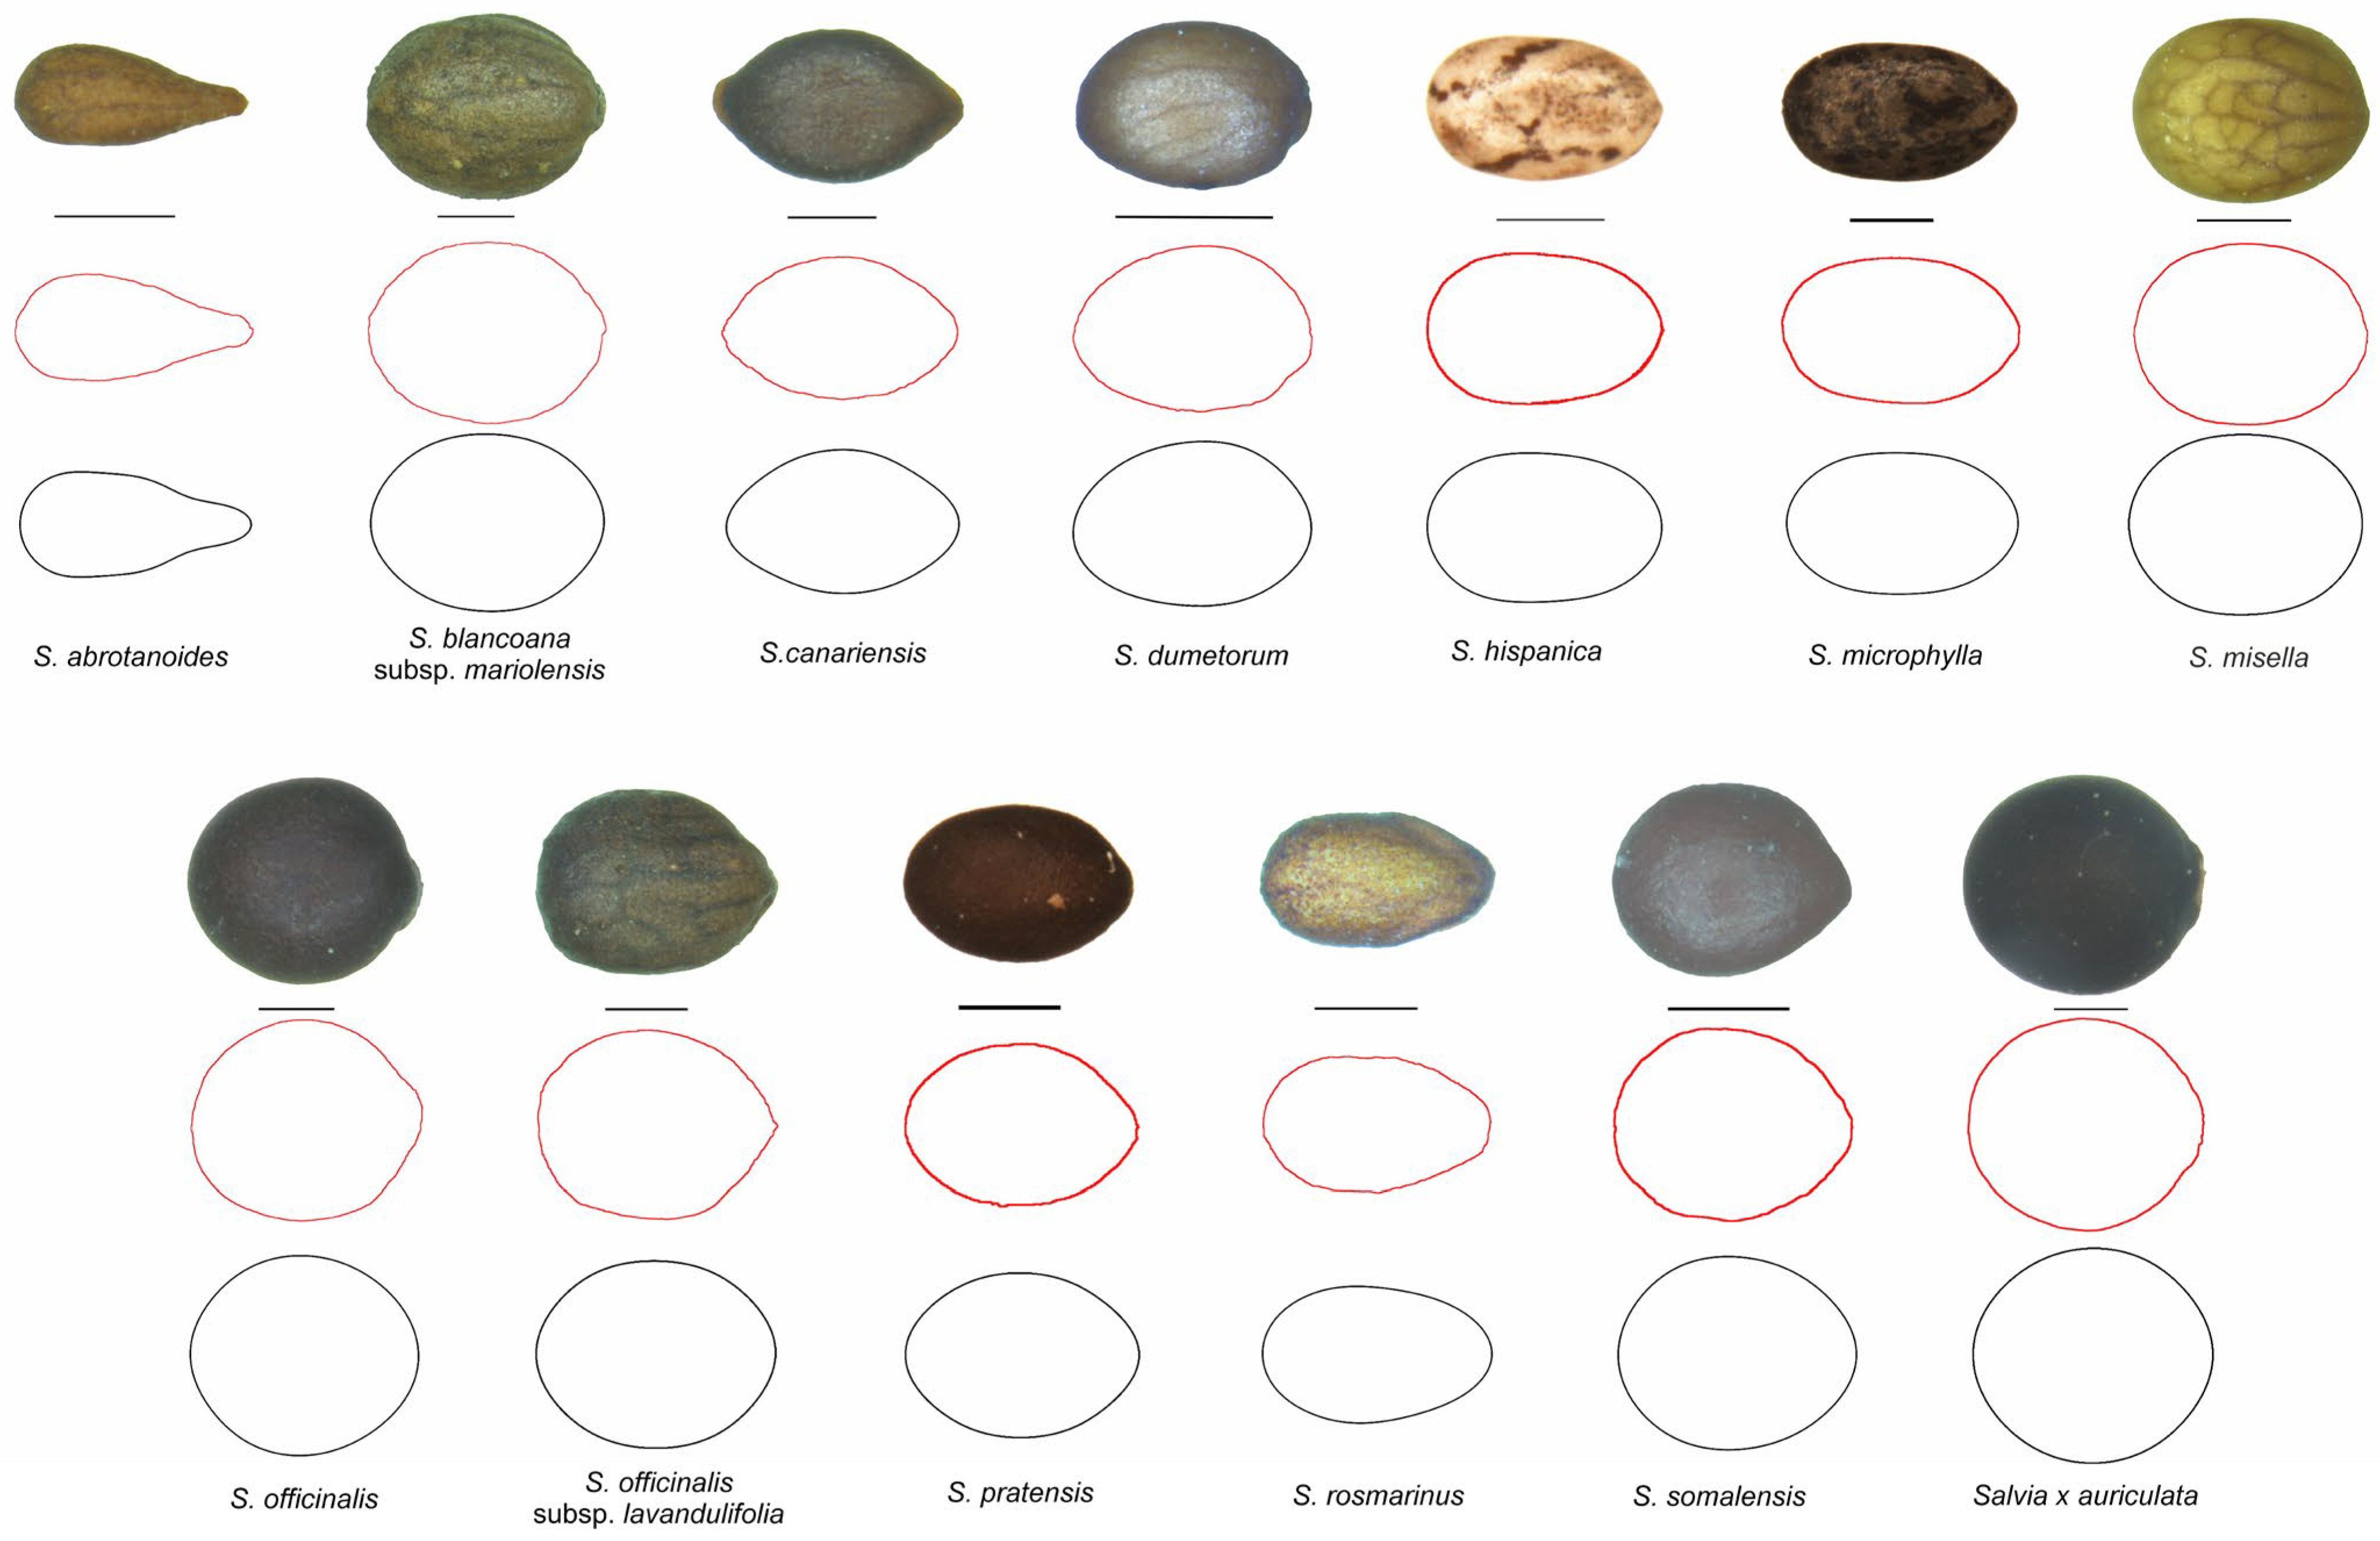
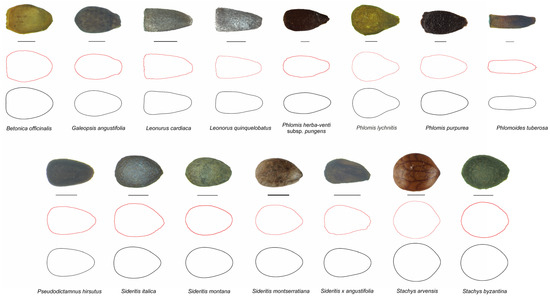
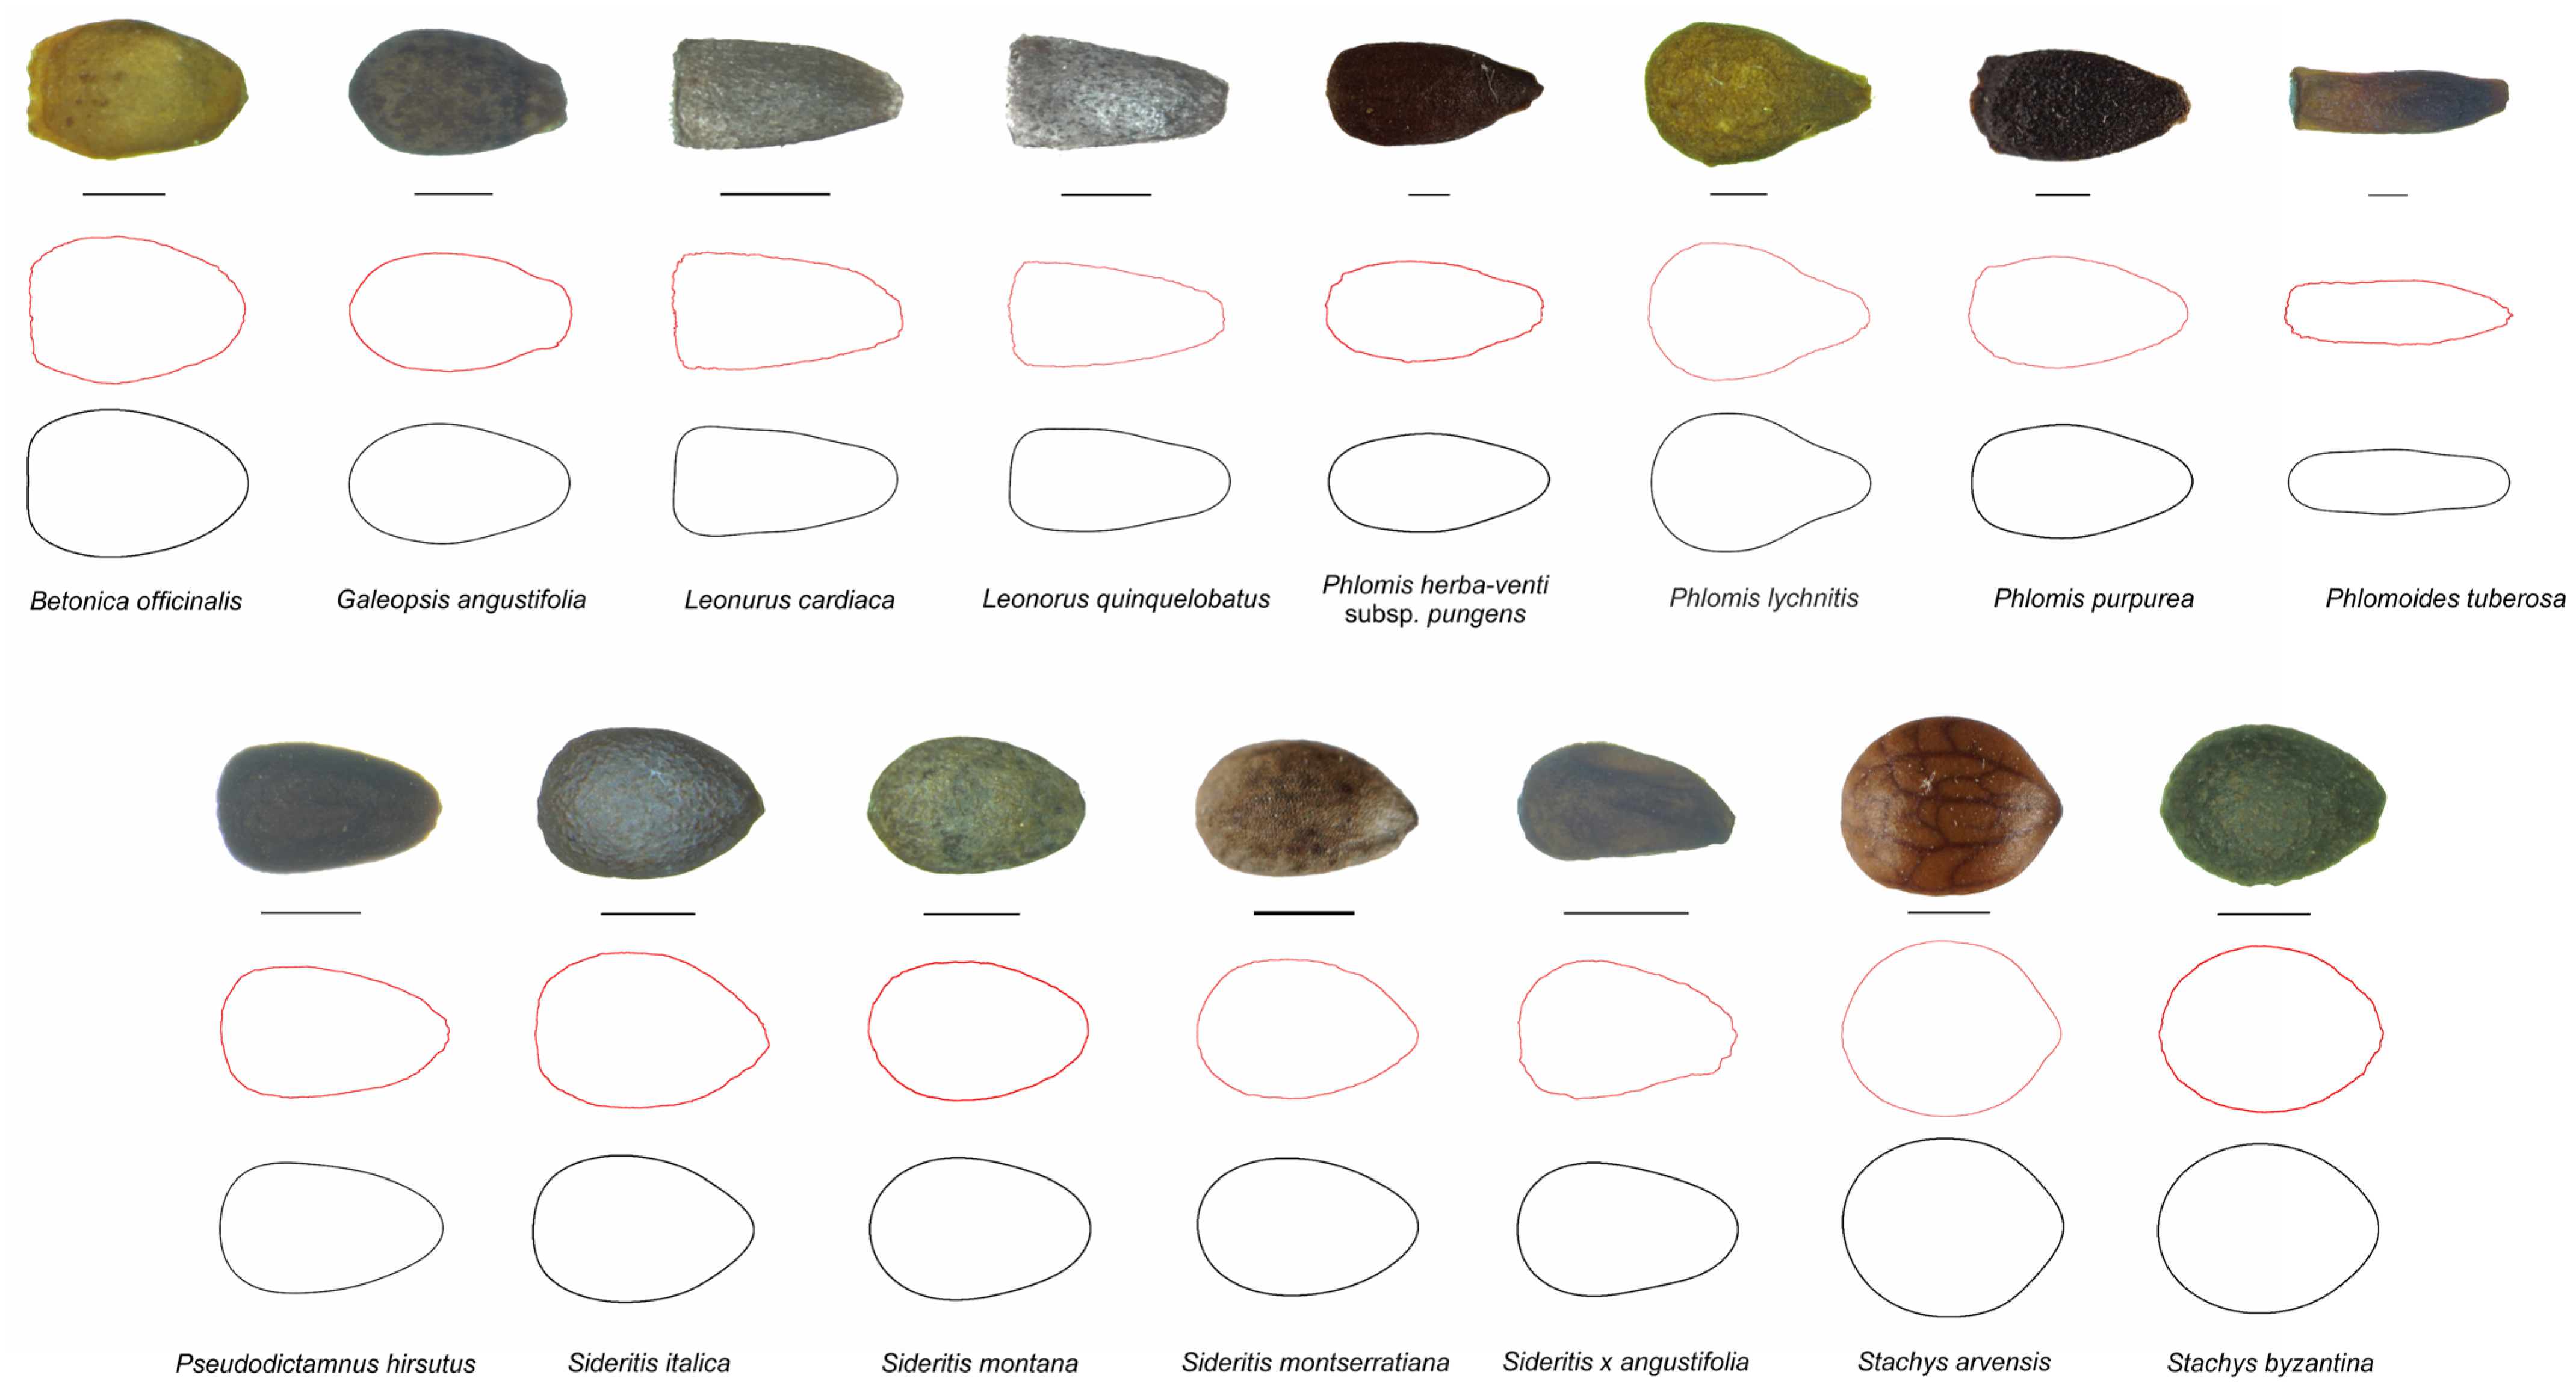
The general morphology of the nutlets for the species analyzed is summarized in Table A1 (Appendix A). Average outlines of nutlets for each species were obtained by the following two methods: Image analysis and Fourier equations. The results of both are shown in Figure 1, Figure 2 and Figure 3 with representative photographs of each species. Figure 1 contains the species of the subfamily Nepetoideae, except Salvia; Figure 2, thirteen species of Salvia; and Figure 3 the species of the subfamily Lamioideae. All images are presented with the micropile to the right.
Figure 1.
Representative images of nutlets from 21 species of the Nepetoideae; red: average outlines made manually with Corel PhotoPaint; black: outlines from Fourier Equations. Bar represents 1 mm.
Figure 2.
Representative images of nutlets from 13 species of Salvia; red: average outlines made manually with Corel PhotoPaint; black: outlines from Fourier Equations. Bar represents 1 mm.
Figure 3.
Representative images of nutlets from 15 species of the Lamioideae; red: average outlines made manually with Corel PhotoPaint; black: outlines from Fourier Equations. Bar represents 1 mm.
3.2. Comparison Between Subfamilies
There were differences between the two subfamilies in all measurements of size (area, perimeter, length, width) and shape (circularity, aspect ratio, roundness, solidity) (Table 2).
Table 2.
Mean values and results of Mann–Whitney U-test for the comparisons between subfamilies of the following measurements: area (A, mm2), perimeter (P, mm), length (L, mm), width (W, mm), circularity (C), roundness (R), and solidity (S). Different superscripts in two files of the same column indicate significant differences. Between brackets, there are coefficients of variation.
Also, there were differences between subfamilies in the measurements related to curvature of the surface outline (maximum, average, and ratio maximum-to-average curvature values; Table 3).
Table 3.
Mean values and results of Mann–Whitney U-test for the comparisons between subfamilies of maximum, minimum, and average curvature values are as follows: Maximum (Max Curv), Minimum (Min Curv) Average curvature (Ave Curv), and the ratio maximum-to-average curvature (Ratio Curv). Different superscripts in two files of the same column indicate significant differences. Between brackets, there are coefficients of variation.
3.3. Comparison Between Genera Within Subfamilies
The mean values and Kruskal–Wallis test results for comparisons of length, width, area, circularity, roundness, and solidity values between genera in the Nepetoideae and Lamioideae are shown in Table A1 and Table A2 in Appendix A. In the Nepetoideae (Table A2 in Appendix A) Salvia nutlets were the largest, followed by those of Dracocephalum. There were no differences in size between the other genera. Differences in shape measurements were also observed between genera, with Thymbra and Thymus exhibiting the highest circularity values, Agastache the lowest, and Mentha and Thymus exhibiting the highest solidity values, with Agastache exhibiting the lowest.
Differences between genera were observed in all curvature values. Maximum curvature was higher in Ocimum and Clinopodium than in Lavandula and Salvia (Table 4). Minimum curvature had average negative values in Lavandula and Salvia, while in Ocimum there were negative values in O. x africanum and positive values in O. tenuiflorum. In Clinopodium, minimum curvature values were positive. An inverse relationship was observed between area and average curvature. Curvature ratio was lower in Clinopodium and Salvia than in Lavandula and Ocimum (Table 4).
Table 4.
Mean values and results of Kruskal–Wallis test for the comparisons between genera in the Nepetoideae for the following: Maximum (Max Curv), Minimum (Min Curv) Average curvature (Ave Curv), and the ratio maximum-to-average curvature (Ratio Curv). Different superscripts in two files of the same column indicate significant differences. Between brackets, there are coefficients of variation.
Notable differences in size and shape measurements were also observed in the Lamioideae (Table A2 in Appendix A). The genus Stachys exhibited the highest values of circularity and solidity, while Leonurus and Phlomis exhibited the lowest values of both. Values of maximum and minimum curvature were higher in Sideritis, and the minimum curvature was negative in Phlomis (Table 5).
Table 5.
Mean values and results of Kruskal–Wallis test for the comparisons between genera in the Lamioideae for Maximum (Max Curv), Minimum (Min Curv), Average curvature (Ave Curv), and the ratio maximum-to-average curvature (Ratio Curv). Different superscripts in two files of the same column indicate significant differences. Between brackets, there are coefficients of variation.
3.4. Comparison of Size and Shape Between Species
3.4.1. The Subfamily Nepetoideae
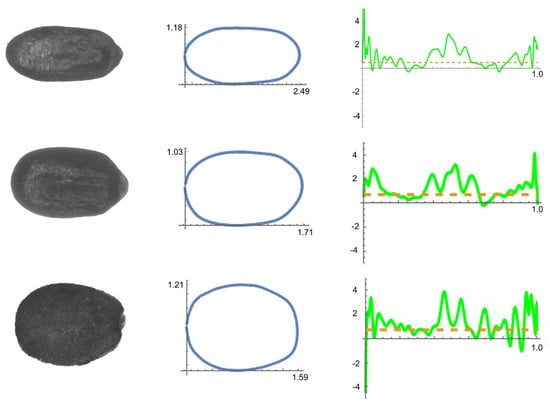
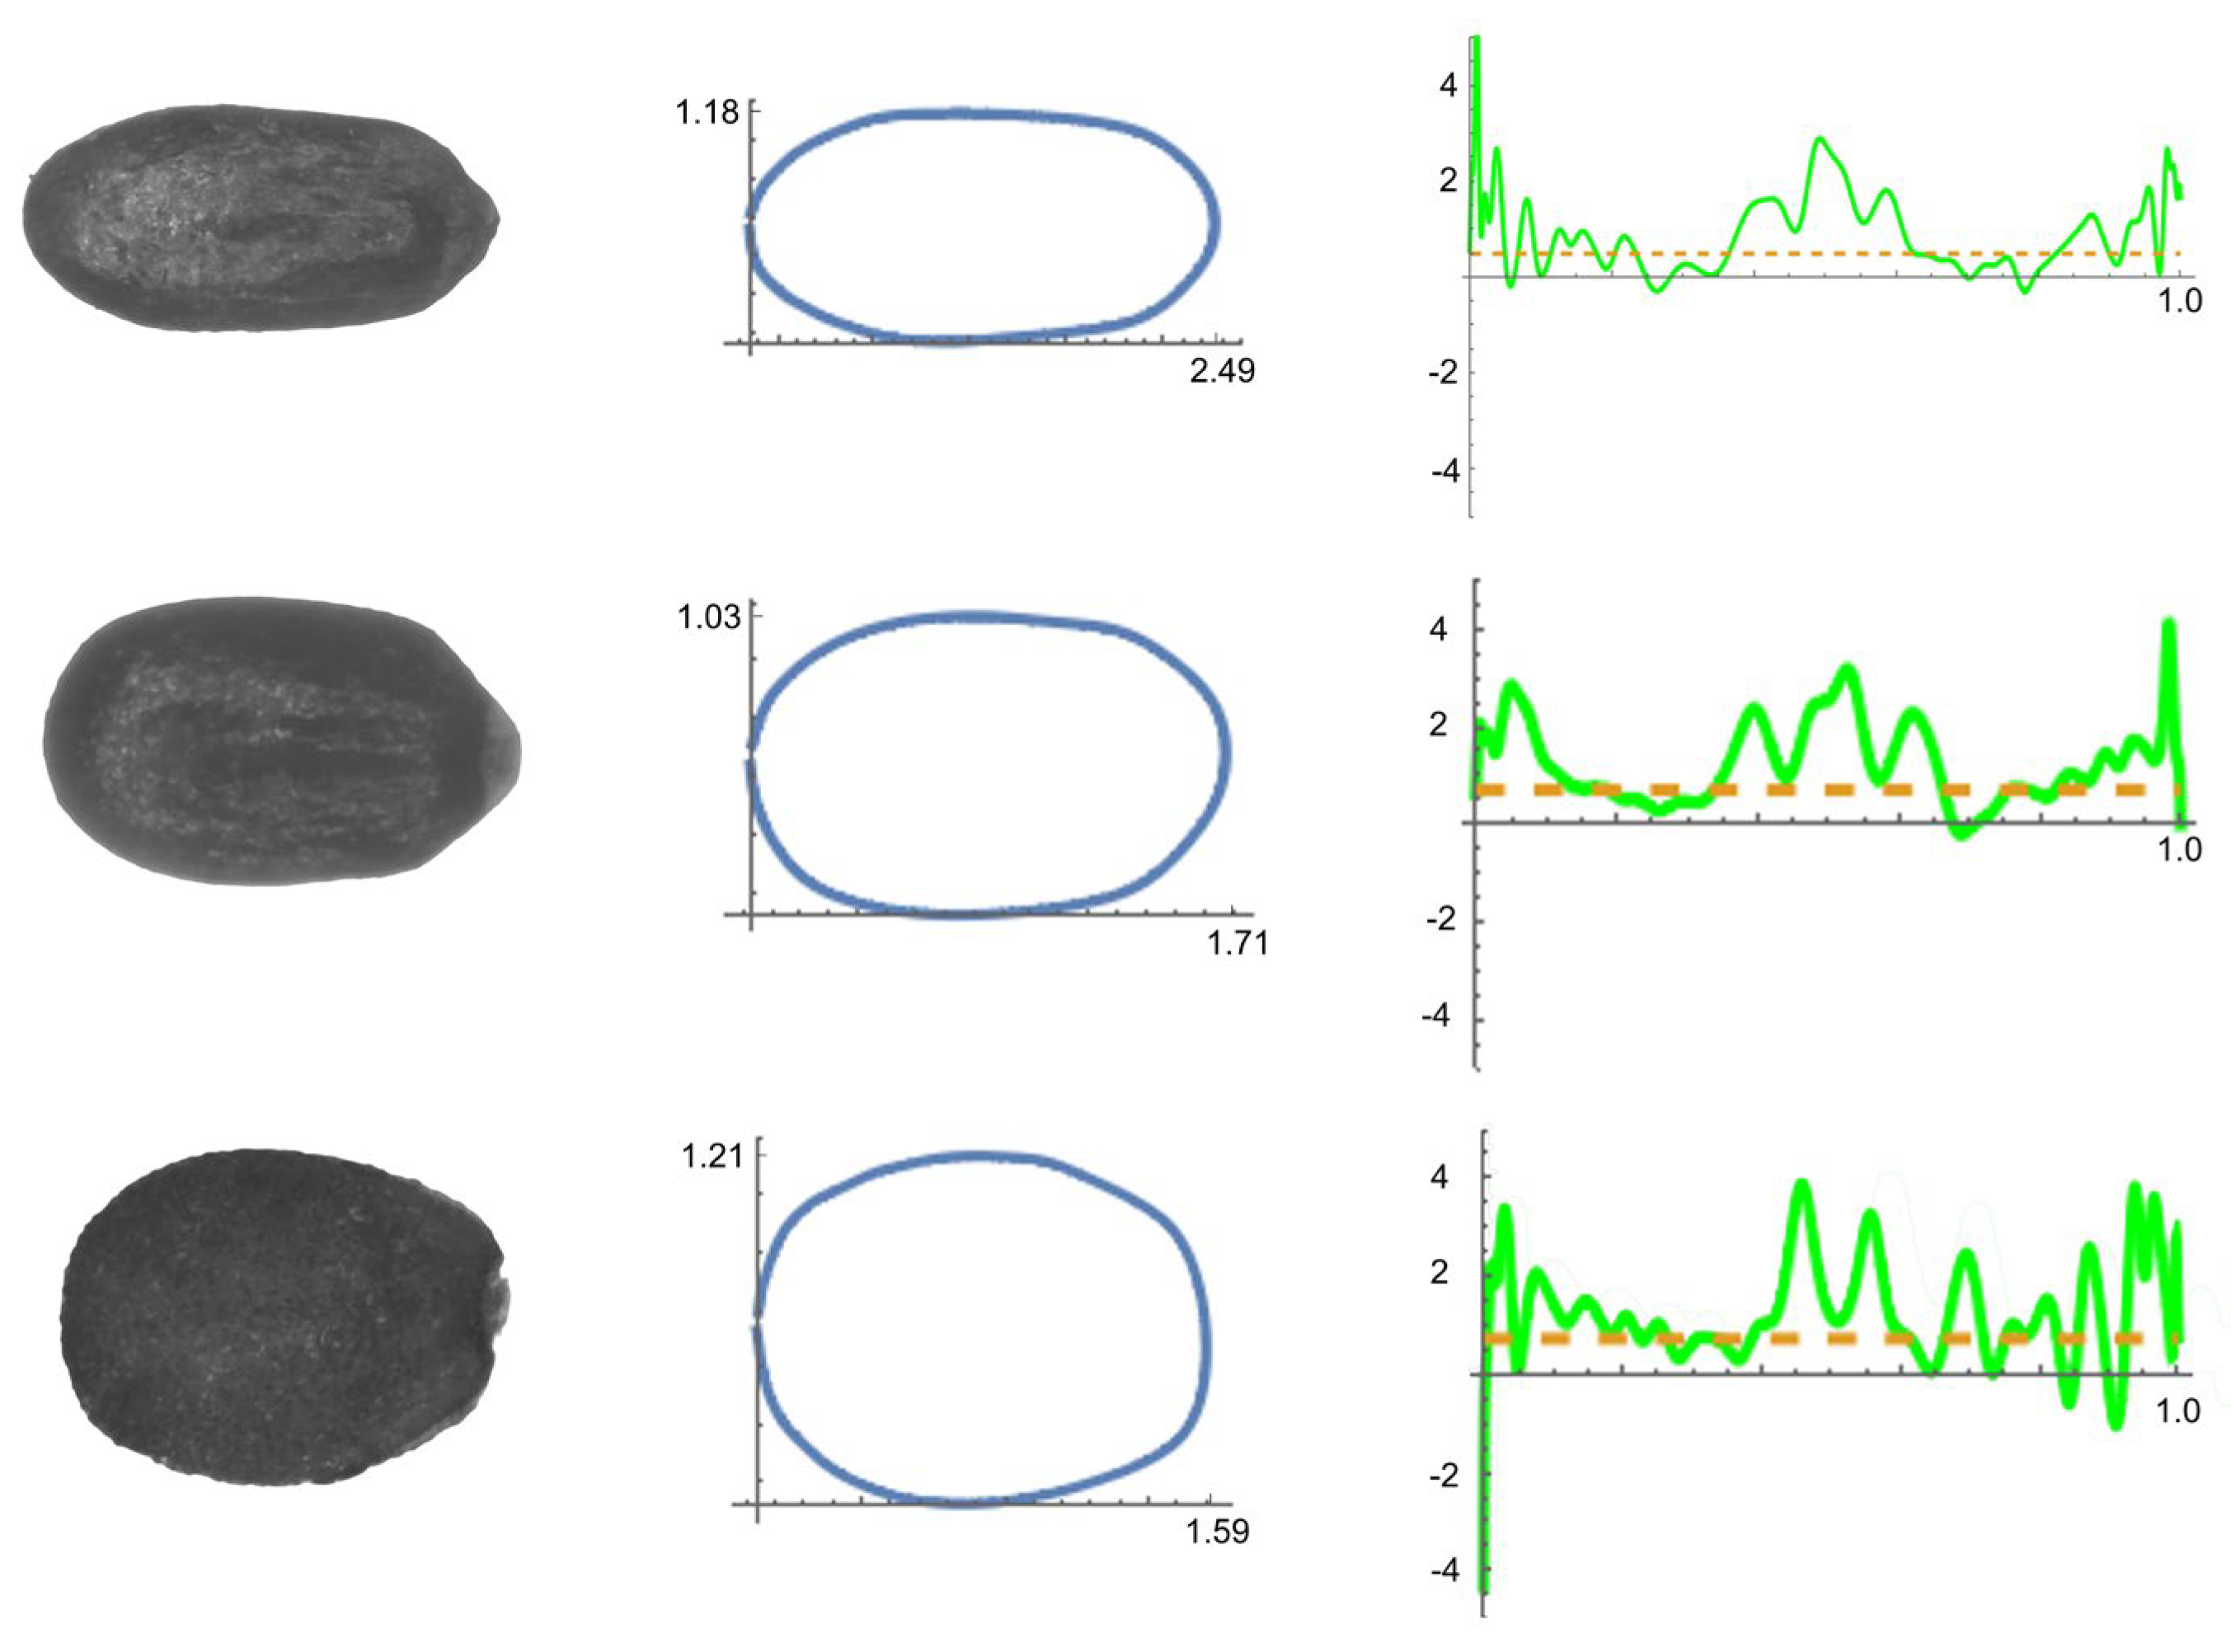
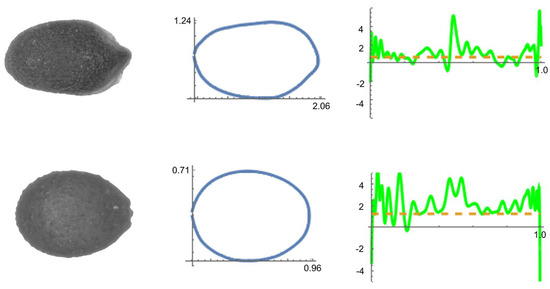
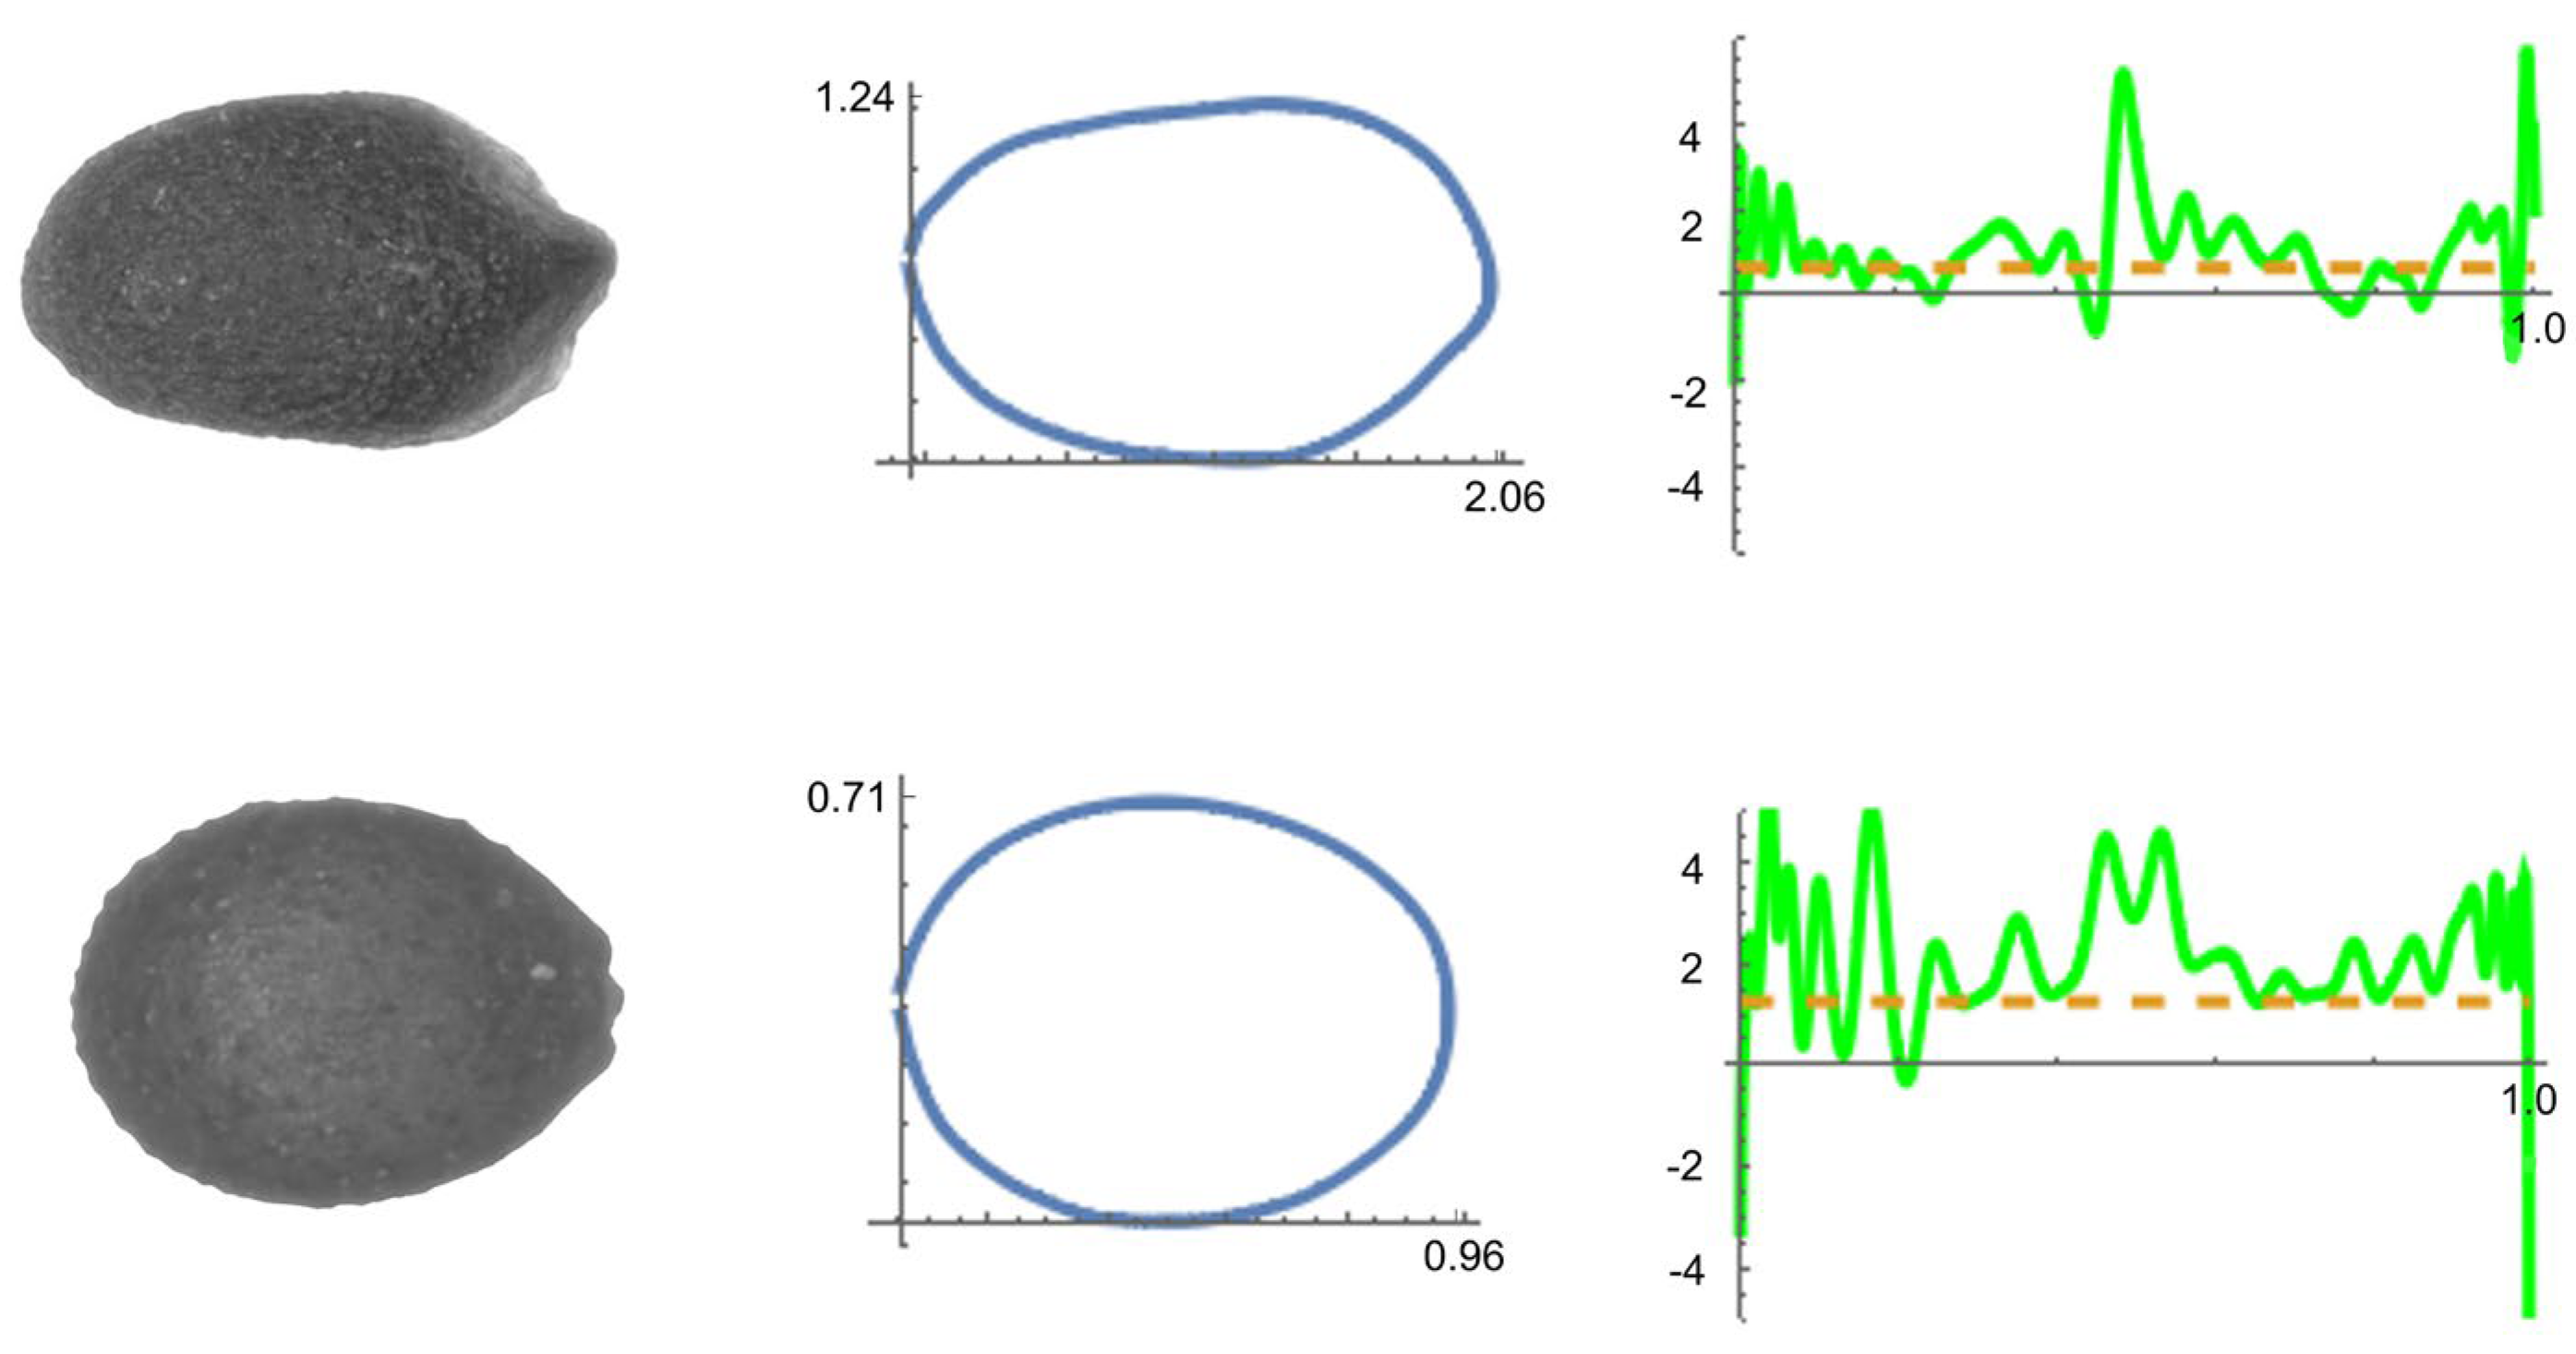
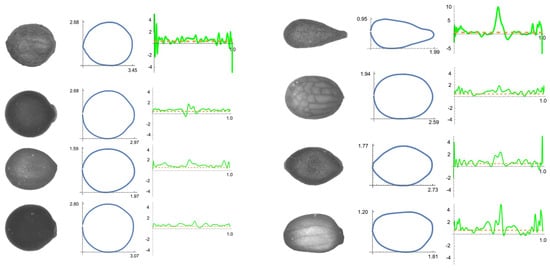
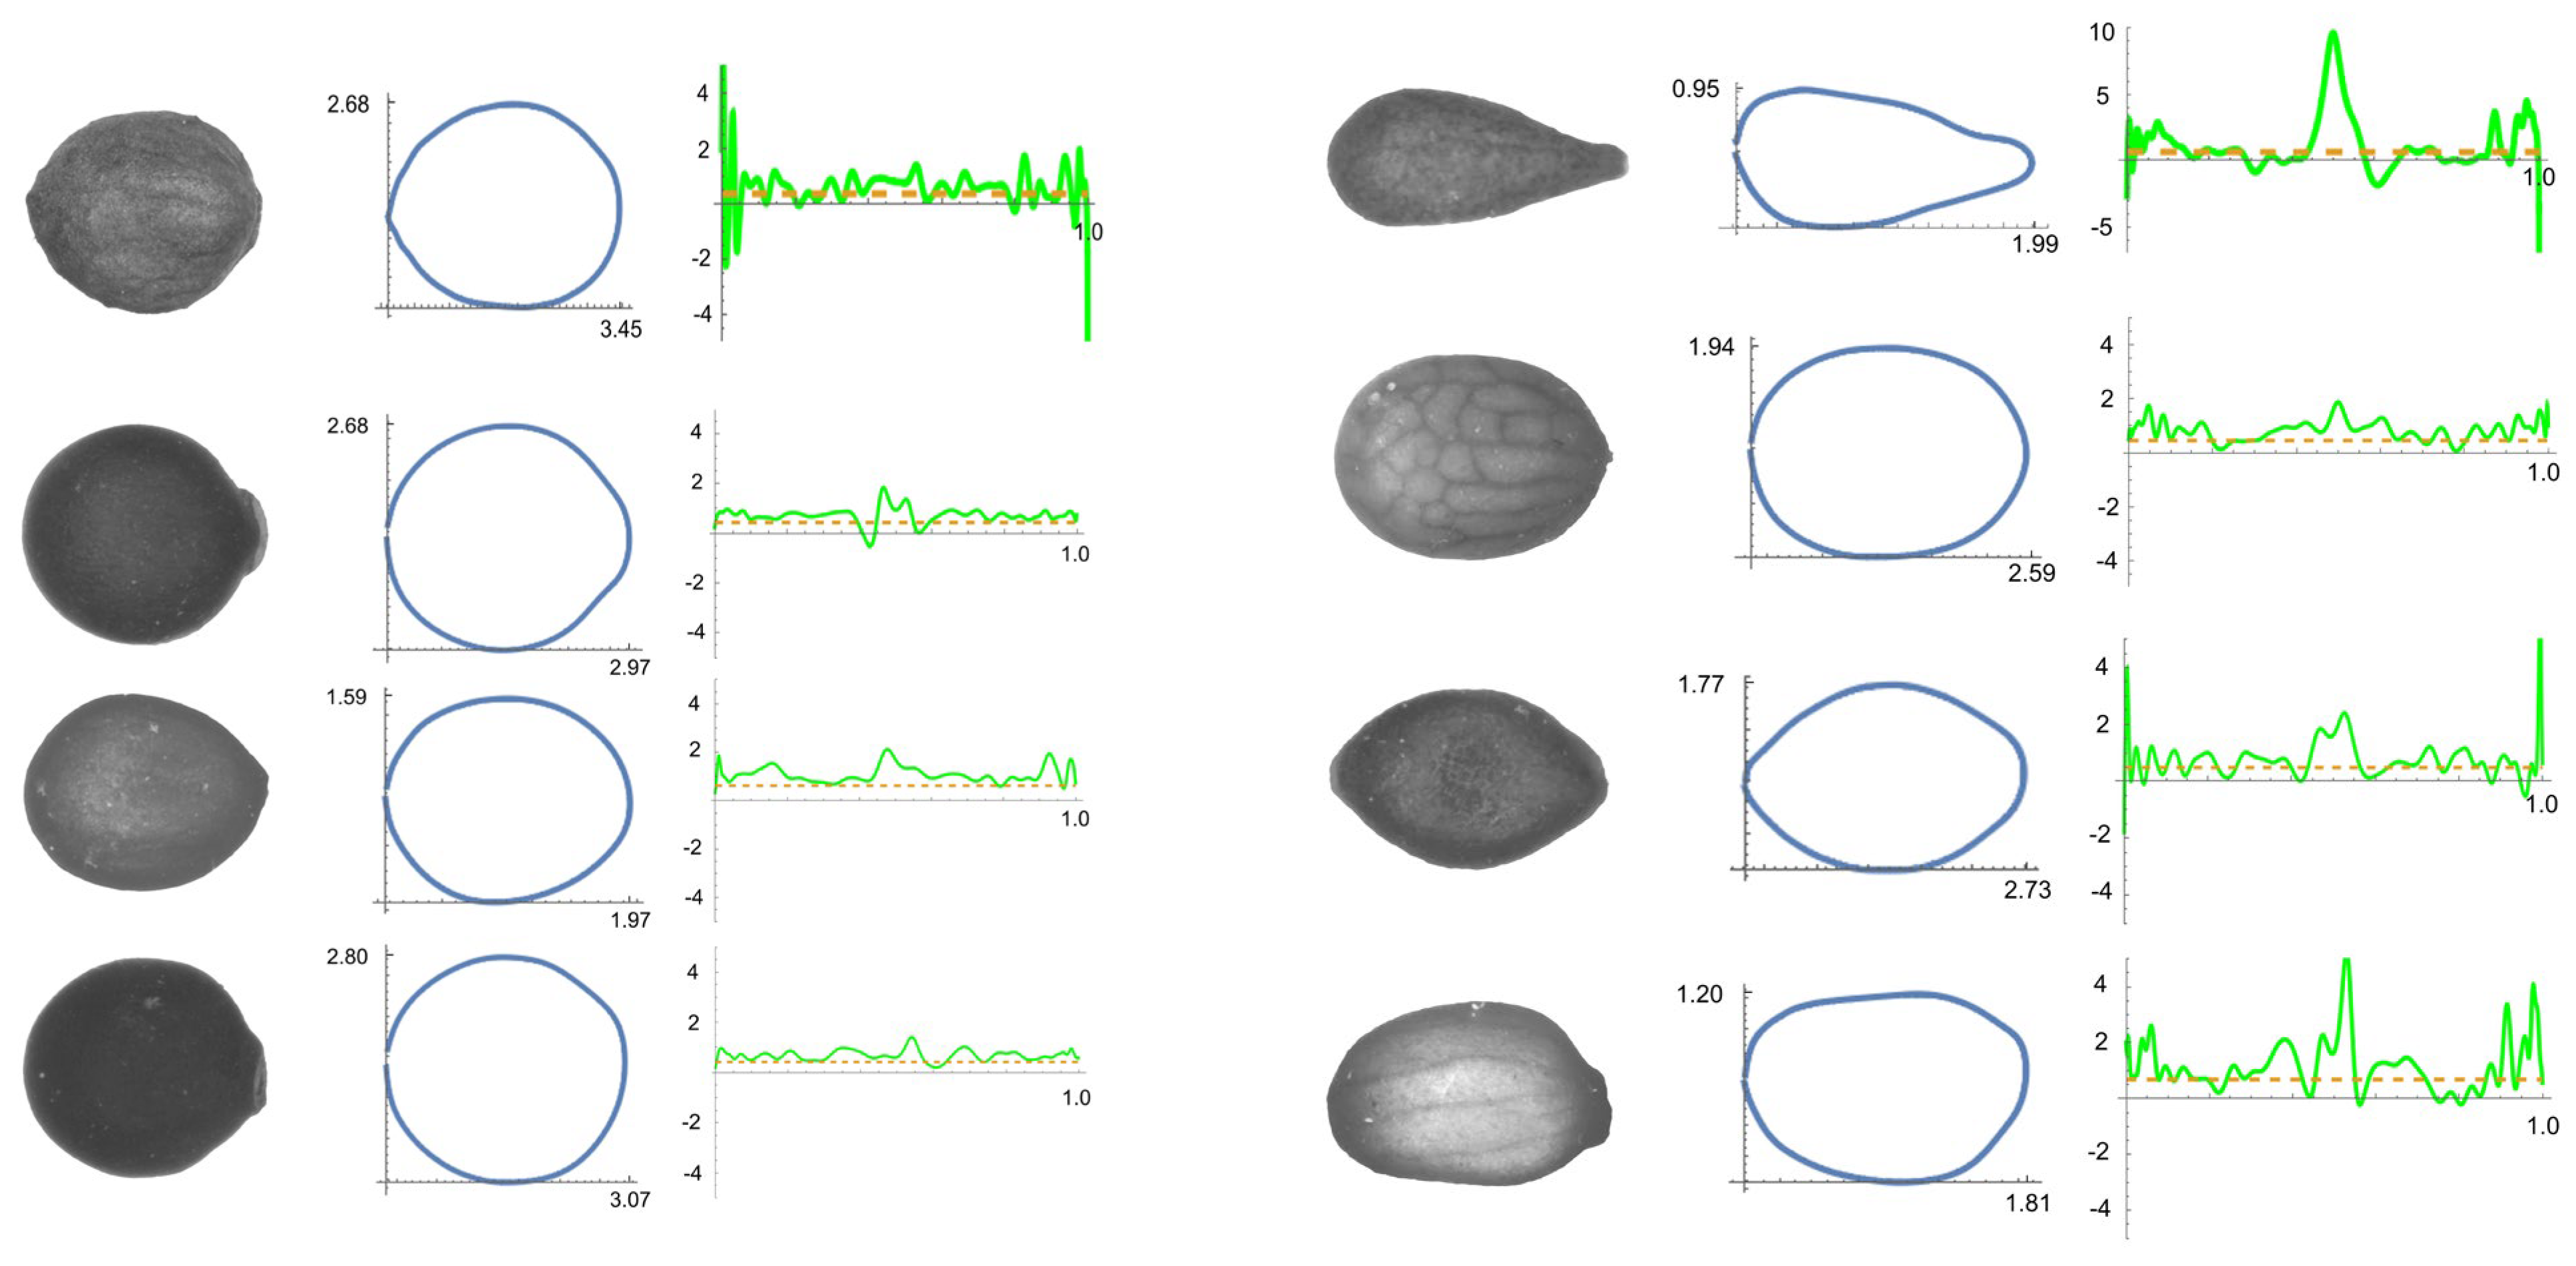
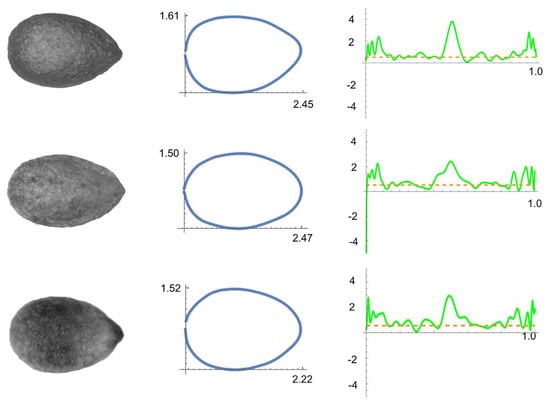
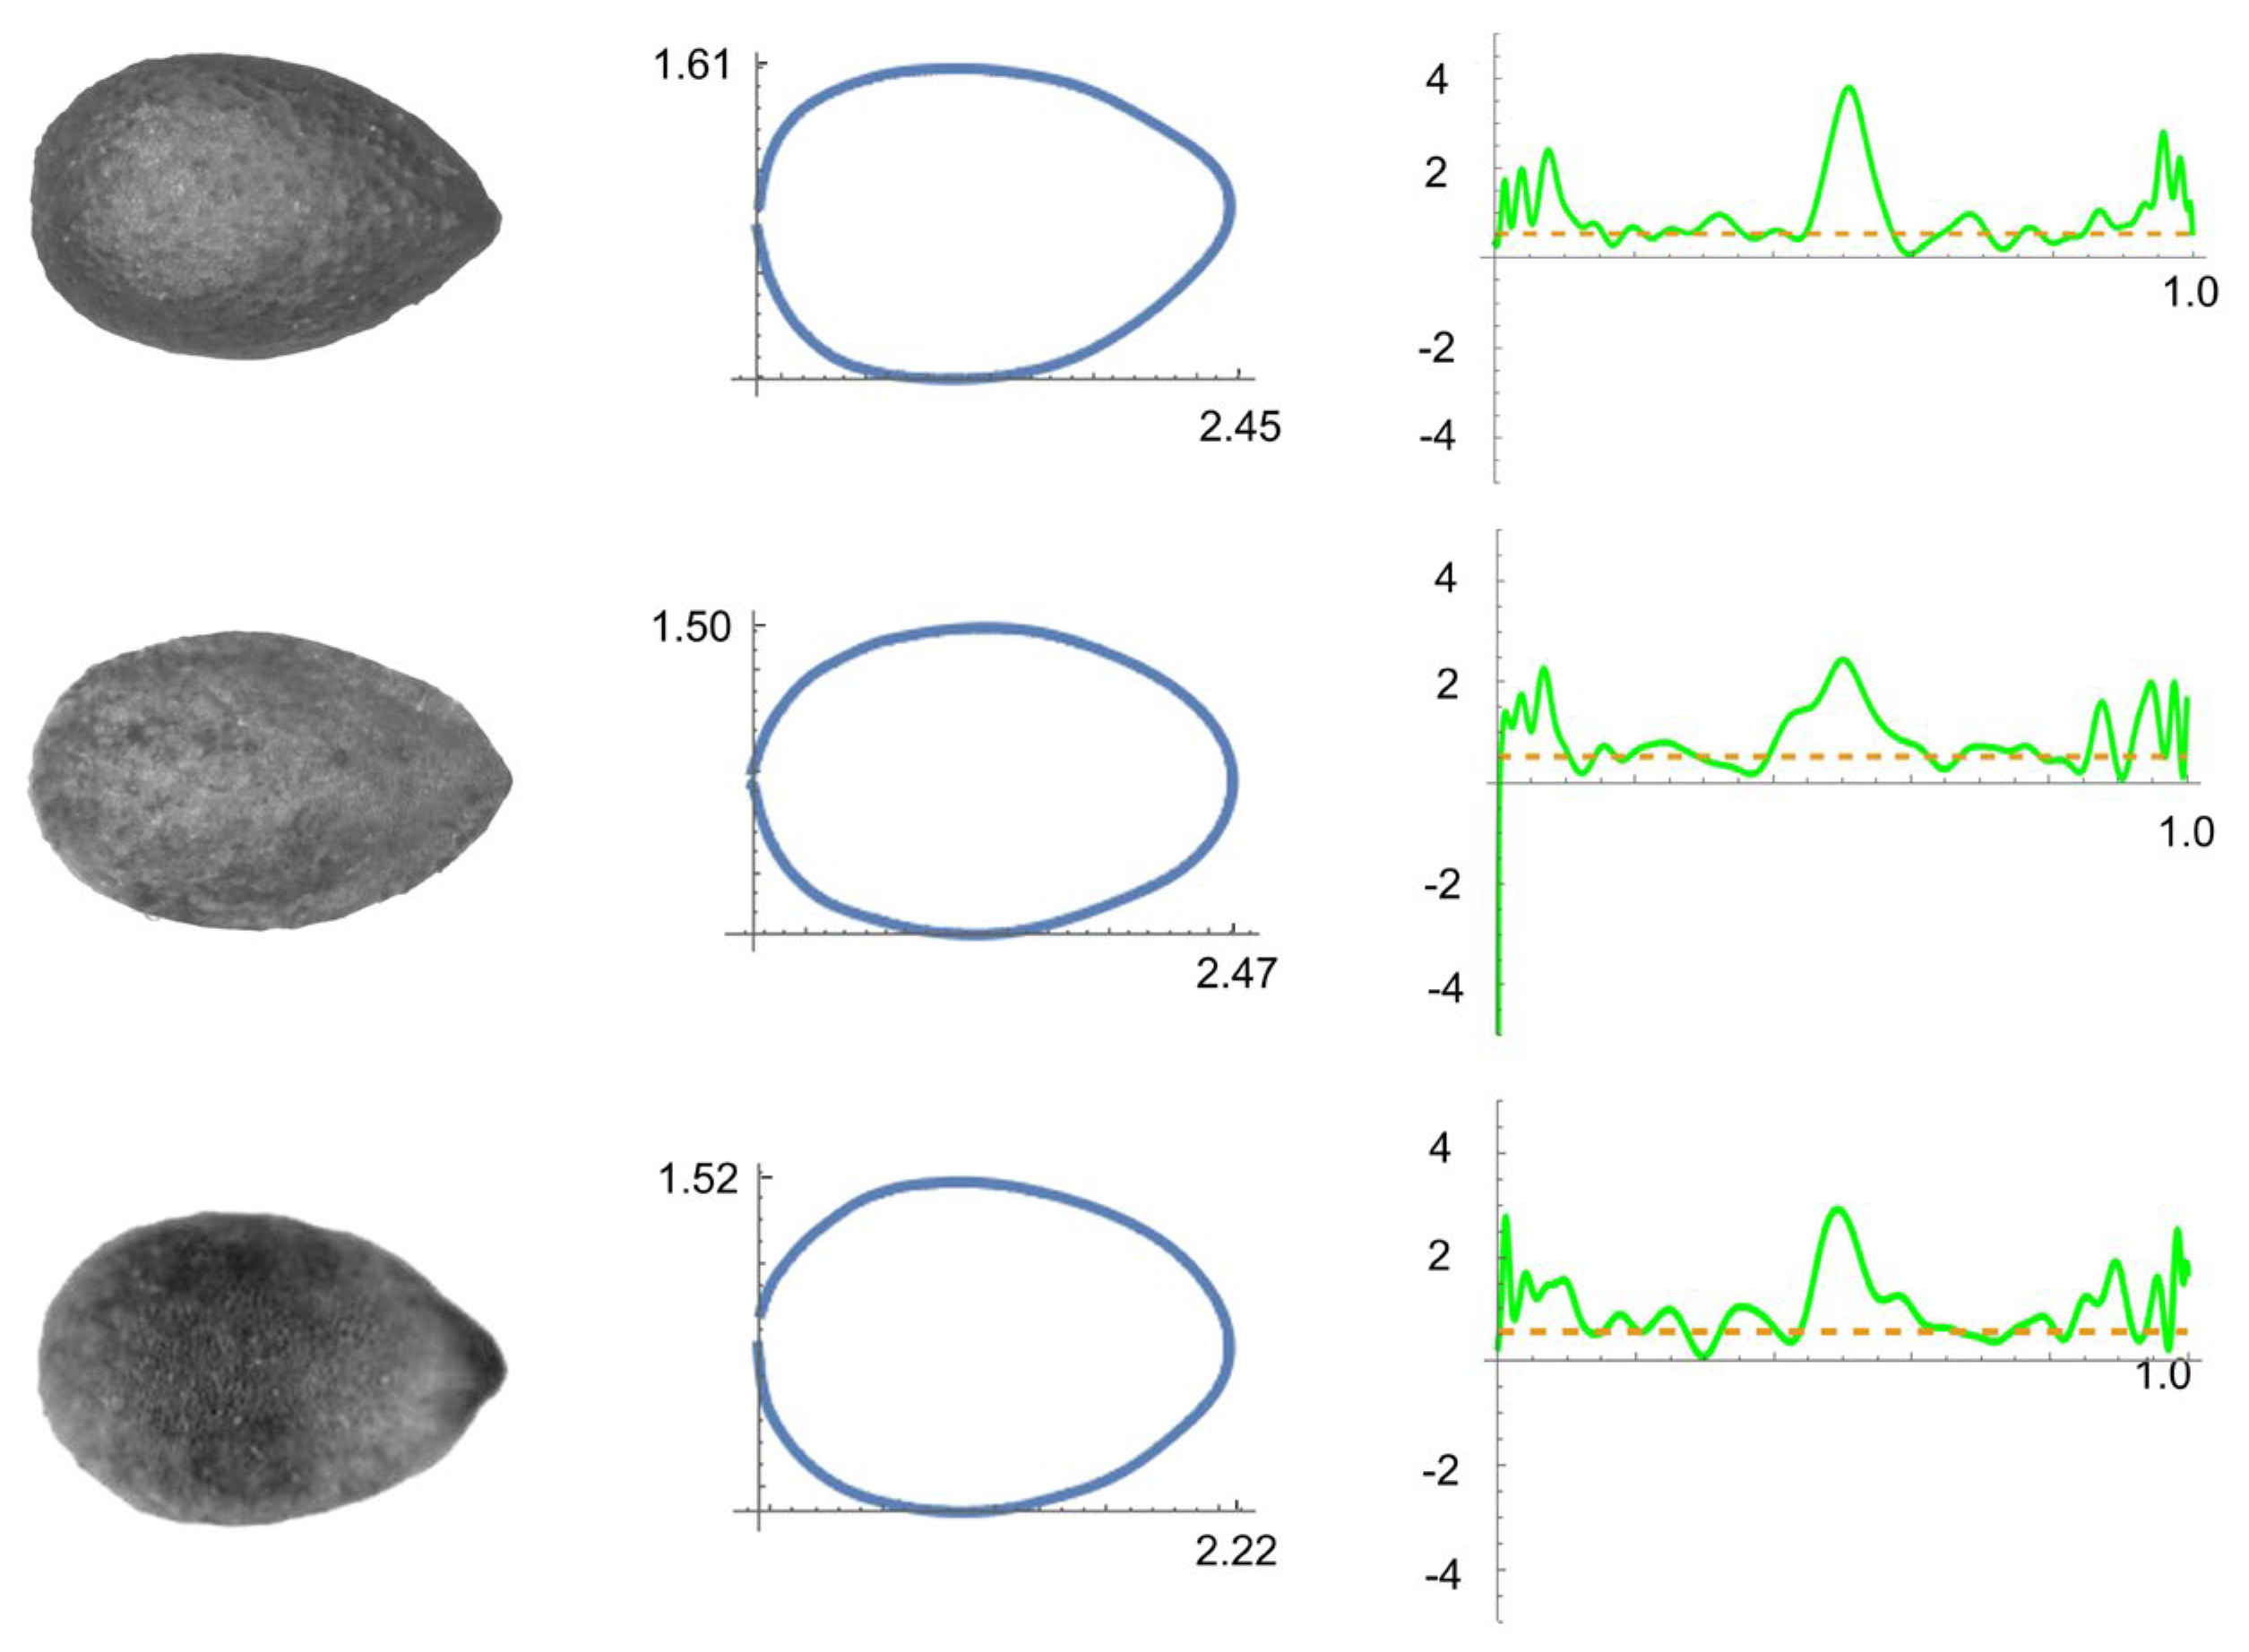
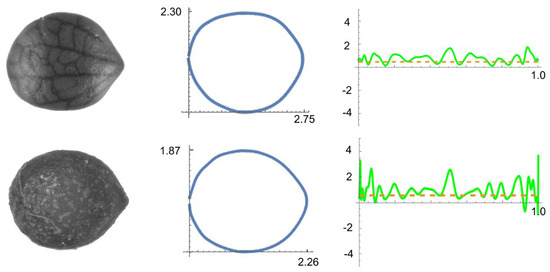
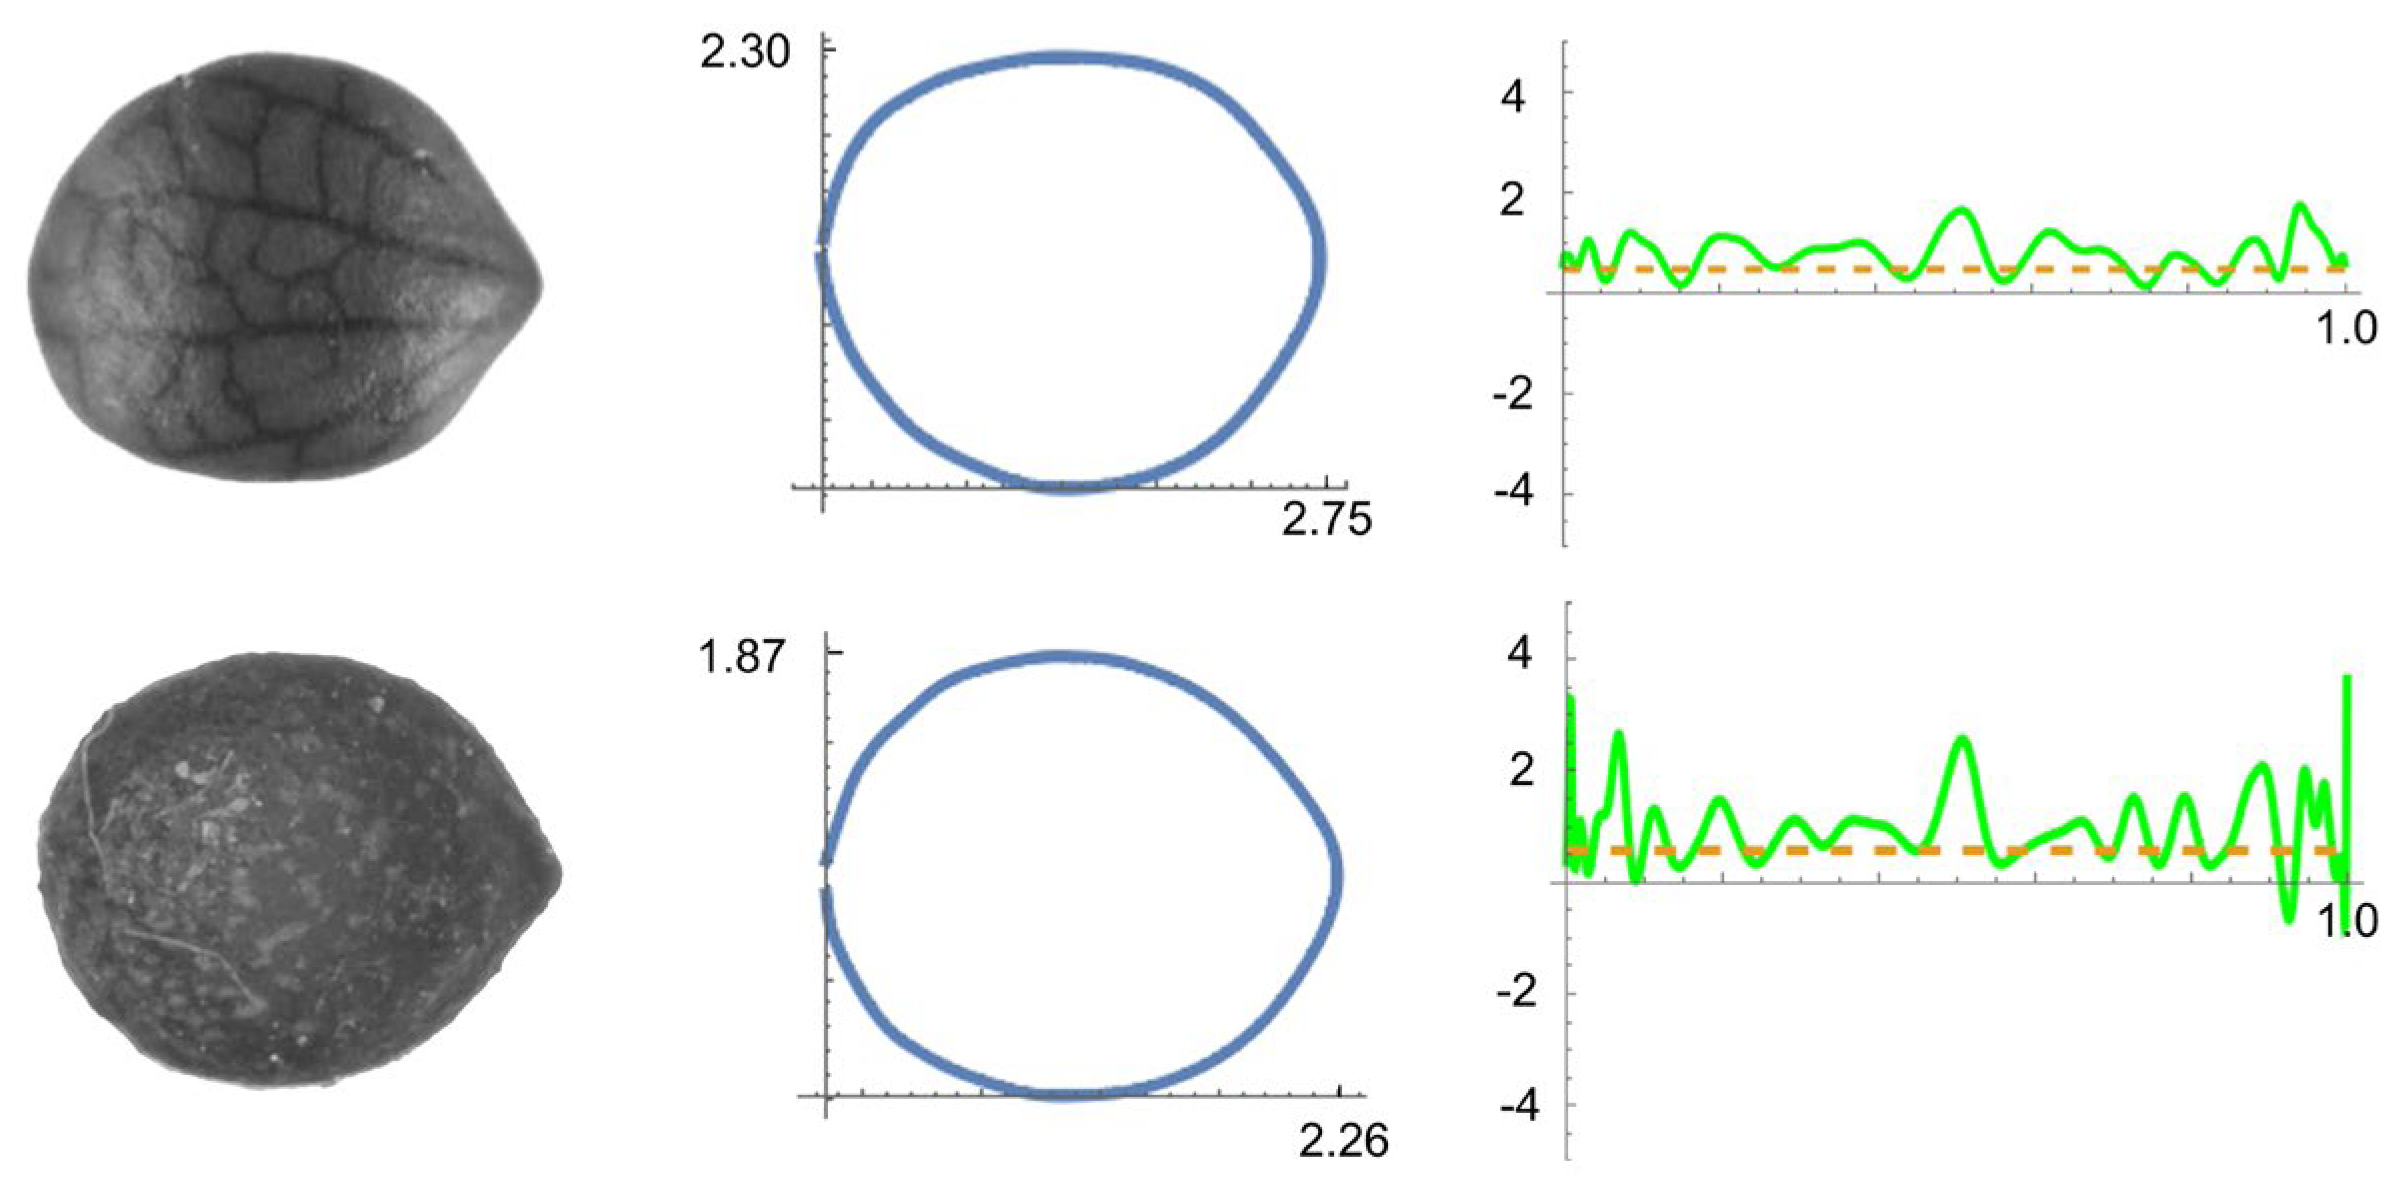
Table 6 shows the means and results of Kruskal–Wallis test for the comparison between species of the genera Clinopodium, Lavandula, Ocimum, and Salvia. Figure 4, Figure 5, Figure 6 and Figure 7 contain representative images of curvature analysis for species in each genus.
Table 6.
Mean values and results of Kruskal–Wallis test for the comparisons between species of the genera Clinopodium, Lavandula, Ocimum, and Salvia for area (A, mm2), length (L, mm), width (W, mm), circularity (C), roundness (R), solidity (S), and curvature values. Max Curv: Maximum curvature; Min Curv: Minimum curvature; Ave Curv: Average curvature; Ratio Curv: Ratio maximum-to-average curvature. Different superscripts in two files of the same column indicate significant differences. Between brackets, there are coefficients of variation.
Figure 4.
Curvature analysis in species of Clinopodium. (Above): C. alpinum; (middle): C. menthifolium; (below): C. vulgare. (Left): Nutlet images; (center): Bézier curve with measurements of length and width (mm); (right): Curvature values along the curve (green) and average curvature (orange). The curvature is calculated between 0.2 and 0.8 to avoid conflicting regions in the extremities of the curve.
Figure 5.
Curvature analysis in species of Lavandula. (Above): L. angustifolia; (middle): L. lanata; (below): L. multifida. (Left): Nutlet images; (center): Bézier curve with measurements of length and width (mm); (right): Curvature values along the curve (green) and average curvature (orange). The curvature is calculated between 0.2 and 0.8 to avoid conflicting regions in the extremities of the curve.
Figure 6.
Curvature analysis in species of Ocimum. (Above): O. x africanum; (below): O. tenuiflorum. (Left): Nutlet images; (center): Bézier curve with measurements of length and width (mm); (right): Curvature values along the curve (green) and average curvature (orange). The curvature is calculated between 0.2 and 0.8 to avoid conflicting regions in the extremities of the curve.
Figure 7.
Curvature analysis in Salvia species. (Left Panel): From top to bottom: S. blancoana, S. officinalis, S. somalensis, S. x auriculata. (Right Panel): From top to bottom: S. abrotanoides, S. misella, S. canariensis, S. dumetorum. (Left): Nutlet images; center: Bézier curve with measurements of length and width (mm); (right): Curvature values along the curve (green) and average curvature (orange). The curvature is calculated between 0.2 and 0.8 to avoid conflicting regions in the extremities of the curve.
The species of Clinopodium had the smallest nutlets, and Salvia the largest. Salvia species had values for solidity and Max curv covering all the range from the lowest to the highest. Negative curvature values were found in Lavandula lanata and L. angustifolia, Ocimum africanum, and two species of Salvia (S. abrotanoides and S. blancoana subsp. mariolensis).
3.4.2. Subfam. Lamioideae
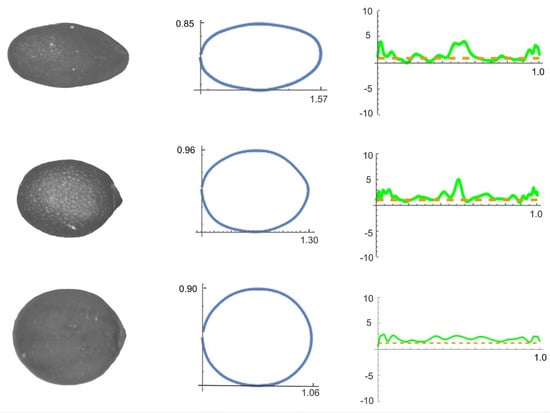
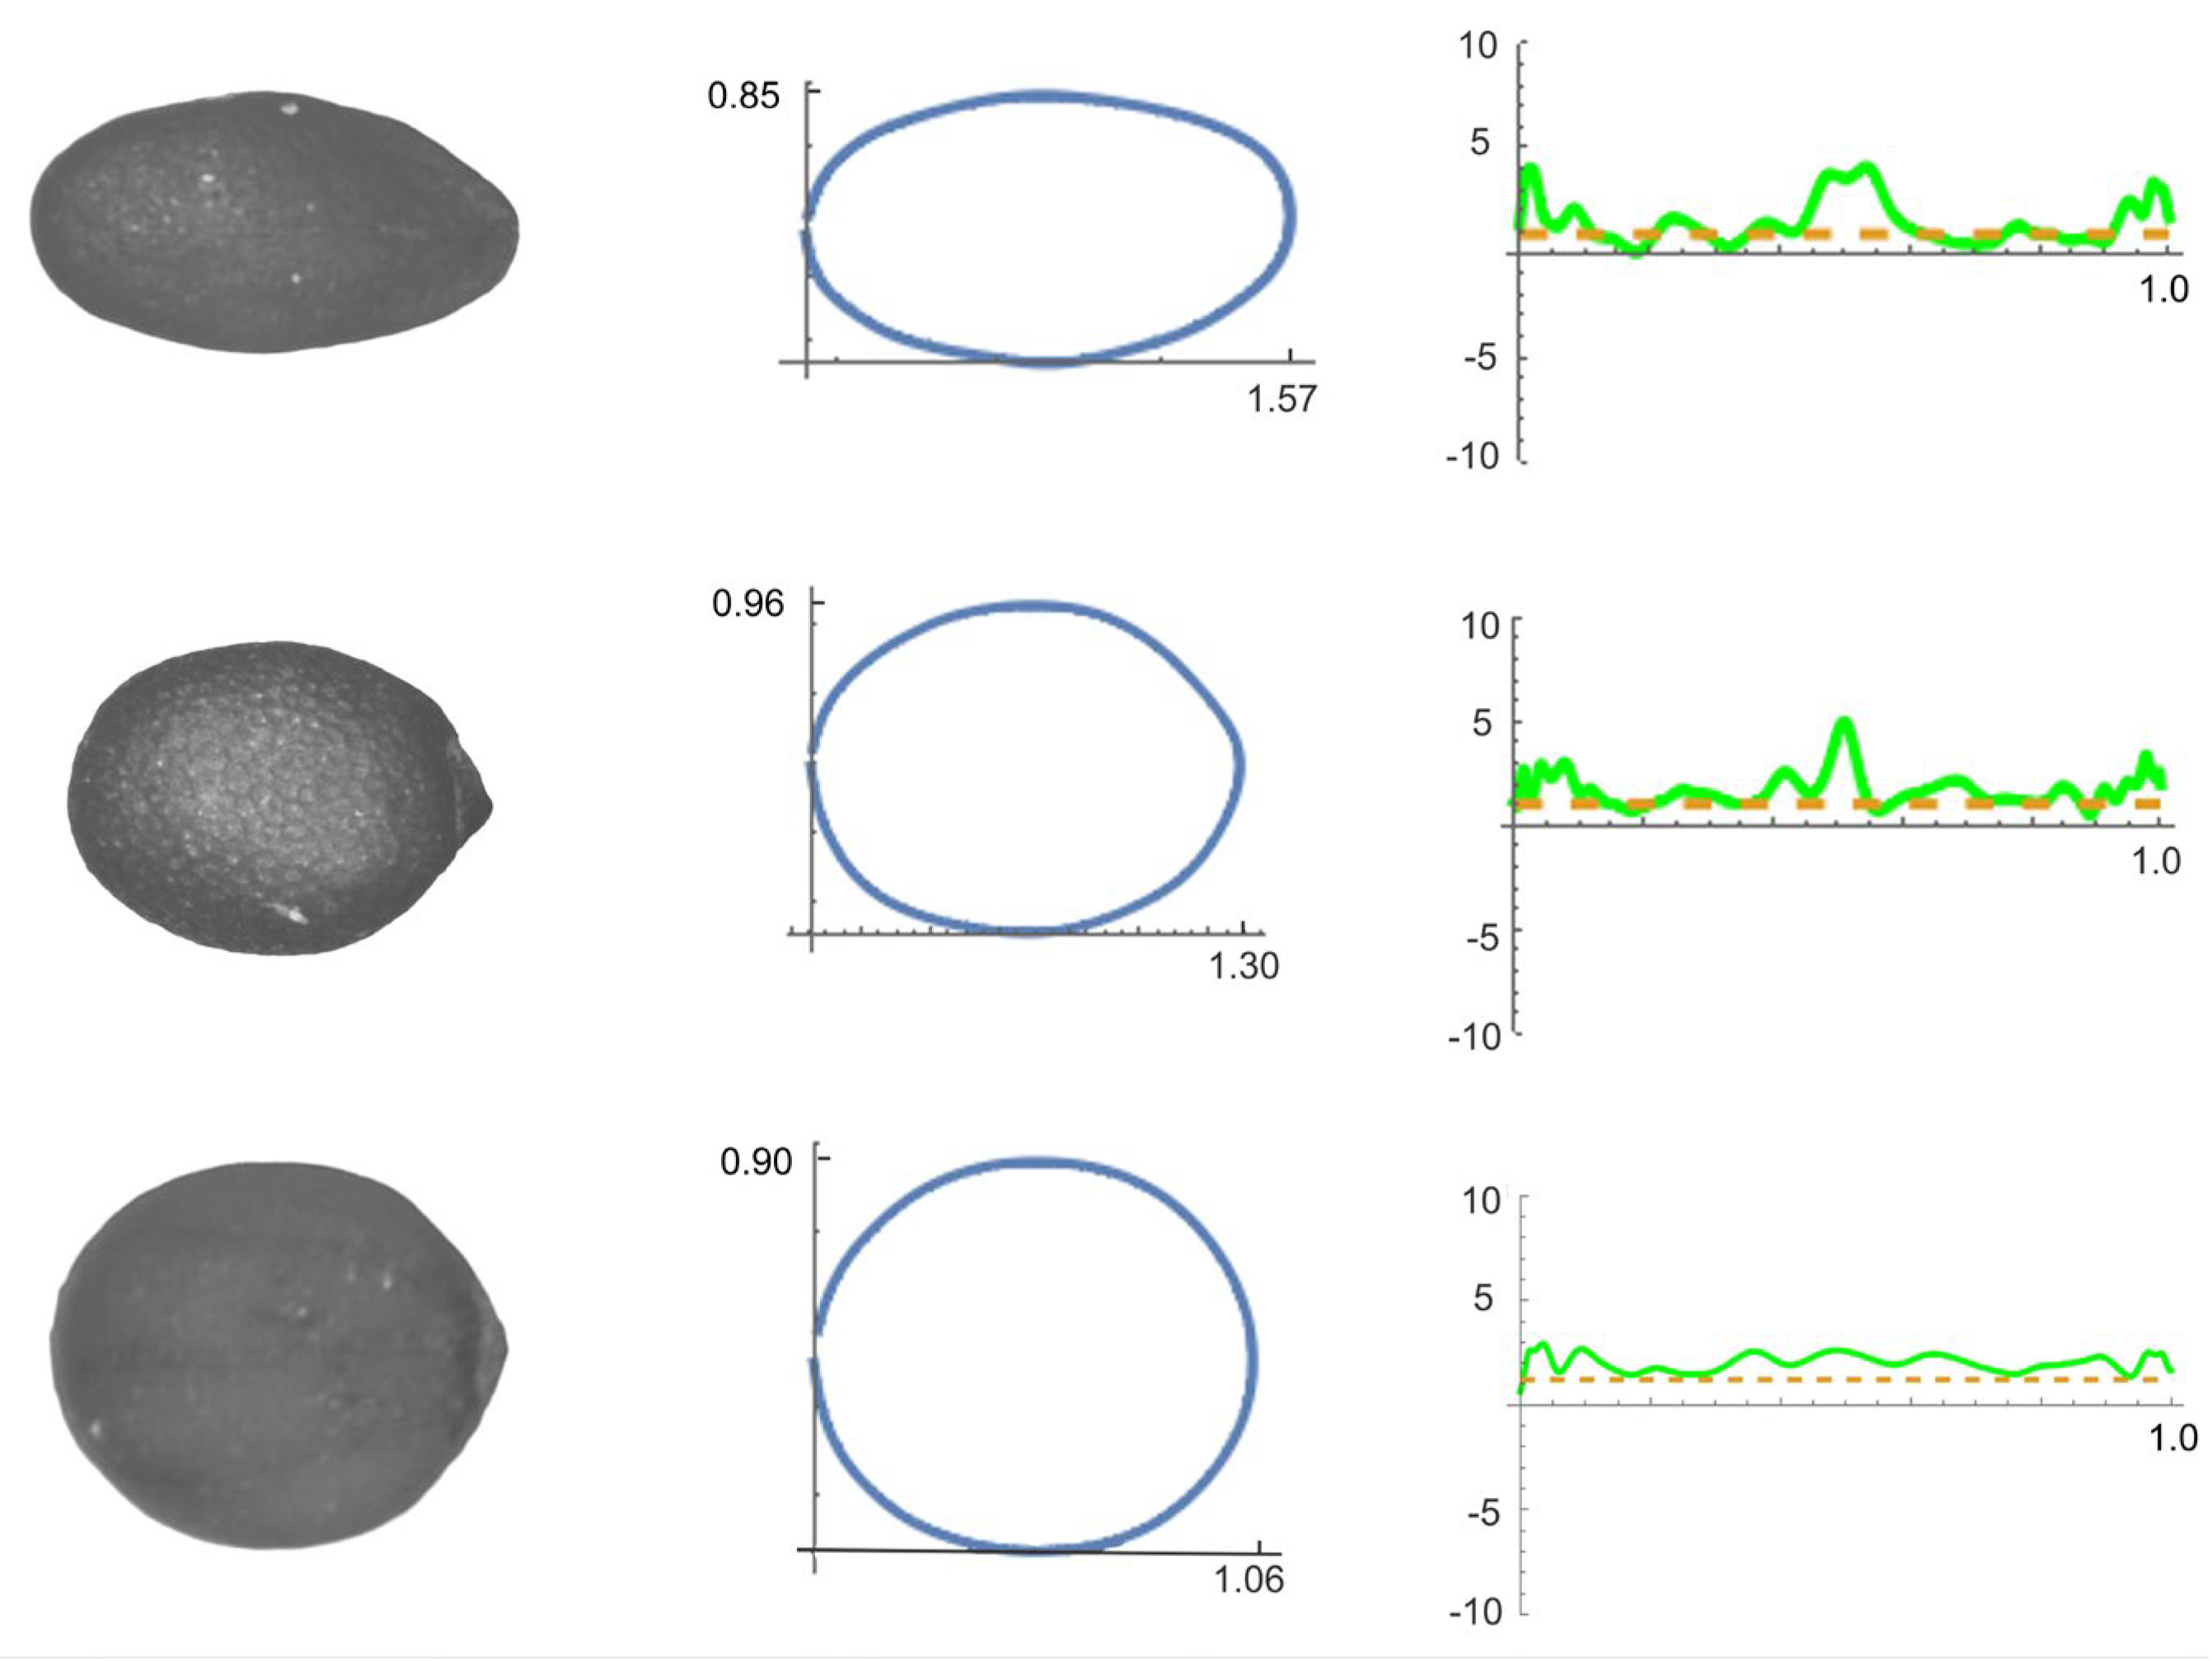
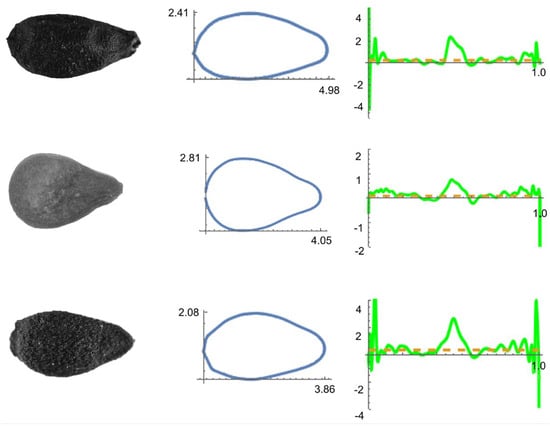
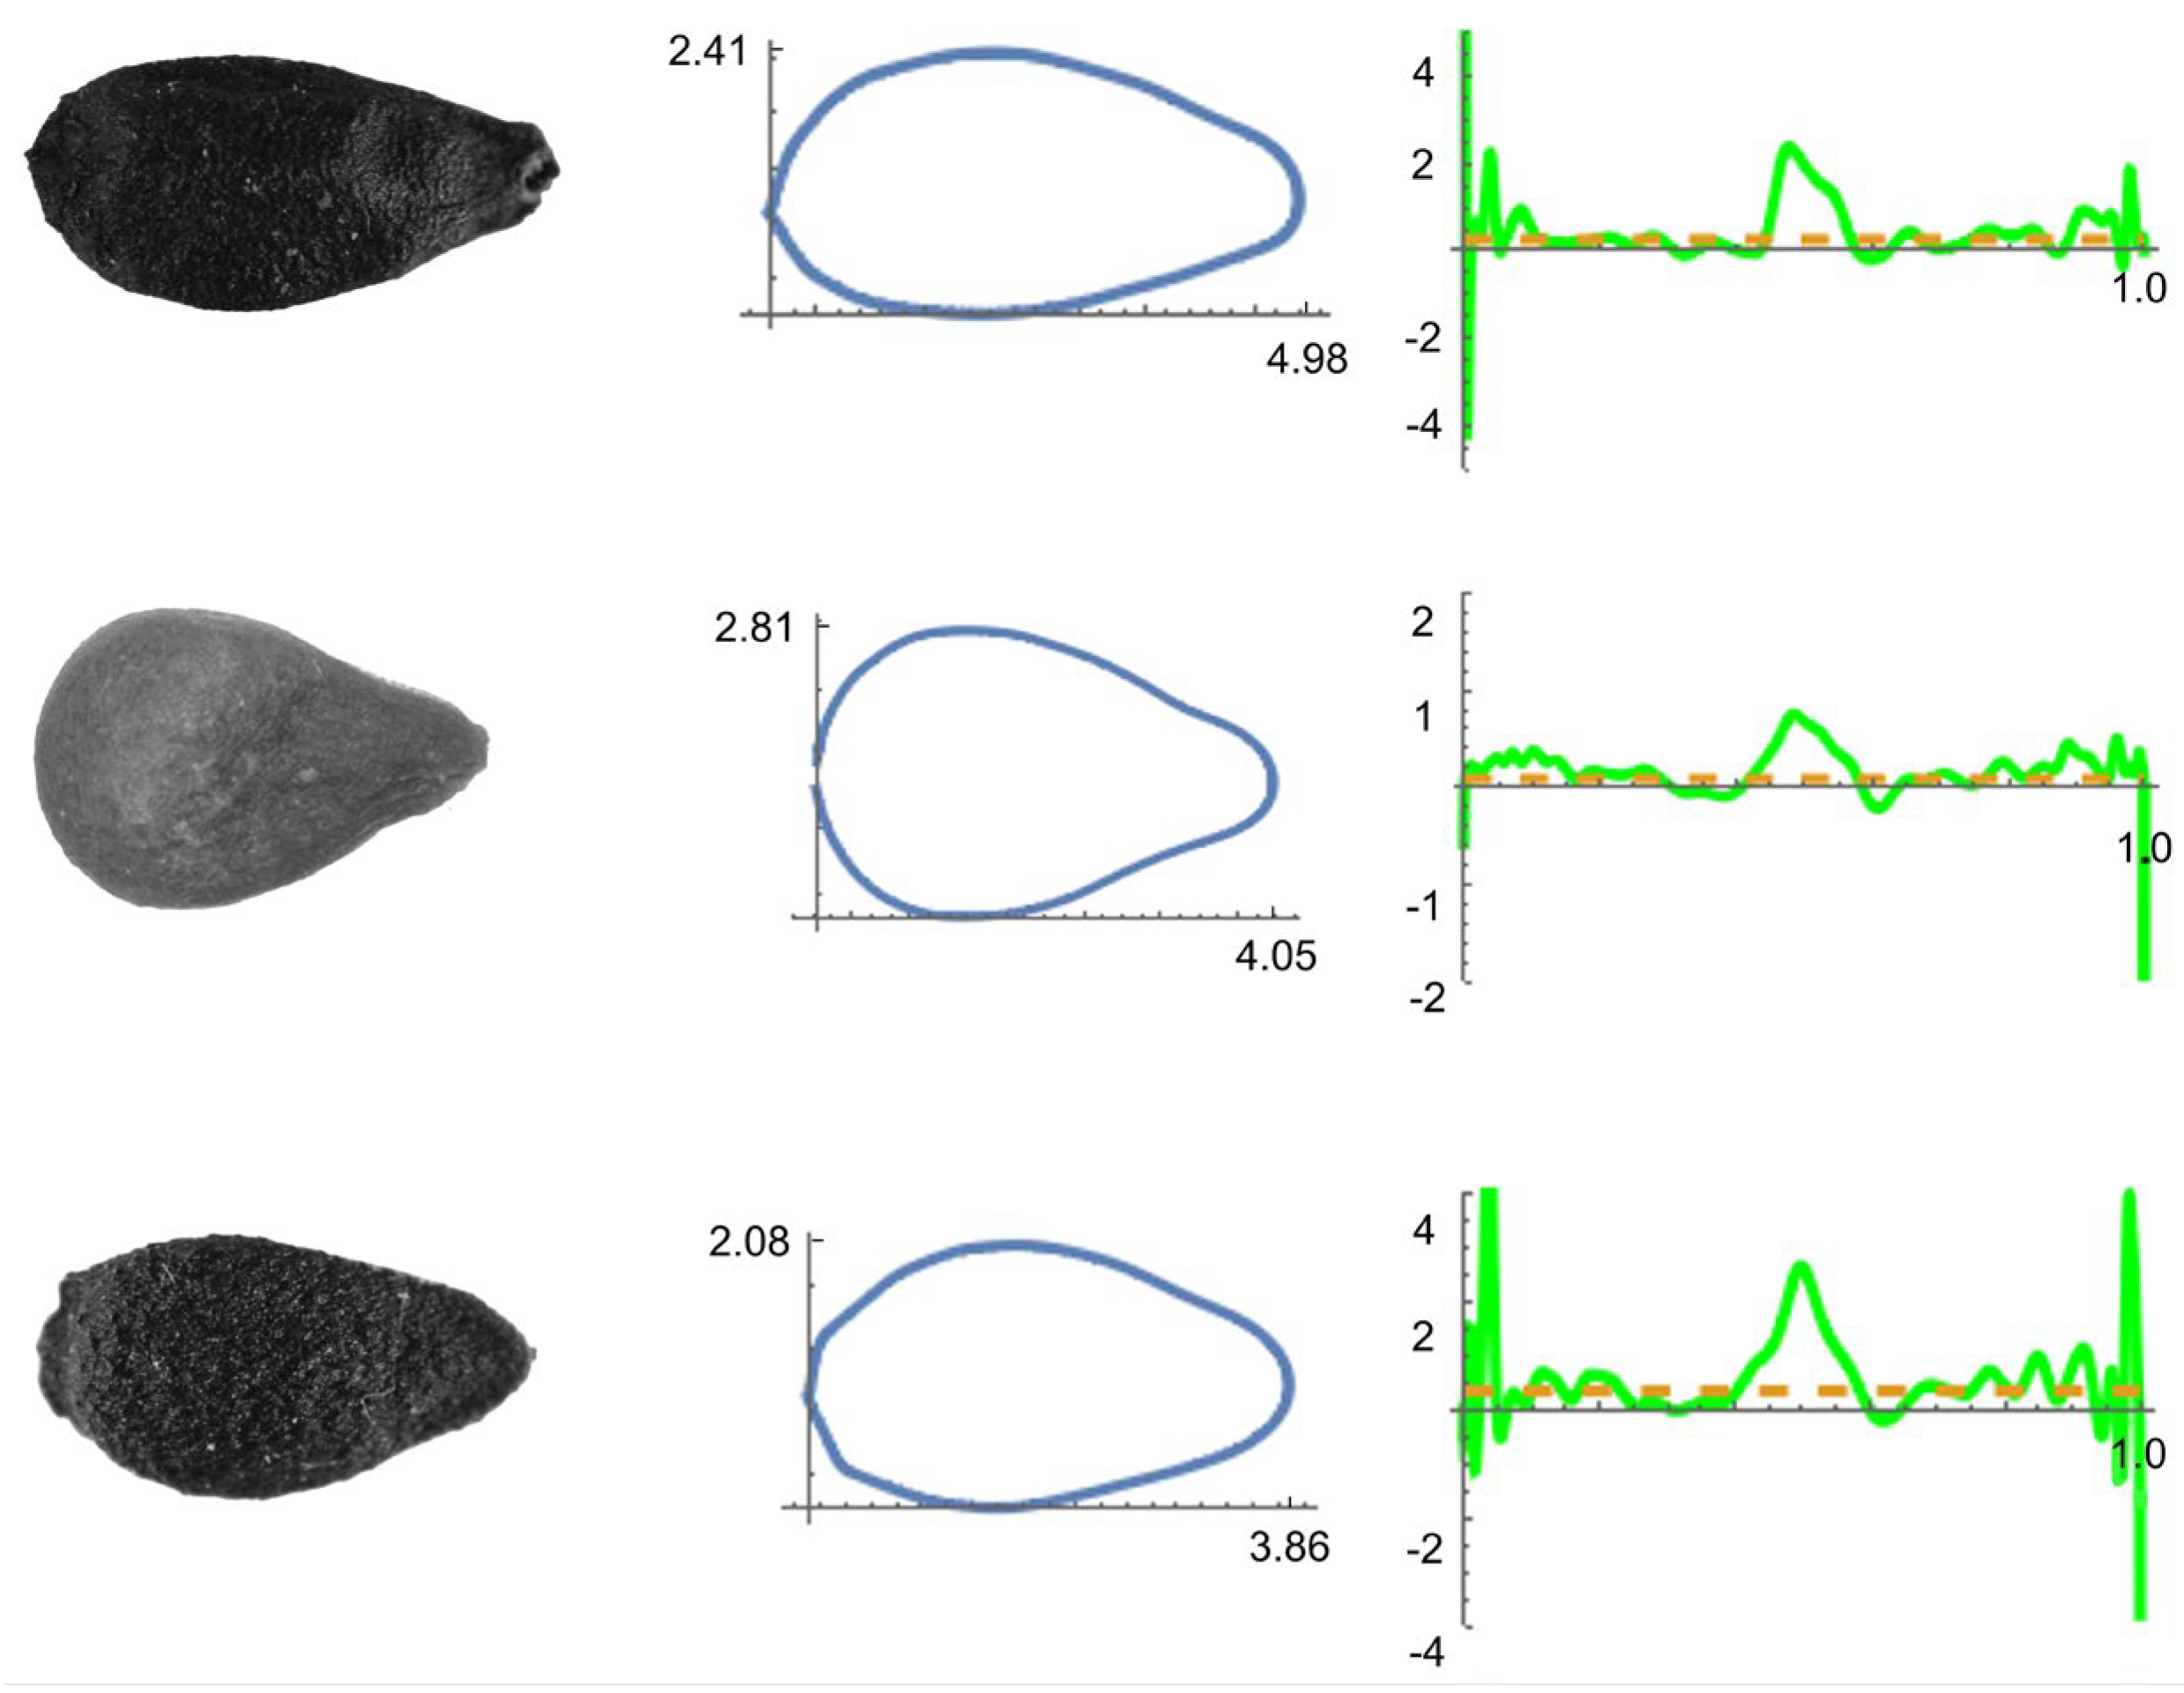
Table 7 shows the results of Kruskal–Wallis test for the comparisons between species of Phlomis, Sideritis, and Stachys and Figure 8, Figure 9 and Figure 10 contain representative images of curvature analysis for species in each genus. In Phlomis, the largest nutlets corresponded to P. herba-venti. Minimum curvature values were negative in the three species, with higher absolute values in P. herba-venti than P. purpurea. Max C and Ave C were lowest in P. lychnitis. This species also had the highest Max C to Ave C ratio.
Table 7.
Mean values and results of Kruskal–Wallis test for the comparisons between species in species of Phlomis, Sideritis, and Stachys for area (A, mm2), length (L, mm), width (W, mm), circularity (C), roundness (R), and solidity (S) values. Max Curv: Maximum curvature; Min Curv: Minimum curvature; Ave Curv: Average curvature; Ratio Curv: Ratio maximum-to-average curvature. Different superscripts in two files of the same column indicate significant differences. Between brackets, there are coefficients of variation.
Figure 8.
Curvature analysis in species of Phlomis. (Above): P. herba-venti; (middle): P. lychnitis; (below): P. purpurea. (Left): Nutlet images; (center): Bézier curve with measurements of length and width (mm); (right): Curvature values along the curve (green) and average curvature (orange). The curvature is calculated between 0.2 and 0.8 to avoid conflicting regions in the extremities of the curve.
Figure 9.
Curvature analysis in species of Sideritis. (Above): S. italica; (middle): S. montana; (below): S. montserratiana. (Left): Nutlet images; (center): Bézier curve with measurements of length and width (mm); (right): Curvature values along the curve (green) and average curvature (orange). The curvature is calculated between 0.2 and 0.8 to avoid conflicting regions in the extremities of the curve.
Figure 10.
Curvature analysis in species of Stachys. (Above): S. arvensis; middle: S. byzantina. (Left): Nutlet images; (center): Bézier curve with measurements of length and width (mm); (right): Curvature values along the curve (green) and average curvature (orange). The curvature is calculated between 0.2 and 0.8 to avoid conflicting regions in the extremities of the curve.
Of the three species of Sideritis, S. italica had larger nutlets than S. montana (Table 7). Max C was higher in S. montserratiana than in S. montana. Min C was higher in S. montana than in S. montserratiana. Ave C was higher in S. montserratiana than in S. italica. Ratio C was lower in S. montana than in the other two species.
Among the species of Stachys, the nutlets were larger in S. arvensis than in S.byzantina (Table 7). Correspondingly, Ave C was lower in the former. Circularity and roundness were also higher in S. arvensis, with lower values of Max C and ratio C in this species.
3.5. Principal Component Analysis (PCA)
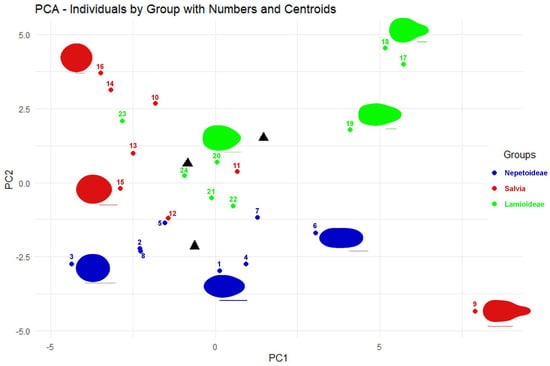
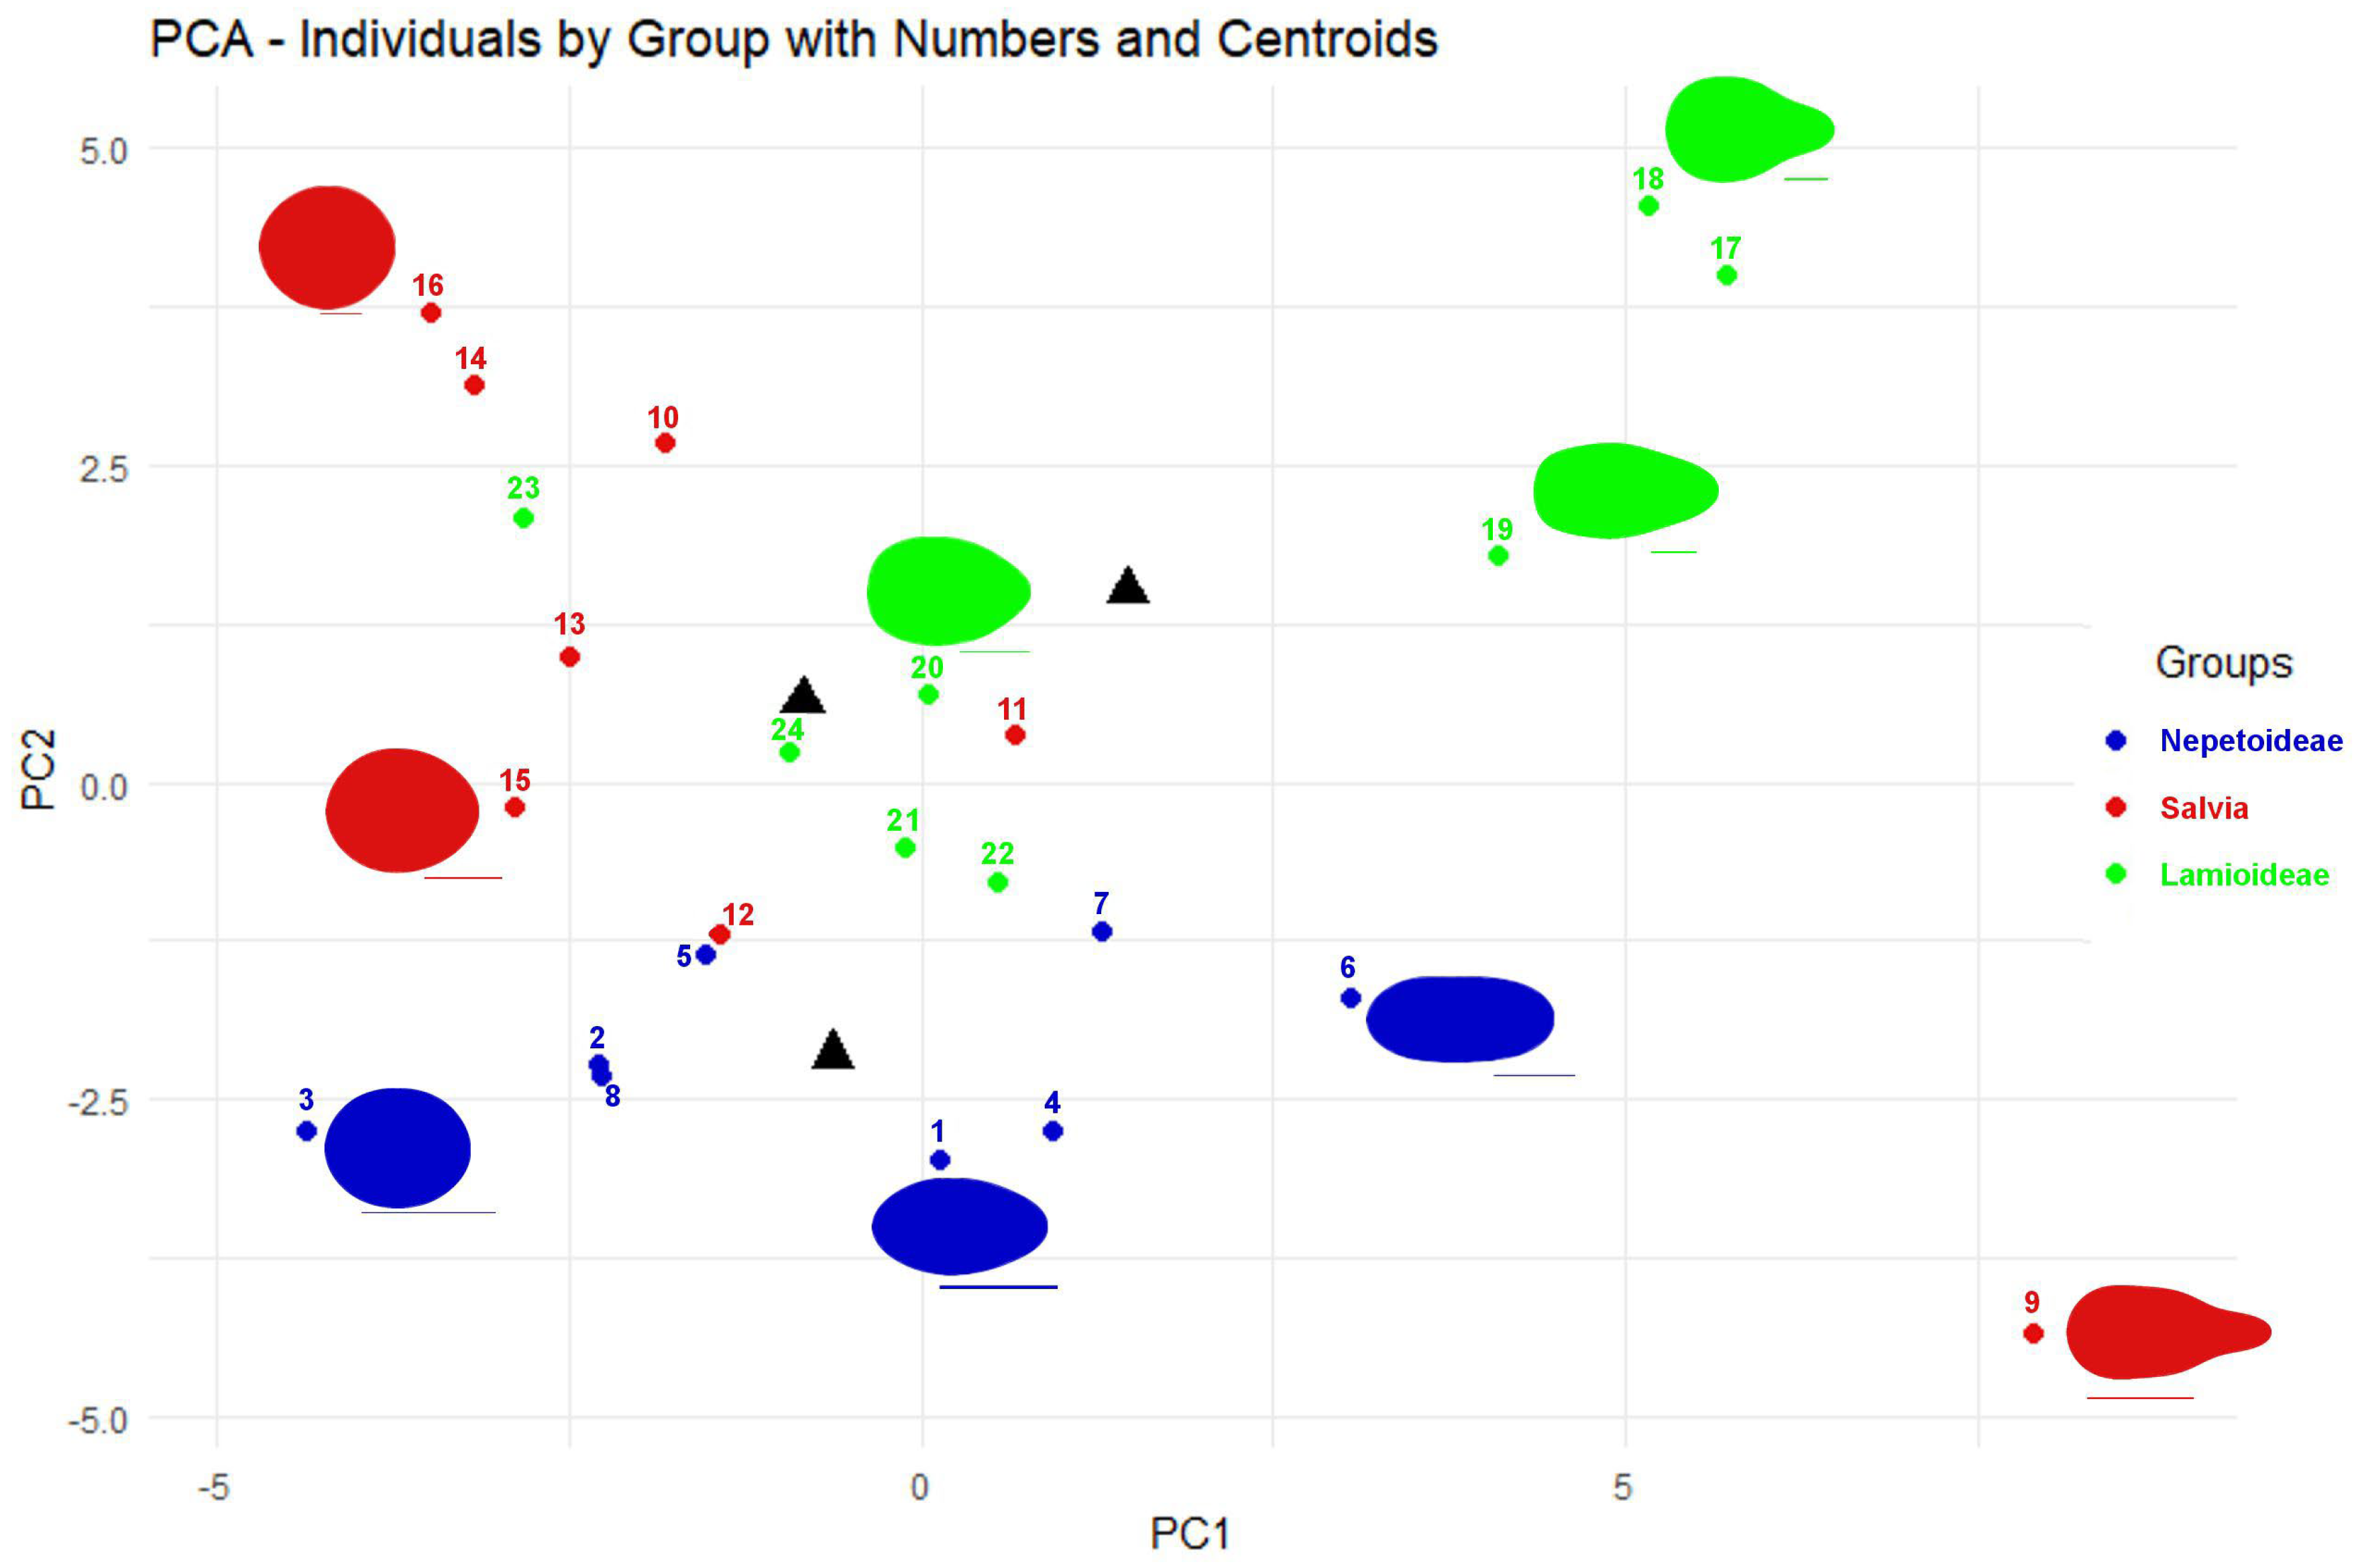
PCA revealed two principal components that together explain 68.2% of the total variance (Table A4 in the Appendix A; Figure 11). PC1 explains 43.2% of the variance and contains shape variables (R, C, AR, S), together with minimum curvature, curvature ratio, and Fourier coefficients a2, a3, a5 and d1, d2, d3, and d5. PC2 explains 25% of the variance and contains size variables (A, W, P, L), with maximum and average curvatures. PC1 and PC2 can be named as “aspect ratio” and “size”, respectively. Significant Fourier coefficients were associated with shape measurements in PC1 (Table A4 in the Appendix A).
Figure 11.
PCA Plot. PC1 (aspect ratio) increases from left to right, while PC2 (size) increases from bottom to top. The numbers represent species, in blue (Nepetoideae): 1, 2, 3: Clinopodium alpinum, C. menthifolium, C. vulgare; 4, 5, 6: Lavandula angustifolia subsp. angustifolia, L. lanata, L. multifida; 7, 8: Ocimum tenuiflorum, O. x africanum. In red (Salvia): 9, 10, 11, 12, 13, 14, 15, 16: Salvia abrotanoides, S. blancoana subsp. mariolensis, S. canariensis, S. dumetorum, S. misella, S. officinalis, S. somalensis, S. x auriculata. In green (Lamioideae): 17, 18, 19: Phlomis herba-venti subsp. pungens, P. lychnitis, P. purpurea; 20, 21, 22: Sideritis italica, S. montana, S. montserratiana. 23, 24: Stachys arvensis, S. byzantina. Outlines corresponding to EFT are shown for 1, 3, 6, 9, 15, 16, 18,19, and 20. Bars correspond to 0.5 mm. Triangles show the centroid for each group.
4. Discussion
Morphological analyses of Lamiaceae nutlets in the literature often focus on the detailed characteristics of the coat and length and width data [12,18,19,23,24,25]. Comparisons based on other general morphological measurements are relatively scarce, as are comparisons of size and shape between taxa superior to genus level. Previous work from our laboratory included nutlets from nine genera in the subfamily Nepetoideae [27], showing differences in size and shape between tribes, with Mentheae having the smallest nutlets, Elsholtzieae the largest ones, and Ocimeae an intermediate size. The genus Salvia was the exception to this general pattern, with the analyzed species (S. hispanica, S. microphylla, S. officinalis, S. pratensis, and S. rosmarinus) having larger nutlets than those of the other genera in the Mentheae. In terms of shape, the Elsholtzieae had the highest values of roundness, the Mentheae had intermediate values, and the Ocimeae had the lowest values. Additionally, the study presented cases of species exhibiting negative curvature values due to regions of partial non-convexity, including some Mentha, Thymus, and Lavandula species, as well as more generally, Ocimum species. PCA revealed two principal components of size and shape, with average curvature associated with size measurements [27].
This work includes nutlets of forty-nine species, expanding the previously reported results [27] to include the Lamioideae subfamily and providing a comparison between the Lamioideae and Nepetoideae subfamilies. The two subfamilies differ in size and shape, with larger nutlets in the Lamioideae, particularly in species of the genus Phlomis, and more rounded nutlets with higher values of solidity in the Nepetoideae. As in previous studies, lower circularity values are associated with regions of negative curvature in the nutlets. Differences in roundness, circularity, and solidity were also found between genera in both subfamilies, as well as between species in most of the genera tested, suggesting those measurements may be interesting criteria in the taxonomy of the Lamiaceae.
The measurement of curvature was applied here to both average outlines obtained from Fourier coefficients and individual nutlet images, for which the points of the outlines were used to calculate the Bézier curves and corresponding curvature. The former method is quicker but less accurate, as it is based on EFT approximations rather than real nutlet images. This method was used to gain an overall view of curvature in all species and to make comparisons between subfamilies and genera. The Lamioideae exhibited more extreme curvature values than the Nepetoideae, with maximum values being higher. The average curvature and the ratio of maximum to average curvature were both higher in the Lamioideae. Although the curvatures measured on average Fourier outlines can be used for comparisons between species, accurate descriptions are better supported by the method based on the direct measurement of curvature on individual nutlet images.
The results of the PCA confirm the expected differences between the Fourier coefficients, with the coefficients a and d being responsible for the main characteristics of the curves that define nutlet shape, and the coefficients b and c being negligible for the basic structure of the curves but defining their detailed aspects and symmetry. These results open the way to detailed comparisons of nutlet shape in species or populations. PC1 and PC2 were associated with shape and size, respectively. Related to curvature measurements, minimum curvature and curvature ratio were associated with PC1 while maximum and average curvatures were associated with PC2.
The work presented here includes eight species of Salvia that were not reported in our previous publication, as well as new populations of S. officinalis and S. rosmarinus. The data confirm that nutlet size is larger in species of Salvia than in other genera in the subfam. Nepetoideae and in the tribe Mentheae [27], as well as that the species of this genus have great diversity in shape. The nutlet sizes of the Salvia species analyzed here are in the range from the smallest reported for S. halophila Hedge (1.6–2.0 × 1.0–1.3 mm) [17], to the largest for S. albimaculata Hedge and Hub.-Mor. (8.4 × 2.8 mm) and S. macrochlamys Boiss. and Kotschy (5 × 4 mm) [19]. These authors suggest that measurements of size are of little value in the taxonomy of this genus. Therefore, it is tempting to speculate that shape measurements, such as circularity, roundness, solidity, or curvature values, could be useful in the taxonomy of Salvia species. Nevertheless, more samples should be analyzed to give a final statement about this important aspect. Species of this genus exhibited significant variation in all measurements, including notable negative curvature values in S. abrotanoides. Negative curvature values were also observed in the average minimum curvature values of S. blancoana, S. canariensis, Lavandula, and Phlomis. Negative minimum curvature values in Stachys bizantina and Ocimum x africanum were in contrast with positive values in other species within the same genus.
One interesting feature of nutlets morphology in the Lamiaceae family is that a high degree of variation observed in the images could not be reflected in the measurements performed. This affects subtle surface changes without alteration in overall size and shape measurements here analyzed. Although their general shape corresponds to simple geometric figures, ellipses, or ovals, detailed observation of the nutlets suggests variations related to differences in symmetry that would not be detected by the measurements used in this study. Differences in symmetry were detected between species of the Cucurbitaceae [41], and the methods used therein may be useful to measure symmetry in species of the Lamiaceae. The average contours created with image processing software and those derived from Fourier coefficients did not accurately represent the shape of some of the images and overlooked a significant amount of the variation. This contrasts with the results in Vitis, where the average outline accurately and better represents each individual seed for a given cultivar [42]. Many seed and nutlet measurements exhibit multimodal and non-Gaussian distributions [43,44], which are more prevalent in plants grown under natural conditions and are associated with high levels of variation [44]. The measurement of symmetry, in combination with the manual method to measure symmetry, may be useful approaches in the taxonomy of this family.
Most species in the Lamiaceae exhibit high outcrossing rates, which may influence variations in nutlet shape. Genetic mixing introduces new combinations of alleles that may have an effect on nutlet morphology. In this context, investigating nutlet shape in Lamium purpureum L., a species that exhibits some degree of self-pollination [45,46], could be interesting. In relation to the reproductive biology of Salvia, the evolutionary significance of the staminal lever mechanism is a matter of debate. The mechanism is responsible for complete emptying of the pollen sacs [47], and while some authors consider it as a proof of the significance of staminal structures for reproductive isolation and speciation in the genus [47], for others it could act by increasing the rate of out-crossing and forcing diversification [48]. The broad morphological variation found in Salvia species agrees with the genetic diversity in this genus [48], offering new possibilities for the study of the genetic basis of nutlet morphology.
5. Conclusions
Differences in nutlet size and shape are described between the two main subfamilies of Lamiaceae as follows: the nutlets of the Lamioideae are larger and have higher aspect ratio and lower circularity values. Curvature analysis also indicates differences with higher absolute values of maximum, minimum, and average curvature in the subfamily Lamioideae. Morphometric analysis based on geometric measurements, curvature, and Fourier equations reveals new aspects of nutlet morphology in the family Lamiaceae that can be of applied interest in the taxonomy of this family.
Supplementary Materials
The following supporting information can be downloaded at: Figure S1: Original images (JPG) with 20 nutlets of each species, and Figure S2: Images of 6 nutlets for those species used in the Fourier analysis and PCA, are available at https://zenodo.org/records/17340980 (accessed on 20 November 2024). Figure S3: Mathematica files for curvature analysis (automated calculations) from Aos based on the images with 20 nutlets per species, and Figure S4: Curvature analysis by individual nutlet images are available at https://zenodo.org/records/17213075 (accessed on 20 November 2024). Tables S1 (FamLamiaceae) and S2 FamLamiaceae2 are available at https://zenodo.org/records/17577048 (accessed on 20 November 2024).
Author Contributions
Conceptualization, E.C.; methodology, J.J.M.-G., Á.T. and E.C.; software, J.J.M.-G. and E.C.; validation, J.J.M.-G., D.G.d.P., Á.T., S.R., A.J. and E.C.; formal analysis, J.J.M.-G. and E.C.; investigation, J.J.M.-G., D.G.d.P., Á.T., S.R., A.J. and E.C.; resources, J.J.M.-G., D.G.d.P., Á.T., S.R., A.J. and E.C.; data curation, J.J.M.-G.; writing—original draft preparation, J.J.M.-G. and E.C.; writing—review and editing, J.J.M.-G., D.G.d.P., Á.T., S.R., A.J. and E.C.; visualization, J.J.M.-G. and E.C.; supervision, Á.T., A.J. and E.C.; project administration, E.C.; funding acquisition, A.J. and E.C.; All authors have read and agreed to the published version of the manuscript.
Funding
This research received no external funding.
Data Availability Statement
The original contributions presented in this study are included in the article/supplementary material. Further inquiries can be directed to the corresponding author(s).
Acknowledgments
Project “CLU-2025-2-02—Unit of Excellence IRNASA_CSIC”, funded by the Junta de Castilla y León and co-funded by the European Union (FEDER “Europe boosts our growth”), and Project “DEEP-MaX-2024_IRNASA” funded by CSIC.
Conflicts of Interest
The authors declare no conflicts of interest.
Abbreviations
The following abbreviations are used in this manuscript:
| Aos | Average outlines |
| PCA | Principal Component Analysis |
Appendix A
Table A1.
General morphological characteristics of the nutlets under study. Symmetry refers here to bilateral similarity along the minor axis. Bilateral symmetry related to the major axis is relatively common in most of the species. The position of the hilum is polar, in the ventral side of the nutlet, and the pole containing the hilium is considered the apical pole.
Table A2.
Mean values and results of Kruskal–Wallis test for the comparisons between genera in the Nepetoideae for area (A), length (L), width (W), circularity (C), roundness (R), and solidity (S) values. Different superscripts in two files of the same column indicate significant differences. Between brackets, there are coefficients of variation.
Table A3.
Mean values and results of Kruskal–Wallis test for the comparisons between genera in the Lamioideae for area (A), length (L), width (W), circularity (C), roundness (R), and solidity (S) values. Different superscripts in two files of the same column indicate significant differences. Between brackets, there are coefficients of variation.
Table A4.
Relative contribution of measurements and Fourier coefficients to PC1 and PC2. PC1 is integrated by shape measurements (aspect ratio, roundness, circularity, and solidity, together with minimum curvature and the ratio maximum-to-average curvature) and Fourier coefficients a2, a3, a5, d1, d2, d3, and d5. PC2 is integrated by size measurements, maximum and average curvature, and d6.
References
- Christenhusz, M.J.; Fay, M.F.; Chase, M.W. Plants of the World: An Illustrated Encyclopedia of Vascular Plants; University of Chicago Press: Chicago, IL, USA, 2020. [Google Scholar]
- Zhao, F.; Chen, Y.-P.; Salmaki, Y.; Drew, B.T.; Wilson, T.C.; Scheen, A.-C.; Celep, F.; Bräuchler, C.; Bendiksby, M.; Wang, Q.; et al. An updated tribal classification of Lamiaceae based on plastome phylogenomics. BMC Biol. 2021, 19, 2. [Google Scholar] [CrossRef] [Scilit]
- Judd, W.S.; Campbell, C.S.; Kellogg, E.A.; Stevens, P.F.; Donoghue, M.J. Plant Systematics: A Phylogenetic Approach; Sinauer Associates, Inc.: Sunderland, MA, USA, 2016. [Google Scholar]
- Harley, R.M.; Atkins, S.; Budantsev, A.L.; Cantino, P.D.; Conn, B.J.; Grayer, R.; Harley, M.M.; de Kok, R.; Krestovskaja, T.; Morales, R.; et al. Labiateae. In VII. Flowering Plants: Dicotyledons. Lamiales (Except Acanthaceae Including Avicenniaceae); Kadereit, J.W., Ed.; Springer: Berlin, Germany, 2004; pp. 167–275. [Google Scholar]
- Wagstaff, S.J.; Hickerson, L.; Spangler, R.; Reeves, P.A.; Olmstead, R.G. Phylogeny in Labiatae s.l., inferred from cpDNA sequences. Plant Syst. Evol. 1998, 209, 265–274. [Google Scholar] [CrossRef] [Scilit]
- Scheen, A.C.; Bendiksby, M.; Ryding, O.; Mathiesen, C.; Albert, V.A.; Lindqvist, C. Molecular phylogenetics, character evolution, and suprageneric classification of Lamioideae (Lamiaceae). Ann. Missouri Bot. Gard. 2010, 97, 468–483. [Google Scholar] [CrossRef] [Scilit]
- Bendiksby, M.; Thorbek, L.; Scheen, A.C.; Lindqvist, C.; Ryding, O. An updated phylogeny and classification of Lamiaceae subfamily Lamioideae. Taxon 2011, 60, 471–484. [Google Scholar] [CrossRef] [Scilit]
- Roy, T.; Lindqvist, C. New insights into evolutionary relationships within the subfamily Lamioideae (Lamiaceae) based on pentatricopeptide repeat (PPR) nuclear DNA sequences. Am. J. Bot. 2015, 102, 1721–1735. [Google Scholar] [CrossRef] [Scilit] [PubMed]
- Qian, M.; Chen, Y.; Dirmenci, T.; Zhao, Y.; Hu, G.; Zhao, F.; Celep, F.; Li, B.; Xiang, C. Phylogenomics of the tribe Leonureae reveals a new genus: Paraleonurus (Lamiaceae, Lamioideae). Turk. J. Bot. 2024, 48, 427–440. [Google Scholar] [CrossRef] [Scilit]
- Wojciechowska, B. Morphology and anatomy of fruits and seeds in the family Labiatae with particular respect to medicinal species. Monogr. Bot. 1966, 21, 3–245. [Google Scholar] [CrossRef] [Scilit]
- Krawczyk, K.; Głowacka, K. Nutlet micromorphology and its taxonomic utility in Lamium L. (Lamiaceae). Plant Syst. Evol. 2015, 301, 1863–1874. [Google Scholar] [CrossRef] [Scilit]
- Celep, F.; Kahraman, A.; Guerin, G.R.; Karabacak, E.; Akaydın, G.; Doğan, M. Nutlet micromorphology and its taxonomic and phylogenetic significance in Salvia (Lamiaceae). Plant Biosyst. 2020, 156, 271–283. [Google Scholar] [CrossRef] [Scilit]
- Hassan, S.A.; Al-Thobaiti, A.T. Morphological nutlet characteristics of some Lamiaceae taxa in Saudi Arabia and their taxonomic significance. Pak. J. Bot. 2015, 47, 1969–1977. [Google Scholar]
- Budantsev, A.L.; Lobova, T.A. Fruit morphology, anatomy and taxonomy of tribe Nepeteae (Labiatae). Edinb. J. Bot. 1997, 54, 183–216. [Google Scholar] [CrossRef] [Scilit]
- Celep, F.; Kahraman, A.; Atalay, Z.; Doğan, M. Seed morphology of some Salvia species (Lamiaceae) from Turkey and its systematic importance. Plant Syst. Evol. 2014, 300, 1179–1190. [Google Scholar]
- Kriebel, R.; Drew, B.T.; Drummond, C.P.; Gonzalez-Gallegos, J.G.; Celep, F.; Mahdjoub, M.M.; Rose, J.P.; Xiang, C.L.; Hu, G.X.; Walker, J.B.; et al. New World Salvia: Phylogeny, taxonomy, and biogeography. Syst. Bot. 2019, 44, 829–865. [Google Scholar]
- Kahraman, A.; Büyükkartal, H.N.; Doğan, M. Pericarp Ultrastructure of Salvia Section Hemisphace (Mentheae; Nepetoideae; Lamiaceae). Commagene J. Biol. 2018, 2, 1–7. [Google Scholar] [CrossRef] [Scilit]
- Kahraman, A.; Celep, F.; Doğan, M.; Guerin, G.R.; Bagherpour, S. Mericarp morphology and its systematic implications for the genus Salvia L. section Hymenosphace Benth. (Lamiaceae) in Turkey. Plant Syst. Evol. 2011, 292, 33–39. [Google Scholar] [CrossRef] [Scilit]
- Kahraman, A.; Celep, F.; Doğan, M. Morphology, anatomy, palynology and nutlet micromorphology of Salvia macrochlamys (Labiatae) in Turkey. Biologia 2010, 65, 219–227. [Google Scholar] [CrossRef] [Scilit]
- Ozkan, M.; Aktas, K.; Ozdemir, C.; Guerin, G. Nutlet morphology and its taxonomic utility in Salvia (Lamiaceae: Mentheae) from Turkey. Acta Bot. Croat. 2009, 68, 105–115. Available online: https://www.abc.botanic.hr/index.php/abc/article/view/76 (accessed on 1 July 2025).
- Kaya, A.; Dinc, M. Nutlet morphology of six Clinopodium taxa, previously treated as Acinos, in Turkey. Biol. Divers. Conserv. 2015, 7, 119–125. [Google Scholar]
- Pădure, I.M. Nepeta (Lamiaceae) morphology and anatomy in Romania and their taxonomic significance. In Proceedings of the Plant, Fungal and Habitat Diversity Investigation and Conservation, Sofia, Bulgaria, 20–26 June 2006; IV BBC: Sofia, Bulgaria, 2006; pp. 34–38. [Google Scholar]
- Rejdali, M. Seed morphology and taxonomy of the North African species of Sideritis L. (Lamiaceae). Bot. J. Linn. Soc. 1990, 103, 317–324. [Google Scholar] [CrossRef] [Scilit]
- Khalik, A. Seed morphology and surface microstructure of the genus Plectranthus L. (Lamiaceae) in Arabian Peninsula highlighting on their systematic implications. Aust. J. Crop Sci. 2016, 10, 1222–1231. [Google Scholar] [CrossRef] [Scilit]
- Akgül, G.; Ketenoğlu, O.; Pinar, N.M.; Kurt, L. Pollen and Seed Morphology of the Genus Marrubium (Lamiaceae) in Turkey. Ann. Bot. Fenn. 2008, 45, 1–10. [Google Scholar] [CrossRef] [Scilit]
- Ozkan, M.; Soy, E. Morphology, Anatomy, Hair and Karyotype Structure of Salvia blepharoclaena Hedge and Hub.-Mor. (Lamiaceae), Endemic to Turkey. Pak. J. Biol. Sci. 2007, 10, 893–898. [Google Scholar] [CrossRef] [Scilit]
- Gutiérrez del Pozo, D.; Martín-Gómez, J.J.; Reyes Tomala, N.I.; Tocino, Á.; Cervantes, E. Seed geometry in species of the Nepetoideae (Lamiaceae). Horticulturae 2025, 11, 315. [Google Scholar] [CrossRef] [Scilit]
- POWO. Plants of the World Online. Facilitated by the Royal Botanic Gardens, Kew. Published on the Internet. 2025. Available online: https://powo.science.kew.org/ (accessed on 19 August 2025).
- Terral, J.F.; Tabard, E.; Bouby, L.; Ivorra, S.; Pastor, T.; Figueiral, I.; Picq, S.; Chevance, J.-B.; Jung, C.; Fabre, L.; et al. Evolution and history of grapevine (Vitis vinifera) under domestication: New morphometric perspectives to understand seed domestication syndrome and reveal origins of ancient European cultivars. Ann. Bot. 2010, 105, 443–455. [Google Scholar] [CrossRef] [Scilit]
- Gros-Balthazard, M.; Newton, C.; Ivorra, S.; Pierre, M.-H.; Pintaud, J.-C.; Terral, J.-F. The domestication syndrome in Phoenix dactylifera seeds: Toward the identification of wild date palm populations. PLoS ONE 2016, 11, e0152394. [Google Scholar] [CrossRef] [Scilit]
- Jesus, A.; Bonhomme, V.; Evin, A.; Soteras, R.; Jacomet, S.; Bouby, L.; Antolín, F. Morphometrics of waterlogged archaeological seeds give new insights into the domestication and spread of Papaver somniferum L. in Western Europe. PLoS ONE 2023, 18, e0286190. [Google Scholar] [CrossRef] [Scilit] [PubMed]
- Cervantes, E.; Rodríguez-Lorenzo, J.L.; Gutiérrez del Pozo, D.; Martín-Gómez, J.J.; Janousek, B.; Tocino, Á.; Juan, A. Seed Silhouettes as Geometric Objects: New Applications of Elliptic Fourier Transform to seed morphology. Horticulturae 2022, 8, 974. [Google Scholar] [CrossRef] [Scilit]
- McLellan, T.; Endler, J.A. The relative success of some methods for measuring and describing the shape of complex objects. Syst. Biol. 1998, 47, 264–281. [Google Scholar] [CrossRef] [Scilit]
- Kuhl, F.P.; Giardina, C.R. Elliptic Fourier features of a closed contour. Comput. Graph. Image Process 1982, 18, 236–258. [Google Scholar] [CrossRef] [Scilit]
- Bonhomme, V.; Picq, S.; Gaucherel, C.; Claude, J. Momocs: Contour analysis using R. J. Stat. Softw. 2014, 56, 24. [Google Scholar] [CrossRef] [Scilit]
- Ferreira, T.; Rasband, W. ImageJ User Guide-Ij1.46r. 2012. 186p. Available online: https://imagej.net/ (accessed on 12 June 2024).
- Cervantes, E.; Martín-Gómez, J.J.; Espinosa-Roldán, F.E.; Muñoz-Organero, G.; Tocino, Á.; Cabello-Sáenz de Santamaría, F. Seed morphology in key Spanish grapevine cultivars. Agronomy 2021, 11, 734. [Google Scholar] [CrossRef] [Scilit]
- Cervantes, E.; Tocino, A. Geometric analysis of Arabidopsis root apex reveals a new aspect of the ethylene signal transduction pathway in development. J. Plant Physiol. 2005, 162, 1038–1045. [Google Scholar] [CrossRef] [Scilit]
- R Core Team. R: A Language and Environment for Statistical Computing; Version 4.1.2; R Foundation for Statistical Computing: Vienna, Austria, 2021; Available online: https://www.R-project.org (accessed on 20 November 2024).
- Martín-Gómez, J.J.; Rodríguez-Lorenzo, J.L.; Espinosa-Roldán, F.E.; de Santamaría, F.C.S.; Muñoz-Organero, G.; Tocino, Á.; Cervantes, E. Morphometric analysis reveals new data in the history of Vitis cultivars. Plants 2025, 14, 2481. [Google Scholar] [CrossRef] [Scilit] [PubMed]
- Martín-Gómez, J.J.; Gutiérrez del Pozo, D.; Rodríguez-Lorenzo, J.L.; Tocino, Á.; Cervantes, E. Geometric analysis of seed shape Diversity in the Cucurbitaceae. Seeds 2024, 3, 40–55. [Google Scholar] [CrossRef] [Scilit]
- Martín-Gómez, J.J.; Rodríguez-Lorenzo, J.L.; Espinosa-Roldán, F.E.; de Santamaría, F.C.S.; Muñoz-Organero, G.; Tocino, Á.; Cervantes, E. Seed morphometry reveals two major groups in Spanish grapevine cultivars. Plants 2025, 14, 1522. [Google Scholar] [CrossRef] [Scilit] [PubMed]
- Rovner, I. Computer-assisted seed morphometry—A tool for archaeogenetics. In Plant Archaeogenetics; Gyulai, G., Ed.; Nova Sci Publisher Inc.: New York, NY, USA, 2011; pp. 135–141. [Google Scholar]
- Rovner, I.; Gyulai, F. Computer-assisted morphometry: A new method for assessing and distinguishing morphological variation in wild and domestic seed populations. Econ. Bot. 2007, 61, 154–172. [Google Scholar]
- Grime, J.P.; Hodgson, J.G.; Hunt, R. Comparative Plant Ecology; Unwin Hyman Ltd.: London, UK, 1988. [Google Scholar]
- Macior, L.W. Pollination interactions in sympatric dicentra species. Am. J. Bot. 1978, 65, 57–62. [Google Scholar] [CrossRef] [Scilit]
- Speck, T.; Rowe, N.P.; Civeyrel, L.; Claßen-Bockhoff, R.; Neinhuis, C.; Spatz, C. The potential of plant biomechanics in functional biology and systematics. In Deep Morphology: Towards a Renaissance of Morphology in Plant Systematics; Stuessy, T., Hörandl, F., Mayer, V., Eds.; Koeltz: Königstein, Germany, 2003; pp. 241–271. [Google Scholar]
- Kalnyuk, J.V.; Yurkevich, O.Y.; Badaeva, E.D.; Semenov, A.R.; Zoshchuk, S.A.; Amosova, A.V.; Muravenko, O.V. Taxonomy, Phylogeny, Genomes, and Repeatomes in the Subgenera Salvia, Sclarea, and Glutinaria (Salvia, Lamiaceae). Int. J. Mol. Sci. 2025, 26, 6436. [Google Scholar] [CrossRef] [Scilit] [PubMed]

Disclaimer/Publisher’s Note: The statements, opinions and data contained in all publications are solely those of the individual author(s) and contributor(s) and not of MDPI and/or the editor(s). MDPI and/or the editor(s) disclaim responsibility for any injury to people or property resulting from any ideas, methods, instructions or products referred to in the content. |
© 2025 by the authors. Licensee MDPI, Basel, Switzerland. This article is an open access article distributed under the terms and conditions of the Creative Commons Attribution (CC BY) license (https://creativecommons.org/licenses/by/4.0/).