


Abstract
Key pigments and genes associated with peel color variation between Shiranui Mandarin and its Citrine Mutant were investigated. Combining liquid chromatography with tandem mass spectrometry (LC-MS/MS) analysis detected carotenoids in the peel of Shiranui mandarin and its mutant, Citrine Shiranui. Transcriptomic analysis revealed genes enriched in the carotenoid biosynthesis and chlorophyll degradation pathways. Weighted Gene Coexpression Network Analysis (WGCNA) predicted potential regulatory transcription factors. Dual-Luciferase Reporter Assays (LUC) demonstrated the regulatory relationships between the predicted transcription factors and key functional genes involved in carotenoid biosynthesis and chlorophyll degradation. During fruit ripening, the accumulation of β-cryptoxanthin was significantly lower in Citrine Shiranui. In fully ripened fruit, β-cryptoxanthin accounted for 43.62% of the peel pigments in Shiranui, compared to only 8.21% in Citrine Shiranui. Additionally, while chlorophyll degradation occurred during ripening in both varieties, Citrine Shiranui retained higher chlorophyll level. Notably, the expression patterns of CitBCH1 and CitNCY1 were associated with reduced β-cryptoxanthin synthesis and delayed chlorophyll degradation in Citrine Shiranui. LUC further demonstrated that CitBCH1 and CitNCY1 were positively regulated by an ethylene-responsive transcription factor (CitERF5) and an ABA-responsive element-binding factor (CitABF2), respectively. In summary, the citrine/yellow peel color of the Citrine Shiranui mutant primarily resulted from reduced β-cryptoxanthin accumulation due to down-regulation of CitBCH1, while the retention of chlorophyll, linked to lower CitNCY1 expression, might also contribute modestly to the phenotype.
1. Introduction
Carotenoids and chlorophylls are the predominant pigments in citrus fruit peels. Chlorophylls dominate in immature fruits. As peel coloration initiates, chlorophylls degrade while carotenoids accumulate substantially [1]. These carotenoids represent the primary pigments in ripened citrus fruits and are responsible for the characteristic red, orange, and yellow hues in their peels and juice [2].
Carotenoids are a class of C40 tetraterpenoid compounds. In citrus fruits, the differential accumulation of carotenoid components is a key factor, in addition to the total carotenoid content, that causes the peels or flesh to exhibit distinct fruit coloration patterns. In several red-flesh mutants, such as Cara Cara (Citrus sinensis), Hong Anliu (C. sinensis), Flame (C. paradisi), and Rio Red (C. paradisi), lycopene is primarily found [3]. Lycopene and β-carotene are predominant in the juice vesicles of red pummelo (C. grandis cv. Chuzhou Early Red) [4]. In the dull orange to dark yellow peels of Hamlin (C. sinensis), β-cryptoxanthin is a major pigment [5]. The peels of the orange cultivars Bonanza and Cara Cara (C. sinensis) exhibit an orange-red color due to high amounts of β-citraurin [4,6]. In contrast, in the C. sinensis cultivar Pinalate, which has yellow peels, colorless carotenoids such as phytoene, phytofluene, and ζ-carotene accumulate, whereas its parent cultivar Navelate has typical bright orange peels [7]. Phytoene is also markedly accumulated in Lisbon lemon (C. limon) peels [8].
The carotenoid biosynthesis pathway involves multiple hydroxylation steps mediated by two distinct enzyme types: non-heme di-iron enzymes (BCH type) and cytochrome P450 enzymes (CYP97 type) [9]. Specifically, β-carotene hydroxylase (BCH/CrtR-b/CHYB) catalyzes the hydroxylation of β-rings, converting β-carotene to β-cryptoxanthin and subsequently hydroxylating β-cryptoxanthin to produce zeaxanthin. In most plant species, BCH genes form small gene families [8] and exhibit tissue-specific expression patterns [9]. In Citrus, two BCH genes have been identified: BCH1, which catalyzes the hydroxylation of carotenes to form β-cryptoxanthin and zeaxanthin, and BCH2, which promotes xanthophyll accumulation and increases plastoglobule size [10,11]. The differential expression of BCH genes is thought to provide regulatory flexibility, enabling control over the accumulation of upstream carotenes or downstream xanthophylls [9].
Chlorophylls, as tetrapyrrole molecules, undergo degradation through the coordinated action of chlorophyll catabolic enzymes (CCEs) including 7-hydroxymethyl chlorophyll a reductase (HCAR), NON-YELLOW COLORING 1 (NYC1), NYC1-LIKE (NOL), pheophytinase (PPH), pheophorbide a oxygenase (PAO), and red chlorophyll catabolite reductase (RCCR) [11]. These CCEs form a functional complex by physically interacting with both STAY-GREEN (SGR) protein and the light-harvesting complex of photosystem II (LHCII), creating a dynamic SGR-CCE-LHCII protein interaction system that orchestrates chlorophyll breakdown [12,13]. Within this complex, NYC1 specifically functions as a chlorophyll b (Chlb) reductase, playing a critical role in the chlorophyll cycle by mediating the interconversion between Chla and Chlb.
The regulation of peel coloration during fruit ripening is mediated by hormone signals-associated transcription factors. Ethylene, a key ripening-related phytohormone, exerts its effects via transcriptional regulation-in tomato (Solanum lycopersicum), the ethylene-responsive transcription factor SlNAC4 upregulates phytoene synthase (SlPSY1) to promote carotenoid accumulation [14], while in Citrus sinensis, CsERF061 activates both CsPSY1 and CsBCH expression [15]. Chlorophyll degradation, conversely, is modulated by multiple hormones including ethylene, abscisic acid (ABA) and jasmonic acid (JA). Studies from Arabidopsis (Arabidopsis thaliana) demonstrate that the ethylene-responsive AtEIN3 directly binds to and activates the AtNYC1 promoter [16], while ABA signaling components (ABF2/3/4, ABI5 and EEL) positively regulate NYC1 transcription [17,18], illustrating the complex hormonal coordination of pigment metabolism during ripening.
Citrine Shiranui (C. reticulata Blanco), commercially known as Jinlegan, is a spontaneous bud mutation derived from Shiranui mandarin that was first identified in China. Citrine Shiranui is characterized by its distinctive citrine/yellow peel coloration at maturity compared to the deep orange peel of its parental Shiranui (SH) variety. The current study employs a comprehensive analytical approach combining LC-MS/MS (Combining liquid chromatography with tandem mass spectrometry)-based carotenoid profiling with RNA-seq transcriptomic analysis to elucidate the precise molecular regulatory networks responsible for the observed peel color divergence between Citrine Shiranui and its parental line.
2. Materials and Methods
2.1. Plant Materials
Fruit samples of Shiranui (SH) and its mutant Citrine Shiranui (CS) were collected from the same orchard at three critical developmental stages: immature stage (Stage I, 180 days after flowering, 180 DAF), color-break stage (Stage II, 210 DAF), and full-colored stage (Stage III, 240 DAF). Following collection, peels were carefully excised with the fruit neck and basal portions removed, then immediately frozen at −80 °C for subsequent analyses. The experimental design included three biological replicates, with each replicate consisting of six fruits harvested from a single tree to ensure sample consistency.
2.2. The Total Carotenoid Content and Chlorophylls Contents Determination
The total carotenoid (TCaro) and chlorophyll contents were determined using spectrophotometry. Briefly, frozen peel samples were homogenized, and 1 g aliquots were extracted in 20 mL of an acetone:ethanol (1:1, v/v) solution for 24 h in darkness. After centrifugation at 4000× g for 10 min, the absorbance of the supernatant was measured at 645 nm, 663 nm, and 470 nm for Chlb, Chlb, and TCaro determination, respectively. The contents of Chla, Chlb, total chlorophyll (TChl), and TCaro were calculated using the following formulae: Chla = (12.7D663 − 2.69D645) × V/W, Chlb = (22.9D645 − 4.68D663) × V/W, TChl = (20.0D645 + 8.02D663) × V/W, TCaro = (1000D470 − 3.27Chla − 104 Chlb)/229 × V/W. V is the volume of the extraction solution (mL) and W is the weight of the sample (g).
2.3. Carotenoid Composition Determination
Carotenoid composition quantification was conducted using the AB Sciex QTRAP6500 LC-MS/MS platform through MetWare (Wuhan, China) (http://www.metware.cn/). Peel samples were lyophilized and homogenized to powder, with 50 mg aliquots extracted using n-hexane:acetone:ethanol (2:1:1, v/v/v). Following centrifugation, supernatants were concentrated under nitrogen and reconstituted in methanol:methyl tert-butyl ether (MTBE) (1:1, v/v). Filtered extracts (0.22 μm) were analyzed on a UHPLC-MS/MS system (ExionLC™ AD coupled to 6500 Triple Quadrupole, Sciex, Framingham, MA, USA) with YMC C30 column (150 mm × 2.1 mm, 3 μm) at 28 °C. The mobile phase consisted of (A) methanol:acetonitrile (3:1) with 0.01% BHT and 0.1% formic acid, and (B) MTBE with 0.01% BHT, delivered at 0.8 mL/min with the following gradient: 100% A (0–3 min), linear transition to 58% A (3–6 min), 20% A (6–8 min), 5% A (8–9 min), returning to 100% A (9.1–11 min). MS detection employed positive ion APCI mode on the API 6500 system controlled by Analyst 1.6.3 software, with ion source parameters optimized for carotenoid detection. Data acquisition was performed in Multiple Reaction Monitoring (MRM) mode. The MRM transitions, declustering potentials (DP), and collision energies (CE) for each carotenoid were optimized using their respective authentic standards. Compound identification was achieved by matching the retention time and MRM transitions with those of the standards. Quantification was based on the peak area of the specific MRM transition for each compound. Sixty-eight standard samples were used (Table S1).
2.4. RNA Sequencing (RNA-Seq) and Quantitative Reverse Transcription-PCR (qRT-PCR)
Total RNA was extracted using Trizol reagent (Invitrogen, Carlsbad, CA, USA) following manufacturer protocol, with RNA integrity verified through Agilent 2100 Bioanalyzer assessment (Agilent Technologies, Palo Alto, CA, USA) and RNase-free agarose gel electrophoresis. cDNA library preparation and sequencing were conducted on the PacBio Sequel platform (Single Molecule Real Time Sequencing) by Novogene Co., Ltd. (Beijing, China) Gene Denovo Biotechnology Co., Ltd. (Beijing, China). Clean reads were aligned and FPKM (Fragments Per Kilobase of exon model per Million mapped fragments) values were calculated using RSEM software (v1.3.3). CD-HIT was employed to eliminate redundant corrected consensus reads, generating final transcripts for downstream analysis. Differential gene expression analysis was performed using the DESeq R package (v1.10.1), and unigenes dierentially expressed between two samples were screened using a false discovery rate (FDR) of < 0.01 and |log2 (fold changes)| ≥ 1 as the criteria. KOBAS software (v3.0) facilitated KEGG pathway enrichment analysis of differentially expressed genes (DEGs). For qRT-PCR validation, RNA aliquots were reverse transcribed and amplified using gene-specific primers (Table S2), with Actin serving as the reference gene. Expression levels were quantified using the 2−ΔΔCt method, incorporating three biological replicates each with three technical replicates to ensure data reliability.
2.5. Weighted Gene Coexpression Network Analysis (WGCNA)
Weighted Gene Co-expression Network Analysis (WGCNA) was performed on differentially expressed genes (DEGs) using the WGCNA package (v1.47) in R software (v4.3.2) with the following parameters: a soft-thresholding power of 12 to ensure scale-free topology, a merge cut height of 0.75 for module dendrogram merging, and a minimum module size of 50 genes [19]. Module eigengenes were subsequently correlated with sample groups and phenotypic traits to identify biologically relevant modules.
2.6. Dual-Luciferase Activity Assay (LUC)
The promoter regions (2000 bp upstream of the initiation codon) and coding sequences (CDS) of the target genes (CitBCH1 and CitNYC1) were cloned, along with the CDS of the transcription factor genes (CitERF5, CitEIL1, and CitABF2). Sequence comparison between the two citrus varieties revealed no nucleotide differences. The promoters of CitBCH1 and CitNYC1 were independently inserted into the pGreen II 0800-LUC dual-reporter vector, while the CDS of CitERF5, CitEIL1, and CitABF2 were individually cloned into the pGreen II 62-SK vector under the control of the CaMV 35S promoter to generate effector constructs. The effector and reporter plasmids were co-transformed into tobacco (Nicotiana tabacum L.) leaves via Agrobacterium tumefaciens strain GV3101 (pSoup-p19) at a 1:5 (v/v) ratio. After 48 h of infiltration at 21 °C, fluorescence images were captured using a multicolor fluorescence imaging system (GelView6000 PLUS, Guangzhou Biolight Biotechnology, Guangzhou, China). Luciferase (LUC) and Renilla (REN) activities were quantified using a Dual-Luciferase Reporter Assay Kit (Promega, Madison, WI, USA) on a SpectraMax M2 microplate reader (Molecular Devices, Shanghai, China). The relative transcriptional activity was determined by calculating the LUC/REN ratio, with six biological replicates analyzed for each combination.
2.7. Statistical Analysis
Statistical analyses were conducted using IBM SPSS Statistics 19.0 (IBM Corporation, Armonk, NY, USA). One-way analysis of variance (ANOVA) followed by the Student–Newman–Keuls (SNK) post hoc test was applied to assess significant differences at the 5% probability level (p < 0.05). Pairwise comparisons between cultivars at each developmental stage were evaluated.
3. Results
3.1. Determination of Total Carotenoid and Chrolophylls Contents
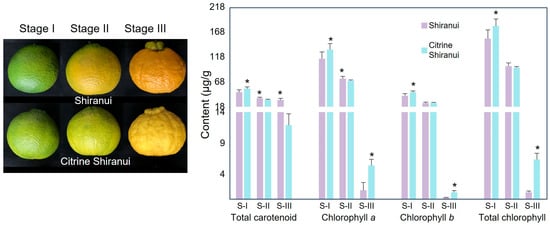
At stage I (immature stage), the peel color of both SH and CS was green. At stage II (color-break stage), the peel of SH appeared yellow, while that of CS appeared yellowish-green. At stage III (full-colored stage), SH was orange, while the peel of CS was citrine/yellow (Figure 1). We preliminarily determined carotenoid and chlorophyll contents using spectrophotometry. Both TCaro and Chls contents gradually decreased in SH and CS. At the stage with the most significant difference in peel color (Stage III; full-colored stage), the TCaro content in SH was significantly higher than in CS, with a 2.64-fold difference. In contrast, Chla, Chlb, and TChl in CS peels were significantly higher than in SH, by 3.74-fold, 3.64-fold, and 5.57-fold, respectively (Figure 1).
Figure 1.
The total carotenoid and chlorophylls contents in the peels of Shiranui and Citrine Shiranui during ripening. S-I, immature stage; S-II, breaking stage; S-III, full-colored stage. Asterisks indicate significant differences between Shiranui (SH) and Citrine Shiranui (CS) at the same stage (p < 0.05), as determined by the Student–Newman–Keuls (SNK) test.
3.2. Determination of Carotenoid Compound Components
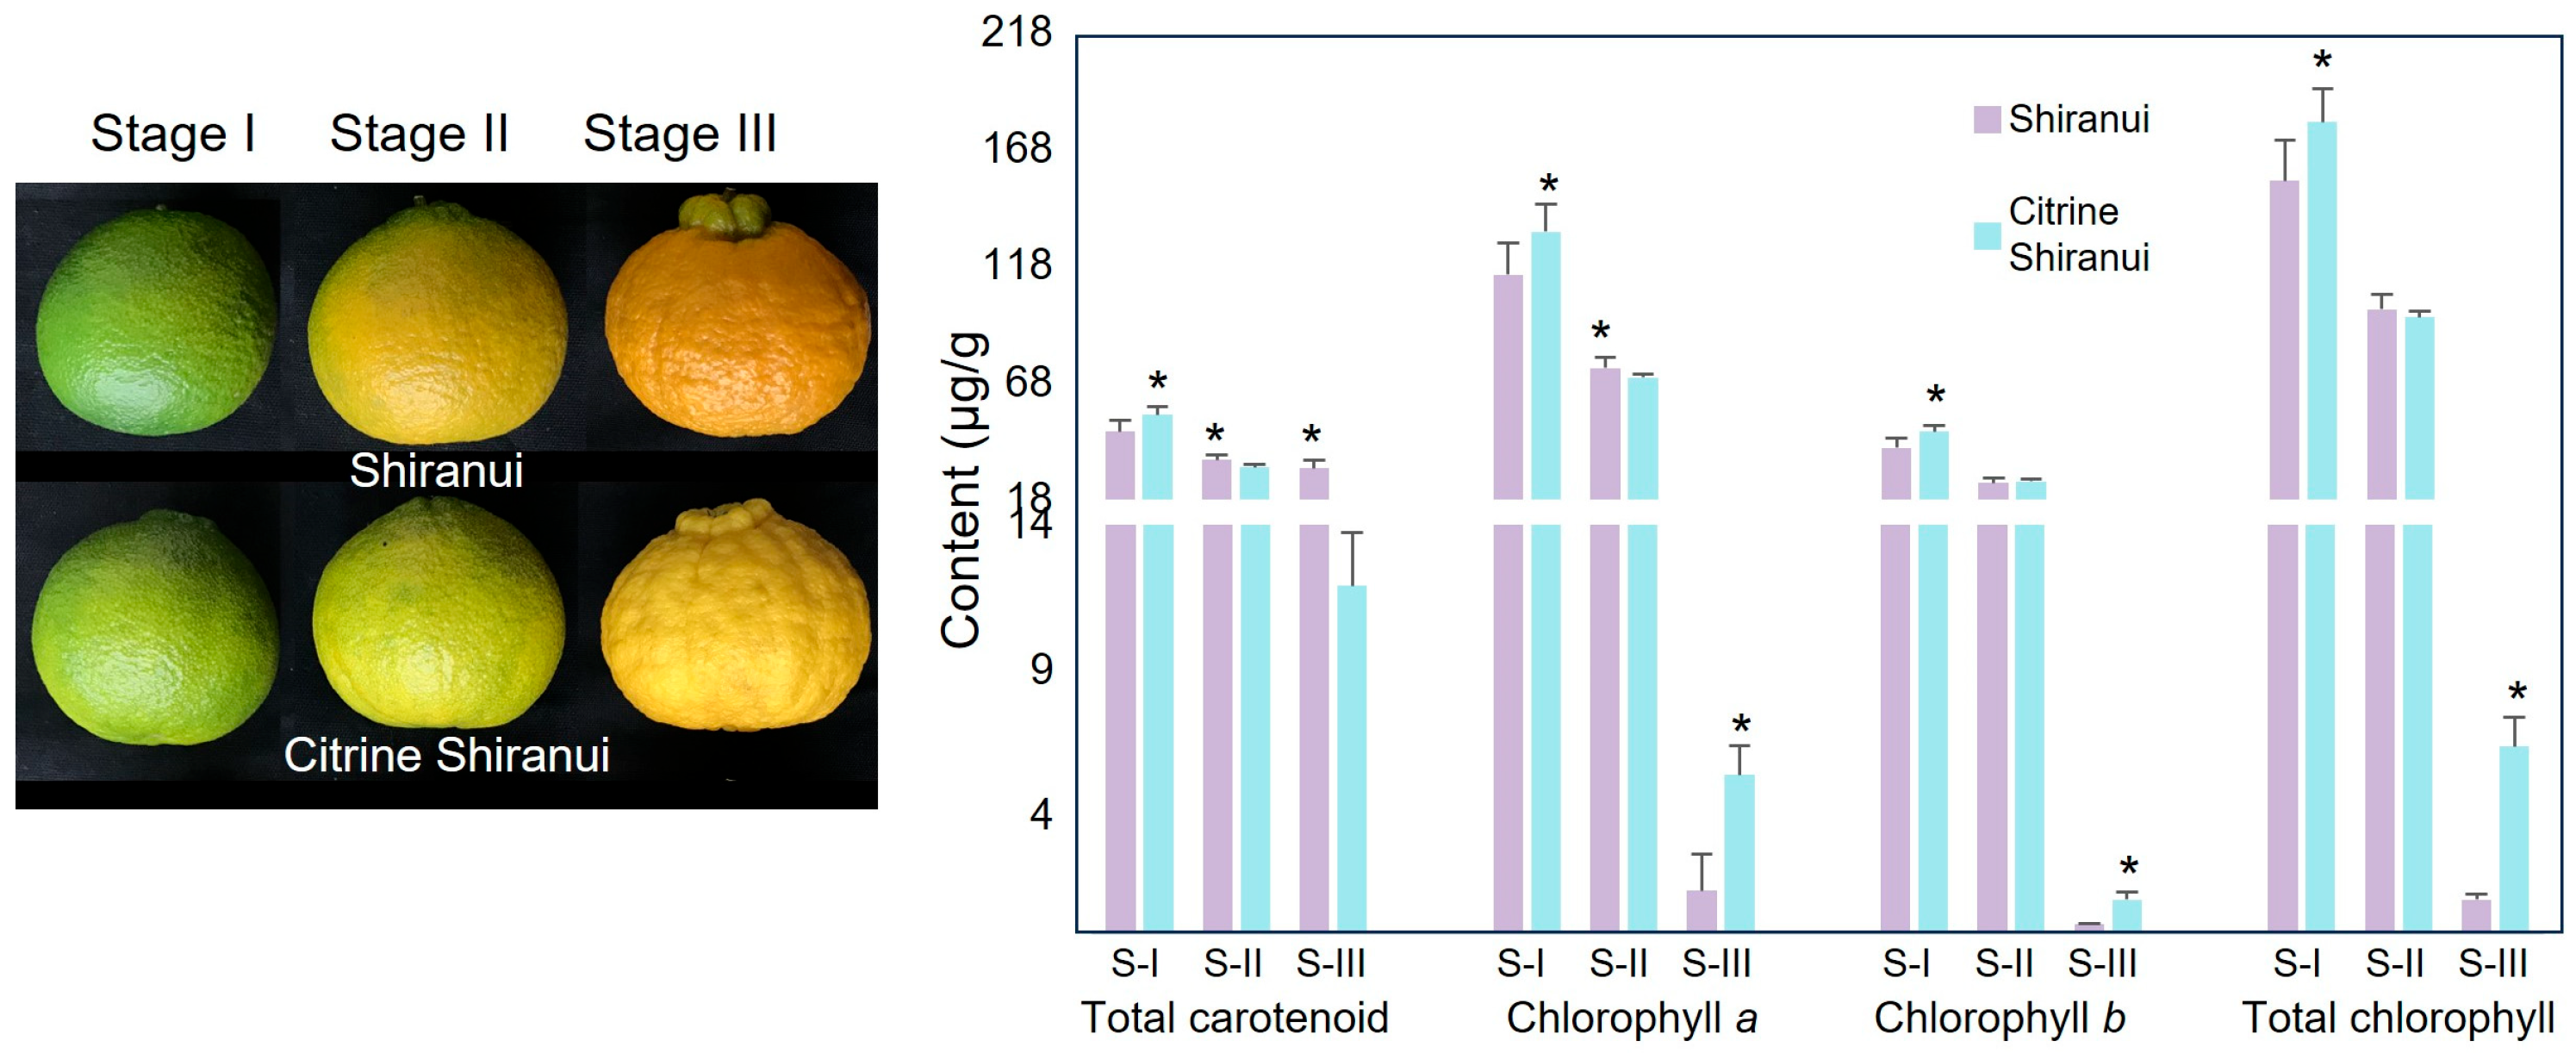
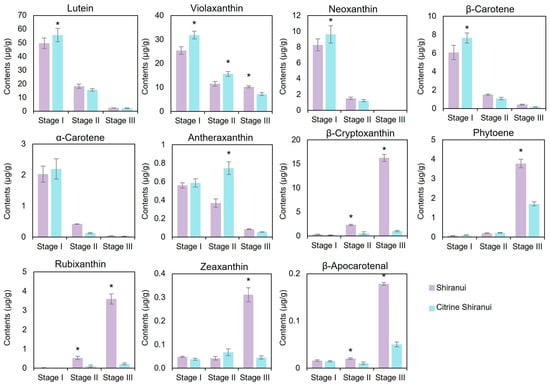
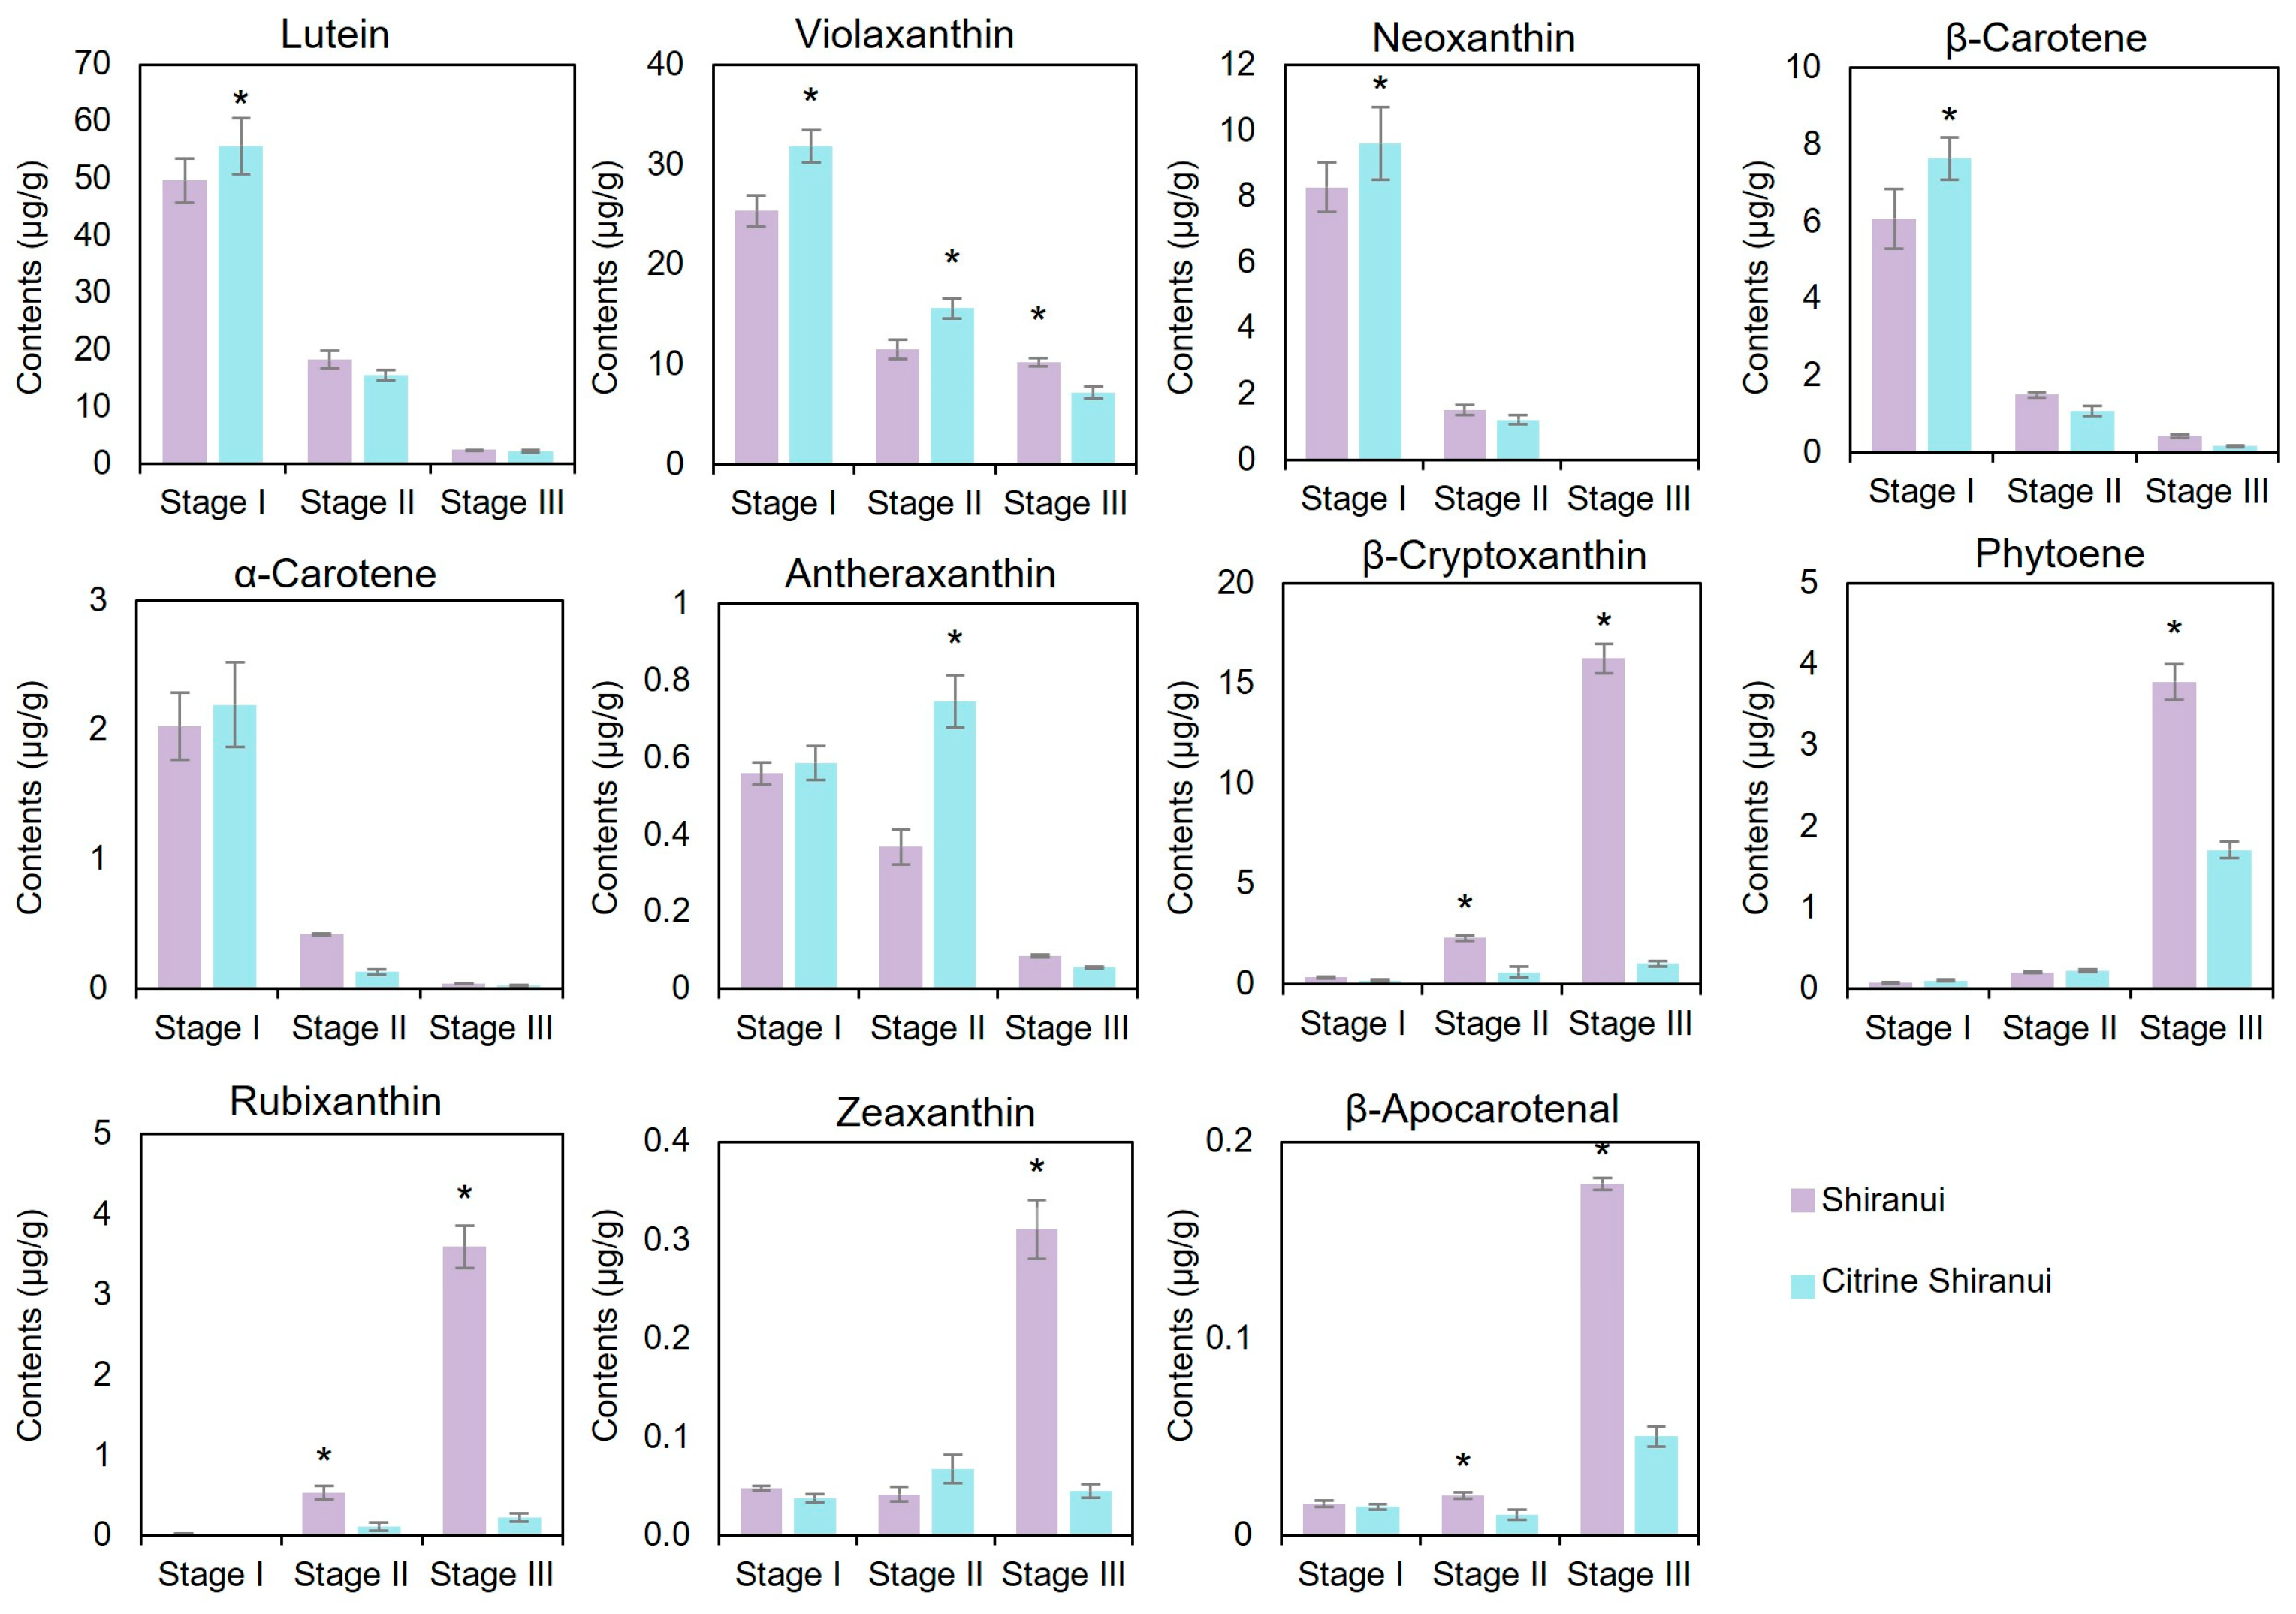
Based on 68 carotenoid standards, 38 carotenoid compounds were detected in the test samples, including esterified forms of carotenoids (Table S1). Since esterification does not modify carotenoid chromophore properties [20], compounds sharing identical carotenoid backbones were grouped, yielding 11 distinct carotenoids for analysis (Figure 2). Six carotenoids exhibited declining trends during fruit ripening in both SH and CS cultivars. Among these, lutein, violaxanthin, neoxanthin, and β-carotene showed significantly higher concentrations in CS peels compared to SH at the immature stage. By the full-colored stage, differences between cultivars became negligible for most of these six carotenoids, except for violaxanthin which maintained detectable variation. In contrast, five carotenoids (β-cryptoxanthin, phytoene, rubixanthin, zeaxanthin, and β-apocarotenal) demonstrated progressive accumulation during ripening in both cultivars. While their levels remained comparable between cultivars through early developmental stages, SH peels displayed a dramatic upsurge in these compounds at full coloration, whereas CS exhibited only modest increases. Consequently, CS peels contained significantly lower concentrations of these five carotenoids at the final ripening stage compared to SH.
Figure 2.
The contents of 11 carotenoid components in peels of Shiranui and Citrine Shiranui during ripening. Stage I, immature stage; Stage II, breaking stage; Stage III, full-colored stage. Asterisks indicate significant differences between SH and CS at the same stage (p < 0.05), as determined by the Student–Newman–Keuls (SNK) test.
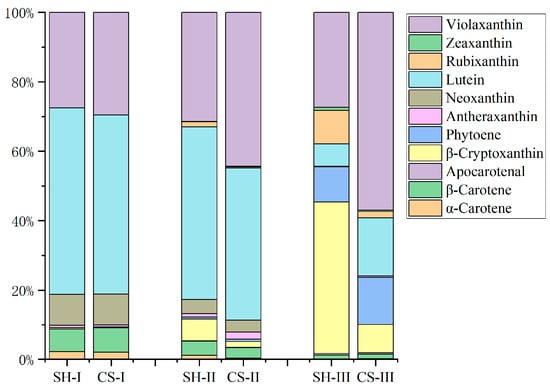
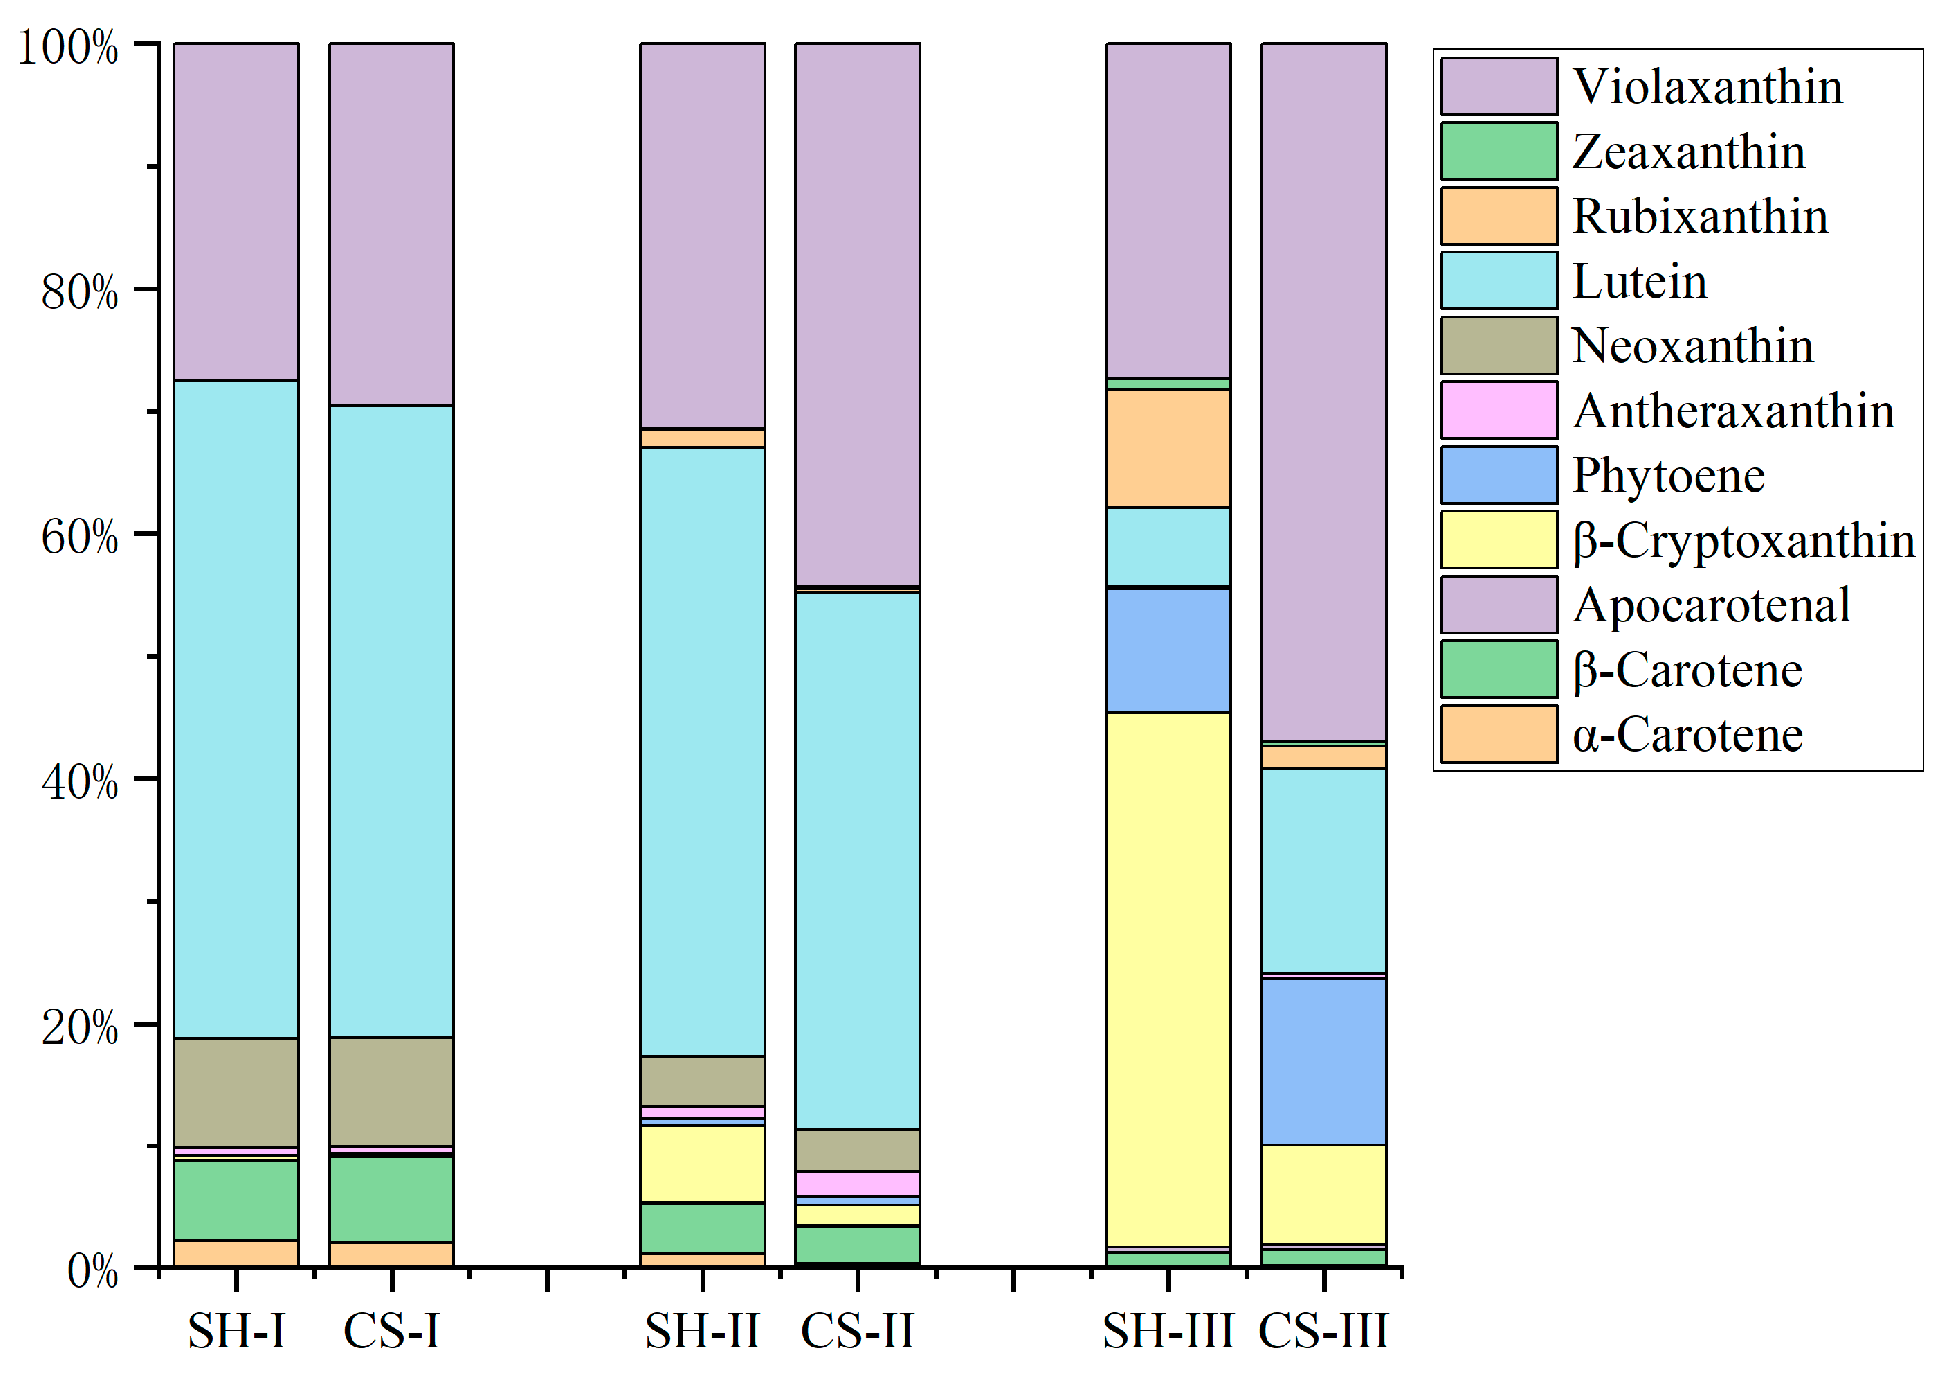
The carotenoid proportions at certain fruit developing stages were analyzed (Figure 3). At the immature stage, both citrus cultivars showed similar carotenoid profiles, with lutein representing the predominant carotenoid (53.68% in SH and 51.60% in CS). Violaxanthin constituted the second most abundant carotenoid (27.45% in SH and 29.51% in CS), followed by neoxanthin (8.96% in SH and 8.90% in CS) and β-carotene (6.57% in SH and 7.09% in CS). The breaking stage maintained carotenoid proportions similar to those observed at the immature stage. However, dramatic compositional changes occurred at the full-colored stage. In SH peels, β-cryptoxanthin became dominant (43.62%), followed by violaxanthin (27.39%), phytoene (10.15%), and rubixanthin (9.66%). In contrast, CS peels exhibited a distinct profile with violaxanthin as the major carotenoid (56.87%), followed by lutein (16.78%) and phytoene (13.57%). β-Cryptoxanthin was only 8.21% in CS.
Figure 3.
The proportions of 11 carotenoids in the peels of Shiranui and Citrine Shiranui during ripening. SH, Shiranui; CS, Citrine Shiranui; I, immature stage; II, breaking stage; III, full-colored stage.
3.3. Analysis of Key Genes Associated with Carotenoid Biosynthesis and Chlorophyll Degradation
Totally there were 31,113 genes identified, and 17,335 of them with FPKM > 1 were used for further analysis. The differentially expressed genes (DEGs) between SH and CS cultivars during fruit development indicated that, 237 (194 up and 43 down) DEGs at the immature stage (SH-I vs. CS-I), rising to 465 (120 up and 345 down) at the breaking stage (SH-II vs. CS-II), and 424 (339 up and 85 down) at the full-colored stage (SH-III vs. CS-III) (Figure S1).
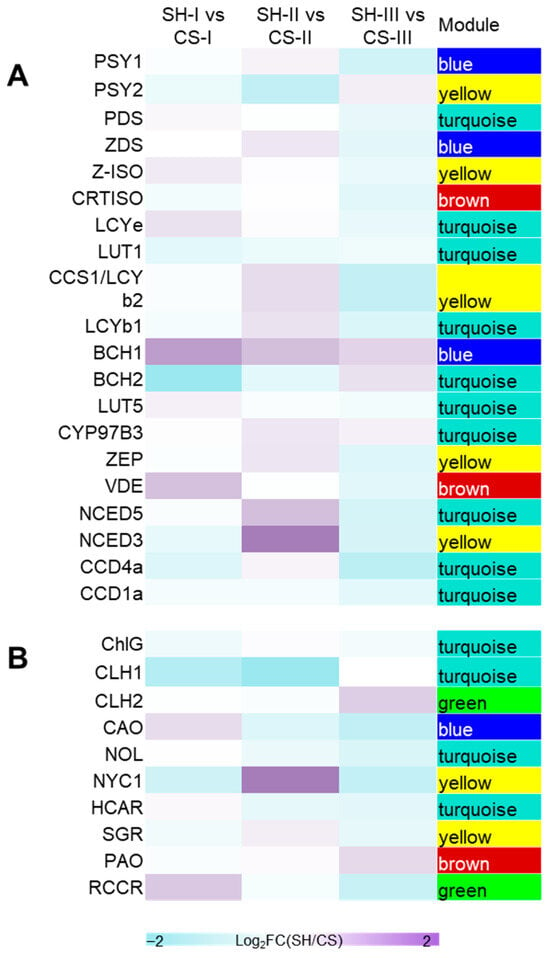
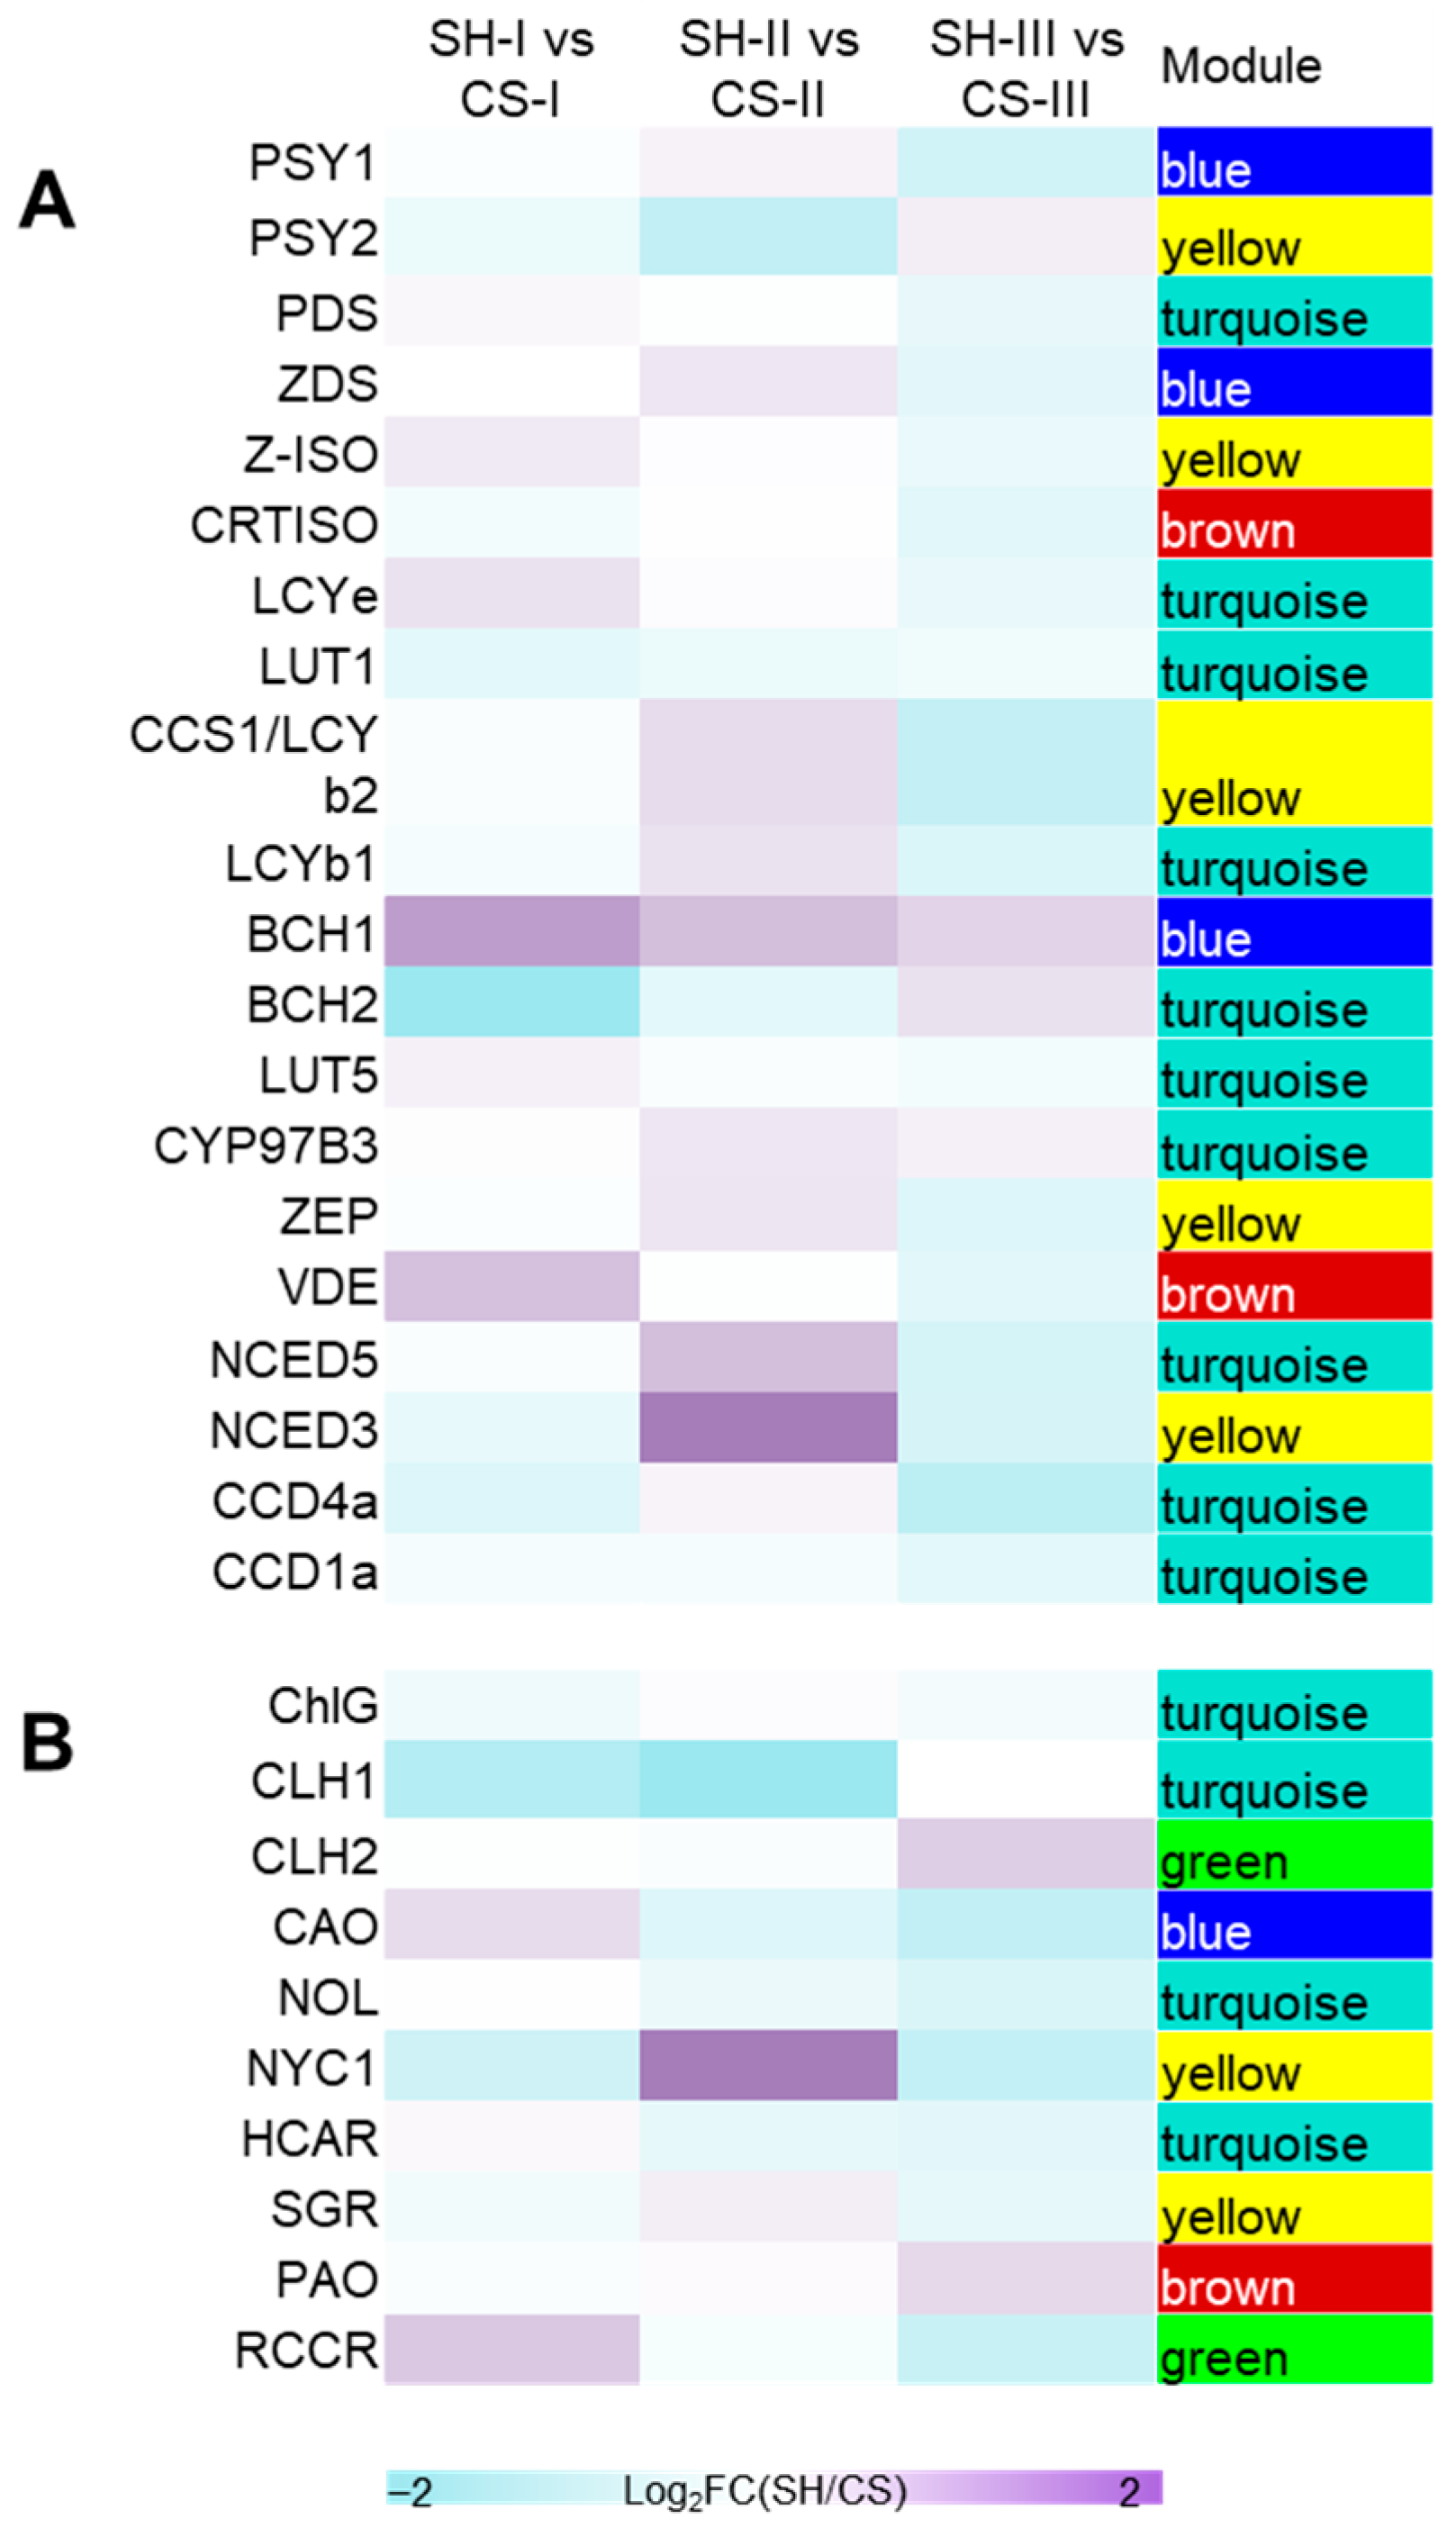
Given the focus of this study on the phenotypic differences in peel color between Shiranui and Citrine Shiranui, we directly analyzed the gene expression profiles of the metabolic pathways of two key pigments responsible for citrus peel coloration. Transcriptional profiling identified 21 genes involved in the carotenoid biosynthesis pathway (Figure 4A), with most exhibiting conserved expression patterns between cultivars. CitBCH1 (Cs9g19270) showed the highest expression level (mean FPKM = 457.59). This gene displayed consistently elevated expression in SH across all developmental stages, with a 1.53-fold increase at the immature stage. The second most highly expressed gene was CitCCD1b (Cs7g01710; mean FPKM = 116.01), followed by CitCCS1 (Citrus_sinensis_newGene_2072), annotated as lycopene β-cyclase 2 (LCYB2) [21,22], with mean FPKM = 111.23. Notably, CitNCED3 (Cs5g14370) showed significantly higher expression specifically in CS-II.
Figure 4.
FPKM heatmaps of genes involved in carotenoid biosynthesis pathway (A) and chlorophyll degradation pathway (B). The heatmaps were generated from the log2-fold change (log2FC) values (the ratio of SH FPKM to CS FPKM) calculated from three replicates of RNA. SH, Shiranui, CS, Citrine Shiranui, I, stage I (immature stage), II, stage II (breaking stage), III, stage (full-color stage).
Analysis of chlorophyll degradation revealed 10 candidate genes (Figure 4B), with CitNYC1 (Cs4g15890) being the only differentially expressed gene between cultivars. It exhibited an average expression level of 51.00 FPKM. CitNYC1 was significantly higher expression in SH compared to CS at the breaking stage (2.7-fold difference). Notably, this expression pattern reversed during subsequent development, with CitNYC1 transcript levels declining in SH while increasing in CS at the full-colored stage.
3.4. Screening of the Key Transcription Factors Involved in Carotenoid Biosynthesis and Chlorophyll Degradation
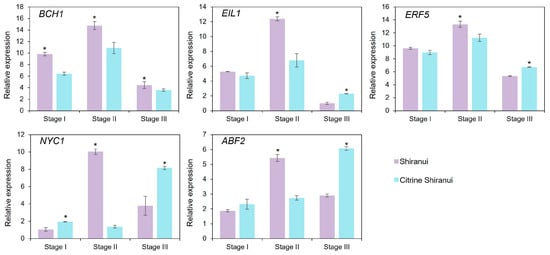
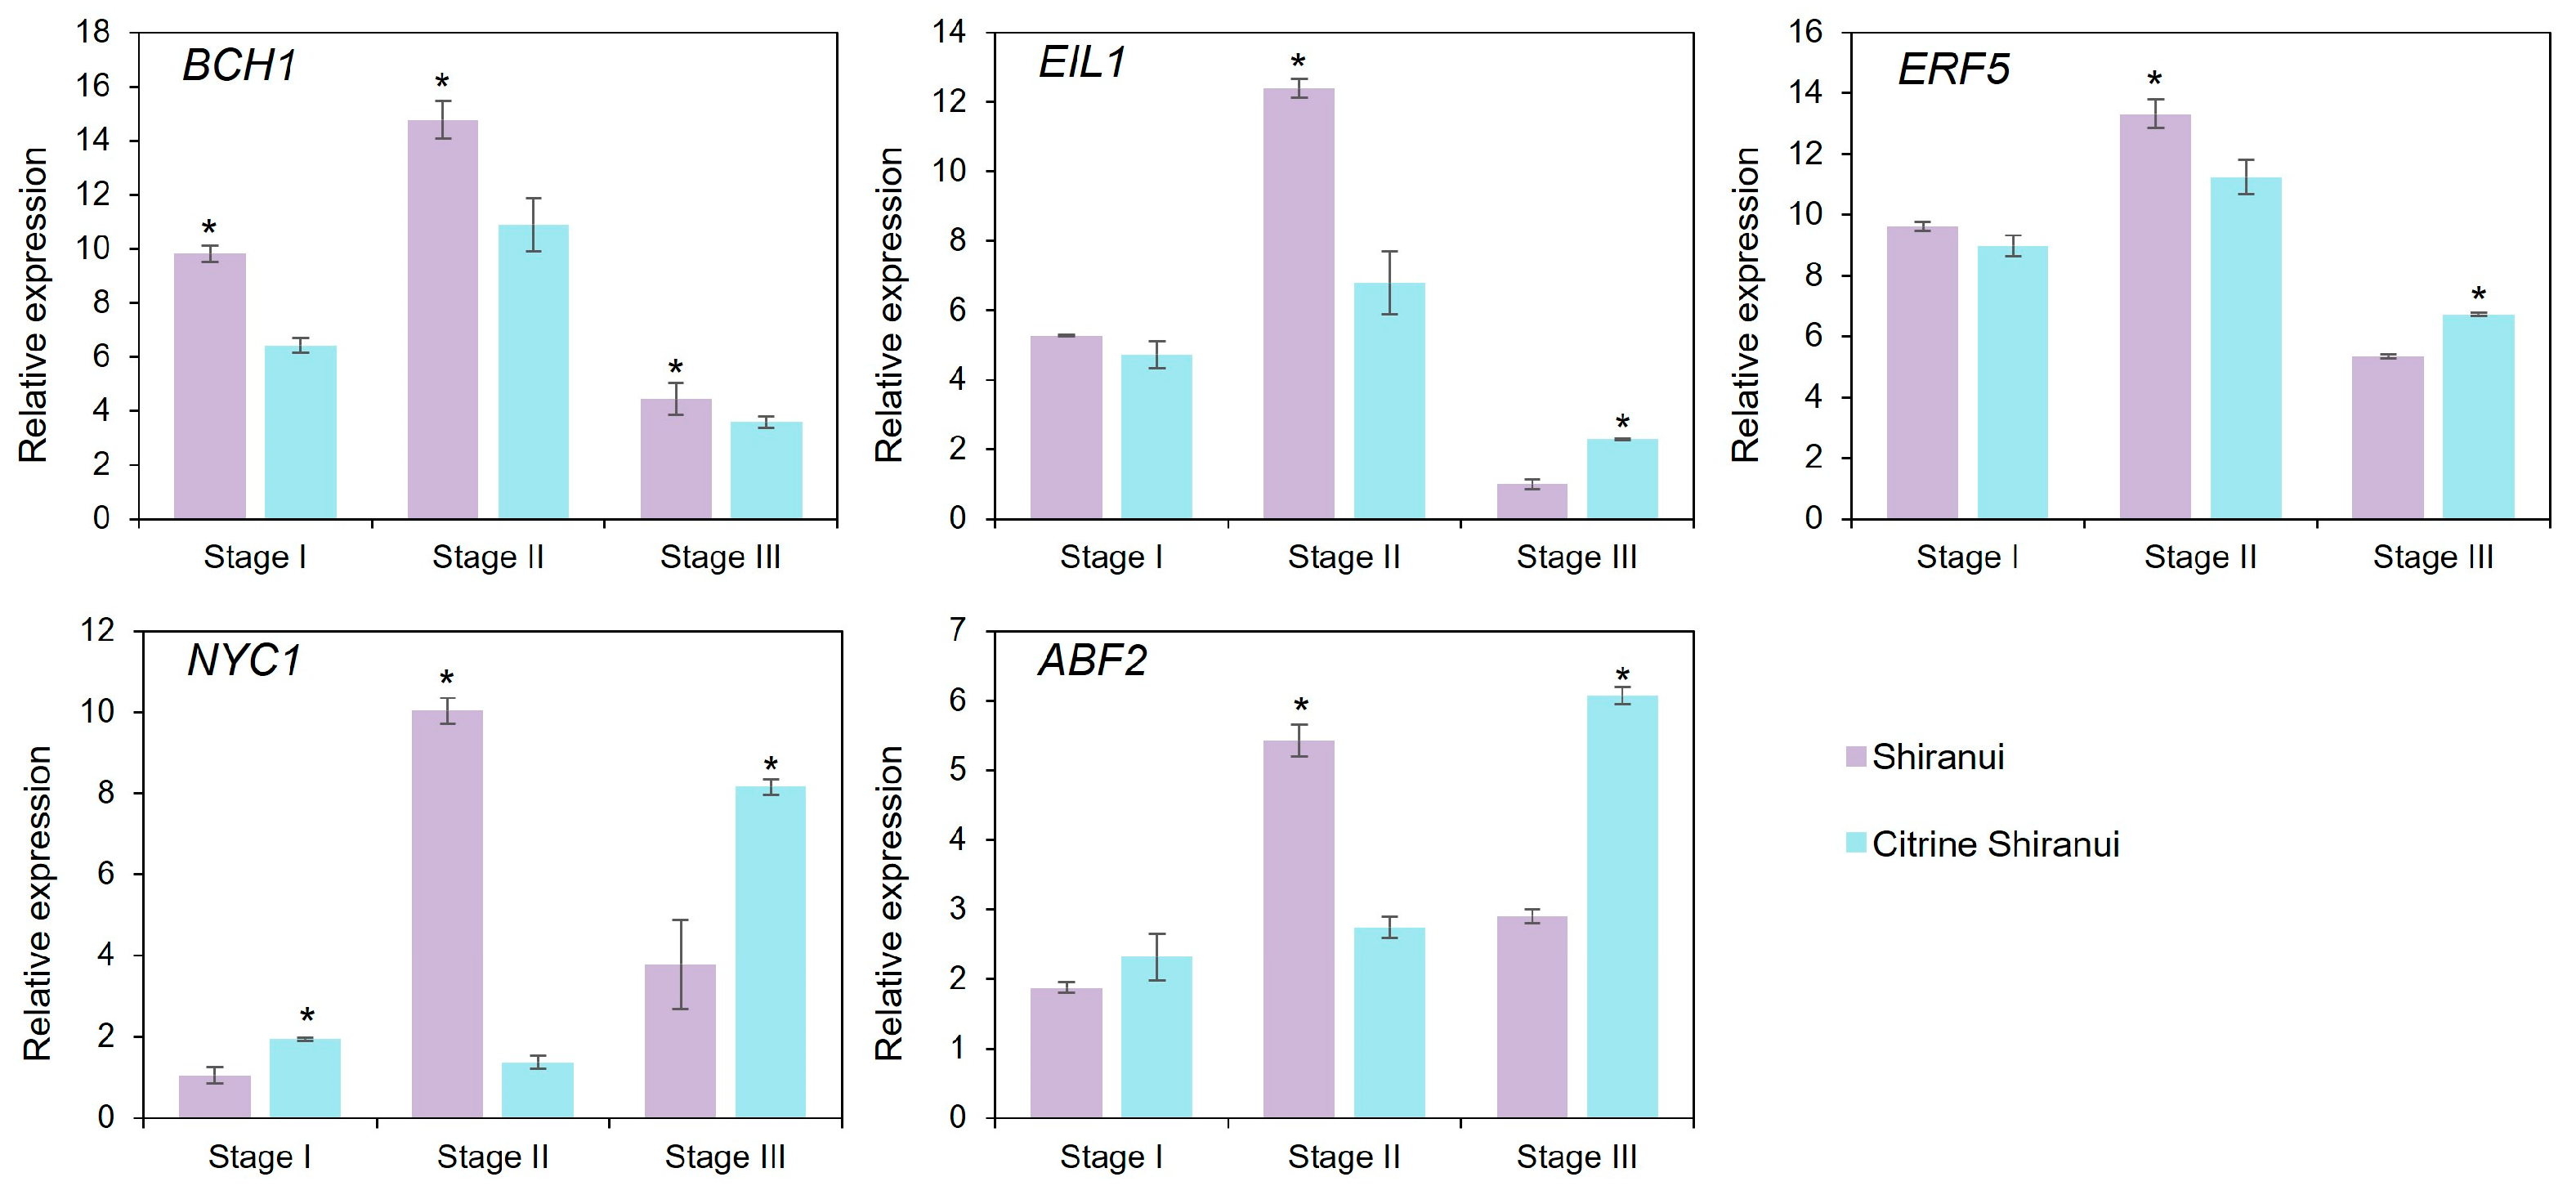
Weighted Gene Co-expression Network Analysis (WGCNA) was performed on CitBCH1 and CitNYC1 to identify co-expressed transcription factor genes. There were 13 distinct gene modules identified by WGCNA (Figure S2). CitBCH1 was assigned to the MEblue module (Figure 4). There were 35 transcription factor genes in MEblue module strongly co-expressed with CitBCH1, including 8 genes enriched in plant hormone signaling pathways (ethylene, ABA, gibberellin, auxin, and salicylic acid; Table S3). Based on expression levels and co-expression strength with CitBCH1, two ethylene signaling-related transcription factors, CitERF5 (Cs9g13620) and CitEIL1 (Cs3g06930), were screened out for subsequent validation. The qRT-PCR analysis confirmed the similar expression patterns of CitBCH1, CitERF5, and CitEIL1 (Figure 5). Meanwhile, WGCNA revealed that CitNYC1 was assigned to the MEyellow module. Analysis of the MEyellow module identified 5 transcription factors strongly co-expressed with CitNYC1, and 3 of them were associated with plant hormone signaling. Among these, CitABF2 (Cs3g23480), an ABA-responsive transcription factor, exhibited both high expression levels and strong co-expression with CitNYC1 (Table S4), with qRT-PCR results presented in Figure 5.
Figure 5.
The relative expressions of targets gene analyzed using qRT-PCR. Stage I, immature stage. Stage II, breaking stage; Stage III, full-colored stage. Asterisks indicate significant differences between SH and CS at the same stage (p < 0.05), as determined by the Student–Newman–Keuls (SNK) test.
3.5. Dual-Luciferase Reporter Assay
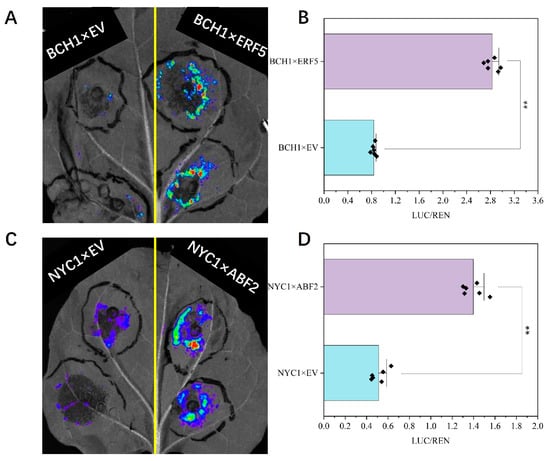
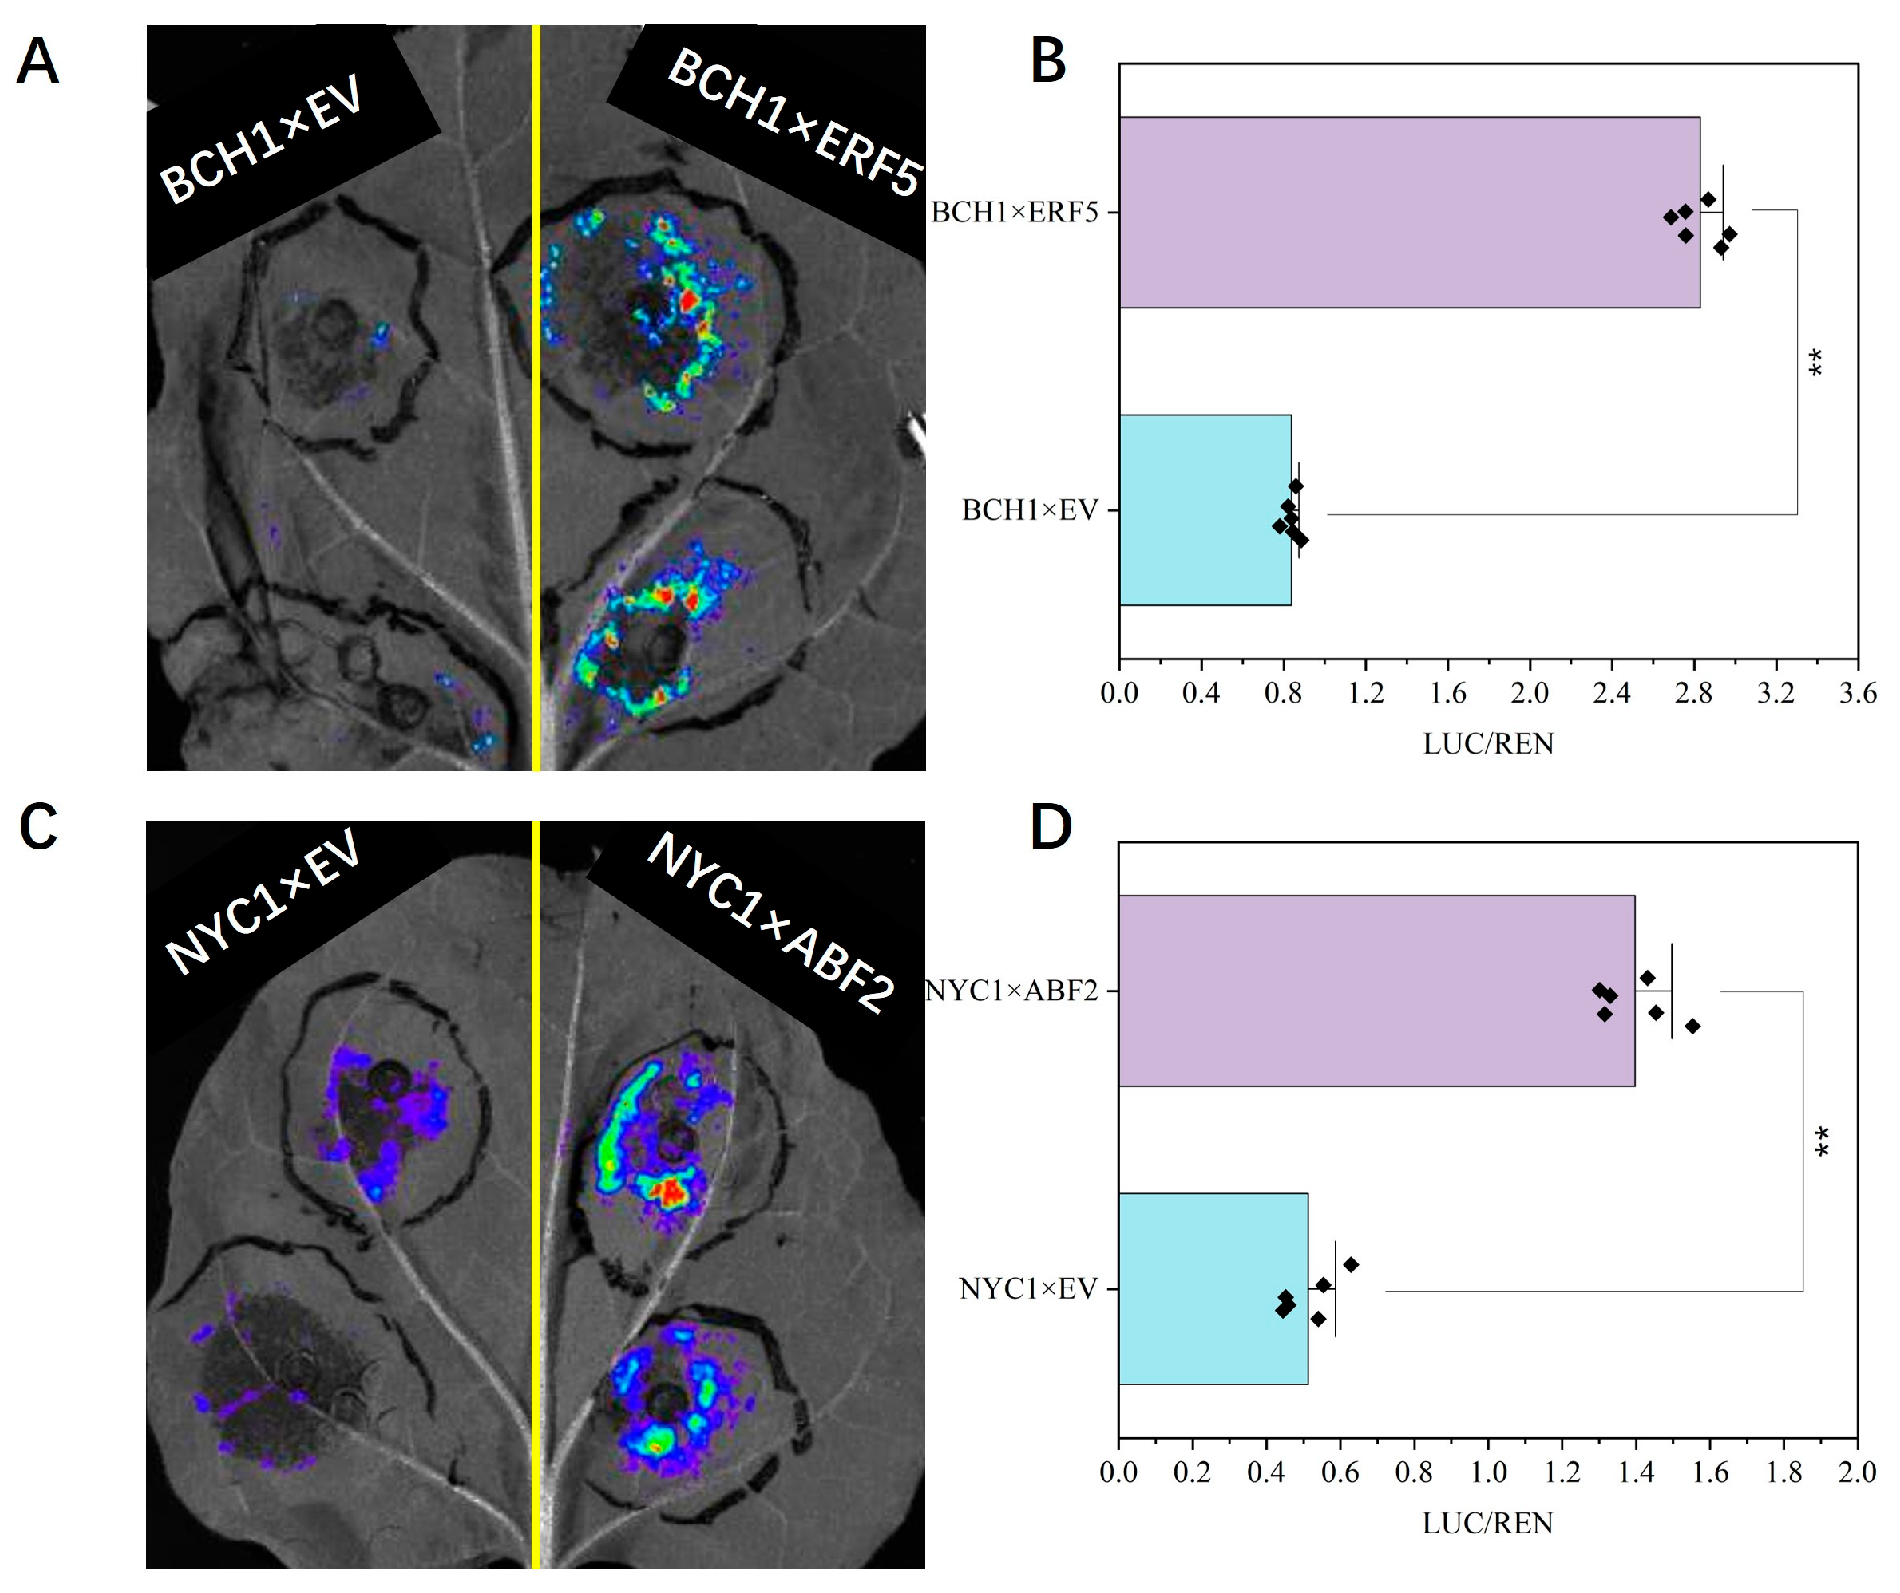
The dual-luciferase reporter assays (LUC) were employed to examine the regulatory effects of transcription factors on target genes, specifically CitEIL1 and CitERF5 on CitBCH1, and CitABF2 on CitNYC1. Luminescence analysis revealed maximal reporter activity in leaves co-transformed with pGreenII-62SK-CitERF5 and pGreenII-0800-LUC-CitBCH1pro, and pGreenII-62SK-CitABF2 and pGreenII-0800-LUC-CitNYC1pro (Figure 6). Control experiments, including co-transformation with pGreenII-62SK-CitEIL1 plus pGreenII-0800-LUC-CitBCH1pro or empty vectors, showed no detectable luminescence. Quantitative analysis demonstrated significantly higher LUC/REN ratios in leaves expressing CitERF5 + CitBCH1pro or CitABF2 + CitNYC1pro compared to empty vector controls (Figure 6).
Figure 6.
The dual-luciferase reporter assay of CitBCH1 × CitERF5 (A,C) and CitNYC1 × CitABF2 (B,D). BCH1 × EV: co-infected with pGreenII-0800-Luc-CitBCH1 pro and pGreenII-62SK (empty), two replicants. BCH1 × ERF5: co-infected with pGreenII-0800-Luc-CitBCH1 pro and pGreenII-62SK-CitERF5, two replicants. NYC1 × EV: co-infected with pGreenII-0800-Luc-CitNYC1 pro and pGreenII-62SK (empty), two replicants. NYC1 × ABF2: co-infected with pGreenII-0800-Luc-CitNYC1 pro and pGreenII-62SK-CitABF2, two replicants. ** represents significant difference (p < 0.01).
4. Discussion
In citrus fruits, chlorophylls serve as the dominant pigments in unripe fruit, whereas carotenoids accumulate predominantly following the degreening phase [23]. In the fruits with yellow (as opposed to orange or red) coloration, reduced accumulation of total carotenoids is one of the key contributing factors. This is observed, for example, in the yellowish-orange peel of Navel orange (C. sinensis) compared to the red-pigmented peel of Cara Cara [21], and in the yellow fruit of the sweet orange Pinalate (C. sinensis) relative to the bright orange fruit of Navelate [7]. Similarly, the yellow flavedo of lemon (C. limon) exhibits lower total carotenoid content compared to the orange flavedo of Satsuma mandarin and Valencia sweet orange [1]. In the present research, the total carotenoid content also showed high accumulation in Shiranui peels. Concurrently, we found that chlorophyll content in Citrine Shiranui was significantly higher than in Shiranui. From the perspective of the color spectrum, the wavelength of green light (495–570 nm) is close to that of yellow (570–590 nm) but distant from orange (590–620 nm) [24]. Therefore, the green color contributed by residual chlorophylls in Citrine Shiranui may overlap with the pigmentary effects of carotenoids, resulting in peels that appear more yellowish. Similar phenomena have been reported in previous studies. For instance, in the C. clementina mutant (No. 39E7), impaired chloroplast degradation led to chlorophyll retention, resulting in an atypical yellowish external appearance at full ripening [25].
In mandarin varieties such as Satsuma mandarin (C. reticulata), which has orange-red skin, β-cryptoxanthin accumulates predominantly in both the peels and juice sacs of mature fruit [8,26]. Similarly, β-cryptoxanthin has been identified as a major pigment in the dull orange to dark yellow peels of C. sinensis cv. Hamlin [5]. In the present study, we also found β-cryptoxanthin to be the most abundant carotenoid in mature C. reticulata Shiranui fruit peels (Figure 3). In contrast, violaxanthin was the predominant carotenoid in Citrine Shiranui peels, followed by lutein (16.78%), which accounted for only 6.39% in Shiranui peels. Lutein is known to contribute to bright yellow coloration in fruits, particularly in immature stages, and in green leafy vegetables [27]. Therefore, we propose that lutein also contributes to the distinct citrine/yellow color of Citrine Shiranui peels. Overall, the carotenoid profile in the yellow peels of Citrine Shiranui appears to differ from those reported in other yellow-peeled citrus varieties. For instance, in the yellow-peeled mutant C. sinensis cv. Pinalate, the accumulation of phytoene, phytofluene, and ζ-carotene are considered the primary cause of the color [7]. Similarly, phytoene is mainly responsible for the yellow color of Lisbon lemon (C. limon) peels [8].
Analysis of carotenoid dynamics during peel coloration revealed that, in the peels of both SH and CS, six carotenoids (including lutein) exhibited consistent decline throughout the process, while five carotenoids (including β-cryptoxanthin) demonstrated progressive accumulation. Notably, the six decreasing carotenoids maintained comparable levels in both citrus varieties, whereas the five increasing carotenoids were significantly diminished in fully colored CS peels. This observation suggests that CS likely harbors genetic mutations that specifically disrupt the biosynthesis of the five accumulating carotenoids, rather than impairing the degradation of the six declining carotenoids. Given the predominance of β-cryptoxanthin among the five upregulated carotenoids, we hypothesized that the marked deficiency in β-cryptoxanthin synthesis represented the principal determinant underlying the distinctive yellow pigmentation of CS peels.
The present study identified 21 genes enriched in the carotenoid biosynthesis pathway, with most exhibiting peak expression at the breaking stage (stage II) in both citrus cultivars (Figure 4), such as CitBCH1, CitCCD1b, CitCCS1, CitPSY1, CitZDS, CitZEP, and Citζ-ISO. Interestingly, carotenoid levels reached their maximum or minimum concentrations only at the full-colored stage (stage III) (Figure 4), a temporal discrepancy that likely reflects the well-documented phenomenon of phenotype delay [28]. Among these genes, BCH1 encodes a carotenoid hydroxylase with dual catalytic functions. It hydroxylates β-carotene to generate β-cryptoxanthin and further converts β-cryptoxanthin into zeaxanthin [9]. Previous studies have established a strong correlation between BCH1 expression and total carotenoid accumulation [29,30,31]. Consistent with these findings, CitBCH1 exhibited high transcript abundance in both cultivars, with consistently elevated expression in SH compared to CS across all developmental stages (Figure 4). This differential expression pattern likely underlied the significantly higher β-cryptoxanthin and zeaxanthin levels observed in fully pigmented SH peels (Figure 2).
Our findings established CitBCH1 as key genetic determinants underlying the differential peel coloration in SH and CS. Through LUC reporter assays, we demonstrated that CitBCH1 is directly activated by the ethylene-responsive transcription factor CitERF5. As a member of the ethylene-related ERF transcription factor subfamily [32], CitERF5 mediates diverse physiological processes, including stress responses [32,33,34,35,36] and anthocyanin biosynthesis [37]. Our study reveals its novel role in activating CitBCH1 to enhance carotenoid production. Considering ethylene as a citrus ripening regulator [38], CitERF5-mediated carotenoid biosynthesis likely represents a component of ethylene-triggered ripening.
Chlb reductase NYC1 catalyzes the first step of Chlb degradation [39]. The nyc1 mutant in rice (Oryza sativa L.) leaves displayed the ‘‘stay-green’’ phenotype [39]. In the current study, CitNYC1 expression in SH surged prominently at the breaking stage (stage II), whereas in CS, its transcriptional upregulation was delayed until the full-colored stage (stage III) (Figure 4). This temporal divergence suggests that chlorophyll degradation initiates earlier in SH, resulting in comparatively higher chlorophyll retention in CS peels at full maturity, a finding corroborated by pigment quantification (Figure 1). In addition, we confirmed that CitNYC1 was activated by CitABF2, a central regulator of ABA signaling [40] and a hub gene in sweet orange ripening [41]. This activation likely represents distinct ABA-dependent ripening mechanisms in SH and CS.
5. Conclusions
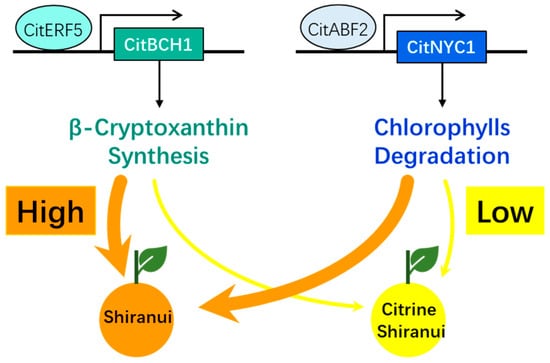
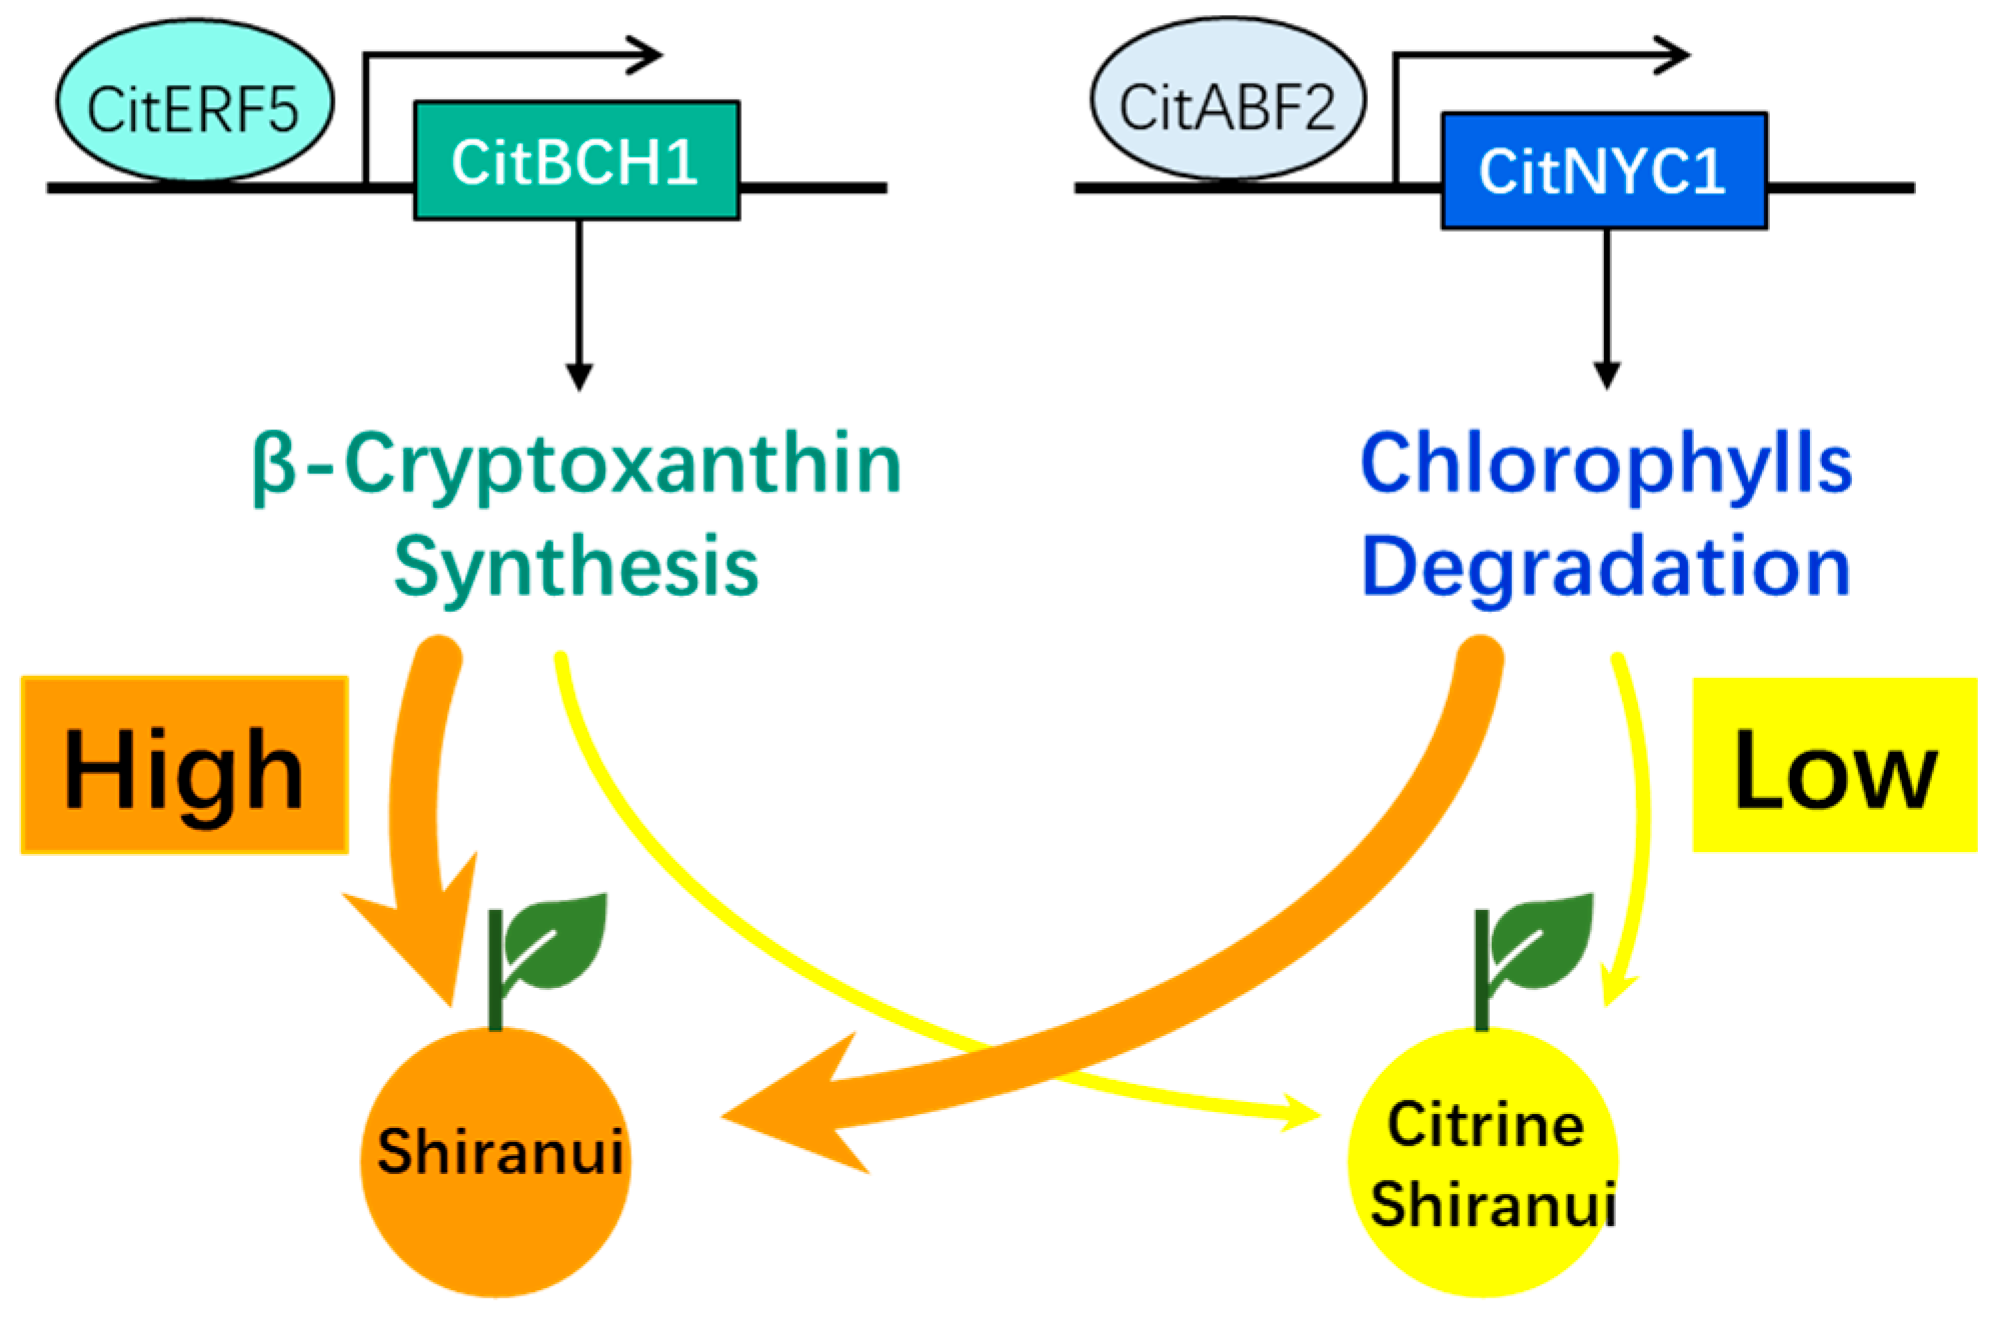
In this study, LC-MS/MS-based carotenoid profiling combined with RNA-sequencing-based gene expression data was used to comprehensively reveal the molecular regulatory mechanism underlying the color divergence in the peels of Shiranui and its bud mutant, Citrine Shiranui. Among the 11 identified carotenoid compounds, the accumulation levels of five increased (including β-cryptoxanthin) sharply during fruit ripening in Shiranui but only slightly in Citrine Shiranui. In the fully colored peels of Shiranui, β-cryptoxanthin was the predominant carotenoid (43.62%), whereas in Citrine Shiranui, it accounted for only 8.21%. The deficiency of β-cryptoxanthin was likely the primary factor contributing to the citrine color of Citrine Shiranui peels. CitBCH1, a key gene responsible for carotenoid biosynthesis, exhibited significantly higher transcript levels than other genes and was consistently more highly expressed in Shiranui than in Citrine Shiranui across all three developmental stages. This differential expression might be the main reason for the reduced accumulation of β-cryptoxanthin in Citrine Shiranui. Additionally, residual chlorophylls resulting from the higher expression of CitNYC1 in Citrine Shiranui might also contribute modestly to the yellow appearance of the peel. Furthermore, we propose that CitBCH1 and CitNYC1 might be involved in ethylene- and ABA-signaling pathways related to fruit ripening through the transcription factors CitERF5 and CitABF2, respectively (Figure 7).
Figure 7.
Model draft indicating that CitBCH1 and CitNYC1 regulated by ethylene and ABA signals are the critical genes determined the different colors in the peels of Shiranui and Citrine Shiranui.
Supplementary Materials
The following supporting information can be downloaded at: https://www.mdpi.com/article/10.3390/horticulturae11111333/s1, Figure S1: The number of the differentially expressed genes (DEGs) between SH and CS cultivars during fruit development; Figure S2: Cluster dendrogram and gene numbers in modules; Table S1: Carotenoid compounds detection by LC-MS/MS; Table S2: Primers used in the present study; Table S3: The transcription factor genes collected with CitBCH1; Table S4: The transcription factor genes collected with CitNCY1.
Author Contributions
X.W.: Conceptualization, Writing—review and editing. Y.W.: Writing—original draft, Investigation. W.H.: Investigation. D.C.: Software. P.G.: Data curation. M.Z.: Methodology. B.X.: Resources. L.L.: Resources. G.S.: Project administration. S.H.: Project administration. Z.W.: Conceptualization, Funding acquisition, Supervision. All authors have read and agreed to the published version of the manuscript.
Funding
The Ministry of Science and Technology of the People’s Republic of China (Grant No. 2021YFD1600802-02). Sichuan Provincial Science and Technology Plan Project, China (Grant No. 2024NSFSC0395).
Data Availability Statement
The original contributions presented in this study are included in the article/Supplementary Material. Further inquiries can be directed to the corresponding author.
Conflicts of Interest
The authors declare that they have no known competing financial interests or personal relationships that could have appeared to influence the work reported in this paper.
References
- Kato, M.; Ikoma, Y.; Matsumoto, H.; Sugiura, M.; Hyodo, H.; Yano, M. Accumulation of carotenoids and expression of carotenoid biosynthetic genes during maturation in citrus fruit. Plant Physiol. 2004, 134, 824–837. [Google Scholar] [CrossRef] [Scilit] [PubMed]
- Matsumoto, H.; Ikoma, Y.; Kato, M.; Kuniga, T.; Nakajima, N.; Yoshida, T. Quantification of carotenoids in citrus fruit by LC-MS and comparison of patterns of seasonal changes for carotenoids among citrus varieties. J. Agric. Food Chem. 2007, 55, 2356–2368. [Google Scholar] [CrossRef] [Scilit] [PubMed]
- Chen, C. Pigments in Citrus Fruit: Mutants, Compounds, Genes, and Beyond. In The Citrus Genome; Gentile, A., La Malfa, S., Deng, Z., Eds.; Compendium of Plant Genomes; Springer: Cham, Switzerland, 2020; pp. 196–209. [Google Scholar] [CrossRef] [Scilit]
- Xu, C.J.; Fraser, P.D.; Wang, W.J.; Bramley, P.M. Differences in the carotenoid content of ordinary citrus and lycopene-accumulating mutants. J. Agric. Food Chem. 2006, 54, 5474–5481. [Google Scholar] [CrossRef] [Scilit]
- Lee, H.S.; Castle, W.S. Seasonal changes of carotenoid pigments and color in Hamlin, Earlygold, and budd blood orange juices. J. Agric. Food Chem. 2001, 49, 877–882. [Google Scholar] [CrossRef] [Scilit]
- Oberholster, R.; Cowan, A.K.; Molnár, P.; Tóth, G. Biochemical basis of color as an aesthetic quality in Citrus sinensis. J. Agric. Food Chem. 2001, 49, 303–307. [Google Scholar] [CrossRef] [Scilit]
- Rodrigo, M.J.; Marcos, J.F.; Alférez, F.; Mallent, M.D.; Zacarías, L. Characterization of pinalate, a novel Citrus sinensis mutant with a fruit-specific alteration that results in yellow pigmentation and decreased ABA content. J. Exp. Bot. 2003, 54, 727–738. [Google Scholar] [CrossRef] [Scilit]
- Kato, M. Mechanism of carotenoid accumulation in citrus fruit. J. Jpn. Soc. Hortic. Sci. 2012, 81, 219–233. [Google Scholar] [CrossRef] [Scilit]
- Ruiz-Sola, M.Á.; Rodríguez-Concepción, M. Carotenoid biosynthesis in Arabidopsis: A colorful pathway. Arab. Book 2012, 10, e0158. [Google Scholar] [CrossRef] [Scilit]
- Kim, J.; Smith, J.J.; Tian, L.; Dellapenna, D. The evolution and function of carotenoid hydroxylases in Arabidopsis. Plant Cell Physiol. 2009, 50, 463–479. [Google Scholar] [CrossRef] [Scilit]
- Zhang, Y.Z.; Jin, J.J.; Zhu, S.C.; Sun, Q.; Zhang, Y.; Xie, Z.Z.; Ye, Y.; Deng, X.X. Citrus β-carotene hydroxylase 2 (BCH2) participates in xanthophyll synthesis by catalyzing the hydroxylation of β-carotene and compensates for BCH1 in citrus carotenoid metabolism. Hortic. Res. 2023, 10, uhac290. [Google Scholar] [CrossRef] [Scilit]
- Sakuraba, Y.; Schelbert, S.; Park, S.Y.; Han, S.H.; Lee, B.D.; Andrès, C.B.; Kessler, F.; Hörtensteiner, S.; Paek, N.C. STAY-GREEN and chlorophyll catabolic enzymes interact at light-harvesting complex II for chlorophyll detoxification during leaf senescence in Arabidopsis. Plant Cell 2012, 24, 507–518. [Google Scholar] [CrossRef] [Scilit]
- Shimoda, Y.; Ito, H.; Tanaka, A. Arabidopsis STAY-GREEN, mendel’s green cotyledon gene, encodes magnesium-dechelatase. Plant Cell 2016, 28, 2147–2160. [Google Scholar] [CrossRef] [Scilit]
- Gao, Y.; Fan, Z.Q.; Zhang, Q.; Li, H.L.; Liu, G.S.; Jing, Y.; Zhang, Y.P.; Zhu, B.Z.; Zhu, H.L.; Chen, J.Y.; et al. A tomato NAC transcription factor, SlNAM1, positively regulates ethylene biosynthesis and the onset of tomato fruit ripening. Plant J. 2021, 108, 1317–1331. [Google Scholar] [CrossRef] [Scilit]
- Zhu, K.; Sun, Q.; Chen, H.; Mei, X.; Lu, S.; Ye, J.; Chai, L.; Xu, Q.; Deng, X. Ethylene activation of carotenoid biosynthesis by a novel transcription factor CsERF061. J. Exp. Bot. 2021, 72, 3137–3154. [Google Scholar] [CrossRef] [Scilit]
- Qiu, K.; Li, Z.; Yang, Z.; Chen, J.; Wu, S.; Zhu, X.; Gao, S.; Gao, J.; Ren, G.; Kuai, B.; et al. EIN3 and ORE1 accelerate degreening during ethylene-mediated leaf senescence by directly activating chlorophyll catabolic genes in Arabidopsis. PLoS Genet. 2015, 11, e1005399. [Google Scholar] [CrossRef] [Scilit]
- Sakuraba, Y.; Jeong, J.; Kang, M.Y.; Kim, J.; Paek, N.C.; Choi, G. Phytochrome-interacting transcription factors PIF4 and PIF5 induce leaf senescence in Arabidopsis. Nat. Commun. 2014, 5, 4636. [Google Scholar] [CrossRef] [Scilit] [PubMed]
- Gao, S.; Gao, J.; Zhu, X.; Song, Y.; Li, Z.; Ren, G.; Zhou, X.; Kuai, B. ABF2, ABF3, and ABF4 promote ABA-mediated chlorophyll degradation and leaf senescence by transcriptional activation of chlorophyll catabolic genes and senescence-associated genes in Arabidopsis. Mol. Plant 2016, 9, 1272–1285. [Google Scholar] [CrossRef] [Scilit] [PubMed]
- Langfelder, P.; Horvath, S. WGCNA: An R package for weighted correlation network analysis. BMC Bioinform. 2008, 9, 559. [Google Scholar] [CrossRef] [Scilit]
- Pérez-Gálvez, A.; Mínguez-Mosquera, M.I. Esterification of xanthophylls and its effect on chemical behavior and bioavailability of carotenoids in the human. Nutr. Res. 2005, 25, 631–640. [Google Scholar] [CrossRef] [Scilit]
- Alquézar, B.; Zacarías, L.; Rodrigo, M.J.; Alférez, F. Molecular and functional characterization of a novel chromoplast-specific lycopene beta-cyclase from Citrus and its relation to lycopene accumulation. J. Exp. Bot. 2009, 60, 1783–1797. [Google Scholar] [CrossRef] [Scilit] [PubMed]
- Wei, X.; Chen, C.; Yu, Q.; Gady, A.; Yu, Y.; Liang, J.; Gmitter, F.G., Jr. Novel expression patterns of carotenoid pathway-related genes in citrus leaves and maturing fruits. Tree Genet. Genom. 2014, 10, 439–448. [Google Scholar] [CrossRef] [Scilit]
- Lu, Y.; Shen, X.; Li, Y.; Xu, Y.; Chen, Y.; Chen, Y.; Hu, X.; Li, X.; Sun, X.; Gong, J. Regulation of chlorophyll and carotenoid metabolism in citrus fruit. Hortic. Plant J. 2025, 11, 951–962. [Google Scholar] [CrossRef] [Scilit]
- Helmenstine, A.M. The Visible Spectrum: Wavelengths and Colors. ThoughtCo. 2024. Available online: https://www.thoughtco.com/understand-the-visible-spectrum-608329 (accessed on 29 October 2025).
- Ríos, G.; Naranjo, M.A.; Rodrigo, M.-J.; Alós, E.; Zacarías, L.; Cercós, M.; Talón, M. Identification of a GCC transcription factor responding to fruit colour change events in citrus through the transcriptomic analyses of two mutants. BMC Plant Biol. 2010, 10, 276. [Google Scholar] [CrossRef] [Scilit]
- Goodner, K.L.; Rouseff, R.L.; Hofsommer, H.J. Orange, mandarin, and hybrid classification using multivariate statistics based on carotenoid profiles. J. Agric. Food Chem. 2001, 49, 1146–1150. [Google Scholar] [CrossRef] [Scilit] [PubMed]
- Khoo, H.E.; Prasad, K.N.; Kong, K.W.; Jiang, Y.; Ismail, A. Carotenoids and their isomers: Color pigments in fruits and vegetables. Molecules 2011, 16, 1710–1738. [Google Scholar] [CrossRef] [Scilit]
- Buccitelli, C.; Selbach, M. mRNAs, proteins and the emerging principles of gene expression control. Nat. Rev. Genet. 2020, 21, 630–644. [Google Scholar] [CrossRef] [Scilit]
- Yamamizo, C.; Kishimoto, S.; Ohmiya, A. Carotenoid composition and carotenogenic gene expression during Ipomoea petal development. J. Exp. Bot. 2010, 61, 709–719. [Google Scholar] [CrossRef] [Scilit] [PubMed]
- Yan, J.; Kandianis, C.B.; Harjes, C.E.; Bai, L.; Kim, E.H.; Yang, X.; Skinner, D.J.; Fu, Z.; Mitchell, S.; Li, Q.; et al. Rare genetic variation at Zea mays crtRB1 increases beta-carotene in maize grain. Nat. Genet. 2010, 42, 322–327. [Google Scholar] [CrossRef] [Scilit] [PubMed]
- Zhou, X.; McQuinn, R.; Fei, Z.; Wolters, A.M.; Van Eck, J.; Brown, C.; Giovannoni, J.J.; Li, L. Regulatory control of high levels of carotenoid accumulation in potato tubers. Plant Cell Environ. 2011, 34, 1020–1030. [Google Scholar] [CrossRef] [Scilit]
- Sakuma, Y.; Liu, Q.; Dubouzet, J.G.; Abe, H.; Shinozaki, K.; Yamaguchi-Shinozaki, K. DNA-binding specificity of the ERF/AP2 domain of Arabidopsis DREBs, transcription factors involved in dehydration- and cold-inducible gene expression. Biochem. Biophys. Res. Commun. 2002, 290, 998–1009. [Google Scholar] [CrossRef] [Scilit]
- Yang, X.; Chen, L.; Yang, Y.; Guo, X.; Chen, G.; Xiong, X.; Dong, D.; Li, G. Transcriptome analysis reveals that exogenous ethylene activates immune and defense responses in a high late blight resistant potato genotype. Sci. Rep. 2020, 10, 21294. [Google Scholar] [CrossRef] [Scilit] [PubMed]
- Moffat, C.S.; Ingle, R.A.; Wathugala, D.L.; Saunders, N.J.; Knight, H.; Knight, M.R. ERF5 and ERF6 play redundant roles as positive regulators of JA/Et-mediated defense against Botrytis cinerea in Arabidopsis. PLoS ONE 2012, 7, e35995. [Google Scholar] [CrossRef] [Scilit]
- Pan, Y.; Seymour, G.B.; Lu, C.; Hu, Z.; Chen, X.; Chen, G. An ethylene response factor (ERF5) promoting adaptation to drought and salt tolerance in tomato. Plant Cell Rep. 2012, 31, 349–360. [Google Scholar] [CrossRef] [Scilit]
- Son, G.H.; Wan, J.; Kim, H.J.; Nguyen, X.C.; Chung, W.S.; Hong, J.C.; Stacey, G. Ethylene-responsive element-binding factor 5, ERF5, is involved in chitin-induced innate immunity response. Mol. Plant-Microbe Interact. 2012, 25, 48–60. [Google Scholar] [CrossRef] [Scilit]
- Mo, R.; Han, G.; Zhu, Z.; Essemine, J.; Dong, Z.; Li, Y.; Deng, W.; Qu, M.; Zhang, C.; Yu, C. The ethylene response factor ERF5 regulates anthocyanin biosynthesis in ‘Zijin’ mulberry fruits by interacting with MYBA and F3H genes. Int. J. Mol. Sci. 2022, 23, 7615. [Google Scholar] [CrossRef] [Scilit] [PubMed]
- Zacarías, L.; Rodrigo, M.J. Genomics of citrus fruit ripening. In The Citrus Genome; Gentile, A., La Malfa, S., Deng, Z., Eds.; Springer: Cham, Switzerland, 2020; pp. 177–193. [Google Scholar] [CrossRef] [Scilit]
- Kusaba, M.; Ito, H.; Morita, R.; Iida, S.; Sato, Y.; Fujimoto, M.; Kawasaki, S.; Tanaka, R.; Hirochika, H.; Nishimura, M.; et al. Rice NON-YELLOW COLORING1 is involved in light-harvesting complex II and grana degradation during leaf senescence. Plant Cell 2007, 19, 1362–1375. [Google Scholar] [CrossRef] [Scilit]
- Kim, S.; Kang, J.Y.; Cho, D.I.; Park, J.H.; Kim, S.Y. ABF2, an ABRE-binding bZIP factor, is an essential component of glucose signaling and its overexpression affects multiple stress tolerance. Plant J. 2004, 40, 75–87. [Google Scholar] [CrossRef] [Scilit] [PubMed]
- Feng, G.; Wu, J.; Xu, Y.; Lu, L.; Yi, H. High-spatiotemporal-resolution transcriptomes provide insights into fruit development and ripening in Citrus sinensis. Plant Biotechnol. J. 2021, 19, 1337–1353. [Google Scholar] [CrossRef] [Scilit]
Disclaimer/Publisher’s Note: The statements, opinions and data contained in all publications are solely those of the individual author(s) and contributor(s) and not of MDPI and/or the editor(s). MDPI and/or the editor(s) disclaim responsibility for any injury to people or property resulting from any ideas, methods, instructions or products referred to in the content. |
© 2025 by the authors. Licensee MDPI, Basel, Switzerland. This article is an open access article distributed under the terms and conditions of the Creative Commons Attribution (CC BY) license (https://creativecommons.org/licenses/by/4.0/).