


Abstract
Hanseniaspora uvarum is consistently observed as the dominant non-Saccharomyces species in grape juice leading to spontaneous fermentations and is often considered a detrimental factor due to the increased volatile acidity associated with its abundance. This study investigated how fermentation temperature affects the competitive interaction between H. uvarum and Saccharomyces cerevisiae, and how these shifts influence microbial community structure during spontaneous grape juice fermentations. Defined single- and co-inoculated fermentations were conducted across a range of temperatures (17, 23, and 25 °C), and cell abundance was quantified by flow cytometry. In parallel, spontaneous fermentations were monitored using ITS metabarcoding to assess temperature-driven changes in fungal community composition. At 17 °C, H. uvarum dominated early fermentation due to its faster growth rate, resulting in slower sugar consumption and prolonged fermentations. Increasing fermentation temperature enhanced the early growth of S. cerevisiae. Consistent patterns were observed in spontaneous fermentations, where higher temperatures increased the relative abundance of S. cerevisiae and shortened fermentation time. These results demonstrate that fermentation temperature is a major driver of yeast competition and suggest that moderate increases in fermentation temperature may help limit excessive H. uvarum proliferation during spontaneous fermentations.
1. Introduction
The surface of wine grapes harbours a complex consortium of fungal species whose composition varies with variety, geographic origin, climate, and viticultural practice [1,2,3]. Several studies have characterised the fungal microbiome of grapes, demonstrating both local variability and the presence of a core group of taxa [1,4,5]. These fungi are transferred into the must during processing, where they influence fermentation dynamics and contribute to wine aroma and flavour development. Their impact is particularly notable during un-inoculated (“spontaneous”) fermentations, where the absence of commercial yeast starter cultures allows the native microbial community to exert a more pronounced effect on the outcome.
Among the dominant early colonisers of grape must is Hanseniaspora uvarum, an apiculate yeast that rapidly proliferates during the initial stages of fermentation before being displaced by Saccharomyces cerevisiae as oxygen becomes limiting and ethanol concentrations increase [6,7,8,9,10]. H. uvarum has been viewed primarily as a spoilage organism because of its contribution to elevated concentrations of ethyl acetate and acetic acid [11]. However, recent research suggests it can have positive effects on aroma complexity and fermentation-derived flavour compounds [12,13,14,15,16,17].
The physiological traits that support the competitive advantage of H. uvarum during early fermentation have not been fully elucidated. Evidence suggests that H. uvarum has a faster growth rate than S. cerevisiae and other Hanseniaspora species, enabling early dominance in spontaneous fermentations [10,18,19,20], impacting the growth of S. cerevisiae and overall fermentation timeframes. This rapid growth rate may be linked to the distinct evolutionary history of the genus, characterised by extensive gene loss in pathways such as DNA repair, cell-cycle regulation, mRNA splicing, chromatid segregation, and signal recognition particle targeting [21,22]. Moreover, H. uvarum has lost core histone genes typically conserved in the Saccharomycetales while acquiring novel cis-regulatory elements that may have compensated for these losses [23].
Fermentation temperature has also been implicated in shaping H. uvarum competitiveness. Previous studies have shown that H. uvarum can sustain faster growth and sugar consumption than S. cerevisiae at lower temperatures (e.g., 15 °C) in defined media [19] and that under co-inoculation conditions, lower fermentation temperatures result in higher early growth of H. uvarum in grape must [18]. However, it remains unclear whether increased competitiveness at low temperatures also occurs in spontaneous fermentations, where complex microbial communities interact. If low temperatures also favour H. uvarum in spontaneous ferments, there is a potential for associated wine quality issues given that elevated H. uvarum abundance has been associated with increased production of undesirable compounds, such as ethyl acetate [11]. Current control strategies remain limited, with SO2 being the primary tool available to winemakers to restrict the growth of this species [24]. However, reducing reliance on SO2 is an active goal in the global wine industry due to both regulatory and consumer-driven pressures [25]. In this context, fermentation temperature may represent a practical tool to modulate the growth of H. uvarum, thereby reducing dependence on SO2 for its control.
In this study, we used flow cytometry to quantify the growth of H. uvarum in single and co-inoculation with S. cerevisiae across a range of temperatures, in order to assess how temperature influences competitive interactions between these species. Additionally, we performed metabarcoding of spontaneous grape juice fermentations to determine how fermentation temperature shapes population dynamics in spontaneous fermentation.
2. Materials and Methods
2.1. Microorganisms
Experiments were performed using H. uvarum strain AWRI 1276, which is an isolate from Chardonnay [22,26] and S. cerevisiae strain AWRI 4928, which is a transformant of AWRI 2867, an isolate of Collection Cepage Syrah strain LW 07. AWRI 4928 was transformed with a blue fluorescent protein (BFP) gene to allow the precise determination of cell concentration for each species by flow cytometry. Details on the transformation protocol are available in [27]. All microorganisms used in this work have been deposited in, and are available from, the AWRI Wine Microorganism Culture Collection (URL https://www.awri.com.au/research_and_development/wine-microorganism/ (accessed on 14 April 2025)).
2.2. Dual-Species Experiments
Growth assessment of H. uvarum AWRI 1276 and S. cerevisiae AWRI 4928 in chemically defined grape juice media (CDM) [28] was undertaken in single- and co-inoculation formats. Each species was inoculated at a concentration of 104 cells/mL as determined by flow cytometry. Self-anaerobic 100 mL fermentations were conducted in 100 mL sealed Schott bottles fitted with 1 psi, series 500 pressure release valves (Smart Products, Mills Rivers, NC, USA). Cells were kept in suspension by stirring at 230 rpm using 18 mm cross-head stir bars. Fermentations were carried out at 17 °C, 23 °C and 25 °C.
Cells were counted by flow cytometry using a Guava® easyCyte 12HT instrument (Merck Millipore, Burlington, MA, USA). Prior to cell counting, cells were diluted in PBS (NaCl 8 g/L, KCl 0.2 g/L, Na2HPO4 1.44 g/L, KH2PO4 0.24 g/L, pH 7.4 (Merck Life Science Pty Ltd., Bayswater, Australia)) to a concentration lower than 5 × 10⁶ cells/mL. Forward and side scatter detectors were used to determine particle size and estimate cell numbers. Blue fluorescence was detected using violet (405 nm solid-state laser) excitation and a 448/50 nm detection filter. A minimum of 5000 events were measured in all samples with a throughput lower than 500 events/μL. Results were analysed with InCyte software version 3.4.
Differences in cell concentrations were analysed in R [29] using two-way analysis of variance (ANOVA) implemented with the rstatix package version 1.0 [30]. Log cell concentrations were analysed with respect to treatment (co- and single-inoculation), temperature, and their interaction as fixed effects using the formula anova_test(log_cells ~ treatment + temperature + treatment:temperature). Analyses were performed separately for each species and time point. Cell counts were log-transformed prior to analysis. Pairwise comparisons between treatments within each temperature were conducted using the tukey_hsd function within rstatix.
2.3. Spontaneous Fermentations and ITS Metabarcoding
Freshly pressed Chardonnay grape must was sourced from a winery in Angaston, Barossa Valley, South Australia. The must was stored at −20 °C until use. Basic chemical compositional parameters of the must are available in Table A1. Because spontaneous fermentation experiments were conducted outside the harvest period, we first assessed whether freezing freshly pressed grape juice would preserve sufficient viable yeast populations to support spontaneous fermentation after thawing. To test this, fermentations were performed at 17 °C in 100 mL sealed Schott bottles as described in Section 2.1, using both fresh juice and juice subjected to a freeze–thaw cycle. Fermentation progress was monitored through sugar consumption, viable yeast counts determined by plating on YPD medium, and yeast population dynamics assessed using ITS metabarcoding (Figure A1). Samples collected at the end of alcoholic fermentation were analysed by HPLC as previously described [28].
The freeze–thaw cycle had minimal impact on total viable yeast cell concentrations and sugar consumption kinetics (Figure A1). However, ITS metabarcoding indicated partial suppression of native S. cerevisiae following freezing and thawing (Figure A1). Despite this, both S. cerevisiae and H. uvarum became the dominant species at mid and late stages of spontaneous fermentation, supporting the use of frozen grape juice as a suitable model system for spontaneous fermentation experiments in this study.
To evaluate the effect of fermentation temperature on the population dynamics of S. cerevisiae and H. uvarum during spontaneous fermentation, the juice was thawed, and 100 mL of must was transferred into 100 mL sealed Schott bottles as described in Section 2.1. Spontaneous fermentations were carried out in triplicate at 17 °C, 23 °C and 25 °C as described in Section 2.1. Samples were taken daily for DNA extraction and enzymatic sugar determination (glucose + fructose) as previously described [31], with adaptations as described by [32].
DNA was extracted from pellets using a Gentra PureGene Yeast/Bact kit (Qiagen, Hilden, Germany). PCRs were performed using 10 ng of DNA with primer sequences ITS1 and ITS4 [33], designed to amplify the fungal ITS region. Amplification parameters were: 30 cycles, 56 °C annealing, 30 s extension, KAPA Taq HotStart polymerase. Sequencing libraries were prepared using the SQK-NBD114.24 kit and sequenced in a P2 Solo device (Oxford Nanopore Technologies, Oxford, UK). Pod5 files were base-called and demultiplexed with Dorado (Oxford Nanopore Technologies, Oxford, UK).
Metabarcoding analyses were performed utilising the ONT-Ampseq Snakemake pipeline version 1.1.2 [34] and the UTAX-formatted Fungi UNITE database version 10.0 (release date 19 February 2025). Reads were filtered by length (200–2500 bp) and minimum average Phred quality of 25. OTUs were clustered at 97% similarity and taxonomic identification was performed using BLAST version 2.15.0. BLAST searches were conducted using the pipeline default parameters, and only the highest-ranked database hit was retained (min e-value 1 × 10⁻¹⁰) for taxonomic assignment. Because closely related yeast species may share highly similar ITS sequences, OTUs with best hits to Saccharomyces cerevisiae and Hanseniaspora uvarum were manually inspected by examining the top two BLAST matches to verify that the assigned species represented the unique highest-scoring hit and that no alternative species exhibited identical alignment statistics.
3. Results and Discussion
3.1. Fermentation Temperature Modulates Competition Between H. uvarum and S. cerevisiae
Earlier studies have shown that the competitive growth dynamics between H. uvarum and S. cerevisiae are influenced by fermentation temperature [18,19], with lower temperatures often favouring the growth of H. uvarum. In our previous investigation, we confirmed that H. uvarum exhibits a faster growth rate than S. cerevisiae, allowing this species to rapidly dominate during the early stages of fermentation [10]. However, those fermentations were conducted at 17 °C, a temperature within the medium-to-low range commonly used for grape must fermentation.
To precisely evaluate whether temperature is a key driver of H. uvarum’s competitive advantage, we performed fermentations across a wider temperature range and quantified cell numbers for both species using flow cytometry in single- and co-inoculation formats. Sugar consumption rates were also measured to assess how changes in species abundance influenced fermentation kinetics and completion time.
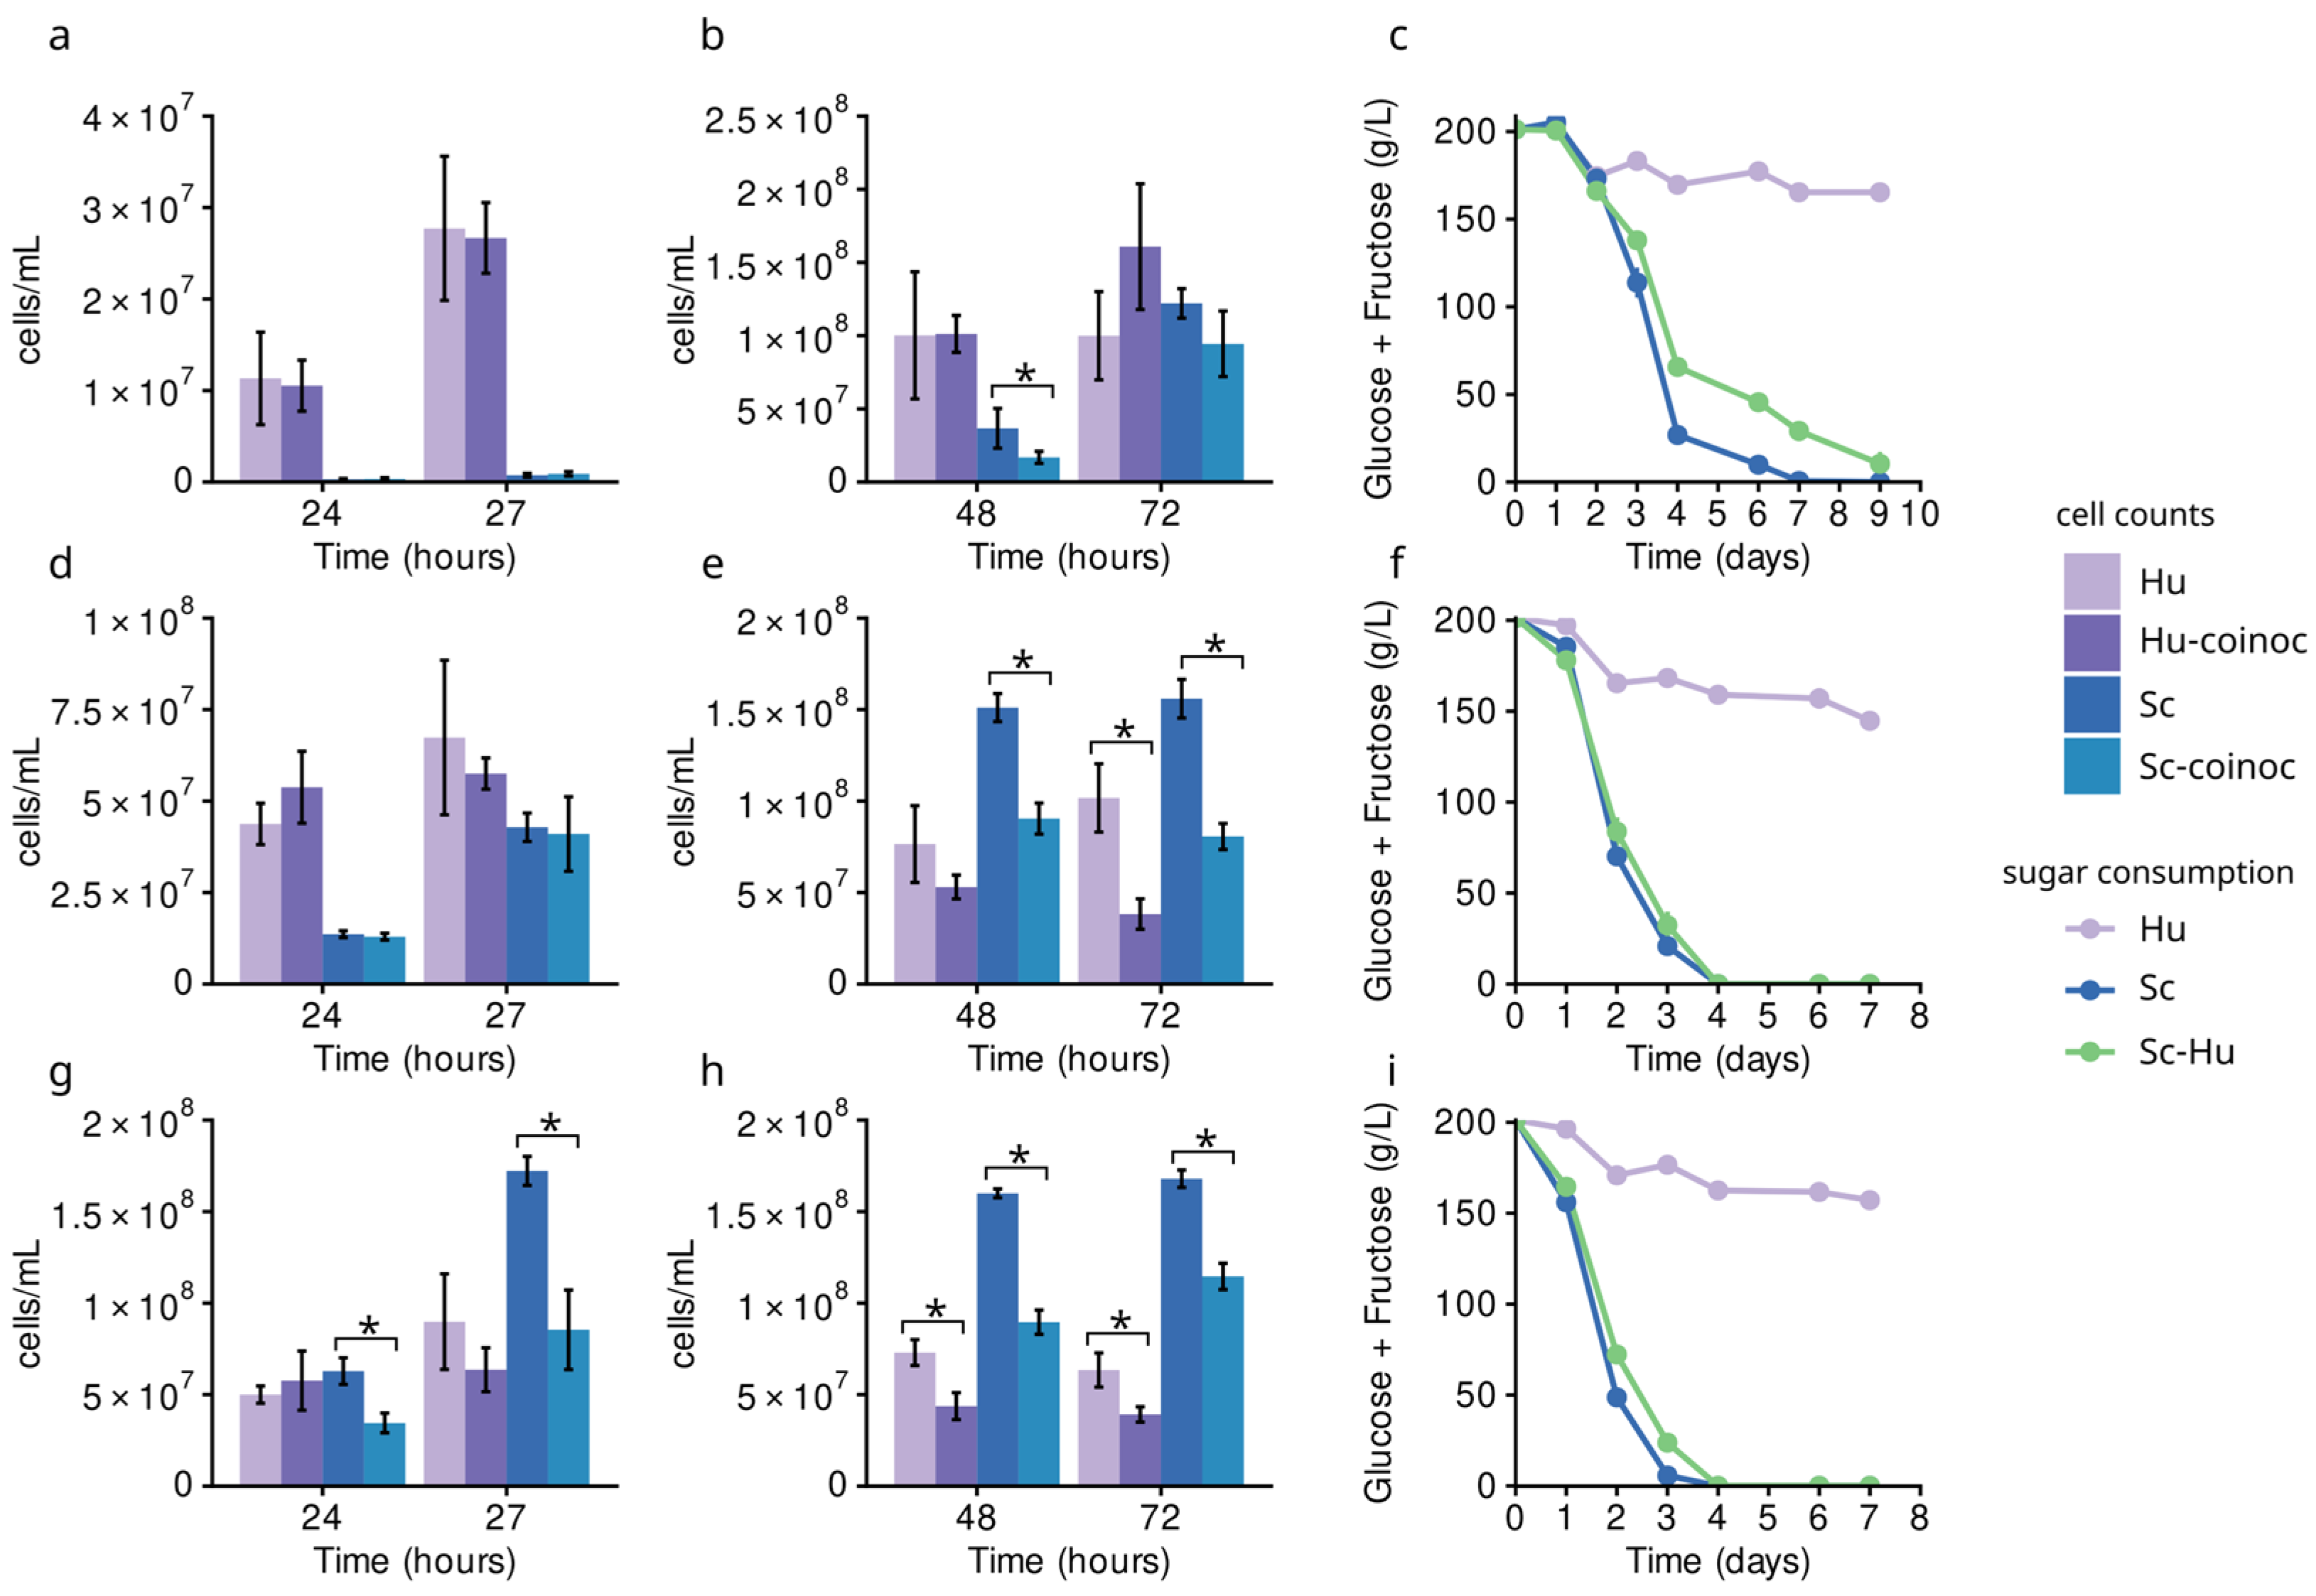
Consistent with our previous findings [10], H. uvarum displayed rapid early growth at 17 °C in both single and co-inoculated fermentations, and its proliferation was not significantly affected by the presence of S. cerevisiae (Figure 1a,b). After 72 h, both species reached comparable cell numbers across all treatments (Figure 1b). Despite this, notable differences in fermentation duration were observed (Figure 1c): co-inoculated fermentations did not reach dryness (<2 g/L) after 13 days of fermentation, whereas S. cerevisiae monocultures completed fermentation within 7 days of inoculation (Figure 1c, Table S1). As expected, given the poor fermentative capacity of H. uvarum, single-species fermentations consumed only 36 g/L. Despite this, the presence of H. uvarum during co-inoculation clearly affected sugar utilisation by S. cerevisiae. This may reflect both the slower sugar consumption of H. uvarum during early fermentation, when it remains dominant, and early competition between the two species for essential nutrients.
Figure 1.
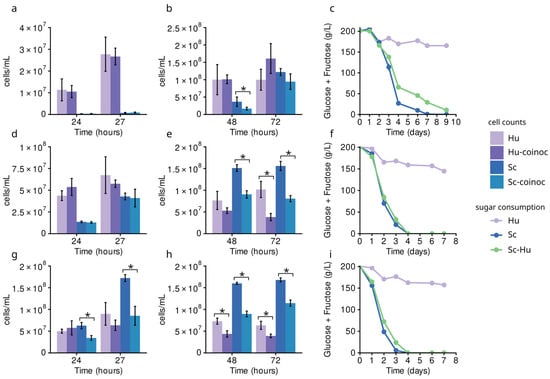
Effect of temperature on growth of Hanseniaspora uvarum (Hu) and Saccharomyces cerevisiae (Sc), individually and co-inoculated, in chemically defined grape juice media (CDM). Cell number was determined by flow cytometry after 24 and 27 h and 48 and 72 h at 17 °C (a,b), 23 °C (d,e) and 25 °C (g,h) after inoculation of H. uvarum and S. cerevisiae at 104 cells/mL. Coinoc treatments represent the cell number for H. uvarum (Hu-coinoc) and S. cerevisiae (Sc-coinoc) under co-inoculation. Sugar consumption at 17 °C (c), 23 °C (f) and 25 °C (i) for the three inoculation regimes investigated. All data represent the mean of three replicates, with error bars indicating standard deviation. The results of Tukey’s HSD test between a species under single and co-inoculation (p-values < 0.05) are indicated with an asterisk. Exact p-values are reported in Table S4.
Contrasting patterns were observed when fermentation temperature was increased to 23 and 25 °C (Figure 1d–i). As expected, significantly higher cell numbers were observed for both species at comparative time points when grown at higher temperatures in single and co-inoculation fermentations (Table S2). However, S. cerevisiae showed a markedly stronger response early in fermentation (Figure 1d,g). Specifically, mean S. cerevisiae cell numbers at 24 h increased from 3.0 × 10⁵ cells/mL at 17 °C to 1.4 × 10⁷ cells/mL and 6.3 × 10⁷ cells/mL at 23 °C and 25 °C, respectively. Although mean H. uvarum cell numbers also increased, from 1.1 × 10⁷ cells/mL at 17 °C to 4.4 × 10⁷ cells/mL and 5.0 × 10⁷ cells/mL at 23 °C and 25 °C, the changes were far less pronounced (Table S3). These differences are consistent with the known differences in optimal growth temperature between the two species: S. cerevisiae typically exhibits an optimum around 31–32 °C, while H. uvarum grows best at 24 °C [35].
A consequence of increasing fermentation temperature was a shift in early fermentation competitive dynamics in favour of S. cerevisiae. Higher S. cerevisiae cell numbers after 72 h at 25 °C were observed under both single- and co-inoculation conditions (Figure 1h). However, there was evidence that co-inoculation suppressed cell numbers for both species at elevated fermentation temperatures (Figure 1e,h, Tables S3 and S4). For example, in 25 °C fermentations, H. uvarum mean cell concentrations decreased from 6.3 × 10⁷ cells/mL to 3.9 × 10⁷ cells/mL at 72 h when co-inoculated (p = 0.01). Similarly, S. cerevisiae mean cell concentrations decreased from 1.7 × 10⁸ cells/mL to 1.1 × 10⁸ cells/mL with co-inoculation (p = 0.0006).
The suppressed cell concentrations indicate that, despite the enhanced competitiveness of S. cerevisiae at higher temperatures, the presence of H. uvarum continued to influence S. cerevisiae growth. Nevertheless, the enhanced growth of S. cerevisiae supported by higher temperatures allowed sugar consumption rates under co-inoculation to closely match those observed in single-inoculated S. cerevisiae fermentations. Single and co-inoculated ferments at 23 °C and 25 °C all finished within 4 days (Table S1).
Overall, these results highlight the critical role of fermentation temperature in shaping the competitive dynamics between H. uvarum and S. cerevisiae, corroborating previous observations [18,19]. The observed shifts in dominance can be largely attributed to inherent differences in the optimal growth temperatures of these species. These findings are particularly relevant for the management of spontaneous fermentations, given the high abundance of H. uvarum in freshly pressed grape juice [1,5] and the well-documented detrimental organoleptic effects associated with its proliferation in wine [11].
These findings may also have implications for the future application of H. uvarum as a commercial starter culture, considering recent studies demonstrating its potential to enhance aroma complexity and contribute positively to fermentation-derived flavour compounds [12,13,14,15,16,17].
3.2. Impact of Fermentation Temperature on Microbial Dynamics During Spontaneous Grape Juice Fermentation
The influence of temperature on early competitive growth between H. uvarum and S. cerevisiae was demonstrated in the previous section in a model system, with higher temperatures favouring the growth of S. cerevisiae and accelerating the completion of fermentation when in co-inoculation with H. uvarum. However, spontaneous fermentations involve complex interactions among multiple yeast species, and how these communities collectively respond to temperature remains poorly understood. To examine whether temperature-driven shifts observed in defined-medium co-inoculation experiments are also reflected in changes to species abundance during spontaneous grape juice fermentations, a Chardonnay grape must was spontaneously fermented at three different temperatures (17, 23 and 25 °C), and changes in microbial composition were monitored using ITS metabarcoding.
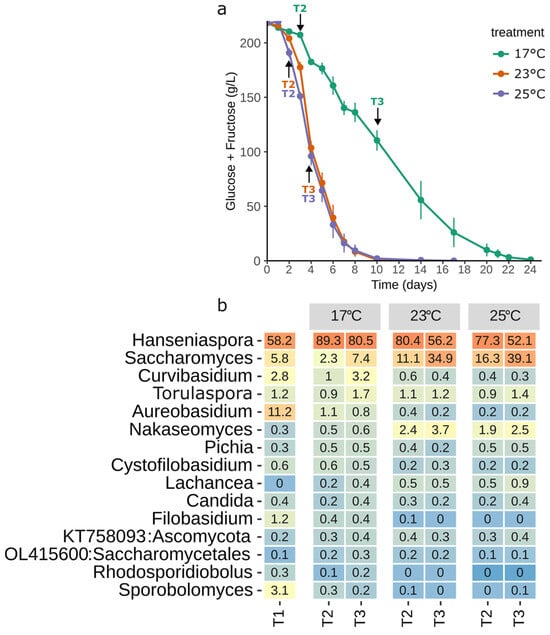
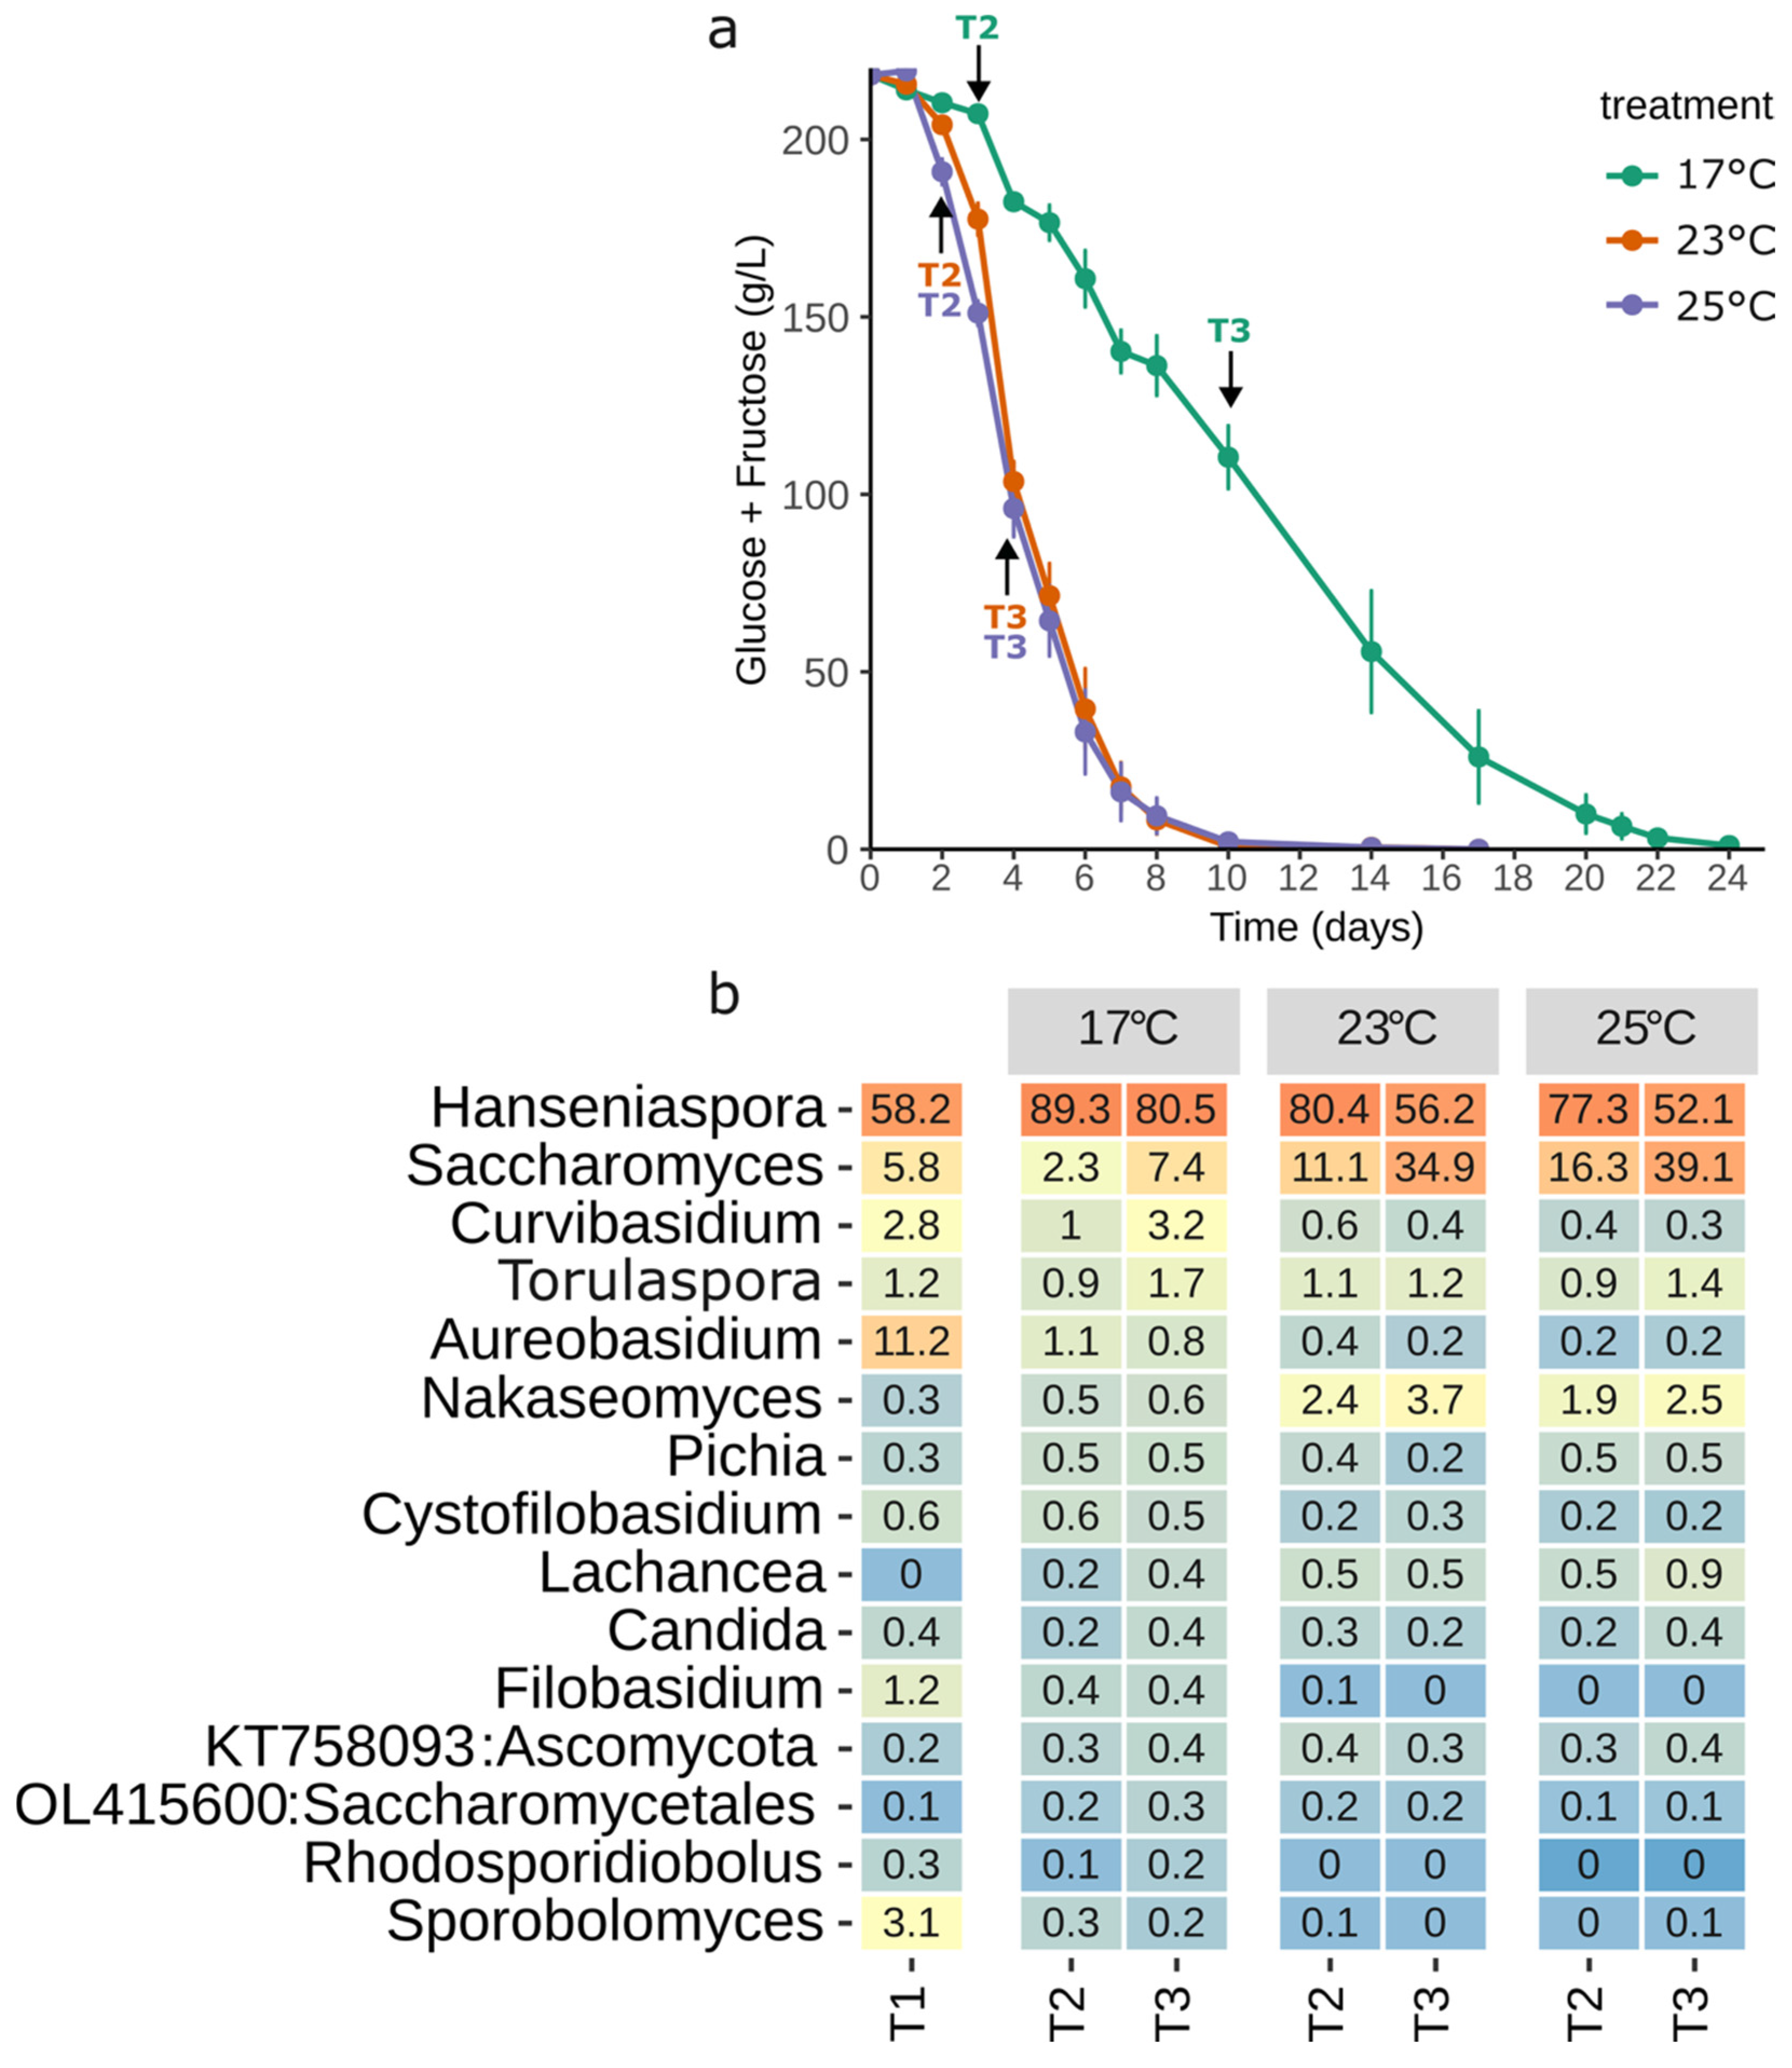
The most abundant genera at time point T1 were Hanseniaspora, Aureobasidium, and Saccharomyces (Figure 2b). The species abundance profiles observed in this experimental work are consistent with previous studies [1,5]. T1 was characterised by a particularly high relative abundance of Hanseniaspora (58%). Although similar patterns have previously been observed in surveys of spontaneous grape juice fermentations [5], it is also possible that partial fermentation had already occurred during must preparation or that storage conditions influenced the initial community composition (Figure A1). Nevertheless, all experimental treatments were conducted under identical laboratory conditions, with fermentation temperature as the sole experimental variable.
Figure 2.
Microbial dynamics of a spontaneous Chardonnay grape must fermentation conducted at 17 °C, 23 °C, and 25 °C. (a) Fermentation progression during spontaneous Chardonnay must fermentation at 17 °C, 23 °C, and 25 °C. Data points represent the mean of three replicates, with error bars indicating standard deviation. Arrows indicate the sampling time points of panel (b). (b) Relative abundance of the top 15 genera determined by ITS metabarcoding. When no genus-level taxonomic identification was available, the UNITE reference sequence accession is shown along with the best available taxonomic classification. T1 represents the grape must prior to fermentation, T2 the community composition after approximately a 16 g/L drop, and T3 after 50% sugar consumption. Values represent the mean relative abundance of three independent replicates and are coloured with a gradient to accentuate abundance values from 0% (blue) to 3% (yellow) to 100% (organge).
Fungal relative abundance profiles at 10% and 50% sugar consumption (T2 and T3) (Figure 2a) revealed clear temperature-dependent shifts in community composition (Figure 2b). At T3, the relative abundance of Saccharomyces (OTUs’ best BLAST hit to S. cerevisiae, Table S5) increased from 7.4% in fermentations conducted at 17 °C to 34.9% and 39.1% at 23 °C and 25 °C, respectively. This increase was accompanied by a marked decline in Hanseniaspora (OTUs’ best BLAST hit to H. uvarum, Table S5), which decreased from 80.5% at 17 °C to 56.2% and 52.1% at 23 °C and 25 °C, respectively (Figure 2). These results strongly support the findings from the earlier defined-medium co-culture experiments and indicate that the competitive fitness of S. cerevisiae is enhanced at higher fermentation temperatures. Nevertheless, it should be noted that the ITS metabarcoding approach employed in this experiment provides relative abundance estimates rather than absolute cell counts. While the earlier co-culture experiments demonstrated that higher temperatures resulted in increased absolute cell abundance of S. cerevisiae, absolute quantification of these species was not performed during the spontaneous fermentations.
Clear differences were also observed in sugar consumption among treatments (Figure 2a). Apart from an accelerated sugar utilisation by the 25 °C ferments in the first 3 days, no differences in the sugar consumption profile were detected between fermentations conducted at 23 °C and 25 °C, with both treatments completing fermentation within 10 days (Table S6). In contrast, fermentations conducted at 17 °C required 24 days to reach completion (Figure 2a, Table S6). Considering the higher abundance of Saccharomyces in the 23 °C and 25 °C treatments (Figure 2b), together with the faster fermentations observed in the co-culture experiments (Figure 1f,i), it is likely that the shorter fermentation timeframes are explained by the greater fermentative capacity of S. cerevisiae compared with H. uvarum [36].
HPLC analysis of end-of-fermentation samples (Table S7) revealed significant differences in acetic acid and glycerol concentrations among temperature treatments. Fermentations conducted at 17 °C contained higher acetic acid concentrations (0.45 ± 0.12 g/L) than those conducted at 23 °C (0.25 ± 0.08 g/L) and 25 °C (0.22 ± 0.07 g/L). In contrast, glycerol concentrations were significantly lower at 17 °C (7.41 ± 0.21 g/L) compared with fermentations performed at 23 °C (8.45 ± 0.39 g/L) and 25 °C (8.78 ± 0.73 g/L). Although speculative, the higher acetic acid concentrations observed at 17 °C may be associated with the greater abundance of H. uvarum, a species well known for elevated acetic acid production [11]. Conversely, the increase in more than 1 g/L glycerol in fermentations conducted at higher temperatures may be linked to the greater relative abundance of S. cerevisiae, which is recognised for its substantial glycerol production during alcoholic fermentation [37], and reported to produce higher glycerol concentrations than H. uvarum under wine fermentation conditions [38].
The results of the co-culture and spontaneous fermentation experiments indicate that the major microbial abundance transition occurred between 17 °C and 23 °C. The relatively minor differences observed between 23 °C and 25 °C suggest that once this threshold is exceeded, additional increases in temperature may provide minimal effects on microbial succession and fermentation kinetics. Consequently, our findings do not support distinct practical recommendations for conducting spontaneous fermentations at 23 °C versus 25 °C but rather suggest that avoiding excessively cool fermentation temperatures may be more important for limiting the proliferation of Hanseniaspora and promoting the earlier establishment of Saccharomyces populations.
The temperature range investigated in this study was relatively narrow and did not cover the full range of temperatures employed in commercial winemaking. White wine fermentations are frequently conducted at lower temperatures (approximately 12–15 °C) to preserve volatile aroma compounds, whereas red wine fermentations may occur at temperatures exceeding 25 °C. Based on the observed temperature-dependent shifts in microbial competition and the known growth characteristics of these species, it is possible that fermentations conducted at lower temperatures would further favour the persistence of Hanseniaspora; however, additional studies looking into a broader range of fermentation temperatures are required before generalised recommendations can be made for commercial practice.
4. Conclusions
This study explored the impact of fermentation temperature on the competitive growth of H. uvarum and S. cerevisiae during grape juice fermentations. H. uvarum is known to have a faster growth rate than S. cerevisiae, but has lower fermentative capacity and ethanol tolerance, making it an early competitive species during spontaneous fermentations. In dual-species fermentations, clear temperature-dependent shifts in species abundance were observed. Increasing fermentation temperature from 17 °C to 23 °C or 25 °C enhanced the growth of S. cerevisiae, influencing both early competition dynamics and final cell numbers, and resulting in shorter fermentation completion times. Investigation of these same temperature regimes in spontaneous fermentations confirmed that temperature changes induce shifts in the relative abundance of the fungal community. The most pronounced changes in spontaneous fermentations also involved H. uvarum and S. cerevisiae, with higher fermentation temperatures favouring S. cerevisiae growth and shortening overall fermentation times. In this context, fermentation temperature may serve as an alternative to SO2 to control excessive H. uvarum proliferation during spontaneous fermentation. However, these findings should be interpreted with caution, as the present study was conducted at laboratory scale using a single Chardonnay must and a specific microbial community. The effectiveness of temperature management as a replacement or reduction strategy for SO2 may vary considerably under commercial winemaking conditions, where grape cultivar, fermentation volume, initial microbial composition, oxygen availability, and cellar practices can substantially influence microbial interactions and fermentation dynamics. Furthermore, SO2 provides several additional benefits during winemaking, including protection against oxidation and suppression of other spoilage microorganisms. Consequently, the potential of fermentation temperature to partially substitute for SO2 usage will require validation across multiple grape varieties and under pilot- and commercial-scale winemaking conditions.
Although spontaneous fermentation is often associated with desirable attributes such as increased flavour complexity and enhanced wine quality, excessive growth of H. uvarum and the associated increases in volatile acidity have made some winemakers reluctant to adopt this approach. The present study did not evaluate ethyl acetate production, aroma composition, or sensory attributes of the resulting wines. Therefore, our results directly support conclusions regarding microbial population dynamics and fermentation performance, but any potential benefits to final wine quality remain speculative. We hypothesise that reducing excessive H. uvarum proliferation through temperature management may contribute to improved fermentation outcomes and potentially mitigate the production of undesirable metabolites; however, this relationship requires direct validation through future studies incorporating chemical and sensory analyses. Consequently, fermentation temperature should presently be considered as a potential management tool for modulating microbial succession during spontaneous fermentations rather than a demonstrated strategy for improving final wine quality. Furthermore, because this study was conducted at laboratory scale using a single grape must and microbial community, larger-scale studies including different grape varieties and winemaking conditions are required to confirm the practical applicability of these findings and determine whether the observed microbial shifts ultimately translate into measurable improvements in wine composition and sensory quality.
Supplementary Materials
The following supporting information can be downloaded at: https://www.mdpi.com/article/10.3390/fermentation12080390/s1. Table S1: Sugar consumption (g/L of glucose + fructose) in dual-species experiments. Table S2: Tukey’s HSD test comparing temperatures within each species, treatment, and time point. Cell numbers were log-transformed prior to analysis. Table S3: Mean and standard deviation of cell concentrations for all treatments and timepoints. Table S4: Tukey’s HSD test comparing treatments within each species, temperature, and timepoint. Cell numbers were log-transformed prior to analysis. Table S5: Relative abundance of OTUs grouped by species based on best BLAST hits. Individual OTUs and their best BLAST hits to the UNITE database are shown when no species-level taxonomic identification is available. Table S6: Sugar consumption (g/L of glucose + fructose) in Chardonnay spontaneous grape juice fermentations. Table S7. Concentration of metabolites in spontaneously fermented wines. Different letters within a row indicate significant differences among temperature treatments according to Tukey’s HSD test.
Author Contributions
Conceptualization, C.A.O. and S.A.S.; methodology, C.A.O.; software, C.A.O.; validation, C.A.O. and J.M.; formal analysis, C.A.O. and J.M.; investigation, C.A.O. and J.M.; resources, S.A.S.; data curation, C.A.O.; writing—original draft preparation, C.A.O.; writing—review and editing, S.A.S.; visualisation, C.A.O.; supervision, S.A.S.; project administration, S.A.S.; funding acquisition, C.A.O. and S.A.S. All authors have read and agreed to the published version of the manuscript.
Funding
This research was funded by Wine Australia, grant number AWR 2202-2.3.1.
Institutional Review Board Statement
Not applicable.
Informed Consent Statement
Not applicable.
Data Availability Statement
The original contributions presented in this study are included in the article and Supplementary Material. ITS sequencing data are available in NCBI under Bioproject accession PRJNA1474009. Raw data used to produce the graphs in Figure 1, Figure 2 and Figure A1 are available from the Dryad open data repository at DOI: https://doi.org/10.5061/dryad.cfxpnvxp3. Further inquiries can be directed to the corresponding author.
Acknowledgments
The authors would like to thank Hill-Smith Family Estates for the provision of grape juice and Markus Herderich for useful comments during manuscript preparation.
Conflicts of Interest
The authors declare no conflicts of interest.
Appendix A
Figure A1.
Assessment of the impact of a freeze–thaw cycle on the fermentation performance and yeast population of a spontaneously fermented Chardonnay grape must. (a) Sugar consumption and (b) total CFU/mL during spontaneous Chardonnay must fermentation before (fresh) and after the freeze–thaw cycle (frozen). Data points represent the mean of three replicates, with error bars indicating standard deviation. (c) Relative abundance of the top 5 genera determined by ITS metabarcoding. T2 represents the fungal community composition after a 1 °Bé drop, T3 and T4 after 50% and 90% sugar consumption, respectively. Values represent the mean relative abundance of three independent replicates and are coloured with a gradient to accentuate abundance values from 0% (blue) to 3% (yellow) to 100% (organge).
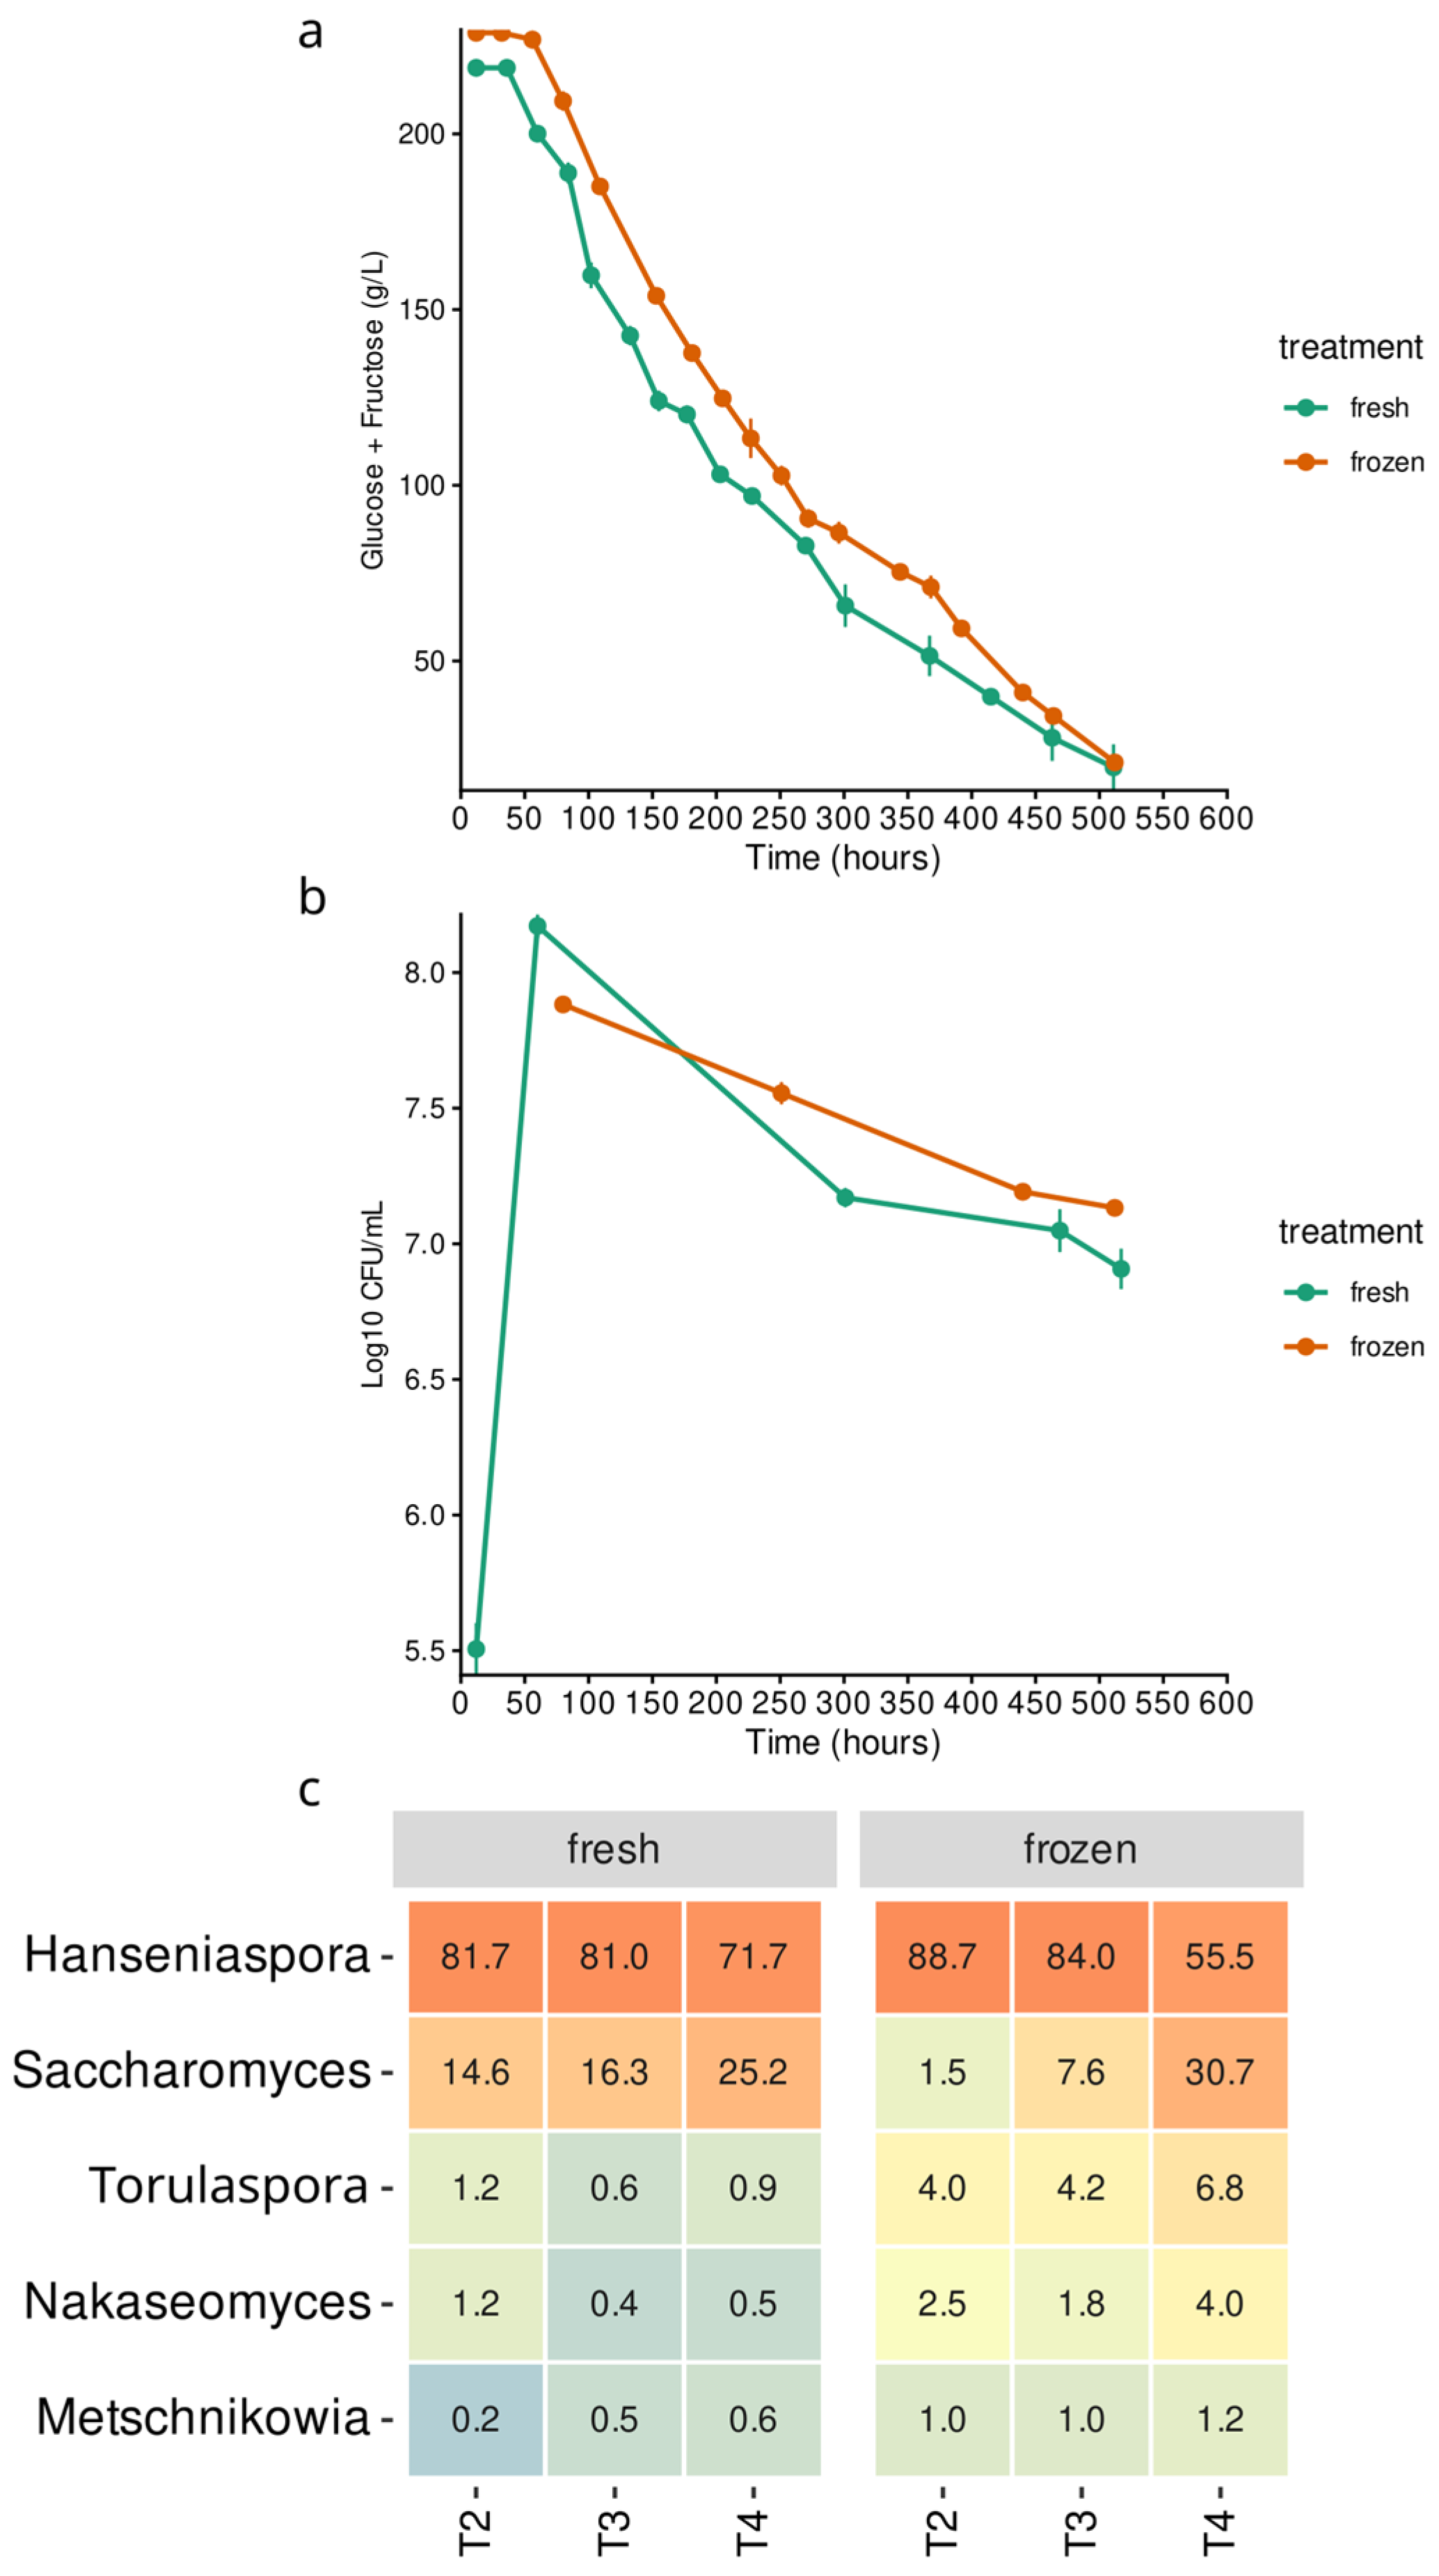
Table A1.
Chemical composition of Chardonnay grape juice.
References
- Bokulich, N.A.; Thorngate, J.H.; Richardson, P.M.; Mills, D.A. Microbial Biogeography of Wine Grapes Is Conditioned by Cultivar, Vintage, and Climate. Proc. Natl. Acad. Sci. USA 2014, 111, E139–E148. [Google Scholar] [CrossRef] [Scilit] [PubMed]
- Gayevskiy, V.; Goddard, M.R. Geographic Delineations of Yeast Communities and Populations Associated with Vines and Wines in New Zealand. ISME J. 2012, 6, 1281–1290. [Google Scholar] [CrossRef] [Scilit] [PubMed]
- Pinto, C.; Pinho, D.; Cardoso, R.; Custódio, V.; Fernandes, J.; Sousa, S.; Pinheiro, M.; Egas, C.; Gomes, A.C. Wine Fermentation Microbiome: A Landscape from Different Portuguese Wine Appellations. Front. Microbiol. 2015, 6, 905. [Google Scholar] [CrossRef] [Scilit] [PubMed]
- Liu, D.; Howell, K. Community Succession of the Grapevine Fungal Microbiome in the Annual Growth Cycle. Environ. Microbiol. 2021, 23, 1842–1857. [Google Scholar] [CrossRef] [Scilit]
- Onetto, C.A.; Ward, C.M.; Van Den Heuvel, S.; Hale, L.; Cuijvers, K.; Borneman, A.R. Temporal and Spatial Dynamics within the Fungal Microbiome of Grape Fermentation. Environ. Microbiol. 2024, 26, e16660. [Google Scholar] [CrossRef] [Scilit]
- Beltran, G.; Torija, M.J.; Novo, M.; Ferrer, N.; Poblet, M.; Guillamón, J.M.; Rozès, N.; Mas, A. Analysis of Yeast Populations during Alcoholic Fermentation: A Six Year Follow-up Study. Syst. Appl. Microbiol. 2002, 25, 287–293. [Google Scholar] [CrossRef] [Scilit]
- Ciani, M.; Capece, A.; Comitini, F.; Canonico, L.; Siesto, G.; Romano, P. Yeast Interactions in Inoculated Wine Fermentation. Front. Microbiol. 2016, 7, 555. [Google Scholar] [CrossRef] [Scilit] [PubMed]
- Combina, M.; Elía, A.; Mercado, L.; Catania, C.; Ganga, A.; Martinez, C. Dynamics of Indigenous Yeast Populations during Spontaneous Fermentation of Wines from Mendoza, Argentina. Int. J. Food Microbiol. 2005, 99, 237–243. [Google Scholar] [CrossRef] [Scilit]
- Fleet, G.H. Growth of Yeasts during Wine Fermentations. J. Wine Res. 1990, 1, 211–223. [Google Scholar] [CrossRef] [Scilit]
- Onetto, C.A.; McCarthy, J.; Schmidt, S.A. A Rapid Growth Rate Underpins the Dominance of Hanseniaspora uvarum in Spontaneous Grape Juice Fermentations. Yeast 2025, 42, 116–125. [Google Scholar] [CrossRef] [Scilit]
- van Wyk, N.; Badura, J.; von Wallbrunn, C.; Pretorius, I.S. Exploring Future Applications of the Apiculate Yeast Hanseniaspora. Crit. Rev. Biotechnol. 2024, 44, 100–119. [Google Scholar] [CrossRef] [Scilit] [PubMed]
- Badura, J.; Kiene, F.; Brezina, S.; Fritsch, S.; Semmler, H.; Rauhut, D.; Pretorius, I.S.; von Wallbrunn, C.; van Wyk, N. Aroma Profiles of Vitis vinifera L. cv. Gewürztraminer Must Fermented with Co-Cultures of Saccharomyces Cerevisiae and Seven Hanseniaspora spp. Fermentation 2023, 9, 109. [Google Scholar] [CrossRef] [Scilit]
- Mestre, M.V.; Maturano, Y.P.; Gallardo, C.; Combina, M.; Mercado, L.; Toro, M.E.; Carrau, F.; Vazquez, F.; Dellacassa, E. Impact on Sensory and Aromatic Profile of Low Ethanol Malbec Wines Fermented by Sequential Culture of Hanseniaspora uvarum and Saccharomyces Cerevisiae Native Yeasts. Fermentation 2019, 5, 65. [Google Scholar] [CrossRef] [Scilit]
- Rossouw, D.; Bauer, F.F. Exploring the Phenotypic Space of Non-Saccharomyces Wine Yeast Biodiversity. Food Microbiol. 2016, 55, 32–46. [Google Scholar] [CrossRef] [Scilit]
- Santos, A.P.C.; Vanderlinde, R.; Machado, B.A.S.; de Oliveira Mamede, M.E. Improving Production of Aromatic Compounds by Indigenous Yeasts in Chenin Blanc Grape Must. Afr. J. Agric. Res. 2016, 11, 2433–2442. [Google Scholar] [CrossRef] [Scilit]
- Wang, J.; Wang, Z.; Gao, H.; Bai, X.; Li, L.; Wei, R.; Dong, Z. Metabolomics and Flavor Diversity in Cabernet Sauvignon Wines Fermented by Various Origins of Hanseniaspora uvarum in the Presence and Absence of Saccharomyces Cerevisiae. LWT-Food Sci. Technol. 2024, 203, 116396. [Google Scholar] [CrossRef] [Scilit]
- Zhang, Z.; Wang, H.; Xia, H.; Sun, L.; Zhang, Q.; Yang, H.; Zhang, J. Wine Aroma Modification by Hanseniaspora uvarum: A Multiple-Step Strategy for Screening Potential Mixed Starters. Food Chem. X 2023, 20, 100930. [Google Scholar] [CrossRef] [Scilit]
- Erten, H. Relations between Elevated Temperatures and Fermentation Behaviour of Kloeckera Apiculata and Saccharomyces Cerevisiae Associated with Winemaking in Mixed Cultures. World J. Microbiol. Biotechnol. 2002, 18, 377–382. [Google Scholar] [CrossRef] [Scilit]
- Mendoza, L.M.; de Nadra, M.C.M.; Bru, E.; Farías, M.E. Influence of Wine-Related Physicochemical Factors on the Growth and Metabolism of Non-Saccharomyces and Saccharomyces Yeasts in Mixed Culture. J. Ind. Microbiol. Biotechnol. 2009, 36, 229–237. [Google Scholar] [CrossRef] [Scilit] [PubMed]
- Pourcelot, E.; Vigna, A.; Marlin, T.; Galeote, V.; Nidelet, T. Design of a New Model Yeast Consortium for Ecological Studies of Enological Fermentation. Peer Community J. 2025, 5. [Google Scholar] [CrossRef] [Scilit]
- Steenwyk, J.L.; Opulente, D.A.; Kominek, J.; Shen, X.-X.; Zhou, X.; Labella, A.L.; Bradley, N.P.; Eichman, B.F.; Čadež, N.; Libkind, D.; et al. Extensive Loss of Cell-Cycle and DNA Repair Genes in an Ancient Lineage of Bipolar Budding Yeasts. PLoS Biol. 2019, 17, e3000255. [Google Scholar] [CrossRef] [Scilit] [PubMed]
- Onetto, C.A.; Ward, C.M.; Varela, C.; Hale, L.; Schmidt, S.A.; Borneman, A.R. Genetic and Phenotypic Diversity of Wine-Associated Hanseniaspora Species. FEMS Yeast Res. 2025, 25, foaf031. [Google Scholar] [CrossRef] [Scilit] [PubMed]
- Haase, M.A.B.; Steenwyk, J.L.; Boeke, J.D. Gene Loss and Cis-Regulatory Novelty Shaped Core Histone Gene Evolution in the Apiculate Yeast Hanseniaspora uvarum. Genetics 2024, 226, iyae008. [Google Scholar] [CrossRef] [Scilit] [PubMed]
- Cuijvers, K.; Van Den Heuvel, S.; Varela, C.; Rullo, M.; Solomon, M.; Schmidt, S.; Borneman, A. Alterations in Yeast Species Composition of Uninoculated Wine Ferments by the Addition of Sulphur Dioxide. Fermentation 2020, 6, 62. [Google Scholar] [CrossRef] [Scilit]
- Guerrero, R.F.; Cantos-Villar, E. Demonstrating the Efficiency of Sulphur Dioxide Replacements in Wine: A Parameter Review. Trends Food Sci. Technol. 2015, 42, 27–43. [Google Scholar] [CrossRef] [Scilit]
- de Barros Lopes, M.; Soden, A.; Martens, A.L.; Henschke, P.A.; Langridge, P. Differentiation and Species Identification of Yeasts Using PCR. Int. J. Syst. Evol. Microbiol. 1998, 48, 279–286. [Google Scholar] [CrossRef] [Scilit]
- Onetto, C.A.; Borneman, A.R.; Schmidt, S.A. Strain-Specific Responses by Saccharomyces Cerevisiae to Competition by Non-Saccharomyces Yeasts. Fermentation 2021, 7, 165. [Google Scholar] [CrossRef] [Scilit]
- Schmidt, S.A.; Dillon, S.; Kolouchova, R.; Henschke, P.A.; Chambers, P.J. Impacts of Variations in Elemental Nutrient Concentration of Chardonnay Musts on Saccharomyces Cerevisiae Fermentation Kinetics and Wine Composition. Appl. Microbiol. Biotechnol. 2011, 91, 365–375. [Google Scholar] [CrossRef] [Scilit] [PubMed]
- R Core Team. R: A Language and Environment for Statistical Computing; R Foundation for Statistical Computing: Vienna, Austria, 2013. [Google Scholar]
- Kassambara, A. Rstatix: Pipe-Friendly Framework for Basic Statistical Tests. 2023. Available online: https://CRAN.R-project.org/package=rstatix (accessed on 11 August 2026).
- Hohorst, H.-J. D-Glucose-6-Phosphate and d-Fructose-6-Phosphate: Determination with Glucose-6-Phosphate Dehydrogenase and Phosphoglucose Isomerase. In Methods of Enzymatic Analysis; Bergmeyer, H.-U., Ed.; Academic Press: New York, NY, USA, 1965; pp. 134–138. [Google Scholar] [CrossRef] [Scilit]
- Vermeir, S.; Nicolaï, B.M.; Jans, K.; Maes, G.; Lammertyn, J. High-Throughput Microplate Enzymatic Assays for Fast Sugar and Acid Quantification in Apple and Tomato. J. Agric. Food Chem. 2007, 55, 3240–3248. [Google Scholar] [CrossRef] [Scilit] [PubMed]
- Gardes, M.; Bruns, T.D. ITS Primers with Enhanced Specificity for Basidiomycetes—Application to the Identification of Mycorrhizae and Rusts. Mol. Ecol. 1993, 2, 113–118. [Google Scholar] [CrossRef] [Scilit] [PubMed]
- Schacksen, P.S.; Østergaard, S.K.; Eskildsen, M.H.; Nielsen, J.L. Complete Pipeline for Oxford Nanopore Technology Amplicon Sequencing (ONT-AmpSeq): From Pre-Processing to Creating an Operational Taxonomic Unit Table. FEBS Open Bio 2024, 14, 1779–1787. [Google Scholar] [CrossRef] [Scilit]
- Salvadó, Z.; Arroyo-López, F.N.; Guillamón, J.M.; Salazar, G.; Querol, A.; Barrio, E. Temperature Adaptation Markedly Determines Evolution within the Genus Saccharomyces. Appl. Environ. Microbiol. 2011, 77, 2292–2302. [Google Scholar] [CrossRef] [Scilit] [PubMed]
- Langenberg, A.K.; Bink, F.J.; Wolff, L.; Walter, S.; von Wallbrunn, C.; Grossmann, M.; Schmitz, H.P. Glycolytic Functions Are Conserved in the Genome of the Wine Yeast Hanseniaspora uvarum, and Pyruvate Kinase Limits Its Capacity for Alcoholic Fermentation. Appl. Environ. Microbiol. 2017, 83, e01580-17. [Google Scholar] [CrossRef] [Scilit] [PubMed]
- Remize, F.; Sablayrolles, J.M.; Dequin, S. Re-assessment of the influence of yeast strain and environmental factors on glycerol production in wine. J. Appl. Microbiol. 2000, 88, 371–378. [Google Scholar] [CrossRef] [Scilit] [PubMed]
- Moreira, N.; Mendes, F.; De Pinho, P.G.; Hogg, T.; Vasconcelos, I. Heavy sulphur compounds, higher alcohols and esters production profile of Hanseniaspora uvarum and Hanseniaspora guilliermondii grown as pure and mixed cultures in grape must. Int. J. Food Microbiol. 2008, 124, 231–238. [Google Scholar] [CrossRef] [Scilit] [PubMed]
Disclaimer/Publisher’s Note: The statements, opinions and data contained in all publications are solely those of the individual author(s) and contributor(s) and not of MDPI and/or the editor(s). MDPI and/or the editor(s) disclaim responsibility for any injury to people or property resulting from any ideas, methods, instructions or products referred to in the content. |
© 2026 by the authors. Licensee MDPI, Basel, Switzerland. This article is an open access article distributed under the terms and conditions of the Creative Commons Attribution (CC BY) license.