


Abstract
Poly(β-L-malic acid) (PMLA) has attracted considerable industrial attention due to its promising applications in biomedicine, bioplastics, and environmental fields. However, its biosynthesis is highly dependent on elevated dissolved oxygen (DO) levels, while the simultaneous production of pullulan represents a major obstacle. This study introduces a novel strategy to enhance PMLA production in Aureobasidium melanogenum by selectively inhibiting pullulan biosynthesis. We demonstrate that excessive pullulan accumulation severely impairs fermentation performance by significantly reducing oxygen transfer efficiency—an uncharacterized bottleneck in PMLA production. To address this, an ARTP-induced mutant, designated No. H13, was generated, exhibiting an 82.1% reduction in pullulan synthesis. This metabolic shift led to an 86.93% increase in the oxygen mass transfer coefficient (KLa), ultimately enhancing PMLA yield by 72.1% to 45.0 g/L with a specific production of 1.09 g/g. Transcriptomic analysis suggested a potential redirection of carbon flux toward PMLA biosynthesis through coordinated up-regulation of glycolysis and TCA cycle genes, alongside down-regulation of gluconeogenesis and pullulan-exporting ABC transporters. This work presents an alternative to enzymatic approaches by employing a consolidated mutagenesis strategy to reconfigure metabolic networks, offering a strategy for PMLA overproduction.
1. Introduction
Poly(β-L-malic acid) (PMLA) is a water-soluble biopolymer composed of L-malic acid monomers connected by ester linkages. It has attracted considerable industrial interest due to its potential applications in biomedical, bioplastic, and environmental fields [1,2]. PMLA is biosynthesized by diverse phylogenetic clades of Aureobasidium spp. under aerobic conditions [3,4], with high dissolved oxygen (DO) levels (>70%) generally favoring its production [5]. Notably, Aureobasidium spp. also simultaneously synthesize substantial amounts of pullulan [6,7,8], an exopolysaccharide known for its thermal stability, film-forming capacity, solubility, adhesiveness, and antioxidant properties. Pullulan accumulates as an extracellular amorphous slime [9,10], imparting high viscosity and heat resistance, which can impede oxygen transfer in the fermentation broth. To date, the specific influence of pullulan on PMLA biosynthesis remains incompletely understood.
Divergent perspectives exist regarding the biosynthesis of pullulan and PMLA by A. melanogenum. A prominent viewpoint posits that their production is intrinsically linked, a theory supported by successful co-production strategies. For instance, the addition of 0.05% Tween 80 was shown to enhance the co-production of both polymers, yielding 46.45 g/L of PMLA and 28.8 g/L of pullulan at 60 h in a 5 L fermenter, which represented increases of 75.08% and 27.21%, respectively, compared to the control [11]. Similarly, a dissolved oxygen (DO)-shift control strategy was employed to boost PMLA titers to 118.6 g/L without compromising pullulan production (27.2 g/L) [5]. Conversely, an alternative school of thought suggests a competitive relationship between the two metabolic pathways, particularly when carbon source shifts are applied. In one study, replacing glucose with a Jerusalem artichoke medium in a 5 L bioreactor resulted in a high PMLA concentration of 114.4 g/L but a substantially lower pullulan yield of 14.3 g/L [12]. This shift was accompanied by a significant increase in the activities of key PMLA synthesis enzymes (pyruvate carboxylase and malate dehydrogenase), while the activities of pullulan synthesis-related enzymes (α-phosphoglucose mutase, UDP-glucose pyrophosphorylase, and glucosyltransferase) remained unaffected. These findings imply that altering the carbon source can modulate metabolic flux, potentially by improving oxygen transfer conditions favorable for PMLA synthesis, thereby diverting resources away from pullulan production.
Furthermore, various genetic engineering strategies have been proposed to enhance PMLA production in Aureobasidium spp. In one study, A. melanogenum ZX-10 was engineered to overexpress the endogenous PMLA synthetase (PMS) along with heterologous cytosolic malate dehydrogenase (MDH) and pyruvate carboxylase (PYC) from Aspergillus oryzae, using a high-copy yeast episomal plasmid driven by the gpdA promoter from Aspergillus nidulans. This approach increased the PMLA yield by 19–37% (0.64–0.74 g/g, compared to 0.54 g/g in the wild type), underscoring the critical role of the reductive tricarboxylic acid (rTCA) pathway in PMLA biosynthesis [13]. In another example, overexpression of the exogenous cnb gene from Beauveria bassiana in mutant strain AE59 enabled the production of 49.47 g/L PMLA from waste xylose-containing mother liquor, with a yield of 0.33 g/g, highlighting the importance of the calcineurin signaling pathway [14]. Additionally, the GATA-family transcription factor Gat1 was shown to regulate PMLA biosynthesis: its overexpression increased PMLA production by 11.2%, while its knockout reduced production to 49.1% of the original level [15]. These varied outcomes from different genetic modifications reflect the complexity of metabolic regulation in Aureobasidium spp. Beyond targeted genetic engineering, non-targeted mutagenesis techniques such as Atmospheric and Room Temperature Plasma (ARTP) have gained attention for microbial breeding. ARTP efficiently induces diverse DNA damage, leading to high mutation rates and genetically stable mutants [16], and this mutation is non-targeted. For instance, an ARTP-derived A. melanogenum (M233-20) produced 162.3 g/L pullulan in a 30 L bioreactor, with a yield of 0.82 g/g glucose [17]. This success suggests the potential of using ARTP to generate low-pullulan mutants for redirecting metabolic flux toward PMLA. However, the application of ARTP mutagenesis specifically for enhancing PMLA production has not yet been reported.
In this study, we first systematically evaluated the effect of pullulan accumulation on PMLA production. Building on this insight, we then applied ARTP mutagenesis to generate a mutant library and screened for high-PMLA-producing variants. Finally, to elucidate the underlying regulatory mechanisms, we performed transcriptomic profiling of phenotypically divergent mutants, thereby assessing the global impact of ARTP-induced mutagenesis on the transcriptional landscape of A. melanogenum.
2. Materials and Methods
2.1. Microorganism, Media and Cultivation Conditions
A. melanogenum ipe-1 (CGMCC no. 23225) used in this study was stored in China General Microbiological Culture Collection Center, Beijing, China. Cultivation conditions and the medium for PMLA production were the same as described by Yu et al. [18], with minor modifications. Specifically, the seed culture was grown at 25 °C and 200 rpm for 48 h. The 5 L bioreactor fermentation was performed for 96 h at 800 rpm and an aeration rate of 2 vvm. The compositions (w/v) of the seed culture medium were as follows: 8% glucose, 0.2% NaNO3, 0.01% KH2PO4, 0.02% MgSO4·7H2O, 0.05% KCl and 0.1% tryptone (LP0042, Oxoid Ltd., Basingstoke, Hampshire, UK) in deionized water. The compositions of the fermentation medium in flasks were the same as the seed culture except for the addition of 15 g/L CaCO3. For the production of PMLA in the 5 L bioreactor (Biotech-5JG, Shanghai Baoxing Biology Equipment Engineering Co., Ltd., Shanghai, China), the following medium was used (w/v): 16% glucose, 1.5% tryptone, 0.2% NaNO3, 0.05% KH2PO4, 0.02% MgSO4·7H2O, and 0.05% KCl in deionized water.
2.2. ARTP Mutagenesis and Screening Methods for Stable Strains
The 48 h seed culture (50 mL), with an initial cell density of 3.75 mg/mL (dry biomass), was centrifuged at 10,730× g for 10 min. After discarding the supernatant, the cell pellet was directly resuspended in 50 mL of sterile saline within a 50 mL centrifuge tube, resulting in a final cell density of 3.1 mg/mL. Subsequently, a 20 μL aliquot of this fungal suspension (~62 μg dry biomass) was evenly spread onto a sterile metal plate (6 mm in diameter) and allowed to air-dry. Mutagenesis was performed for predetermined time intervals, followed by cell recovery with 5 mL of saline. For high-yielding strain screening, the mutant suspension was diluted 50-fold, spread onto Trypan blue screening plates, and incubated for 3–5 d; colonies displaying a darker blue color were selected as presumptive high-yielding strains. Finally, PMLA production was verified by shake-flask fermentation, and yield stability was monitored by successive subculturing (5 generations). To ensure reproducibility, the same culture and preparation protocol was used for all mutation experiments.
For transcriptome analysis, fermentation broths from the high-yield mutant and the original strain were collected at 40 h and 72 h. The harvested cells were washed three times by centrifugation at 10,730× g, snap-frozen in liquid nitrogen, and stored at −80 °C (three biological replicates for each group). The frozen samples were then sent to Majorbio (Beijing, China), where mRNA isolation, library construction, and high-throughput sequencing (RNA-Seq) were performed.
2.3. Analytical Methods
The culture broth (8 mL) was centrifuged in a high-speed centrifuge (4–16 K, Sigma, Roedermark, Germany) at 10,000× g for 8 min and the resulting supernatants were used for the measurements of PMLA, glucose and free exopolysaccharides (EPSs). For the measurement of Biomass, the cells were washed three times with 8 mL of distilled water, dried to constant weight at 90 °C. The EPS in the first 8 mL washing water was defined as the EPS located on the cell surface (i.e., the EPS in the Figures). The EPS and free EPS were measured by the phenol-sulfuric acid method,. PMLA was measured as described by Cao et al. [19]. The culture supernatant was mixed with an equal volume of 2 M H2SO4 and hydrolyzed at 90 °C for 12 h. After neutralization, the released L-malic acid was quantified by HPLC as described above. Differently, the concentration of L-malic acid was measured by a HPLC apparatus (Shimadzu LC20AT, Kyoto, Japan) equipped with two Aminex HPX-87H ion exclusion columns (Bio-Rad, Hercules, CA, USA) in series. The process was performed at a temperature of 60 °C, 210 nm and a flow rate of 0.4 mL/min with 0.75 mmol/L H2SO4 as moving phase. The concentrations of glucose were measured by the same HPLC apparatus and Aminex HPX-87N ion exclusion columns at 60 °C, 0.6 mL/min with pure water as moving phase using refractive index detector (RI).
2.4. KLa Measurement
The volumetric oxygen mass transfer coefficient (KLa) was determined dynamically in the 5 L bioreactor (800 rpm, 2 vvm) using a polarographic DO electrode (OxyProbe II, Broadley-James Corp., Irvine, CA, USA). Abiotic KLa was measured via the standard dynamic gassing-out method. For the biotic phase, a modified graphical dynamic method [20,21] was applied to account for the increasing broth viscosity and to simultaneously determine KLa and dynamic saturated DO (C*). Detailed protocols and mathematical derivations are provided in the Supplementary Information (Text S1 and Figure S1).
2.5. Statistical Analysis
All shake-flask fermentation experiments were performed in triplicate (n = 3), while bioreactor fermentations were performed in duplicate (n = 2). Statistical differences between experimental groups were evaluated by one-way analysis of variance (ANOVA) followed by Tukey’s post hoc test using OriginPro 2018 software (Origin Lab Corporation, Northampton, MA, USA) at a 95% confidence level. Data are expressed as the mean ± standard deviation (SD).
3. Results and Discussion
3.1. Effect of Exogenous Pullulan and Pullulanase on PMLA Production
3.1.1. Effect of Exogenous Pullulan on PMLA Production
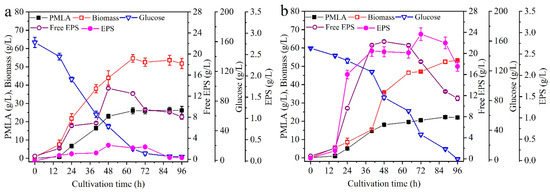
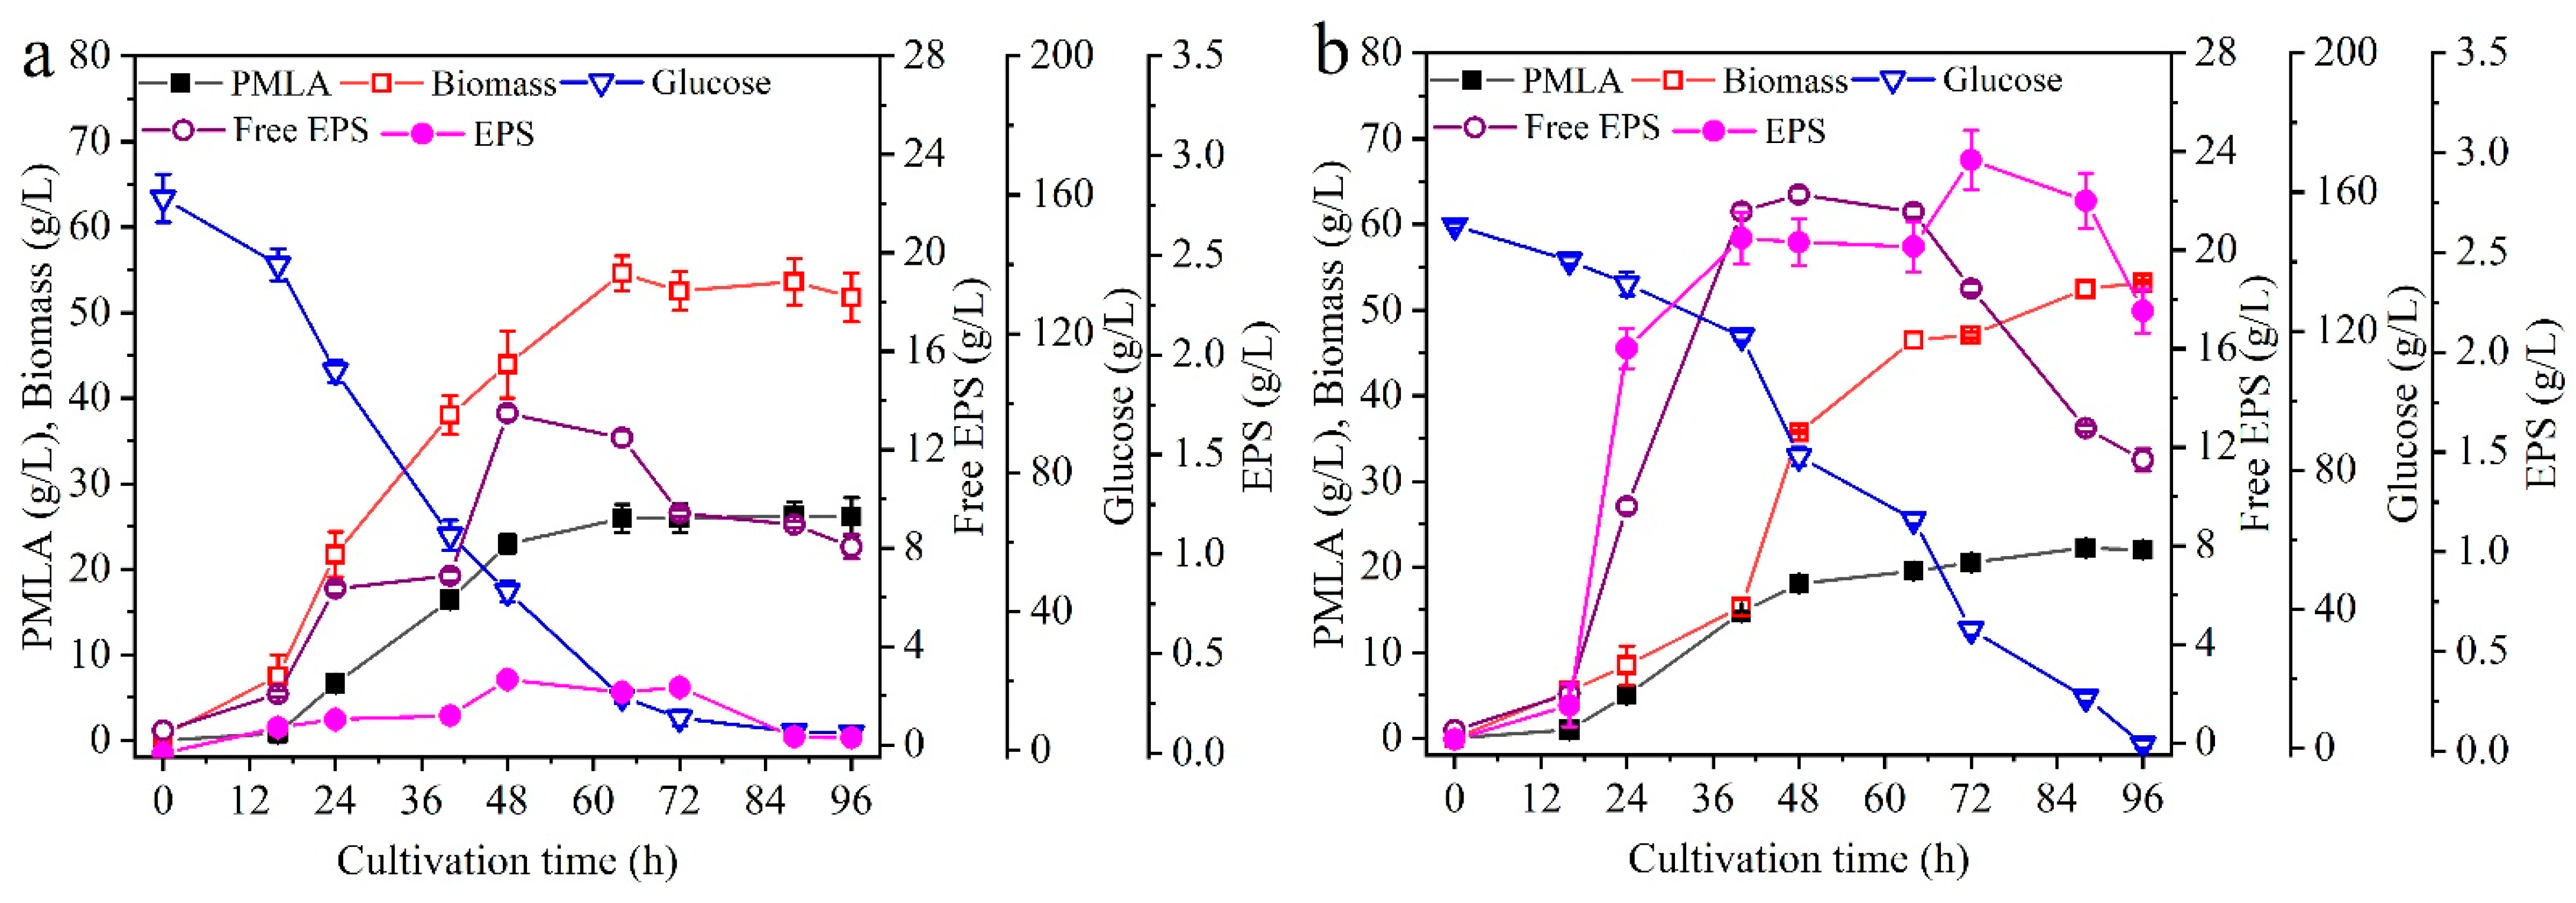
The kinetics of PMLA production by the strain ipe-1 are shown in Figure 1a. Both PMLA production and cell growth increased rapidly until 64 h, after which no significant changes were observed. Glucose was rapidly consumed before 72 h, after which the assimilation rate slowed as the residual glucose concentration fell below 10 g/L. Beyond 64 h, the consumed EPS and glucose were primarily utilized to sustain basic cellular activities or for the synthesis of other unidentified products. The produced EPS may accumulate as an extracellular amorphous slime [9,10], potentially hindering the release of PMLA into the broth—a hypothesis that will be further investigated in the following section. The maximum concentrations achieved were 26.2 g/L for PMLA, 54.6 g/L for biomass, 13.5 g/L for free EPS, and 0.37 g/L for EPS.
Figure 1.
Kinetics of PMLA production by the strain ipe-1 (a), the strain ipe-1 with a final concentration of 5.6 g/L pullulan added at 24 h (b). Data are given as mean ± SD, n = 2.
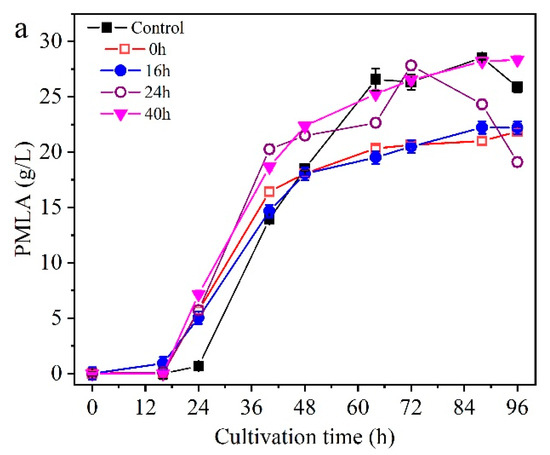
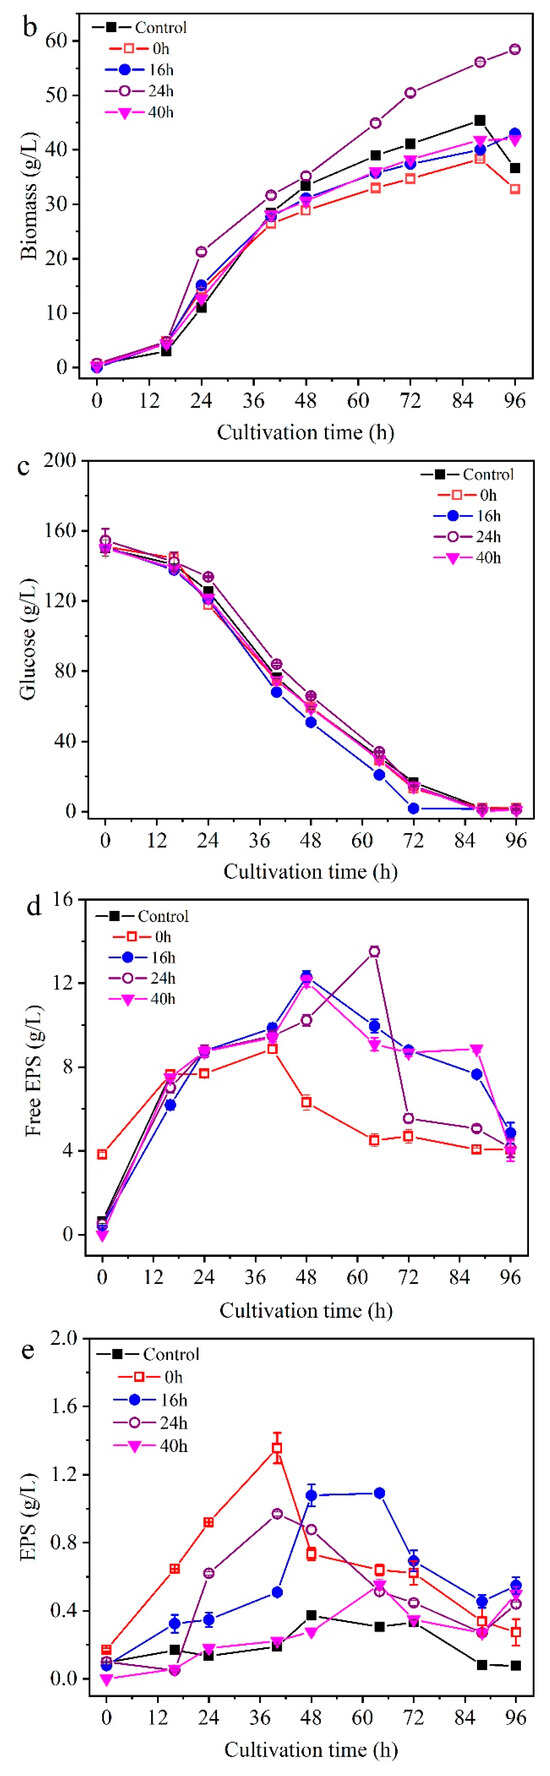
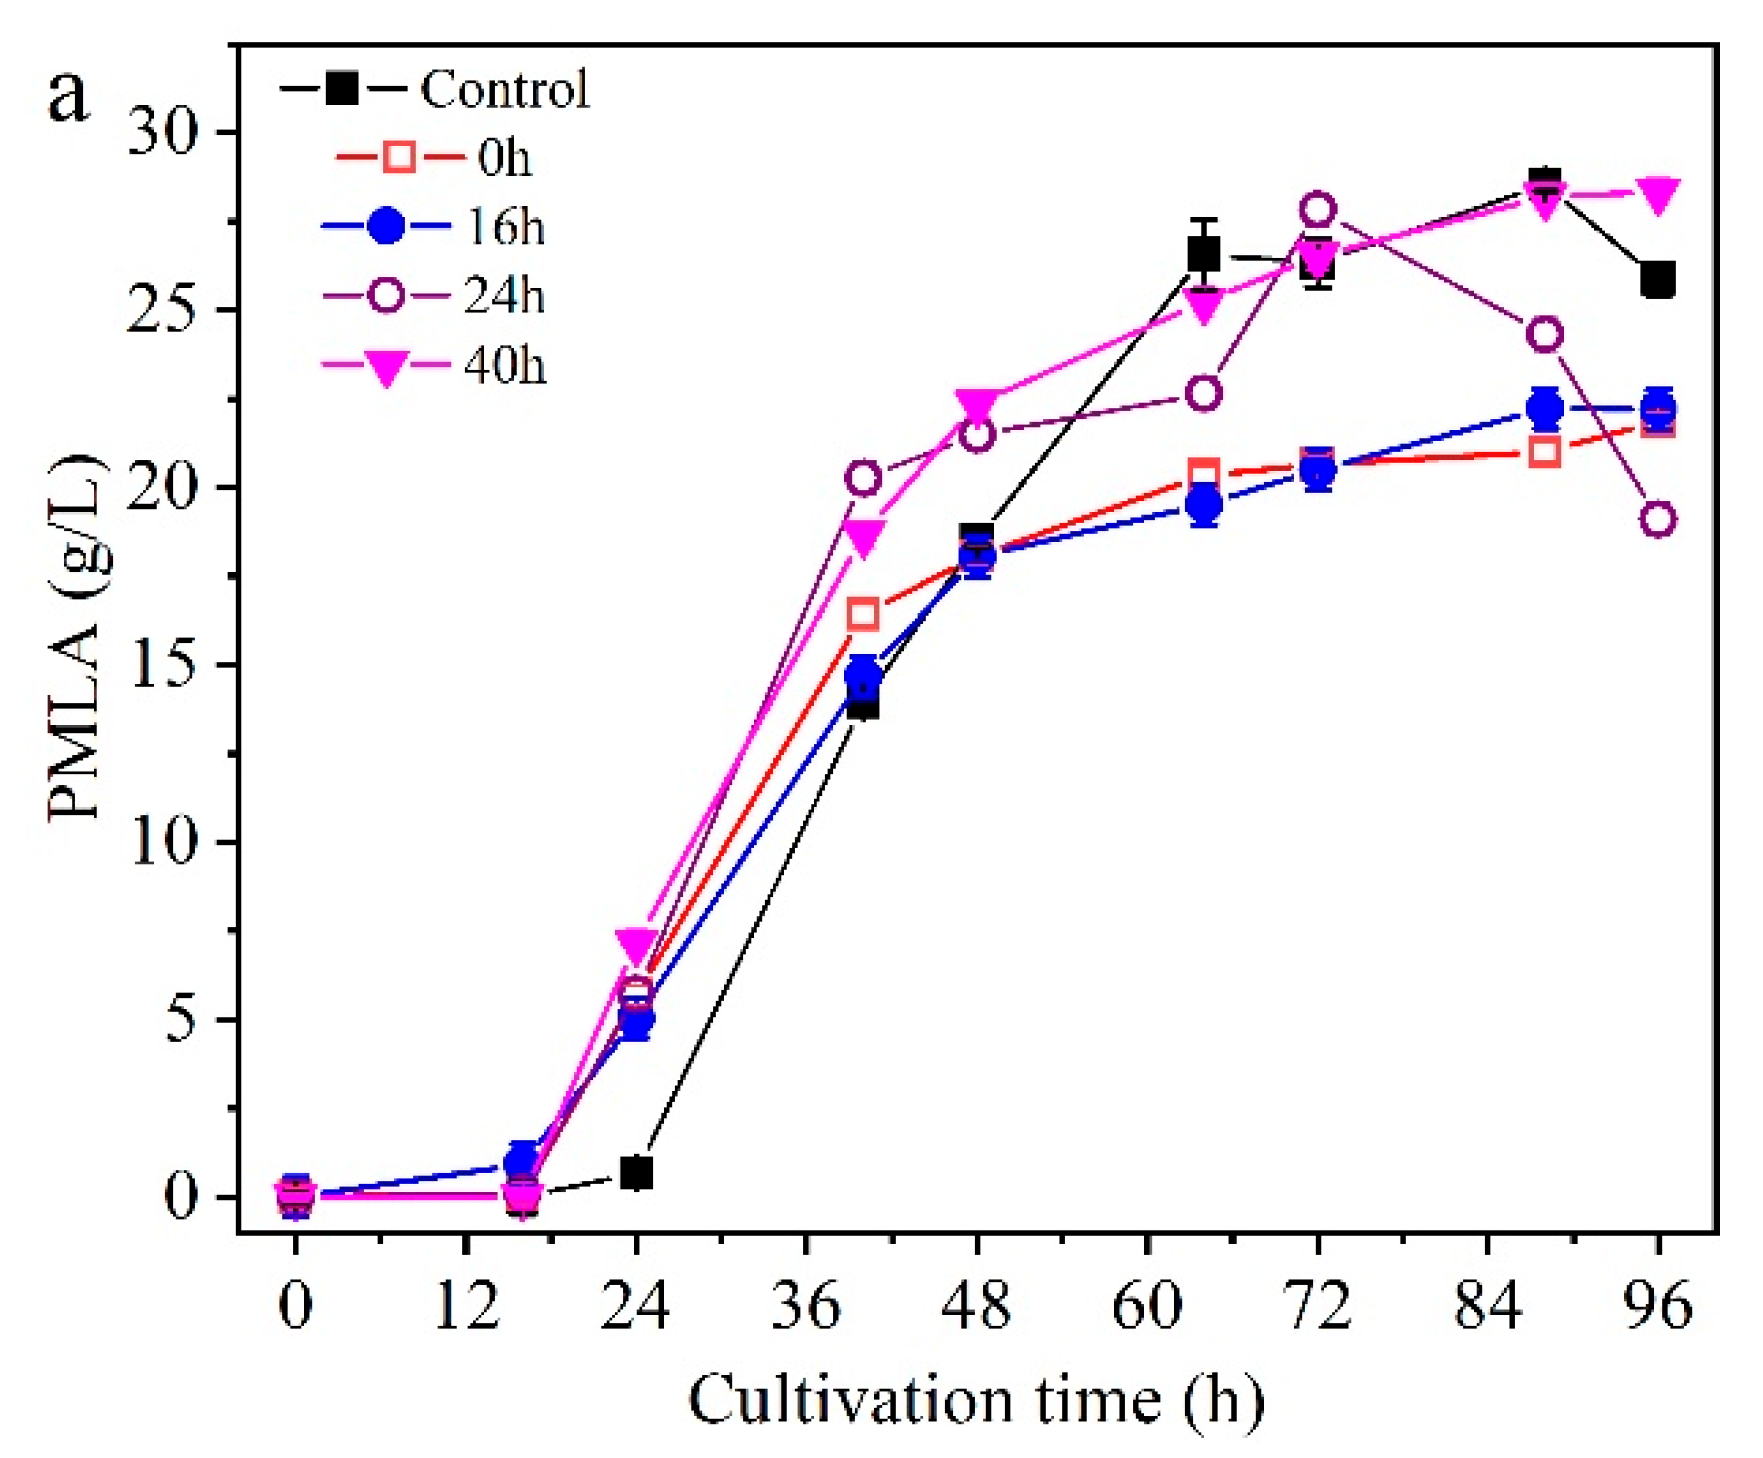
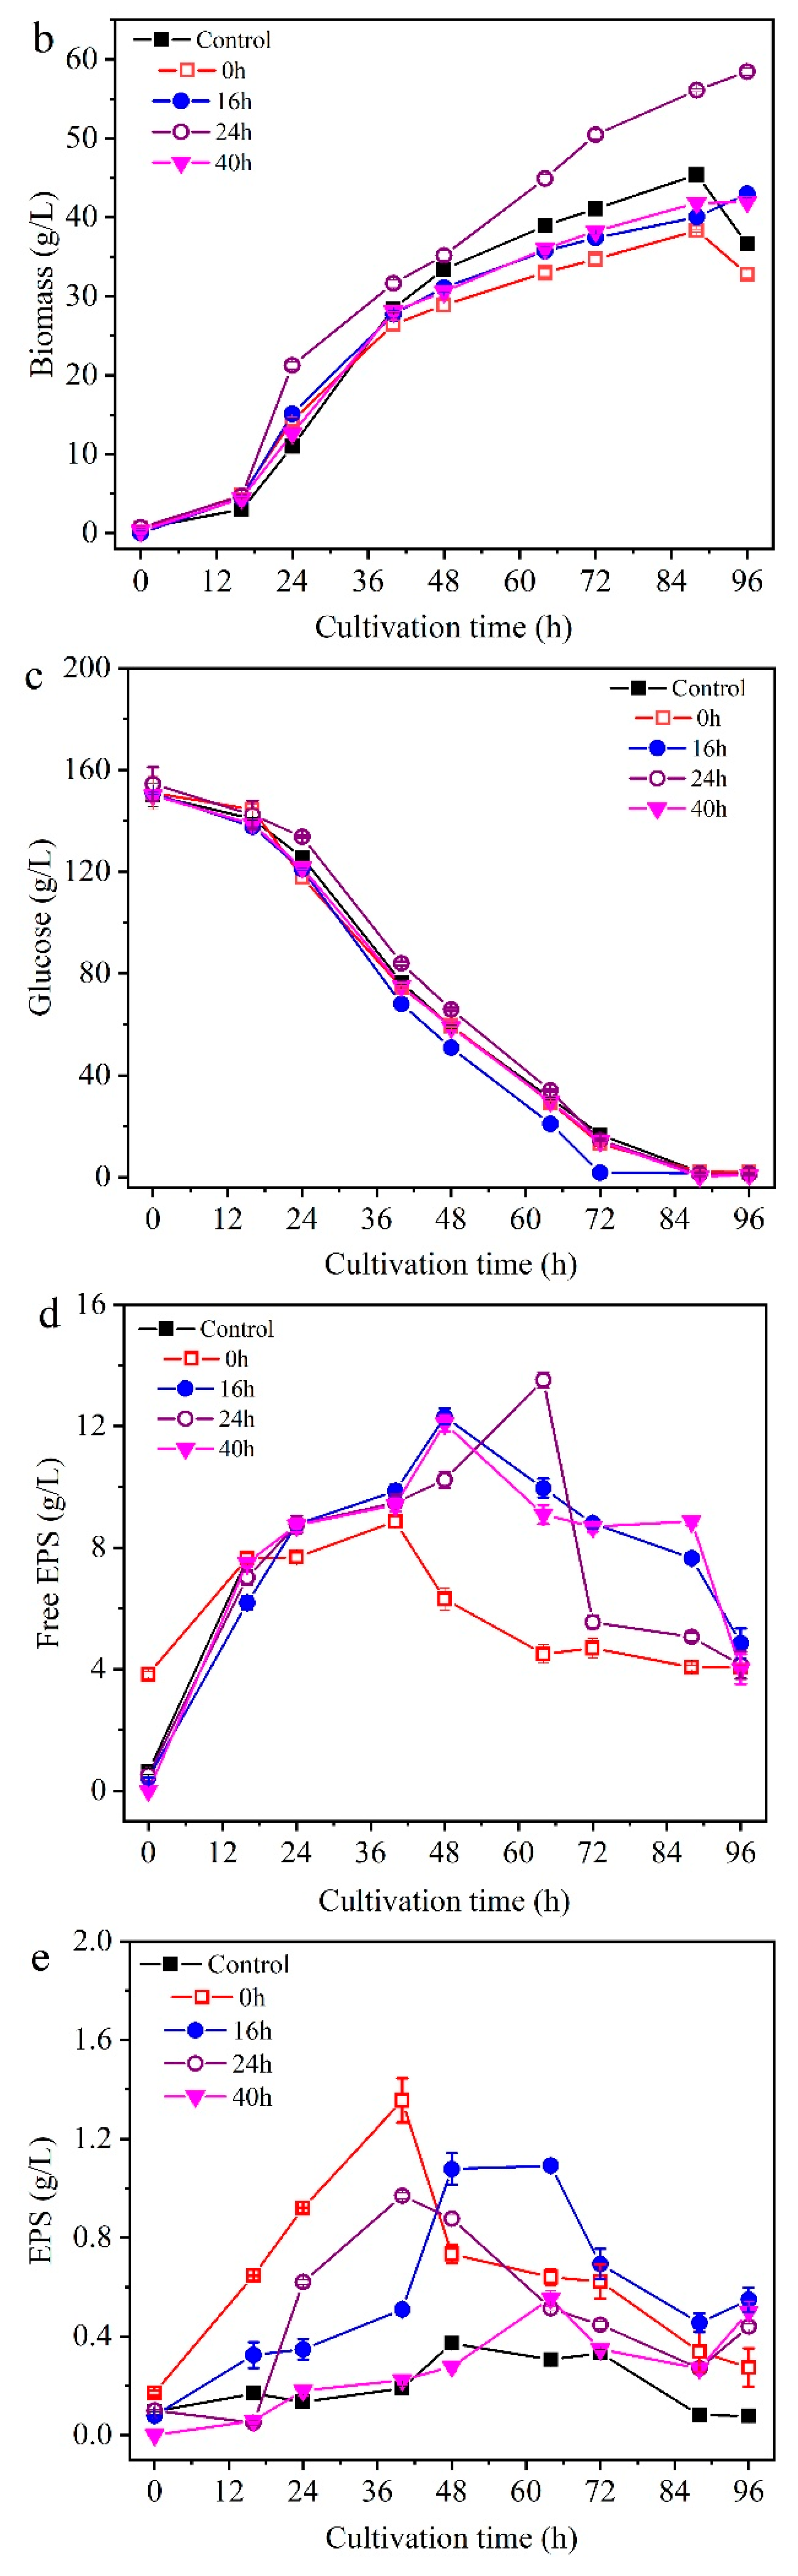
To elucidate the mechanism by which EPS affects PMLA production, exogenous pullulan was added to a final concentration of 5.6 g/L at 24 h (Figure 1b). At this time point, the endogenous EPS produced by the strain was 6.52 g/L, making the total EPS concentration comparable to the endogenous EPS level observed at 64 h in the control (Figure 1a). This intervention resulted in a maximum PMLA concentration of 22.2 g/L, representing a 15.3% decrease compared to the control. In contrast, the concentrations of free EPS and cell-bound EPS increased significantly by 22.8% and 7-fold, respectively, reaching 22.2 g/L and 2.96 g/L, while biomass was 53.2 g/L. To further assess the temporal effect of EPS, pullulan was added at different time points. The maximum PMLA concentrations were 21.8, 22.2, 27.8, and 28.1 g/L when pullulan was supplemented at 0, 16, 24, and 40 h (Figure 2a), respectively. These results indicate that the premature increase in broth viscosity caused by early EPS accumulation imposes severe physical mass-transfer constraints, which significantly hinder PMLA production. This suggests that particular attention should be paid to the seed culture and early fermentation phase to control initial EPS formation. Analysis of EPS dynamics revealed that early addition (0 h) induced substantial EPS accumulation on the cells, which subsequently declined earlier. When added at 16 h, EPS on the cell surface increased gradually until 64 h, implying a more prolonged impact. This demonstrates that both cell-bound and free EPS can inhibit PMLA production (Figure 2d,e). Furthermore, the observed spontaneous reduction in EPS concentration suggests that the strain synthesizes polysaccharide-degrading enzymes. Given that Aureobasidium spp. are known to produce pullulanase in large quantities [22,23,24], this enzyme is a likely candidate for EPS degradation—a hypothesis that will be investigated in the following section.
Figure 2.
Effect of pullulans added at different times on PMLA production by the strain ipe-1. (a) PMLA concentration; (b) biomass concentration; (c) residual glucose concentration; (d) free EPS concentration; and (e) EPS concentration. Data are given as mean ± SD, n = 2.
3.1.2. Effect of Exogenous Pullulanase on PMLA Production
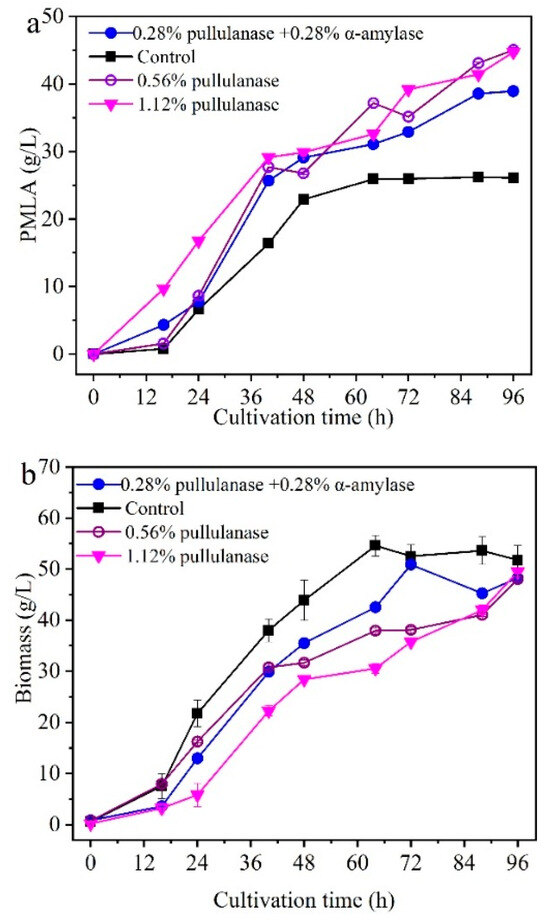
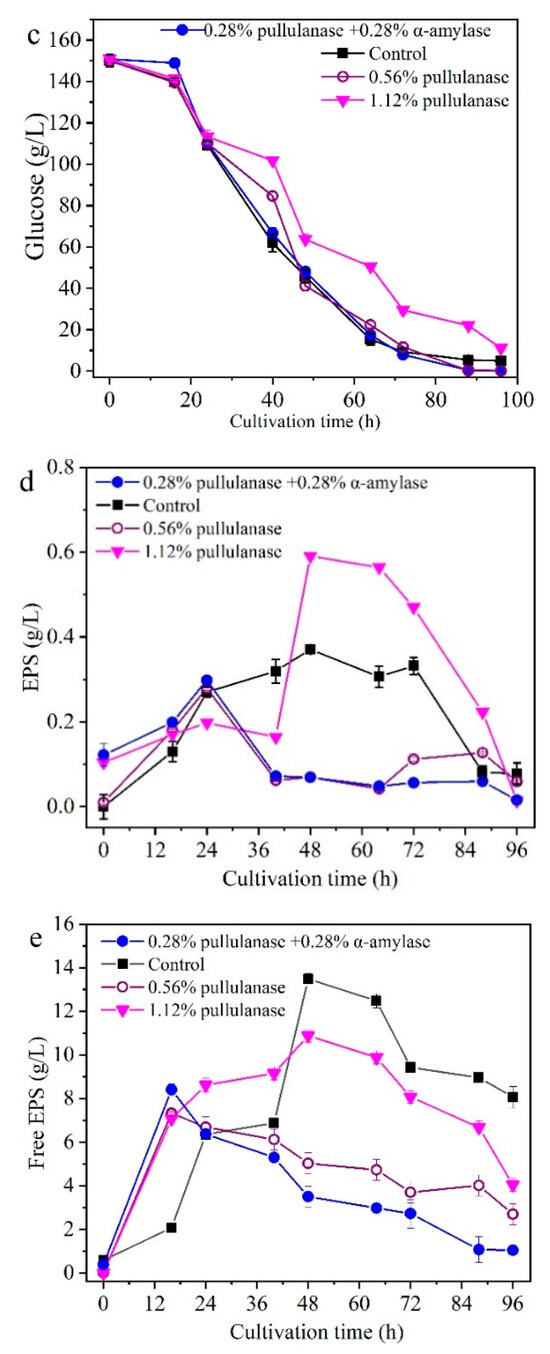
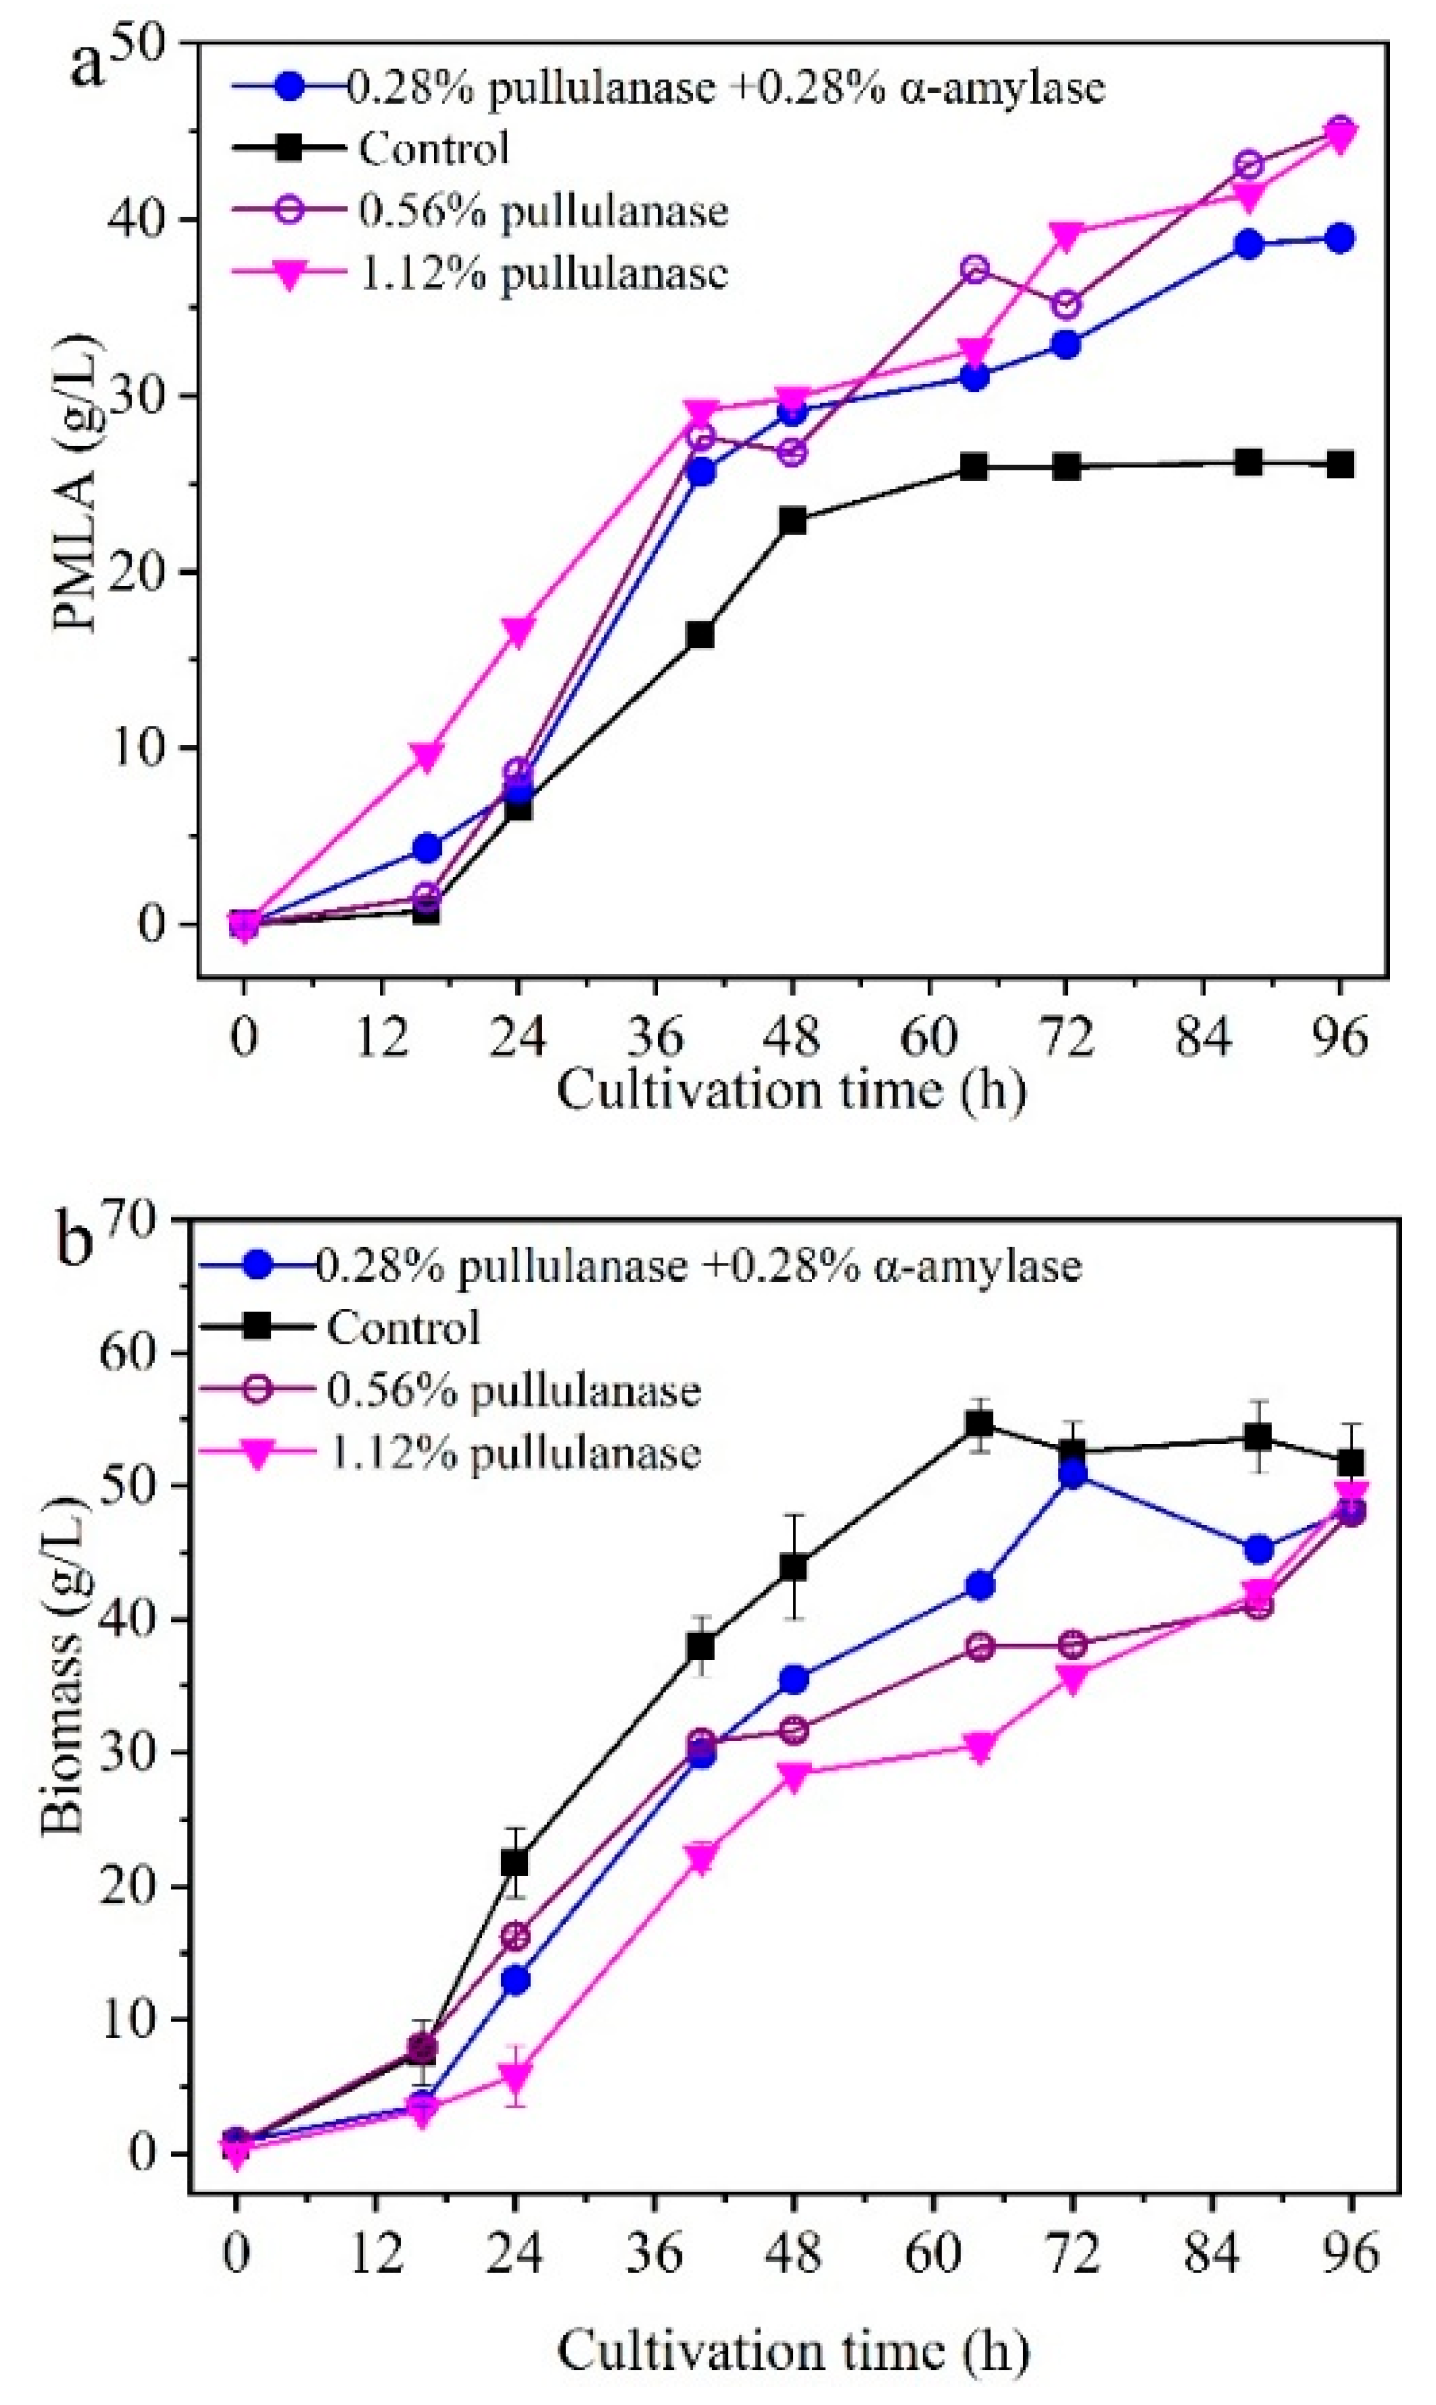
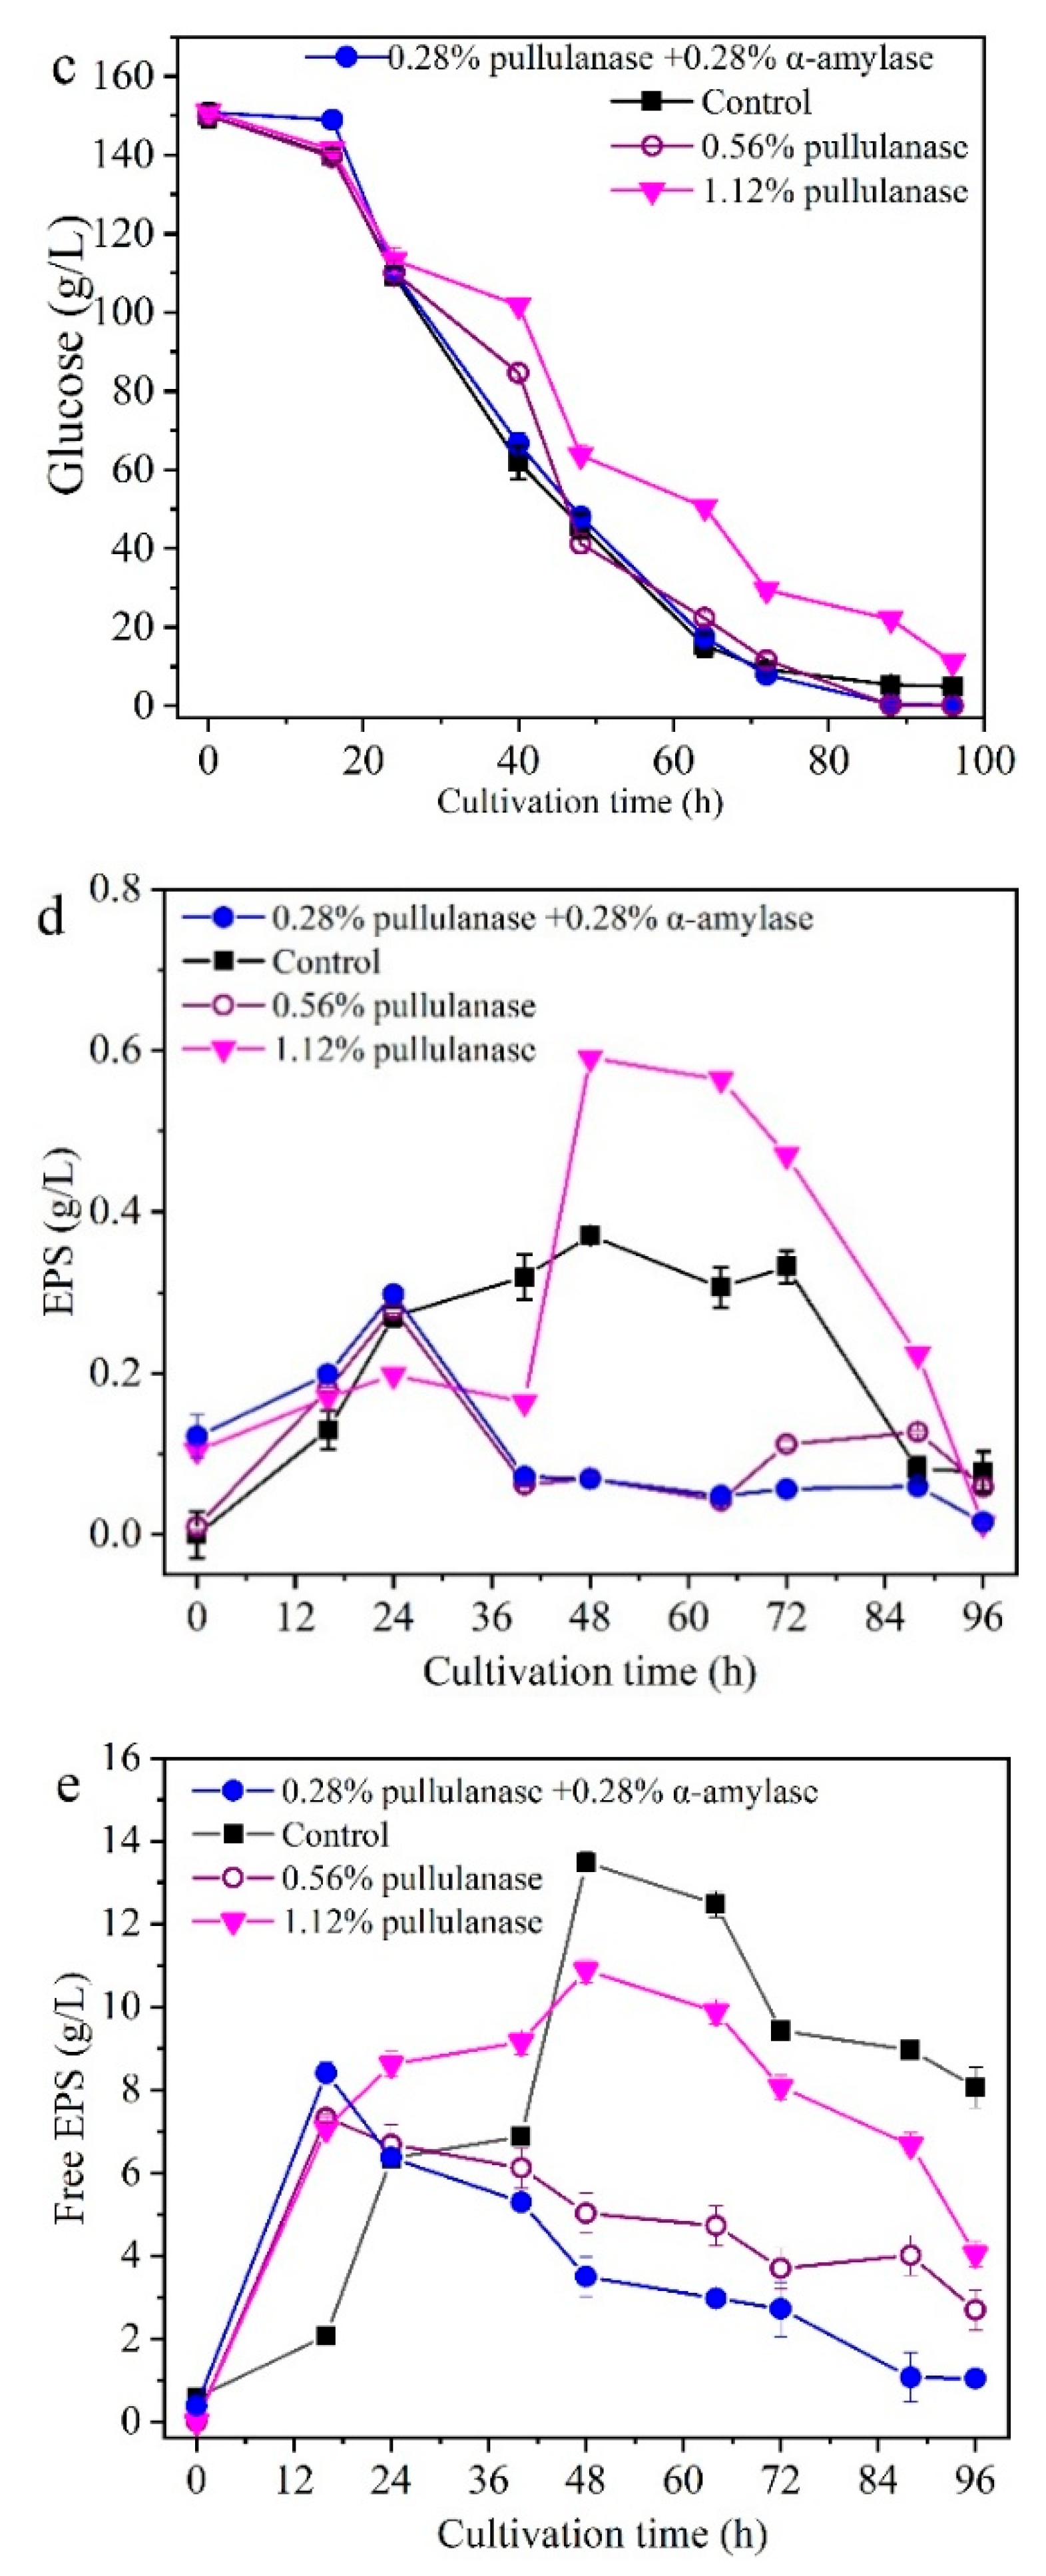
To further elucidate the mechanism by which EPS influences PMLA production, exogenous pullulanase was added to the culture broth at 24 h (Figure 3). The addition of 0.56% (v/v) exogenous pullulanase resulted in a maximum PMLA concentration of 45.0 g/L, which was 71.8% higher than that of the control. In contrast, biomass, free EPS, and cell-bound EPS concentrations decreased significantly—by 6.8%, 50.5%, and 24.3%, respectively. However, when the pullulanase dosage was further increased to 1.12% (v/v), no further enhancement in PMLA production was observed, nor were additional reductions in free or cell-bound EPS detected. Previous studies have reported that enzymes such as α-amylase, glucoamylase, and isopullulanase regulate the molecular weight of pullulan synthesized by A. melanogenum P16 [22]. Therefore, in a separate experiment, 0.28% (v/v) of the pullulanase in the 0.56% pullulanase treatment was replaced with 0.28% (v/v) α-amylase. Although free EPS was further reduced, cell-bound EPS levels remained similar to those in the 0.56% (v/v) pullulanase treatment, and PMLA production decreased. These results suggest that cell-bound EPS has a more pronounced influence on PMLA production.
Figure 3.
Effect of pullulanase added amount at 24 h on PMLA production by the strain ipe-1. (a) PMLA concentration; (b) biomass concentration; (c) residual glucose concentration; (d) EPS concentration; and (e) free EPS concentration. Data are given as mean ± SD, n = 2.
3.2. ARTP Mutagenesis Combining Trypan Blue Plate for Screening High PMLA Producers
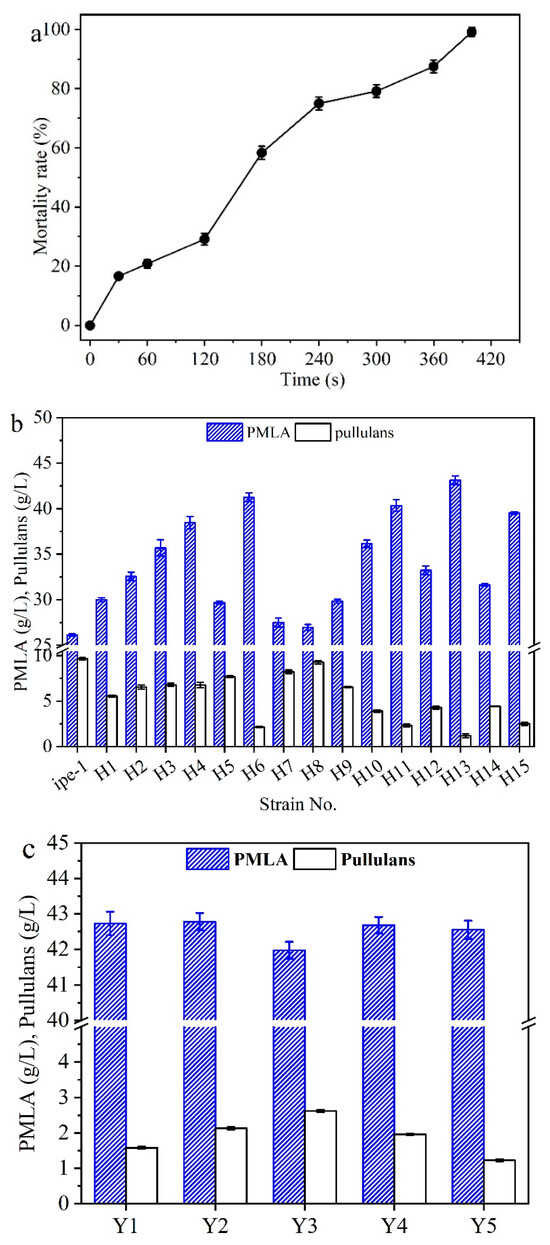
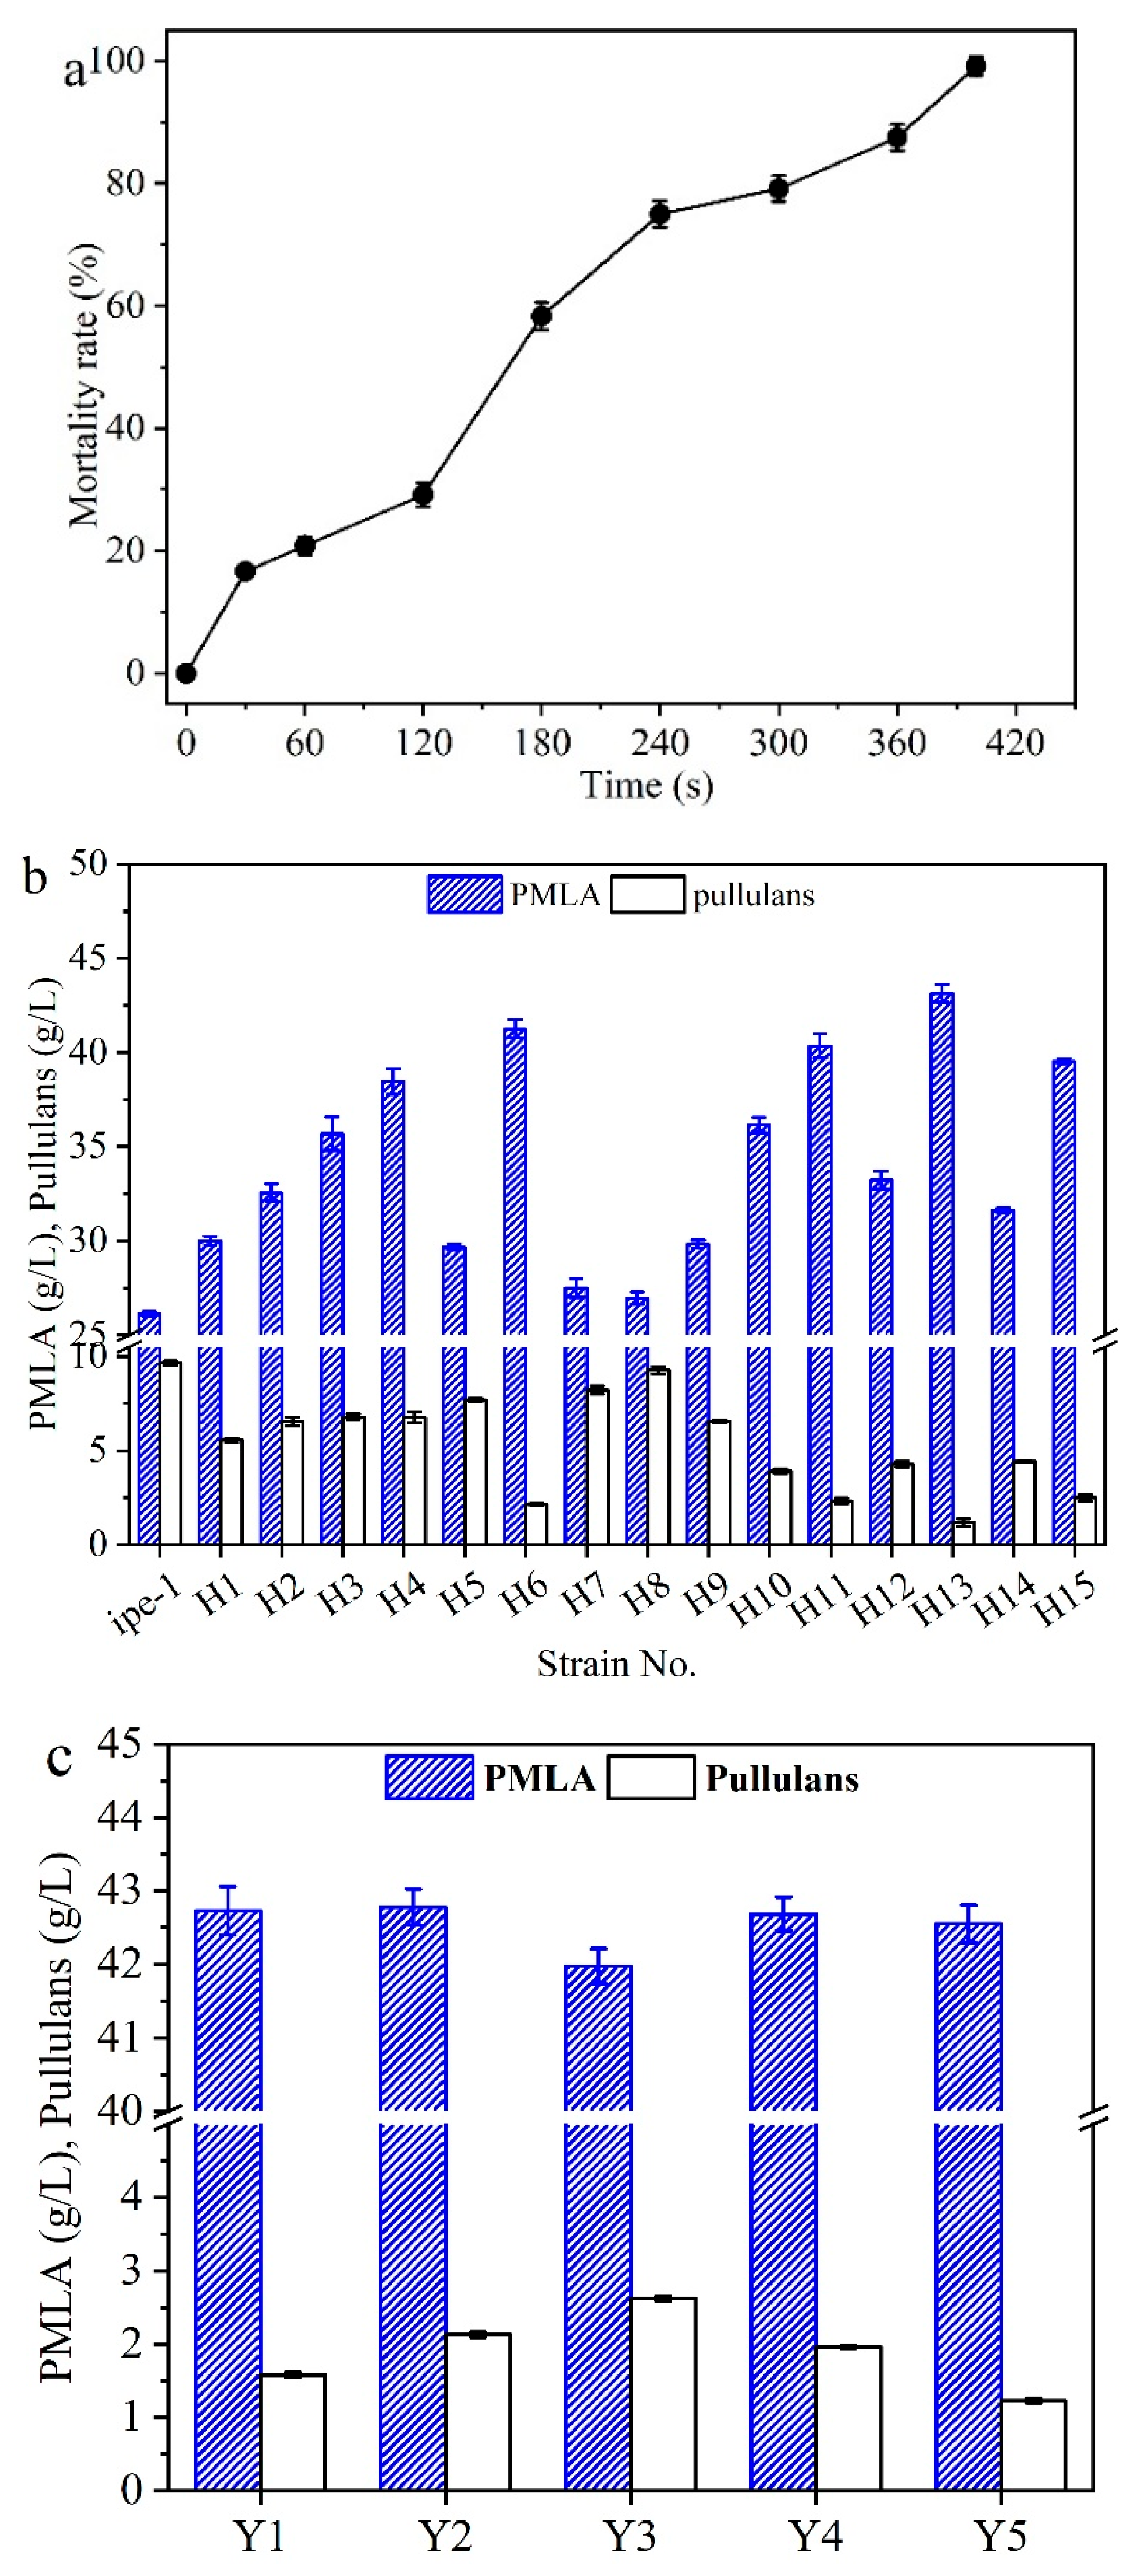
Random mutagenesis is an effective strategy for obtaining high-yield microbial strains [25]. For instance, a high pullulan-producing strain of A. melanogenum was previously obtained using ARTP mutagenesis [26]. In this study, to screen for a high-yielding PMLA producer, A. melanogenum ipe-1 was used as the starting strain and subjected to ARTP mutagenesis. As shown in Figure 4a, the mortality rate was statistically analyzed over treatment durations ranging from 0 to 400 s. The mortality rate increased rapidly with prolonged treatment time and reached nearly 100% at 400 s. To achieve a significant mutagenic effect, a treatment duration of 240 s was selected for subsequent experiments, corresponding to a mortality rate of approximately 75%.
Figure 4.
PMLA high-yielding strains were obtained by ARTP mutagenesis. (a) The mortality rate of ARTP mutagenesis. (b) The production of PMLA from 15 mutant strains and original strain (ipe-1). (c) Generation stability of the strain No. H13. data are given as mean ± SD, n = 3.
After ARTP treatment for 240 s, mutant strains were primarily screened on Trypan blue plates to identify isolates with low total polysaccharide production. A total of 15 mutants exhibiting relatively high PMLA yields were selected and further verified by flask fermentation (Figure 4b). Among these, strain No. H13 showed a significantly higher PMLA yield—65% greater than that of the original strain. Furthermore, the high-yielding strains underwent five successive subcultures to evaluate production stability. As shown in Figure 4c, the PMLA yield of strain No. H13 remained stable with no significant difference over five generations. Therefore, strain No. H13 was selected as a high-yielding and genetically stable candidate. These results are consistent with previous reports on obtaining high pullulan-producing A. melanogenum strains via ARTP mutagenesis [26]. This study demonstrates that ARTP mutagenesis is a highly suitable method for generating mutant strains of A. melanogenum, and that combining it with Trypan blue plate screening provides an efficient strategy for obtaining superior PMLA-producing strains. Nevertheless, the randomness of ARTP mutagenesis implies potential off-target mutations warranting genome sequencing, and future batch fermentation studies are needed to assess scalability and long-term stability beyond five generations.
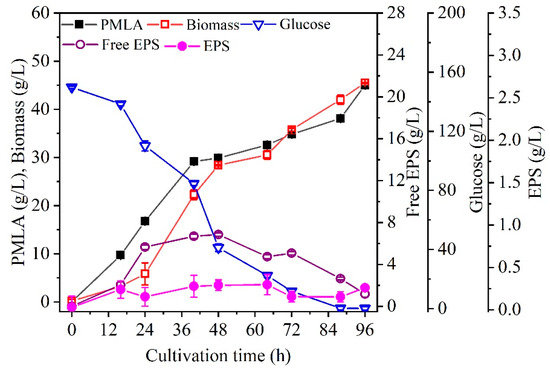
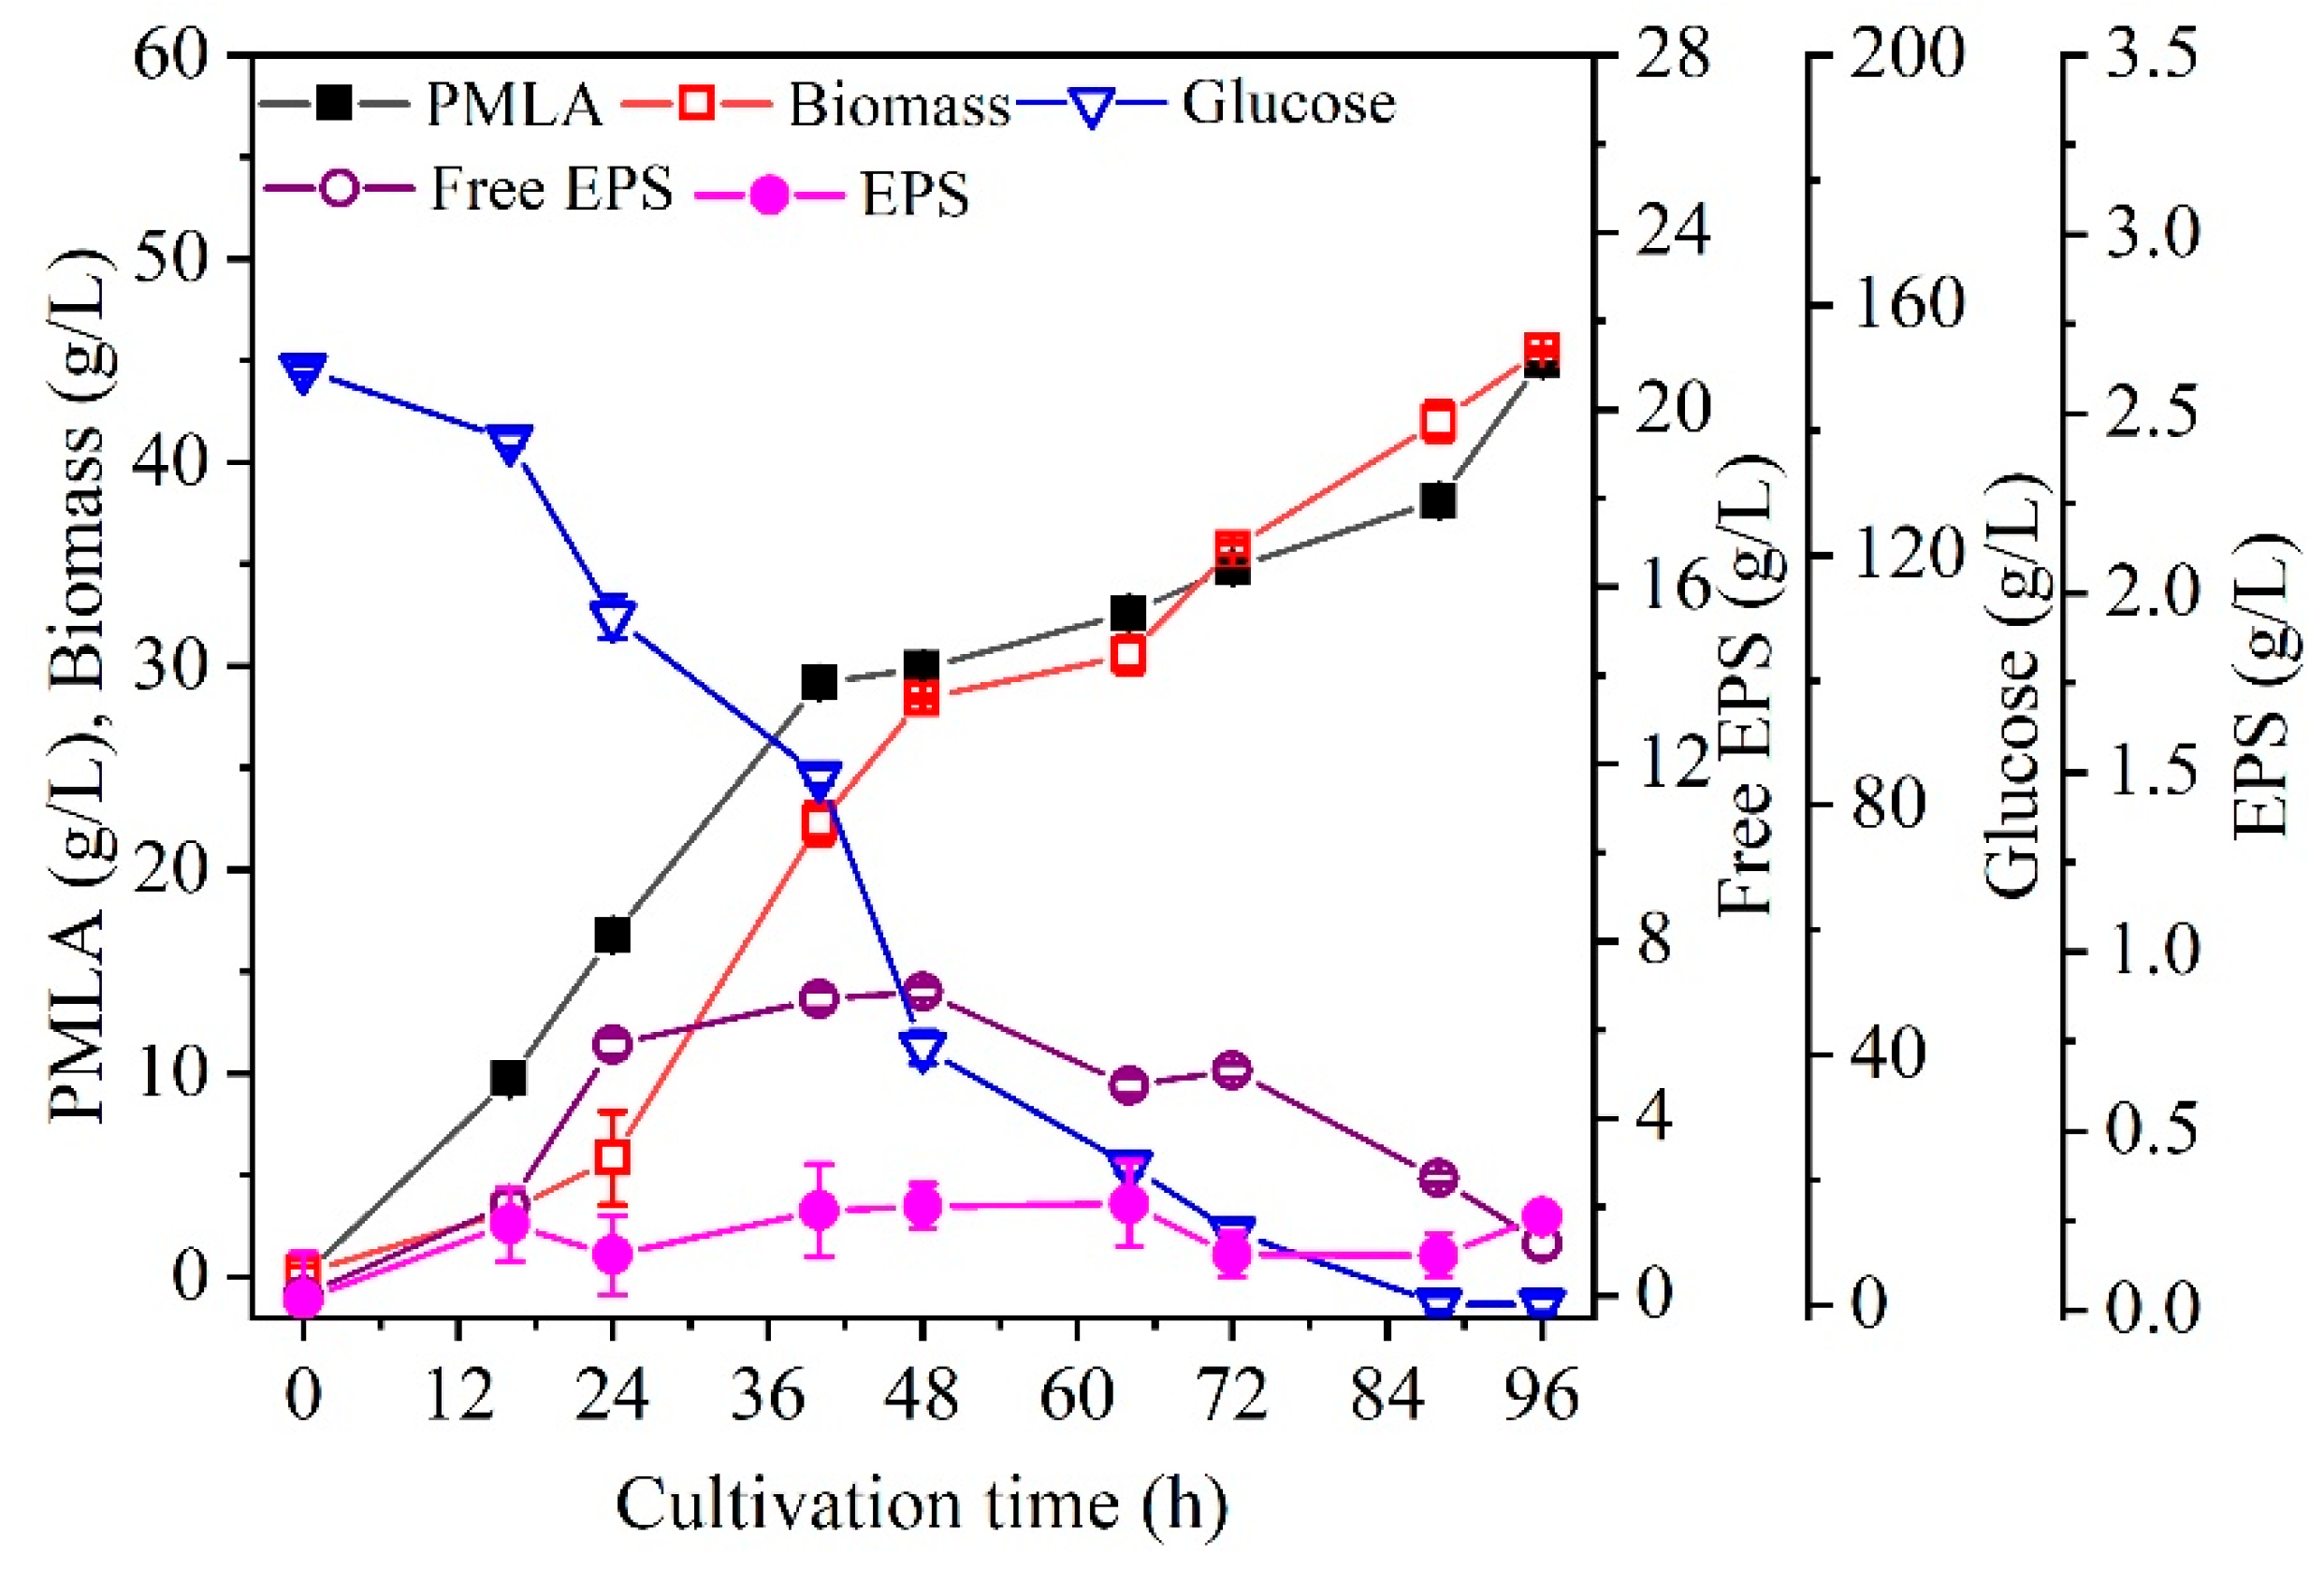
To further evaluate the properties of PMLA production by strain No. H13, the kinetics of PMLA synthesis using the mutant strain H13 were investigated in a 5 L bioreactor. As shown in Figure 5, both PMLA production and cell growth increased rapidly up to 40 h, showing a linear trend, after which the rate slowed down, forming a second linear phase with a lower slope—a pattern distinct from that in Figure 1a. In contrast, free EPS increased rapidly during the first 24 h. Following a slight decrease, it reached its maximum at 48 h and then began to decline, while EPS remained at a relatively low concentration throughout the 96 h cultivation period. The final PMLA concentration reached 45.0 g/L, representing a 71.8% increase compared to that in Figure 1a. On the other hand, the final concentrations of biomass and total EPS were 45.5 g/L and 1.44 g/L, respectively, corresponding to decreases of 16.7%, 49.6%, and 82.1%. These results suggest that the reduction in total EPS may have improved the oxygen transfer coefficient (KLa), or that ARTP mutagenesis altered the metabolic flux distribution in strain ipe-1. This hypothesis will be further examined in the following section.
Figure 5.
Kinetics of PMLA production by the mutant strain No. H13. Data are given as mean ± SD, n = 2.
3.3. Unraveling the Effect of ARTP Mutagenesis on PMLA Production
3.3.1. The Effect of Pullulan on the Variation of KLa
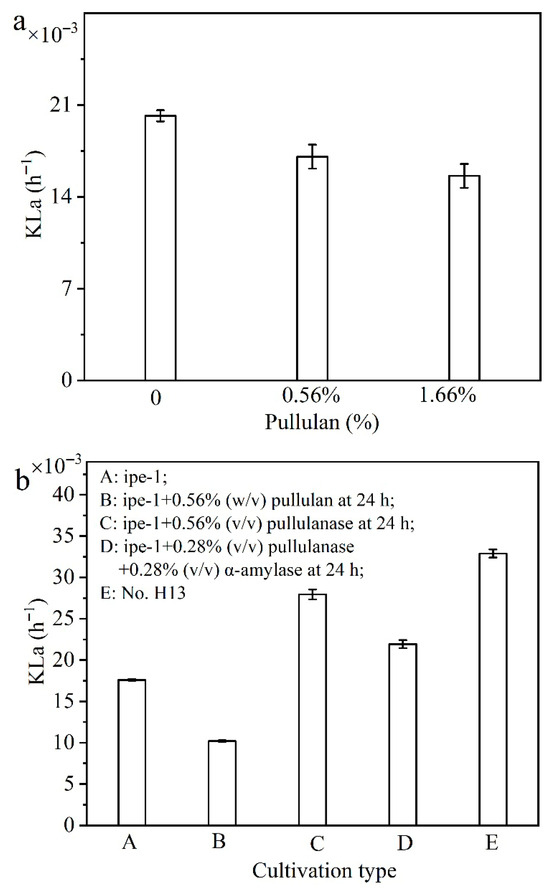
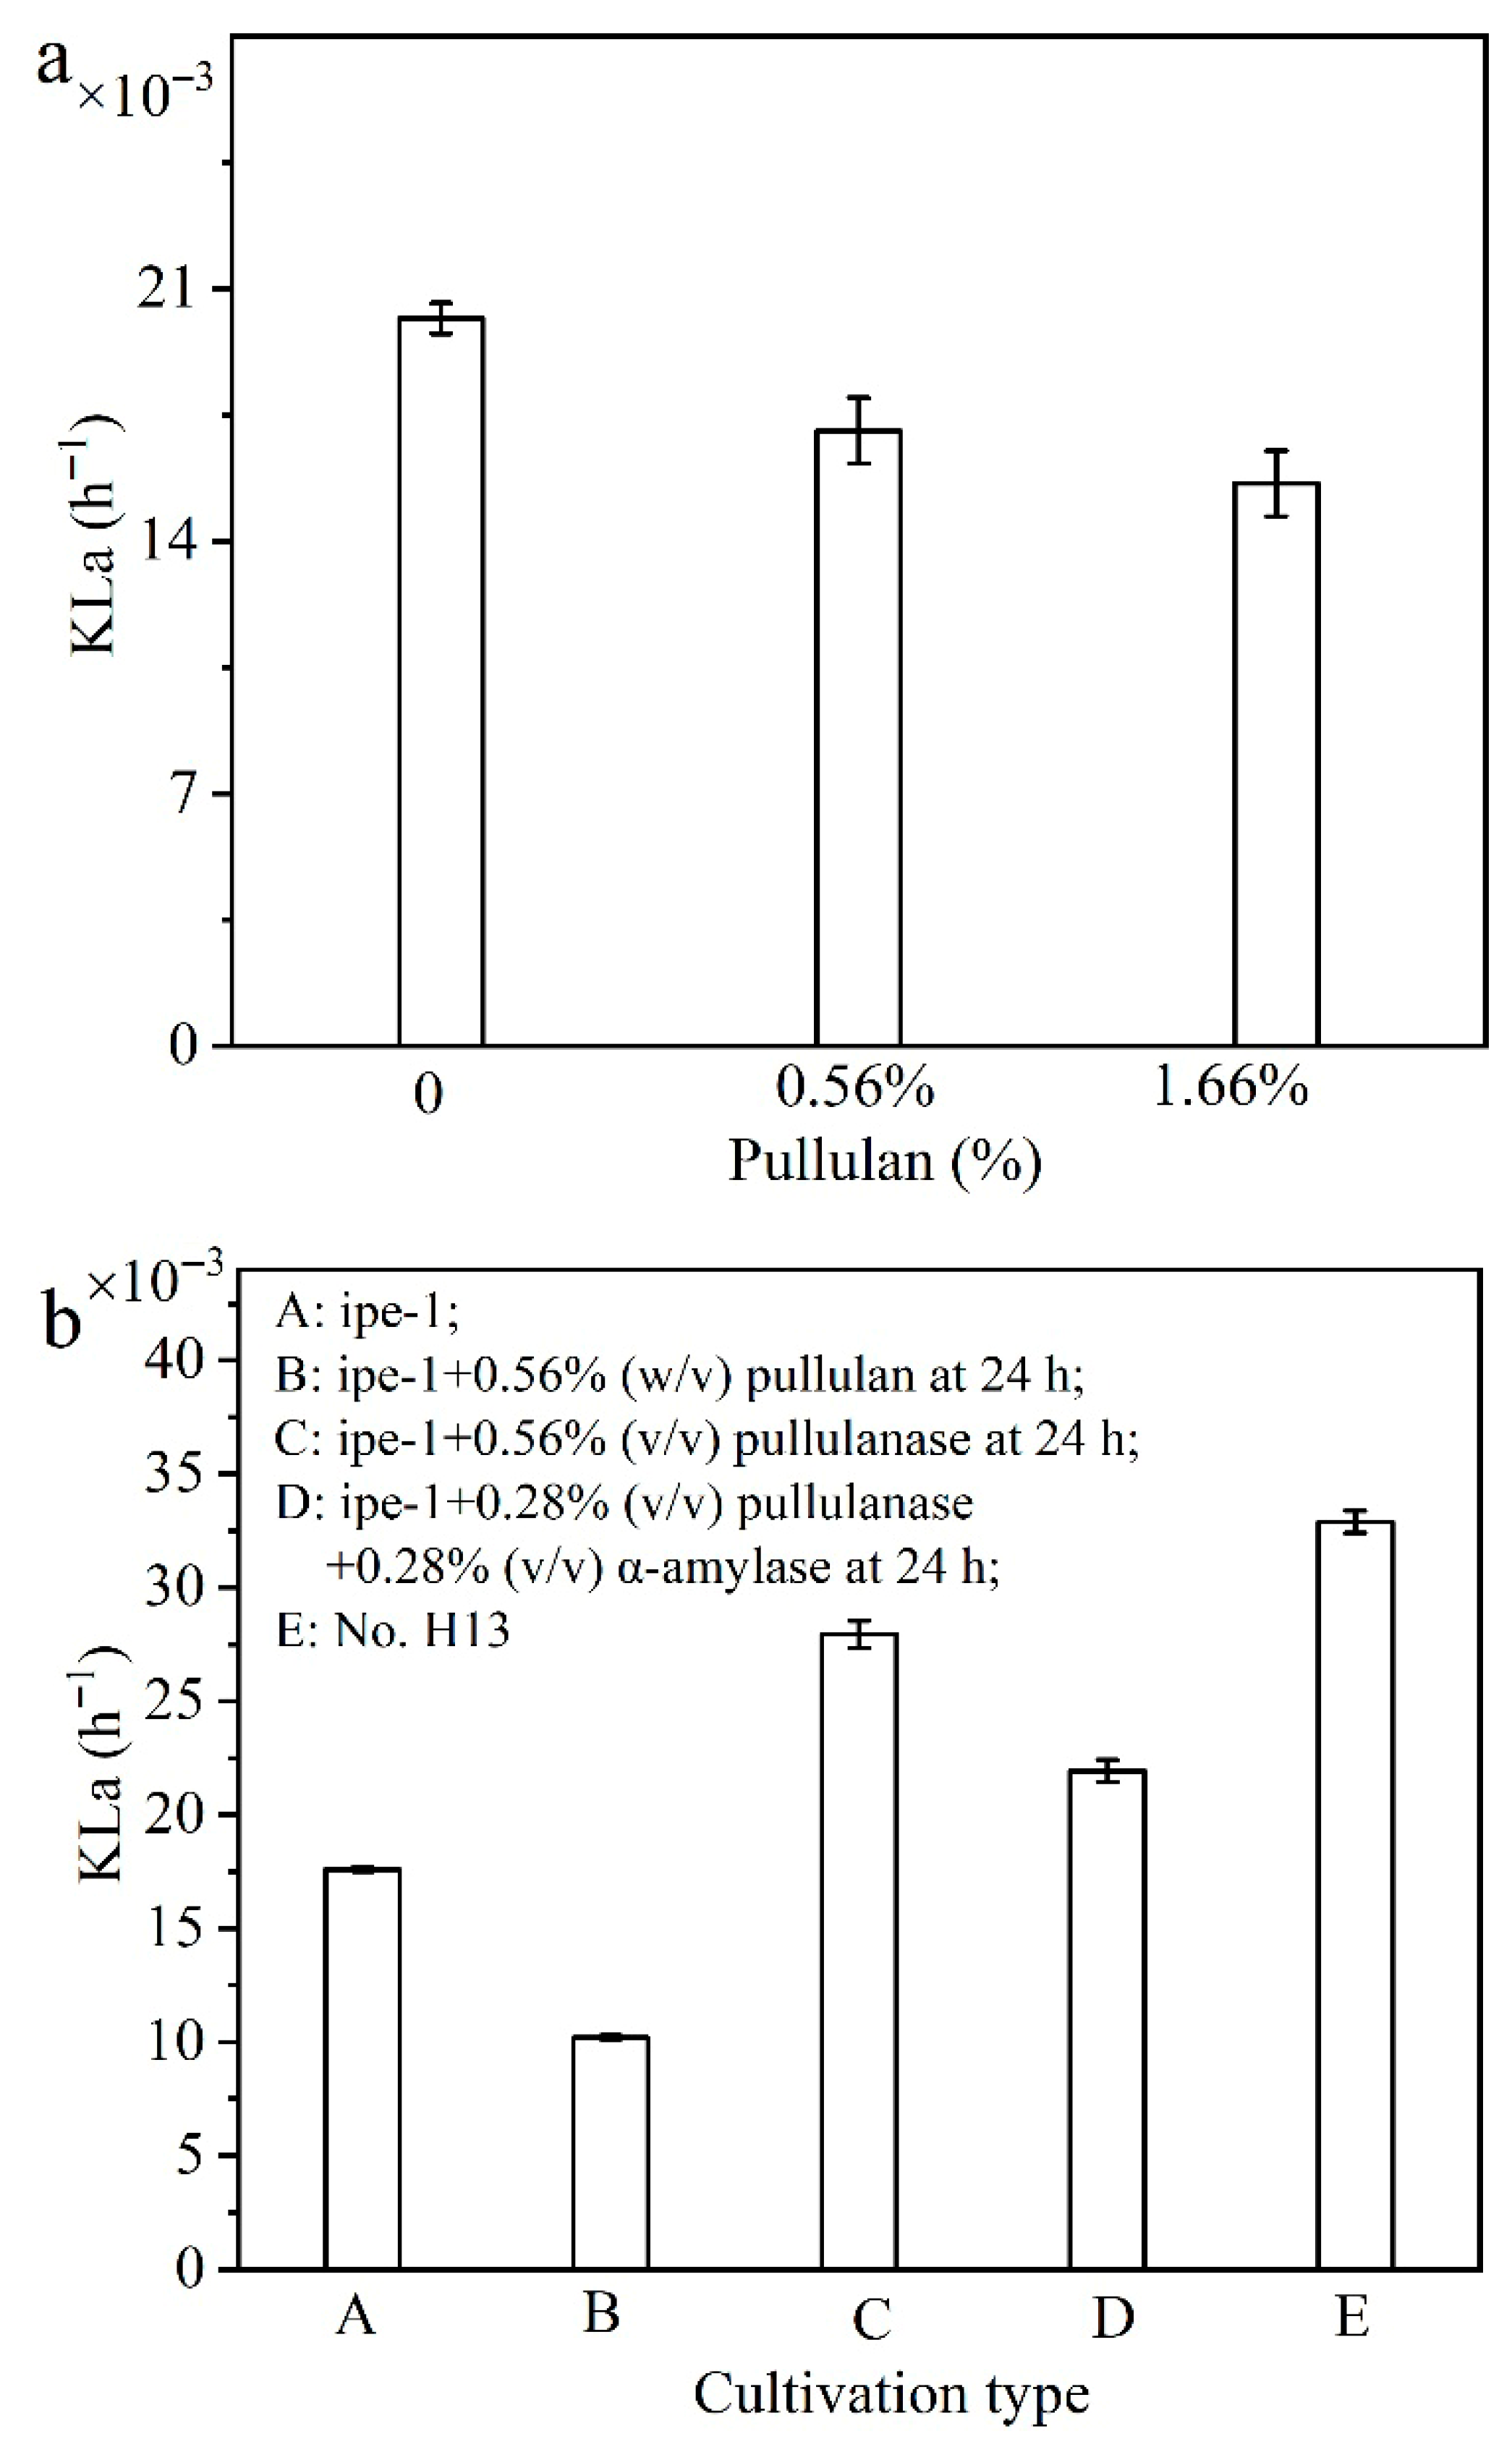
In the non-cultured system without inoculation (Figure 6a), the addition of exogenous pullulan negatively influenced oxygen transfer in the medium, with the extent of reduction depending on the pullulan concentration. Compared with the non-supplemented control, the KLa decreased by 15.41% and 22.69% at pullulan concentrations of 0.56% and 1.66%, respectively. As shown in Figure 6b, comparison between Type A (control strain ipe-1) and Type B (ipe-1 with 0.56 g/L pullulan added at 24 h) revealed that pullulan supplementation increased broth viscosity, thereby hindering oxygen transfer and resulting in a 42.0% reduction in KLa relative to Type A. In contrast, when comparing Type A with Type C (ipe-1 with 0.28% pullulanase and 0.28% α-amylase added at 24 h) and Type D (ipe-1 with 1.67% pullulanase added at 24 h), the KLa increased by 58.75% and 86.93%, respectively. Correspondingly, PMLA production increased by 46.2% and 83.53%, while both free and cell-bound EPS levels decreased significantly. These results suggest that enzymatic hydrolysis improves oxygen transfer in the fermentation broth. Compared to Type A, Type E (strain No. H13) showed an 86.93% increase in KLa. After 96 h of batch fermentation, this mutant also produced 65.12% more PMLA than the control. This improvement may be attributed to the reduced synthesis of total EPS in strain No. H13, which alleviated the metabolic burden on cell growth and decreased the oxygen demand. Moreover, the reduction in by-product formation allowed more carbon flux to be directed toward PMLA synthesis, thereby enhancing yield. In summary, these findings demonstrate that pullulan, an EPS secreted by A. melanogenum, impedes oxygen transfer in the broth and consequently restrains PMLA synthesis. Suppressing pullulan synthesis effectively improves oxygen transfer efficiency, lowers the oxygen uptake rate, and promotes the target product formation.
Figure 6.
The KLa under different pullulan addition without inoculation (a), and cultivation type (b). Data are given as mean ± SD, n = 2.
3.3.2. Transcriptome Bioinformatics Analysis
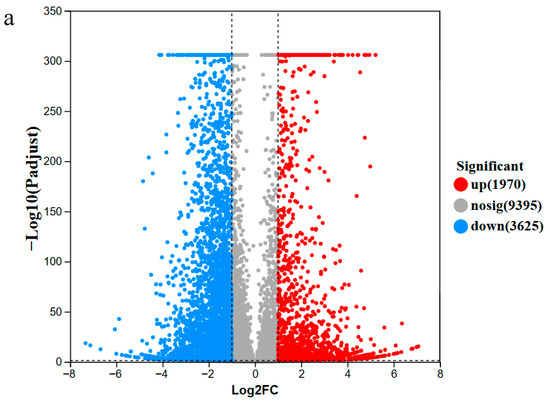
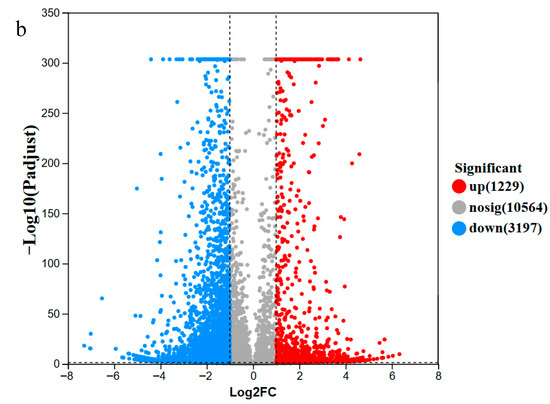
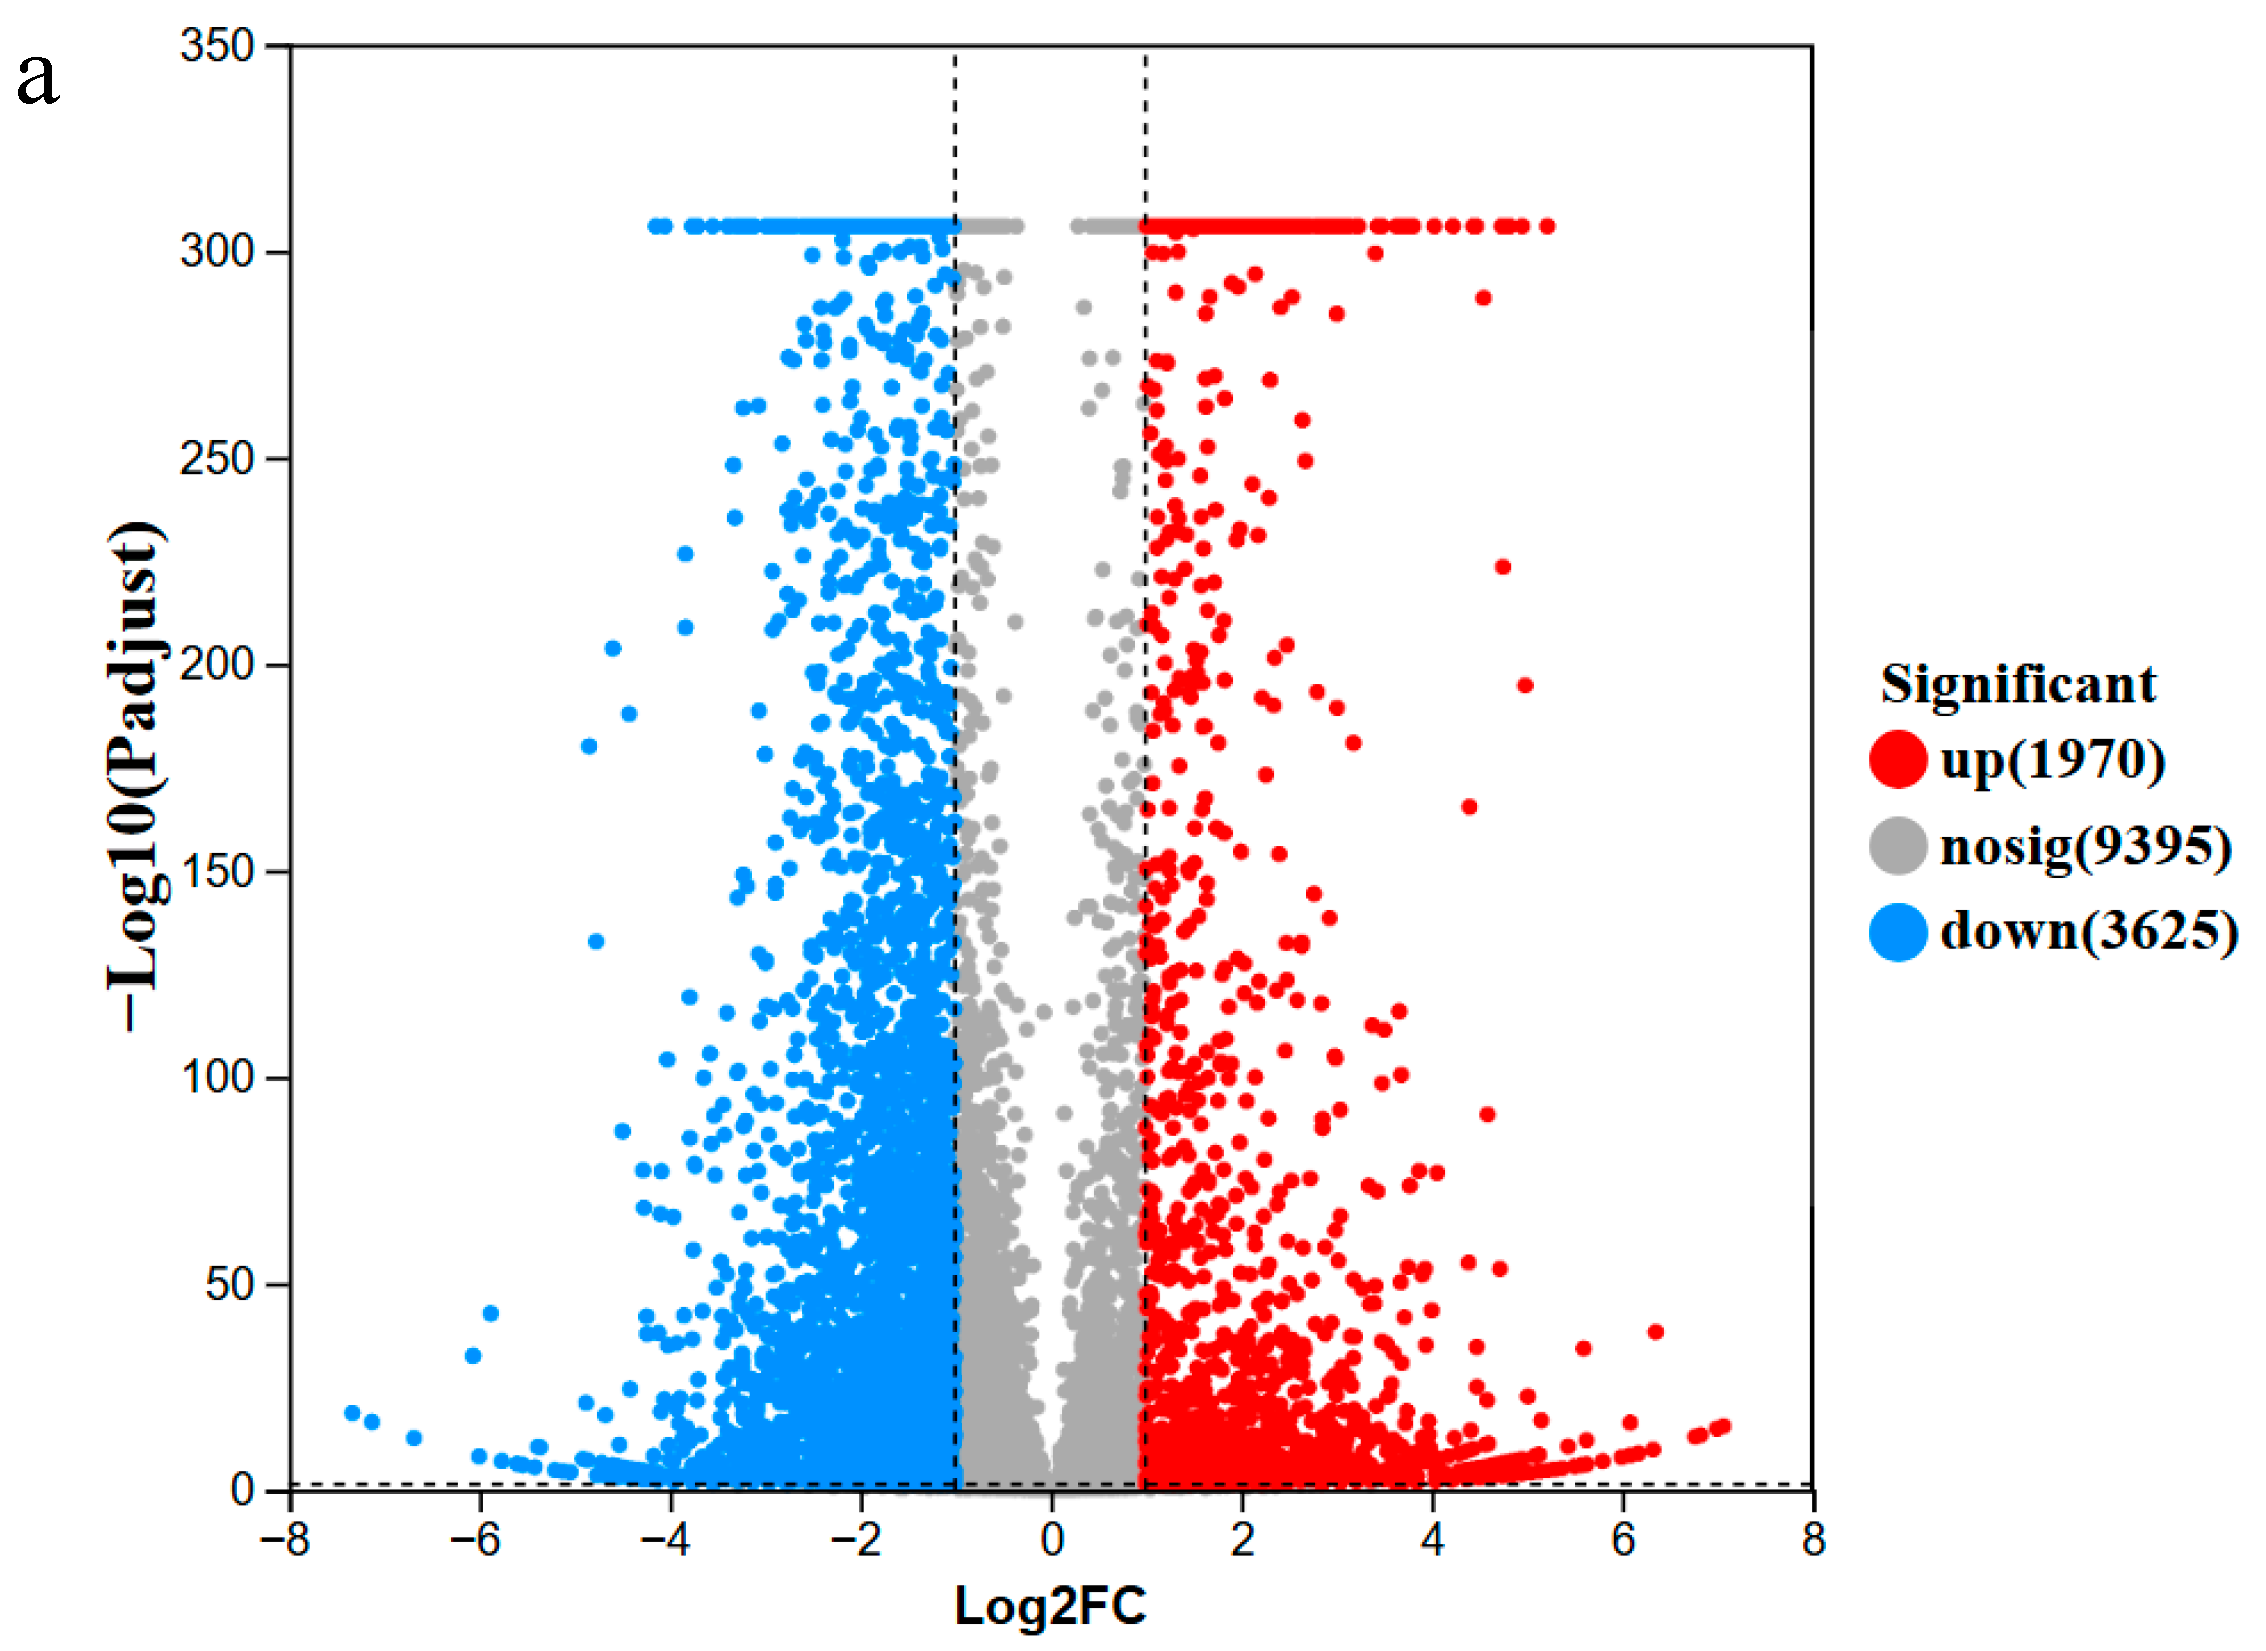
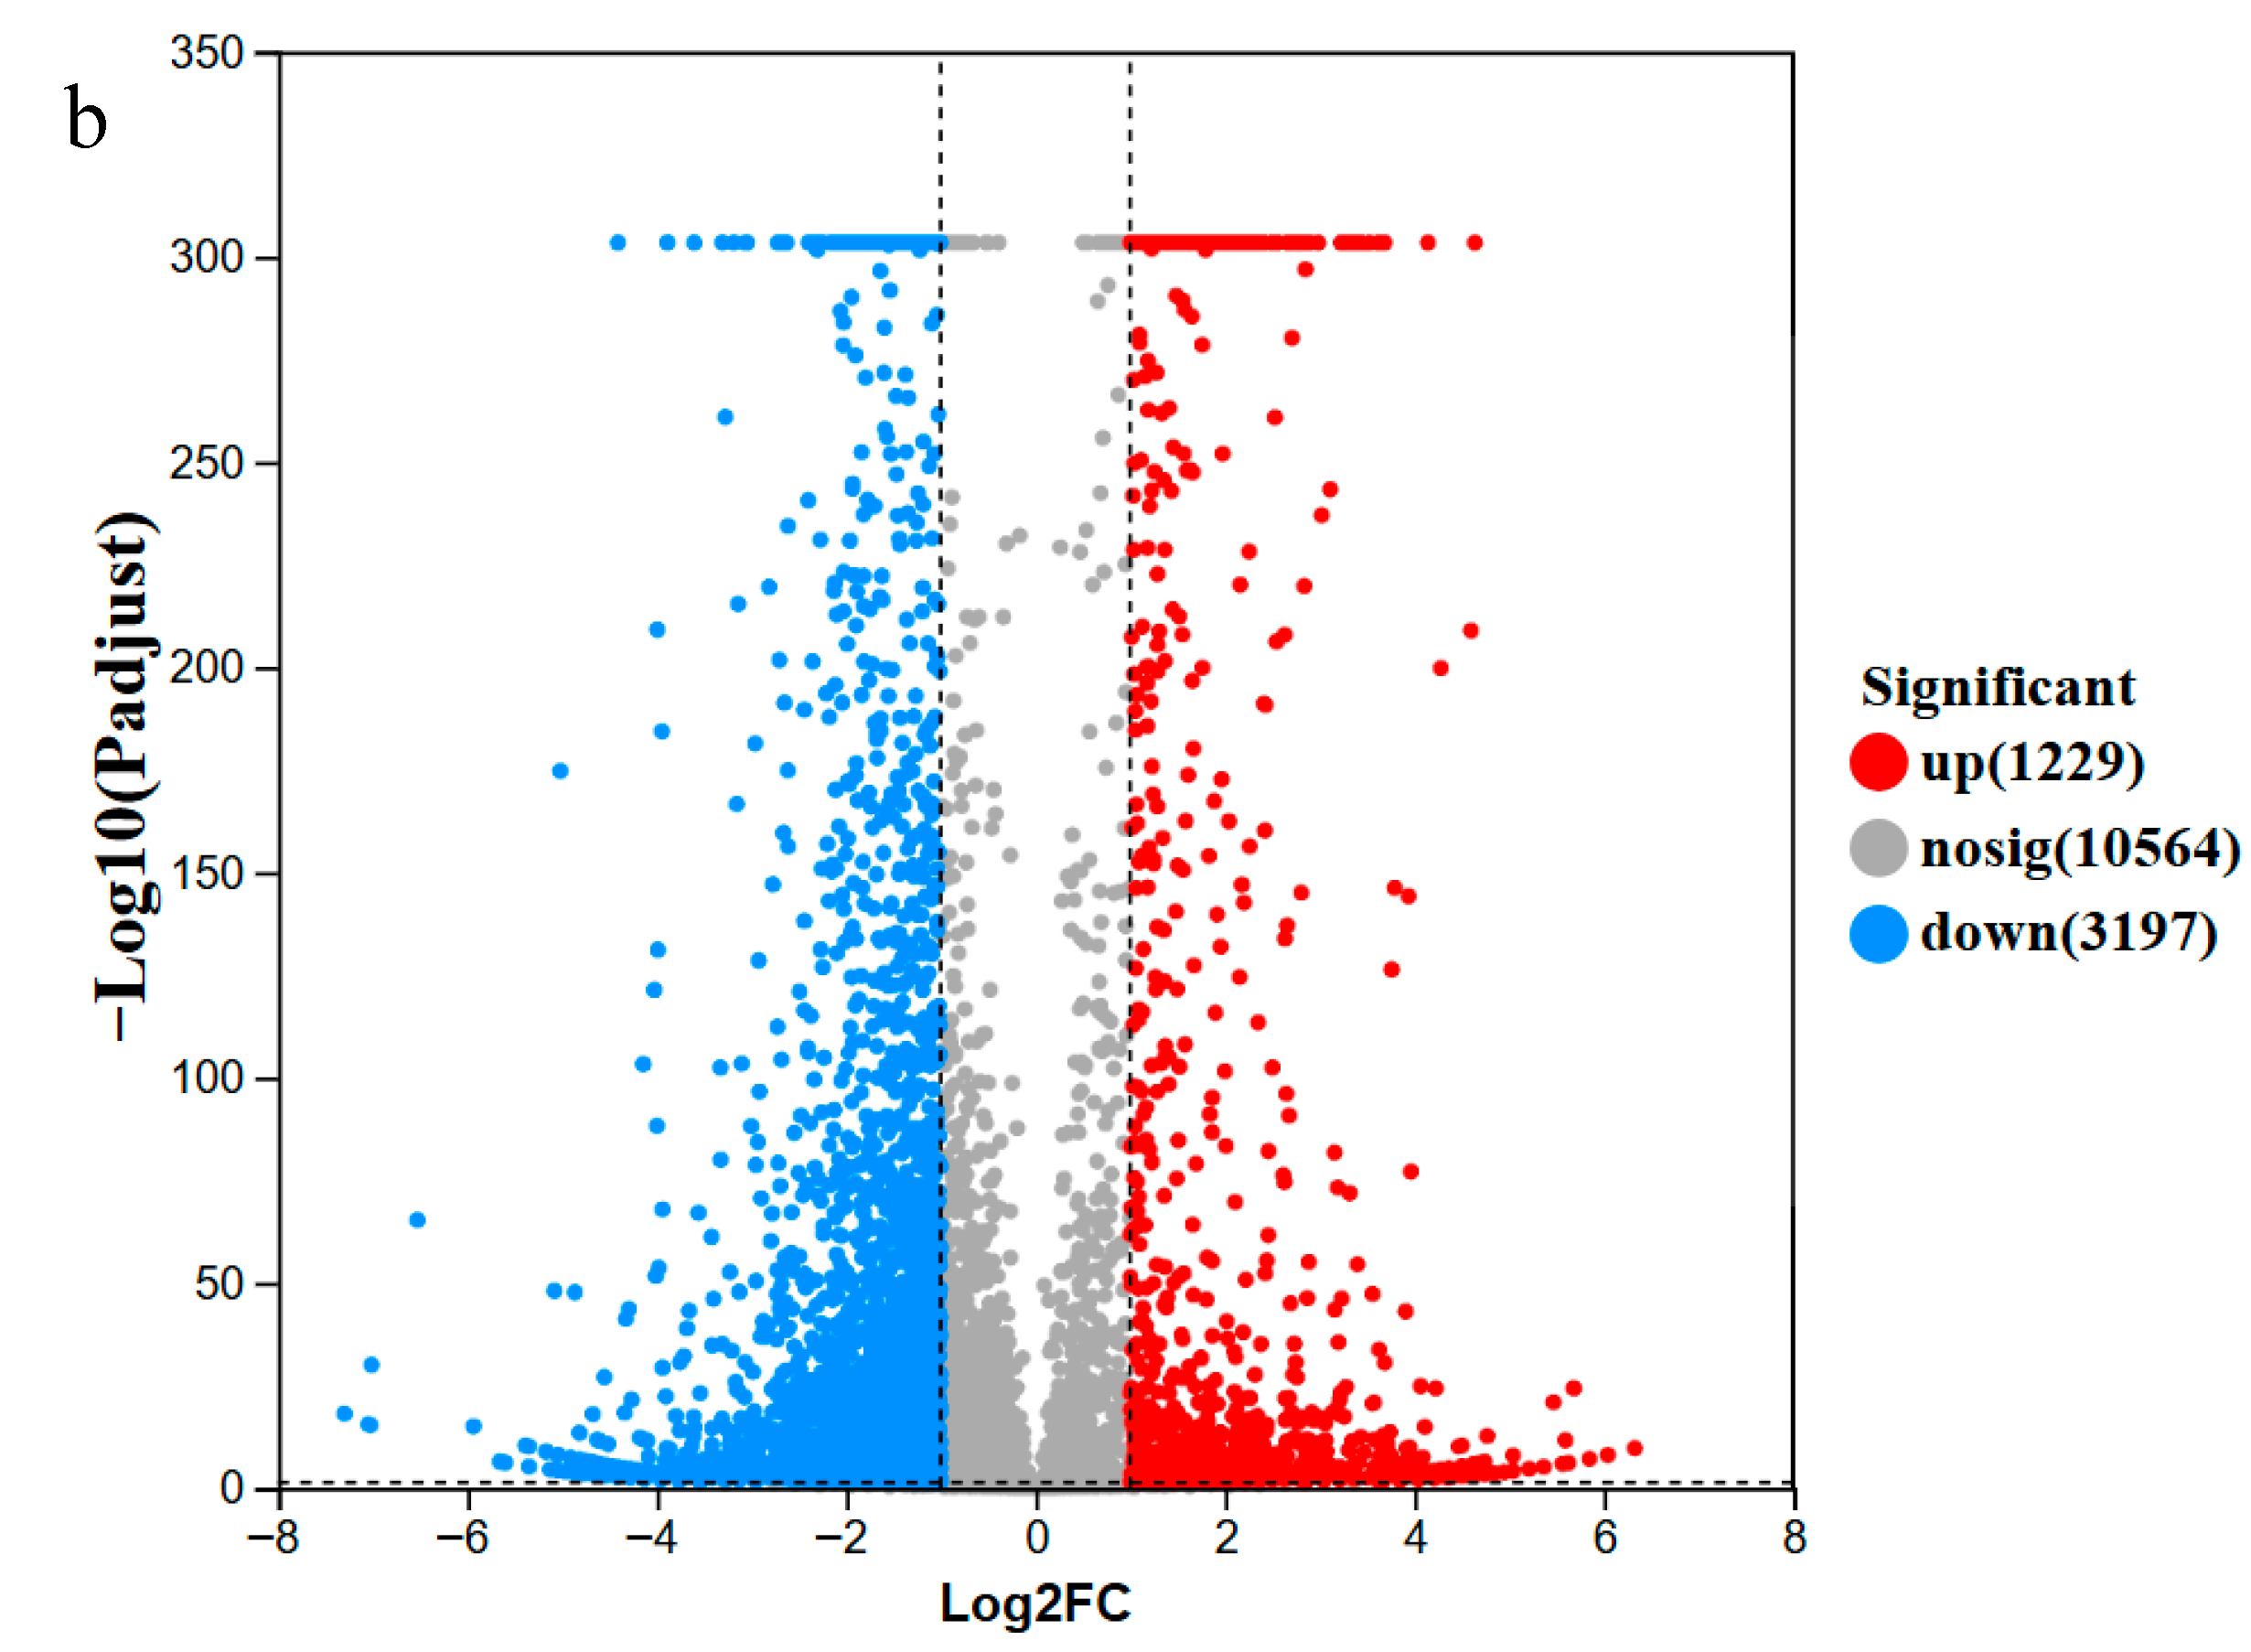
Previously, it was found that the Pentose Phosphate Pathway (PPP) played a vital role in cell growth and PMLA biosynthesis, and the activities of PFK (a rate-limiting enzyme in the EMP) and G6PDH (the first step and crucial check point of the PPP) existed in A. melanogenum ipe-1 [18]. In addition, sucrose metabolism was also faster for the strain ipe-1 [27], which was similar to that for the strain A. melanogenum CGMCC1234 [28]. Thus, the transcriptome bioinformatics analysis was further studied, and the differential genes were further analyzed at 40 h and 72 h, since PMLA productivity was different in the two stages (i.e., between 0 h and 48 h, and between 48 h and 96 h). According to differences in expression quantities, 1970 genes were up-regulated and 3625 genes were down-regulated at 40 h, and 1229 genes were up-regulated and 3197 genes were down-regulated at 72 h (Figure 7). Based on enrichment analysis, several metabolic pathways were selected for gene analysis due to their potential involvement in PMLA and pullulan synthesis. These pathways include Glycolysis/Gluconeogenesis, the Citrate Cycle (TCA cycle), Purine Metabolism, Pyruvate Metabolism, Oxidative Phosphorylation, and Glyoxylate and Dicarboxylate Metabolism, among others [18,29]. At 40 h and 72 h, among the shared genes involved in PMLA synthesis and pullulan synthesis, the up-regulated and down-regulated genes are shown in Table 1 and Table 2, respectively. Through KEGG screening, significantly different pathways were identified, and 13 differentially expressed genes related to malic acid synthesis were selected, 11 of which were up-regulated. Among them, the up-regulation of hexokinase suggests a potential enhancement of glycolysis, while acetyl-CoA synthase and aldehyde dehydrogenase likely provide more acetyl-CoA. Together with hexokinase, the transcriptional changes in these enzymes point to an increased supply of substrates. Furthermore, the expression patterns of FMN-dependent α-hydroxy acid dehydrogenase, in conjunction with L-lactate dehydrogenase, imply a potential role in generating energy for metabolism. It is worth noting that while the necessary sampling procedures may induce transient stress responses (such as temporary hypoxia), the strictly parallel processing of all samples ensures that these transcriptional profiles reliably reflect relative metabolic trends.
Figure 7.
Differences in expression quantities between the strain No. H13 and the control strain ipe-1 by transcriptome bioinformatics analysis at 40 h (a) and 72 h (b).
Table 1.
Key candidate gene with up-regulated expression.
Table 2.
Key candidate gene with down-regulated expression.
The down-regulated genes listed in Table 2 may be associated with the synthesis or secretion of pullulan. Key enzymes involved in gluconeogenesis, such as pyruvate decarboxylase, enolase, and triphosphate isomerase, were down-regulated, leading to reduced glycogen synthesis and thereby inhibiting the production of pullulan precursors. Additionally, the expression of ABC transporters, which participate in pullulan secretion, was decreased. The reduced expression of fatty acid synthase may be related to its role in cell membrane synthesis and its indirect impact on energy metabolism, such as acetyl-CoA synthesis. Studies suggest that GPI may indirectly affect pullulan synthesis by regulating the UDP-glucose transporter or membrane microenvironments [24]. Other genes that indirectly influence the synthesis of polysaccharides and PMLA include those involved in glutathione metabolism, peroxisomal function, and alcohol dehydrogenase, which enhance stress resistance under adverse conditions. These changes in differentially expressed genes contribute to our understanding of the relationship between pullulan and PMLA synthesis, providing new insights for reducing pullulan production and improving PMLA yield.
While the aforementioned transcriptomic changes provide valuable molecular insights, the macroscopic redirection of carbon flux is most directly evidenced by the fermentation yield data based on actual glucose consumption (Figure 1a and Figure 5). As shown in the fermentation profile of the parent strain (Figure 1a), it consumed 149.24 g/L of glucose, yielding 0.176 g/g of PMLA and 0.093 g/g of EPS. In contrast, while the mutant strain consumed a comparable amount of glucose (149.65 g/L), it exhibited a drastically altered carbon distribution (Figure 5). Specifically, the sugar-to-EPS yield dropped by 0.076 g/g (to 0.017 g/g), indicating that a substantial portion of the carbon source was diverted from EPS biosynthesis. Simultaneously, the sugar-to-acid yield for PMLA surged by 0.125 g/g (reaching 0.301 g/g). This quantitative trade-off provides clear evidence of carbon rerouting: the carbon flux originally destined for EPS accumulation was effectively redirected toward PMLA biosynthesis. Notably, the increase in PMLA yield (0.125 g/g) actually exceeds the carbon saved from EPS (0.076 g/g). This suggests that eliminating the viscous EPS layer also improved overall metabolic efficiency—likely through enhanced oxygen mass transfer—allowing even more carbon to be channeled into the PMLA pathway rather than being lost to other sinks. Consistent with this macroscopic carbon balance, our transcriptomic profiles indicate a coordinated down-regulation of gluconeogenesis and export machinery, alongside an up-regulation of glycolysis and TCA replenishing enzymes to secure a high malate precursor supply. These findings provide new genetic targets (e.g., hxk1, ald6, mdh3, and the ABC transporter abt1) for metabolic engineering aimed at minimizing pullulan contamination and maximizing PMLA yield according to the established genetic manipulation techniques in previous studies [13,30,31,32,33].
4. Conclusions
This study identifies pullulan accumulation as a major bottleneck in PMLA fermentation by Aureobasidium pullulans ipe-1, primarily through severely impairing oxygen transfer. We demonstrate that generating a mutant library via ARTP mutagenesis and subsequently screening for defects in pullulan production (using a trypan blue-based plate assay) allows for the identification of strains with enhanced PMLA production.
The obtained mutant, No. H13, with an 82.1% reduction in pullulan synthesis, exhibited a remarkable reconfiguration of its metabolic network. Fermentation yield data clearly demonstrated a macroscopic redirection of carbon flux toward PMLA. Consistent with this mass balance, transcriptome analysis indicated a coordinated up-regulation of glycolysis/TCA cycle genes and down-regulation of gluconeogenesis and ABC transporters. Furthermore, this metabolic shift, coupled with the drastic reduction in pullulan accumulation, resulted in an 86.93% higher oxygen transfer coefficient and a 72.1% increase in PMLA production. While exogenous enzymatic hydrolysis can improve productivity, our mutagenesis approach offers a more fundamental and efficient solution for the sustainable overproduction of PMLA.
Supplementary Materials
The following supporting information can be downloaded at: https://www.mdpi.com/article/10.3390/fermentation12050243/s1, Figure S1: Temporal profile of dissolved oxygen concentration measured via the exhaust gas method. Text S1: Detailed procedures and mathematical derivations for the determination of KLa. References [20,21] are cited in the Supplementary Materials.
Author Contributions
Q.L., methodology, visualization, writing—original draft. J.N., investigation, methodology, visualization, writing—original draft. S.W., investigation, methodology. X.W., writing—review and editing. All authors have read and agreed to the published version of the manuscript.
Funding
This work was supported by the National Natural Science Foundation of China (No. 22278412 and No. 31601411) and Scientific Research Project of Liaoning Provincial Department of Education (No. JYTMS 20230423).
Data Availability Statement
The data presented in this study are available on request from the corresponding author due to commercial confidentiality and intellectual property protection regarding the mutant strains and fermentation processes. The data are not publicly available.
Conflicts of Interest
The authors declare no conflict of interest.
References
- Van Nguyen, T.H.; Tsapis, N.; Benrabah, L.; Gouilleux, B.; Baltaze, J.-P.; Domenichini, S.; Fattal, E.; Moine, L. Poly(malic acid) nanoconjugates of pyrazinoic acid for lung delivery in the treatment of tuberculosis. Bioconjug. Chem. 2024, 35, 1532–1542. [Google Scholar] [CrossRef] [Scilit]
- Huang, X.; Xu, L.; Qian, H.; Wang, X.; Tao, Z. Polymalic acid for translational nanomedicine. J. Nanobiotechnol. 2022, 20, 295. [Google Scholar] [CrossRef] [Scilit]
- Manitchotpisit, P.; Skory, C.D.; Peterson, S.W.; Price, N.P.J.; Vermillion, K.E.; Leathers, T.D. Poly (β-L-malic acid) production by diverse phylogenetic clades of Aureobasidium pullulans. J. Ind. Microbiol. Biotechnol. 2012, 39, 125–132. [Google Scholar] [CrossRef] [Scilit]
- Wang, P.; Jia, S.-L.; Liu, G.-L.; Chi, Z.; Chi, Z.-M. Aureobasidium spp. and their applications in biotechnology. Process. Biochem. 2022, 116, 72–83. [Google Scholar] [CrossRef] [Scilit]
- Xia, J.; Liu, X.; Xu, J.; Xu, J.; Wang, X.; Li, X. Simultaneously enhanced production of poly(β-malic acid) and pullulan using a dissolved oxygen shift (DO-shift) control strategy. J. Chem. Technol. Biotechnol. 2017, 92, 1464–1471. [Google Scholar] [CrossRef] [Scilit]
- Zhang, K.; Yue, L.; Cong, J.; Zhang, J.; Feng, Z.; Yang, Q.; Lu, X. Increased production of pullulan in Aureobasidium pullulans YQ65 through reduction of intracellular glycogen content. Carbohydr. Polym. 2025, 352, 123196. [Google Scholar] [CrossRef] [Scilit]
- Zeng, N.; Wang, D.; Long, J.; Wang, Y.; Chen, B.; Baloch, F.B.; Li, Z.; Zhang, N.; Li, B. Transcriptome and metabolome integration analysis reveals the effect of citric acid on cell metabolism in Aureobasidium pullulans NG. LWT 2025, 215, 117244. [Google Scholar] [CrossRef] [Scilit]
- Yang, G.; Mo, H.; Liu, B.; Wu, Y.; Liu, G.; Hu, Y.; Jiao, X.; Guo, K.; Wei, X.; Fang, Y.; et al. Pullulan fermented by Aureobasidium melanogenum TZ-FC3 for the preparation of self-healing, adhesive, injectable and antibacterial pullulan/PVA/borax hydrogel. Int. J. Biol. Macromol. 2025, 286, 138544. [Google Scholar] [CrossRef] [Scilit] [PubMed]
- de Souza, C.K.; Ghosh, T.; Lukhmana, N.; Tahiliani, S.; Priyadarshi, R.; Hoffmann, T.G.; Purohit, S.D.; Han, S.S. Pullulan as a sustainable biopolymer for versatile applications: A review. Mater. Today Commun. 2023, 36, 106477. [Google Scholar] [CrossRef] [Scilit]
- Wang, D.; Yu, X.; Gongyuan, W. Pullulan production and physiological characteristics of Aureobasidium pullulans under acid stress. Appl. Microbiol. Biotechnol. 2013, 97, 8069–8077. [Google Scholar] [CrossRef] [Scilit] [PubMed]
- Tu, G.; Wang, Y.; Ji, Y.; Zou, X. The effect of Tween 80 on the polymalic acid and pullulan production by Aureobasidium pullulans CCTCC M2012223. World J. Microbiol. Biotechnol. 2015, 31, 219–226. [Google Scholar] [CrossRef] [Scilit] [PubMed]
- Xia, J.; Xu, J.; Liu, X.; Xu, J.; Wang, X.; Li, X. Economic co-production of poly(malic acid) and pullulan from Jerusalem artichoke tuber by Aureobasidium pullulans HA-4D. BMC Biotechnol. 2017, 17, 20. [Google Scholar] [CrossRef] [Scilit] [PubMed]
- Qin, Z.; Feng, J.; Li, Y.; Zheng, Y.; Moore, C.; Yang, S.-T. Engineering the reductive tricarboxylic acid pathway in Aureobasidium pullulans for enhanced biosynthesis of poly-L-malic acid. Bioresour. Technol. 2024, 393, 130122. [Google Scholar] [CrossRef] [Scilit]
- Li, B.; Li, B.; Wang, P.; Feng, Y.; Xu, X.; Zhang, Y.; Zou, X. Bio-refinery of xylose processing wastes for green polymalic acid production and l-malic acid recovery by engineered Aureobasidium pullulans in a non-waste-disposal system. Chem. Eng. J. 2023, 454, 140533. [Google Scholar] [CrossRef] [Scilit]
- Song, X.; Wang, Y.; Wang, P.; Pu, G.; Zou, X. GATA-type transcriptional factor Gat1 regulates nitrogen uptake and polymalic acid biosynthesis in polyextremotolerant fungus Aureobasidium pullulans. Environ. Microbiol. 2020, 22, 229–242. [Google Scholar] [CrossRef] [Scilit]
- Hao, Y.; Pan, X.; Xing, R.; You, J.; Hu, M.; Liu, Z.; Li, X.; Xu, M.; Rao, Z. High-level production of L-valine in Escherichia coli using multi-modular engineering. Bioresour. Technol. 2022, 359, 127461. [Google Scholar] [CrossRef] [Scilit]
- Wang, D.; Zhu, C.; Zhang, G.; Wang, C.; Wei, G. Enhanced β-glucan and pullulan production by Aureobasidium pullulans with zinc sulfate supplementation. Appl. Microbiol. Biotechnol. 2020, 104, 1751–1760. [Google Scholar] [CrossRef] [Scilit]
- Yu, H.; Liu, B.; Luo, J.; Cao, W.; Qiao, C.; Wan, Y. Toward understanding the key enzymes involved in β-poly (L-malic acid) biosynthesis by Aureobasidium pullulans ipe-1. Eng. Life Sci. 2018, 18, 379–386. [Google Scholar] [CrossRef] [Scilit]
- Cao, W.; Qi, B.; Zhao, J.; Qiao, C.; Su, Y.; Wan, Y. Control strategy of pH, dissolved oxygen concentration and stirring speed for enhancing β-poly(malic acid) production by Aureobasidium pullulans ipe-1. J. Chem. Technol. Biotechnol. 2013, 88, 808–817. [Google Scholar] [CrossRef] [Scilit]
- Ocampo-Lopez, C.; Ramirez-Carmona, M.; Rendón-Castrillón, L.; Castro-Mejía, M. PBL Methodology Applied for the Development of a Software for Optimizing Bioprocesses Scaling. In Proceedings of the Sixth International Symposium on Project Approaches in Engineering Education (PAEE 2014), Medellín, Colombia, 2–3 June 2014. [Google Scholar]
- Garcia-Ochoa, F.; Gomez, E.; Santos, V.E.; Merchuk, J.C. Oxygen uptake rate in microbial processes: An overview. Biochem. Eng. J. 2010, 49, 289–307. [Google Scholar] [CrossRef] [Scilit]
- Liu, N.-N.; Chi, Z.; Liu, G.-L.; Chen, T.-J.; Jiang, H.; Hu, Z.; Chi, Z.-M. α-Amylase, glucoamylase and isopullulanase determine molecular weight of pullulan produced by Aureobasidium melanogenum P16. Int. J. Biol. Macromol. 2018, 117, 727–734. [Google Scholar] [CrossRef] [Scilit] [PubMed]
- Gao, J.; Liao, X.; Ma, H.; Bai, W. Transcriptome analysis of Aureobasidium pullulans BL06 and identification of key factors affecting pullulan production. Carbohydr. Polym. 2025, 349, 122984. [Google Scholar] [CrossRef] [Scilit] [PubMed]
- Wei, X.; Liu, G.-L.; Jia, S.-L.; Chi, Z.; Hu, Z.; Chi, Z.-M. Pullulan biosynthesis and its regulation in Aureobasidium spp. Carbohydr. Polym. 2021, 251, 117076. [Google Scholar]
- Long, M.; Xu, M.; Ma, Z.; Pan, X.; You, J.; Hu, M.; Shao, Y.; Yang, T.; Zhang, X.; Rao, Z. Significantly enhancing production of trans -4-hydroxy-l-proline by integrated system engineering in Escherichia coli. Sci. Adv. 2020, 6, eaba2383. [Google Scholar] [CrossRef] [Scilit]
- Li, X.; Zhao, S.; Chen, L.; Zhou, Q.; Qiu, J.; Xin, X.; Zhang, Y.; Yuan, W.; Tian, C.; Yang, J.; et al. High-level production of pullulan from high concentration of glucose by mutagenesis and adaptive laboratory evolution of Aureobasidium pullulans. Carbohydr. Polym. 2023, 302, 120426. [Google Scholar] [CrossRef] [Scilit]
- Cao, W.; Wang, Y.; Shen, F.; Luo, J.; Yin, J.; Qiao, C.; Wan, Y. Efficient β-poly(l-malic acid) production from Jerusalem artichoke by Aureobasidium pullulans ipe-1 immobilized in luffa sponge matrices. Bioresour. Technol. 2019, 288, 121497. [Google Scholar] [CrossRef] [Scilit]
- Sheng, L.; Tong, Q.; Ma, M. Why sucrose is the most suitable substrate for pullulan fermentation by Aureobasidium pullulans CGMCC1234? Enzym. Microb. Technol. 2016, 92, 49–55. [Google Scholar] [CrossRef] [Scilit]
- Cao, W.; Cao, W.; Shen, F.; Luo, J.; Yin, J.; Qiao, C.; Wan, Y. A sustainable pH shift control strategy for efficient production of β-poly(L-malic acid) with CaCO3 addition by Aureobasidium pullulans ipe-1. Appl. Microbiol. Biotechnol. 2020, 104, 8691–8703. [Google Scholar] [CrossRef] [Scilit]
- Li, B.; He, J.; Zuo, K.; Xu, X.; Zou, X. Engineering the by-products pathway in Aureobasidium pullulans for highly purified polymalic acid fermentation with concurrent recovery of L-malic acid. Bioresour. Technol. 2024, 414, 131578. [Google Scholar] [CrossRef] [Scilit]
- Guan, J.; Wang, W.; Zhang, K.; Shi, X.; Yang, Q.; Song, J. Role of AplaeA in the regulation of spore production and poly(malic acid) synthesis in Aureobasidium pullulans. Int. J. Biol. Macromol. 2024, 279, 135153. [Google Scholar] [CrossRef] [Scilit]
- Chi, Z.; Wei, X.; Ge, N.; Jiang, H.; Liu, G.-L.; Chi, Z.-M. NsdD, a GATA-type transcription factor is involved in regulation and biosynthesis of macromolecules melanin, pullulan, and polymalate in Aureobasidium melanogenum. Int. J. Biol. Macromol. 2024, 268, 131820. [Google Scholar] [CrossRef] [Scilit] [PubMed]
- Qi, C.Y.; Chi, Z.; Liu, G.L.; Chi, Z.M. A high molecular weight polymalate is synthesized by the whole genome duplicated strain Aureobasidium melanogenum OUC. Int. J. Biol. Macromol. 2022, 202, 608–619. [Google Scholar] [CrossRef] [Scilit] [PubMed]

Disclaimer/Publisher’s Note: The statements, opinions and data contained in all publications are solely those of the individual author(s) and contributor(s) and not of MDPI and/or the editor(s). MDPI and/or the editor(s) disclaim responsibility for any injury to people or property resulting from any ideas, methods, instructions or products referred to in the content. |
© 2026 by the authors. Licensee MDPI, Basel, Switzerland. This article is an open access article distributed under the terms and conditions of the Creative Commons Attribution (CC BY) license.