


Abstract
Rhamnolipids are promising biosurfactants with diverse applications, but their efficient production from glucose remains challenging. In this study, a glucose-based fermentation process was developed using Pseudomonas aeruginosa YM4 through sequential evaluation of nitrogen source, pH, C/N ratio, glucose concentration, and Fe2+ supplementation in a 5 L bioreactor. A mixed NH4+/NO3− nitrogen source resulted in higher rhamnolipid production than either NH4+ or NO3− alone. Maintaining the culture pH at 7.2 prevented excessive acidification and promoted glucose consumption and rhamnolipid production. The highest rhamnolipid titer (29.7 g/L) was achieved using 100 g/L glucose, a C/N ratio of 35, and 10.8 μM Fe2+. Fermentation kinetics indicated that biomass accumulated rapidly during the early fermentation stage, whereas rhamnolipid production continued after cell growth had slowed. Under the selected conditions, YM4 produced a rhamnolipid mixture containing 73.8% di-rhamnolipids and showed substantially higher rhamnolipid production than three additional P. aeruginosa strains cultivated under identical conditions. This study developed a glucose-based fermentation process for producing di-rhamnolipid-rich products and demonstrated the efficient rhamnolipid-producing capability of P. aeruginosa YM4 under the evaluated conditions.
1. Introduction
Rhamnolipids (RLs), a group of glycolipid biosurfactants mainly produced by Pseudomonas strains, have attracted growing attention as renewable alternatives to synthetic surfactants due to their excellent surface activity, biodegradability, and low toxicity [1,2,3]. Owing to these properties, RLs have been explored for applications in petroleum recovery, environmental remediation, agriculture, cosmetics, and pharmaceuticals [2,3].
Structurally, RLs consist of one or two rhamnose molecules linked to one or two β-hydroxy fatty acids, forming mono-rhamnolipid and di-rhamnolipid congeners with different physicochemical properties and application characteristics [4,5]. Among these congeners, di-rhamnolipids generally exhibit stronger emulsifying properties and biological activities, increasing interest in the production of di-rhamnolipid-rich RL products [6,7,8].
Despite their promising applications, large-scale RL production remains constrained by high production costs and limited fermentation efficiency [9,10]. Among the factors influencing fermentation performance, the carbon source is particularly important because it affects cell growth, precursor availability, and RL composition [11,12]. Vegetable oils are commonly used substrates for RL production because they provide fatty acid precursors that support high product titers [8,12]. However, their poor water solubility can complicate substrate feeding, oxygen transfer, and downstream product recovery, increasing process complexity and production costs. In contrast, glucose is inexpensive and readily available, making it an attractive alternative carbon source for RL fermentation [12]. Consequently, glucose has attracted considerable interest as an alternative carbon source for RL production.
However, establishing an efficient glucose-based fermentation process remains challenging. Compared with lipid substrates, glucose often results in lower RL production, and fermentation performance varies among strains and cultivation conditions [12,13]. Previous studies have shown that nitrogen source, pH, nutrient balance, and trace metal supplementation all influence RL production [14,15,16,17,18]. Nevertheless, these factors have mostly been investigated independently, whereas their combined effects on glucose utilization, biomass formation, and RL production during controlled bioreactor fermentation remain poorly understood. Consequently, systematic process development for glucose-based RL production is still limited.
Pseudomonas aeruginosa YM4 is an RL-producing strain previously isolated in our laboratory [8]. In our previous study, YM4 produced more than 20 g/L RLs using soybean oil or glycerol as carbon sources and naturally produced di-rhamnolipid-rich RLs [8]. These characteristics suggest that YM4 may be suitable for further evaluation in glucose-based RL fermentation. Its performance during glucose-based fermentation, however, has not yet been systematically evaluated. Moreover, it is unknown whether refining the fermentation process can simultaneously achieve efficient glucose utilization, high RL productivity, and a di-rhamnolipid-rich product profile.
Therefore, this study aimed to establish a glucose-based fermentation process for P. aeruginosa YM4 by evaluating key fermentation factors affecting RL production. Nitrogen source and fermentation pH were first investigated to identify the major factors limiting glucose-based RL production. The C/N ratio, initial glucose concentration, and Fe2+ supplementation were subsequently evaluated in a 5 L bioreactor to improve fermentation performance. Fermentation kinetics were further analyzed to characterize the relationship between biomass formation and RL accumulation, and the RL composition produced by YM4 was compared with those of three additional P. aeruginosa strains. This study developed a glucose-based fermentation strategy for producing di-rhamnolipid-rich RLs and provides a basis for further development of glucose-based RL production processes.
2. Materials and Methods
2.1. Bacterial Strains and Seed Preparation
Four Pseudomonas aeruginosa strains, including YM4, PAO1, HN, and HEB, were maintained in our laboratory. P. aeruginosa YM4 (CCTCC No. M2017494) was generated by atmospheric and room-temperature plasma (ARTP) mutagenesis of a parental strain originally isolated from crude-oil-contaminated soil, as described previously [8]. P. aeruginosa PAO1, a well-characterized reference laboratory strain, was used as a comparative strain. Strains HN and HEB were previously isolated and screened in our laboratory for RL production and maintained in our collection. YM4 was used as the primary production strain, while PAO1, HN, and HEB were used for comparative evaluation of RL production and composition under glucose-based fermentation conditions.
LB medium was used for strain activation and seed preparation and contained 10 g/L tryptone, 5 g/L yeast extract, and 10 g/L NaCl. Bacterial stocks stored at −80 °C were streaked onto LB agar plates and incubated at 37 °C for 24 h. A single colony was inoculated into liquid LB medium and cultivated at 37 °C and 200 rpm for 12 h. For bioreactor cultivation, the seed culture was grown in LB medium until the OD600 reached approximately 3–4 and was subsequently used as the inoculum.
2.2. Fermentation Media
The basal medium for shake-flask fermentation contained 80 g/L glucose, 7.888 g/L Na2HPO4·12H2O, 1.972 g/L KH2PO4, 0.2 g/L MgSO4·7H2O, 0.1 g/L CaCl2, 1 g/L NaCl, 1 g/L KCl, 0.5 g/L yeast extract, and 2 mL/L trace-element solution. The basal medium used for bioreactor cultivation contained 80 g/L glucose, 0.5 g/L KH2PO4, 0.2 g/L MgSO4·7H2O, 0.1 g/L CaCl2, 1 g/L NaCl, 1 g/L KCl, 0.5 g/L yeast extract, and 2 mL/L trace-element solution.
The trace-element stock solution comprised 0.500 g/L FeSO4·7H2O, 0.250 g/L CuSO4·5H2O, 2.875 g/L ZnSO4·7H2O, and 1.691 g/L MnSO4·H2O and was added to the fermentation medium at 2 mL/L unless otherwise specified.
For nitrogen-source evaluation, the basal medium was supplemented with 37.5 mM (NH4)2HPO4, 75 mM NaNO3, 12 g/L soy peptone (FP410, Angel Yeast Co., Ltd., Yichang, China), or a mixed nitrogen source consisting of 18.75 mM (NH4)2HPO4 and 37.5 mM NaNO3.
The mixed nitrogen source supplied equal molar amounts of NH4+-N and NO3−-N. The total nitrogen concentration of the inorganic nitrogen source treatments was maintained at 75 mM, whereas the soy peptone concentration was selected based on the manufacturer-specified nitrogen content.
2.3. Shake-Flask Evaluation of Nitrogen Sources
Fermentation medium (50 mL) was inoculated with 2% (v/v) seed culture and incubated at 37 °C and 200 rpm for 96 h. Glucose-based RL production was then evaluated using (NH4)2HPO4, NaNO3, soy peptone, or the mixed ammonium/nitrate formulation described in Section 2.2 as nitrogen sources.
The initial glucose concentration was 80 g/L. At the end of cultivation, the RL titer, dry cell weight, residual glucose concentration, and culture pH were determined.
2.4. Bioreactor Cultivation
Fermentations were performed in a 5 L stirred-tank bioreactor (BioCore QF-05, Shanghai Chuyi Biotechnology Co., Ltd., Shanghai, China) with a working volume of 3 L. The cylindrical vessel had an inner diameter of 160 mm, a straight-section height of 240 mm, and a total height of 285 mm. Agitation was provided by a single six-blade straight turbine impeller with a diameter of 70 mm. The bioreactor was inoculated with 10% (v/v) seed culture and operated at 37 °C. Industrial-grade oxygen was supplied at 200 mL/min, and the agitation speed was maintained at 300 rpm. Dissolved oxygen was not actively controlled during fermentation. The pH was automatically controlled by the addition of 2 M NaOH or 1 M H2SO4. Silicone antifoam (1 g/L) was added as required to suppress excessive foaming [8]. Samples were collected at predetermined intervals to determine RL concentration, residual glucose concentration, and biomass. Unless otherwise specified, fermentation was terminated when the residual glucose concentration decreased below 5 g/L. For glucose concentration experiments in which glucose was not completely consumed, fermentation was terminated after 96 h.
2.5. Nitrogen-Source Evaluation Under Controlled pH Conditions
To compare the effects of nitrogen-source composition under controlled pH conditions, the four nitrogen-source formulations described in Section 2.2 were evaluated in the 5 L bioreactor. The initial glucose concentration was maintained at 80 g/L, and the fermentation pH was controlled at 7.0. The other cultivation conditions were maintained as described in Section 2.4.
RL concentration, dry cell weight, residual glucose concentration, fermentation time, and volumetric productivity were determined. Based on the overall fermentation performance, the mixed ammonium/nitrate formulation was used in subsequent experiments.
2.6. Effect of Fermentation pH
The effects of controlled pH on glucose utilization, biomass formation, and RL production were investigated in a 5 L bioreactor. Fermentation was carried out in medium containing 80 g/L glucose and the mixed ammonium/nitrate nitrogen source, with the pH maintained at 6.5, 7.0, 7.2, 7.4, and 7.6 in separate runs. Other cultivation conditions were maintained as described in Section 2.4.
2.7. Effect of the C/N Ratio
Different C/N ratios were evaluated for their effects on biomass formation and RL production using the mixed ammonium/nitrate nitrogen source. All fermentations were performed with an initial glucose concentration of 80 g/L at pH 7.2. The concentrations of (NH4)2HPO4 and NaNO3 were adjusted proportionally to obtain C/N ratios of 18, 29, 35, 41, and 53 while maintaining equal molar contributions of NH4+-N and NO3−-N. The C/N ratio was defined as the molar ratio of carbon atoms supplied by glucose to nitrogen atoms supplied by inorganic nitrogen sources.
2.8. Effect of the Initial Glucose Concentration
The effect of initial glucose concentration on RL production and glucose utilization was evaluated using initial glucose concentrations of 60, 80, 100, 120, and 150 g/L. For each glucose concentration, the concentrations of (NH4)2HPO4 and NaNO3 were adjusted proportionally to maintain a C/N ratio of 35, while maintaining equal molar contributions of NH4+-N and NO3−-N. The fermentation pH was controlled at 7.2, and the other cultivation conditions were maintained as described in Section 2.4. Cells collected at the end of fermentations containing 60 and 80 g/L initial glucose were additionally examined by transmission electron microscopy to compare intracellular inclusion formation.
2.9. Effect of Fe2+ Concentration
The effect of Fe2+ concentration on RL production was evaluated using a medium containing 100 g/L glucose. All fermentations were performed at pH 7.2. Fe2+ concentrations of 3.6, 7.2, 10.8, and 14.4 μM were obtained by adjusting the amount of FeSO4·7H2O, while the concentrations of the remaining trace elements were kept constant.
2.10. Fermentation Under the Selected Conditions
The selected nitrogen-source composition, pH, C/N ratio, glucose concentration, and Fe2+ concentration identified above were combined for fermentation under the selected conditions in the 5 L bioreactor. The final fermentation medium contained 100 g/L glucose, 23.5 mM (NH4)2HPO4, 47 mM NaNO3, 0.5 g/L KH2PO4, 0.2 g/L MgSO4·7H2O, 0.1 g/L CaCl2, 1 g/L NaCl, 1 g/L KCl, 0.5 g/L yeast extract, and 2 mL/L trace-element solution. FeSO4·7H2O was adjusted to provide a final Fe2+ concentration of 10.8 μM, while the remaining trace elements remained unchanged. Fermentation was conducted at 37 °C with the pH controlled at 7.2. Samples were collected periodically to determine residual glucose, NH4+, dry cell weight, and RL concentrations.
2.11. Comparison of RL Production Among Different Strains
To compare strain-dependent differences in glucose-based RL production, P. aeruginosa YM4, PAO1, HN, and HEB were cultivated using the selected fermentation medium described in Section 2.10. The fermentation pH was maintained at 7.2, and the other cultivation conditions were maintained as described in Section 2.4. The RL products produced by the four strains were further analyzed by high-performance liquid chromatography coupled with an evaporative light-scattering detector (HPLC-ELSD) to compare the proportions of mono-rhamnolipids and di-rhamnolipids.
2.12. Analytical Methods
RLs in the fermentation broth were quantified by HPLC-ELSD, as previously described by Li et al. [8]. Briefly, fermentation broth samples were centrifuged to remove cells. The resulting supernatants were appropriately diluted and filtered through a 0.22 μm membrane. HPLC-ELSD analysis was performed using an Agilent 1260 Infinity HPLC system (Agilent Technologies, Palo Alto, CA, USA) equipped with an evaporative light-scattering detector (ELSD 2000ES, Alltech Associates, Inc., Deerfield, IL, USA) and a C18 column (4.6 × 150 mm, 5 μm; Sepax Technologies, Suzhou, China). Acetonitrile and water containing 0.05% formic acid were used as the mobile phases, with a linear gradient of acetonitrile from 30% to 100% over 40 min at a flow rate of 1 mL/min. The ELSD drift temperature was set at 103 °C, and the nebulizer gas flow rate was 2.8 L/min. RLs were quantified using a commercial RL standard (AGAE-R90, catalog No. A791255126058; AGAE Technologies, Corvallis, OR, USA; purity, 90%), containing approximately 55.4% di-rhamnolipids and 44% mono-rhamnolipids according to the supplier. Mono-rhamnolipid and di-rhamnolipid fractions were assigned based on the reported retention times of the major rhamnolipid congeners, and their relative proportions were calculated from the integrated peak areas. The calibration curve was established over an RL concentration range of 0.2–1.4 mg/mL using logarithmically transformed concentration and peak-area data, yielding the regression equation y = 1.8978x + 2.222 with an R2 of 0.9964, where x and y represent the logarithms of RL concentration and HPLC-ELSD peak area, respectively.
Glucose concentration was measured using an SBA-40C bioanalyzer equipped with a glucose oxidase electrode (Institute of Biology, Shandong Academy of Sciences, Jinan, China). The NH4+ concentration in the fermentation broth was determined using the Nessler reagent spectrophotometric method. Biomass was determined as either dry cell weight (DCW) or OD600, depending on the experiment. For DCW determination, 10 mL of fermentation broth was centrifuged at 12,000 rpm and 4 °C for 10 min, and the resulting cell pellet was dried at 70 °C overnight and weighed gravimetrically. For OD600 determination, appropriately diluted fermentation broth samples were measured spectrophotometrically at 600 nm.
Volumetric RL productivity (mg/L/h) was calculated by dividing the final RL concentration by the corresponding fermentation time. Each fermentation condition was evaluated in an individual 5 L bioreactor run, and the reported error bars represent the standard deviations of repeated analytical measurements.
2.13. Transmission Electron Microscopy
Cells collected at the end of fermentation were fixed, dehydrated, embedded, and sectioned according to standard procedures for transmission electron microscopy. Ultrathin sections of approximately 70–90 nm were prepared using a Leica EM UC7 ultramicrotome (Leica Microsystems GmbH, Vienna, Austria), stained with uranyl acetate and lead citrate, and examined using a Hitachi HT7800 transmission electron microscope (Hitachi High-Tech Corporation, Tokyo, Japan) operated at 80 kV. Because the chemical composition of the observed intracellular structures was not independently determined, they are referred to as intracellular inclusions in this study.
2.14. Fermentation Kinetic Analysis
The major fermentation variables were defined as glucose concentration (S, g/L), dry cell weight (X, g/L), and RL concentration (P, g/L). Biomass growth was described using the logistic growth model, whereas RL formation was evaluated using the Luedeking–Piret model [19]:
where μm is the maximum specific growth rate, Xm is the maximum biomass concentration, α and β are the growth-associated and non-growth-associated product-formation coefficients, respectively. The corresponding model parameters and goodness-of-fit values were obtained by nonlinear regression and are summarized in Table S1.
dX/dt = μmX(1 − X/Xm)
dP/dt = α(dX/dt) + βX
The apparent biomass yield and RL yield based on glucose consumption were calculated as
where X0 and Xf are the initial and final biomass concentrations, P0 and Pf are the initial and final RL concentrations, and S0 and Sf are the initial and final glucose concentrations, respectively.
YX/S = (Xf − X0)/(S0 − Sf)
YP/S = (Pf − P0)/(S0 − Sf)
To further characterize the temporal changes in biomass formation and RL production, the instantaneous biomass formation rate (rX, g DCW/(L·h)) and instantaneous RL production rate (rP, g RL/(L·h)) were calculated from the first derivatives of the fitted biomass and RL concentration profiles:
rX = dX/dt
rP = dP/dt
The maximum values of rX and rP, together with the corresponding fermentation times, were determined from the derivative curves. Kinetic model fitting and data processing were performed using Origin 2021 software (OriginLab Corporation, Northampton, MA, USA).
3. Results and Discussion
3.1. Effect of Nitrogen Source and pH
In our previous studies, strain YM4 produced more than 20 g/L RL under shake-flask conditions when soybean oil or glycerol was used as the carbon source and NaNO3 was supplied as the nitrogen source [8]. To determine whether the preference for NaNO3 observed in previous oil-or glycerol-based fermentations remained applicable to glucose fermentation, four nitrogen sources, including NaNO3, soy peptone, (NH4)2HPO4, and a mixed inorganic nitrogen source containing equimolar NH4+ and NO3− were compared. Nitrate is generally considered a favorable nitrogen source for RL production when oils are used as carbon substrates, whereas ammonium nitrogen has often been associated with lower RL production [15,16]. When NaNO3 was used as the sole nitrogen source, strain YM4 produced only 0.3 g/L RLs and reached a final biomass concentration of 0.9 g/L (Table 1). Cultures grown with peptone reached a higher biomass concentration (4.7 g/L), but the RL titer remained low at 1.5 g/L. Using (NH4)2HPO4 as the nitrogen source resulted in an RL titer of 3.2 g/L and a biomass concentration of 3.9 g/L. In contrast, the mixed nitrogen source resulted in an RL titer of 14.1 g/L and a DCW of 3.8 g/L (Table 1). These results indicate that RL production was not solely associated with biomass formation.
Table 1.
Effect of nitrogen sources on RL production and biomass formation by P. aeruginosa YM4 under the tested fermentation conditions.
The final culture pH varied among the nitrogen treatments. Despite phosphate buffering, NaNO3, soy peptone, and (NH4)2HPO4 cultures acidified to pH 4.0, 4.8, and 5.5, respectively, whereas the mixed nitrogen culture maintained a higher final pH of 6.5 and showed the highest RL production. These findings suggest that acidification may represent an important limitation during glucose-based fermentation.
To further evaluate the effect of acidification, nitrogen-source experiments were repeated in a 5 L bioreactor with pH controlled at 7.0. Under controlled-pH conditions, RL titers increased to 10.1, 14.4, and 18.2 g/L for NaNO3, (NH4)2HPO4, and the mixed nitrogen source, respectively. The increase in RL production from 0.3 to 10.1 g/L under controlled-pH conditions suggests that acidification substantially affected RL production in shake-flask fermentation, rather than nitrogen source composition alone determining RL production. The mixed nitrogen source still achieved the highest RL titer and a productivity of 252.8 mg/L/h, whereas soy peptone promoted biomass formation (10.8 g/L) but resulted in an RL titer of only 4.2 g/L. Therefore, the mixed nitrogen source was selected for subsequent pH evaluation.
3.2. Effect of Fermentation pH on Glucose Utilization and RL Production
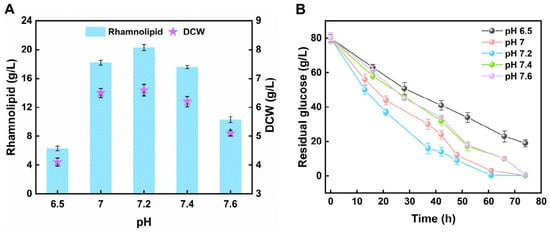
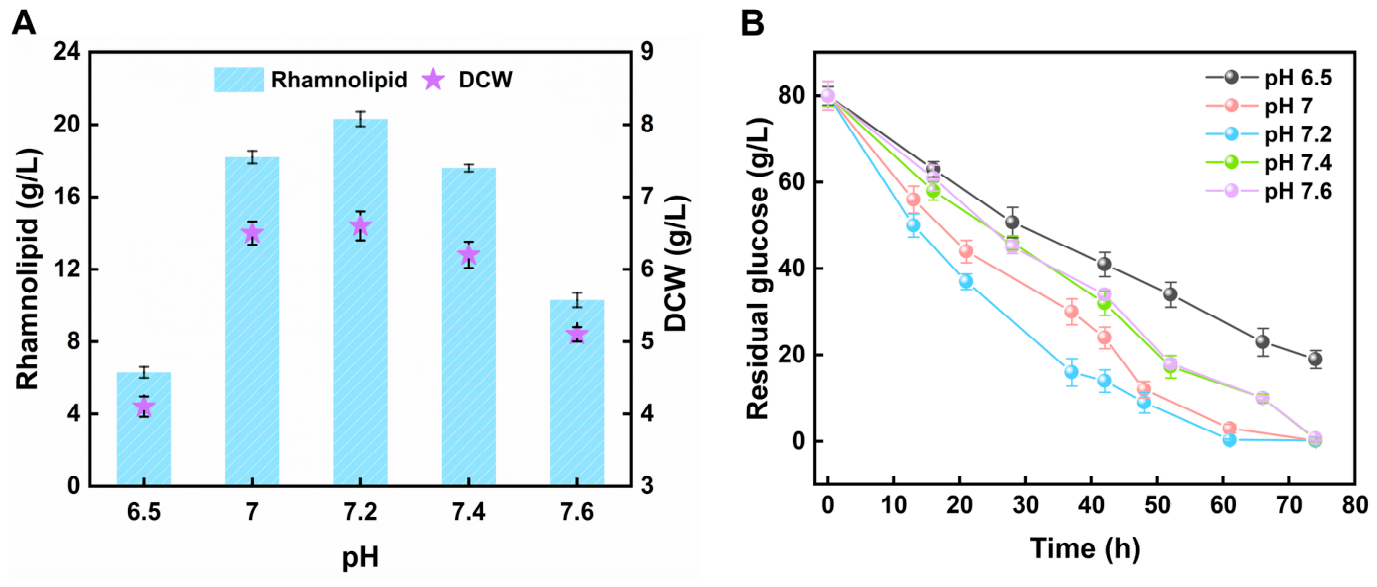
The nitrogen-source experiments indicated that culture acidification was likely an important limitation in glucose-based fermentation. As shown in Figure 1A, both biomass accumulation and RL production were strongly affected by fermentation pH. At pH 6.5, only 6.3 g/L RL was produced. Increasing the pH to 7.0–7.4 increased RL production, with the highest titer (20.3 g/L) obtained at pH 7.2. Further increasing the pH to 7.6 reduced both biomass and RL production. Glucose consumption showed a similar trend (Figure 1B). At pH 7.2, glucose was almost completely consumed within approximately 62 h, whereas more than 20 g/L remained after 74 h at pH 6.5.
Figure 1.
Effect of fermentation pH on (A) RL titer and DCW and (B) glucose consumption by P. aeruginosa YM4 cultivated in a 5 L bioreactor with 80 g/L glucose and a mixed NH4+/NO3− nitrogen source. Data are presented as the mean ± SD of repeated analytical measurements.
Previous studies have identified fermentation pH as an important factor affecting cell growth and RL production. For example, Soares dos Santos et al. [17] reported that pH 7.0 supported the highest RL production by P. aeruginosa PA1 under batch fermentation, whereas deviations from this value reduced productivity. Earlier glucose-based studies also reported reduced growth and RL production when the fermentation pH deviated from the favorable range [18]. Consistent with these findings, YM4 showed the highest RL production at pH 7.2. In addition, the present results suggest that the favorable pH facilitated glucose utilization and that culture acidification was an important constraint in glucose-based RL fermentation.
3.3. Effect of C/N Ratio on Biomass Formation and RL Production
After selecting pH 7.2 as the fermentation condition, the C/N ratio was varied from 18 to 53 with 80 g/L glucose to determine a suitable carbon–nitrogen balance for RL production. Glucose catabolism provides metabolic intermediates and reducing power for RL precursor synthesis in P. aeruginosa [20], and appropriate medium composition can improve RL production by balancing carbon utilization, precursor supply, and cell growth [21].
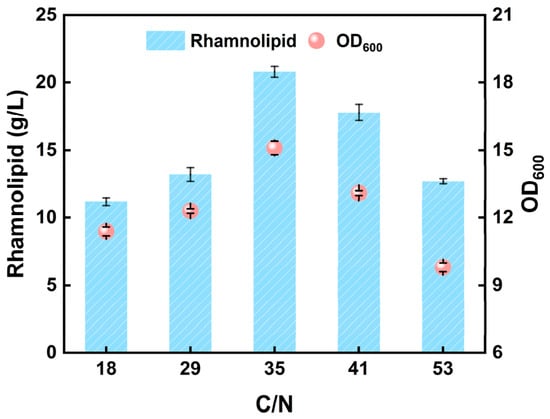
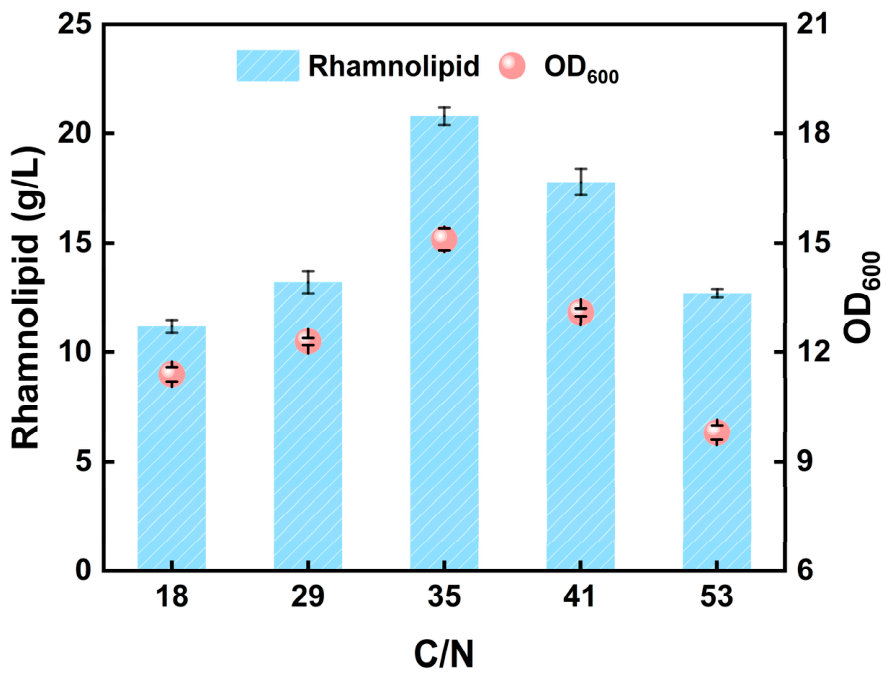
As shown in Figure 2, RL production and biomass both increased as the C/N ratio rose from 18 to 35, reaching 20.8 g/L and an OD600 of 15.1, respectively. Further increases to 41 and 53 reduced both RL production and biomass formation, indicating that both lower and higher C/N ratios were unfavorable for RL fermentation under the tested conditions. Thus, the higher RL production at C/N 35 was associated with balanced biomass formation and product accumulation.
Figure 2.
Effect of C/N ratio on RL production and biomass formation by P. aeruginosa YM4 cultivated in a 5 L bioreactor with 80 g/L glucose at pH 7.2. The C/N ratio ranged from 18 to 53. Data are presented as the mean ± SD of repeated analytical measurements.
Notably, the favorable C/N ratio was identical to that previously determined for YM4 with soybean oil, despite the known effects of carbon source on RL titer and congener distribution [6]. This suggests that a similar C/N balance may be favorable for YM4 with both glucose and soybean oil under the respective tested conditions [8]. A C/N ratio of 35 was therefore used in subsequent experiments to evaluate the effect of initial glucose concentration.
3.4. Effect of Glucose Concentration on RL Production
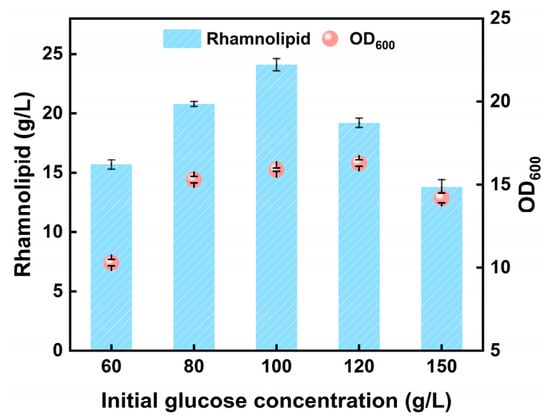
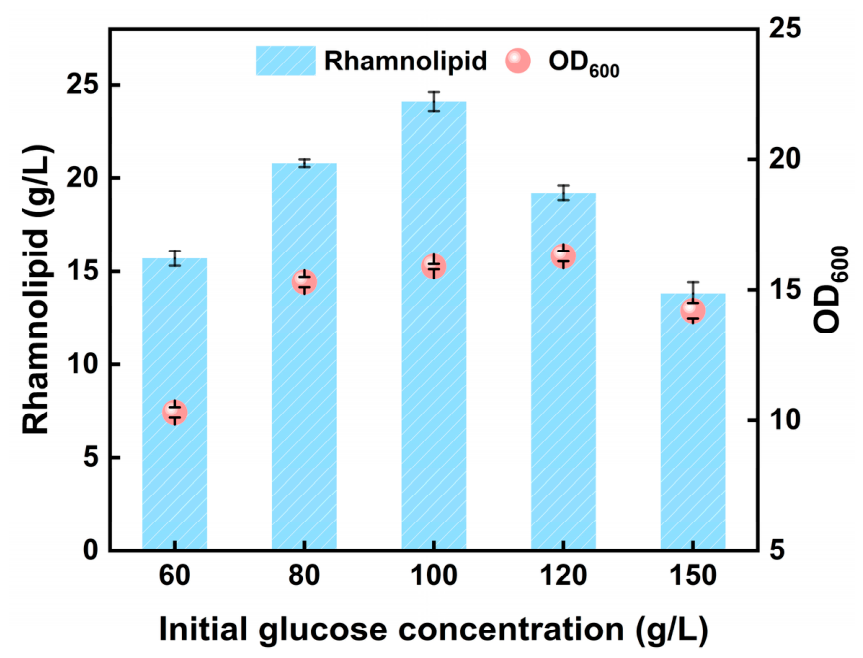
Increasing the initial substrate concentration is a common strategy to increase product titer, provided that the additional carbon can be efficiently consumed. However, previous studies have shown that increasing glucose concentration does not always improve RL production. Reduced production at higher glucose concentrations has been reported for several Pseudomonas strains [22,23]. To identify the initial glucose concentration that resulted in the highest RL titer, fermentations were performed with glucose concentrations ranging from 60 to 150 g/L while maintaining pH at 7.2 and a C/N ratio of 35.
Increasing the glucose concentration from 60 to 100 g/L increased the RL titer from 15.7 to 24.1 g/L (Figure 3). At 100 g/L glucose, most of the glucose was consumed, with only 3.4 g/L remaining at the end of fermentation. Increasing the glucose concentration beyond 100 g/L did not further improve RL production.
Figure 3.
Effect of the initial glucose concentration on RL production and biomass formation by P. aeruginosa YM4 cultivated in a 5 L bioreactor at pH 7.2 with a C/N ratio of 35. Initial glucose concentrations ranged from 60 to 150 g/L. Fermentation was terminated when the residual glucose concentration decreased below 5 g/L or after 96 h when glucose was not completely consumed. Data are presented as the mean ± SD of repeated analytical measurements.
At 120 and 150 g/L glucose, the final RL titers decreased, while substantial amounts of substrate remained unused. Residual glucose reached 64.9 g/L at an initial concentration of 150 g/L. These results suggest that YM4 was unable to efficiently utilize the additional glucose supplied at higher initial concentrations under the tested conditions. Increasing the initial glucose concentration beyond 100 g/L did not further increase RL production under the tested conditions.
Cell morphology also changed with increasing glucose concentration. When the glucose concentration increased from 60 to 80 g/L, OD600 rose from 10.3 to 15.3. TEM observations further showed intracellular inclusions in cells cultivated under increased glucose supply (Figure S1). Although the chemical nature of these inclusions was not determined, their occurrence may be associated with increased intracellular carbon storage under carbon-rich conditions [24]. Together with the increased residual glucose concentration and lower RL production, these results indicate that further increasing glucose supply was not beneficial to RL production.
3.5. Effect of Fe2+ Concentration on RL Production
After determining the carbon and nitrogen conditions, the effect of Fe2+ concentration was investigated. Iron is required for multiple cellular processes and has been reported to affect RL production and the expression of RL biosynthetic genes in P. aeruginosa. Shatila et al. [14] showed that both iron form and concentration influenced RL production and the expression of rhlA, rhlB, and rhlR. Jiang et al. [25] also identified a low FeSO4 concentration as favorable for high-productivity RL fermentation.
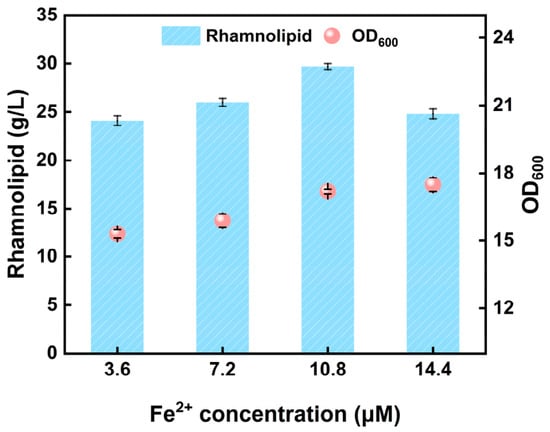
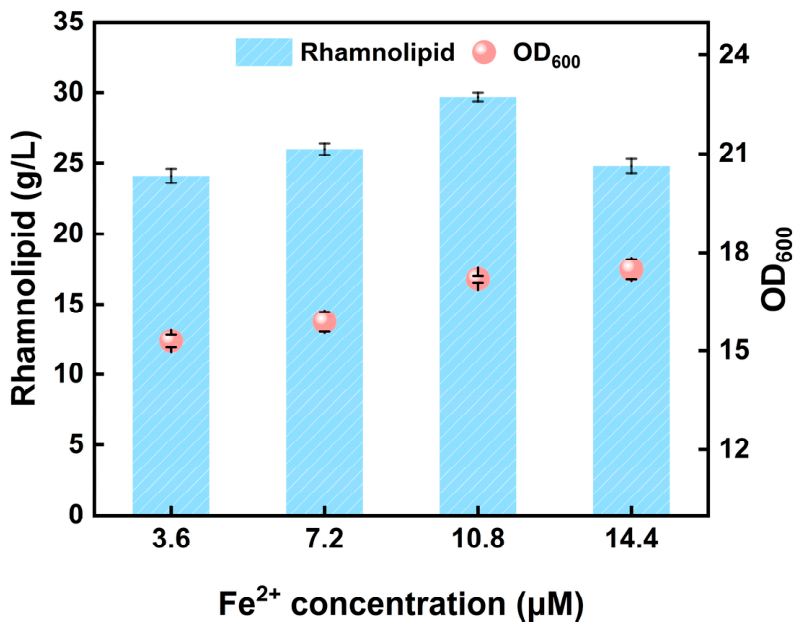
As shown in Figure 4, increasing the Fe2+ concentration from 3.6 to 10.8 μM increased the RL titer from 24.1 to 29.7 g/L. During the same range, OD600 increased from 15.3 to 17.2. However, when Fe2+ was further increased to 14.4 μM, RL production decreased, whereas biomass accumulation was not markedly affected. The different responses of biomass and RL production at the highest Fe2+ concentration indicate that the effect of Fe2+ was not solely related to changes in cell growth. Instead, RL formation appeared to be sensitive to the tested range of iron availability. This observation is consistent with previous reports showing concentration-dependent effects of iron on RL production [14]. The highest RL titer was obtained at 10.8 μM Fe2+. Based on the preceding experiments, the conditions selected for further characterization were therefore 100 g/L glucose, a mixed NH4+/NO3− nitrogen source at C/N 35, pH 7.2, and 10.8 μM Fe2+.
Figure 4.
Effect of Fe2+ concentration on RL production and biomass formation by P. aeruginosa YM4 cultivated with 100 g/L glucose at pH 7.2 and a C/N ratio of 35. The Fe2+ concentration was varied from 3.6 to 14.4 μM by adjusting the concentration of FeSO4·7H2O in the trace-element solution. Data are presented as the mean ± SD of repeated analytical measurements.
3.6. Fermentation Profile and Kinetics Under the Selected Conditions
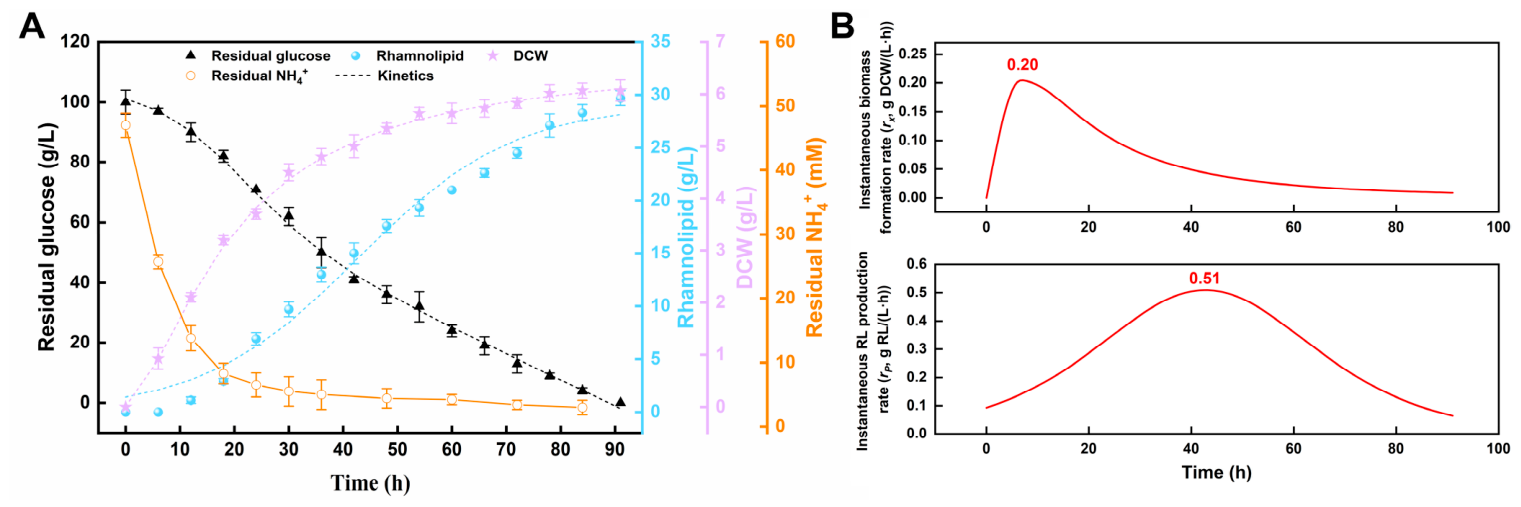
The fermentation process was subsequently characterized under the selected fermentation conditions. Glucose consumption, biomass formation, RL production, NH4+ concentration, instantaneous biomass formation rate, and instantaneous RL production rate were monitored to characterize the temporal relationship between biomass formation and RL accumulation.
As shown in Figure 5A, biomass accumulated rapidly during the early stage of fermentation, while RL accumulation remained relatively limited. The instantaneous biomass formation rate (rX) reached a maximum of 0.20 g DCW/(L·h) at approximately 7.4 h (Figure 5B). As fermentation proceeded, the NH4+ concentration decreased and subsequently remained at approximately 3 mM, while biomass accumulation slowed and RL production continued. The instantaneous RL production rate (rP) reached a maximum of 0.51 g RL/(L·h) at approximately 42.7 h, considerably later than the maximum biomass formation rate. These profiles indicate a temporal separation between rapid biomass formation and the period of highest RL production.
Figure 5.
Fermentation profiles and related kinetic parameters under the selected fermentation conditions. (A) Time-course profiles of glucose consumption, NH4+ consumption, RL production, and biomass formation together with the corresponding fitted concentration profiles. (B) Instantaneous biomass formation rate (rx, g DCW/(L·h)) and instantaneous RL production rate (rP, g RL/(L·h)), obtained from the first derivatives of the fitted biomass and RL concentration profiles.
Independent kinetic model fitting showed that the Logistic model adequately described biomass growth (R2 = 0.979), while the Luedeking–Piret model showed good agreement with the RL production data (R2 = 0.994). The positive growth-associated and non-growth-associated coefficients suggested contributions from both growth-associated and non-growth-associated RL formation. Detailed kinetic parameters and apparent fermentation yields are summarized in Table S1. Changes in NH4+ concentration may help explain the performance of the mixed nitrogen source. The rapid decline in NH4+ during early fermentation suggests that ammonium mainly supported initial biomass formation, whereas nitrate may have contributed to nitrogen availability during later fermentation. However, nitrate consumption was not directly measured in this study.
At 91 h, the RL titer reached 29.7 g/L, corresponding to a volumetric productivity of 326.4 mg/L/h and a final dry cell weight of 6.0 g/L. Compared with the initial 5 L fermentation using the mixed nitrogen source at pH 7.0, sequential evaluation of pH, C/N ratio, glucose concentration, and Fe2+ increased the RL titer from 18.2 to 29.7 g/L and improved volumetric productivity from 252.8 to 326.4 mg/L/h. Overall, the fermentation kinetics indicate rapid biomass formation during the early stage, followed by continued RL accumulation after growth slowed. These observations also help explain why the highest biomass obtained during nitrogen-source screening did not correspond to the highest RL titer.
3.7. RL Production and Composition Among Different P. aeruginosa Strains
To determine whether the higher RL production of YM4 was mainly associated with strain characteristics or the selected fermentation conditions, three additional P. aeruginosa strains, PAO1, HN, and HEB, were cultivated under the same conditions.
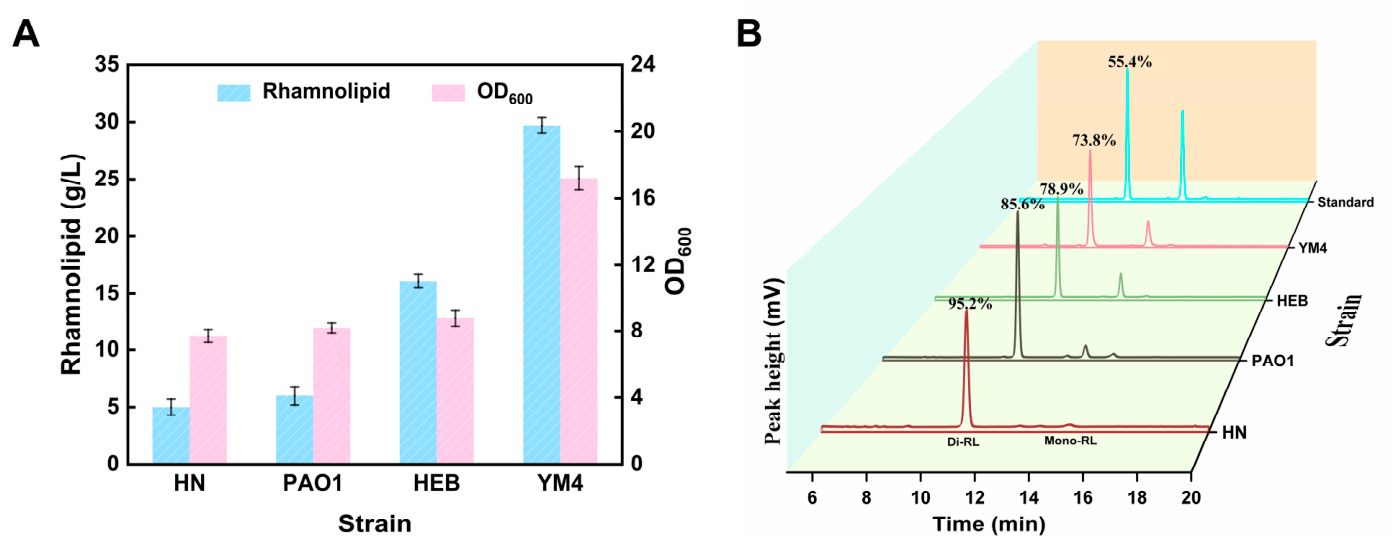
As shown in Figure 6A, considerable differences were observed among the four strains. PAO1 and HN produced approximately 5–6 g/L RLs, whereas HEB produced 16.2 g/L RLs. In comparison, YM4 produced 29.7 g/L under the same fermentation conditions. These results indicate that the higher RL production of YM4 was not solely attributable to the selected medium composition and process conditions, but was also strongly influenced by strain background. The substantially higher production of YM4 under the same culture conditions supports its suitability for glucose-based RL fermentation.
Figure 6.
RL production profiles of different P. aeruginosa strains under the selected fermentation conditions. (A) RL titers and OD600 values of the four strains (HN, PAO1, HEB, YM4). (B) Relative proportions of mono- and di-rhamnolipids calculated from their integrated HPLC-ELSD peak areas relative to the total RL peak area.
The RL composition also differed among the strains (Figure 6B). Under glucose-based cultivation, di-rhamnolipids accounted for 73.8–95.2% of the total integrated RL peak area in the HPLC-ELSD chromatograms, with proportions of 95.2%, 85.6%, 78.9%, and 73.8% for HN, PAO1, HEB, and YM4, respectively. Thus, although YM4 achieved the highest total RL titer among the four strains, it did not exhibit the highest relative proportion of di-rhamnolipids. Zhao et al. [6], for example, reported differences in mono- and di-rhamnolipid composition when glucose and soybean oil were used by the same P. aeruginosa strain. These results indicate that total RL production and congener distribution are strain-dependent characteristics that should be considered separately. In the present study, the main advantage of YM4 was its substantially higher total RL production while still producing a di-rhamnolipid-rich product mixture.
Our previous studies also showed that the proportion of di-rhamnolipids produced by YM4 depended on the carbon substrate, reaching approximately 65% with soybean oil and 86% with glycerol [8]. PAO1 and HN similarly produced lower di-rhamnolipid fractions with soybean oil than those observed here with glucose. The present results suggest that glucose fermentation resulted in a di-rhamnolipid-rich profile among the strains examined, although the extent of this effect remained strain-dependent. To place the performance of YM4 in the context of previously reported glucose-based processes, published studies were compared in Table 2. Most reported glucose-based fermentations with P. aeruginosa produced less than 10 g/L RLs. YM4 produced 29.7 g/L within 91 h, corresponding to a volumetric productivity of 326.4 mg/L/h, indicating its potential for high-titer glucose-based RL production. Despite the favorable fermentation performance at the 5 L scale, further process development is required before larger-scale application. In particular, dissolved-oxygen dynamics and oxygen-transfer requirements should be characterized during scale-up, as dissolved oxygen was not actively controlled in the present study and may influence glucose metabolism, biomass formation, and RL production. Process economics, downstream recovery, and robustness at larger scales also remain to be evaluated. In addition, because P. aeruginosa is an opportunistic pathogen, appropriate containment, sterilization, and waste treatment strategies would be essential for any future large-scale implementation.
Table 2.
RL production by different strains using glucose-based fermentation.
4. Conclusions
A glucose-based fermentation process for P. aeruginosa YM4 was established through sequential evaluation of nitrogen source, pH, C/N ratio, initial glucose concentration, and Fe2+ supplementation. The selected conditions resulted in an RL titer of 29.7 g/L with a volumetric productivity of 326.4 mg/L/h, and the produced RL mixture contained 73.8% di-rhamnolipids. Fermentation profiling and kinetic analysis showed rapid biomass formation during the early cultivation stage, followed by continued RL accumulation after growth slowed. The kinetic analysis further indicated contributions from both growth-associated and non-growth-associated RL formation. YM4 also achieved substantially higher RL titers than the three additional P. aeruginosa strains tested under the same conditions. These results support further investigation of glucose-based RL fermentation, although oxygen-transfer control, process economics, downstream recovery, scale-up performance, and biosafety require further evaluation.
Supplementary Materials
The following supporting information can be downloaded at: https://www.mdpi.com/article/10.3390/fermentation12100487/s1, Figure S1: Representative TEM images showing intracellular inclusions in P. aeruginosa YM4 cells at the end of fermentation under initial glucose concentrations of 60 g/L (left) and 80 g/L (right); Table S1: Kinetic parameters obtained from independent Logistic and Luedeking–Piret model fitting and apparent fermentation yields under the selected fermentation conditions.
Author Contributions
Y.W.: Data curation, Conceptualization, Writing—original draft. W.G.: Resources, Project administration. D.D.: Supervision, Resources, Project administration. K.J.: Resources, Project administration. S.L.: Conceptualization, Supervision, Writing—review and editing. W.T.: Conceptualization, Writing—original draft, Writing—review and editing, Supervision. All authors have read and agreed to the published version of the manuscript.
Funding
This research was funded by the “Tianshan Talents” Young Top Talents Program of Xinjiang Uygur Autonomous Region (Grant No. 2023TSYCCY0001).
Institutional Review Board Statement
Not applicable.
Informed Consent Statement
Not applicable.
Data Availability Statement
The data presented in this study are available from the corresponding author upon reasonable request.
Acknowledgments
The authors gratefully acknowledge the financial support from the “Tianshan Talents” Young Top Talents Program of Xinjiang Uygur Autonomous Region (Grant No. 2023TSYCCY0001). The authors also acknowledge the support provided by the collaborating companies during the implementation of this joint research project.
Conflicts of Interest
Author Wei Guo was employed by Xinjiang Oilfield Company. Author Ding Dong and Kai Ji were employed by Karamay Xinaoda Petroleum Technology Service Co., Ltd. The remaining authors declare that the research was conducted in the absence of any commercial or financial relationships that could be construed as a potential conflict of interest.
References
- Baroi, A.M.; Chican, I.E.; Manaila-Maximean, D.; Fierascu, I.; Matei, R.I.; Fistos, T.; Fierascu, R.C. Natural Surfactants and Fermentation-Derived Solutions for Sustainable Decontamination of Fresh Produce: Mechanisms, Efficiency, and Industrial Perspectives. Sustainability 2026, 18, 6782. [Google Scholar] [CrossRef] [Scilit]
- Guzmán, E.; Ortega, F.; Rubio, R.G. Exploring the world of rhamnolipids: A critical review of their production, interfacial properties, and potential application. Curr. Opin. Colloid Interface Sci. 2024, 69, 101780. [Google Scholar] [CrossRef] [Scilit]
- Chong, H.Q.; Li, Q.X. Microbial production of rhamnolipids: Opportunities, challenges and strategies. Microb. Cell Factories. 2017, 16, 137. [Google Scholar] [CrossRef] [Scilit] [PubMed]
- Abdel-Mawgoud, A.M.; Lépine, F.; Déziel, E. Rhamnolipids: Diversity of structures, microbial origins and roles. Appl. Microbiol. Biotechnol. 2010, 86, 1323–1336. [Google Scholar] [CrossRef] [Scilit] [PubMed]
- Li, Z.; Gao, L.Y.; Su, S.Z.; Wang, R.; Lei, P.; Gu, Y.; Song, Y.T.; Xu, H.; Sun, L. Review in Structure-Activity Relationships, Synthetic Regulation, and Applications of Mono/Di-Rhamnolipids. Microorganisms 2026, 14, 570. [Google Scholar] [CrossRef] [Scilit] [PubMed]
- Zhao, F.; Han, S.Q.; Zhang, Y. Comparative studies on the structural composition, surface/interface activity and application potential of rhamnolipids produced by Pseudomonas aeruginosa using hydrophobic or hydrophilic substrates. Bioresour. Technol. 2020, 295, 122269. [Google Scholar] [CrossRef] [Scilit] [PubMed]
- Chen, I.C.; Lee, M.T. Rhamnolipid Biosurfactants for Oil Recovery: Salt Effects on the Structural Properties Investigated by Mesoscale Simulations. ACS Omega 2022, 7, 6223–6237. [Google Scholar] [CrossRef] [Scilit] [PubMed]
- Li, Z.; Zhang, Y.; Lin, J.; Wang, W.; Li, S. High-Yield Di-Rhamnolipid Production by Pseudomonas aeruginosa YM4 and its Potential Application in MEOR. Molecules 2019, 24, 1433. [Google Scholar] [CrossRef] [Scilit] [PubMed]
- Maji, D.; Ravichandran, D.; Dalal, G.; Kumar, K. Fermentative routes of microbial biosurfactants production: Emerging trends, innovations and multifaceted applications. Bioprocess Biosyst. Eng. 2026, 49, 2333–2352. [Google Scholar] [CrossRef] [Scilit] [PubMed]
- Thakur, V.; Baghmare, P.; Verma, A.; Verma, J.S.; Geed, S.R. Recent progress in microbial biosurfactants production strategies: Applications, technological bottlenecks, and future outlook. Bioresour. Technol. 2024, 408, 131211. [Google Scholar] [CrossRef] [Scilit] [PubMed]
- Sarma, N.; Deka, S.; Deka, H. Understanding the effects of different carbon sources in the inhibition potential of rhamnolipid biosurfactant against two phytopathogens. Biocontrol Sci. Technol. 2025, 35, 1159–1178. [Google Scholar] [CrossRef] [Scilit]
- Tan, Y.N.A.; Li, Q.X. Microbial production of rhamnolipids using sugars as carbon sources. Microb. Cell Fact. 2018, 17, 89. [Google Scholar] [CrossRef] [Scilit] [PubMed]
- Wittgens, A.; Tiso, T.; Arndt, T.T.; Wenk, P.; Hemmerich, J.; Müller, C.; Wichmann, R.; Küpper, B.; Zwick, M.; Wilhelm, S.; et al. Growth independent rhamnolipid production from glucose using the non-pathogenic Pseudomonas putida KT2440. Microb. Cell Fact. 2011, 10, 80. [Google Scholar] [CrossRef] [Scilit] [PubMed]
- Shatila, F.; Diallo, M.M.; Şahar, U.; Ozdemir, G.; Yalçın, H.T. The effect of carbon, nitrogen and iron ions on mono-rhamnolipid production and rhamnolipid synthesis gene expression by Pseudomonas aeruginosa ATCC 15442. Arch. Microbiol. 2020, 202, 1407–1417. [Google Scholar] [CrossRef] [Scilit] [PubMed]
- Alcalde, M.A.; Merino-Rafael, F.A.; Gutiérrez-Moreno, S.M. Optimization of mineral nutrients to improve rhamnolipid production by Pseudomonas aeruginosa 6 K-11. J. Chem. Technol. Biotechnol. 2024, 99, 2170–2177. [Google Scholar] [CrossRef] [Scilit]
- Zhou, J.; Liu, S.X.; Xie, B.; Wang, W.Y.; Xu, N.; Xu, A.M.; Dong, W.L.; Jiang, M. Enhancing rhamnolipid production through a two-stage fermentation control strategy based on metabolic engineering and nitrate feeding. Bioresour. Technol. 2023, 388, 129716. [Google Scholar] [CrossRef] [Scilit] [PubMed]
- dos Santos, A.S.; Pereira, N., Jr.; Freire, D.M.G. Strategies for improved rhamnolipid production by Pseudomonas aeruginosa PA1. Peerj 2016, 4, e2078. [Google Scholar] [CrossRef] [Scilit] [PubMed]
- Chen, S.Y.; Wei, Y.H.; Chang, J.S. Repeated pH-stat fed-batch fermentation for rhamnolipid production with indigenous Pseudomonas aeruginosa S2. Appl. Microbiol. Biotechnol. 2007, 76, 67–74. [Google Scholar] [CrossRef] [Scilit] [PubMed]
- Wang, X.Y.; Li, D.M.; Yue, S.H.; Yuan, Z.Z.; Li, S. A Rare Mono-Rhamnolipid Congener Efficiently Produced by Recombinant Pseudomonas aeruginosa YM4 via the Expression of Global Transcriptional Regulator irrE. Molecules 2024, 29, 1992. [Google Scholar] [CrossRef] [Scilit] [PubMed]
- De Oliveira, R.D.; Novello, V.; Da Silva, L.F.; Gomez, J.G.C.; Le Roux, G.A.C. Glucose metabolism in Pseudomonas aeruginosa is cyclic when producing Polyhydroxyalkanoates and Rhamnolipids. J. Biotechnol. 2021, 342, 54–63. [Google Scholar] [CrossRef] [Scilit] [PubMed]
- Pang, A.P.; Zhang, T.; Yang, K.; Wang, X.; Huang, L.; Zhang, B.; Liu, Z.Q.; Zheng, Y.G. Enhanced rhamnolipid production in Pseudomonas putida through systematic medium optimization and metabolic engineering. Bioresour. Technol. 2026, 447, 134198. [Google Scholar] [CrossRef] [Scilit] [PubMed]
- Varjani, S.J.; Upasani, V.N. Biodegradation of petroleum hydrocarbons by oleophilic strain of Pseudomonas aeruginosa NCIM 5514. Bioresour. Technol. 2016, 222, 195–201. [Google Scholar] [CrossRef] [Scilit] [PubMed]
- Radzuan, M.N.; Banat, I.M.; Winterburn, J. Production and characterization of rhamnolipid using palm oil agricultural refinery waste. Bioresour. Technol. 2017, 225, 99–105. [Google Scholar] [CrossRef] [Scilit] [PubMed]
- Nitschke, M.; Costa, S.; Contiero, J. Rhamnolipids and PHAs: Recent reports on Pseudomonas-derived molecules of increasing industrial interest. Process Biochem. 2011, 46, 621–630. [Google Scholar] [CrossRef] [Scilit]
- Jiang, J.J.; Zhang, D.Y.; Niu, J.; Jin, M.J.; Long, X.W. Extremely high-performance production of rhamnolipids by advanced sequential fed-batch fermentation with high cell density. J. Clean. Prod. 2021, 326, 129382. [Google Scholar] [CrossRef] [Scilit]
- Zhang, Y.; Liu, J.Y.; Fan, S.Q.; Qin, Y.M.; Xiao, Z.Y.; Chen, C.Y.; Yang, M.M.; Liu, W.L. Enhanced Fermentation for Rhamnolipid Production in a Membrane Bioreactor with a New Strain Pseudomonas aeruginosa BC1. Ind. Eng. Chem. Res. 2023, 62, 12269–12276. [Google Scholar] [CrossRef] [Scilit]
- Pathania, A.S.; Jana, A.K. Utilization of waste frying oil for rhamnolipid production by indigenous Pseudomonas aeruginosa: Improvement through co-substrate optimization. J. Environ. Chem. Eng. 2020, 8, 104304. [Google Scholar] [CrossRef] [Scilit]
- Ehinmitola, E.O.; Aransiola, E.F.; Adeagbo, O.P. Comparative study of various carbon sources on rhamnolipid production. S. Afr. J. Chem. Eng. 2018, 26, 42–48. [Google Scholar] [CrossRef] [Scilit]
- Lotfabad, T.B.; Shourian, M.; Roostaazad, R.; Najafabadi, A.R.; Adelzadeh, M.R.; Noghabi, K.A. An efficient biosurfactant-producing bacterium Pseudomonas aeruginosa MR01, isolated from oil excavation areas in south of Iran. Colloids Surf. B Biointerfaces 2009, 69, 183–193. [Google Scholar] [CrossRef] [Scilit] [PubMed]
- Varjani, S.J.; Upasani, V.N. Carbon spectrum utilization by an indigenous strain of Pseudomonas aeruginosa NCIM 5514: Production, characterization and surface active properties of biosurfactant. Bioresour. Technol. 2016, 221, 510–516. [Google Scholar] [CrossRef] [Scilit] [PubMed]
- Moussa, T.A.A.; Mohamed, M.S.; Samak, N. Production and characterization of di-rhamnolipid produced by Pseudomonas aeruginosa TMN. Braz. J. Chem. Eng. 2014, 31, 867–880. [Google Scholar] [CrossRef] [Scilit]
- Wu, J.Y.; Yeh, K.L.; Lu, W.B.; Lin, C.L.; Chang, J.S. Rhamnolipid production with indigenous Pseudomonas aeruginosa EM1 isolated from oil-contaminated site. Bioresour. Technol. 2008, 99, 1157–1164. [Google Scholar] [CrossRef] [Scilit]

Disclaimer/Publisher’s Note: The statements, opinions and data contained in all publications are solely those of the individual author(s) and contributor(s) and not of MDPI and/or the editor(s). MDPI and/or the editor(s) disclaim responsibility for any injury to people or property resulting from any ideas, methods, instructions or products referred to in the content. |
© 2026 by the authors. Licensee MDPI, Basel, Switzerland. This article is an open access article distributed under the terms and conditions of the Creative Commons Attribution (CC BY) license.