


Abstract
The Qiongzhusi Formation, a thick and vertically heterogeneous marine shale sequence in southern China, presents substantial obstacles to efficient hydraulic stimulation when conventional horizontal-well staged fracturing is applied, owing to marked interlayer contrasts in mineralogy, rock mechanics, and natural fracture intensity. To address this challenge, this study develops an integrated methodological framework that combines a comprehensive fracability index (IFI) with discrete-element-based fluid–solid coupling simulations, aimed at elucidating fluid-driven fracture propagation behaviors and their corresponding flow performance under separate-layer fracturing conditions. Using Well Z202 as a field case, the IFI is first constructed by incorporating mineral composition, mechanical properties, and natural fracture attributes to quantitatively rank the stimulability of individual layers. Subsequently, a discrete element hydraulic fracturing model is established, which explicitly resolves the transient fluid flow within fracture networks, the pressure-dependent initiation and extension of tensile fractures, and the dynamic evolution of fracture aperture and permeability in response to varying injection rates and fluid viscosities. The simulations reveal that fracture network geometry—and hence the effective fluid-flow pathway—is governed by a tripartite interplay: brittle mineral content dictates the locus of initial fracture opening, natural fracture density and orientation control fluid diversion and network interconnectivity, and the in situ stress state modulates fracture complexity and vertical growth potential. Critically, the results demonstrate that high-angle natural fractures substantially enhance vertical fluid connectivity, with a single perforation cluster generating a stimulated fracture height of up to 23.7 m, a finding corroborated by post-fracturing temperature logging. The modeled fracture heights align closely with field-observed production contributions: lower perforation clusters, which develop greater fracture half-heights, account for 4.0–4.6% of gas production, whereas upper clusters contribute only 1.4–2.9%, confirming the dominant influence of downward fluid-driven fracture propagation. Overall, the proposed workflow—integrating quantitative fracability evaluation, fluid–solid coupled numerical simulation, and field flow-data validation—offers a robust theoretical foundation for optimizing separate-layer fracturing design, with direct implications for injection strategy, fracture conductivity maintenance, and long-term productivity forecasting in thick shale reservoirs.
1. Introduction
Efficient development of shale gas that is an important component of clean energy holds strategic significance for ensuring national energy security [1,2,3]. The Qiongzhusi Formation, as an important and new target for the marine shale in southern China, has a vast resource potential [4,5,6]. The formation is very thick (up to 700 m drilled in a single well), and divided into eight layers vertically, but the rock minerals and mechanics and the development of natural fractures vary greatly between layers, presenting strong heterogeneity [7,8,9]. Confined by single targets and staged fracturing technology, traditional development through horizontal wells is difficult to fully stimulate the thick reservoirs, and consequently, the production capacity of some layers cannot be effectively utilized. Fortunately, separate-layer fracturing technology provides a feasible solution to ending the problem [10,11,12]. Separate-layer fracturing operation follows a reasonable separate layer and cluster scheme designed on the differences in fracability among different layers to enable hydraulic fractures to propagate and form a fracture network in the vertical direction. In the Qiongzhusi Formation, the propagation of hydraulic fractures is likely stopped, deflected, or terminated due to bedding planes and natural fractures, thereby limiting the stimulated reservoir volume (SRV) and affecting production capacity. Field practice has shown that SRV is jointly controlled by multiple factors such as mineral composition, fracture structure, in situ stress, pore structure, and gas saturation, and their configuration within and between layers determines the effectiveness of stimulation and production capacity [13,14,15,16,17,18]. Therefore, it is urgent to identify the favorable fracability layers and clarify the response laws of fracture morphology to layer differences.
Fracability evaluation is a crucial step connecting geological understanding with fracturing design, which have been studied by many scholars both domestically and internationally [19,20,21,22]. Rickman et al. constructed a brittleness index based on rock elastic modulus and Poisson’s ratio, which has been widely used as a basic method [23]. Most studies constructed index systems in terms of rock brittleness, strength and toughness, natural fracture development, stress difference, and anisotropy. Among them, the brittleness index based on elastic modulus and Poisson’s ratio is widely applied due to its ease of integration with logging, rock mineral, and mechanical experiments. However, in shale, brittleness is not a simple mapping of the elastic parameter. It is controlled by organic matter, minerals, micro-cracks, and bedding orientation, especially in strongly anisotropic layered media, where there is no stable relation between mechanical parameters and fracture propagation behaviors. To enhance the correlation between evaluation results and engineering responses, some scholars considered geological and engineering parameters, and constructed comprehensive indices from normalized or energy perspectives. However, uncertainties in fracture initiation and propagation due to multi-fracture interactions, fracture network effects, and inter-layer heterogeneity remain significant challenges.
Numerical simulation is an important means for revealing the mechanism of fracture evolution. Compared with the continuum method, the discrete element method can explicitly depict the processes of fracture initiation, extension, deflection and bifurcation at the particle scale, and has unique advantages in simulating the control effect of bedding planes and natural fractures on hydraulic fractures [24,25]. Some scholars have used the discrete element method to simulate the expansion of multiple fractures and their connected structure, but the work on establishing an interpretable correlation between the engineering-scale fracability evaluation results and the microscopic fracture evolution process should be done.
Based on the above understanding, this paper takes the shale of the Qiongzhusi Formation as the research object to construct a comprehensive fracability evaluation system integrating mineral composition, rock mechanics and natural fracture characteristics at the well scale, and identifies the favorable fracability layers and potential barriers through longitudinal comparison. Furthermore, a numerical hydraulic fracturing model is established using the discrete element method to analyze the responses of fracture initiation and expansion in different layers to inter-layer heterogeneity at the microscopic scale. The simulation results have been verified by field fracturing observation and microseismic, temperature and production data. The research aims to establish an integrated fracturing optimization method featuring “comprehensive evaluation-mechanism simulation-field verification”, providing theoretical basis and engineering support for the three-dimensional development of thick shale reservoirs and the selection of horizontal well targets.
2. Reservoir Geology
The Qiongzhusi Formation is divided into eight layers vertically (layers ① to ⑧). Layers ①, ③, ⑤, and ⑦ are organic-rich shale intervals, and layers ②, ④, ⑥, and ⑧ are composed of low-TOC shale. The layer thickness ranges from 50 to 160 m, and the total thickness of all layers is approximately 700 m. Of the eight layers, layer ④ is the thickest (162 m). Vertically, the lithology combination presents an alternating pattern of “rich organic matter-low TOC”, which provides natural vertical separators for separate-layer fracturing stimulation and controls the significant differences in reservoir quality and fracability among different layers.
2.1. Mineral Composition
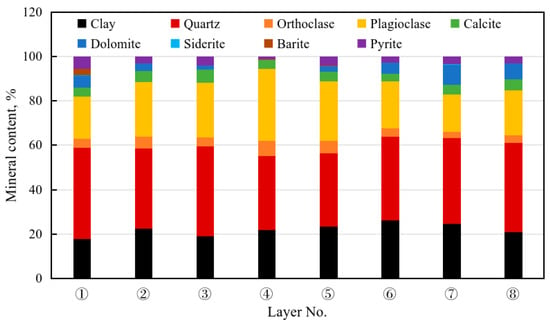
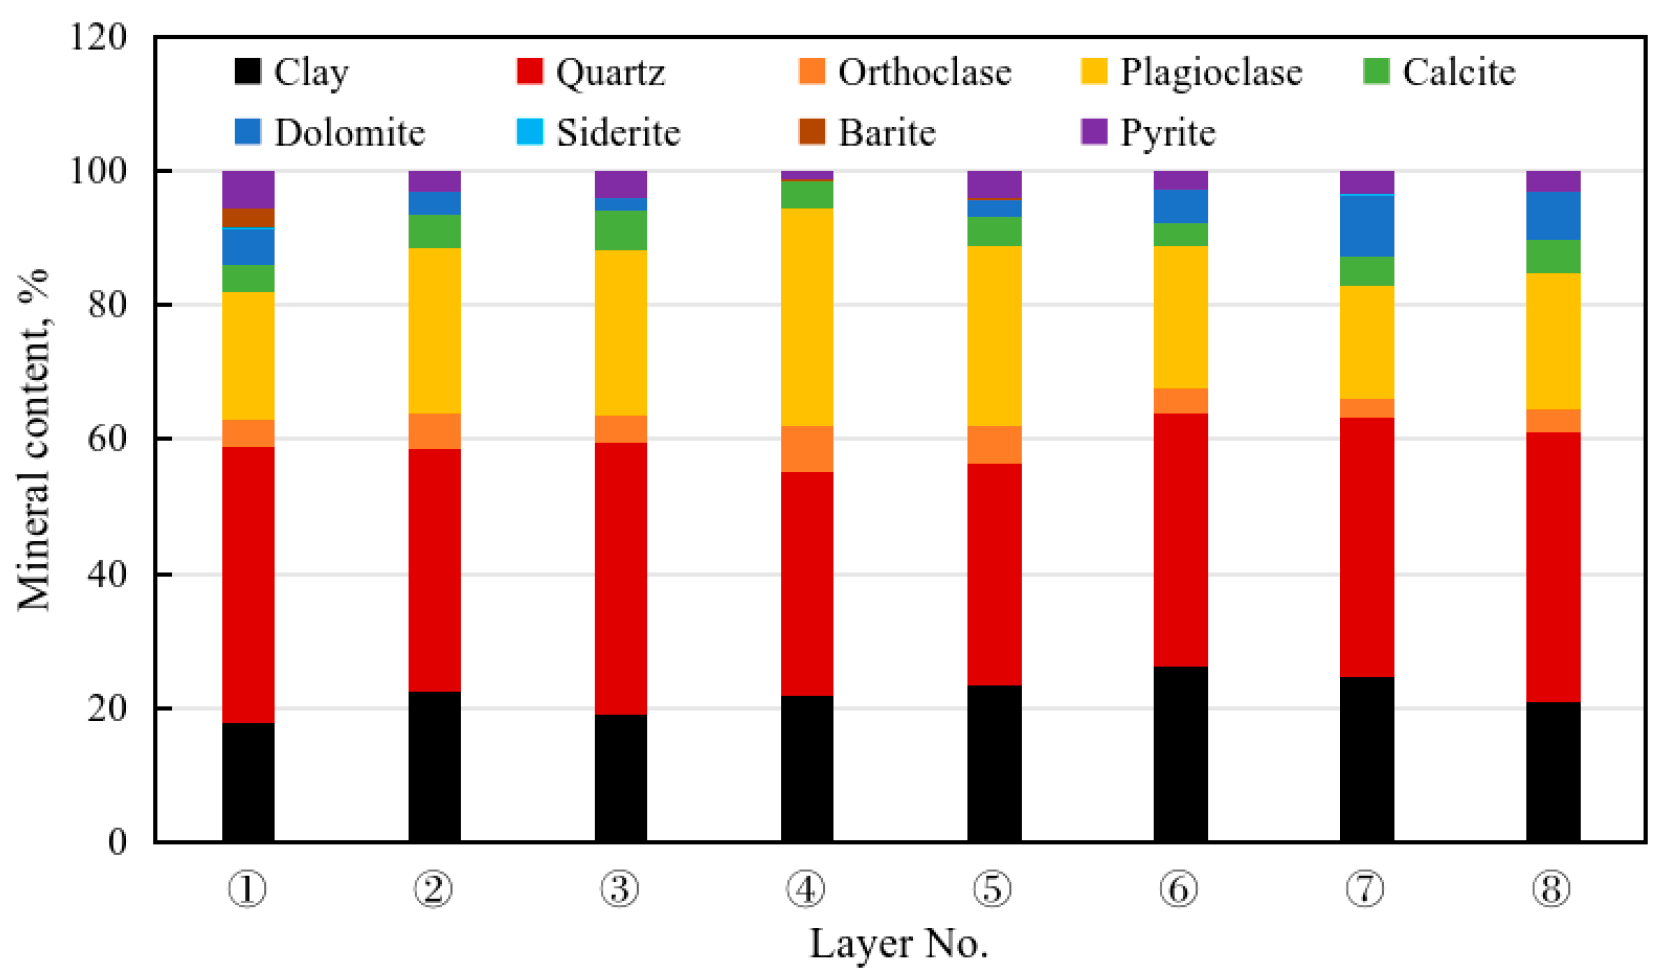
According to the experimental analysis data from Well Z202 drilled in the Qiongzhusi Formation, the mineral composition of the layers shows obvious heterogeneity. Figure 1 shows the cumulative distribution of mineral composition of eight small layers. The reservoir of the Qiongzhusi Formation is mainly composed of quartz and feldspar as the brittle framework, and the proportion of clay minerals ranges from 20% to 32%.
Figure 1.
The cumulative distribution of minerals in eight layers of the Qiongzhusi Formation in Well Z202.
2.2. Rock Mechanics
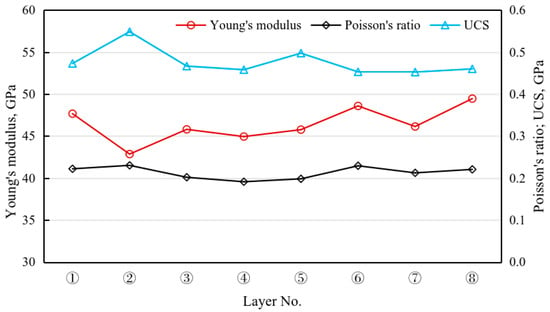
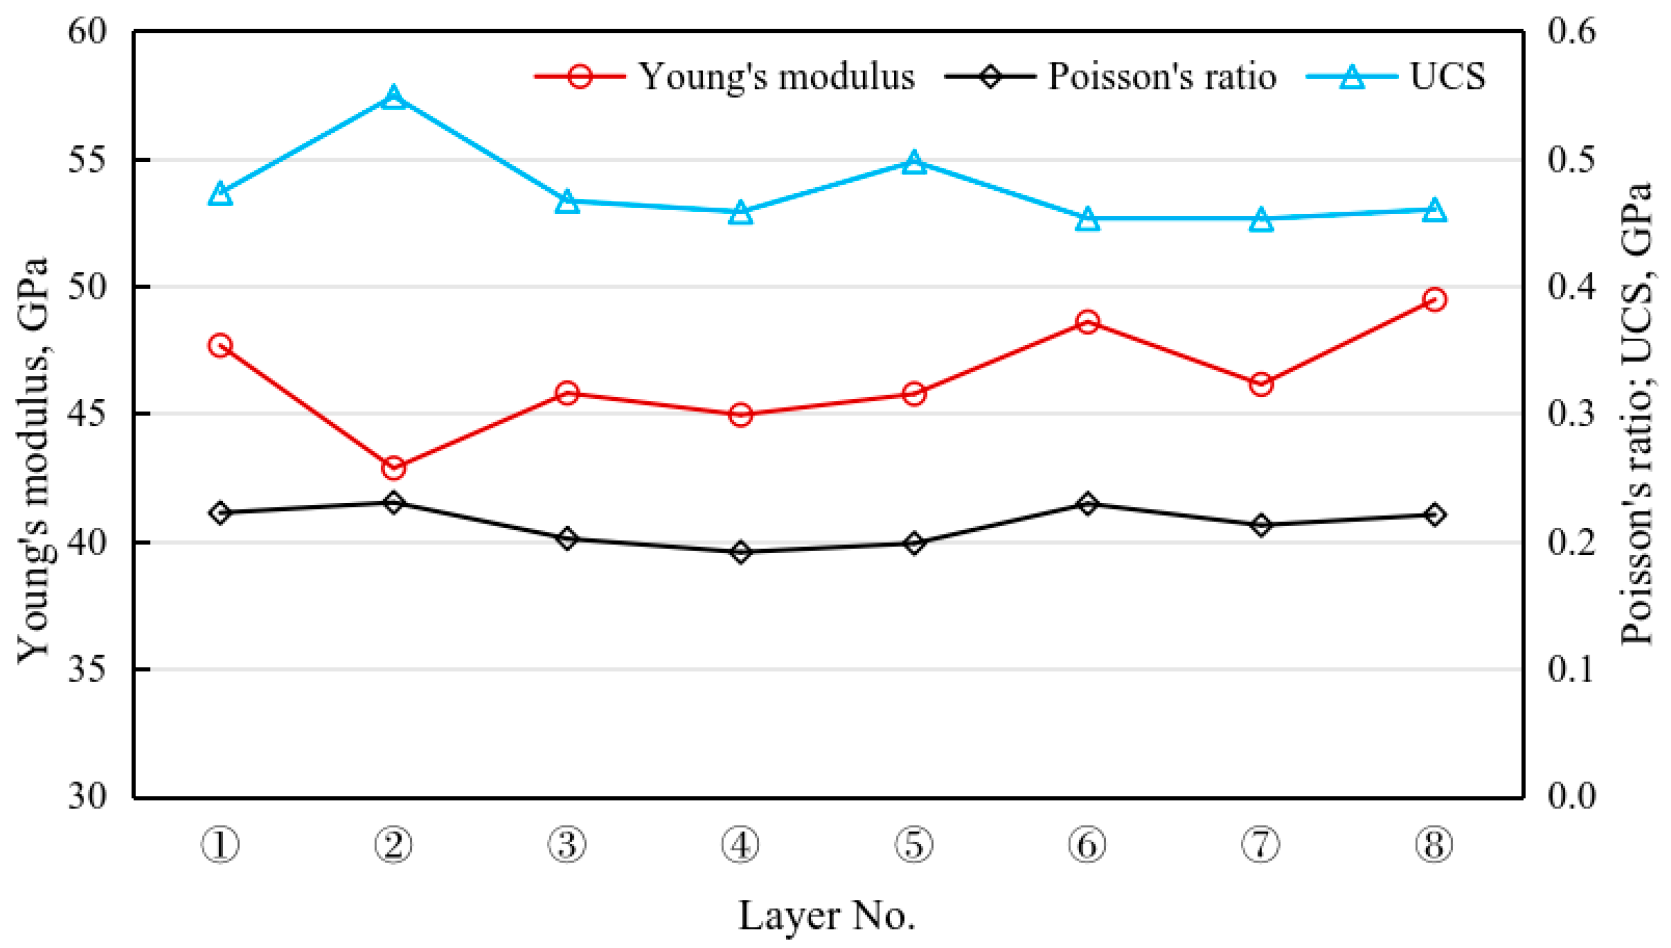
The mechanical profile of the entire section in Well Z202 was obtained through AC logging data and dynamic–static parameter conversion. As shown in Figure 2, the Young’s modulus fluctuates between 38 and 52 GPa, with layer ⑥ having the highest value. The Poisson’s ratio is relatively stable, maintaining between 0.20 and 0.22. The uniaxial compressive strength (UCS) is 420 to 560 MPa, with layers ②, ④ and ⑤ exhibiting higher matrix strength. From the vertical distribution, the Young’s modulus of the 5th and 7th layers (organic-rich shale) is low, and the brittleness index is higher; the 4th and 6th layers (low-TOC shale) have higher Young’s modulus, but the content of brittle minerals is also higher, showing better fracability; the 8th layer has the highest clay content (31.74%), and average Young’s modulus, but the plastic is high, so the fracability is low.
Figure 2.
Petrophysical parameters of eight Qiongzhusi Formation layers in Well Z202.
2.3. Distribution of Natural Fractures
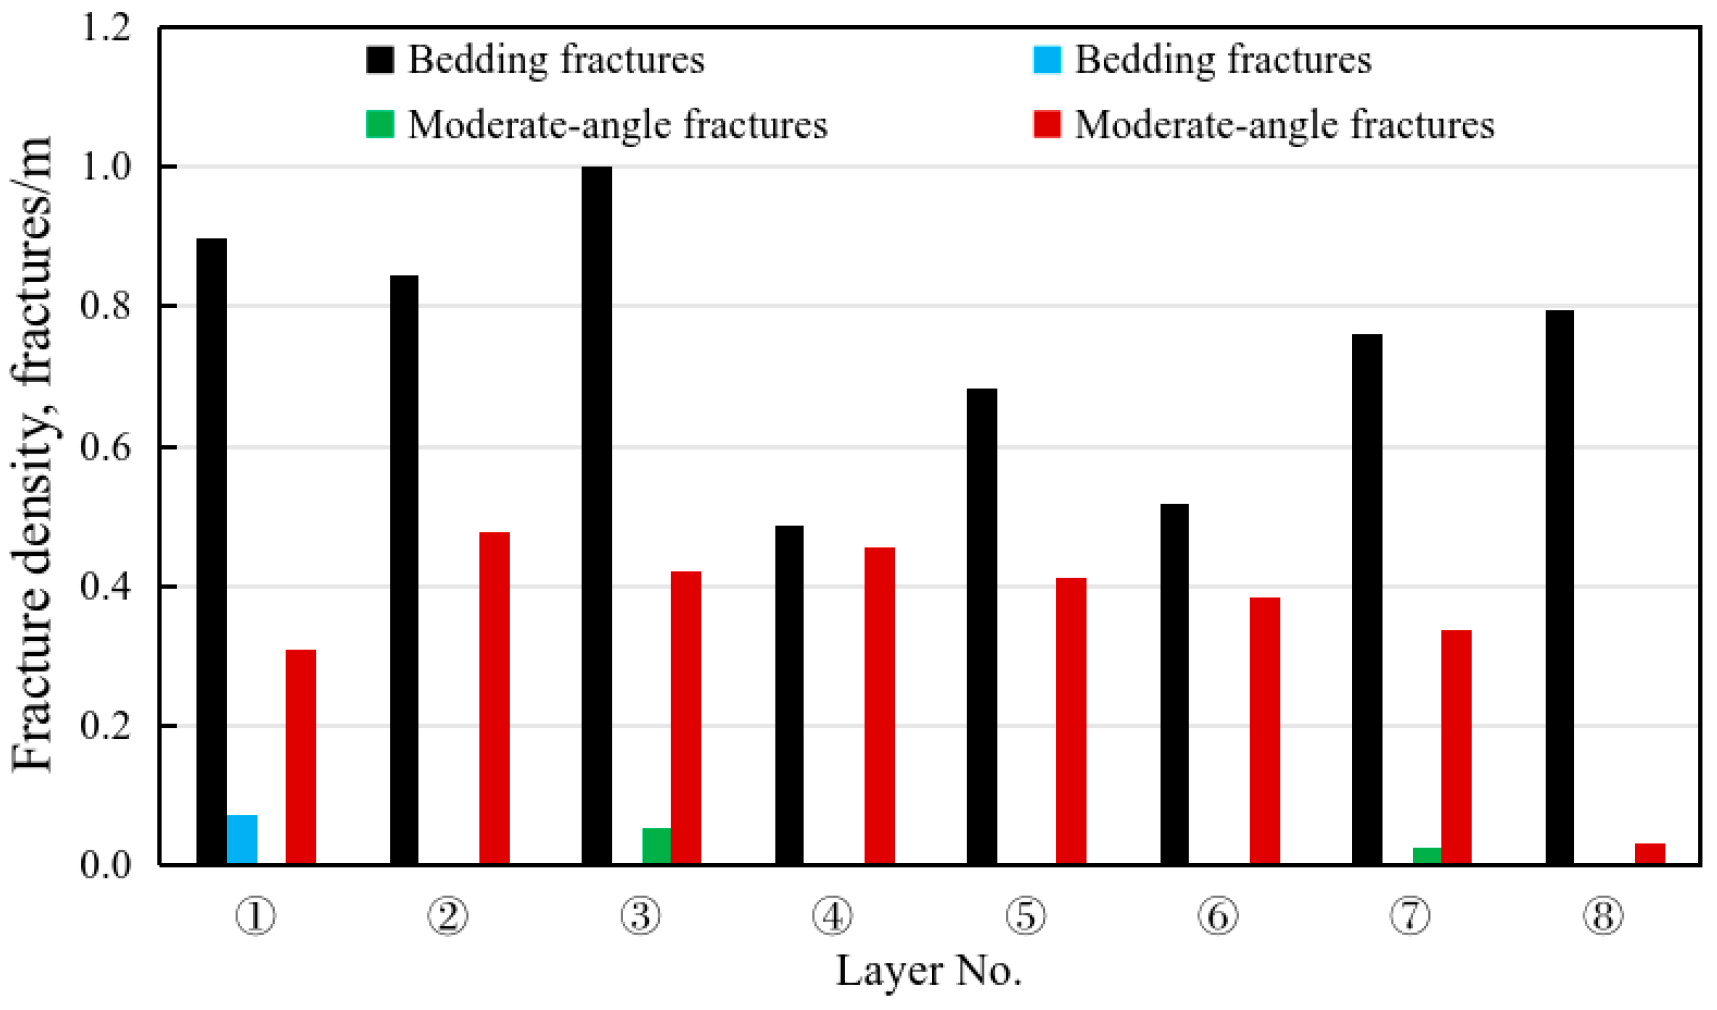
Fine interpretation of fractures in the Qiongzhusi Formation in Well Z202 was finished using FMI logging data. According to the core description and FMI logging data, layers ① to ③ have dense fractures in small sizes (10 to 30 cm), and layers ④ to ⑦ have less fractures in large sizes (50 to 660 cm). Fourteen highly conductive fractures are mainly distributed in layers ⑦, ⑤, and ④ at inclination angles of 70 to 88°. Eleven less conductive fractures are mainly distributed in layer ⑦ at an inclination angle of 58 to 89°. Most fractures are highly inclined and filled. Figure 3 displays the types of fractures in the Qiongzhusi Formation in Well Z202. Fractures in layers ① to ③ are extremely dense (>1.0 fractures/m), which is a favorable condition for horizontal bedding fractures. Layer ① has unique low-angle fractures (0.07 fractures/m), layer ③ has more moderate-angle fractures, and layers ⑤ to ⑥ are mainly dominated by high-angle fractures (>0.35 fractures/m).
Figure 3.
Fracture density of eight layers in the Qiongzhusi Formation in Well Z202.
3. Comprehensive Evaluation of Reservoir Fracability
The fracability of shale reservoirs is a key indicator for assessing whether effective fracture networks would be induced and commercial production capacity is promising after hydraulic fracturing stimulation. The Qiongzhusi Formation, as an important target for marine shale gas in southern China, is extremely heterogeneous in the vertical direction so that the traditional evaluation method using a single brittleness index often neglects the contribution of natural fractures and the influence of rock strength. This paper constructs a multi-dimensional fracability evaluation model by comprehensively considering mineral composition, mechanical parameters and natural fractures by taking Well Z202 as a case.
3.1. MBI
Mineral composition is the basis for determining the physical and mechanical properties of rocks. Generally, it is believed that the higher the contents of hard and brittle minerals such as quartz, feldspar, and carbonate, the more prone the rock is to undergo brittle failure under stress. In comparison, clay minerals are plastic, and their high contents would absorb fracturing energy and inhibit the expansion of fractures. The Mineral Index (MBI) constructed in this study aims to quantify the positive contribution of non-clay minerals to fracability using the following formula:
where means the volume fraction of a kind of mineral; is the combination of non-clay minerals, including quartz, orthoclase, plagioclase, calcite, dolomite, siderite, barite and pyrite; represents all minerals; and indicates the volume fraction of clay minerals.
3.2. MI
The mechanical properties of rocks directly determine the pressure for fracture initiation and propagation. Young’s modulus (E) represents the rock’s ability to resist deformation. The higher the modulus, the more likely the fractures are to remain open. Poisson’s ratio (ν) reflects the rock’s response to lateral stress. A lower Poisson’s ratio is usually associated with higher brittleness. Additionally, uniaxial compressive strength (UCS) directly indicates the difficulty of fracturing rock matrix. To standardize the measurement, this study normalizes the parameters as the following Mechanical Index (MI):
where is Young’s modulus, dimensionless; is Poisson’s ratio, dimensionless; and means uniaxial compressive strength, dimensionless.
All mechanical parameters are processed using the range standardization method as follows:
where X represents the original mechanical parameter; Xmin and Xmax denote the minimum and maximum values, respectively, within the study formation; and X* is a standardized dimensionless parameter, from 0 to 1.
3.3. FI
Natural fractures (bedding and structural fractures) act as oil and gas channels and an important structural basis for inducing hydraulic fracture networks; especially, bedding fractures have a dominant role in the cross-layer extension of hydraulic fractures. Studies have shown that when the density of bedding fractures is moderate, it is more conducive to inducing fractures to deviate and re-crack between layers, thereby forming a more complex fracture network. However, when bedding fractures are too sparse or too dense, this inducing effect is weakened. Based on this nonlinear influence, this paper uses to depict the optimal contribution range of bedding fractures. In terms of structural fractures, high-angle structural fractures are more likely to form favorable angles with the principal stress direction and can serve as extending channels for induced fractures, promoting the vertical or oblique extension of fractures and significantly enhancing the vertical connectivity of the fracture network. Therefore, they are given a secondary high weight. Medium-angle structural fractures have a certain guiding effect on the fracture extension path, but their contribution to the cross-layer extension and the complexity of the fracture network is weaker than that of bedding fractures and high-angle fractures. Low-angle structural fractures are more likely to form slip interfaces together with bedding planes, and have limited promotion effect on the growth of fracture height, so they are given a lower weight. Based on the above ranking, this paper uses gradient weights of 1, 2, and 3 to weigh the density of low-, medium-, and high-angle structural fractures, respectively, and constructs a Fracture Index (FI) as follows:
where represents the normalized density of bedding fractures; represents the normalized density of low-angle structural fractures; is the normalized density of medium-angle structural fractures; and is the normalized density of high-angle structural fractures.
It should be noted that the negative correlation between MI and fracture size does not contradict the IFI framework. In the IFI, MI represents the rock’s intrinsic brittleness and its ability to sustain open fractures, which benefits post-fracture conductivity. In the DEM model, however, a higher MI implies greater matrix strength, which consumes more injection energy during fracture initiation and propagation, thus restricting the fracture network extent under the same pumping conditions. This apparent trade-off reflects the multi-faceted nature of fracability and is physically consistent.
3.4. IFI
To avoid the one-sidedness of single indicator in characterizing reservoir fracability, this paper constructs an integrated fracability index (IFI) under the constraints of mineral composition, mechanical properties and natural fractures to quantitatively characterize the comprehensive potential of inducing effective fracture networks in different layers. The integrated fracability index is defined as follows:
where represents the mineral index, which is used to characterize the influence of mineral composition on rock brittleness and fracture tendency; represents the fracture index, used to depict the influence of natural fractures on the expansion of induced fractures and the connectivity of the fracture network.
Based on the mineral, mechanical and fracture data of the eight layers in Well Z202, their IFIs and controlling factors were calculated, and based on which the layers were classified as: IFI ≥ 0.6, a sweet spot layer, 0.5 ≤ IFI < 0.6, a potential layer, and IFI < 0.5, a barrier layer (Table 1).
Table 1.
Comprehensive fracability index of eight layers in Well Z202.
The evaluation results show that layers ④, ⑥, and ⑦ are sweet-spot layers; layer ④ has an IFI of 0.61, with the thickness of type I+II reservoirs reaching 147 m, far thicker than other layers, and extremely high comprehensive potential; layer ⑥ has an IFI of 0.63, with a high mechanical index (62.1%) and moderate fracture development, belong to a typical mechanically dominated sweet-spot layer; and layer ⑦ has an IFI of 0.6, with excellent reservoir quality (thick type I reservoirs and porosity of 5.8%), large sizes of natural fractures, and abundant high-angle fractures.
The potential layers are layers ③, ⑤, and ⑧. Layer ③ has a FI of 62.2%, with the highest fracture index, but relatively low mechanical index, and a large fracture-dominated network. Layer ⑤ has balanced indicators at a medium to upper level. Layer ⑧ has a mechanical index as high as 66.7%, but the fracture index is only 17.0%, the lowest in the entire well section, and the fracability is entirely contributed by the mechanical properties.
The barrier layers are ① and ②. The mineral index of the two small layers is the highest (>80%), but the mechanical index is low, the fracture development is limited, and the comprehensive fracability is insufficient.
The comprehensive fracturability index (IFI) constructed in this article aims to characterize the engineering fracturability of each sublayer, that is, the inherent potential of the reservoir to form an effective fracture network after hydraulic fracturing. It is an engineering-oriented indicator, rather than a comprehensive geological sweet spot criterion that covers parameters such as organic carbon content, porosity, and gas saturation. The ideal comprehensive sweet spot evaluation should combine the engineering fracturability index of this study with geological sweet spot parameters (organic matter abundance, reservoir performance, gas content, etc.), which is also an important direction for future research.
4. Hydraulic Fracturing Simulation Using the Discrete Element Method
Using the Discrete Element Method (DEM), this paper constructs a microscopic hydraulic fracturing model considering mineral composition, mechanical properties, weak bedding planes and natural fractures with the aim to simulate the initiation and expansion of hydraulic fractures in different layers, and the influences of weak mineral planes.
4.1. Discrete Element Mathematical Model
Compared with classical continuum fluid–solid interaction (FSI) methodologies—such as ALE formulations, immersed-/embedded-interface methods, and partitioned coupling schemes—the present DEM-based coupling approach treats the rock as an assembly of discrete particles, with fractures represented explicitly as particle contacts that can open, close, or slide without requiring predefined fracture paths or remeshing [26,27]. The fluid flow is modeled through the pore network between particles following the cubic law, and coupling is achieved through a staggered explicit sequence. This approach naturally handles fracture initiation, branching, and interaction with pre-existing natural fractures, which are challenging for continuum FSI methods, though its primary limitation is the reduced spatial scale due to computational cost.
4.1.1. Basic Discrete Element Model
Referring to the discrete element model constructed by Li et al. (2022) [28], this paper builds a numerical rock model using the discrete element method. Unlike continuum mechanics, DEM regards rocks as a collection of discrete particles. The core idea of the model is based on the dynamic relaxation method. The dynamic equilibrium of the particle system is solved using the explicit central difference algorithm. The translational and rotational motions of any particle i follow Newton’s second law of motion, and the governing equations are:
where represents the resultant external force acting on the particle i, N; represents the mass of the particle i, kg; means the translational acceleration, m·s−2; means the resultant torque acting on the particle i, N·m; means the moment of inertia, kg·m2; and is the angular acceleration, rad·s−2.
For different mineral particles, the contact model with parallel bonds is adopted to simulate the cementation effect between the mineral particles. The increments of force and torque at the contact points evolve linearly with the relative displacement:
where represents the increment of normal contact force, N; represents the bonding normal stiffness, N·m−3; is the cross-sectional area of the bonding, m2; is the increment of relative normal displacement, m; means the moment increment, N·m; means the moment of inertia of the bonding cross-section, m4; and is the increment of relative rotation angle, rad.
To simulate the sliding behavior of the fractures, a smooth joint model is introduced. When the contact force satisfies the Coulomb criterion, shear sliding occurs:
where means the maximum allowable tangential force, N; represents the normal contact force, N; represents the friction angle of the joint surface, rad; represents the cohesion force within the joint, Pa; and is the contact overlap area, m2.
4.1.2. Hydraulic Fracturing Coupling Equation
Based on the network model of porous medium flow, it is assumed that the flow of fluid in the pore throats between particles follows the cubic law:
where represents the volumetric flow rate in pipeline ij, m3·s−1; represents the calculated thickness of the model, m; means the hydraulic aperture, m; means the dynamic viscosity of the fracturing fluid, Pa·s; are the pore pressures of the fluid domains at both ends of the pipeline, Pa; and is the length of the pipeline, m.
The hydraulic aperture changes dynamically with the contact state of the particles to reflect the control of fracture opening on the conductivity during the fracturing process:
where represents the initial residual aperture, m; represents the reference contact force (used to control the closing rate of the aperture), N; and means the normal displacement between particles, m.
Based on the law of conservation of fluid mass, and considering the compressibility of the fluid and the deformation of the pore volume, the pressure update formula within the fluid domain is:
where represent the pore pressure at time t and the next time, respectively, Pa; is the modulus of fluid volume, Pa; is the apparent volume of the fluid domain; is the net flow into the domain, in m3; is the time step, s; and is the volume change in the fluid domain due to particle movement, m3.
The fluid pressure gradient acts on the particle surface to induce a drag force and a seepage volume force, and their coupling force is explicitly superimposed onto the particle motion equation:
where represents the vector of fluid force acting on the particle, N; represents the cross-sectional area of the compressed particle, m2; is the direction vector of the force; is the local porosity, dimensionless; means the pressure gradient, Pa·m−1; and means the volume of the particle, m3.
The coupled fluid–solid solution within each time step follows a staggered explicit sequence: (1) the fluid pressure field is first updated by solving the pore network flow equations (Equations (9) and (11)) based on the current fracture apertures and particle configuration; (2) the resulting fluid pressures are then converted into drag and seepage forces acting on the particles (Equation (12)); (3) these forces are explicitly incorporated into the particle motion equations (Equation (6)) to update particle positions and contact forces via the central difference method; and (4) the updated particle configuration is used to refresh the hydraulic apertures (Equation (10)) and pore volumes for the next time step. The time step of 1 × 10⁻⁴ s is adopted, which is approximately 10–20% below the theoretical critical time step determined by the minimum particle mass-to-stiffness ratio for explicit DEM schemes, thereby ensuring numerical stability throughout the simulation.
4.2. Physical Model and Parameter Settings
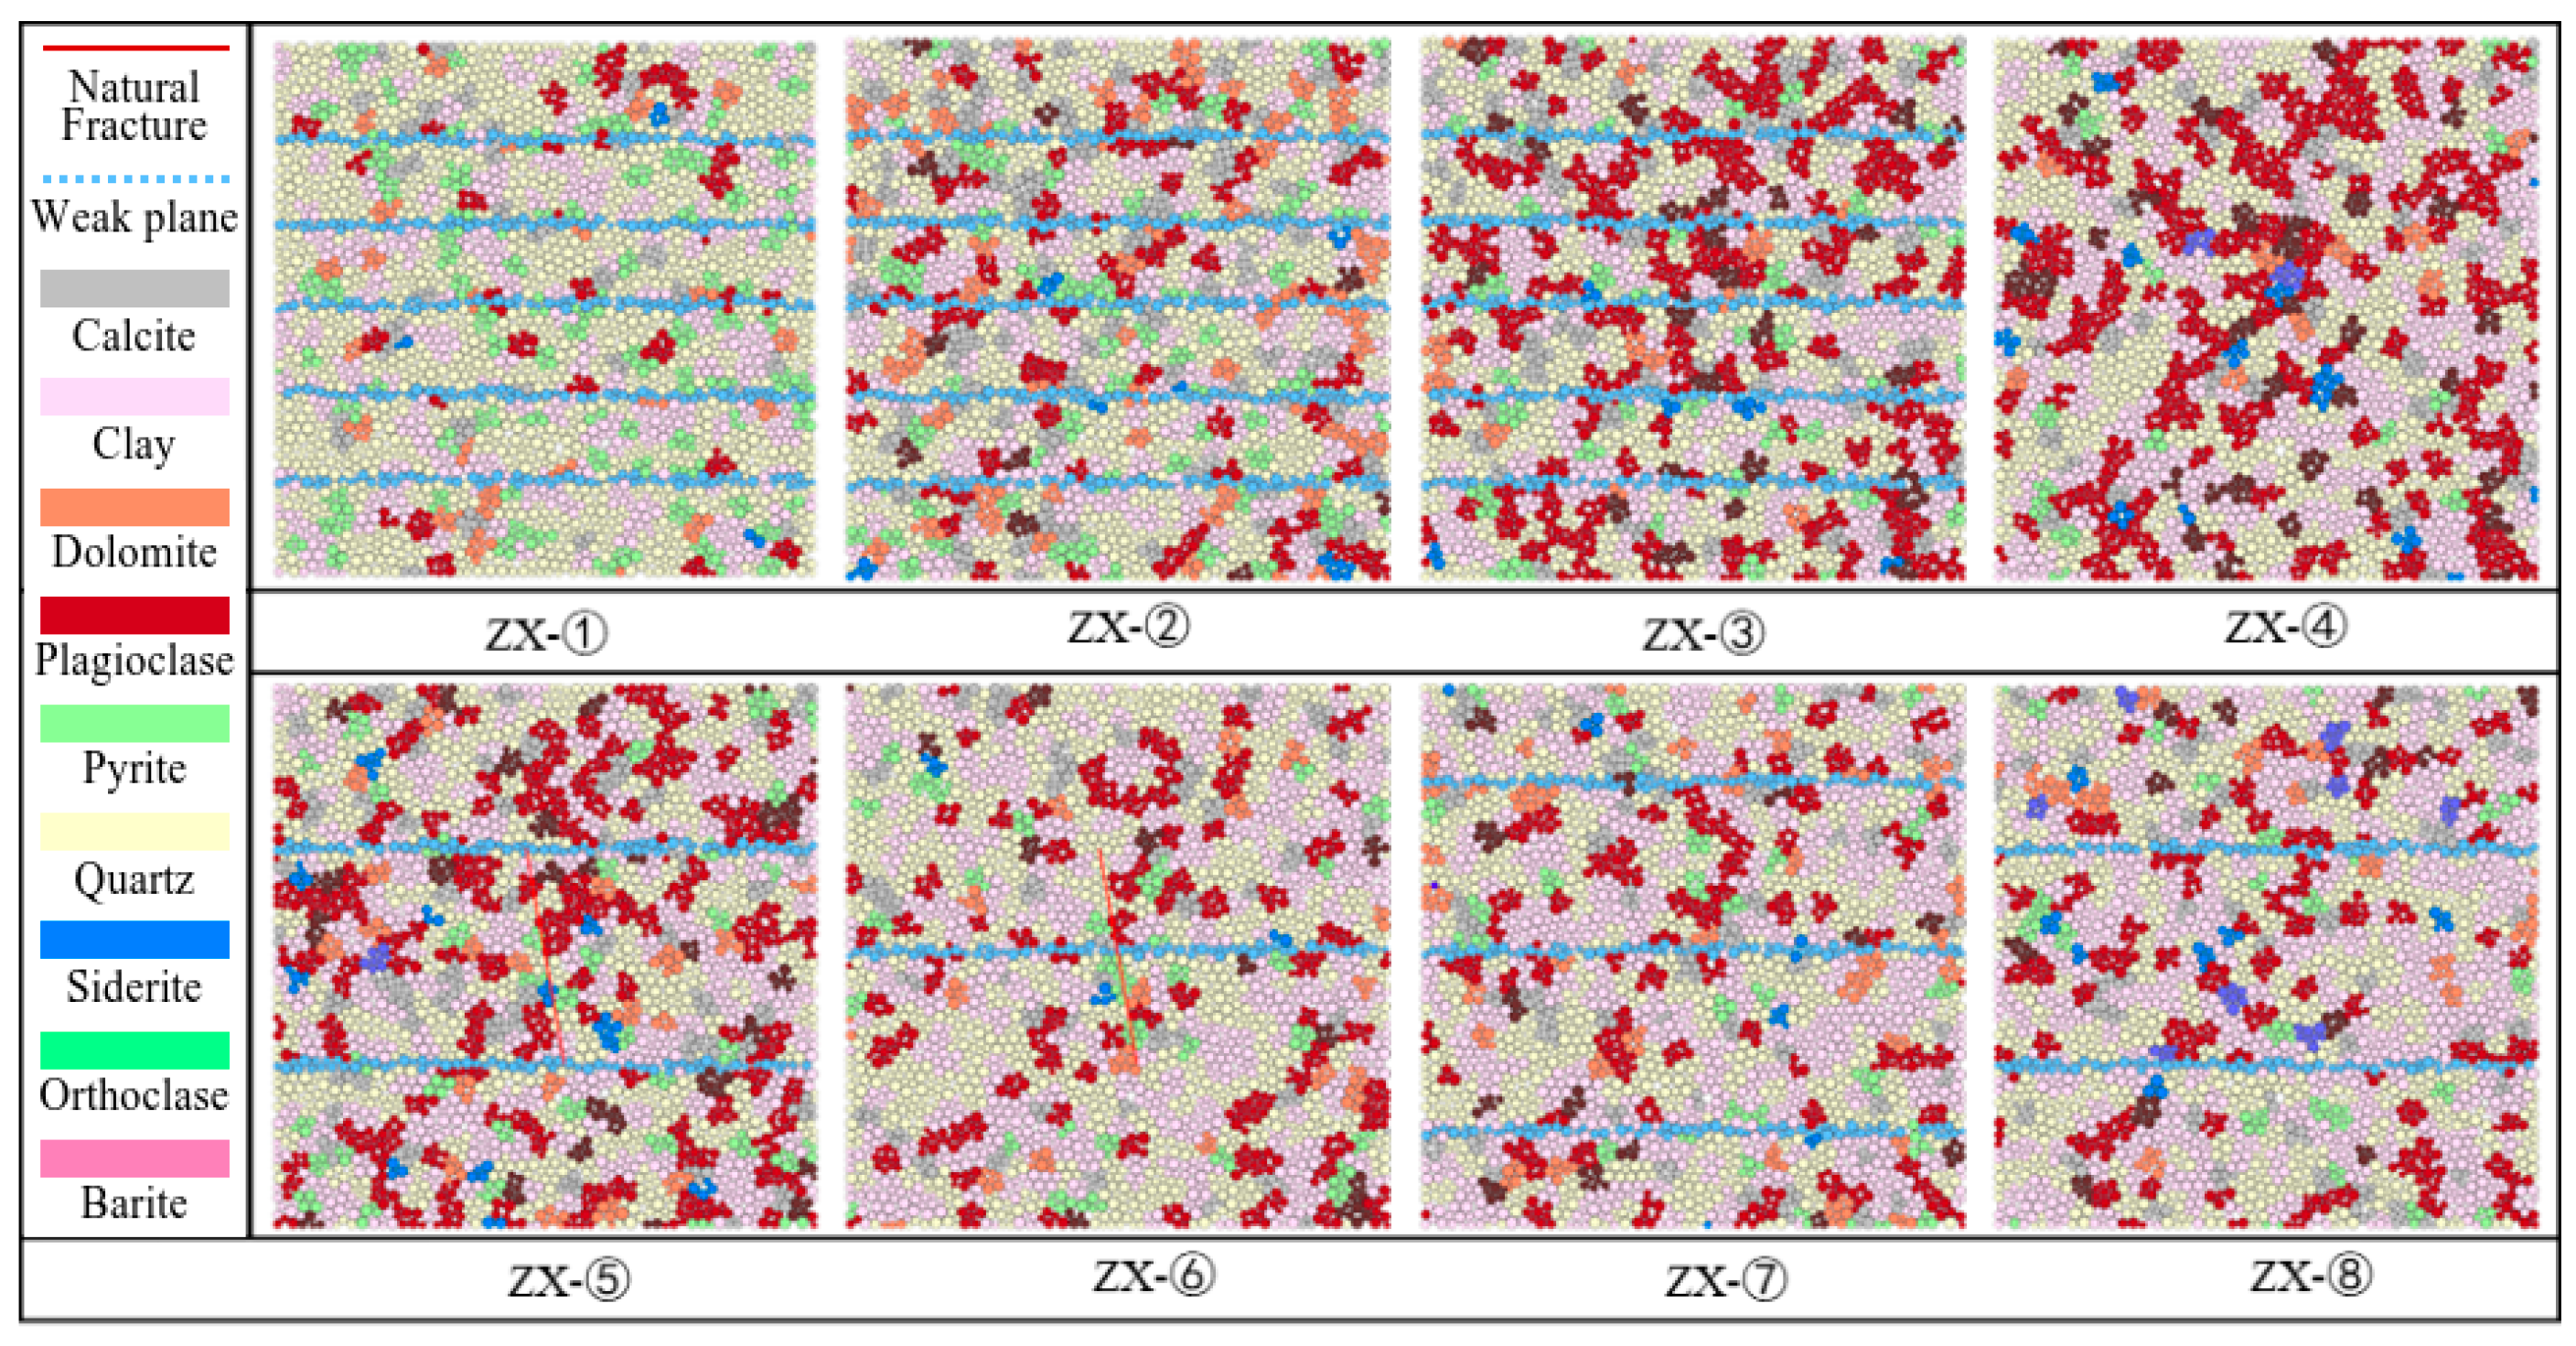
Based on the comprehensive interpretation of logging data, the target interval was finely divided into eight layers which are very heterogeneous in lithology and mineral composition. Considering the X-ray diffraction (XRD) and scanning electron microscopy (SEM) experiments, the average mineral content of each layer was quantitatively characterized. The two-dimensional discrete element model is 5 m × 5 m, and includes 3000–4000 particles estimated by the particle generation algorithm. Its structure is shown in Figure 4.
Figure 4.
The basic structures of mineral–mechanics–weak plane models of eight layers.
To ensure the reliability of the numerical results, a sensitivity analysis was conducted on particle resolution using three representative models with approximately 2000, 3000, 4000, and 6000 particles. The simulated fracture areas for the three resolutions were 12.2 m2, 14.2 m2, 14.9 m2, and 15.3 m2, respectively, with a relative deviation of less than 3% between the latter two. Considering the trade-off between computational accuracy and efficiency, the intermediate resolution of 3000~4000 particles was adopted for all subsequent simulations.
According to the distribution of natural weak planes and fractures, and core description and FMI logging data, it was found that at a scale of 5 m, the model only has one high-angle fracture through layers ⑤ and ⑥. Finally, eight heterogeneous discrete element numerical models were established by integrating the mechanical properties related to mineral composition and the geometric parameters of weak planes (Table 2).
Table 2.
Experiment schemes and model design.
Following the microscopic mechanical parameters of rock minerals compiled by Cao Feng (2025) [29], and the experimental measurements for this study area, we set the parameters of the matrix particles in the discrete element model, and assigned the mineral components with different microscopic properties due to the significant influence of reservoir heterogeneity on fracture propagation. For example, brittle minerals such as quartz were assigned higher contact stiffness and friction coefficients, while clay minerals had lower stiffness ratio and cementation strength (Table 3) after checking against their mechanical indices. This parameter mapping ensures the numerical model to truly reflect the macroscopic deformation and failure of different lithologic formations under stress.
Table 3.
Microscopic mechanical parameters of minerals.
After construction based on the mineral composition and weak planes, the heterogeneous model was set boundary conditions to simulate the real deep depositional environment under the constraint of in situ stress. This study aims to investigate the across-layer propagation of hydraulic fractures, so a servo mechanism was used to apply a stress constraint at the boundaries: 132.8 MPa was applied in the vertical direction (Y-axis) to simulate the overlying pressure, and 115.8 MPa in the horizontal direction (X-axis) to simulate the minimum horizontal principal stress. Before the fracturing simulation began, sufficient computational time-step iterations were run to ensure the internal particle contact force in the model to reach a balanced state, thereby restoring the initial stress field before being disturbed.
The selection of fluid parameters in the hydraulic fracturing simulation also follows the physical similarity criterion. Based on the dimensional analysis theory of fluid–solid coupling, the pumping parameters at the field engineering scale are converted to the model scale through a scaling factor. This not only ensures the convergence of numerical calculations but also accurately reflects the influence of fluid viscosity and injecting rate on the initial fracturing pressure. The specific fluid properties and dimensionally converted pumping parameters are shown in Table 4.
Table 4.
Fluid parameters.
4.3. Simulation Results and Analysis
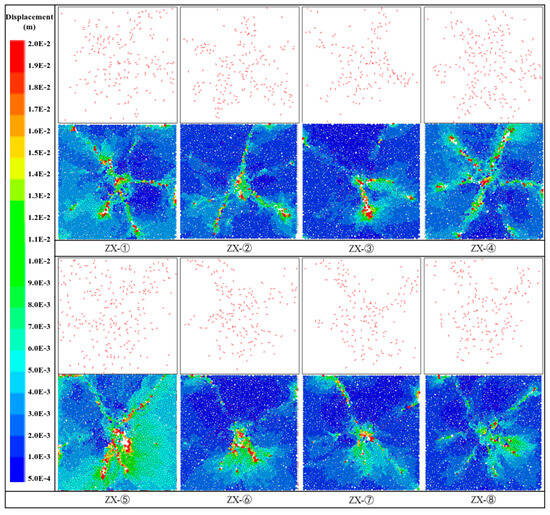
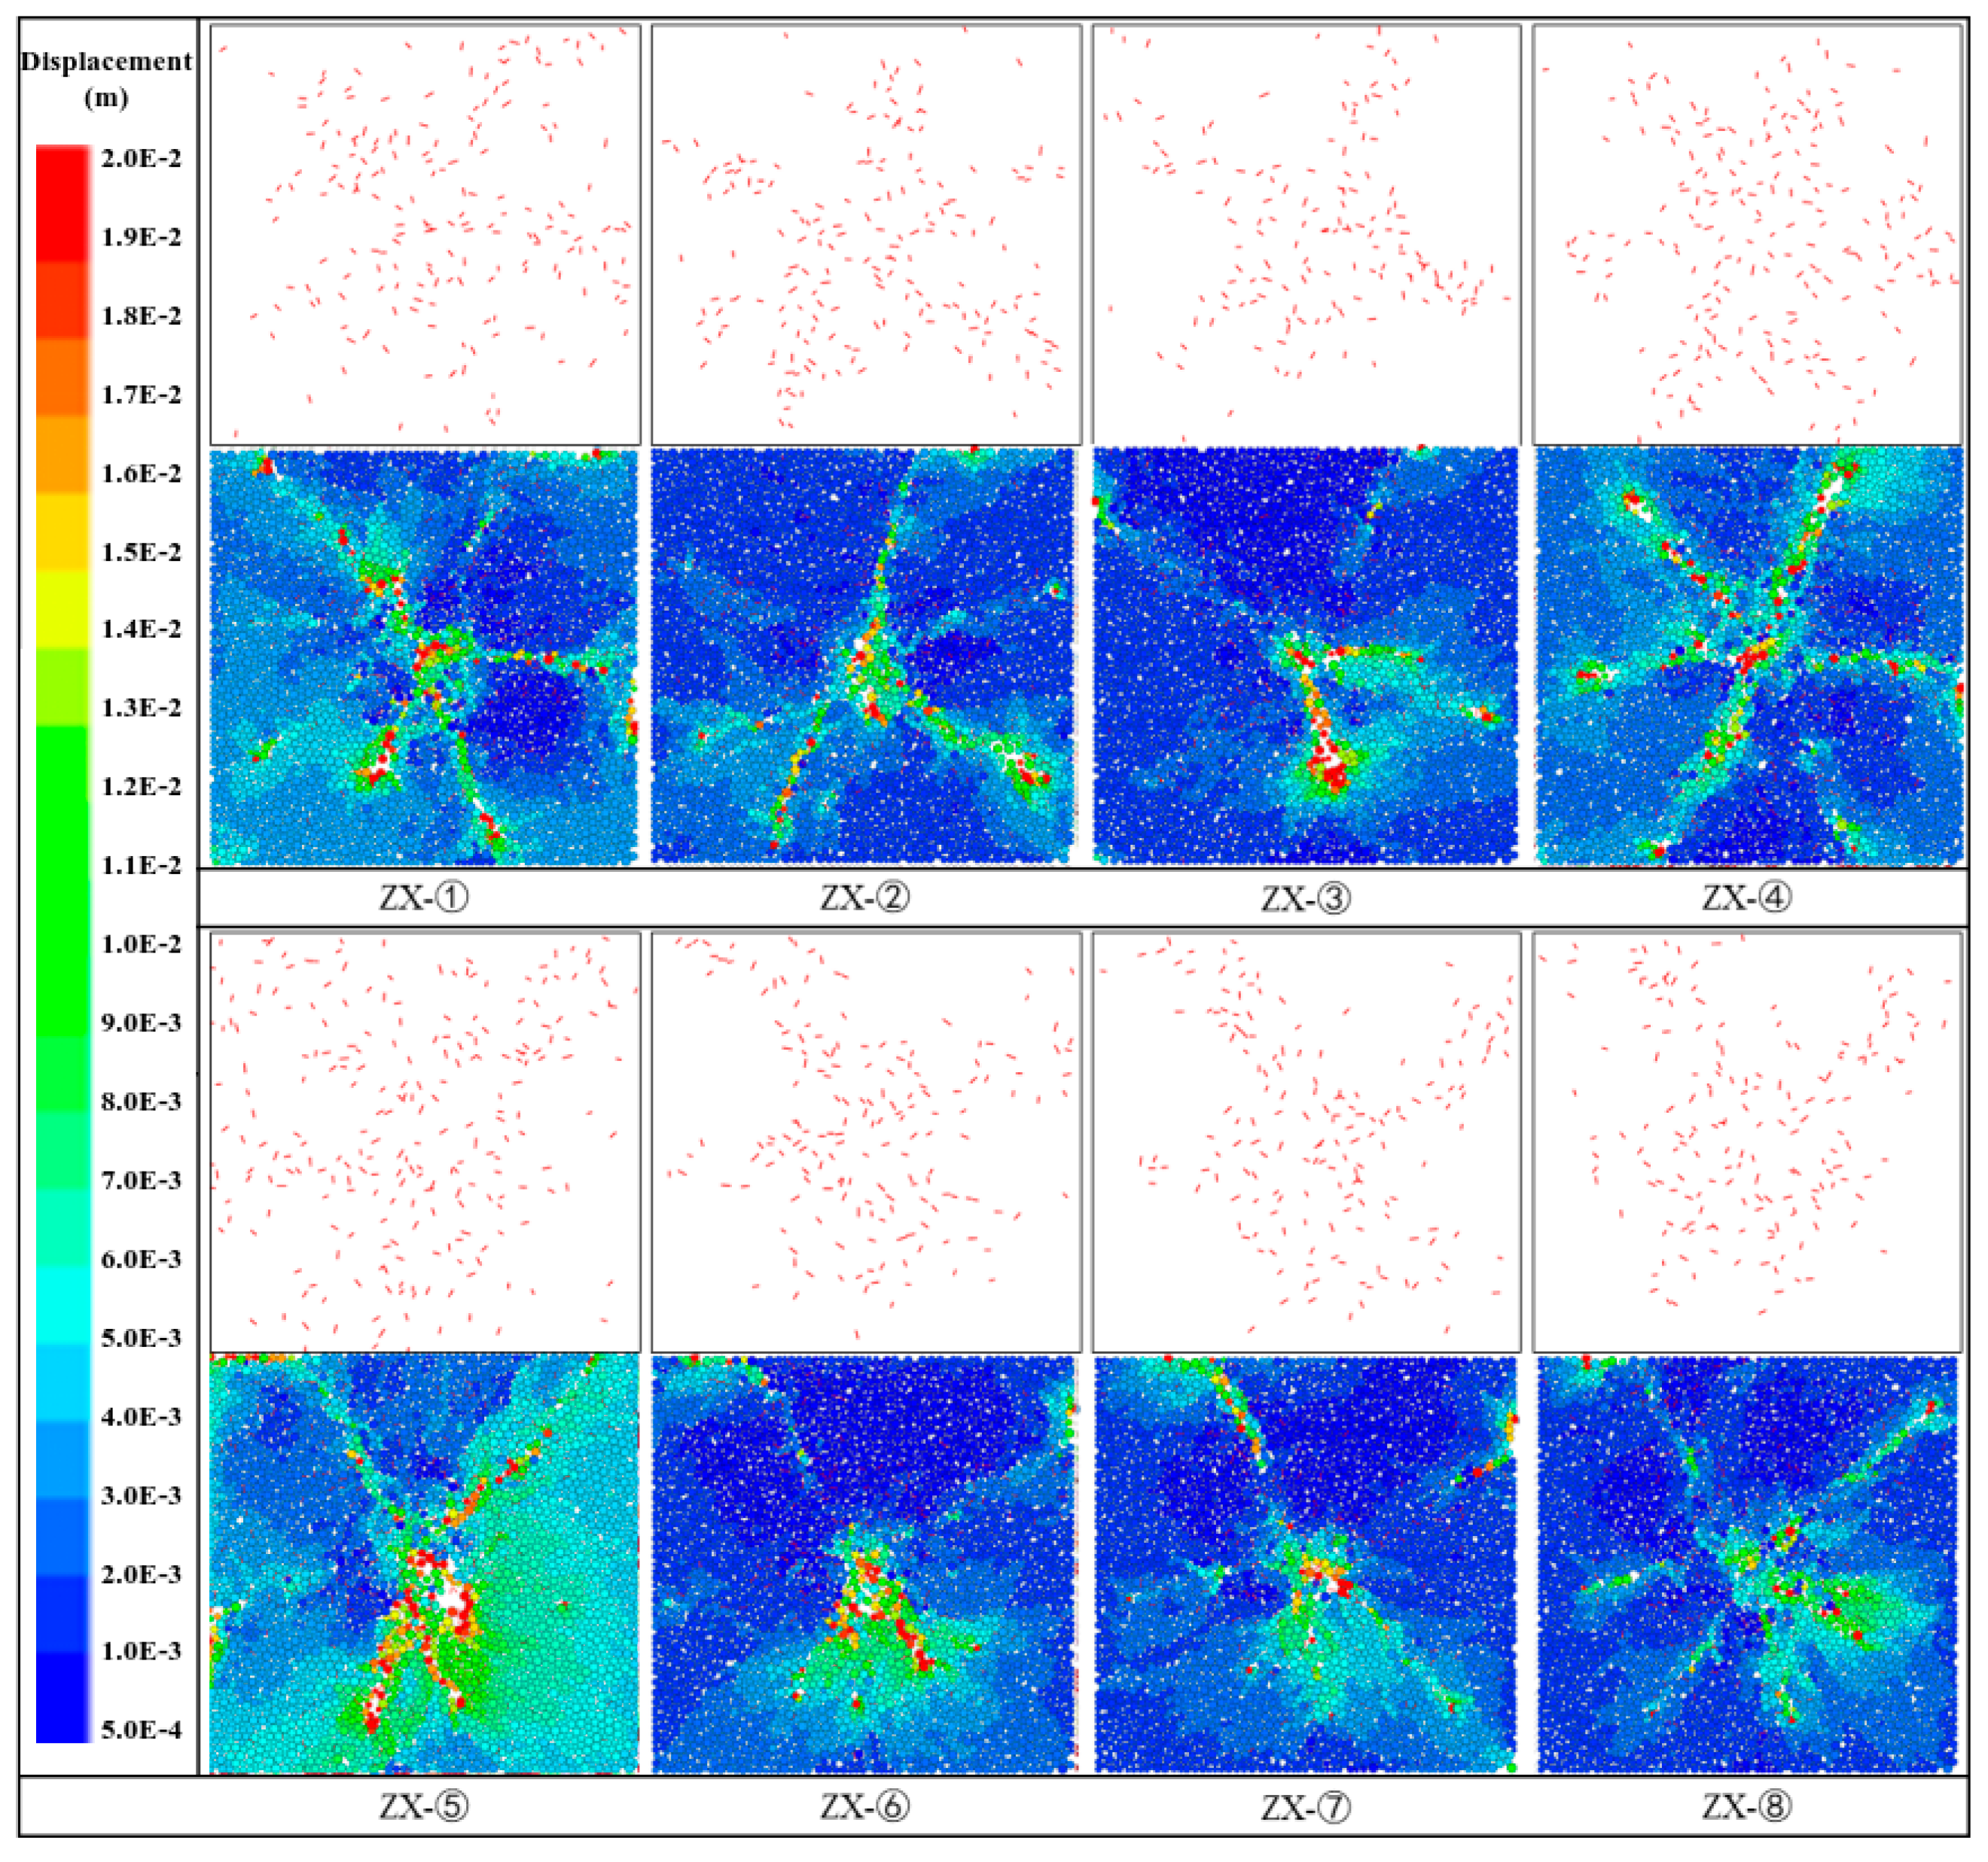
As shown in Figure 5, the results from the discrete element models of all layers demonstrate that the fracture network morphology is greatly affected by mineral composition and weak (bedding) planes. Under the joint influence of different mineral particle strength and the mechanical properties of weak planes, the fractures propagated heterogeneously. The simulation results confirmed that fracture shape and distribution not only depend on the constitutive relationship of the matrix, but are also regulated by the dual factors of micro-mineral heterogeneity and macroscopic structural weak planes, ultimately forming a complex spatial structure with branch development within layers and blocked penetration across layers. The stimulation effect is quantified from three aspects: fracture length, fracture width, and fracture area, as shown in Table 5.
Figure 5.
Post-fracturing fracture fields (top) and particle displacement fields (bottom).
Table 5.
Quantitative indices and fracture parameters.
4.3.1. Influence of Mineral Composition
The simulation results show that the content of highly brittle minerals directly determines the complexity of the fracture network. The layer with high brittle mineral content represented by layer ① (81.6%) is prone to multi-directional brittle fractures, resulting in a fracture network with numerous bifurcations and wide distribution, due to the extremely high brittleness and large matrix elastic modulus. In layer ①, the fracture area is 7.41 m2, the fracture network width is 4.03 m, and the fracture network height is 4.07 m, all of which are the higher values across the entire well section. In contrast, the layer with lower quartz content and higher clay content (such as layer ⑧ with 31.74% clay) has relatively high toughness, and the energy release path is more dispersed. The fracture expansion in layer ⑧ is obviously uniform, making it difficult to form a widespread and dispersed fracture network. The difference in mineral composition is the intrinsic basis for the diversity of fracture networks, and the heterogeneity of mineral distribution significantly affects the extension of fractures. The model dominated by a single mineral is more likely to get a longer fracture network. This phenomenon is attributed to larger mineral particle clusters which effectively reduce the number of weak contact points among particles, accordingly reducing energy dissipation during fracture expansion and providing a less resistant path for the penetration of long fractures.
4.3.2. Influence of Natural Fractures
Natural fractures (including bedding and structural fractures) play a dominant role in the complexity of the morphology of induced fracture network. As a natural mechanical weak plane, bedding induces fractures to turn and slide along the interface, forming numerous horizontal branch fractures and increasing the complexity of the fracture network. On the other hand, dense bedding generates a significant stress shielding effect, restricting the vertical penetration of the major fractures into the deep layers. When the density of bedding is moderate, it is conducive to the formation of “T-shaped” or “I-shaped” complex structures. When the bedding is too dense, fractures are overly concentrated on the bedding plane, and the vertical expansion is severely restricted.
In layer ⑤, the fracture area is 14.89 m2, the highest in the entire well section, due to the high-angle natural fractures. This indicates that the high-angle fractures have played an inducing effect during the fracturing process. The longer and larger pressure sweeping inspired uniform fractures and constructed a highly connected SRV. The simulation result is highly consistent with field observation. Fracture expansion is restricted in the layer with less natural fractures. For example in layer ⑧ where natural fractures are not developed, the modeled fracture area is only 5.86 m2 and fracture network width is 3.95 m, both are lower values across the entire well section, and the fracture height is only 3.91 m, significantly lower than the layer with more natural fractures. These findings verified that natural fractures are helpful to the vertical expansion of hydraulic fractures.
4.3.3. Influence of Stress State
The stress state serves as an external constraint factor for fracture propagation, and it has a significant impact on the complexity of the fracture network. Under a weak slip stress state (Q is 1.03–1.22 in Well Z202), the vertical stress is close to the maximum horizontal principal stress, which is conducive to the penetration of artificial fractures through the bedding plane, and the extension of the fracture height is longer. The fracture morphology is like “丰”, a Chinese character. Under a strong slip stress state (i.e., a larger Q), it is difficult for artificial fractures to penetrate the bedding fractures, and the extension of the fracture height is inhibited. In this case, the fracture morphology is mainly “L” shaped.
The mechanical index and the geometric size of the fracture network show a significant negative correlation. When the mechanical index increases from 45.6 at layer ④ to 66.7 at layer ⑧, the height of the fracture network is significantly suppressed. In the layer with low mechanical strength (such as layer ④), the plastic zone at the fracture tip is more likely to develop, and a lower flow rate can drive a large-scale fracture network. However, in the high stress zone (such as layers ⑥ and ⑧), the fracturing energy consumes quickly, most of which is used to overcome the strength of the rocks, limiting the fracture scale.
5. Field Hydraulic Fracturing Operation
5.1. Separate-Layer Fracturing Scheme
Based on the fracability evaluation and discrete element models, a nine-layer separate fracturing scheme was designed for Well Z202. The cumulative thickness to be stimulated is 466 m, with 52 m a layer on average. To ensure the same layer in the same fracturing interval, best perforation locations were planned by combining reservoir quality, natural fractures, and inter-layer stress. To overcome the vertical stress difference while ensuring the coverage of fracture height within a layer, perforation was run by separate clusters and limiting flow rate. Specifically, for layer ⑤ with developed natural fractures and moderate thickness, single-cluster perforation was performed; and for the other layers, two-cluster perforation was adopted, with uniform hole diameters, and a total of 30 holes. Differentiated fracturing fluid volume was injected based on their fracability. Layers ④⑥⑦ which are high-quality reservoirs were injected fracturing fluid up to 2500 m3 each. Layers ③⑤⑧ belonging to medium-quality reservoirs were given 2000 m3 each. Layers ①②, poor-quality reservoirs, were 1500 m3 each. Post-fracturing well temperature was recorded to evaluate the height of the fracture network.
5.2. Monitoring and Analysis of Fracture Height
The fracture heights from well temperature logging data (Table 6) are distributed between 11 and 55 m, with an average of 32.5 m. The interpreted fracture height in layer ⑤ fractured through single-cluster perforation is 23.7 m. No vertical fracture communication was found between the two clusters in layer ⑧ according to the abnormally high temperature. The fracture height is only 11.2 m, highly consistent with the conclusion of the discrete element model (limited fracture height). The fracture heights are the shortest in layers ⑦ and ⑧ where natural fractures are the least developed, confirming that high-angle natural fractures and the stress difference between layers are the key factors affecting the vertical extension of hydraulic fractures.
Table 6.
Measured fracture heights in eight layers in Well Z202.
5.3. Production Performance Analysis
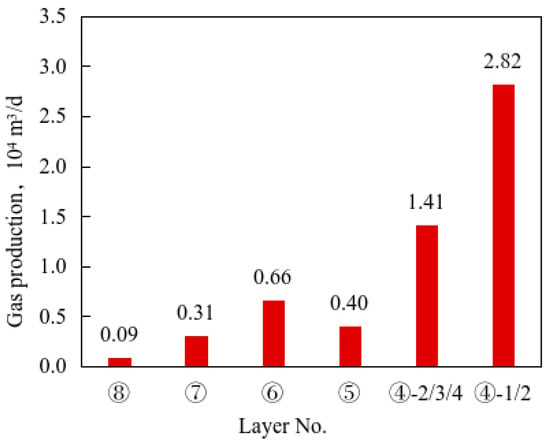
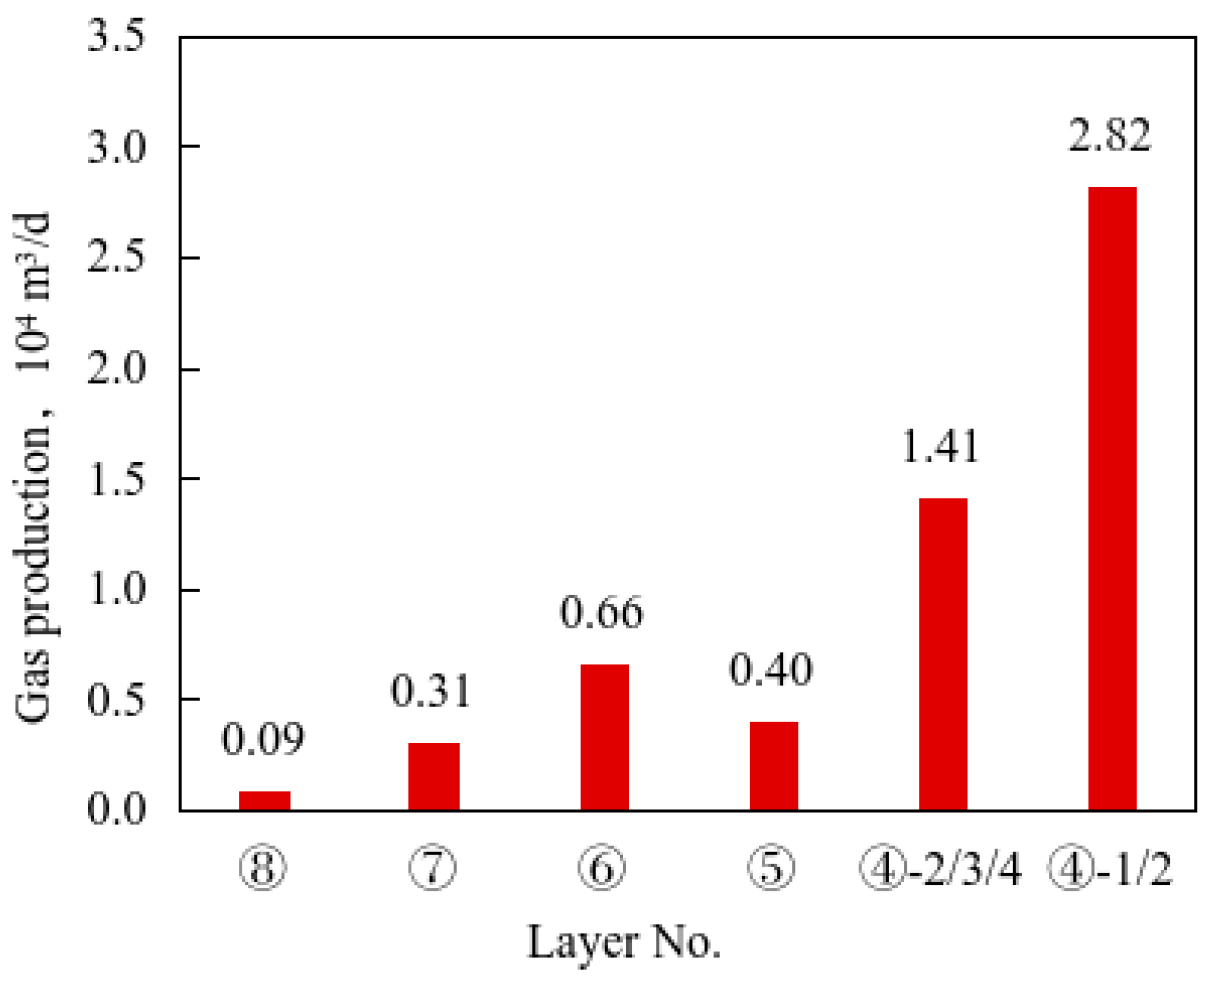
Due to the complex underground conditions, only the post-fracturing gas production from layers ④ to ⑧ was measured (Figure 6), totally 5.7 × 10⁴ m3/d. Most of the gas was produced from types I+II reservoirs which are thicker and were fractured relatively completely. Layers ④ and ⑥ contributed more. They produced liquid of 2510 m3, sand of 252 t, and gas of 0.6 to 2.8 × 10⁴ m3/d, 16 to 24% higher than layers ⑤, ⑦, and ⑧. Within every layer, the half-fracture height induced through the lower perforation clusters is higher than the upper perforation clusters, so the latter contributed more gas production, which is consistent with the law that fractures tend to extend downward. The average gas production contribution from the lower perforation clusters targeted for layers ⑥ to ⑧ is 4.0 to 4.6%, while that from the upper perforation clusters is only 1.4 to 2.9%.
Figure 6.
Post-fracturing gas production from eight layers in Well Z202.
6. Conclusions
(1) The eight layers of the Qiongzhusi Formation show significant differences in mineral composition, rock mechanics, and the development of natural fractures. Comprehensive fracability evaluation identified layers ④, ⑥ and ⑦ as sweet-spot layers (IFI ≥ 0.6 or huge reservoir thickness), layers ③, ⑤ and ⑧ as potential layers (0.5 ≤ IFI < 0.6), and layers ①, ② as barriers (IFI < 0.5).
(2) Mineral composition and rock mechanics control the initial position of fractures, natural fractures dominate the scope of hydraulic fracture network, and stress state affects the complexity of fracture network. Layers with high MBI and moderate FI are conducive to the development of complex fracture networks, while layers with dense fractures or high rock strength are prone to stress shielding and layer sliding.
(3) Field monitoring data indicate that high-angle natural fractures are the key factor affecting the propagation of fracture networks. The hydraulic fractures are 23.7 m high, induced through a single cluster in the Qiongzhusi Formation. Reservoir thickness and hydraulic fracture height have a significant contribution to gas production.
Author Contributions
Conceptualization, J.G. and J.W.; methodology, L.M.; software, J.L.; validation, C.S., Y.S. and J.W.; formal analysis, L.M.; investigation, L.M.; resources, J.G.; data curation, C.S.; writing—original draft preparation, L.M.; writing—review and editing, L.M.; visualization, Y.S.; supervision, J.G.; project administration, J.W.; funding acquisition, J.G. All authors have read and agreed to the published version of the manuscript.
Funding
This research was funded by the National Natural Science Foundation of China Joint Fund Integration Project (grant number U23B6004).
Institutional Review Board Statement
Not applicable.
Informed Consent Statement
Not applicable.
Data Availability Statement
The original contributions presented in this study are included in the article. Further inquiries can be directed to the corresponding authors.
Conflicts of Interest
Author Li Ma, Yi Song, Jianfa Wu, Cheng Shen and Junfeng Li were employed by the company Research Institute of Shale Gas, PetroChina Southwest Oil & Gas Field Company, Chengdu, China. The remaining authors declare that the research was conducted in the absence of any commercial or financial relationships that could be construed as a potential conflict of interest.
References
- Zou, C.; Yu, R.; Dong, D.; Zhang, X.; Chen, Y.; Zheng, M.; Liu, H.; Gao, J. Geologic characteristics, development technologies and prospects of unconventional natural gas in China. Pet. Explor. Dev. 2026, 53, 770–786. [Google Scholar] [CrossRef] [Scilit]
- Wang, Z.; Kong, Y.; Ma, Y. Prospect of China’s natural gas industry in the 15th Five-Year Plan period: Foundation, challenges, and proposals. Nat. Gas Ind. 2025, 45, 217–225. [Google Scholar]
- Lu, C.; Ma, L.; Guo, J.; Xiao, S.; Zheng, Y.; Yin, C. Effect of acidizing treatment on microstructures and mechanical properties of shale. Nat. Gas Ind. 2019, 39, 59–67. [Google Scholar]
- Yong, R.; Shi, X.; Luo, C.; Zhong, K.; Wu, W.; Zheng, M.; Yang, Y.; Li, Y.; Xu, L.; Zhu, Y.; et al. Aulacogen-uplift enrichment pattern and exploration prospect of Cambrian Qiongzhusi Formation shale gas in Sichuan Basin, SW China. Pet. Explor. Dev. 2024, 51, 1211–1226. [Google Scholar] [CrossRef] [Scilit]
- Guo, T.; Deng, H.; Zhao, S.; Wei, L.; He, J. Formation mechanisms and exploration breakthroughs of new type of shale gas in Cambrian Qiongzhusi Formation, Sichuan Basin, SW China. Pet. Explor. Dev. 2025, 52, 57–69. [Google Scholar] [CrossRef] [Scilit]
- Yong, R.; Wu, J.; Wu, W.; Yang, Y.; Xu, L.; Luo, C.; Liu, J.; He, Y.; Zhong, K.; Li, Y.; et al. Exploration discovery of shale gas in the Cambrian Qiongzhusi Formation of Sichuan Basin and its significance. Acta Pet. Sin. 2024, 45, 1309–1323. [Google Scholar]
- Yang, Y.; Shi, X.; Liu, W.; Wu, W.; He, Y.; Li, Y.; Zhang, Y.; Yang, Y.; Zhu, Y.; Liu, J.; et al. Sedimentary evolution model and favorable facies belt selection of the Qiongzhusi Formation in the middle section of the Deyang-Anyue rift in the Sichuan Basin. Nat. Gas Geosci. 2024, 35, 2106–2120. [Google Scholar]
- Yang, X.; Zhang, C.; Zhao, S.; Zhang, J.; Luo, C.; Chen, Y.; Shi, Z.; Xie, S.; Ren, C.; Chen, X.; et al. Characteristics of shale gas reservoir and enlightenment of exploration in Qiongzhusi Formation in southern Sichuan Basin. Nat. Gas Geosci. 2025, 36, 13–24. [Google Scholar]
- Liang, F.; Wu, W.; Zhang, Q.; Luo, C.; Wang, Y.; Liu, Y.; Jiang, W.; Lu, B. Shale pore structure characteristics and shale gas occurrence pattern of the Lower Cambrian Qiongzhusi Formation in the southern Sichuan Basin. Nat. Gas Ind. 2024, 44, 131–142. [Google Scholar]
- Wu, B.; Peng, S.; Sun, B.; Che, Y. Application of fully soluble bridge plug in layered fracturing technology of coalbed methane wells. Nat. Gas Ind. 2024, 44, 131–142. [Google Scholar]
- Guo, X.; Liu, H.; Ai, B.; Wang, Q.; Wang, Q. Rationality evaluation of fracture scale in vertical well layered fracturing of tight gas reservoirs. Unconv. Oil Gas 2019, 6, 89–93. [Google Scholar]
- Ding, Y.; Lan, C.; Liu, J.; Chi, Y.; Dong, C. Numerical simulation and experimental analysis of separate layer fracturing string erosion properties. Oil Drill. Prod. Technol. 2017, 39, 231–236. [Google Scholar]
- Yang, L.; Weng, D.; Li, S.; Liu, M.; Yi, X. Theory and practice of precision fracturing technology for shale oil and gas reservoirs. Nat. Gas Ind. 2026, 46, 11–22. [Google Scholar]
- Ruan, Q.; Zhang, L.; Zhao, Y.; Zhang, D.; Zheng, S. Mechanisms of stress evolution and infill-well fracture disturbance in shale gas reservoirs with natural weak planes. J. Geomech. 2026, 32, 142–158. [Google Scholar]
- Guo, J.; Ren, W.; Zeng, F.; Luo, Y.; Li, Y.; Du, X. Key technologies and field practices of full-field support and transformation for deep shale gas reservoirs. Nat. Gas Ind. 2025, 45, 125–138. [Google Scholar]
- Ma, L.; Guo, J.; Lu, C.; Yang, R.; Mu, K. A coupled CFD-DEM numerical study of proppant transport in hydraulic fracture and natural fracture. Pet. Sci. Technol. 2022, 40, 2988–3004. [Google Scholar] [CrossRef] [Scilit]
- Shen, C.; Xie, J.; Zhao, J.; Fan, Y.; Ren, L. Whole-life cycle countermeasures to improve the stimulation effect of network fracturing in deep shale gas reservoirs of the southern Sichuan Basin. Nat. Gas Ind. 2021, 41, 169–177. [Google Scholar]
- Ma, L.; Lu, C.; Guo, J.; Zeng, B.; Xu, S. Research and application of low-velocity nonlinear seepage model for unconventional mixed tight reservoir. Energies 2025, 18, 3789. [Google Scholar] [CrossRef] [Scilit]
- Yuan, J.; Deng, J.; Zhang, D.; Li, D.; Yan, W.; Chen, C.; Cheng, L.; Chen, Z. Fracability evaluation of shale-gas reservoirs. Acta Pet. Sin. 2013, 34, 523–527. [Google Scholar]
- Jiang, T.; Bian, X.; Su, Y.; Liu, S.; Wei, R. A new method for evaluating shale fracability index and its application. Pet. Drill. Tech. 2014, 42, 16–20. [Google Scholar]
- Zhao, J.-Z.; Xu, W.-J.; Li, Y.-M.; Hu, J.-Y.; Li, J.-Q. A new method for fracability evaluation of shale-gas reservoirs. Nat. Gas Geosci. 2015, 26, 1165–1172. [Google Scholar]
- Lu, C.; Ma, L.; Guo, J.; Li, X.; Zheng, Y.; Ren, Y.; Yin, C.; Li, J.; Zhou, G.; Wang, J.; et al. Novel method and case study of a deep shale fracability evaluation based on the brittleness index. Energy Explor. Exploit. 2022, 40, 442–459. [Google Scholar] [CrossRef] [Scilit]
- Rickman, R.; Mullen, M.J.; Petre, J.E.; Grieser, B.; Kundert, D. A practical use of shale petrophysics for stimulation design optimization: All shale plays are not clones of the Barnett Shale. In Proceedings of the SPE Annual Technical Conference and Exhibition, Denver, CO, USA, 21–24 September 2008. [Google Scholar]
- Li, J.; Zhong, Y.; Yan, Y.; Lu, T.; Yang, X.; Li, G. A study on non-uniform propagation of multi-cluster hydraulic fractures in deep shale reservoirs based on a two-level flow distribution model. J. Eng. Geol. 2025, 33, 1697–1711. [Google Scholar]
- Yang, Z.; Fu, D.; Tao, J.; Yi, L.; Li, X.; Yi, D.; He, J. Current status and prospects of fracture propagation simulation research based on the block discrete element method. Spec. Oil Gas Reserv. 2025, 32, 1–9. [Google Scholar]
- Heil, M. An efficient solver for the fully coupled solution of large-displacement fluid–structure interaction problems. Comput. Methods Appl. Mech. Eng. 2004, 193, 1–23. [Google Scholar] [CrossRef] [Scilit]
- Xu, S.; Wang, Z.J. An immersed interface method for simulating the interaction of a fluid with moving boundaries. J. Comput. Phys. 2006, 216, 454–493. [Google Scholar] [CrossRef] [Scilit]
- Li, M.; Zhang, F. Discrete element modeling of hydraulic fracturing. In Mechanics of Hydraulic Fracturing: Experiment, Model, and Monitoring; Wiley: Hoboken, NJ, USA, 2022; pp. 141–175. [Google Scholar]
- Cao, F.; He, J.; Cao, H.; Deng, H.; Jiang, R.; Wang, W.; Li, D.; Mao, J. Multi-scale rock mechanical parameters and quantitative assessment of brittleness in alkaline lacustrine shale reservoirs. J. Chengdu Univ. Technol. (Sci. Technol. Ed.) 2026, 53, 301–318. [Google Scholar]

Disclaimer/Publisher’s Note: The statements, opinions and data contained in all publications are solely those of the individual author(s) and contributor(s) and not of MDPI and/or the editor(s). MDPI and/or the editor(s) disclaim responsibility for any injury to people or property resulting from any ideas, methods, instructions or products referred to in the content. |
© 2026 by the authors. Licensee MDPI, Basel, Switzerland. This article is an open access article distributed under the terms and conditions of the Creative Commons Attribution (CC BY) license.