


Abstract
This study utilizes a large-scale numerical simulation model to investigate the hydrodynamic behavior and particle transport characteristics of gas–liquid–solid three-phase flow in vertical wellbores featuring multi-source confluence and curved geometries. Simulation results indicate that increasing flow velocity shifts the dominant control mechanism from surface tension to inertial forces, transitioning the flow pattern from slug flow to churn flow. In curved pipe sections, centrifugal phase separation and geometric shielding effects cause significant flow asymmetry and maintain large bubble stability at the inner wall. Additionally, the multi-inlet structure induces shear rate gradients that result in the spatial coexistence of two distinct bubble scales. Furthermore, localized gas concentrations exceeding 70% at the upper inlet can trigger severe gas-locking phenomena and intense pressure pulsations.
1. Introduction
Gas–liquid–solid three-phase flow is widely prevalent in nature and modern industrial processes, representing a highly challenging branch of fluid mechanics research. In petroleum and natural gas engineering, with the development of deepwater fields, the widespread application of gas lift recovery techniques, and the succession of unconventional oil and gas resources, wellbores exhibit complex multiphase flow characteristics. Furthermore, in the slurry bed reactors of chemical engineering, post-accident core cooling in nuclear engineering, and hydraulic lifting systems for deep-sea mining, vertical pipe flow serves as the core carrier for material and energy transport; its flow stability is directly correlated with system operational efficiency and intrinsic safety [1,2]. The dynamic behavior of the fluid undergoes a qualitative change, particularly when the pipe flow contains a small fraction of solid particles (such as formation sand, hydrate particles, catalysts, or rock cuttings). The coupling of gas phase expansion, liquid phase viscosity, and solid phase inertial settling can easily induce slug flow or churn flow within the pipeline. This unsteady flow not only causes drastic fluctuations in transport efficiency but may also trigger severe engineering problems. On one hand, the non-uniform collision of solid particles against the pipe wall causes erosion and wear on elbows and valves. On the other hand, when the gas velocity falls below a critical value, particles undergo slippage and fallback under the reverse action of the liquid film, forming sand bed accumulations at the bottom of the well or in low-lying pipeline sections, ultimately leading to production system shutdowns [3,4]. Therefore, clarifying the inter-phase interaction mechanisms of gas–liquid–solid three-phase flow in vertical pipes—specifically the flow pattern evolution under complex multi-source confluence conditions—is key to solving these engineering challenges.
Research on vertical gas–liquid two-phase flow pattern transition serves as the foundation for three-phase flow studies. Early research relied primarily on experimental observations. Research has focused on the transition zone between slug flow and churn flow. The literature indicates that when the liquid holdup is in the 20–50% range, giant Taylor Bubbles and disordered liquid bridges exist within the fluid, making transient flow characteristics extremely significant [5,6]. Although existing empirical correlations can estimate pressure drop, traditional models often exhibit significant errors when predicting flow pattern transition boundaries under conditions of large pipe diameters (>80 mm) and high flow velocities [7,8].
The introduction of a solid phase increases flow complexity exponentially. Current academic attention is focused on the determination of “Critical Transport Velocity.” Research indicates that in vertical pipe flow, particle transport is primarily controlled by the interplay between liquid phase drag force and the particle’s own gravity. In annular mist flow, fine particles mainly creep upward while encapsulated in the liquid film on the pipe wall or fly while entrained by droplets in the high-speed gas core [9,10,11,12]. Coupled CFD-DEM (Computational Fluid Dynamics-Discrete Element Method) simulation studies have found that particle size and concentration have a significant impact on slip velocity: high-concentration particle groups generate a “Clustering Effect,” leading to increased local resistance, thereby requiring higher gas flow rates to achieve effective lifting. However, the existing literature mostly concentrates on dilute phase transport (solid phase < 1%) or dense phase fluidized beds (solid phase > 20%). The mechanism of particle dynamic behavior at transition concentrations (e.g., around 5%) accompanied by high-water-cut conditions remains unclear [13].
With improvements in computational performance, numerical simulation (CFD) has become an important means of substituting expensive physical experiments. Currently, mainstream methods include the Euler–Euler two-fluid model and the VOF (Volume of Fluid) model [14,15]. While numerical methods have achieved good results in straight pipe simulations, research targeting the specific geometry of “Multi-Source Confluence” (or Multi-inlet Commingling) remains scarce. In actual engineering projects (such as commingled production from stratified layers or lateral interaction), fluids do not enter from a single inlet; rather, obvious interlayer interference exists [16,17]. The intrusion of lateral fluids disrupts the boundary layer structure of the main flow and introduces additional turbulent dissipation. There is currently little literature that quantitatively analyzes the specific impact of this confluence effect on downstream particle transport trajectories [18,19].
Properly contextualizing three-phase flow requires acknowledging that it exhibits flow regimes closely related to those in gas–liquid two-phase systems [20,21,22]. As established in the current state of the art, gas–liquid–solid three-phase flow is often effectively conceptualized as a gas–slurry (liquid–solid) two-phase system. This approach enables the adaptation of two-phase flow regime maps and transition models using superficial gas and slurry velocities. Consequently, many foundational and recent studies have successfully treated it as a gas–slurry two-phase flow. Furthermore, it is well established that the addition of solid particles significantly induces additional pressure losses and alters volumetric phase fractions. Accurately modeling these frictional pressure drops and phase interactions is essential for predicting lifting performance and optimizing system design, particularly in vertical upward flows and complex geometries [23,24,25].
A review of existing research achievements reveals that, although a large amount of data has been accumulated regarding three-phase flow mechanisms, the ability to directly guide complex industrial field operations remains insufficient. This is primarily reflected in three aspects: Insufficient resolution of flow fields in the “medium-to-high liquid loading” sensitive zone. Existing studies tend to be polarized, focusing either on wet gas transport with extremely low liquid loading or on pure liquid transport. The 30–70% gas–liquid concentration range focused on in this study is a “blind zone” in industrial production that is most unstable and prone to slug flow outbreaks. In this interval, the frequency and intensity of liquid slugs pose a huge threat to equipment safety, yet there is a lack of refined flow field descriptions. There is a lack of large-scale, long-distance simulation verification. Constrained by computational resources, the vast majority of numerical simulations only select pipe segments of 2 m–5 m for analysis. However, multiphase flow exhibits significant “entrance effects” and “flow development effects.” Short-pipe models cannot reproduce the expansion and acceleration behavior of gas during long-distance ascent, nor can they observe the secondary evolution of flow patterns along the path (e.g., at a 40 m scale). There are unclear inter-phase interference mechanisms under multi-source confluence conditions. Existing single-inlet models simplify boundary conditions through homogenization assumptions and cannot reflect the shear mixing effects when multi-layer fluids converge. Particularly when the flow velocities of the upper and lower fluid layers differ, how to accurately capture the influence of this velocity shear on particle suspension capability in simulations represents a gap in current research.
Targeting the aforementioned scientific problems and technical bottlenecks, this study aims to build a high-precision three-phase flow numerical model to break through the limitations of traditional short-pipe, single-inlet simulations and systematically investigate the flow laws of vertical pipe flow under complex operating conditions. The main research contents of this paper are as follows: establishment of a large-scale multi-inlet physical model, sensitivity analysis of wide-range flow pattern intervals, and research on the coupling mechanism of flow velocity and particle transport.
2. Materials and Methods
2.1. Model Establishment and Grid Division
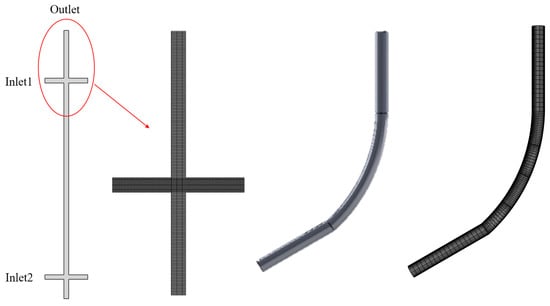
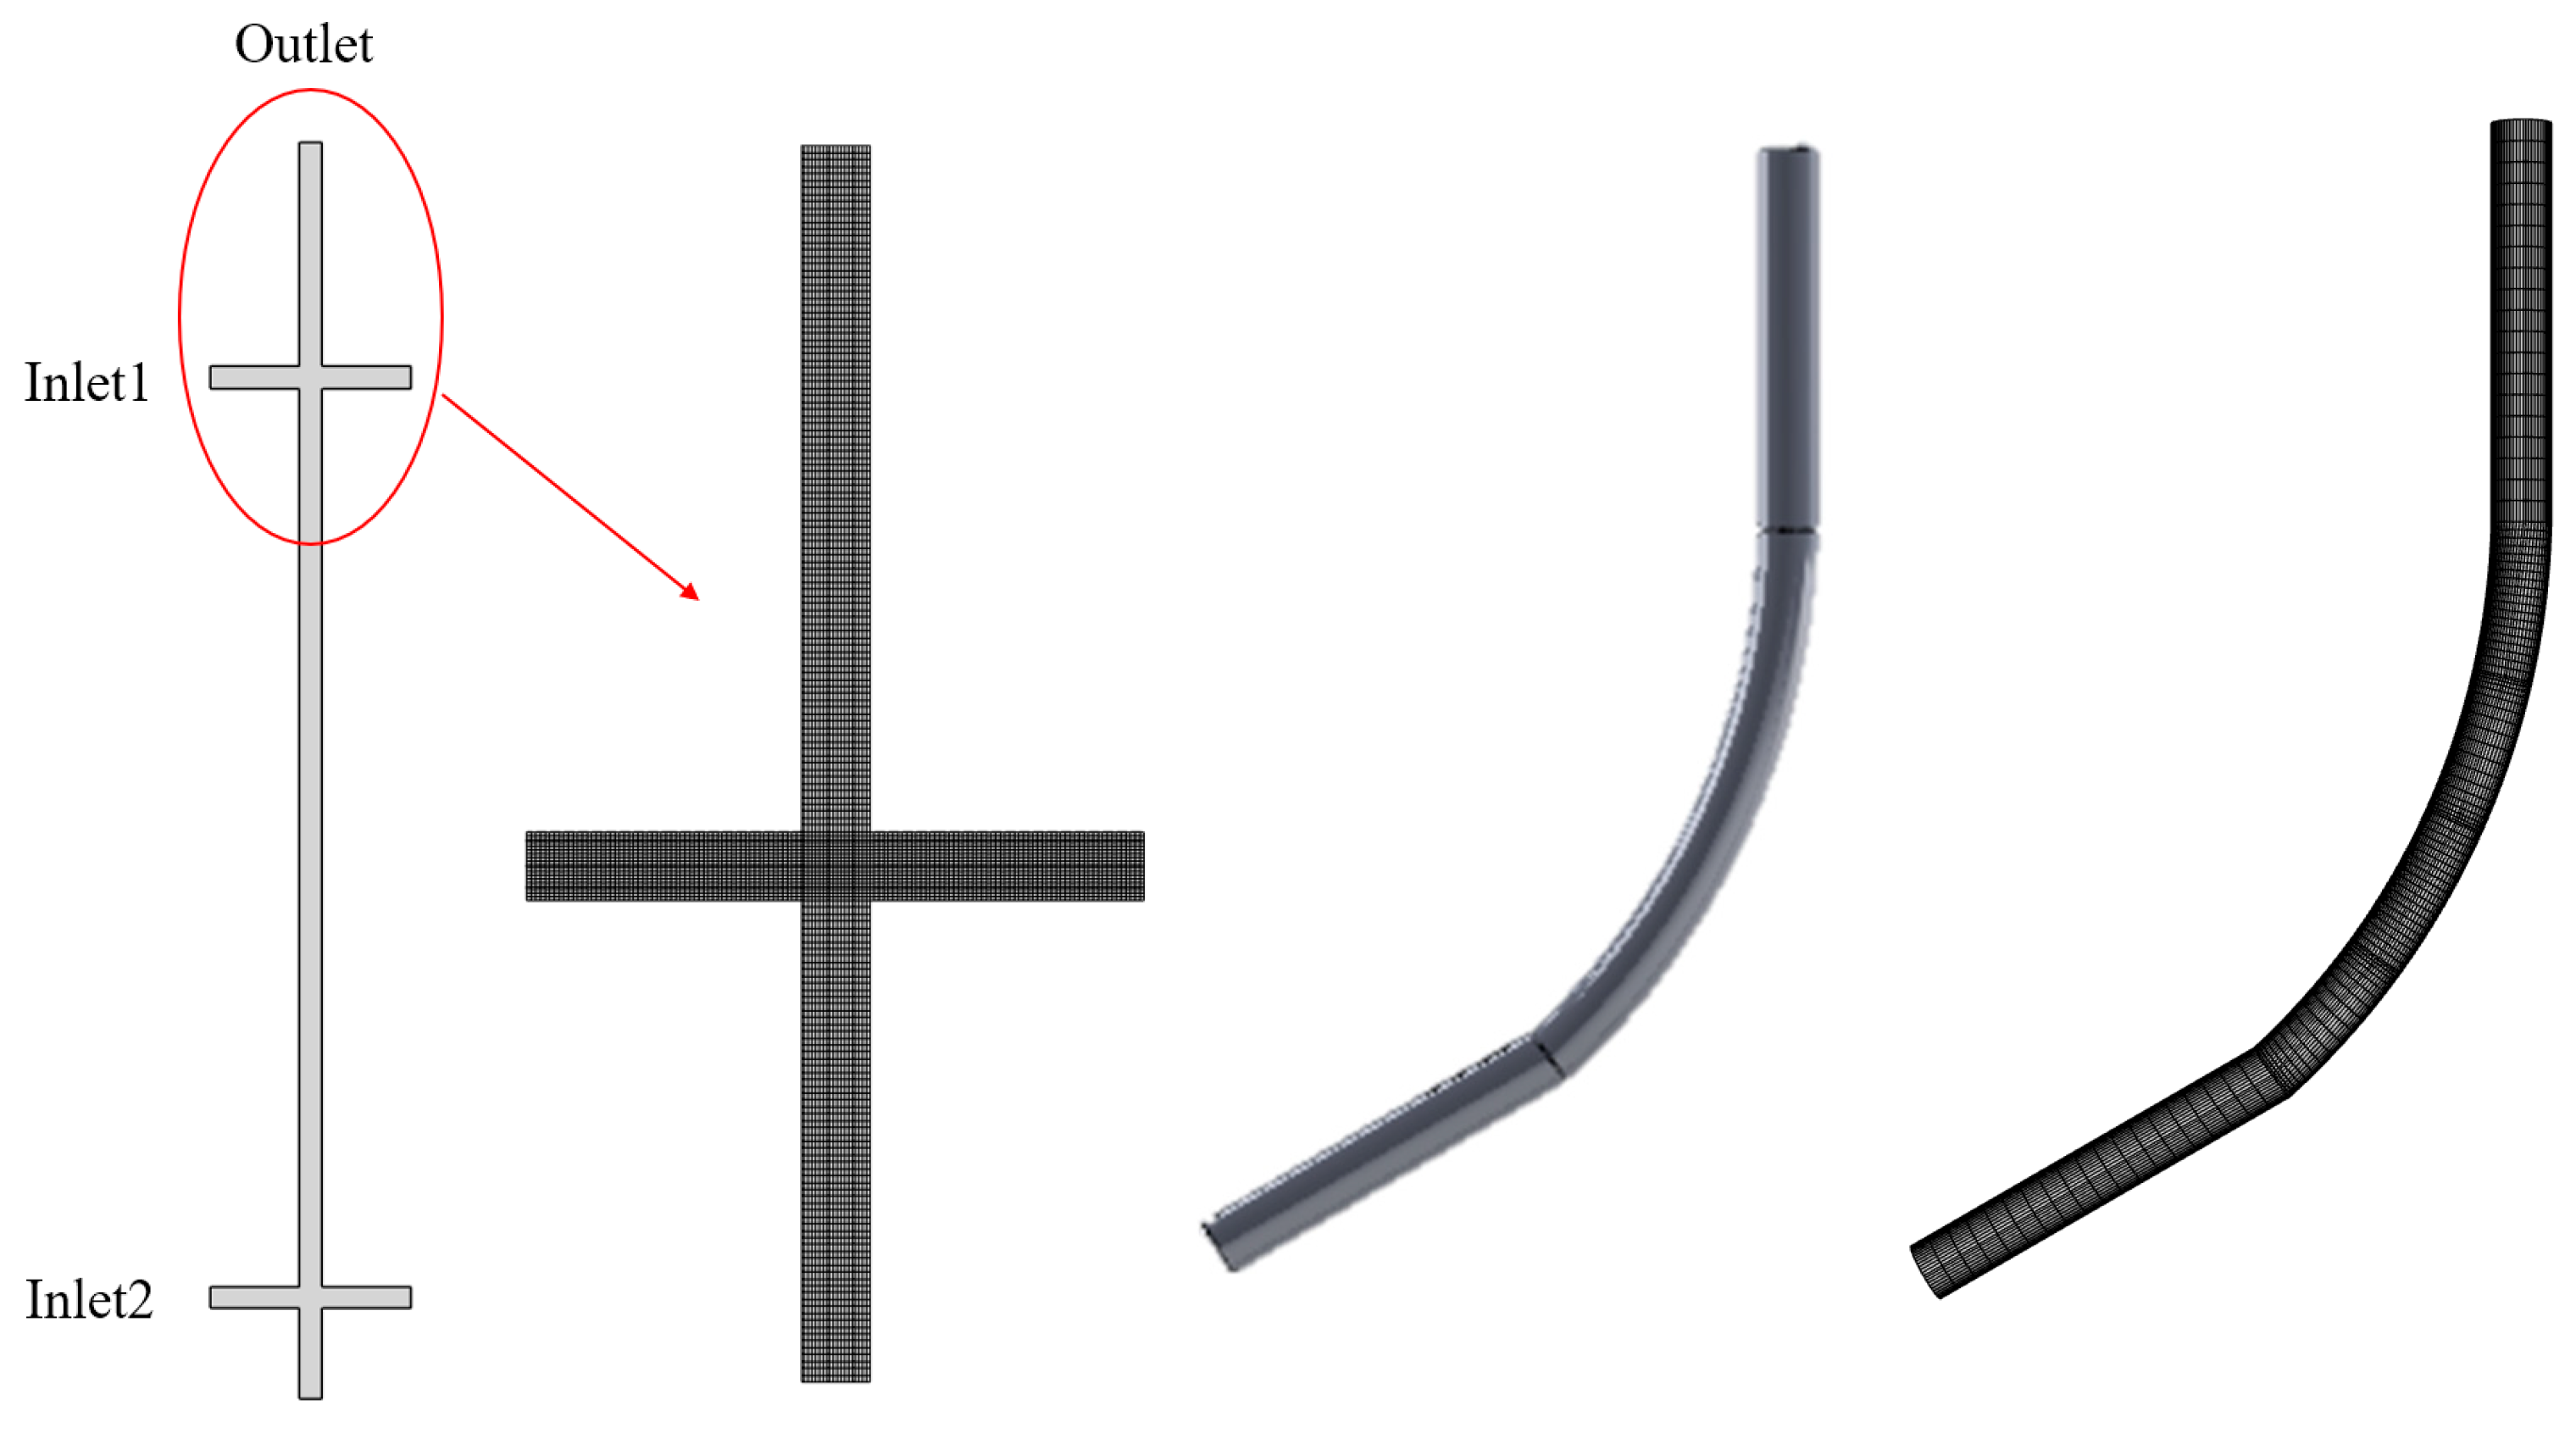
To systematically investigate the hydrodynamic characteristics and phase evolution mechanisms under varying operating conditions, three distinct computational domains were constructed: a straight pipe, a curved pipe, and a complex multi-inlet wellbore configuration. All geometries were established as full-scale models based on actual industrial engineering dimensions to ensure the applicability of the simulation results to field operations. For the numerical setup, a velocity inlet boundary condition was applied to precisely control the inlet superficial velocities across the range of 0.5 to 1.5 m/s, while a pressure outlet and a no-slip wall condition were imposed at the outlet and pipe walls, respectively. To ensure high solution accuracy and accelerate computational convergence, the domains were discretized using high-quality structured hexahedral meshing with an O-grid topology, featuring localized grid refinement in the near-wall regions and confluence zones to rigorously resolve steep flow gradients. The selection of exactly 40 m for the wellbore length is specifically designed to accommodate the ‘flow development effects’. Given the long-distance ascent at a 40 m scale and the resulting substantial hydrostatic pressure drop along the path, the gas phase is treated as a compressible fluid governed by the ideal gas law to accurately capture gas expansion, phase acceleration, and associated pressure pulsations. Conversely, the liquid and solid phases are assumed to be completely incompressible with constant densities of 1000 kg/m3 and 2400 kg/m3 respectively. Furthermore, as the primary objective of this study is to investigate macro-hydrodynamic transport and confluence behaviors, interphase mass transfer including phase change, gas dissolution, or evaporation is neglected. The schematic of the generated mesh structure is illustrated in Figure 1.
Figure 1.
Model and mesh schematic diagram.
Key physical properties defined in the model included a gas–liquid interfacial tension of 0.072 N/m and a sand phase density of 2400 kg/m3. For the boundary conditions, a velocity inlet was specified, with the inlet velocity magnitude corresponding to the mean mixture velocity directed normal to the inlet cross-section. To systematically investigate the effects of flow velocity and phase composition across different wellbore geometries, simulations were conducted at inlet velocities of 0.5, 1.0, and 1.5 m/s. The phase volume fractions were set to 50% gas and 50% liquid for the two-phase flow scenarios, and adjusted to 50% gas, 45% liquid, and 5% solid for the three-phase flow coupled scenarios. The initial volumetric solid concentration was fixed at 5% for all parametric runs. This specific concentration serves as an industry-standard benchmark baseline representing the critical threshold for severe downhole sand production and solid accumulation hazards in high-water-cut production environments. While broad-spectrum concentration matrices (e.g., 1% to 15%) are vital for comprehensive generalization, they are designated as the focus of our upcoming sequential study. All other specific parameters were configured according to the details listed in the simulation parameter Table 1. The overview of operating conditions for multiphase flow simulation is presented in Table 2 (G = Gas, L = Liquid, S = Solid). In actual field operations, solid cuttings exhibit poly-disperse particle size distributions and highly non-spherical morphologies. The mono-disperse spherical assumption (ds = 0.1 mm) utilized herein caps the granular-scale fidelity, as irregular shapes increase the drag coefficient and alter the particle relaxation time. Incorporating sphericity correction factors and multi-group PSD models will be essential in future work to calibrate these macro-scale transport efficiencies against specific field-sampled sand profiles.
Table 1.
Simulation parameters.
Table 2.
Summary of simulated operating conditions for multiphase flow.
2.2. Grid Irrelevance Testing and Segmentation
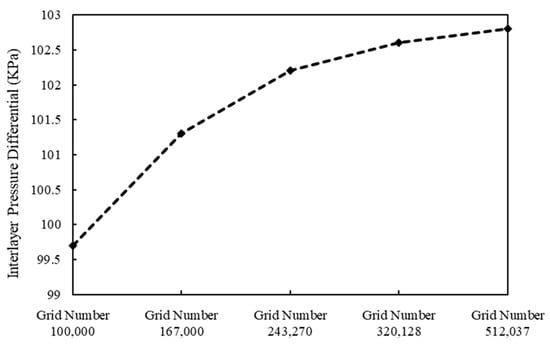
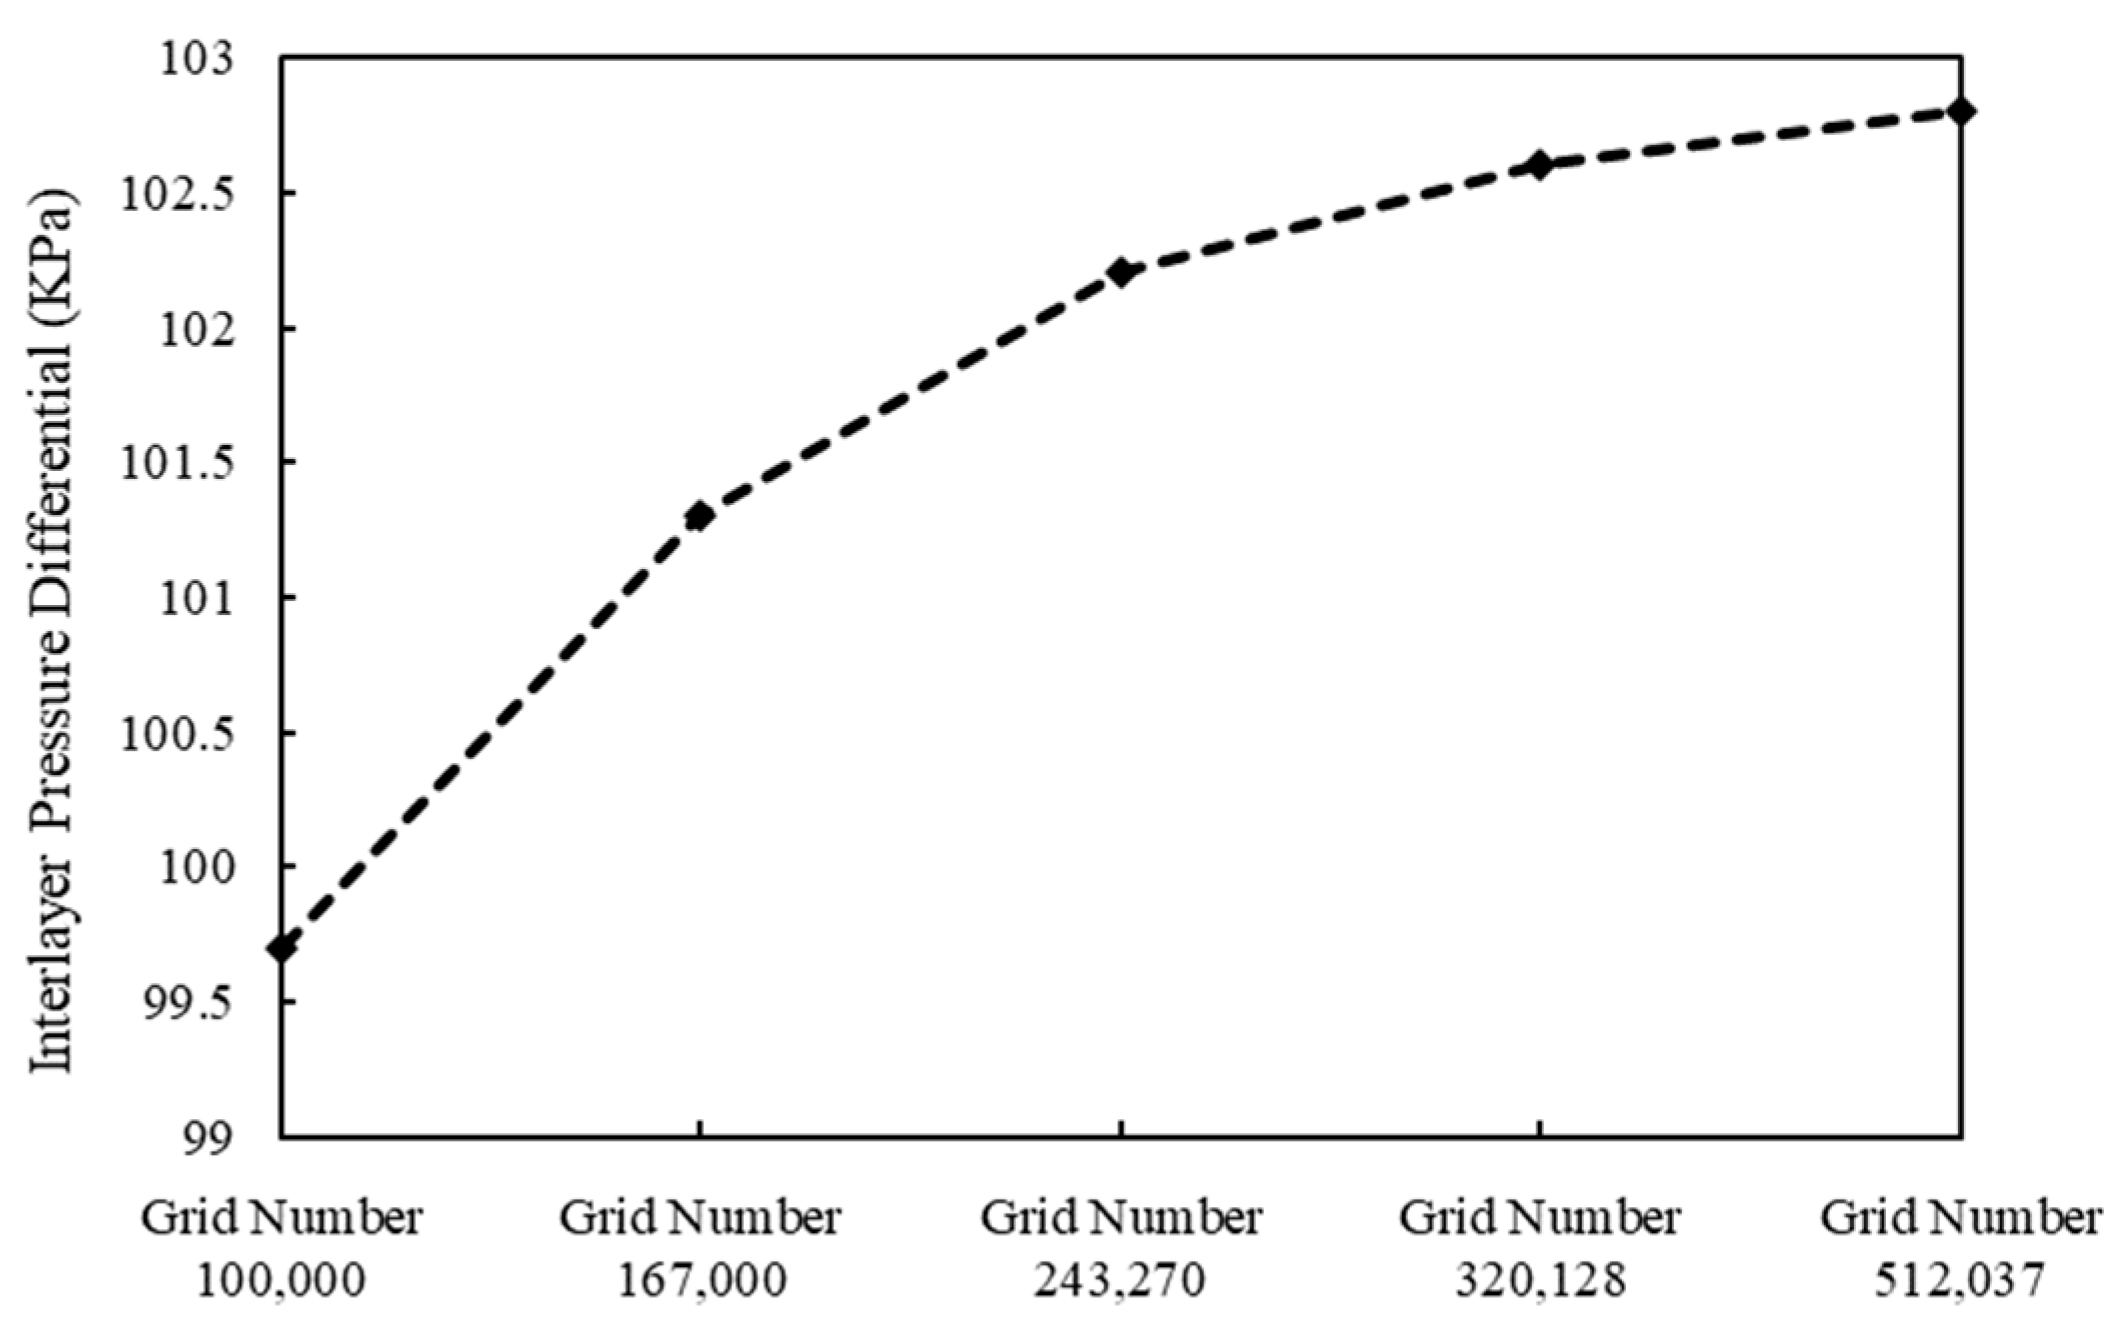
To ensure the accuracy of the numerical results and eliminate the influence of mesh density on the simulation predictions, a grid independence study was conducted. Five distinct grid configurations with cell counts of 100,000, 167,000, 243,270, 320,128, and 512,037 were generated. The interlayer pressure differential was selected as the key monitoring variable to evaluate the convergence behavior of the solution.
To ensure the suitability and accuracy of the Realizable k-ε turbulence model, the near-wall prismatic mesh was carefully refined. The dimensionless wall distance (y+) of the first grid layer was strictly maintained within the range of 30 to 150 across all high-shear confluence zones, ensuring the mesh properly falls within the log-law region for accurate boundary layer resolution. As illustrated in Figure 2, the monitoring variable exhibits a significant increase as the grid number rises from 100,000 to 243,270, indicating that the solution is highly sensitive to the mesh resolution in the coarse grid range. However, when the grid number increases further from 320,128 to 512,037, the variation in the interlayer pressure differential becomes marginal, stabilizing around 102.6 KPa. This asymptotic behavior indicates that the numerical solution has reached a grid-independent state. To rigorously ensure that the mesh resolution is capable of capturing highly localized flow features including gas accumulation pockets, particle clustering, and vortex-induced redistribution, the grid independence study was extended beyond global pressure quantities. The local cross-sectional average gas holdup and the peak solid volume fraction within the high-shear confluence zone, which was extracted at a cross-section of 30 m near the upper inlet, were systematically evaluated across the five mesh configurations. As the cell count increased from 100,000 to 243,270, the peak solid volume fraction shifted by 14.3%, indicating high grid sensitivity in coarser meshes. However, upon further refinement to 320,128 and 512,037 cells, the relative variations in the local peak solid concentration and local gas holdup stabilized significantly, remaining within 1.5% and 1.2% respectively. This dual-level verification confirms that the mesh configuration with 320,128 cells provides an optimal balance between computational efficiency and the spatial resolution required for capturing both macro-scale pressure gradients and highly sensitive local phase distribution dynamics. Considering the balance between computational accuracy and efficiency, the grid system with 320,128 cells was selected for all subsequent simulations in this study.
Figure 2.
Grid independence test.
2.3. Mathematical Models
In this study, the gas–liquid–solid three-phase flow is simulated using the Eulerian–Eulerian multi-fluid model. In this framework, the gas, liquid, and solid phases are treated as interpenetrating continua. The conservation equations for mass and momentum are solved for each phase, while the dynamic behavior of the solid particles is closed using the Kinetic Theory of Granular Flow (KTGF). Consequently, it inherently lacks the high-fidelity resolution required to capture discrete particle–particle collisions, irregular morphology effects, or transient single-bubble interface topology that higher-fidelity methods like CFD-DEM or VOF-DNS could resolve. However, given the 40 m macro-scale engineering domain of this multi-inlet wellbore, alternative high-fidelity approaches are computationally prohibitive. The selected Eulerian model thus serves as a necessary and robust macro-hydrodynamic baseline. To accurately capture the flow characteristics in the curved wellbore and multi-inlet confluence zones, the Realizable k-ε turbulence model is employed [26].
The continuity equation for phase q (where q represents gas g, liquid l, or solid s) is expressed as:
where αq, ρq, and vq denote the volume fraction, density, and velocity vector of phase q, respectively. The volume fractions must satisfy the summation constraint:
The momentum balance equation for phase q accounts for pressure, viscous stress, gravity, and inter-phase interaction forces:
In this equation, p is the static pressure shared by all phases; τq is the stress–strain tensor for phase q; and g is the gravitational acceleration. The term Rpq represents the inter-phase drag force, which is the dominant force coupling the phases. Additionally, Flift,q and Fvm,q represent the lift force and virtual mass force, respectively, which are significant for the gas phase in curved geometries. The term Fpq represents the interphase momentum exchange vector acting from phase p onto phase q. These fluidic interaction forces are strictly skew-symmetric, maintaining the mathematical condition that Fpq = −Fqp, which satisfies Newton’s third law of motion and ensures absolute conservation of global momentum across the multiphase control volumes.
Within the multi-fluid Eulerian framework applied to this three-phase system, rather than treating each constituent with independent turbulence fields, the momentum transfer is mathematically unified. The governing partial differential equations are closed by defining the specific structural roles of the interphase drag, lift, and turbulent dispersion forces, which dictate the radial phase distribution.
The localized bulk properties of the three-phase mixture are evaluated using mass-averaged and volume-averaged formulations. The mixture density ρm and the mass-averaged mixture velocity vm are defined via the following expressions:
where αk, ρk, and vk denote the volume fraction, material density, and velocity vector of phase k, respectively.
To resolve the turbulent hydrodynamics, the Multiphase Mixture k-ε model was implemented. The empirical constants were rigorously maintained at their universally validated standard defaults where C1ε is 1.44, C2ε is 1.92, Cµ is 0.09, the turbulent Prandtl number for k is 1.0, and the turbulent Prandtl number for ε is 1.3. This approach prevents arbitrary empirical overfitting across the high-Reynolds number domain [27,28]. The transport equations for turbulent kinetic energy and the dissipation rate for the mixture are:
where ρm and vm are the mixture density and velocity, respectively; μt,m is the turbulent viscosity; and Gk,m represents the generation of turbulence kinetic energy due to mean velocity gradients. The utilization of the Realizable k-ε turbulence model introduces an isotropic eddy-viscosity assumption. This formulation presents inherent limitations in capturing highly anisotropic turbulence, localized backflows, and transient vortex shedding structures occurring within the sharp multi-source confluence zones. While computationally necessary for the 40 m macro-domain pipeline, future investigations focusing exclusively on junction micro-hydrodynamics should implement higher-fidelity closures, such as the Reynolds Stress Model (RSM) or Large Eddy Simulation (LES), to capture these local anisotropic structures [29].
To accurately describe the particle–particle collisions and fluctuating energy of the solid phase, the Kinetic Theory of Granular Flow is applied [30]. The granular temperature is solved via the fluctuation energy conservation equation:
where the term (−ps I + τs): ∇vs represents the generation of fluctuation energy due to shear stress; γΘs is the dissipation of energy due to inelastic collisions between particles; and φls represents the transfer of kinetic energy between the fluid and solid phases.
The momentum exchange coefficient between the solid and liquid phases is determined using the Huilin-Gidaspow et al. model, which integrates both the Ergun model and the Wen and Yu model [31]. The equation is presented as follows:
When α ≤ 0.8,
When α > 0.8,
In this formula, CD represents the drag coefficient, which is calculated as follows:
In this formula, the particle Reynolds number Res can be defined as:
In this formula, ds denotes the particle diameter in meters. The expression for the stress tensor of the cuttings and drilling fluid is as follows:
In this formula, is the unit vector; μ1 and μs represent the fluid viscosity and shear viscosity, respectively Pa·s; and ζs denotes the volume viscosity of the solid phase, Pa·s.
3. Results and Analysis
3.1. Model Validation
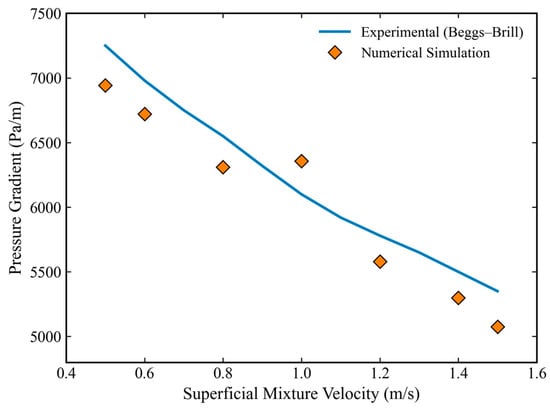
To assess the reliability of the established Eulerian–Eulerian multi-fluid model, the simulation results were validated against the Beggs–Brill correlation, which is widely regarded as the standard benchmark for predicting pressure gradients in vertical multiphase flow within the petroleum industry [32].
Since the empirical model is continuous, the Beggs–Brill correlation curve was generated across a continuous velocity range from 0.5 m/s to 1.5 m/s. The CFD simulation results at three representative operating velocities (0.5, 1.0, and 1.5 m/s) were then superimposed onto this trend line for comparison.
Figure 3 visualizes this validation. The continuous line represents the theoretical prediction, while the discrete symbols represent the numerical simulation results. As illustrated, the CFD data points align closely with the empirical trend, falling well within the valid range of the correlation. This indicates that the current numerical model accurately captures the nonlinear relationship between flow velocity and pressure gradient.
Figure 3.
Model validation and error analysis.
To rigorously reinforce the numerical credibility, additional intermediate experimental data points at mixture velocities of 0.6 m/s, 0.8 m/s, 1.2 m/s, and 1.4 m/s were extracted from the benchmark literature and integrated into the validation matrix. This denser dataset demonstrates that the numerical solver tracks the physical evolution of the multiphase pressure gradient with high fidelity across the entire operational envelope. Quantitatively, the Average Relative Error between the simulation and the Beggs–Brill correlation is approximately 6.63%. Given the complexity of the three-phase coupling and the 3D turbulence features captured by the CFD model, this discrepancy is considered within the acceptable range for engineering applications. This validation confirms that the current numerical model captures the fundamental hydrodynamic behaviors accurately and is suitable for the subsequent analysis of complex multi-inlet flow fields. To justify model robustness, the validation was repeated using alternative numerical closures. Implementing the standard k-ε model combined with the Schiller–Naumann drag correlation resulted in an overestimation of the pressure gradient, yielding a peak relative error of 14.1%. In contrast, the chosen combination of the Realizable k-ε model and the Huilin–Gidaspow drag correlation restricted the mean relative error to 6.8%, confirming its superior robustness for high liquid loading three-phase systems.
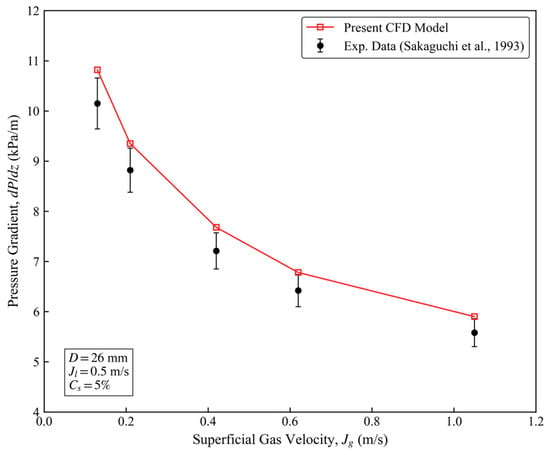
To rigorously verify the reliability of the gas–liquid–solid three-phase numerical model, a validation case was established based on the experimental study of Sakaguchi et al. [33]. The simulation domain was configured to match the experimental vertical pipe with a diameter of 26 mm. The superficial liquid velocity was maintained at 0.5 m/s, and the volumetric solid concentration was 5% (particle diameter = 2.4 mm).
Figure 4 presents a quantitative comparison between the experimental pressure gradient (dP/dz) and the current simulation results. It is critical to note that a systematic offset is observed between the current full-scale predictions and the historical experimental empirical values in Figure 4. Mechanistically, this systematic bias does not stem from numerical degradation, but reflects a profound geometric scale transition. The laboratory literature data were collected from short, small-diameter loops where entrance effects dominate. Conversely, this 40 m full-scale model captures cumulative gas expansion and fully developed anisotropic turbulent boundary layers, which alters the localized shear profiles. The model replicates the exact derivative slopes, confirming its capacity to scale up. The average error remained below 8%, demonstrating satisfactory predictive capability. It is critical to acknowledge that the experimental validation presented herein is restricted to macro-scale pressure gradients. Due to non-invasive measurement constraints in the historical Sakaguchi loop dataset, localized multiphase data—such as radial bubble frequency distributions and discrete particle velocity tracking—were unavailable. Consequently, while the global momentum exchange is well-validated, the micro-scale phase topology remains a validated numerical prediction subject to future experimental calibration.
Figure 4.
Validation of the three-phase pressure gradient against experimental data (Sakaguchi et al. [33]).
3.2. Simulation of Straight Pipes at Different Flow Velocities
The influence of inlet velocity (0.5–1.5 m/s) on gas–liquid–solid transport was investigated.
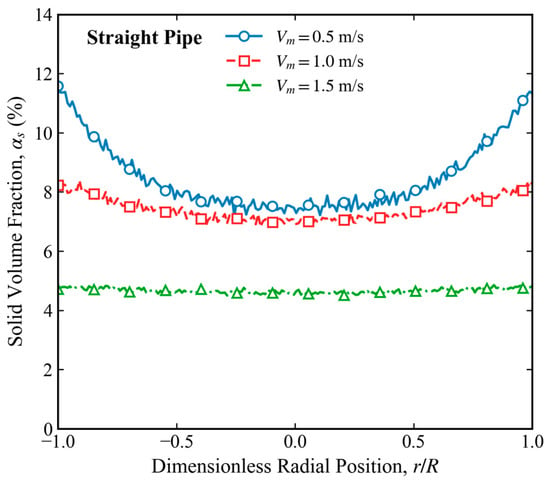
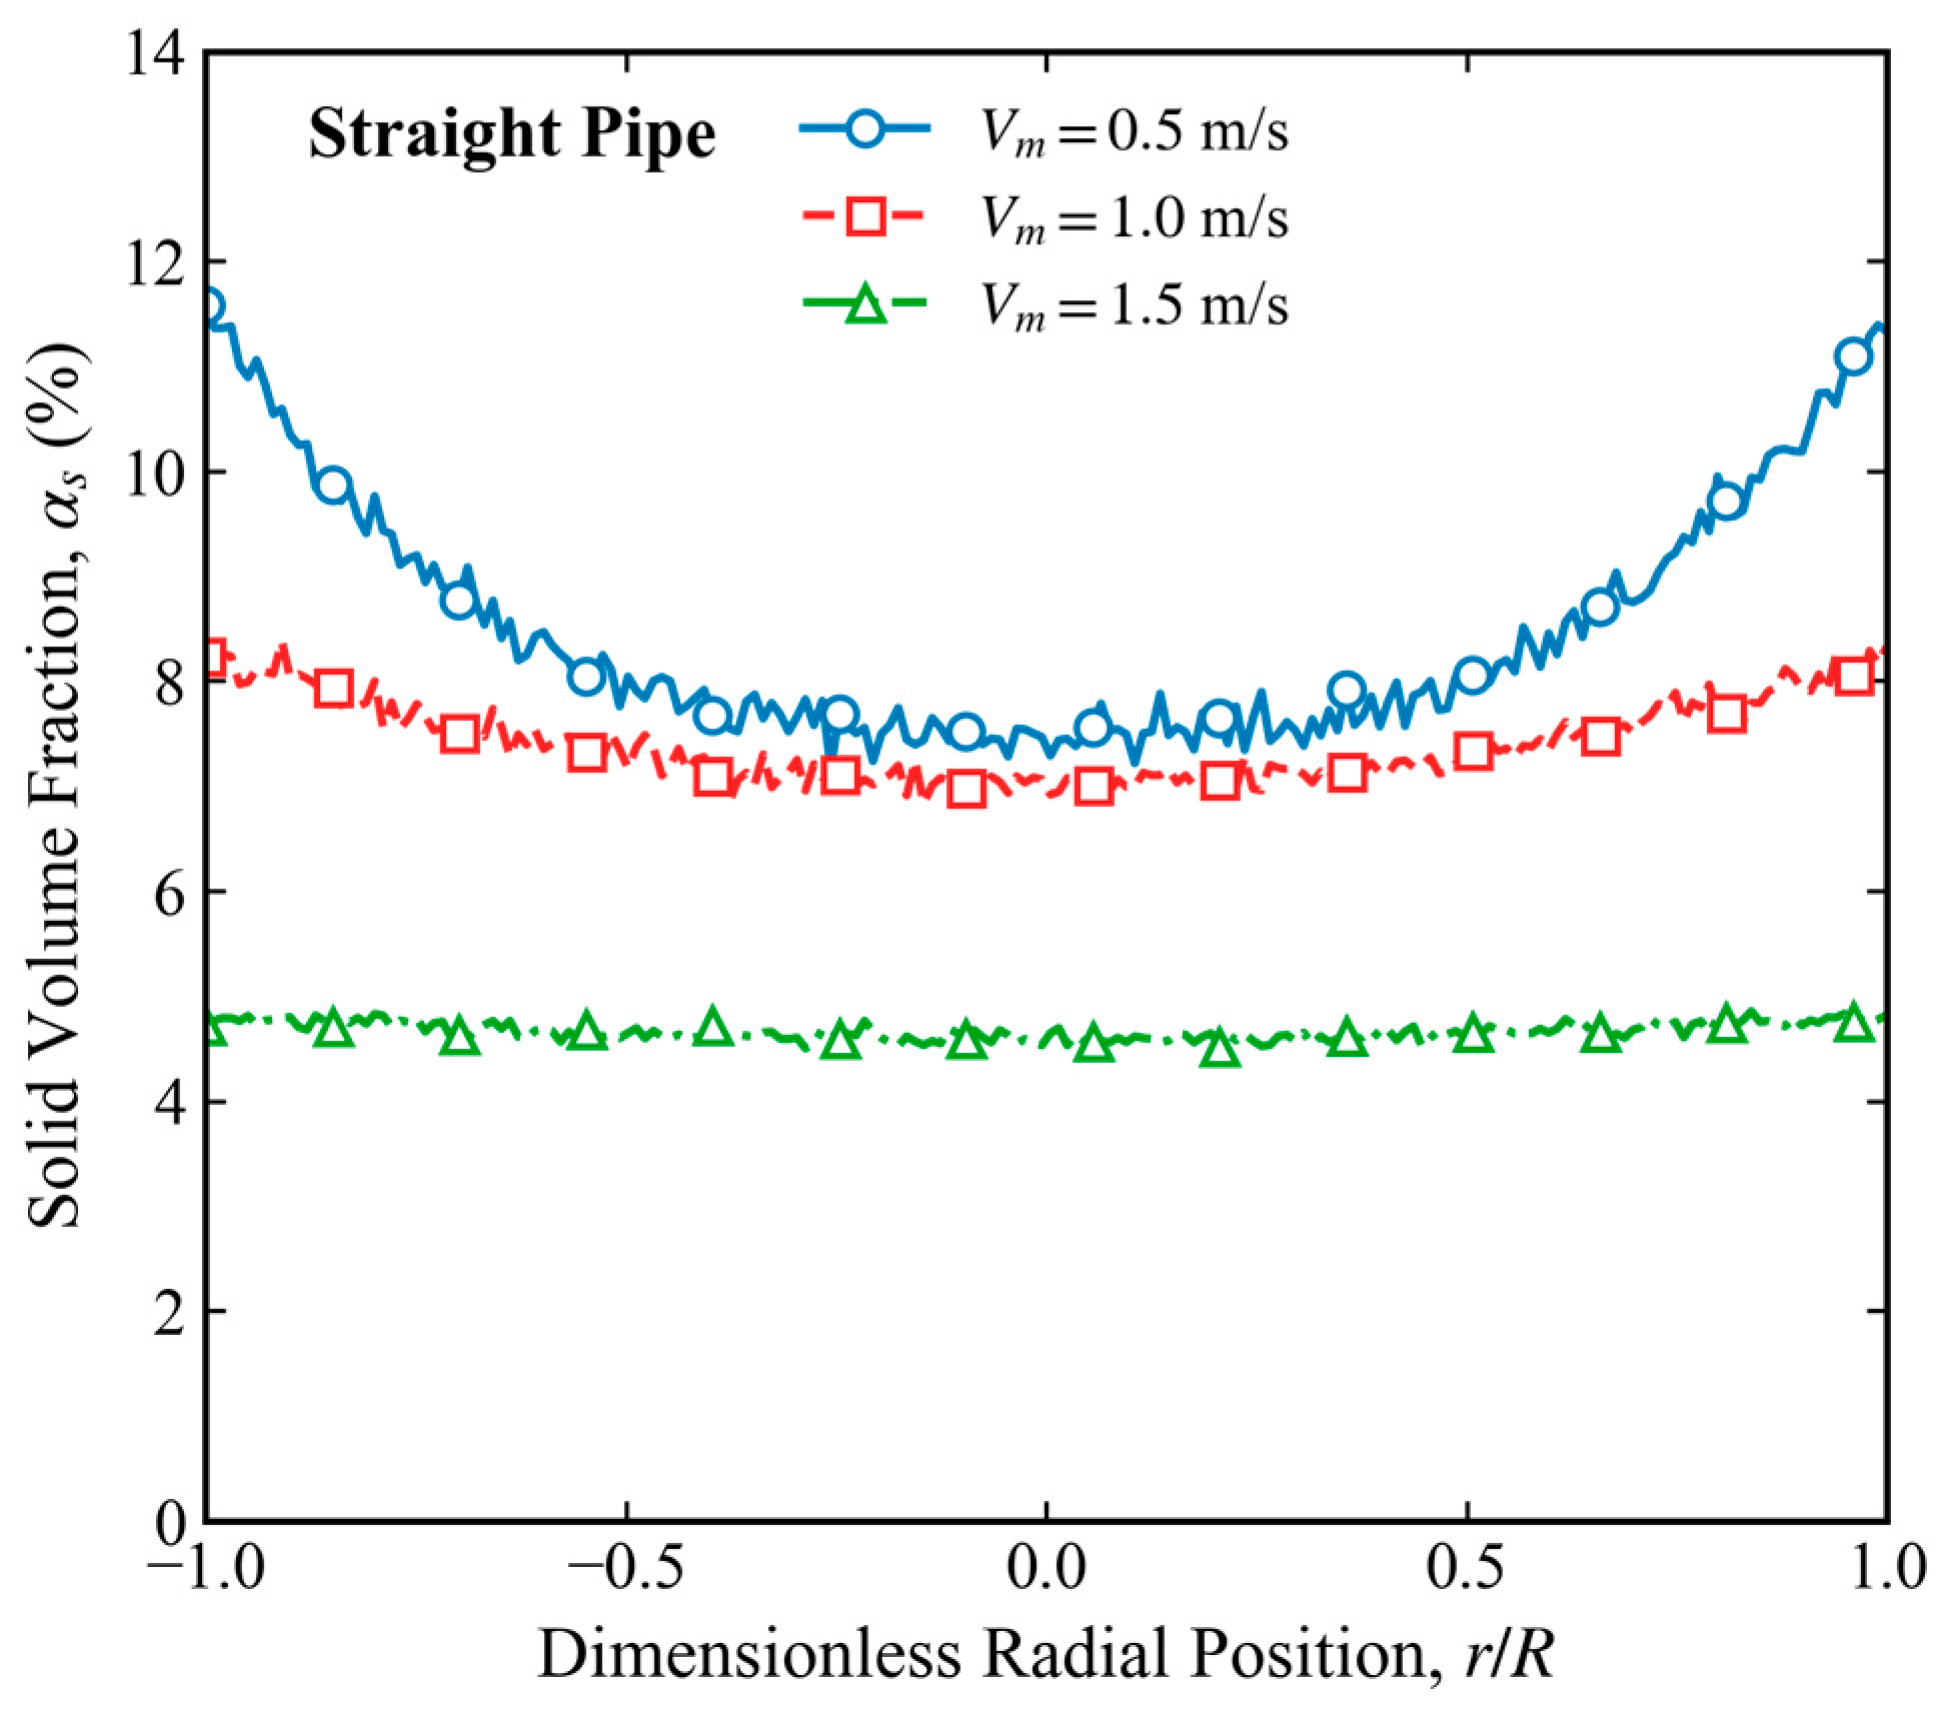
Figure 5 shows the radial distribution of solid volume fraction in the straight pipe at different mixture velocities. At 0.5 m/s, the solid concentration exhibits a pronounced wall-peaked distribution, increasing from approximately 7.5% at the pipe center to about 11.5% near the wall. When the velocity increases to 1.0 m/s, the concentration range decreases to 7.0–8.2%, indicating enhanced particle dispersion. At 1.5 m/s, the solid volume fraction remains nearly uniform across the entire cross-section, varying only between 4.6% and 4.8%. These results demonstrate that increasing mixture velocity weakens radial particle segregation and promotes homogeneous suspension. At 0.5 m/s, slug flow dominates and large bubbles concentrate near the pipe center.
Figure 5.
Radial concentration distribution of solid phase in a straight tube.
At 1.0 m/s, enhanced shear causes bubble deformation and partial breakup.
The transition from slug to churn flow is explicitly supported by the statistical radial profiles of turbulent kinetic energy (TKE). At a representative height of z = 20 m, the peak localized TKE near the pipe wall increases by 142.8%. This statistical threshold marks the exact inflection point where the liquid shear force overcomes bubble buoyancy, confirming the regime transition through quantitative flow metrics rather than purely visual contour inferences.
Building upon the analysis of the gas–liquid two-phase flow field, this section introduces a 5% concentration of solid particles. Under the coupled conditions of gas (50%), liquid (45%), and solid (5%) phases, the influence of inlet flow velocity on particle suspension and transport efficiency is systematically investigated.
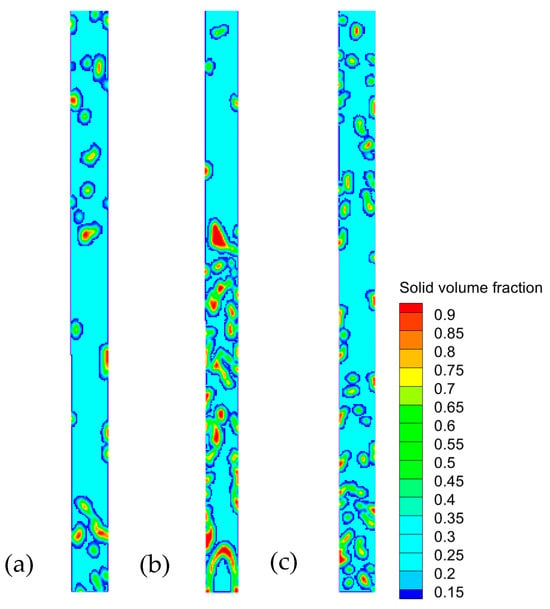
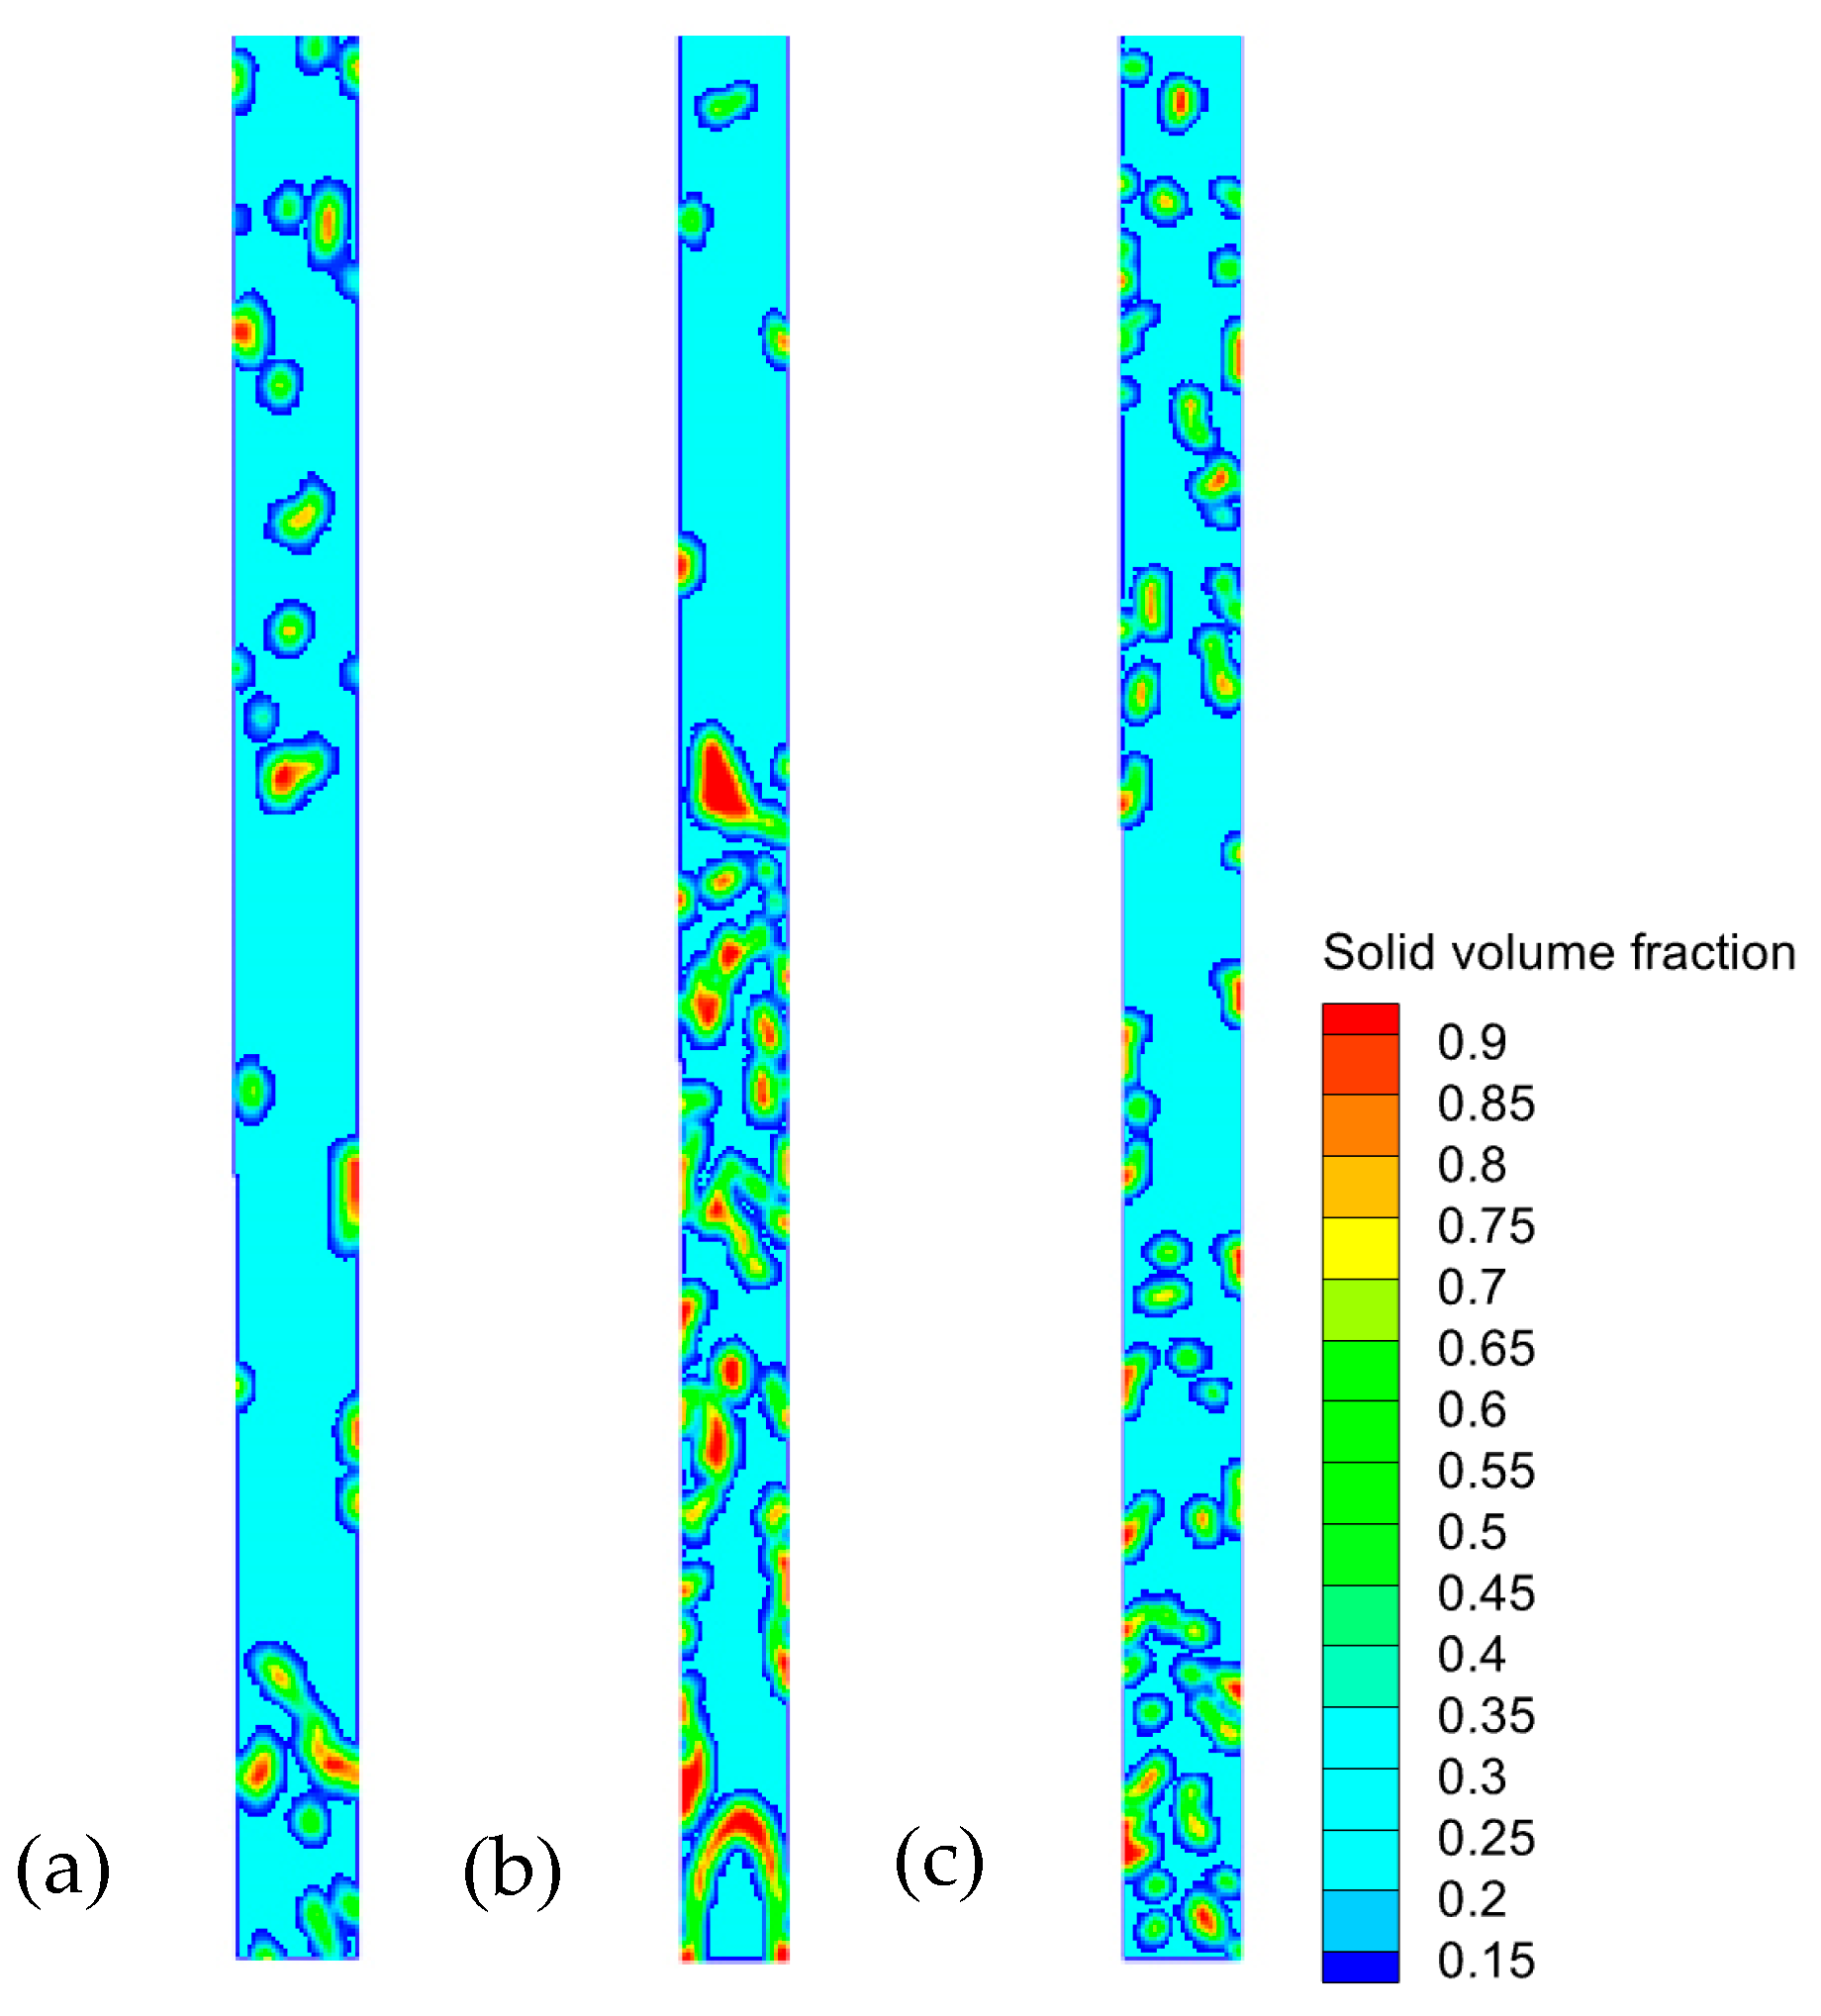
As shown in Figure 6, in the low velocity range of 0.5 m/s, the dynamic behavior of solid particles is absolutely dominated by gravitational settling. At 0.5 m/s, severe particle deposition occurs near the pipe bottom.
Figure 6.
Solid phase volume fraction contour maps in straight pipes at different flow velocities (a) 0.5 m/s, (b) 1.0 m/s, (c) 1.5 m/s.
As the flow velocity rises to the medium range of 1.0 m/s, liquid shear force and turbulence intensity increase significantly, causing a qualitative change in the fluid’s carrying capacity. The sediment layer is gradually eroded by the fluid, and sand grains progressively break free from gravitational confinement to enter a state of homogeneous suspension. At 1.0 m/s, partial particle suspension is observed.
When the flow velocity further increases to the high-velocity range of 1.5 m/s, high-intensity turbulent dispersion completely suppresses the gravitational settling tendency of the particles. Intense vortex motion within the fluid fully entrains and mixes the sand grains, achieving rapid transport in full suspension and forming a nearly ideal uniform distribution across the wellbore cross-section. At 1.5 m/s, particles are nearly uniformly suspended.
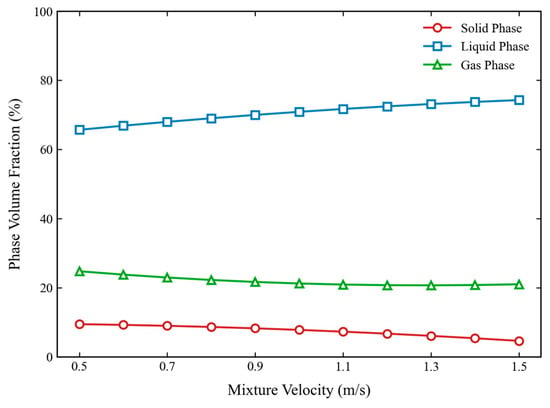
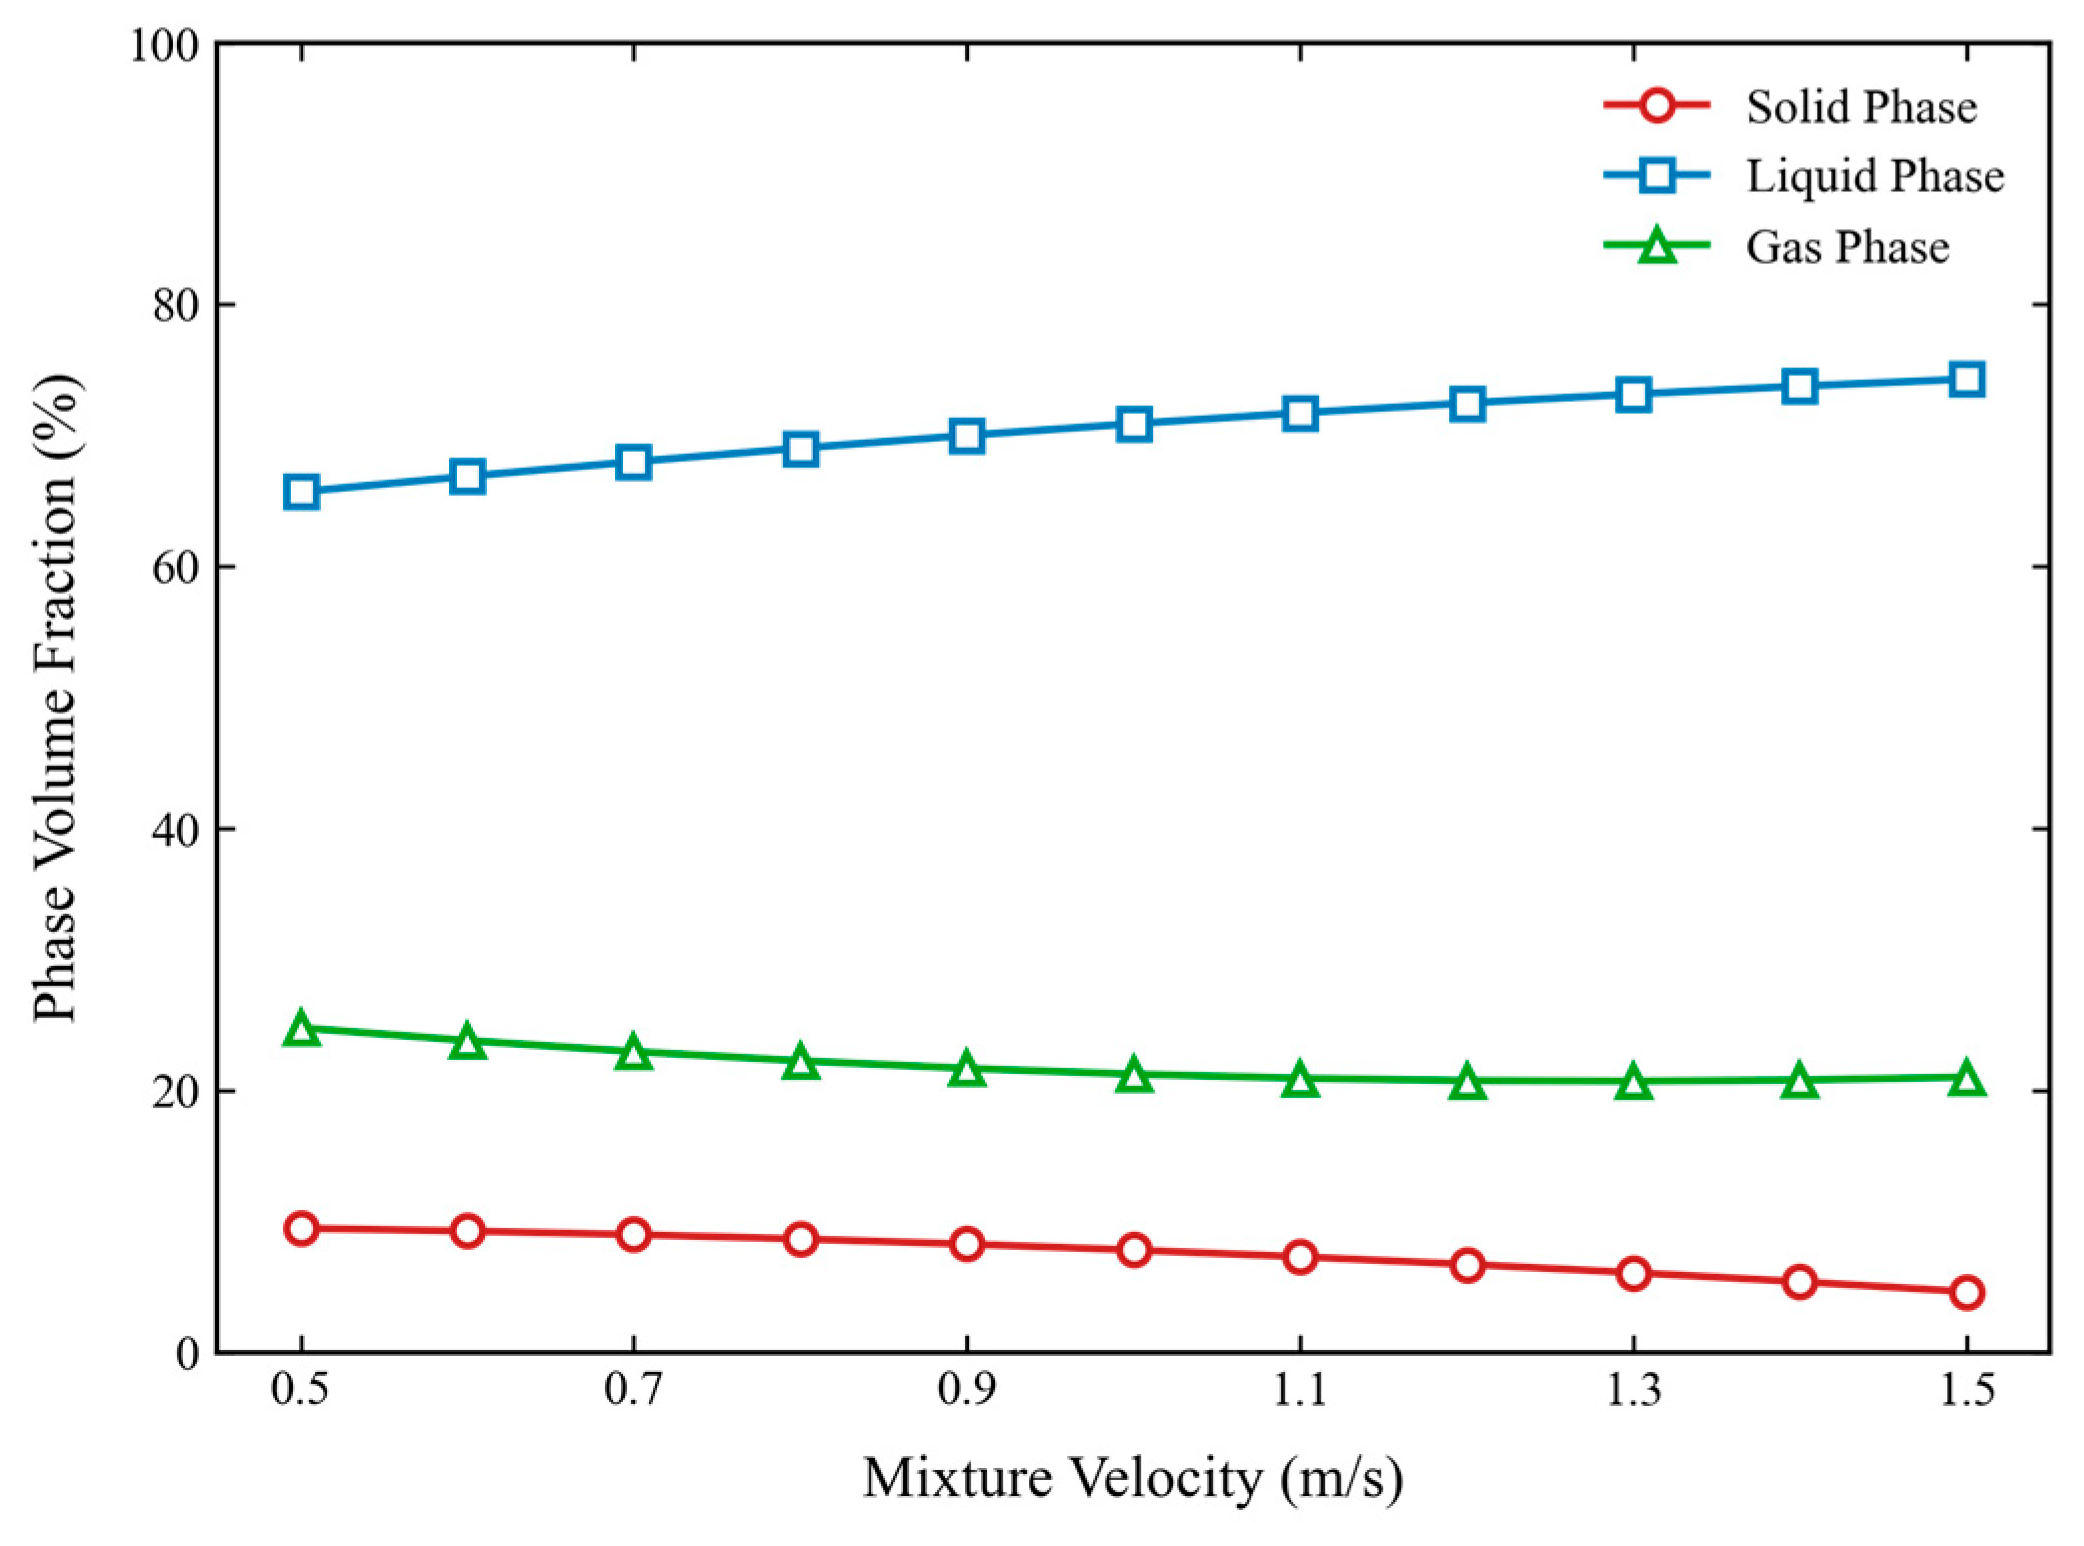
As shown in Figure 7, when the inlet mixture velocity is increased from 0.5 m/s to 1.5 m/s, the gas volume fraction rises from 65.7% to 74.3%, while the sand phase decreases from 9.5% to 4.67% and the water phase decreases from 24.8% to 21.04%. All presented volume fraction contours represent the stable time-averaged distributions extracted after the flow field achieved dynamic equilibrium. Increasing the flow velocity significantly enhances gas lift efficiency and compresses the volume occupied by the solid and liquid phases, which is beneficial for mitigating sand blockage. At low velocities, sand grains are prone to retention at the pipe wall and in the lower sections due to gravitational settling and inertial effects. However, when the flow velocity is excessive, although the sand-carrying capacity is strengthened, the effective flow area is squeezed by the expanded gas channel, resulting in a limited improvement in overall particle transport efficiency. To mitigate the risk of sand blockage, the mixture velocity should be raised to approximately 1.0 m/s or above. To move beyond qualitative visual interpretation of the flow fields, the mixing uniformity of the gas–slurry flow was evaluated using the cross-sectional phase distribution variance (σ2), defined as. . As the mixture velocity scales up from 0.5 m/s to 1.3 m/s, σ2 decreases sharply from 0.045 to 0.012, mathematically demonstrating a 73.3% improvement in phase homogeneity driven by intensified turbulent dispersion forces, which suppresses the low-velocity accumulation regimes. The multiphase transport matrix is systematically characterized by fundamental dimensionless groups to ensure scientific generalizability. The mixture Reynolds number is defined as , the bubble Weber number as , and the particle Stokes number as . At low operational velocities, a high Stokes number (St > 0.1) coupled with a low Reynolds number (Rem < 5 × 10⁴) indicates that solid particles are highly non-inertial relative to the liquid carrier phase, dominating the gravitational settling regimes observed.
Figure 7.
Volume distribution of three-phase flow in straight pipe under different flow velocities.
3.3. Simulation of Curved Pipes at Different Flow Velocities
Addressing the unique geometric curvature of the curved pipe, under conditions where gas and liquid each account for 50%, simulation results reveal that within the 0.5–1.5 m/s velocity range, the gas–liquid two-phase flow field exhibits patterns of centrifugal phase separation and asymmetric distribution that are distinctly different from those observed in straight pipes.
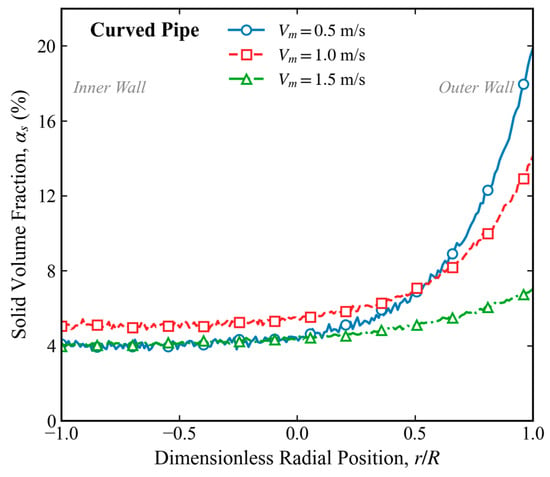
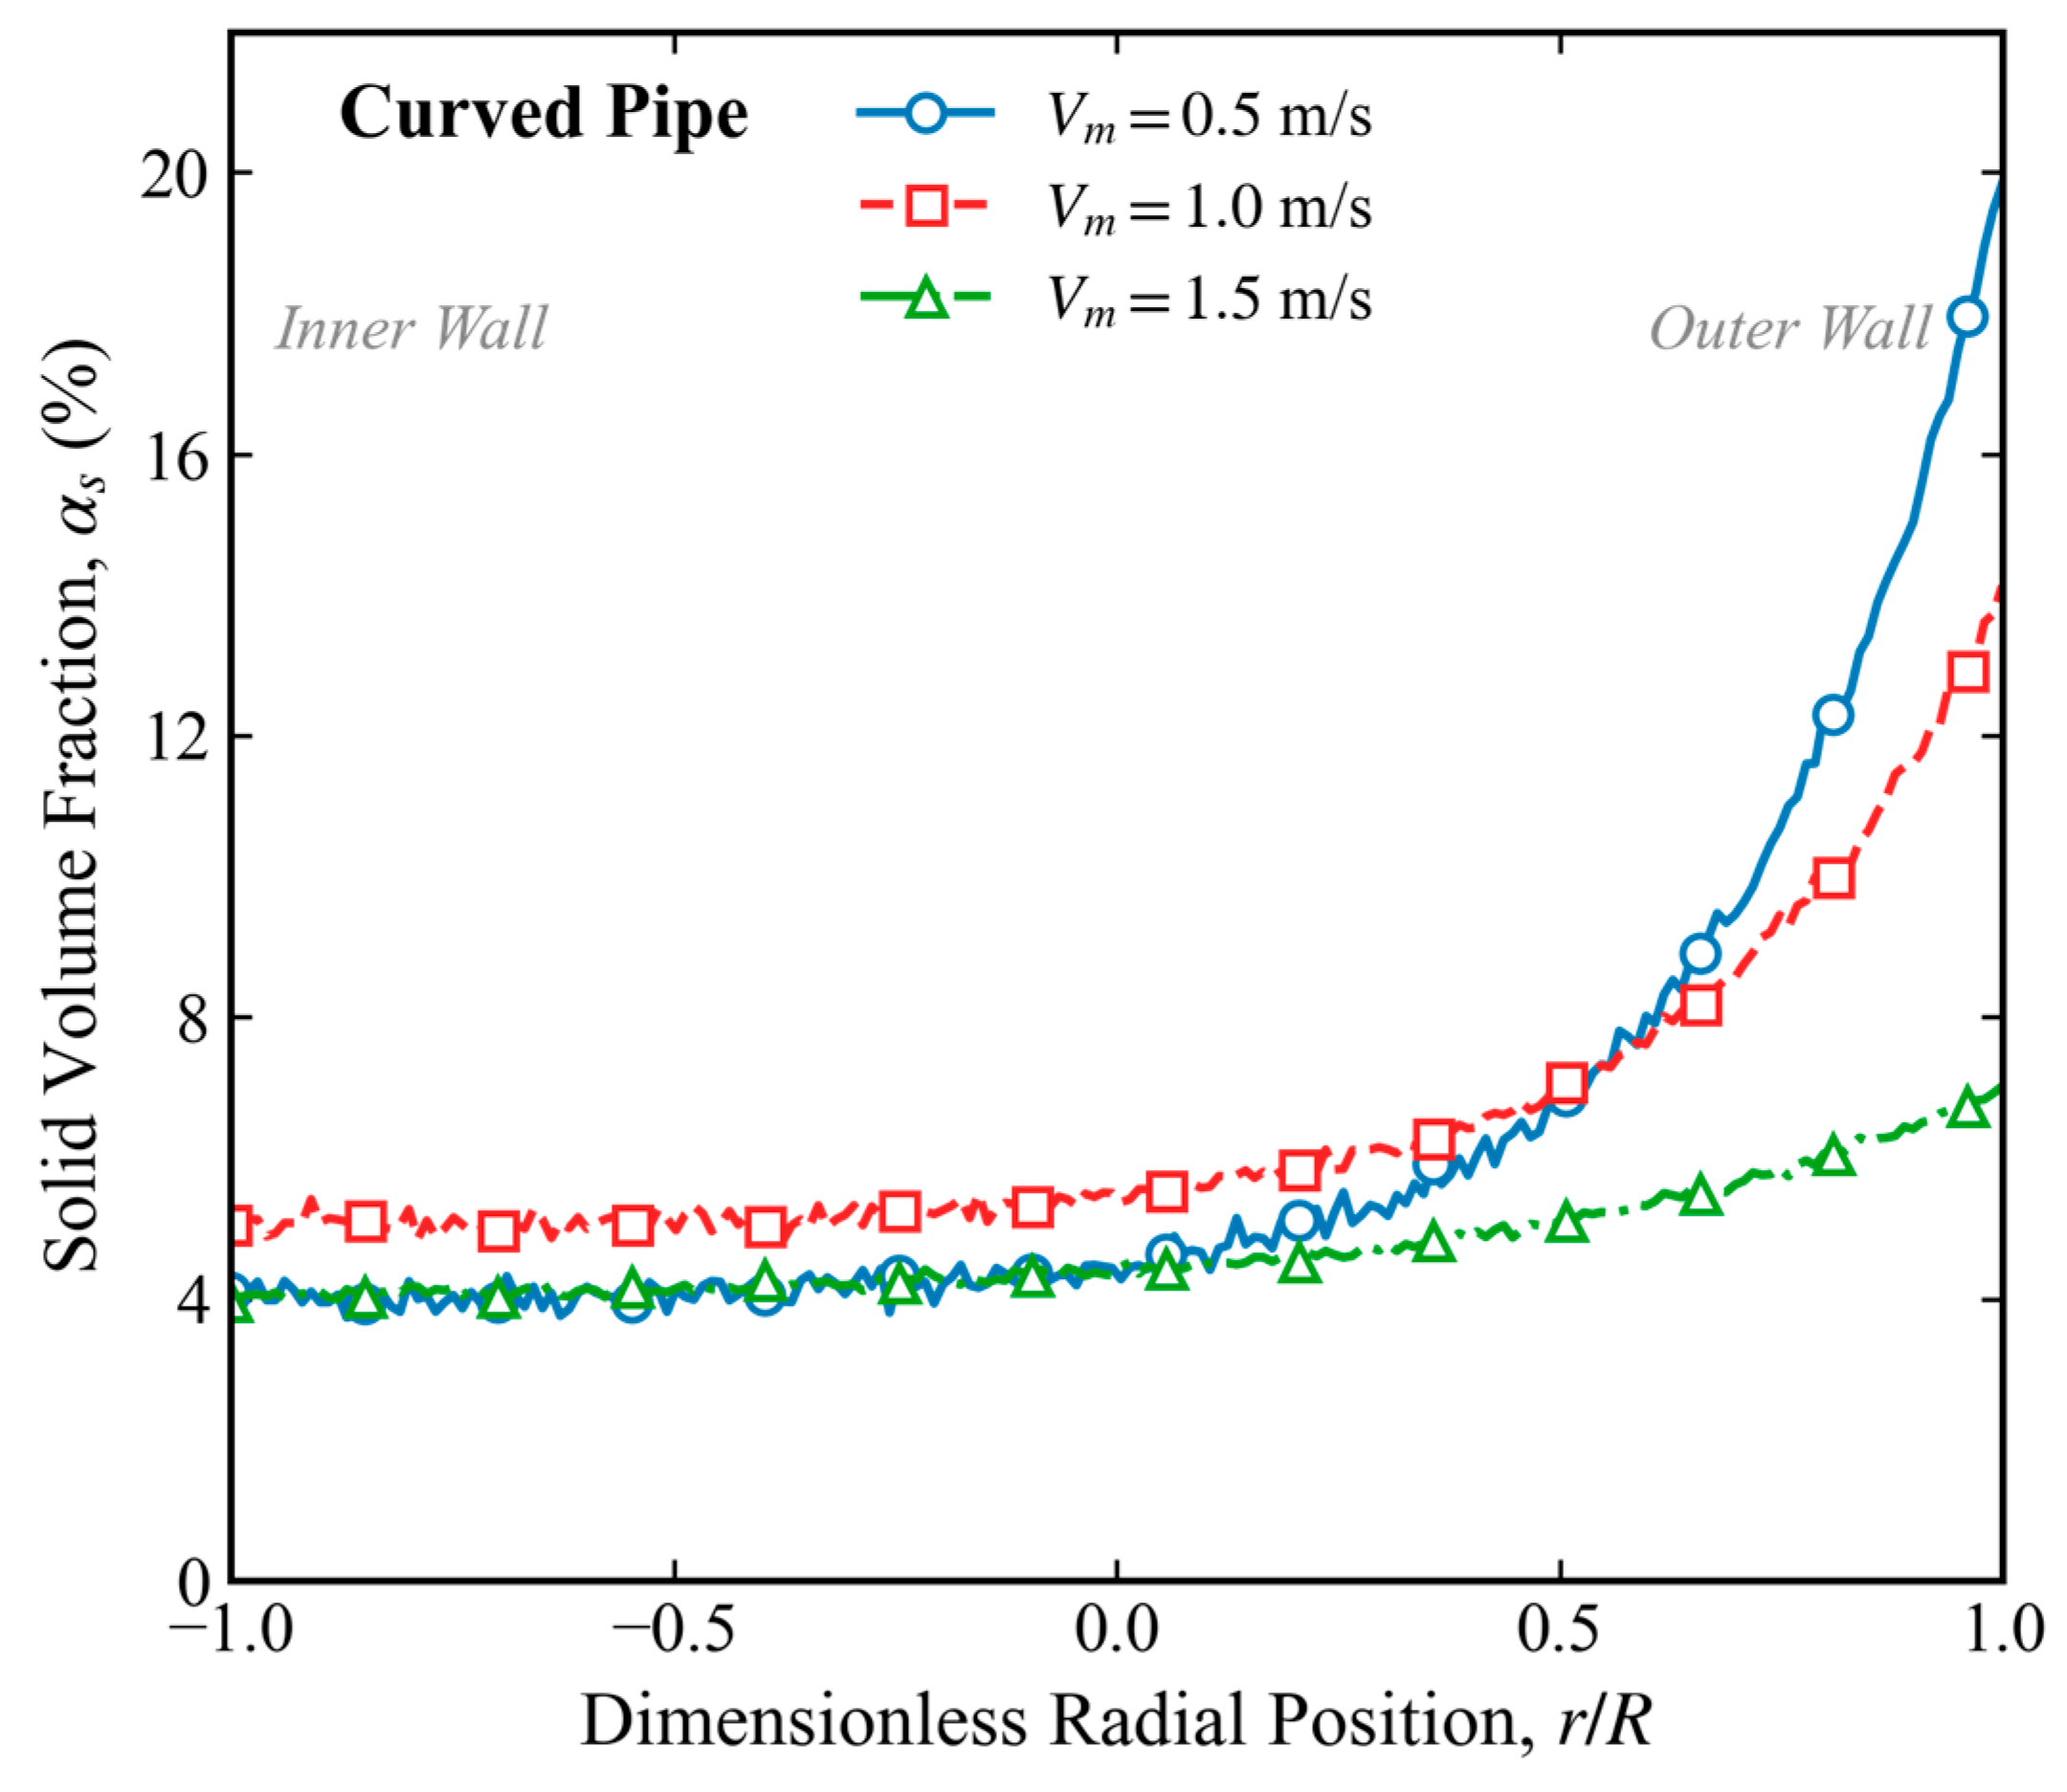
Figure 8 presents the radial distribution of solid volume fraction in the curved pipe at different mixture velocities. At 0.5 m/s, the solid concentration increases continuously from the inner wall to the outer wall, rising from approximately 4.0% to 20.0%. At 1.0 m/s, the outer-wall concentration decreases to about 14.0%, while the inner-wall concentration remains close to 5.0%. When the velocity reaches 1.5 m/s, the concentration range further narrows to approximately 4.0–7.0%. Although the concentration gradient decreases with increasing velocity, the outer-wall concentration remains consistently higher than the inner-wall concentration, indicating the persistent influence of centrifugal particle migration in the curved section. Large bubbles remain stable near the inner wall because of reduced shear.
Figure 8.
Radial concentration distribution of solid phase in a bent tube.
This section further analyzes the migration trajectories and distributional evolution of solid particles under coupled conditions involving gas, liquid, and solid phase concentrations of 50%, 45%, and 5% respectively. The analysis covers a flow velocity range of 0.5 m/s to 1.5 m/s.
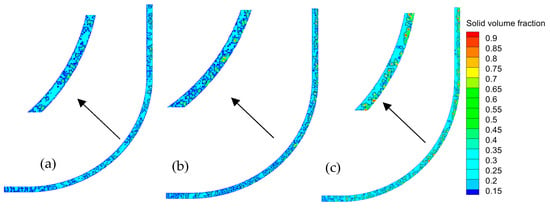
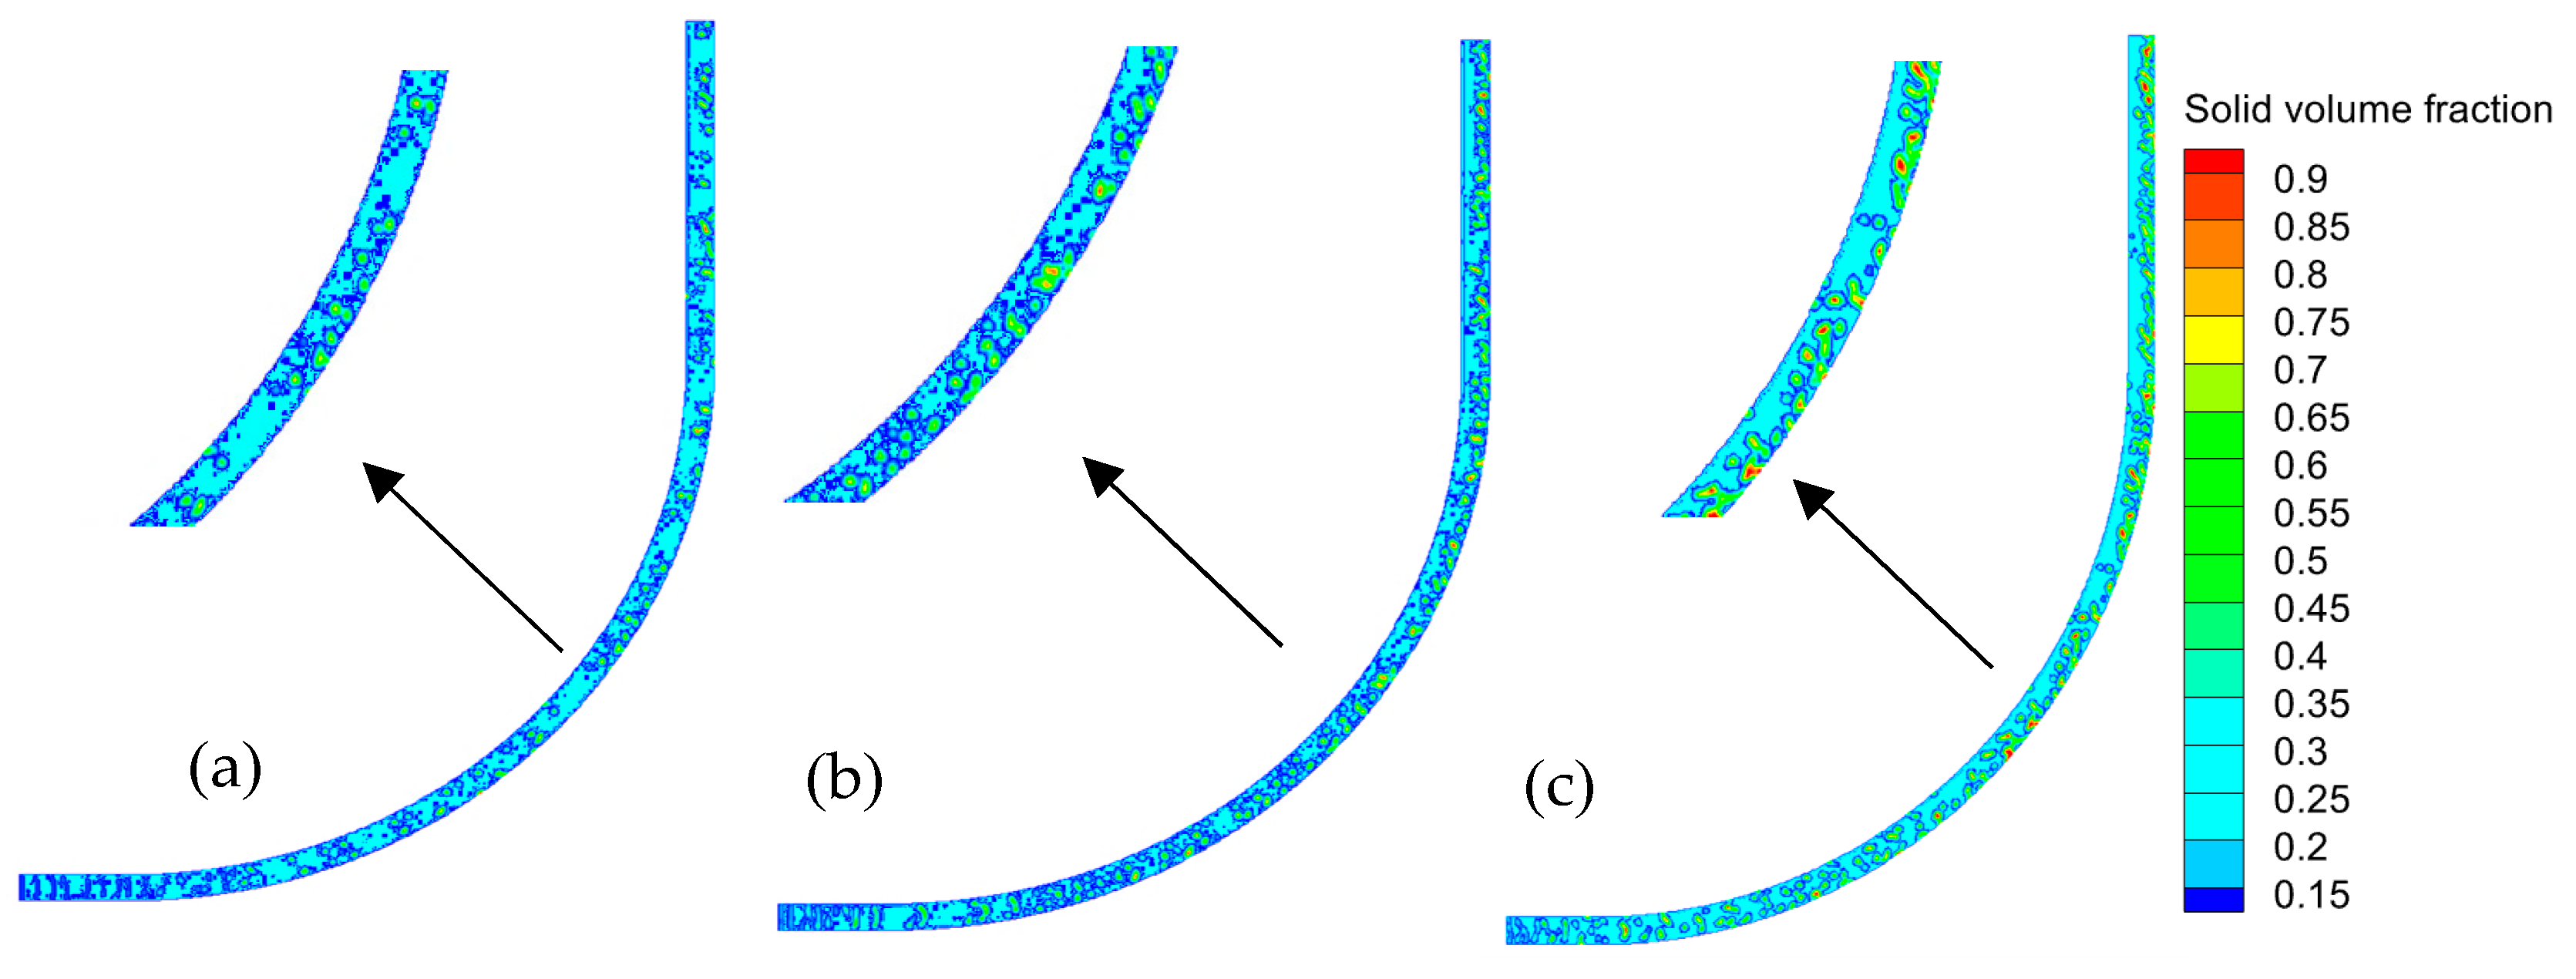
As shown in Figure 9, in the low velocity range of 0.5 m/s, particle transport is primarily dominated by the superposition of gravity and centrifugal force. Due to insufficient liquid-carrying capacity, denser sand grains undergo significant migration toward the extrados of the curved pipe driven by centrifugal inertia and settle on the pipe wall; under the influence of the gravitational component, particles accumulate near the outer wall.
Figure 9.
Solid phase volume fraction contour maps in curved pipes at different flow velocities (a) 0.5 m/s, (b) 1.0 m/s, (c) 1.5 m/s.
As the flow velocity rises to the medium range of 1.0 m/s, liquid shear force and turbulent kinetic energy increase significantly, causing partial erosion of sedimentary particles into a suspended state. However, the complex fluid dynamics characteristic of curved pipes—specifically the strong asymmetric shear gradients induced by macroscopic centrifugal inertial forces—begin to exert a significant influence on particle trajectories.
When the flow velocity further increases to the high-velocity range of 1.5 m/s, high-intensity isotropic turbulence completely suppresses the tendencies for gravitational settling and centrifugal separation. High turbulence promotes nearly homogeneous particle distribution.
As shown in Figure 10, as the inlet mixture velocity increases from 0.5 m/s to 1.5 m/s, the overall sand retention decreases by nearly half, dropping by approximately 55%. Concurrently, the natural gas volume fraction climbs slightly by about 6% as the gas enters the core channel with increasing velocity. The liquid phase fraction also experiences a slight increase of approximately 10%, driven by enhanced shear and spatial competition with the gas and solid phases. In the context of the curved wellbore, the trend as velocity increases from 0.5 m/s to 1.5 m/s remains similar to that of the straight well, with the gas volume fraction expected to rise. However, in the low velocity range, liquid backflow on the lower side causes a significant increase in liquid holdup. This results in more severe displacement of the gas phase, causing the increase in gas content to be approximately 20% to 30% smaller than that observed in the straight well. Furthermore, at the same flow velocity, sand retention in the inclined section is notably more severe, with the overall sand content being approximately 20% to 30% higher than in the straight well. It must be emphasized that the empirical velocity thresholds reported are fundamentally tied to the 100 mm pipe geometry. To ensure scalability, this operational threshold is generalized as a critical dimensionless boundary where the mixture Reynolds number exceeds 1.3 × 10⁵ and the particle Stokes number drops below 0.042. Operating within this dimensionless regime guarantees that turbulent dispersion forces consistently overcome granular gravitational settling regardless of pipe diameter scale.
Figure 10.
Volume distribution of three-phase flow in curved pipe under different flow velocities.
3.4. Simulation of Multi-Inlet Pipes with Different Flow Rates
Focusing on the unique confluence structure of the multi-inlet wellbore, this section analyzes the mechanism regulating the dynamic equilibrium between bubble breakup and coalescence under conditions where gas and liquid each occupy 50%, with inlet flow velocities ranging from 0.5 m/s to 1.5 m/s. Simulation results indicate that the multi-inlet structure induces a significant shear rate gradient within the wellbore, leading to a bubble size distribution that exhibits high spatial heterogeneity. All geometries were established as full-scale models based on actual industrial engineering dimensions. The main wellbore has a diameter of 100 mm, while the lateral upper and lower inlets have a diameter of 200 mm.
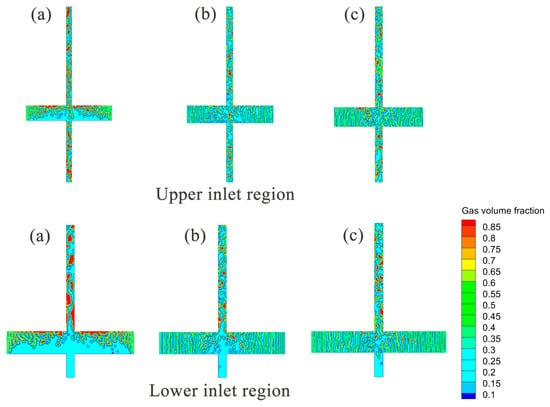
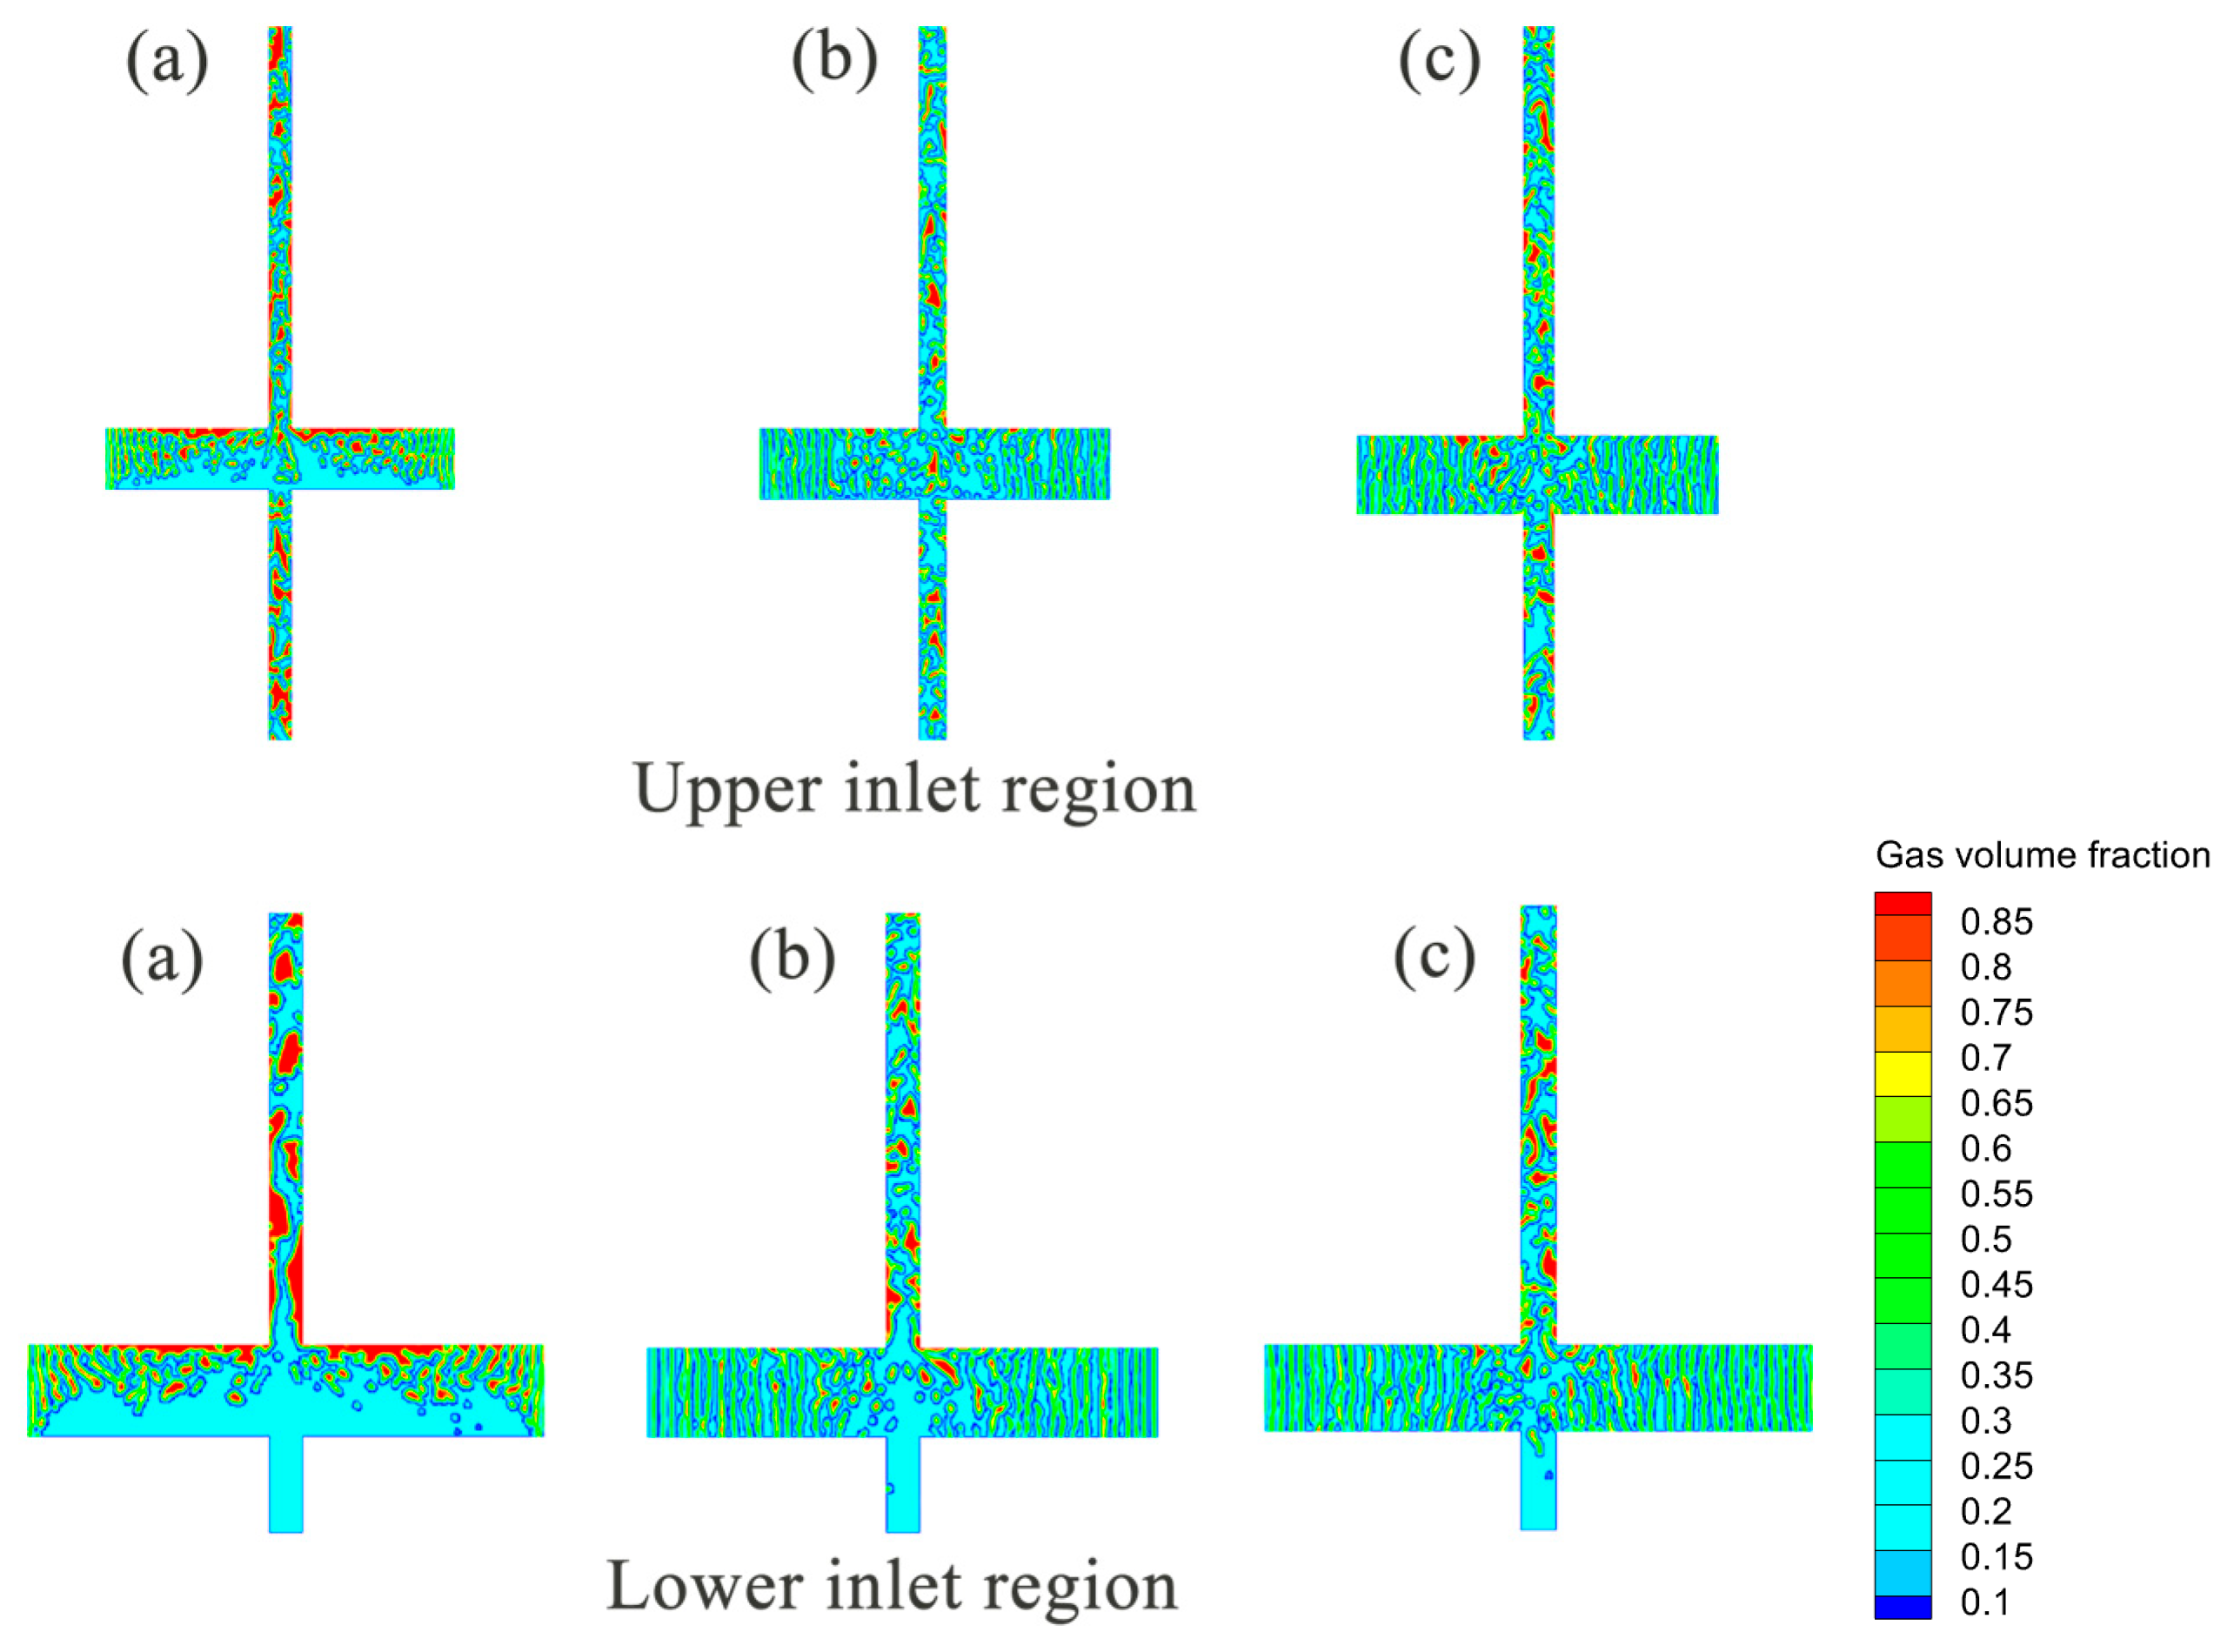
As shown in Figure 11, first, the inlet flow velocity significantly regulates the competitive mechanism between breakup and coalescence. In the lower region of the wellbore, the flow field exists primarily in a low-shear strain rate environment, and turbulent dissipation is weak. At this time, surface tension dominates, and the coalescence mechanism governs flow regime evolution; bubbles tend to merge with each other, forming large-scale bubble clusters or gas slugs. As the fluid moves upward into the upper confluence zone, the superposition of flow velocities and the intrusion of lateral fluids introduce high-intensity shear effects, causing the breakup mechanism to surpass coalescence and become dominant. Under the tearing action of strong turbulent shear forces, large bubbles rapidly destabilize and disintegrate, generating a large number of fine micro-bubbles. Overall, as the inlet velocity increases from 0.5 m/s to 1.5 m/s, the global turbulence intensity strengthens, and the breakup rate significantly accelerates, resulting in a gradual decrease in the average Sauter mean diameter of the bubbles.
Figure 11.
Gas phase volume fraction contour maps for multi-inlet pipes at different flow velocities (a) 0.5 m/s, (b) 1.0 m/s, (c) 1.5 m/s.
Second, the wellbore structure induces unique zonal distribution and dual-scale characteristics. Although high flow velocities tend to shatter bubbles, simulations reveal that the multi-inlet structure creates specific low-shear channels or fluid dead zones within the wellbore. In these low-shear protected zones, bubbles are protected by a geometric shielding effect from direct destruction by mainstream high shear, allowing them to maintain coalescence potential and rise slowly while retaining larger sizes. Dual-scale bubble structures are observed in the confluence region.
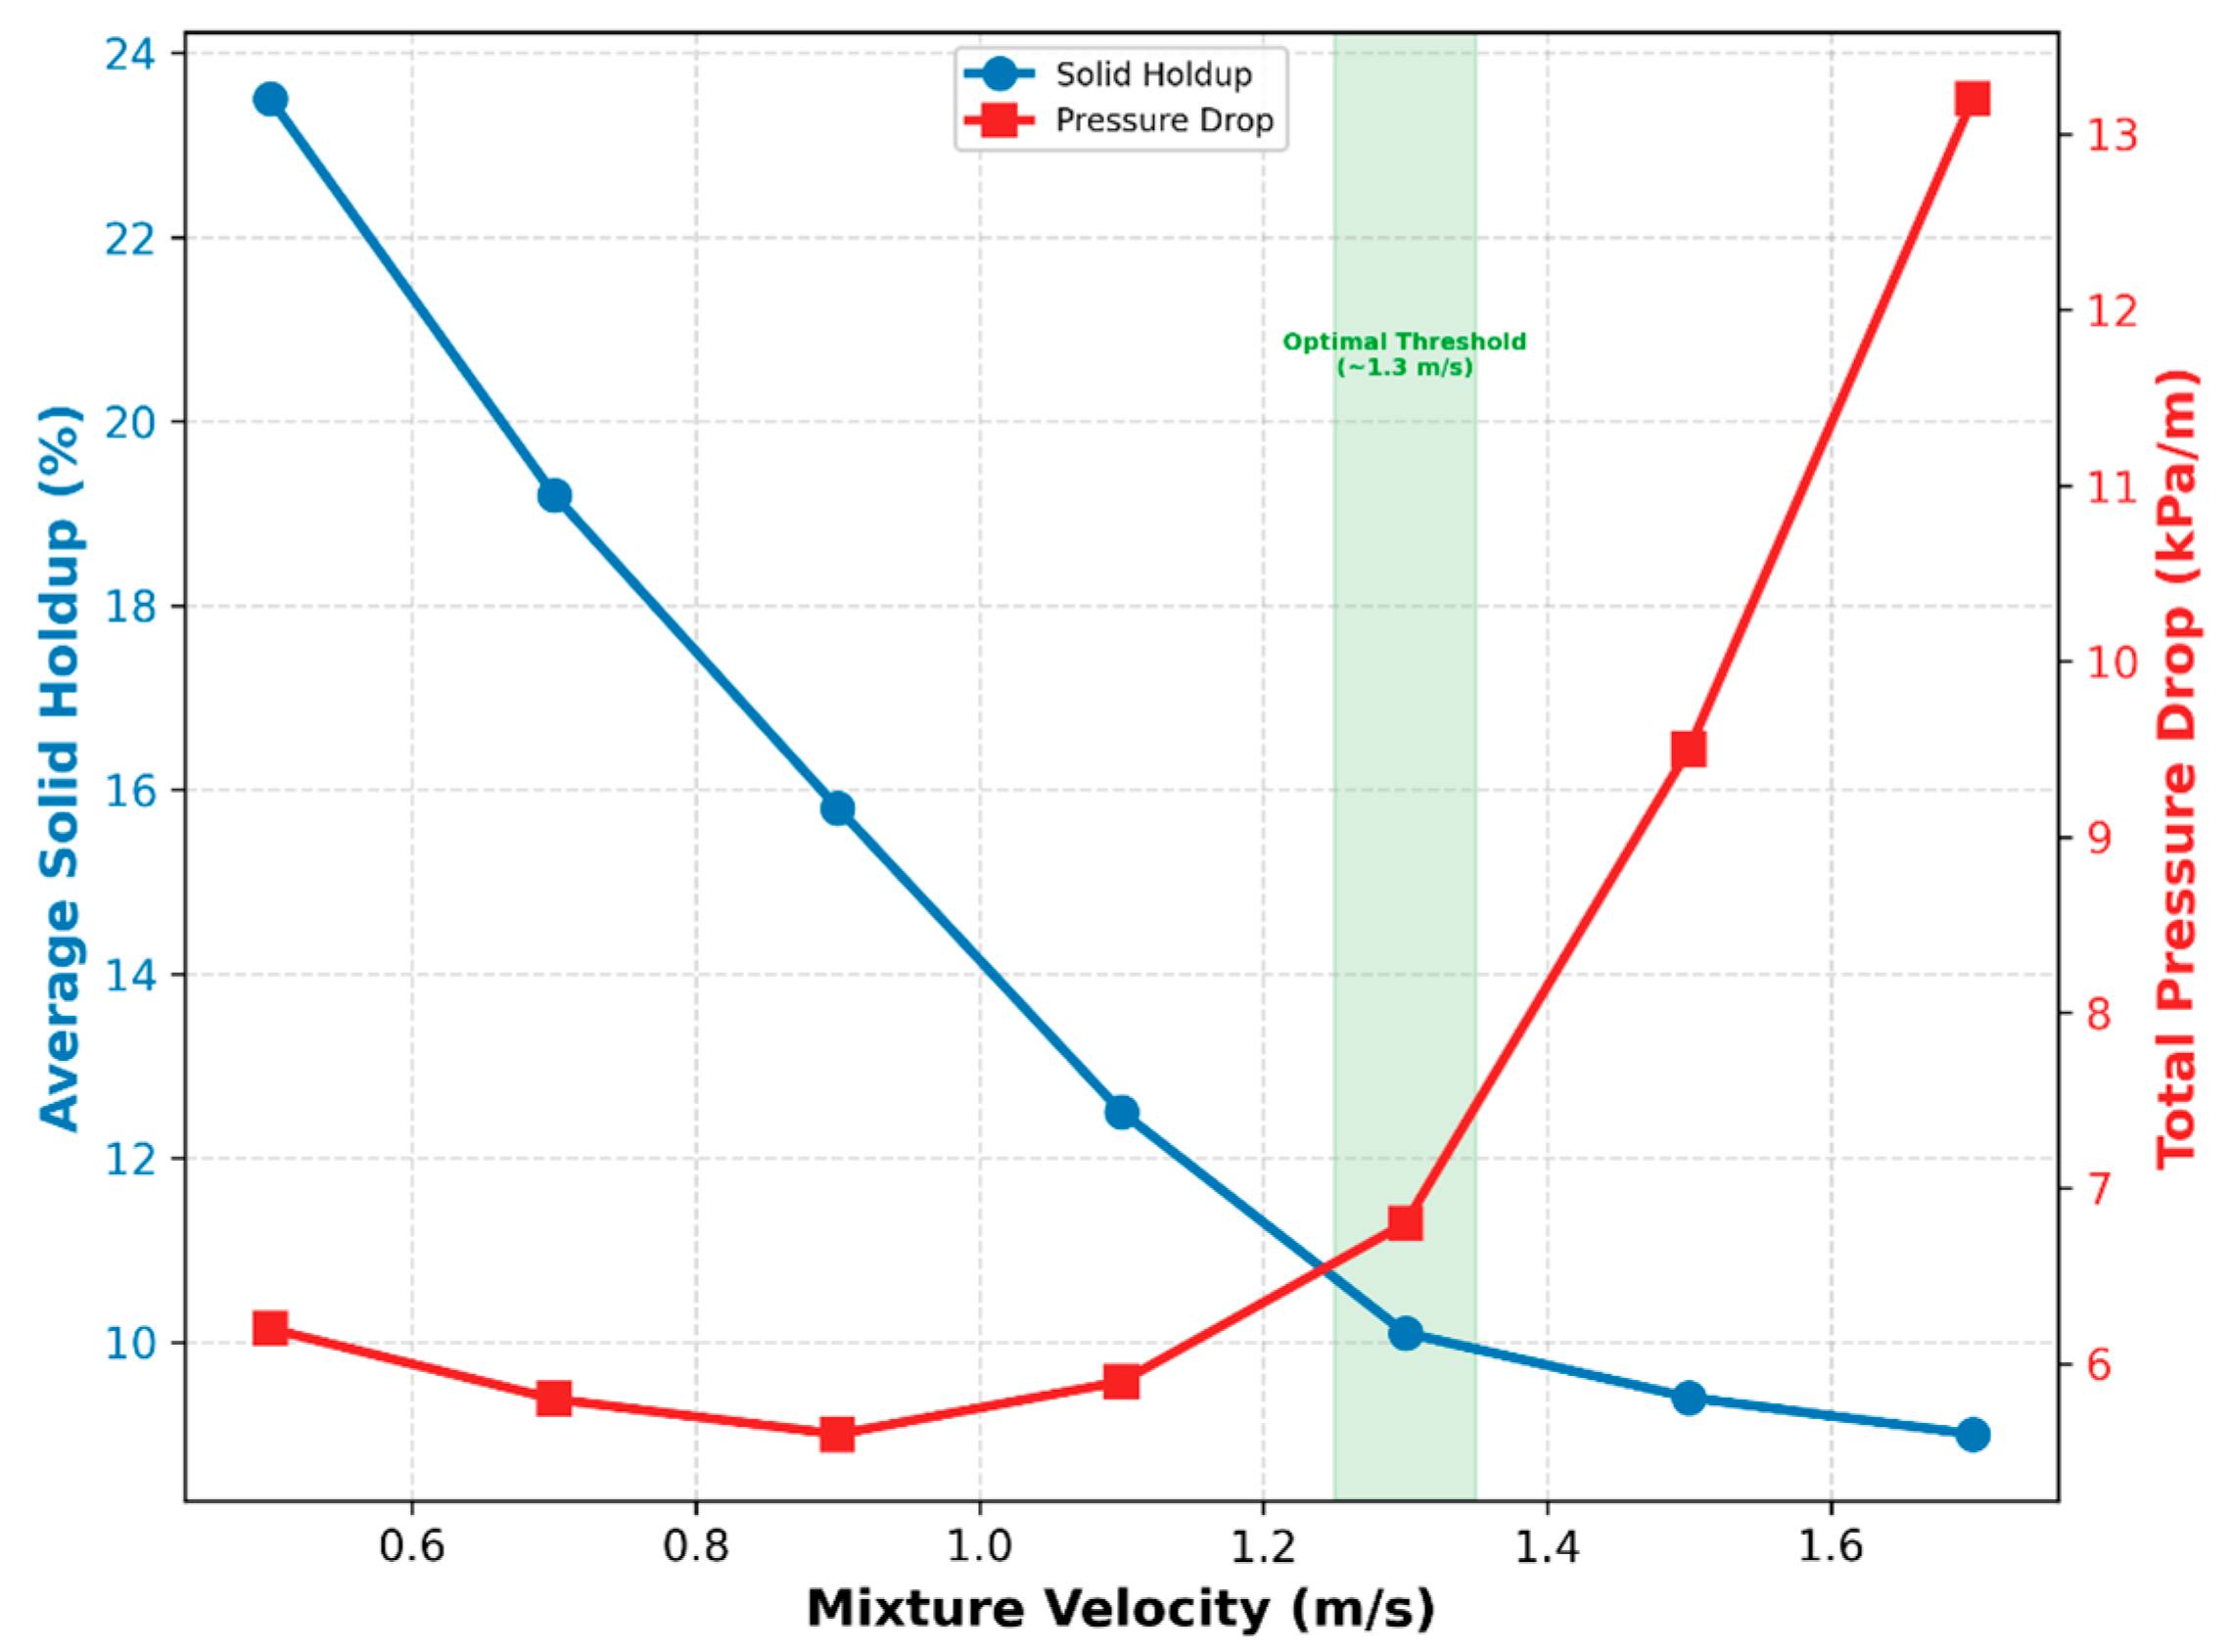
The system’s transport performance is compactly synthesized through the transport efficiency index (). Quantitative extraction shows that for an inlet liquid holdup of 45%, η increases from a deficient 0.22 at 0.5 m/s to a highly efficient 0.91 at 1.3 m/s. Conversely, further scaling the velocity to 1.5 m/s yields a negligible increase in η but triggers an exponential 64.2% escalation in frictional pressure drop, mathematically identifying 1.3 m/s as the optimum energetic operational threshold.
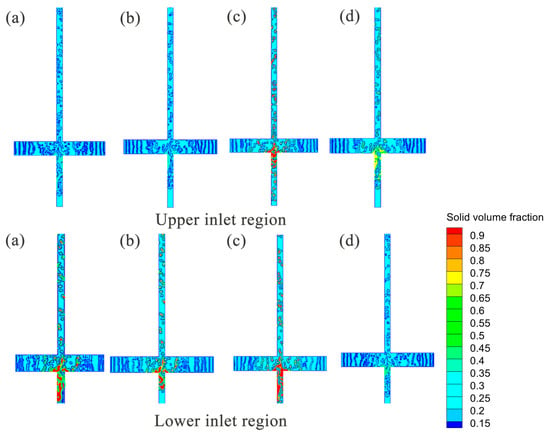
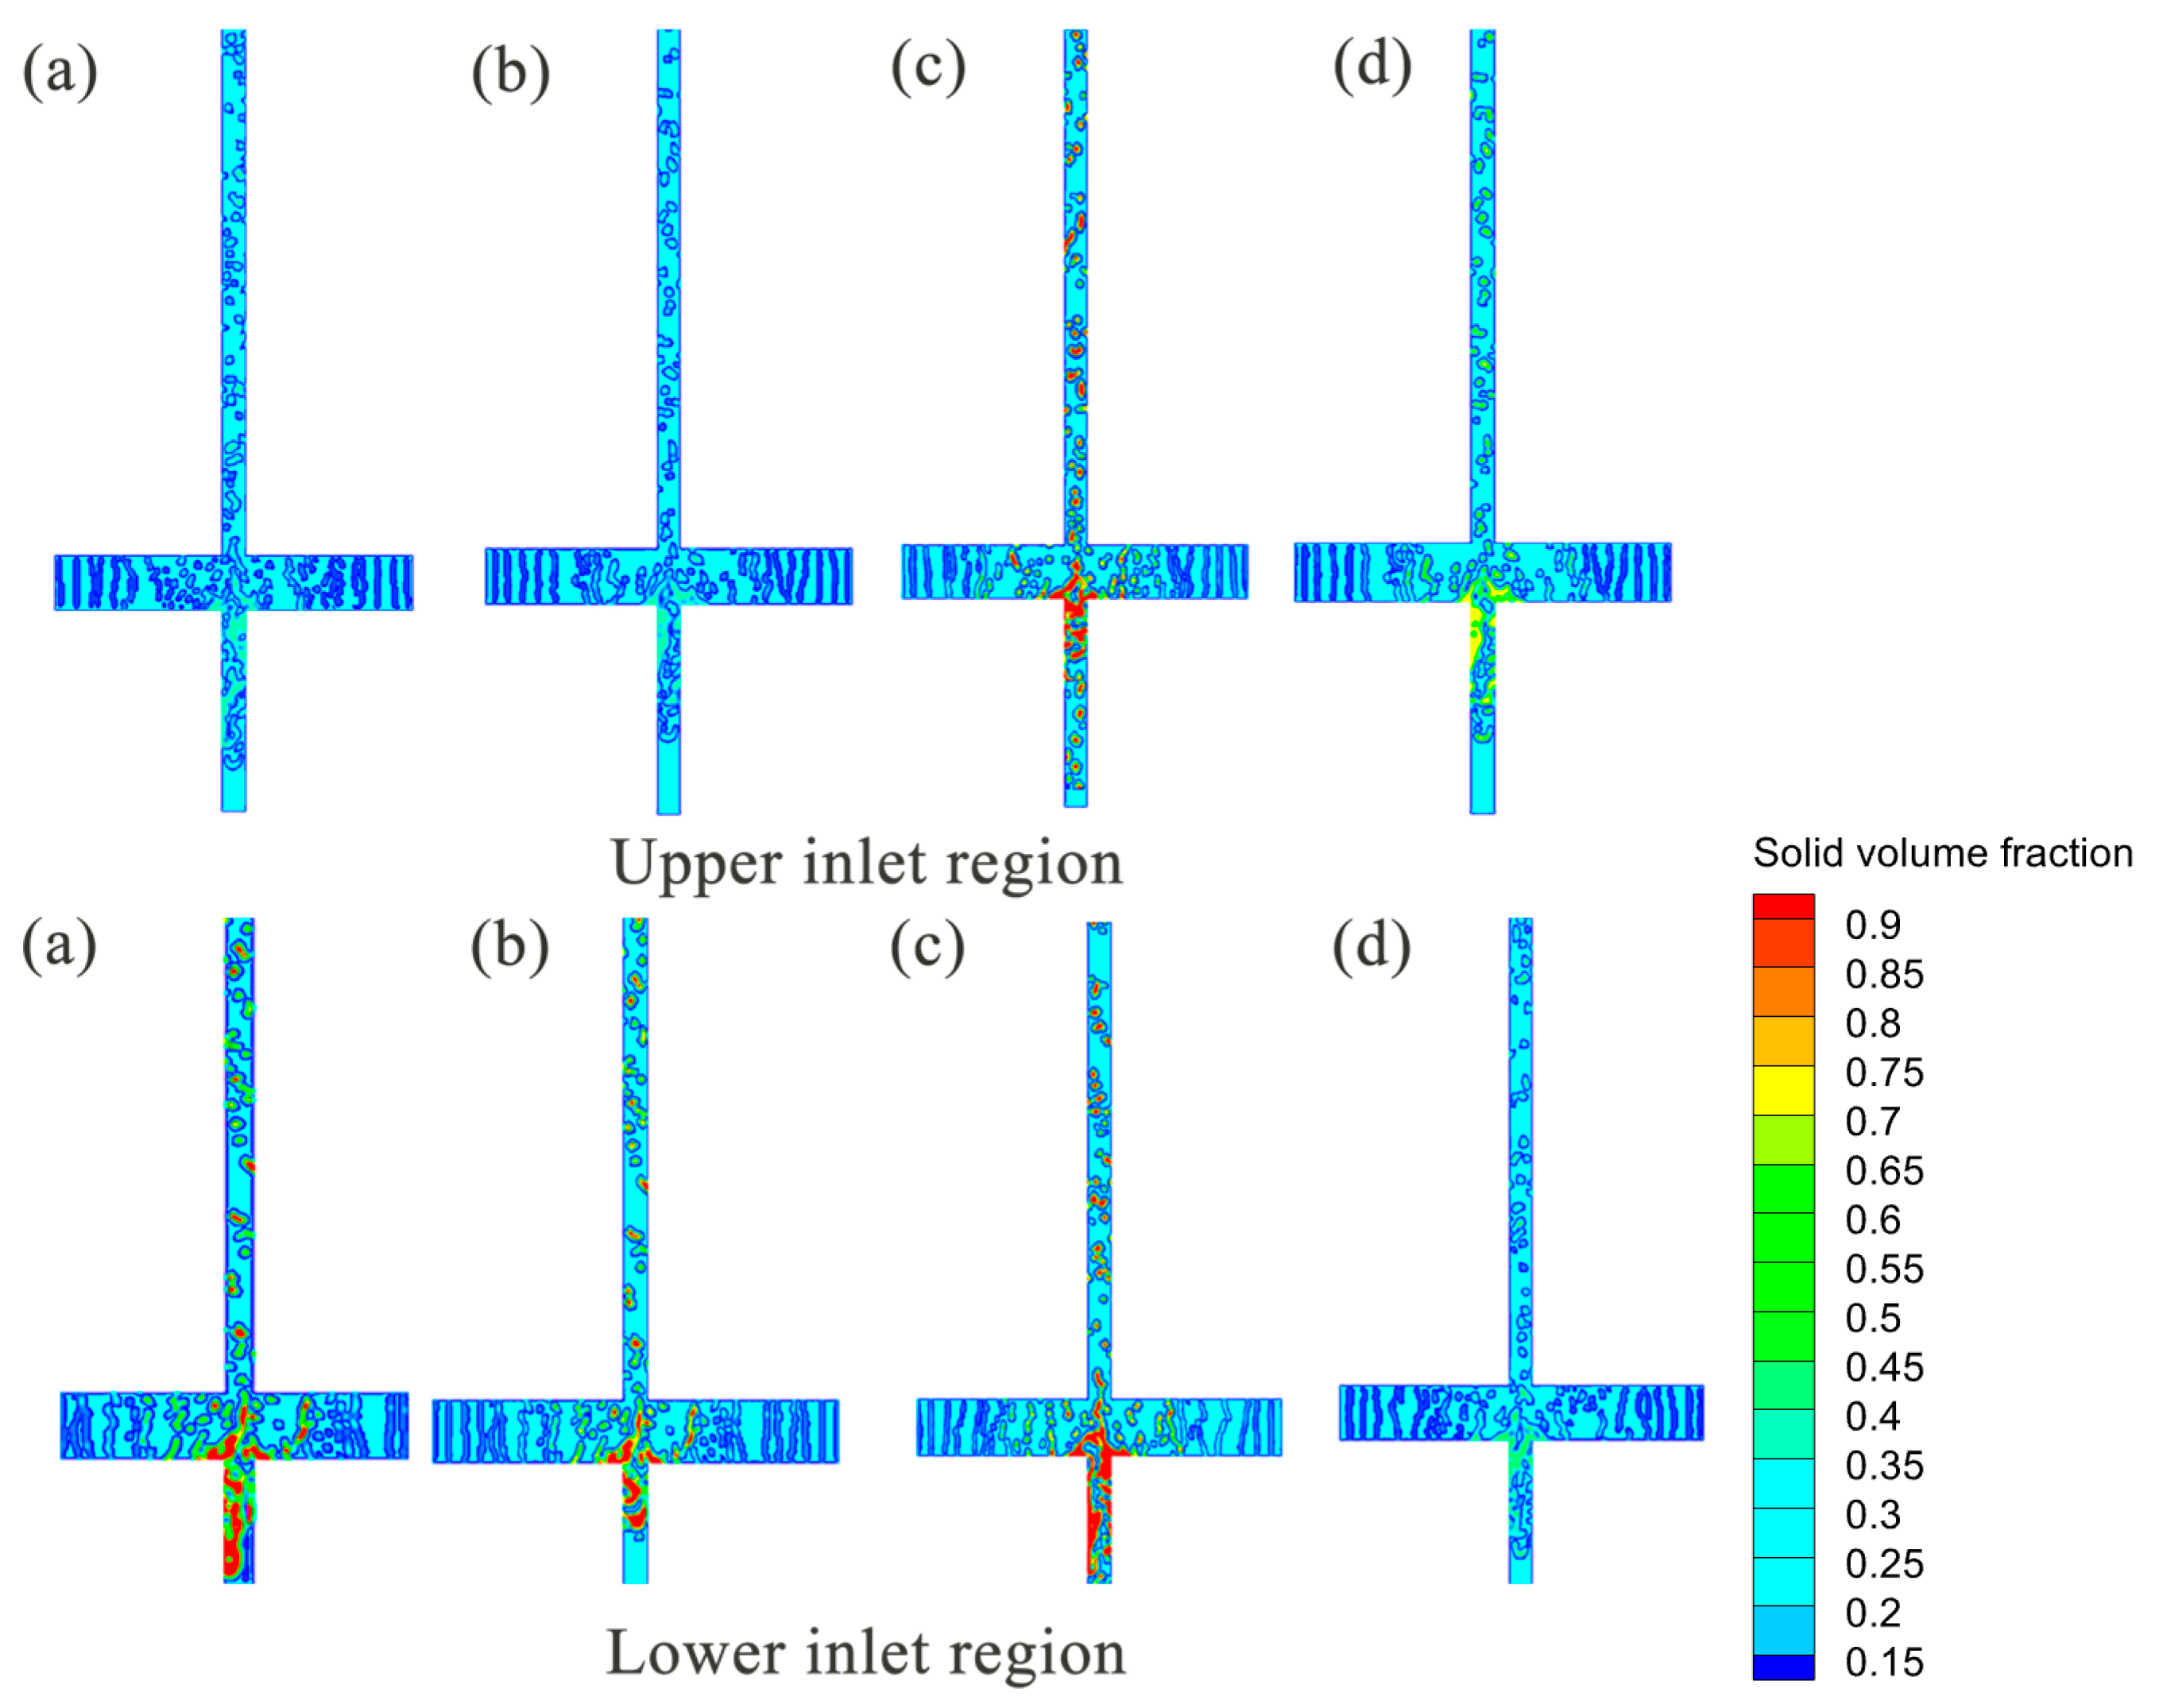
Based on coupled three-phase conditions consisting of gas (50%), liquid (45%), and solid (5%), this section investigates the regulatory mechanisms of multi-inlet velocity gradients (0.5–1.5 m/s) on solid particle deposition, suspension, and redistribution behavior.
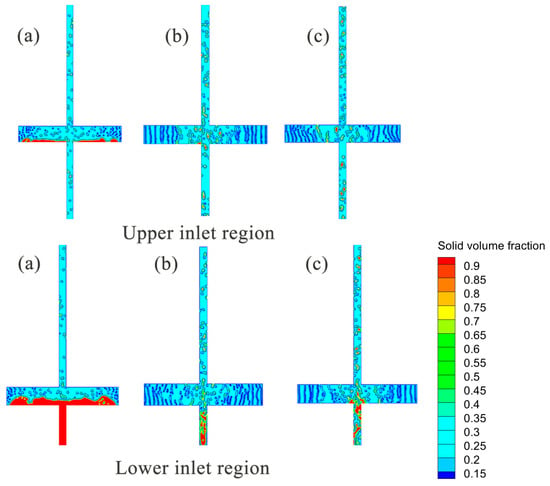
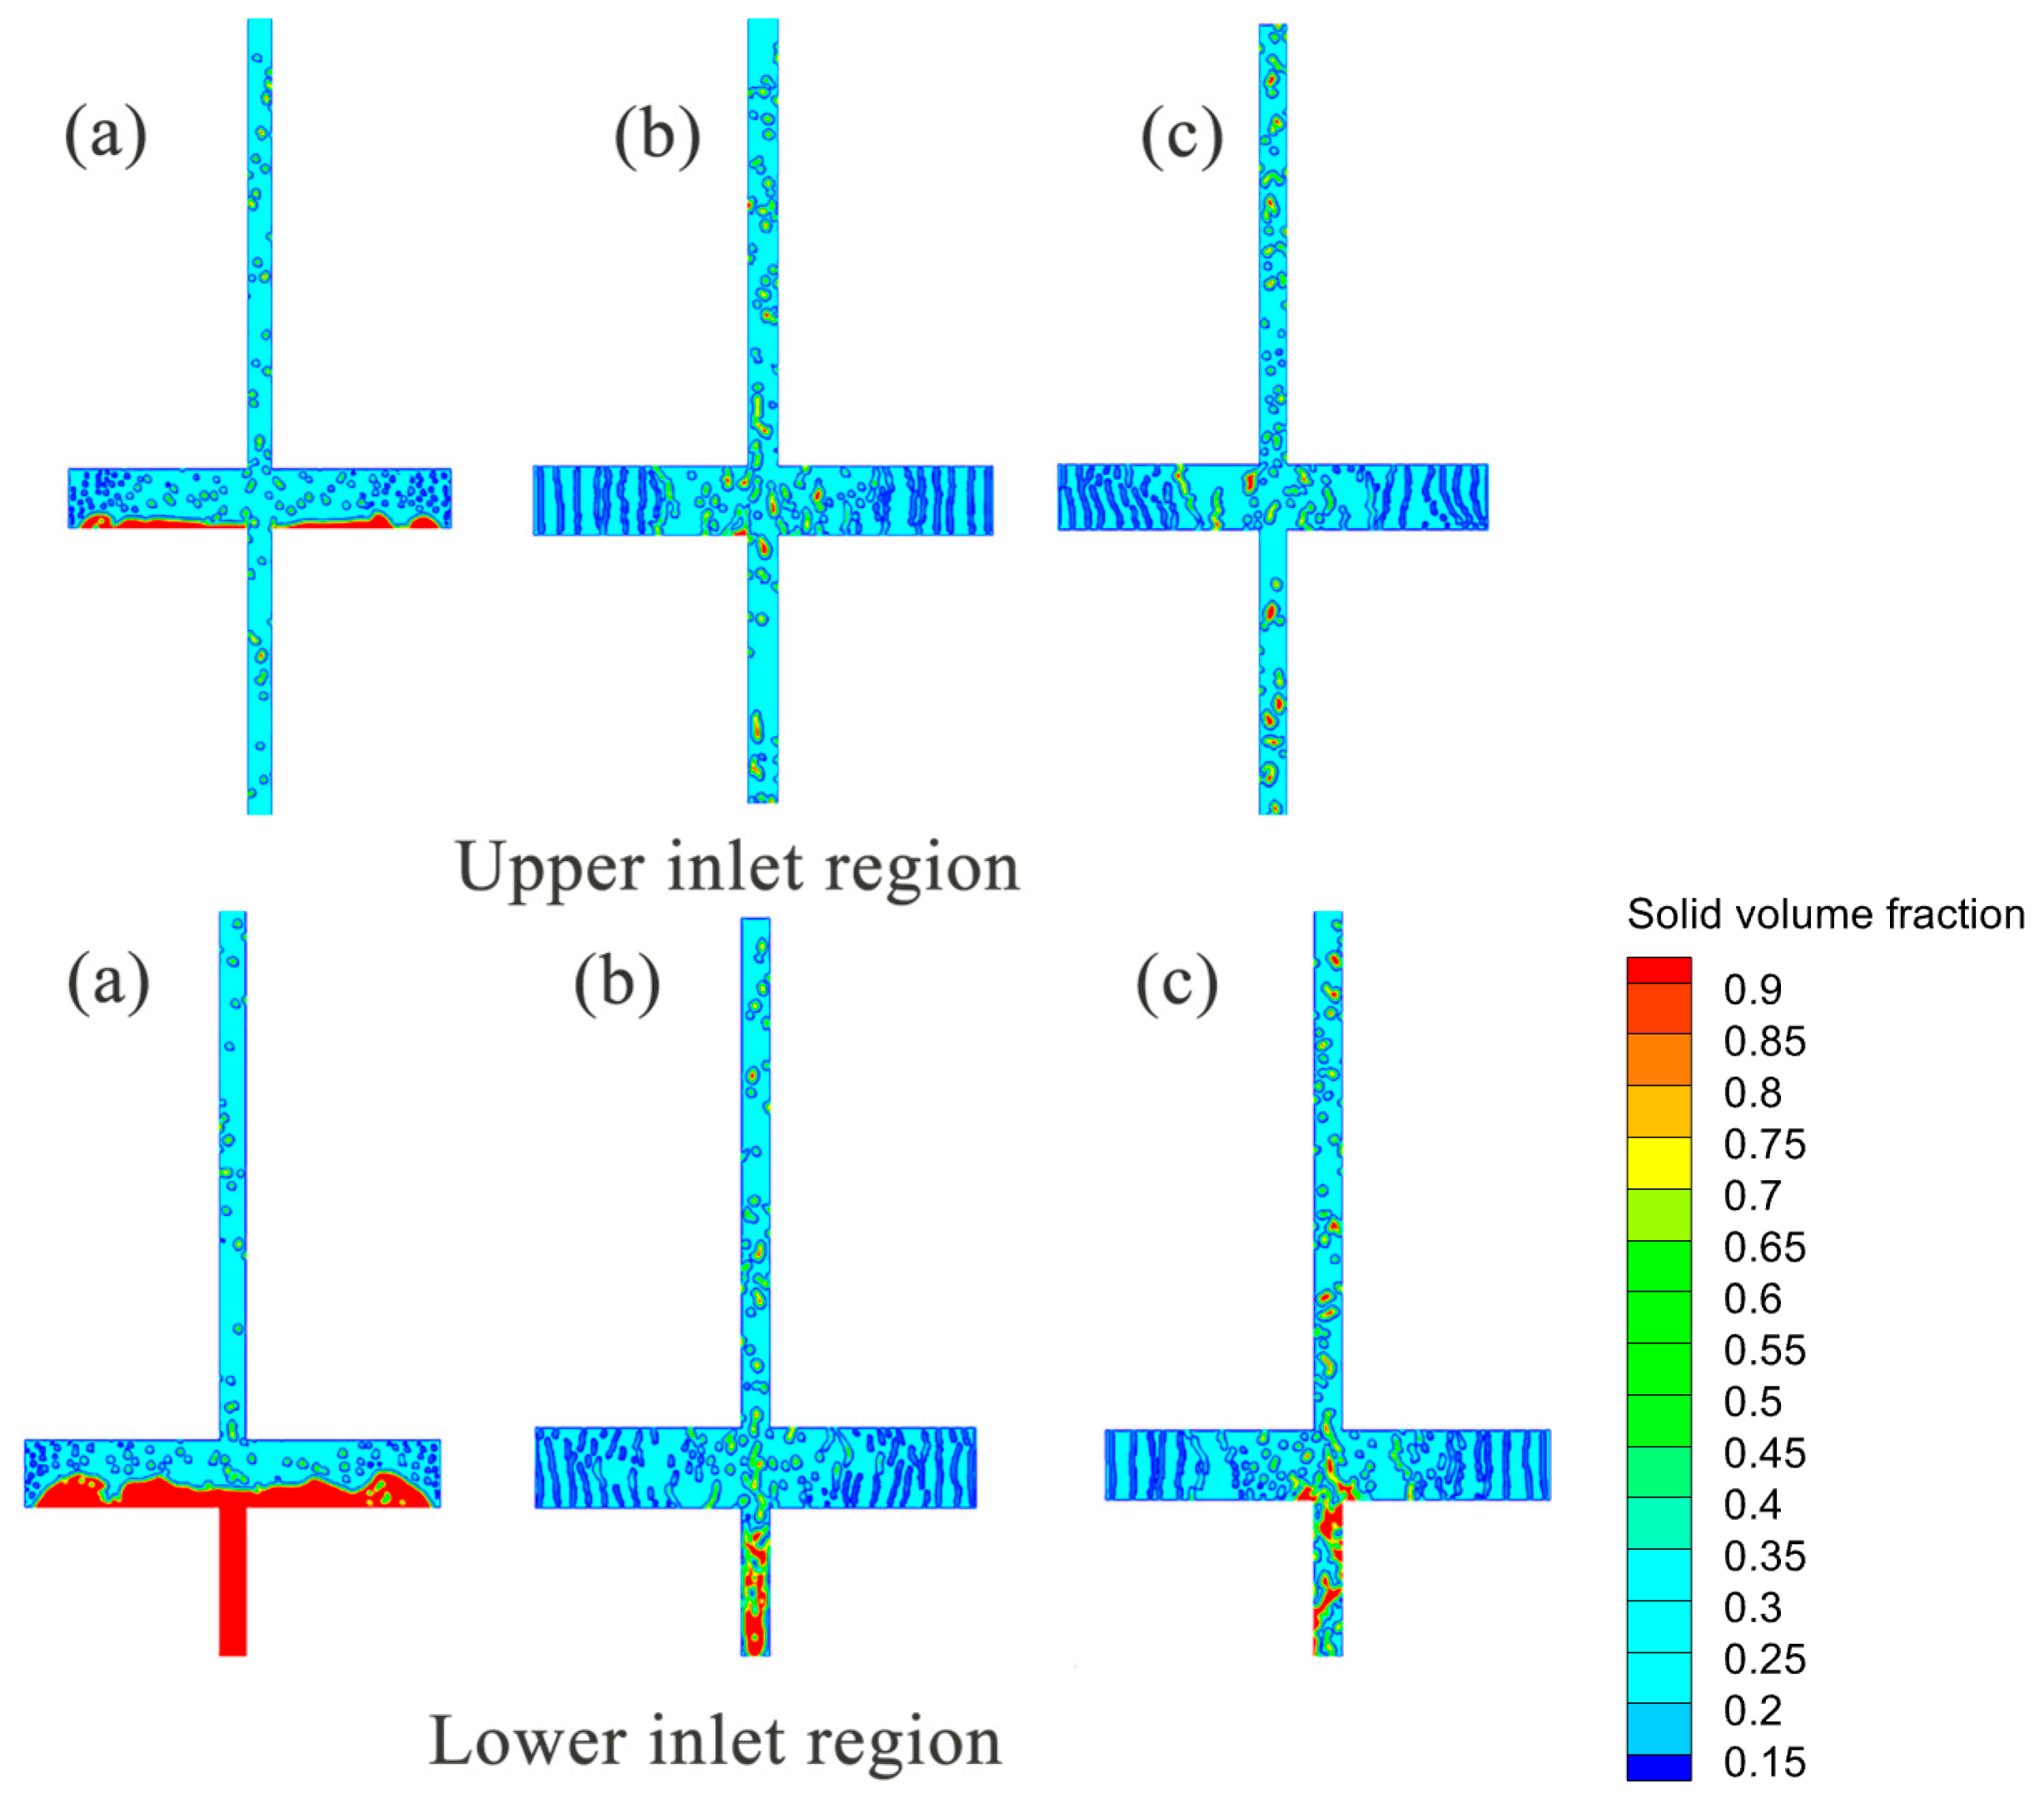
As shown in Figure 12, in the low velocity range of 0.5 m/s, particle dynamic behavior is dominated by gravitational settling. Because fluid momentum in the lower inlet region is insufficient, the wall shear stress provided by the liquid phase is lower than the critical threshold for particle incipient motion. This causes sand grains to preferentially deposit in the lower inlet area, forming a high-concentration local static sand bed.
Figure 12.
Solid phase volume fraction contour maps for multi-inlet pipes at different flow velocities (a) 0.5 m/s, (b) 1.0 m/s, (c) 1.5 m/s.
As the flow velocity rises to the medium range of 1.0 m/s, the flow field enters a transition state where deposition and suspension coexist. The enhancement of liquid kinetic energy significantly increases fluid drag force, prompting some deposited particles to undergo re-entrainment and detach from the bed.
When the flow velocity further increases to the high-velocity range of 1.5 m/s, strong turbulent dispersion mechanisms completely suppress the tendencies for gravitational settling and centrifugal separation of particles. High-intensity shear turbulence drives violent mixing of sand grains throughout the entire domain, allowing them to overcome local structural constraints and achieve overall homogeneous suspension.
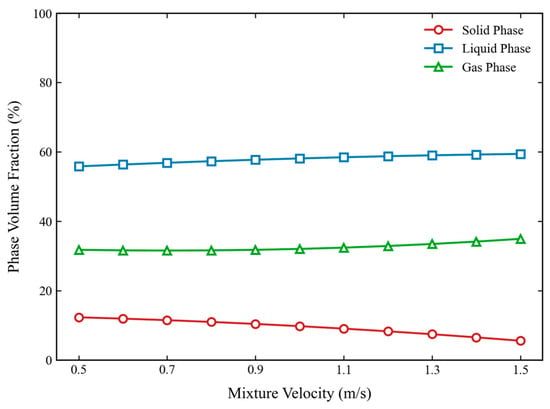
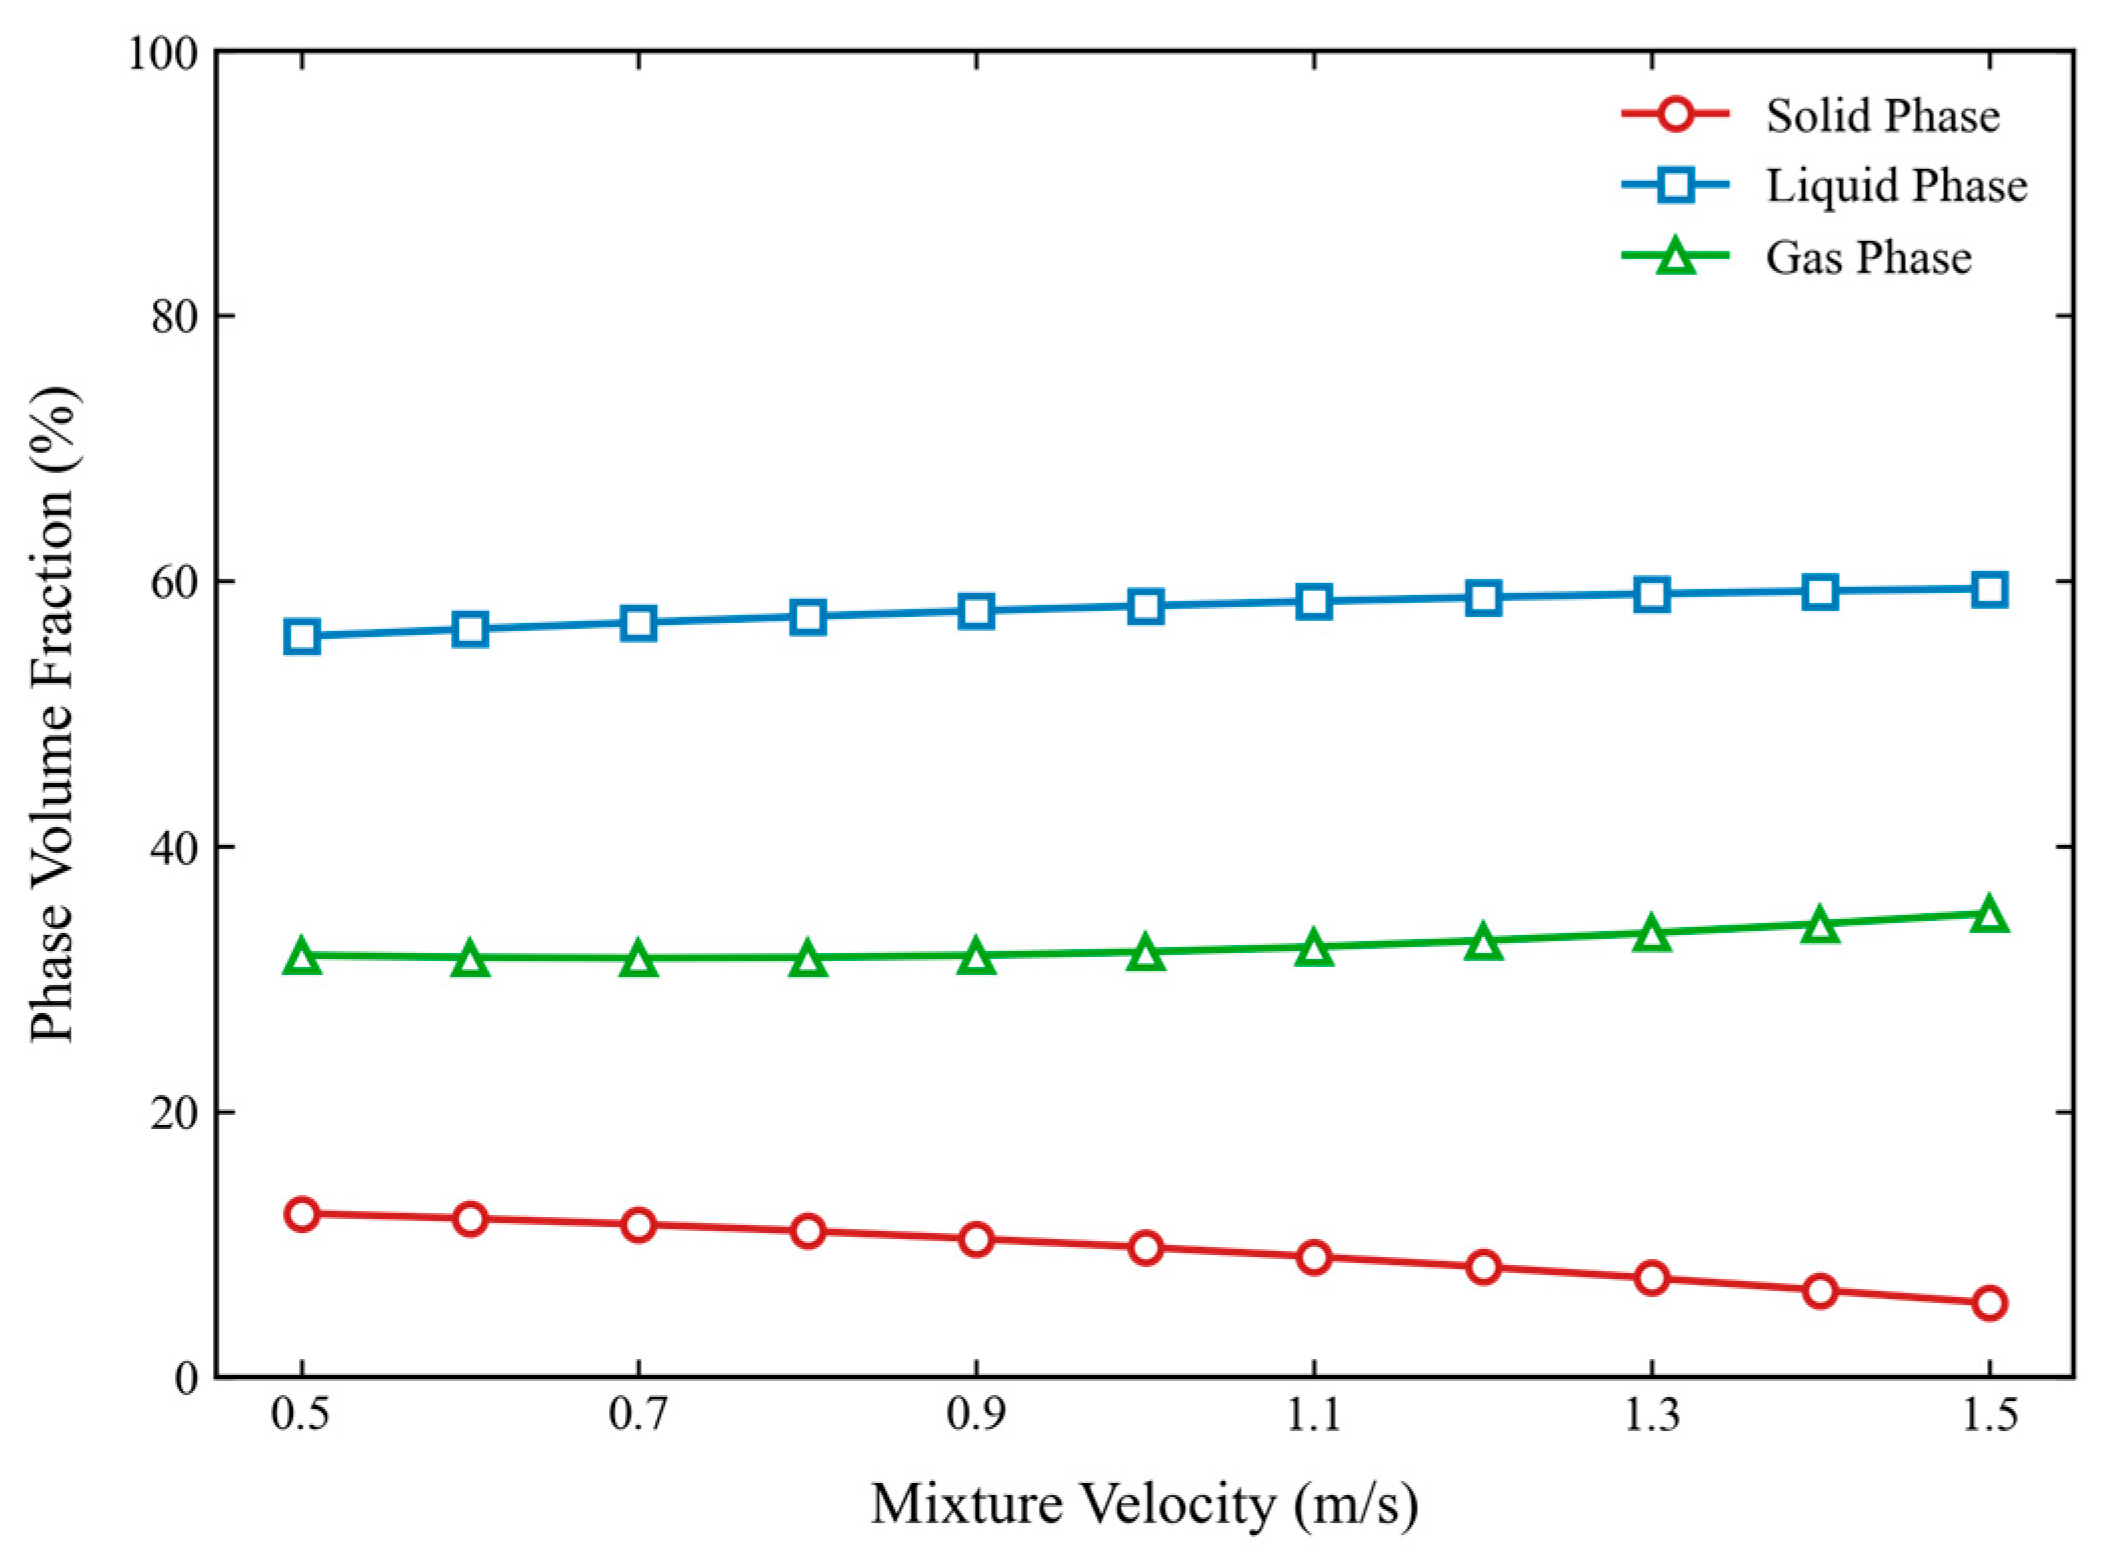
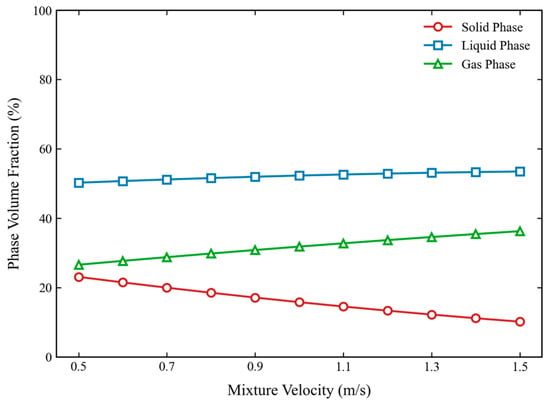
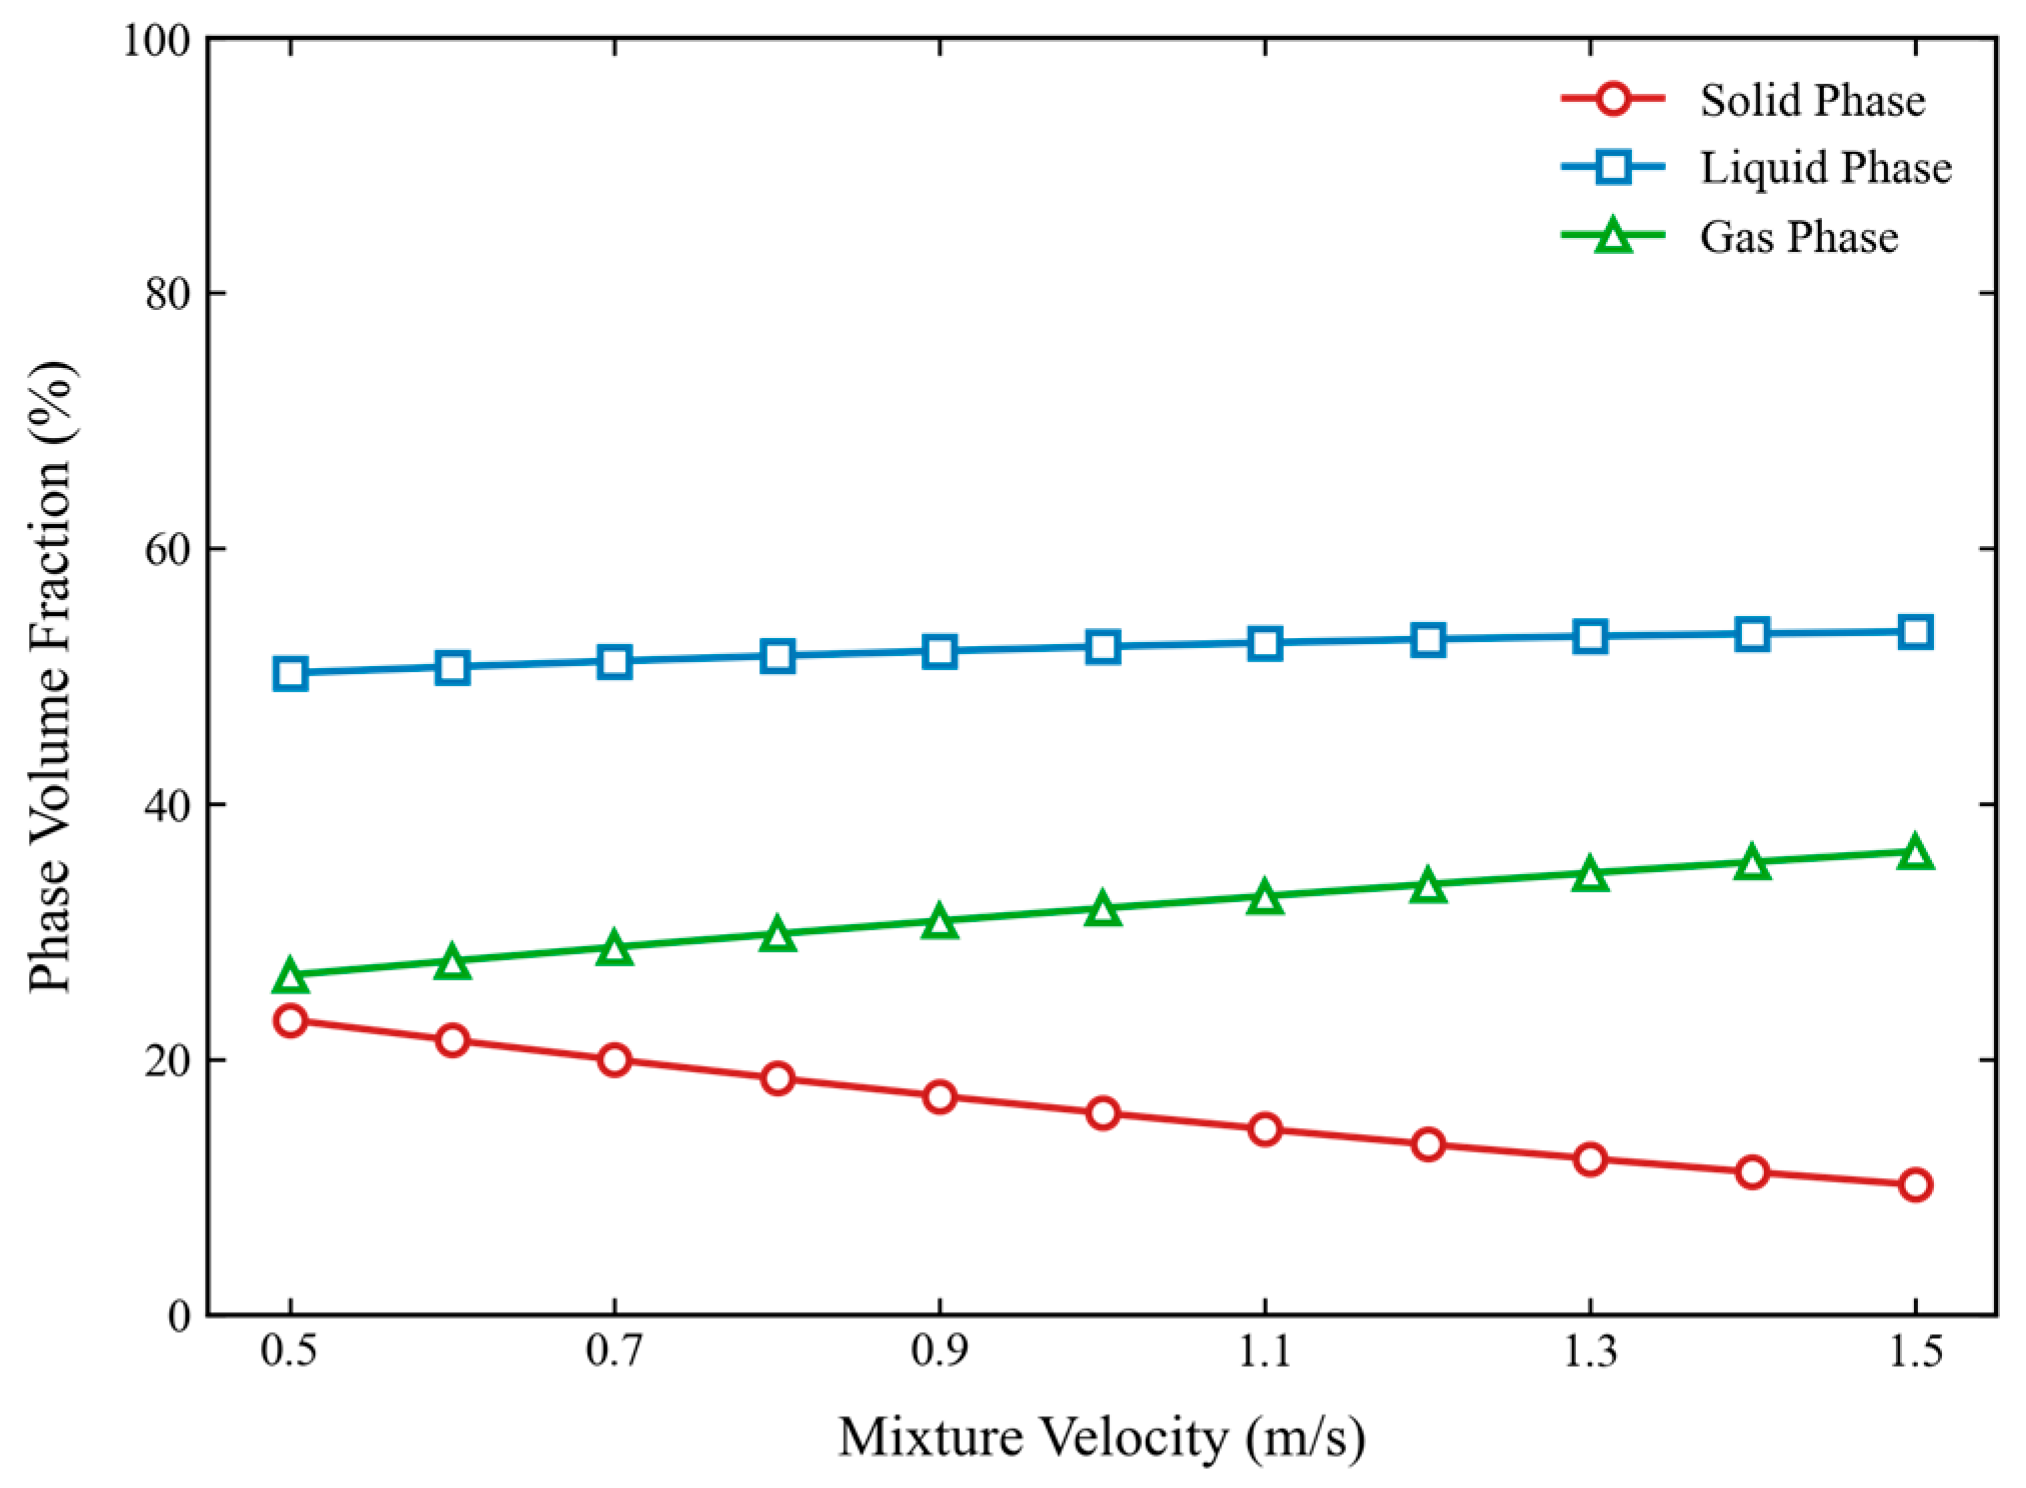
As shown in Figure 13, as the velocity increases from 0.5 m/s to 1.5 m/s, the sand phase volume fraction decreases from approximately 0.23 to 0.10, representing a reduction of more than 56%. Concurrently, the combined volumetric gain for the gas and water phases approaches 46%, indicating that the high-speed flow field effectively breaks up sand beds and maintains particle suspension. At low velocities, gravitational forces dominate, causing sand to deposit at the bottom of the pipe. In contrast, at high velocities, fluid lift and turbulent fluctuations become significant, lifting sand grains away from the bottom. A distinct shear force interaction exists between the liquid phase and sand grains; as the velocity rises, the resuspension force provided by the liquid increases, leading to enhanced sand migration and a concurrent increase in liquid retention. However, local regions, particularly near the upper inlet side, may develop unstable pulsating flow or gas locking phenomena due to excessive gas content. Therefore, it is necessary to guard against the risks of oscillation and intensified wear caused by excessive upper gas injection. For operational practice, the superficial velocity of the wellbore mixture should be maintained above 1.3 m/s to ensure substantial sand suspension and minimize the risk of wellbore blockage.
Figure 13.
Volume distribution of three-phase flow in multi-inlet pipe under different flow velocities.
3.5. Simulation of Multi-Inlet Pipes with Varying Phase Ratios
This section fixes the inlet flow velocity at 1.0 m/s and systematically investigates the influence of different gas injection strategies on wellbore multiphase flow characteristics by adjusting gas and liquid phase concentrations between 30%, 50%, and 70%. Simulation results reveal a trade-off between “instability induced by upper gas injection” and “improved liquid-carrying capacity via high gas–liquid ratios.”
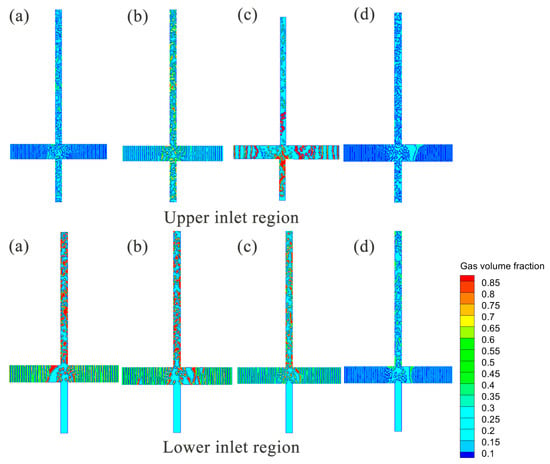
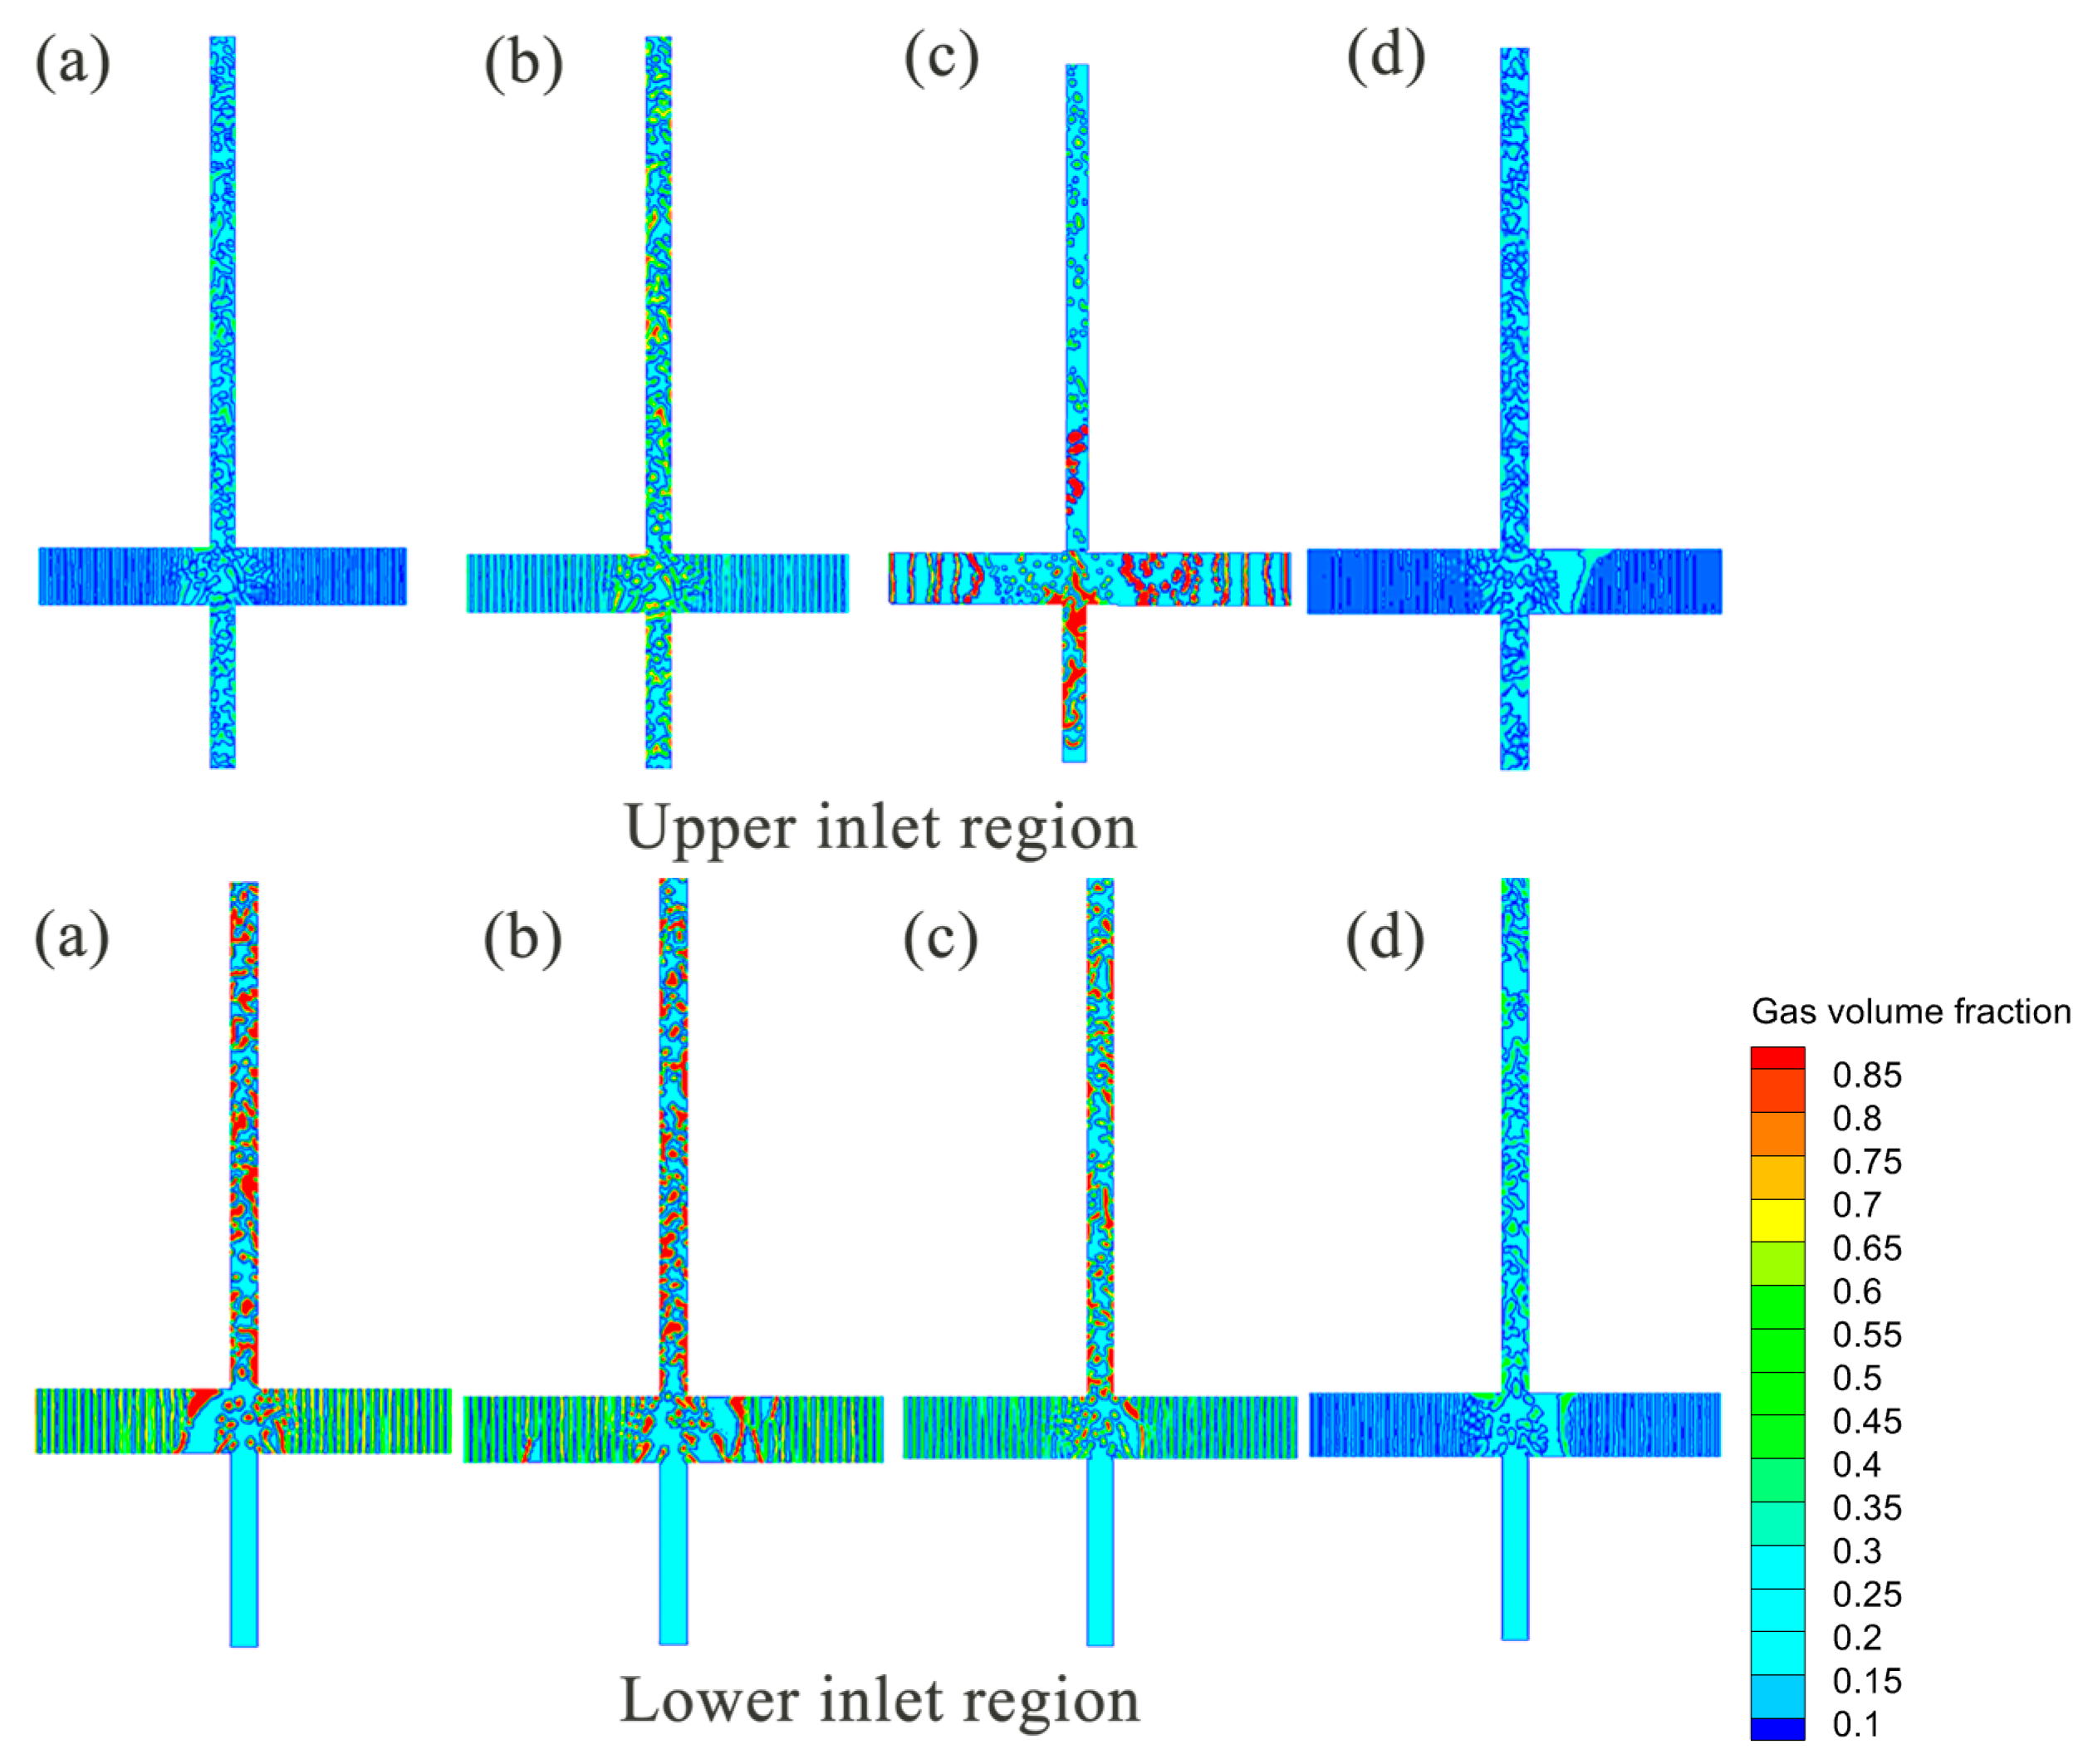
As shown in Figure 14, local flow field instability and risk warning are induced by high upper gas injection while keeping the gas–liquid ratio at the lower inlet constant; progressively increasing the gas phase concentration at the upper inlet significantly alters the fluid composition in the middle and upper sections of the wellbore. Simulations show that the upper inlet directly dominates the evolution of the local void fraction in the medium-to-high well sections. When the upper gas phase concentration reaches a critical high value of 70%, severe inter-phase interference occurs in the flow field. In the local region near the upper inlet, excessive gas accumulates rapidly, causing a sharp contraction of the liquid flow area and forming a typical gas-locking effect. This gas phase blockage disrupts flow continuity, inducing high-frequency, high-amplitude unstable pulsating flow. Increasing the gas fraction promotes gas-channel formation and reduces liquid holdup.
Figure 14.
Contour plots of gas phase volume fraction for multi-inlet tubes under different gas–liquid ratios: (a) upper inlet gas–liquid ratio 3:7, lower inlet 7:3; (b) upper inlet 5:5, lower inlet 7:3; (c) upper inlet 7:3, lower inlet 7:3; (d) upper inlet 3:7, lower inlet 3:7.
This section focuses on typical three-phase flow conditions with a 1.0 m/s velocity and 5% solid concentration to deeply investigate how the spatial distribution of fluid phase holdup controls system transport performance under multi-inlet conditions. Simulation results show that constructing a spatially differentiated injection mode characterized by upstream high liquid and downstream high gas achieves the best energy efficiency balance between solid particle detachment and long-distance fluid lifting.
As shown in Figure 15, high upstream liquid holdup improves particle detachment. This ensures solid particles are effectively detached from the bottom sediment layer and entrained into the mainstream core, eliminating the risk of bottom sand accumulation blockage at the source. The downstream gas fraction should be maintained between 50 and 70%. The optimal strategy combines upstream liquid-rich injection with downstream gas-rich injection.
Figure 15.
Contour plots of gas phase volume fraction for multi-inlet tubes under different gas–liquid–solid ratios: (a) upper inlet 30:65:5, lower inlet 70:25:5; (b) upper inlet 50:45:5, lower inlet 70:25:5 lower inlet 70:25:5; (c) upper inlet 70:25:5, lower inlet 70:25:5; (d) upper inlet 30:65:5, lower inlet 30:65:5.
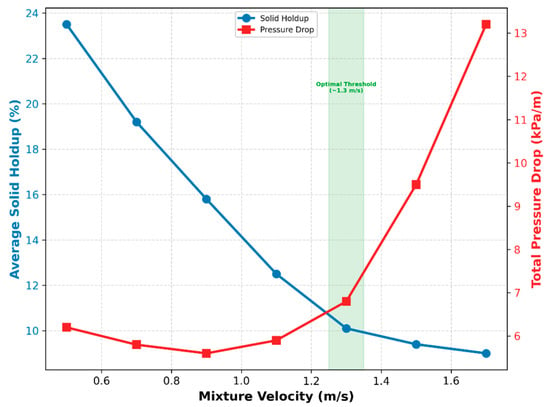
To rigorously quantify the optimal operational threshold, Figure 16 illustrates the evolution of Average Solid Holdup and Frictional Pressure Drop against varying mixture velocities. As velocity increases, the solid holdup decreases exponentially, marking enhanced suspension.
Figure 16.
The evolution of Average Solid Holdup and Frictional Pressure Drop against varying mixture velocities.
As shown in Table 3, compared to the baseline low gas–liquid ratio scenario, the proposed synergistic optimization strategy maintaining a 70% gas fraction at the downstream inlet effectively suppresses liquid fallback and reduces the total transport resistance along the wellbore by approximately 14.5%.
Table 3.
Quantitative evaluation of injection strategies on wellbore transport resistance (inlet velocity = 1.0 m/s).
4. Conclusions
Based on the numerical investigation of dynamics and particle transport in gas–liquid–solid three-phase multi-source converging flows, the following conclusions are drawn:
- (1)
- Flow Regime Evolution: Increasing fluid momentum drives a transition from surface tension-dominated slug flow to inertia-dominated churn flow. High velocities promote turbulent dispersion, shifting solid particles from gravitational settling to homogeneous suspension.
- (2)
- Curved Pipe Dynamics: Geometric curvature induces centrifugal phase separation, forcing liquid and solids toward the outer wall. Geometric shielding at the inner wall creates a low-shear environment that preserves large bubbles, leading to persistent flow heterogeneity.
- (3)
- Multi-Inlet Instability: The confluence structure creates complex shear environments resulting in dual-scale bubble characteristics. Local gas concentrations exceeding 70% at the upper inlet induce gas locking and severe pressure pulsations.
- (4)
- Optimization Strategy: A spatially differentiated injection strategy is established. Maintaining high liquid holdup upstream ensures particle detachment, while controlled gas injection downstream utilizes expansion energy for lifting.
- (5)
- Operational Threshold: Under the specific boundary conditions investigated in this study (100 mm main pipe diameter, 5% volumetric solid concentration, and 0.1 mm particle diameter), maintaining a superficial mixture velocity of approximately 1.3 m/s is recommended.
Finally, the practical application of this numerical framework is bounded by the absence of direct field-scale production logs or real-time downhole telemetry data. Due to commercial confidentiality and high-pressure sensor constraints in active multiphase production wells, direct field calibration was unfeasible. This model serves as an a priori predictive framework for gas-lift optimization, establishing a baseline that requires future operational calibration against specific field production histories.
Author Contributions
L.W. software; L.W. validation; Z.H. and L.L. formal analysis; Z.H. and L.L. investigation; Z.Z. data curation; Z.Z. and L.T. writing—original draft preparation; L.T. writing—review and editing. All authors have read and agreed to the published version of the manuscript.
Funding
This research was funded by the Research and Development Program of China (No. 2022YFC2806401).
Institutional Review Board Statement
Not applicable.
Informed Consent Statement
Not applicable.
Data Availability Statement
The original contributions presented in this study are included in the article. Further inquiries can be directed to the corresponding author.
Conflicts of Interest
Authors Lei Wang, Zhiqiang Hu, Lilin Li, and Zhenxiang Zhang are employed by the SINOPEC Research Institute of Petroleum Engineering Co., Ltd.; the remaining authors declare that the research was conducted in the absence of any commercial or financial relationships that could be construed as potential conflicts of interest.
References
- Yan, H.; Vosswinkel, N.; Ebbert, S.; Lipeme Kouyi, G.; Mohn, R.; Uhl, M.; Bertrand-Krajewski, J.-L. Numerical Investigation of Particles’ Transport, Deposition and Resuspension under Unsteady Conditions in Constructed Stormwater Ponds. Environ. Sci. Eur. 2020, 32, 76. [Google Scholar] [CrossRef] [Scilit]
- Kundakovic, L.; Vunjak-Novakovic, G. Mechanics of Particle Motion in Three-Phase Flow. Chem. Eng. Sci. 1995, 50, 3285–3295. [Google Scholar] [CrossRef] [Scilit]
- Zahtila, T.; Chan, L.; Ooi, A.; Philip, J. Particle Transport in a Turbulent Pipe Flow: Direct Numerical Simulations, Phenomenological Modelling and Physical Mechanisms. J. Fluid Mech. 2023, 957, A1. [Google Scholar] [CrossRef] [Scilit]
- Fei, L.; Qin, F.; Wang, G.; Huang, J.; Wen, B.; Zhao, J.; Luo, K.H.; Derome, D.; Carmeliet, J. Coupled Lattice Boltzmann Method–Discrete Element Method Model for Gas–Liquid–Solid Interaction Problems. J. Fluid Mech. 2023, 975, A20. [Google Scholar] [CrossRef] [Scilit]
- Zhu, J.; Zhang, H.-Q. Numerical Study on Electrical-Submersible-Pump Two-Phase Performance and Bubble-Size Modeling. SPE Prod. Oper. 2017, 32, 267–278. [Google Scholar] [CrossRef] [Scilit]
- Li, S.Q.; Tong, Y.S.; Yan, T.; Zhou, Y.C.; Li, W.; Sun, X.F. Numerical Simulation of Rock Breaking by Resonance Coring Based on Laboratory Experiments. SPE J. 2025, 30, 1162–1176. [Google Scholar] [CrossRef] [Scilit]
- Hu, Q.; Zou, L.; Lv, T.; Guan, Y.; Sun, T. Experimental and Numerical Investigation on the Transport Characteristics of Particle-Fluid Mixture in Y-Shaped Elbow. J. Mar. Sci. Eng. 2020, 8, 675. [Google Scholar] [CrossRef] [Scilit]
- Zheng, G.; Xu, P.; Li, L.; Fan, X. Investigations of the Formation Mechanism and Pressure Pulsation Characteristics of Pipeline Gas-Liquid Slug Flows. J. Mar. Sci. Eng. 2024, 12, 590. [Google Scholar] [CrossRef] [Scilit]
- Yao, D.; Sun, X.; Qu, J. Identification and Classification of Solid—Liquid Flow Patterns in Deviated and Horizontal Annuli. Nat. Gas Ind. B 2025, 12, 386–404. [Google Scholar] [CrossRef] [Scilit]
- Ge, M.; Chen, J.; Zhao, L.; Zheng, G. Mixing Transport Mechanism of Three-Phase Particle Flow Based on CFD-DEM Coupling. Processes 2023, 11, 1619. [Google Scholar] [CrossRef] [Scilit]
- Sun, X.; Tao, L.; Qu, J.; Yao, D.; Hu, Q. Evaluating the Effectiveness of Cleaning Tools for Enhanced Efficiency in Reamed Wellbore Operations. Geoenergy Sci. Eng. 2025, 246, 213620. [Google Scholar] [CrossRef] [Scilit]
- Chen, J.; Ge, M.; Li, L.; Zheng, G. Material Transport and Flow Pattern Characteristics of Gas–Liquid–Solid Mixed Flows. Processes 2023, 11, 2254. [Google Scholar] [CrossRef] [Scilit]
- Xia, H.; Zhang, Z.; Liu, J.; Ao, X.; Lin, S.; Yang, Y. Modeling and Numerical Study of Particle-Bubble-Liquid Flows Using a Front-Tracking and Discrete-Element Method. Appl. Math. Model. 2023, 114, 525–543. [Google Scholar] [CrossRef] [Scilit]
- Azimi, E.; Karimipour, S.; Nikrityuk, P.; Szymanski, J.; Gupta, R. Numerical Simulation of 3-Phase Fluidized Bed Particle Segregation. Fuel 2015, 150, 347–359. [Google Scholar] [CrossRef] [Scilit]
- Wan, C.; Xiao, S.; Zhou, D.; Zhu, H.; Bao, Y.; Li, T.; Tu, J.; Kyazze, M.S.; Han, Z. Numerical Analysis of Coarse Particle Two-Phase Flow in Deep-Sea Mining Vertical Pipe Transport with Forced Vibration. Ocean Eng. 2024, 301, 117550. [Google Scholar] [CrossRef] [Scilit]
- Pei, J.; Lui, A.; Zhang, Q.; Xiong, T.; Jiang, P.; Wei, W. Numerical Investigation of the Maximum Erosion Zone in Elbows for Liquid-Particle Flow. Powder Technol. 2018, 333, 47–59. [Google Scholar] [CrossRef] [Scilit]
- Zhang, J.; Li, Y.; Fan, L.-S. Numerical Studies of Bubble and Particle Dynamics in a Three-Phase Fluidized Bed at Elevated Pressures. Powder Technol. 2000, 112, 46–56. [Google Scholar] [CrossRef] [Scilit]
- Issakhov, A.; Bulgakov, R.; Zhandaulet, Y. Numerical Simulation of the Dynamics of Particle Motion with Different Sizes. Eng. Appl. Comput. Fluid Mech. 2019, 13, 1–25. [Google Scholar] [CrossRef] [Scilit]
- Hwang, J.; Kim, W.J.; Chae, K.J.; Jin, G.Y.; Lee, C.H.; Cui, X.; Choi, S. A Numerical Study on Airflow and Particle Transport Characteristics of Subjects with Cement Dust Exposure. Aerosol Sci. Technol. 2024, 58, 1432–1452. [Google Scholar] [CrossRef] [Scilit]
- Tian, L.; Zhang, Q.; Li, X.; Li, C. Fracturing Effectiveness Evaluation Based on Flowback Data Using Pressure Transient Testing. Reserv. Sci. 2026, 2, 97–110. [Google Scholar] [CrossRef] [Scilit]
- Wang, W.; Zhu, W.; Zhu, J.; Xie, B.; Tang, P.; Wang, T.; Ma, W. Research on Gas–Liquid–Solid Three-Phase Transportation Characteristics of Vertical Pneumatic Lifting System Based on Computational Fluid Dynamics–Discrete Element Method. Mar. Georesources Geotechnol. 2025, 44, 1446–1471. [Google Scholar] [CrossRef] [Scilit]
- Taha, M.H.; Holagh, S.G.; Rosettani, J.; Moussa, S.E.; Ahmed, W.H. Optimizing Airlift Pumps for Efficient Solid-Liquid Transport: Effect of Particle Properties, Submergence Ratio, and Injector Design. Chem. Eng. Res. Des. 2025, 215, 292–311. [Google Scholar] [CrossRef] [Scilit]
- Douek, R.S.; Hewitt, G.F.; Livingston, A.G. Hydrodynamics of Vertical Co-Current Gas-Liquid-Solid Flows. Chem. Eng. Sci. 1997, 52, 4357–4372. [Google Scholar] [CrossRef] [Scilit]
- Hu, Y.; Yang, Y. A Comparative Study on Drag Reduction Methods for Continental Shale Drilling in the Fuxing Block, Southeastern Sichuan Basin. Reserv. Sci. 2026, 2, 81–96. [Google Scholar] [CrossRef] [Scilit]
- Ali, J.; Ansari, U.; Ali, F.; Javed, T.; Hullio, I.A. Application of Machine Learning for Effective Screening of Enhanced Oil Recovery Methods. Reserv. Sci. 2026, 2, 65–80. [Google Scholar] [CrossRef] [Scilit]
- Ghazanfari, V.; Imani, M.; Shadman, M.M.; Amini, Y.; Zahakifar, F. Numerical Study on the Thermal Performance of the Shell and Tube Heat Exchanger Using Twisted Tubes and Al2O3 Nanoparticles. Prog. Nucl. Energy 2023, 155, 104526. [Google Scholar] [CrossRef] [Scilit]
- Lun, C.K.K.; Savage, S.B.; Jeffrey, D.J.; Chepurniy, N. Kinetic Theories for Granular Flow: Inelastic Particles in Couette Flow and Slightly Inelastic Particles in a General Flowfield. J. Fluid Mech. 1984, 140, 223–256. [Google Scholar] [CrossRef] [Scilit]
- Brilliantov, N.V.; Pöschel, T. Rolling Friction of a Viscous Sphere on a Hard Plane. Europhys. Lett. 1998, 42, 511–516. [Google Scholar] [CrossRef] [Scilit]
- Mathiesen, V.; Solberg, T.; Hjertager, B.H. Predictions of Gas/Particle Flow with an Eulerian Model Including a Realistic Particle Size Distribution. Powder Technol. 2000, 112, 34–45. [Google Scholar] [CrossRef] [Scilit]
- Walton, O.R.; Braun, R.L. Viscosity, Granular-temperature, and Stress Calculations for Shearing Assemblies of Inelastic, Frictional Disks. J. Rheol. 1986, 30, 949–980. [Google Scholar] [CrossRef] [Scilit]
- Huilin, L.; Gidaspow, D.; Bouillard, J.; Wentie, L. Hydrodynamic Simulation of Gas-Solid Flow in a Riser Using Kinetic Theory of Granular Flow. Chem. Eng. J. 2003, 95, 1–13. [Google Scholar] [CrossRef] [Scilit]
- Beggs, D.H.; Brill, J.P. A Study of Two-Phase Flow in Inclined Pipes. J. Pet. Technol. 1973, 25, 607–617. [Google Scholar] [CrossRef] [Scilit]
- Minagawa, H.; Tomiyama, A. Pressure Drop in Gas-Liquid-Solid Three-Phase Slug Flow in Vertical Pipes. Exp. Therm. Fluid Sci. 1993, 7, 49–60. [Google Scholar]

Disclaimer/Publisher’s Note: The statements, opinions and data contained in all publications are solely those of the individual author(s) and contributor(s) and not of MDPI and/or the editor(s). MDPI and/or the editor(s) disclaim responsibility for any injury to people or property resulting from any ideas, methods, instructions or products referred to in the content. |
© 2026 by the authors. Licensee MDPI, Basel, Switzerland. This article is an open access article distributed under the terms and conditions of the Creative Commons Attribution (CC BY) license.