


Abstract
Hen eggshell is an abundant, calcite-rich food waste that is usually valorised by calcination at 800–1000 °C, an energy-intensive step that releases its carbonate CO2 and destroys its biogenic microstructure. Low-temperature routes that keep the calcite intact have received little attention, and their effect on the structure and functions of geopolymer gels is unknown. This work examined whether eggshell conditioned at only 250 °C (ES-250) can replace 10 wt% of the metakaolin in a geopolymer gel, and what it changes. ES-250 remained pure biogenic calcite, with intracrystalline vesicles and residual organic matter, and the route needs ≈3–6 times less heat than calcination, including drying. In the hardened binder, ES-250 persisted as discrete 2–5 µm calcite particles without detectable Ca diffusion into the aluminosilicate gel. The Si–O–T bonding, the total pore volume and the N2-accessible porosity (≈41%) were preserved, and only the BET surface area decreased (36.2 → 31.6 m2 g−1). Dye uptake in the dark was maintained, but the strong antibacterial effect of the plain geopolymer, which left no culturable Escherichia coli after 4 h, was largely lost (22–34% reduction). Low-temperature-conditioned eggshell is therefore a decarbonation-free, structurally inert filler for geopolymer gels, but not a functional additive.
1. Introduction
Hen eggshell is one of the most abundant calcium-rich food industry by-products. It is generated in large quantities by egg-breaking plants, bakeries and households and is still largely landfilled, where the adhering membranes and residual albumen cause odour and attract vermin [1,2,3]. Chemically, the calcified shell is ≈95 wt% calcite with ≈3.5 wt% organic matrix and minor Mg, P and trace elements [4,5]. Structurally, it is a hierarchical biomineral. Mammillary knobs nucleate on the fibrous, collagen- and cysteine-rich shell membranes [6], and they grow into a columnar palisade layer whose calcite crystals contain abundant intracrystalline vesicles and occluded proteins, capped by a vertical crystal layer and an organic cuticle [4,5,7,8]. These features give eggshell calcite properties that differ measurably from geological limestone, including anisotropic lattice distortions induced by intracrystalline macromolecules [9,10].
Current high-value uses of eggshell include dietary calcium supplements, adsorbents, catalysts and fillers, and many of them start with calcination at 800–1000 °C to obtain CaO [1,2,3]. Calcination is energy-intensive and, stoichiometrically, releases 0.44 kg CO2 per kg of CaCO3 decomposed. It also erases the biogenic microstructure and organic fraction that make eggshell distinctive. Low-temperature processing (≤300 °C) is, by contrast, much less studied. Thermogravimetric studies show that eggshell loses adsorbed water below ≈200 °C, that its organic matrix degrades mainly between ≈250 and 600 °C, and that calcite decomposes only above ≈650–700 °C [11]. A treatment at 150–300 °C therefore dries and partly purifies the shell without decarbonisation. Compared with calcination, it has three advantages. (i) The carbonate CO2 (0.44 kg per kg CaCO3) is not released. (ii) The heat demand is much lower. Heating calcite to 250 °C requires ≈0.22 MJ kg−1, whereas calcination requires 1.78 MJ kg−1 for the reaction alone and ≈2.6 MJ kg−1 including sensible heat [12], and industrial lime kilns consume 3.6–7.5 GJ per tonne of lime [13] (Section 2.4). (iii) The biogenic microstructure and part of the organic matrix are preserved. The trade-off is that the product is calcite, not reactive CaO, so it cannot act as a soluble calcium source or as an alkaline antibacterial agent in the way calcined shells do [14,15]. At this temperature calcite is thermodynamically stable, while moisture, labile organics and potential pathogens can be reduced. The treatment may also modify the organic–mineral interface in a way that matters for downstream use. In this work, “decarbonation-free” denotes such a processing route, which remains below the decomposition temperature of calcite and therefore avoids the process CO2 released by carbonate decomposition; it does not refer to the energy-related emissions of drying and heating.
Hygienisation is a further reason for heat treatment. Raw eggshell waste carries a considerable microbial load: shell surfaces can be contaminated with Salmonella Enteritidis and other enteric bacteria [16], and the counts of bacteria, coliforms and yeasts on stored eggshell waste increase with storage time [17]. Hygienisation is therefore a prerequisite for any reuse, for example as a calcium supplement in food or feed [2] or in materials handled by people. Dry heat is an established method: 150 °C for 150 min, 160 °C for 120 min and 170 °C for 60 min are standard dry-heat sterilisation schedules [18], and ≥250 °C for ≥30 min is used to inactivate bacterial endotoxins (depyrogenation) [19]. The drying (150 °C, 5 h) and conditioning (250 °C, 2 h) steps used in this work exceed these conditions, so no viable bacteria are expected in the conditioned eggshell. The microbial status of the powders was not tested, however, and should be verified (e.g., total viable count and Salmonella detection) before use in applications involving human or animal contact. The conditioned product consists of calcite, which is non-toxic, and eggshell powder is used as a dietary calcium source [2]; as for any fine mineral powder, exposure to dust during handling should be minimised.
Geopolymers and, more generally, alkali-activated materials are formed by the alkaline activation of reactive aluminosilicates (e.g., metakaolin, fly ash, slag) into an amorphous N–A–S–H or (N,C)–A–S–H binder [20,21,22]. These binders are inorganic gels: the N–A–S–H gel is a disordered three-dimensional network of corner-sharing SiO4 and AlO4 tetrahedra, charge-balanced by alkali cations, which forms through dissolution, gelation and polycondensation, and its nanoparticulate structure governs the porosity and surface reactivity of the hardened material [21]. Calcium sources modify the reaction pathway, and the particle size and Ca content of the precursors have been shown to control the structure and performance of metakaolin- and fly-ash-based geopolymer gels [23]. Dissolved Ca can promote the coexistence of C–(A)–S–H with the geopolymer gel [24], and fine calcite particles can act as nucleation sites and fillers. Adding a biogenic calcite with a vesicular microstructure and residual organics could therefore affect the pore structure, surface chemistry and biological response of the hardened material. Antibacterial function in geopolymers is usually obtained by doping with metal ions or metal-oxide particles (Ag, Cu, Zn, TiO2) [25]. Unmodified metakaolin geopolymers can, however, also inhibit bacteria, an effect usually attributed to the alkaline environment created by activation [26]. In a previous study [27], we modified a metakaolin geopolymer with 2.5 wt% of calcium particles from five marine shell species calcined at 900 °C. The specific surface area and dye adsorption capacity increased strongly, but none of the shell additives matched the rapid reduction in culturable E. coli by the unmodified geopolymer. Calcination at 900 °C, however, releases the carbonate CO2 and destroys the biogenic structure. Uncalcined eggshell powder has also been used to replace part of the metakaolin in alkali-activated binders, where it acted as a filler and partly as a calcium source and, at suitable dosages, improved the mechanical performance [28,29]. These studies focused on mechanical and high-temperature behaviour; the effect of eggshell on the texture of the gel and on functional properties such as dye removal and antibacterial activity was not examined.
Low-temperature processing is also a central theme of geopolymer research itself. Much of the energy and CO2 advantage of geopolymers over Portland cement derives from the moderate processing temperature of their precursors and from curing near ambient temperature [30]. Metakaolin is obtained by calcining kaolin at ≈600–850 °C, well below the ≈1450 °C needed for clinker, and its industrial calcination requires ≈2–4.5 MJ kg−1 [31]. Several routes aim to lower this thermal input further. Mechanical or mechanothermal activation allows kaolinite to be largely dehydroxylated at 300–500 °C [32]. In one-part formulations, the precursor is blended or co-calcined with a solid activator, so that only water has to be added at the point of use [33]. Curing at or near room temperature is generally sufficient for metakaolin binders and can even be preferable, because curing at higher temperature (e.g., 50 °C) markedly reduced the strength of a metakaolin geopolymer [34]. Life-cycle studies have shown that the alkali activator, especially sodium silicate, is the main contributor to the environmental impact of geopolymer concrete [35], so further gains depend on reducing the amounts of thermally processed precursor and activator per unit of binder. Mineral fillers and partial precursor replacements that need little or no thermal treatment are therefore attractive. Ground limestone, for example, acts mainly as a filler and nucleation substrate in metakaolin geopolymers [36,37]. In eggshell-based construction materials, eggshell is used either calcined, to obtain reactive CaO, or raw, after washing, drying and grinding [1,38]. Raw eggshell powder has been combined with fly ash in ambient-cured geopolymers for soil stabilisation [39] and in lightweight geopolymer panels [40], and it has replaced part of the metakaolin in one-part binders and in geopolymer concrete [28,29]. These studies evaluated mechanical and thermal performance. Intermediate treatments at ≈200–300 °C, which keep the calcite intact but remove moisture and labile organics and reduce the microbial load of the shell, have received little attention. Whether such a decarbonation-free eggshell affects the gel texture and the functional properties (dye removal and antibacterial activity) of a metakaolin binder has, to our knowledge, not been examined.
The aim of this work was to establish whether a decarbonation-free eggshell, conditioned at 250 °C, can replace part of the metakaolin in a geopolymer gel, and how it affects the structure, texture and functional behaviour of the gel. The study has two parts. In the first part, eggshell dried at 150 °C (ES-150) and conditioned at 250 °C (ES-250) were compared to determine what the 250 °C treatment changes. XRD with whole-powder-pattern fitting was used to verify that no decarbonation or phase transformation occurred and to determine the lattice parameters, Mg substitution and crystallite size. SEM with quantitative image analysis was used to describe the particle morphology and the intracrystalline vesicles, EDS mapping and ATR-FTIR to follow the residual organic matter, and N2 physisorption to measure the accessible surface. In the second part, ES-250 replaced 10 wt% of the metakaolin in a geopolymer (GP-ES), which was compared with the reference geopolymer of our previous study (GP-0) [27], prepared from the same raw materials and activators. XRD and ATR-FTIR were used to detect reaction products between calcite and the activator and changes in the Si–O–T bonding of the gel, SEM-EDS to locate the calcite particles and to detect Ca diffusion into the gel, and N2 physisorption to quantify the surface area and pore structure. Methylene blue tests in the dark and under UV-A irradiation were used to assess dye uptake and a possible photo-assisted transformation, and a suspension test with Escherichia coli to assess the antibacterial activity. The objectives were to (i) establish what a 250 °C treatment does, and does not, change in biogenic calcite, and (ii) to determine how the treated calcite interacts with the aluminosilicate gel and how it affects the microstructure, texture and functional behaviour of the geopolymer gel.
2. Results and Discussion
The results are presented from the filler to the gel and to its functions: the structure and thermal stability of the biogenic calcite (Section 2.1, Section 2.2, Section 2.3 and Section 2.4), its interaction with the aluminosilicate gel (Section 2.5 and Section 2.6), the resulting gel texture (Section 2.7) and the functional response of the gels (Section 2.8 and Section 2.9). ES-150 and ES-250 denote the eggshell dried at 150 °C and conditioned at 250 °C, and GP-0 and GP-ES the reference and the eggshell-containing geopolymer; their preparation and the experimental methods are described in Section 4.
2.1. Phase Composition and Crystal Structure of Eggshell After 150 and 250 °C
The diffraction patterns of ES-150 and ES-250 (Figure 1a) contain only calcite reflections. All 42 (ES-150) and 41 (ES-250) peaks resolved in the 20–115° range were indexed to calcite (ICDD 04-008-0788, R-3c), and the refinement returned 100% calcite in the crystalline fraction of both samples. Neither aragonite nor vaterite (biogenic CaCO3 polymorphs), nor portlandite or lime, was detected. No crystalline decomposition products were detected above the detection limit of laboratory XRD for minor phases (≈1 wt%). Together with the thermal stability of calcite, which decomposes only above ≈600–700 °C in air, this indicates that the 250 °C treatment causes no measurable decarbonation. The mass loss on conditioning supports this conclusion: if the measured loss of 2.33 wt% (Section 4.1) were due entirely to CO2 released by decarbonation, ES-250 would contain ≈3.0 wt% CaO, which would have been detected by XRD. The loss is therefore attributed to residual water and labile organic matter. The refinement quantifies only crystalline phases; amorphous and organic constituents are not included, and the mass loss was not measured (e.g., by TGA), so a decomposition below the XRD detection limit cannot be strictly excluded, although it is thermodynamically implausible at 250 °C. Both refinements are satisfactory. The residuals are confined to the strongest reflections, most notably (104), (202) and (018)/(116), a pattern typical of anisotropic broadening in platy biogenic calcite.
Figure 1.
(a) XRD patterns of eggshell dried at 150 °C (ES-150) and heat-treated at 250 °C (ES-250), recorded under identical conditions, normalised to the (104) reflection and offset vertically; the main calcite reflections (ICDD 04-008-0788) are indexed. (b) Detail of the (104) reflection; the dotted line marks the reference position.
The refined a parameters of both samples are smaller than that of geological calcite (a = 4.991 Å, c = 17.062 Å [41]), whereas c is close to the reference value. Substitution of the smaller Mg2+ ion for Ca2+ contracts the calcite cell, and interpolation between calcite and magnesite gives ≈1.5–2.6 mol% MgCO3 from a but only ≈0.4–1.0 mol% from c (Table 1). The a-based estimate agrees with the Mg/(Mg + Ca) ratio measured by EDS (1.7–3.0 at.%, Section 2.3) and with the known minor-element chemistry of eggshell [4]. The lower c-based estimate is consistent with the observation of Pokroy et al. that intracrystalline macromolecules expand biogenic calcite anisotropically, particularly along c [9], so that part of the Mg-induced contraction along c is offset by organic-induced expansion.
Table 1.
Structural and textural parameters of the eggshell powders obtained by Rietveld-type whole-powder-pattern fitting of XRD data (Cu Kα, 20–115° 2θ, identical measurement conditions) and by N2 physisorption (77 K). Numbers in parentheses are estimated standard deviations on the last digit(s).
Between 150 and 250 °C, the lattice parameters change only marginally (Δa = +0.0038(18) Å, ≈2σ; Δc = −0.012(11) Å; ΔV = +0.4(3) Å3, +0.1%), and none of these differences is clearly significant. A slight increase in a together with a decrease in c would be compatible with a partial relaxation of the organic-induced anisotropic distortion, which Pokroy et al. observed upon mild thermal annealing of biogenic calcite [9,10], but the present data do not demonstrate it; a dedicated series (e.g., 150–400 °C with an internal Si standard) would be needed. The (104) reflection lies at 29.446° (ES-150) and 29.459° (ES-250; Figure 1b). This small difference (+0.013°) is within the range expected from specimen displacement, which the refinement corrects, so lattice parameters rather than raw peak positions are compared.
Under identical measurement and refinement conditions, the line broadening of the two samples is practically the same. The Williamson–Hall coherent domain size is 78 ± 9 nm for ES-150 and 69 ± 5 nm for ES-250, and the microstrain is 0.146 ± 0.013% and 0.147 ± 0.010%, respectively. The 250 °C treatment therefore does not measurably change the coherent domain size or the microstrain of the biogenic calcite. The main difference between the two patterns is in the relative intensities. The (104) reflection is more dominant in ES-150 (I113/I104 = 0.12 and I202/I104 = 0.14, against 0.23 and 0.15 for ES-250), and the refined March–Dollase coefficient for (104) is 0.70 for ES-150 and 0.95 for ES-250 (Table 1). ES-150, therefore, shows a pronounced preferred orientation of the platy fragments on the (104) cleavage face, whereas the ES-250 powder is close to random orientation. Because this depends on particle shape and on specimen preparation, it is not interpreted as a structural effect of the heat treatment; it may reflect differences in the fragment morphology after grinding.
2.2. Morphology and Texture of the Heat-Treated Eggshell
SE micrographs of ES-250 (Figure 2a,b) show fracture surfaces of compact calcite with a smooth, conchoidal-to-stepped morphology and faint striations parallel to the growth direction of the palisade columns. The surfaces are densely perforated by rounded pores. Image analysis of 798 of these features in two micrographs gives a unimodal, right-skewed size distribution with a median equivalent diameter of 0.18 µm (mean 0.20 ± 0.09 µm; P10–P90 = 0.10–0.32 µm; maximum ≈ 0.8 µm; Figure 2d), a number density of ≈0.9 µm−2 and a projected areal fraction of ≥3–4%. The size, shape and abundance of these pores match the intracrystalline vesicles characteristic of the palisade layer of avian eggshell [4,7]. They are therefore most likely a native biogenic feature rather than a product of the heat treatment. ES-150 was not imaged, so a direct comparison before and after the treatment is not available; the well-defined, non-coalesced vesicles nevertheless show no sign of sintering or collapse of the calcite framework. Because the statistics come from two fields of view, they describe the analysed regions and are not extrapolated to the whole material.
Figure 2.
SE micrographs of eggshell heat-treated at 250 °C (10 kV, ×5000): (a,b) fracture surfaces of palisade calcite with abundant sub-micrometre intracrystalline vesicles and adhered fine debris; (c) angular, lamellar particles of the ground powder. (d) Equivalent-diameter distribution of vesicles segmented from (a,b) (n = 798).
The calcite surfaces are decorated with angular fine debris of 0.2–3 µm, produced by grinding and adhering electrostatically. In addition, Figure 2c shows loose, angular to tabular fragments of 5–15 µm with stepped, lamellar edges and cleavage traces, typical of brittle fracture of calcite along {104} planes. Their platy habit is consistent with the preferred-orientation effects seen in XRD. The combination of internal sub-micrometre porosity and a broad particle-size distribution is relevant for geopolymer use (the particle-size information is summarised at the end of this section). The vesicles offer additional internal surface and potential sites for alkaline-solution ingress and heterogeneous nucleation, while the fine fraction can act as a micro-filler.
Specific surface area. Both eggshell powders are practically non-porous to N2 (Table 1, Figure S1). The isotherms are of Type II with low BET C constants (36–38), the t-plot shows no micropore volume, and the uptake rises steeply only above P/P0 ≈ 0.9, in the inter-particle voids. SBET is 0.92 m2 g−1 for ES-150 and 0.35 m2 g−1 for ES-250, which corresponds to BET-equivalent particle diameters of 2.4 and 6.4 µm. These sizes are consistent with the mixture of 0.2–3 µm debris and 5–15 µm lamellar fragments seen by SEM. The intracrystalline vesicles are closed and therefore not accessible to N2; even if they were, 0.18 µm pores would contribute little area.
The 250 °C treatment reduced SBET by 62% and the pore volume at P/P0 = 0.95 by 61%. It also nearly removed the hysteresis loop that ES-150 shows between P/P0 ≈ 0.45 and 1 (Figure S1a). This H3-type loop is associated with slit-shaped voids between plate-like particles or within fibrous networks [42], and its lower closure at P/P0 ≈ 0.45 reflects cavitation. The calcite lattice was unchanged by the treatment (Table 1), and 250 °C is far below the temperatures at which calcite sinters or decomposes. We therefore attribute the loss of surface tentatively to the partial degradation of the organic fraction, which is supported by the decrease of the ≈1645 cm−1 and O–H/N–H bands in ATR-FTIR (Section 2.3) and by the known degradation range of eggshell organics (≈250–600 °C) [11]; agglomeration of the finest debris may also contribute. Because TGA was not performed, the organic fraction removed at 250 °C could not be separated from the water lost; the total mass loss on conditioning was 2.33 wt% (Section 4.1). Partial degradation and shrinkage of the shell-membrane fibres and adhering matrix proteins, evidenced by the loss of about two-thirds of the amide I band (Section 2.3), would remove a fine, high-surface organic component and the slit-shaped voids associated with it, and may also allow the finest calcite debris to aggregate. The absolute values should be read with caution, because the total surface in the sample tube (0.32 and 0.17 m2) is small for N2 adsorption; the two samples were, however, measured in the same run, and the relative decrease is far larger than the fit uncertainties (±1–2%); independent preparations were not measured. For the geopolymer, the very low surface area of ES-250 means that the eggshell acts as a surface-diluting filler (Section 2.7).
Particle size, density and water absorption. The ground ES-250 powder has a broad particle-size distribution: SEM shows sub-micrometre to 3 µm debris and 5–15 µm lamellar fragments, and its BET-equivalent diameter is 6.4 µm (2.4 µm for ES-150); the particle-size distribution was not measured by laser diffraction. The crystallographic density of the calcite, calculated from the refined cell volume, is 2.718 g cm−3 (Table 1); the skeletal density of the powder, which contains residual organic matter and closed vesicles, is expected to be slightly lower but was not measured. Water absorption was not measured either. Because both powders are practically non-porous to N2 and the vesicles are closed, their open porosity is negligible, and ES-250 is not expected to increase the water demand of the paste significantly.
2.3. Elemental Composition, Element Distribution and Organic Matrix
The EDS map-sum spectra of three areas of ES-250 (Table 2) are dominated by Ca, C and O. Minor Mg (0.3–0.4 wt%), Al (0.1–0.3 wt%), P (0.1 wt%) and Na (≤0.1 wt%) are also present, consistent with the minor-element signature of eggshell [4,5]. Mg is distributed homogeneously and follows Ca (Figure 3f), supporting its lattice incorporation inferred from XRD. Mg/(Mg + Ca) atomic ratios of 1.7–3.0% agree with the estimate derived from the a parameter (1.5–2.6 mol%, Section 2.1), although EDS quantification on rough powders has a large uncertainty [43], and part of the Mg may reside in the organic matrix or at crystal surfaces rather than in the calcite lattice.
Table 2.
EDS map-sum composition (wt%) of eggshell heat-treated at 250 °C, measured on three areas (×3000). Stoichiometric CaCO3: Ca 40.04, C 12.00, O 47.96 wt%.
Figure 3.
EDS mapping of eggshell heat-treated at 250 °C (area Z3, ×3000): (a) electron image; element maps of (b) C, (c) O, (d) Ca, (e) S and (f) Mg; (g) map-sum spectrum with Tru-Q quantification. Ca-poor, C- and S-enriched domains are attributed to residual organic matrix. Contrast streaks in (a) are due to specimen charging.
All areas contain far more carbon than stoichiometric CaCO3 would provide. Atomic C/Ca ratios are 2.3–4.9 against 1.0 for calcite, and the excess corresponds to ≈11–27 wt% C if all Ca is assigned to CaCO3. Part of this excess is analytical. It comes from carbon tape or coating, adventitious hydrocarbon contamination, and the known overestimation of C on rough, charging specimens [43]. The element maps show that it is not uniform, however. In area Z3 (Figure 3), C-rich domains are spatially anti-correlated with Ca, and the same area is the only one that contains sulphur (1.9 wt%), with a diffuse distribution that overlaps the Ca-poor regions. Exposed carbon tape between particles or carbon deposited on strongly charging areas (Figure 3a) could also produce C-rich, Ca-poor regions, but would not account for the sulphur. Sulphur has no mineral host in eggshell calcite. Its most plausible source is S-bearing organic matter, such as the cysteine-rich proteins of the shell membranes and calcified matrix [6,8], but EDS alone cannot identify the chemical form of S. The C- and S-rich, Ca-poor domains are therefore interpreted as consistent with residual organic material that survived the 250 °C treatment. This agrees with the general observation that eggshell organics degrade mainly between ≈250 and 600 °C [11], so a 250 °C treatment is expected to remove water and the most labile fraction but leave much of the proteinaceous matrix. The ATR-FTIR results below are consistent with this interpretation.
This residual organic fraction may be useful for the intended application. Sulphur- and nitrogen-bearing biomolecules and partially degraded proteins can interact with bacterial cell envelopes and with alkaline pore solutions, and they may modify the local chemistry of the geopolymer–filler interface. Their fate during alkaline activation (hydrolysis at high pH, leaching, or retention in the binder) should be established and is addressed in Section 2.6.
The ATR-FTIR spectra of ES-150 and ES-250 (Figure 4a, Table 3) are dominated by the internal modes of calcite. These are the asymmetric stretching ν3 at 1404–1408 cm−1, the out-of-plane bending ν2 at 874 cm−1 and the in-plane bending ν4 at 712 cm−1, together with the ν1+ν4 (1796 cm−1) and 2ν2+ν4 (2513–2515 cm−1) combination bands and a weak, formally IR-inactive ν1 mode at 1084–1086 cm−1. No bands of aragonite (split ν4 at ≈700/713 cm−1, ν2 at ≈855 cm−1) or vaterite (≈745 cm−1) were observed, in agreement with XRD. The ν2/ν4 height ratio, which is sensitive to the degree of atomic order in calcite [44], is practically the same for the two samples (3.1 and 3.0). The 250 °C treatment therefore does not measurably alter the short-range order of the calcite.
Figure 4.
ATR-FTIR spectra of (a) eggshell dried at 150 °C (ES-150) and heat-treated at 250 °C (ES-250), and (b) the reference geopolymer (GP-0) and the geopolymer containing ES-250 (GP-ES). Spectra are offset vertically. The band at ≈2360 cm−1 is due to incompletely compensated atmospheric CO2.
Table 3.
Main ATR-FTIR bands (cm−1) and assignments (spectral resolution 4 cm−1).
The treatment clearly affects the non-carbonate bands. ES-150 shows a distinct band at 1643 cm−1 and a broad O–H/N–H stretching envelope centred at ≈3300 cm−1. The band at 1643 cm−1 contains contributions from the amide I vibration of shell-matrix and membrane proteins and from the H–O–H bending of water, which cannot be separated in these spectra. After heating at 250 °C, the integrated band at ≈1645 cm−1 decreases by two-thirds relative to the calcite ν2 band (area ratio 0.21 → 0.07), and the O–H/N–H envelope decreases by 35% (1.31 → 0.84). These decreases therefore reflect both the removal of adsorbed and structural water and the partial degradation of organic matter, in proportions that cannot be determined from FTIR alone. A weak band at 1645 cm−1 is still present in ES-250; together with the C- and S-rich domains found by EDS mapping (Figure 3), this is consistent with residual organic material, but a protein assignment is not demonstrated. A sharp, weak band at ≈2980 cm−1 appears with similar intensity in all four spectra, including the geopolymers, and is therefore not attributed to the samples.
2.4. Implications for Use in Geopolymers
The characterisation above defines what the geopolymer receives. ES-250 is a fully carbonate, Mg-bearing biogenic calcite with an intact sub-micrometre vesicle network, a broad particle-size distribution and a residual S-bearing organic fraction. Unlike CaO obtained by calcination, it will not hydrate exothermically or rapidly raise the Ca2+ concentration of the activator. It is therefore expected to act as a predominantly inert or weakly reactive micro-filler and possible nucleation substrate, dissolving only partially at the high pH of the activating solution [22,24]. Possible carbonate-derived reaction products in Na-activated systems (e.g., Na–Ca double carbonates such as gaylussite or pirssonite) were therefore looked for in the XRD pattern of the hardened geopolymer (Section 2.5). The treatment avoids the CO2 released by carbonate decomposition (0.44 kg per kg CaCO3).
Representativeness of the eggshell. All domestic laying hens belong to one species, and the calcified shell of their eggs is invariably ≈95 wt% calcite [4,5]. Breed or strain, age, nutrition and housing mainly affect the thickness and ultrastructure of the shell and its contents of minor elements and organic matrix [7,45]. For example, the Ca content of shells from Araucana, Marans and Leghorn hens differed by up to 19% (30.1–35.9 wt%), and their Mg content by about 11% (0.32–0.36 wt%) [46]. The Mg content of ES-250 (0.3–0.4 wt% by EDS, Table 2; ≈1.5–2.6 mol% MgCO3 from the lattice parameters, Table 1) lies within this range. The properties that govern the behaviour of ES-250 in the geopolymer, namely a pure calcite phase that does not decompose at 250 °C, a low solubility in the activator and a negligible N2-accessible surface, are common to hen eggshell in general, so the filler-like behaviour reported here is expected to apply to eggshell from other sources. Source-dependent variables, in particular the amount of residual organic matter (and hence the S and N content) and the particle size after grinding, may, however, modify the functional response. Because a single backyard flock was used, the results should be verified with eggshells from egg-breaking plants, which pool shells from many commercial flocks.
Energy estimate. The electrical energy consumed by the laboratory oven and furnace was not metered; it would in any case not be representative, because laboratory furnaces heat small charges in large chambers with high heat losses. The thermal demand of the two routes was therefore compared on a thermodynamic basis, per kg of CaCO3, using standard enthalpies and heat capacities from [12]. Heating calcite from 25 to 250 °C requires ≈0.22 MJ kg−1 of sensible heat. Calcination at 900 °C requires ≈0.99 MJ kg−1 to heat the calcite and 1.78 MJ kg−1 for the decomposition reaction (ΔH°298 = 178 kJ mol−1); if CaO and CO2 leave the reactor hot, the demand is ≈2.6 MJ kg−1 (2.5–2.75 MJ kg−1 for 800–1000 °C). The theoretical minimum of the calcination route (1.78 MJ kg−1, with complete heat recovery) is thus ≈8 times, and the demand without heat recovery ≈12 times, that of the 250 °C treatment. Industrial lime kilns in the EU consume 3.6–7.5 GJ per tonne of lime [13], i.e., ≈2.0–4.2 MJ per kg of CaCO3 calcined, in addition to releasing 0.44 kg of process CO2. For the binder, replacing 10 wt% of the metakaolin by ES-250 removes 0.1 kg of calcined clay per kg of solid precursor, which corresponds to ≈0.21–0.45 MJ in industrial metakaolin production [31], whereas the theoretical heat demand for conditioning 0.1 kg of eggshell at 250 °C is ≈0.02 MJ. Unless the low-temperature equipment is more than an order of magnitude less efficient than a clay calciner, the substitution therefore lowers the thermal energy embodied in the solid precursor by up to ≈9%. Drying is required by both routes but is not negligible: evaporating the water retained after washing requires ≈2.7 MJ per kg of water, so that for 5–20 wt% residual moisture drying requires ≈0.25–0.65 MJ per kg of dry shell. Including drying, the low-temperature route requires ≈0.5–0.9 MJ kg−1, against ≈2.0–3.3 MJ kg−1 for drying and calcination, i.e., ≈3–6 times less; the 8–12-fold difference refers to the thermal step alone. At the binder level, after including the drying of the eggshell, the substitution lowers the thermal energy embodied in the solid precursor by ≈6–9%. The volatiles lost on conditioning (2.33 wt%) would add at most ≈0.07 MJ kg−1 if they were all water, and they must be removed in calcination as well, so they do not change the comparison. These figures cover the thermal input only. They do not include the collection, washing and grinding of the shells or the production of the alkali activator, which dominates the environmental impact of geopolymers [35], and they do not account for the different functional performance of GP-ES (Section 2.8). A life-cycle assessment based on metered energy consumption at a larger scale is required to quantify the overall benefit.
2.5. Phase Composition and Bonding in the Geopolymer Gels (XRD, ATR-FTIR)
The XRD patterns of GP-0 and GP-ES (Figure 5) both show strongly elevated, broad diffuse scattering between ≈17 and 35° 2θ, with its maximum at ≈27–28°. Relatively weak sharp reflections are superimposed on it. The diffuse contribution is characteristic of the X-ray-amorphous aluminosilicate gel formed by alkaline activation, and possibly of residual amorphous precursor [20,21]. The reference geopolymer GP-0 contains three crystalline phases, all inherited from the metakaolin [27]: quartz (ICDD 04-007-0522; ≈20.9 and 26.6°), muscovite (ICDD 00-002-0058; 19.8, ≈26.7 and 34.9°) and an iron oxide (Fe2O3, ICDD 01-085-3769; reflections near 35°, overlapping with muscovite). All three are unreactive impurities that accompany kaolinite in the parent kaolin. The same three phases are present in GP-ES, where they are joined by calcite (ICDD 04-012-8783). Calcite gives the strongest reflection of the pattern, (104) at 29.5°, together with (110) at 36.05°, (113) at 39.55°, (202) at 43.2°, (018)/(116) at 47.7/48.6° and (122) at 57.5° 2θ. These positions coincide with those of ES-250 (Figure 5, lower pattern), so the calcite comes from the eggshell. In GP-ES the figures of merit of quartz and Fe2O3 are poorer than in GP-0 (2.75–2.77 versus 1.26–1.52), because these phases are diluted and their weak reflections partly overlap with those of calcite. Their presence is nevertheless confirmed by the GP-0 pattern and, for Fe2O3, by the ≈0.3 wt% Fe detected by EDS (Section 2.6). Apart from the calcite reflections, the two patterns are practically identical, including the position and shape of the amorphous hump.
Figure 5.
XRD patterns of the reference geopolymer (GP-0), the eggshell-containing geopolymer (GP-ES) and the eggshell heat-treated at 250 °C (ES-250), normalised to their maximum and offset vertically (15–60° 2θ). C—calcite; M—muscovite; Q—quartz; F—Fe2O3. The geopolymer patterns were reconstructed from the instrument reports, where they are plotted on a square-root intensity scale, and are shown here on a linear scale.
No reflections of new crystalline phases that would indicate reaction between the eggshell calcite and the activator were resolved above the noise level. Such phases would include Na–Ca double carbonates (gaylussite, pirssonite), sodium carbonates or portlandite. The calcite (104) reflection also remains sharp and is not measurably shifted. Within the detection limit of laboratory XRD for minor phases in a largely amorphous matrix (≈1–2 wt%), ES-250 thus persists as calcite, and its dissolution in the activating solution was limited; a minor dissolution or surface reaction below this detection limit cannot be excluded. This matches the behaviour expected for CaCO3, which is far less soluble than CaO or Ca(OH)2 at high pH [22,24], and it is confirmed by the EDS maps below.
The ATR-FTIR spectra of GP-0 and GP-ES (Figure 4b, Table 3) show the typical signature of an aluminosilicate geopolymer. The main asymmetric Si–O–T stretching band lies at 988 cm−1 (GP-0) and 984 cm−1 (GP-ES), well below the ≈1080 cm−1 characteristic of metakaolin [47]. This shift is the usual indicator that Al has entered the silicate network and that geopolymerisation has occurred [21]. A weak shoulder at ≈1140–1150 cm−1 in both geopolymers points to residual unreacted metakaolin or quartz. The band-position difference (4 cm−1) is comparable to the nominal spectral resolution, so no major change in the Si–O–T bonding of the gel was detected when 10 wt% of the metakaolin was replaced by ES-250. FTIR and XRD cannot, however, resolve differences in reaction rate or degree of conversion. The bands at ≈684, ≈558 and ≈425 cm−1 (Si–O–Al and Si–O–Si stretching and bending), the broad O–H band at ≈3450 cm−1 and the H–O–H bending band at ≈1650 cm−1 are common to both samples, with similar relative intensities (O–H/Si–O–T area ratio 0.27–0.29). The two binders therefore contain comparable amounts of water.
Both geopolymers show a weak carbonate band at 1387–1394 cm−1. In GP-0 this band can only come from atmospheric carbonation of the alkaline pore solution, which forms Na/K carbonates. In GP-ES the carbonate band is ≈40% stronger relative to the Si–O–T band (area ratio 0.027 versus 0.019), shifts towards the calcite position, and the ν2 band at 874 cm−1 is more distinct. Both features reflect the additional calcite from ES-250. The calcite ν4 band overlaps with the Si–O–Al band at ≈684 cm−1 and is resolved only as a shoulder at 714 cm−1 in the second-derivative spectrum. The calcite signal is small. Because ATR probes only the outer ≈1–2 µm of the sample, this agrees with the low calcite content found by EDS in the analysed surfaces (Section 2.6). No bands attributable to proteins (amide II ≈1540 cm−1) were detected in GP-ES, which is consistent with dilution and alkaline hydrolysis of the eggshell organics.
2.6. Gel Microstructure and Calcite–Gel Interface
The SE micrographs of GP-ES (Figure 6) show a heterogeneous, particulate microstructure. Plate-like and angular grains 2–10 µm across, with stepped, layered edges typical of (meta)clay and mica particles, are covered by a flocculent layer of nanometre-scale globular particles (mostly < 0.2 µm), which also bridges neighbouring grains. This nanoparticulate morphology is characteristic of (N,K)–A–S–H gel precipitated from solution around partially dissolved metakaolin particles [21]. The high liquid/solid ratio of the mix (≈1.21 by mass) and the large amount of water supplied by the silicate and hydroxide solutions (nominal H2O/(Na2O + K2O) ≈ 13.5; Table 4) are expected to leave a significant pore volume once the free water is lost, which is consistent with the open texture observed [21]. The gel does not form a continuous, dense matrix. Open inter-particle voids of ≈0.5–3 µm are frequent, especially in Figure 6b,c, which indicate a porous, incompletely consolidated binder at the age tested. The bright, diffuse areas result from charging of the poorly conducting gel. This open, globular texture should give the material an accessible pore network, which is quantified by N2 physisorption in Section 2.7.
Figure 6.
SE micrographs of the eggshell-containing geopolymer GP-ES (10 kV, ×5000) from three areas: (a–c) plate-like and angular grains coated with nanometre-scale globular gel particles, with open inter-particle voids.
Table 4.
EDS map-sum composition of the geopolymer GP-ES on three areas (×3000) and derived atomic ratios.
The three areas have very similar compositions (relative standard deviations of 2–4% for O, Si and Al; Table 4), so the analysed regions have similar area-averaged compositions at the scale of the ≈40 × 30 µm fields; because these values include residual crystalline phases, they do not demonstrate homogeneity of the gel at the nanometre scale. The bulk atomic ratio is Si/Al = 1.51–1.53 (SiO2/Al2O3 ≈ 3.0). The alkali-to-aluminium ratio (Na+K)/Al = 0.74–0.96 is close to the value of 1 required to charge-balance tetrahedral Al in a geopolymeric framework. These are area-averaged values that include the crystalline muscovite (K-bearing, Si/Al = 1) and quartz identified by XRD, so the composition of the gel alone may differ somewhat. The measured Si/Al agrees closely with the nominal ratio of the mix (1.54; Table 4), calculated from the metakaolin and the SiO2 supplied by the sodium silicate. This indicates that the analysed areas represent the bulk formulation and that the silicate was distributed homogeneously. A Si/Al of ≈1.5 places the binder between the poly(sialate) (Si/Al = 1) and poly(sialate-siloxo) (Si/Al = 2) frameworks described by Davidovits [20]. K is distributed homogeneously (Figure 7e), consistent with its introduction through the KOH activator and its incorporation, together with Na, as a charge-balancing cation in the gel. Muscovite contributes a minor part of the K signal. Na is the dominant alkali (measured Na/K = 3.7–4.6), in line with the nominal Na/K of ≈4.6, since Na is supplied by both the sodium silicate and the NaOH solution. The measured (Na + K)/Al (0.74–0.96) matches the nominal value of 0.74 in Z3 and is slightly higher in Z1 and Z2. These are the two areas that contain Na-rich patches (see below), which suggests local alkali enrichment, e.g., by migration towards the surface during drying. The close agreement between the measured and nominal Si/Al, Na/K and (Na + K)/Al ratios shows that the EDS map-sum analyses, although semi-quantitative [43], represent the bulk binder composition well.
Figure 7.
EDS mapping of the geopolymer GP-ES (area Z1, ×3000): (a) electron image; element maps of (b) Si, (c) Al, (d) Na, (e) K, (f) Ca, (g) C and (h) Fe; (i) map-sum spectrum. The Ca- and C-rich particle in (f, g) is an embedded ES-250 calcite grain; Na is enriched in irregular patches (d). Maps of areas Z2 and Z3 are given in Figure S4.
The element maps (Figure 7) show that Si and Al are co-distributed throughout the field, with contrast variations that follow topography. Na, by contrast, is enriched in irregular patches several micrometres across in Z1 and Z2 that do not coincide with C or Ca. These are interpreted as local accumulations of activator-derived sodium (excess activator, i.e., alkali and silicate not incorporated into the aluminosilicate framework), which, if exposed to air, could be a source of efflorescence. Ca is confined to discrete, sharply bounded particles 2–5 µm in size (one in Z1, several in Z2, small ones in Z3) that coincide with C-rich spots (Figure 7f,g). These are embedded ES-250 calcite particles. Outside them the Ca signal is at background level, and the bulk Ca/Si ratio is only 0.013–0.028. There is therefore no evidence of Ca diffusion from the eggshell into the surrounding gel or of C–(A)–S–H formation at the resolution and detection limit of EDS (≈0.1 wt% Ca); smaller amounts of Ca dispersed in the gel cannot be excluded. This agrees with the XRD result that the calcite is largely preserved (Section 2.5). Within the analysed areas the eggshell behaves as a predominantly inert or weakly reactive micro-filler rather than as a dissolved Ca source.
The Ca content of the mapped areas (0.4–0.8 wt%, equivalent to 1–2 wt% CaCO3) is 3–6 times lower than the nominal value. Once the free water is lost, the hardened material should contain ≈6.7 wt% ES-250, or ≈2.6 wt% Ca (Table 4). The three fields therefore show similar area-averaged matrix compositions, but they are too few to characterise the dispersion of the ES-250 particles, which may be non-uniform. Several factors can explain the difference. Each ≈40 × 30 µm field contains only a few discrete calcite particles, so the sampling statistics are poor. Dense calcite particles (2.7 g cm−3) may have settled in the fluid paste (liquid/solid ≈ 1.21) before setting. Weakly bonded calcite grains may also be pulled out of, or bypassed by, the fracture surface. Low-magnification EDS (×100–×500) on polished cross-sections taken from the top and bottom of a specimen, or quantitative XRD with an internal standard, would distinguish between these explanations. Sulphur, which was present at up to 1.9 wt% in ES-250, was not detected in the geopolymer (≲ ≈0.1 wt%). This is expected from dilution of the S-bearing organic residues and possibly from their hydrolysis in the highly alkaline activator. The carbon signal (5.5–7.2 wt%) is far greater than the ≤0.24 wt% C that can be bound as CaCO3, and it is distributed diffusely. It is therefore attributed mainly to specimen-preparation carbon and adventitious contamination, possibly with a contribution from atmospheric carbonation of the alkaline pore solution, and is not treated quantitatively [43]. Fe (0.2–0.3 wt%) is dispersed, with a few micrometre-sized clusters in Z3, which is consistent with the minor iron oxide in the precursor.
2.7. Texture and Porosity of the Geopolymer Gels (N2 Physisorption)
Both geopolymers give Type II N2 isotherms with an H3 hysteresis loop (Figure 8a) in the IUPAC classification [42]. Uptake is low and nearly linear up to P/P0 ≈ 0.8, and there is no limiting plateau: the amount adsorbed rises steeply above P/P0 ≈ 0.9 (to 192 and 183 cm3 g−1 STP at P/P0 ≈ 0.998). The desorption branch drops sharply between P/P0 ≈ 0.97 and 0.90, and the loop closes at P/P0 ≈ 0.45–0.6. An H3 loop without a plateau is characteristic of non-rigid aggregates of plate-like particles that form slit-shaped pores, and of materials whose macropore network is not filled with condensate [42]. The textural parameters are listed in Table 5.
Figure 8.
(a) N2 adsorption (filled symbols) and desorption (open symbols) isotherms at 77 K of the reference geopolymer GP-0 and of the eggshell-containing geopolymer GP-ES. (b) BJH pore size distributions from the adsorption branch; the shaded areas mark the micropore (< 2 nm) and macropore (>50 nm) ranges. Above ≈100 nm the distributions are limited by the maximum relative pressure reached and are not directly comparable.
Table 5.
Textural properties of the geopolymers from N2 physisorption at 77 K.
Correlation with the SEM microstructure. Several independent features of the physisorption data match the microstructure observed by SEM (Figure 6). First, the H3 hysteresis is the signature of aggregates of plate-like particles, which is exactly what the micrographs show: plate-like and angular grains 2–10 µm across, bridged and coated by gel. Second, SBET is almost entirely an external surface. The t-plot external area accounts for 93% of SBET for GP-0, and the micropore volume is negligible. For GP-ES, the t-plot external area (35.7 m2 g−1) exceeds SBET by 13% and the micropore intercept is negative. An external area larger than SBET is not physical; it arises from the different assumptions of the two methods (thickness equation and fitting range of the t-plot versus the BET monolayer model) and indicates that no micropore volume is resolved for GP-ES, without quantifying the micropore area. The result is also sensitive to the fitting range: over t = 0.50–0.80 nm, the intercept of GP-ES becomes slightly positive (≈0.0009 cm3 g−1) and the external area falls to ≈29 m2 g−1. The adsorbing surface is therefore the outer surface of the gel particles rather than an intraparticle micropore network. Third, the BET-equivalent particle diameter (70–76 nm) is consistent with the size of the globular gel particles that coat the grains in Figure 6 (mostly < 0.2 µm). Fourth, 60–71% of the BJH pore volume lies between 20 and 100 nm, with a mode at ≈70–85 nm. For a random packing of particles of ≈70–200 nm, the interstitial voids are expected to be a fraction (≈0.2–0.6) of the particle diameter, i.e., tens of nanometres to ≈100 nm. The meso- and small macropores measured by N2 are thus best explained as the interstices between packed gel nanoparticles and between gel-coated plates.
The N2-accessible porosity is high, ≈41% for both materials, in line with the high liquid/solid ratio (≈1.21) and the large water content of the mix (Table 4). This value covers only pores up to ≈150–300 nm. The micrometre-sized inter-particle voids (≈0.5–3 µm) visible in Figure 6b,c are beyond the range of N2 capillary condensation, and the absence of a plateau at P/P0 → 1 confirms that the largest pores are not filled. The total open porosity of the geopolymers is therefore higher than 41%, and ≈41% should be regarded as the nano- and mesoscale porosity of the gel. The skeletal density measured for GP-ES (2.50 g cm−3) is higher than expected from the calcite addition alone (≈2.40 g cm−3 for 6.7 wt% calcite in a binder of 2.38 g cm−3), which suggests that the two powders differed in drying state or bound-water content during pycnometry; values calculated with a common density are therefore also given in Table 5 (footnote b).
Effect of the eggshell. Adding ES-250 changes the pore volume and the porosity very little (Vp −4%, VBJH unchanged, ε ≈ 41% in both), but it decreases SBET by 12.7% (36.2 → 31.6 m2 g−1). No micropore volume is resolved for GP-ES by the t-plot (negative intercept), whereas GP-0 shows a small one (2.7 m2 g−1, 0.0012 cm3 g−1); given these small values and the sensitivity of the t-plot to the fitting range, this difference is indicative only. The C constant decreases (175 → 53) and the texture coarsens slightly (4V0.95/SBET 10.4 → 11.6 nm; 4Vp/SBET 32.7 → 35.8 nm; dBET 70 → 76 nm). A simple balance accounts for most of the loss of surface area. Once the free water has been lost, ES-250 makes up ≈6.7 wt% of the hardened material. Because ES-250 itself has an SBET of only 0.35 m2 g−1 (Table 1), its contribution (≈0.02 m2 g−1) is negligible, and dilution alone would reduce SBET by ≈2.4 m2 g−1, to ≈33.8 m2 g−1. A loss of the small micropore area of GP-0 would account for a further ≈2.7 m2 g−1. Together these give ≈5.1 m2 g−1, close to the observed decrease of 4.6 m2 g−1. The 12.7% difference is much larger than the BET-fit uncertainties (±0.3–0.6%), but each material was measured once, so its reproducibility, typically a few per cent for BET, was not assessed. The lower activator/metakaolin ratio of GP-0 (Section 4.2) may also contribute to the difference in gel texture. The lower C constant is consistent with the loss of the high-energy micropore sites [42]. The intracrystalline vesicles of ES-250 contribute negligibly to the pore volume. Calcite occupies ≈0.025 cm3 per gram of hardened material, and with a vesicle fraction of ≈3–4% this corresponds to <0.001 cm3 g−1, i.e., <0.5% of Vp. Consistent with the SEM-EDS observation of discrete, sharply bounded calcite particles without reaction rims, there is also no evidence of additional interfacial porosity around the eggshell particles.
Influence of the activator/metakaolin ratio. Because the activator masses were kept constant, GP-ES contains 11% more activator per unit of metakaolin than GP-0 (Table 4). More alkali per unit of metakaolin is expected to increase the degree of dissolution of the precursor and to leave more unreacted alkali in the binder. The Na-rich patches and the higher (Na + K)/Al (up to 0.96) in two EDS areas of GP-ES (Section 2.6) are consistent with the latter, whereas the Si–O–T band position and the area-averaged Si/Al did not change measurably (Section 2.5 and Section 2.6). The higher alkali content may also have changed the size of the gel particles, so part of the 12.7% decrease in SBET may be due to the activator ratio rather than to the filler. For the antibacterial response, an alkalinity effect would be expected to increase, not decrease, the activity of GP-ES, and its suspension pH remained nearly neutral (Section 2.8); the change in ratio may, however, modify the surface chemistry of the gel. The present data cannot separate these contributions from those of the calcite particles. A control mix with the activator scaled to the metakaolin content, without eggshell or with an inert filler of similar particle size (e.g., quartz), would do so.
Overall, ES-250 acts as a dense micro-filler that slightly coarsens the gel texture without changing the total nano- and mesoporosity. For the antibacterial function (Section 2.8), this means that both materials offer a similar, highly accessible pore network (≈41% porosity, 32–36 m2 g−1) for contact with the test medium and the release of soluble species. Differences in antibacterial response are therefore unlikely to arise from differences in porosity.
2.8. Antibacterial Activity
The results of the duplicate E. coli test are summarised in Table 6 and Figure 9, and the plates are shown in Figure S2. The negative controls were sterile throughout. The two parallel sets are technical duplicates prepared from the same inoculum (Section 4.8). Their counts agreed closely (coefficient of variation ≤ 9%, with no extra-Poisson dispersion; χ2 p ≥ 0.6), so the Poisson intervals are a realistic measure of the counting uncertainty; the variability between independent experiments is not captured by them. The positive control decreased from 83 to 68.5 and 30 CFU mL−1 after 0.5, 4 and 24 h, which reflects the gradual loss of viability of E. coli in distilled water.
Table 6.
Viable counts (CFU mL−1) after contact of the E. coli suspensions with 2 mg of powder in 10 mL (0.2 g L−1) and reduction R relative to the positive control at the same contact time.
Figure 9.
Viable E. coli counts after 0.5, 4 and 24 h of contact with 0.2 g L−1 of GP-0, GP-ES and ES-250 powders (technical duplicates). Filled symbols: means; open symbols: individual replicates; error bars: 95% Poisson confidence intervals of the pooled counts. Symbols are slightly offset horizontally for clarity.
Reference geopolymer. GP-0 strongly reduced the culturable E. coli. The counts fell by 53.6% within 0.5 h (38.5 versus 83 CFU mL−1), and no colonies were recovered from either replicate after 4 and 24 h (R = 100%; ≥1.8 and ≥1.5 log, limited by the inoculum). All three reductions far exceed the counting uncertainty of this experiment (p < 10−8). The kinetics agree with the 29.8, 98.8 and 100% reductions reported for the same geopolymer in [27].
Suspension pH. The loss of culturability is not associated with bulk alkalinity. At the test dose, the uninoculated suspensions had pH 6.51 (GP-0), 6.66 (GP-ES) and 6.62 (ES-250), against 6.70 for the sterile water. The alkali of the hardened geopolymer is mostly bound as charge-balancing cations in the gel, and the free alkali released by 2 mg of powder is evidently too small to raise the pH of 10 mL of water. The alkaline-stress mechanism usually invoked for alkaline materials [48] and for unmodified geopolymers [26] therefore cannot explain the results at this dose. The slightly lower pH of GP-0 (−0.19 units) is close to the limit of reliable measurement in unbuffered, low-ionic-strength water, but it may reflect weakly acidic surface hydroxyl groups (Si–OH, Si–OH–Al) of the aluminosilicate gel. It more probably arises from direct contact between the cells and the gel particles, for example, through local pH or ionic-strength gradients at the particle surface that the bulk measurement does not capture, or through interaction of the cell envelope with the Al-bearing, nanometre-scale globular gel (Section 2.6). Adhesion of cells to the particles could also lower the colony counts without killing, because a particle carrying several cells forms a single colony on the membrane. The complete absence of colonies after 4 h, when any particle carrying viable cells would still produce a colony, makes aggregation an unlikely explanation for the 4 h result. Adhesion of cells to particles that do not release them on the membrane, or sublethal injury that prevents growth, cannot be excluded, however, because recovery controls and live/dead staining were not performed. The results therefore demonstrate a loss of culturability rather than a directly verified bactericidal effect.
Eggshell alone. ES-250 reduced the E. coli counts by only 13–19%, which is not significant at any contact time (p ≥ 0.07). This agrees with the phase and spectroscopic data. ES-250 is pure calcite, with no CaO or Ca(OH)2 (XRD, FTIR), and its suspension was not alkaline (pH 6.62). It therefore cannot act like calcined eggshell and shell powders, whose antibacterial action is attributed to CaO/Ca(OH)2 and high pH [14,15]. The residual organic matrix detected by FTIR and EDS does not confer measurable activity at this dose.
Eggshell-containing geopolymer. Replacing 10 wt% of the metakaolin with ES-250 largely suppressed the reduction in culturable E. coli observed with the geopolymer. In the same test, with the same inoculum and controls as GP-0, GP-ES reduced the E. coli counts by 34.3% at 0.5 h (p < 0.001), but by only 21.9 and 25.0% after 4 and 24 h (not significant), whereas GP-0 had eliminated all culturable cells by 4 h (Figure 9 and Figure S2). GP-ES therefore behaves almost like ES-250 alone, with at most a small residual effect at short contact times. The loss of activity cannot be explained by a change in the accessible pore structure, because the porosity and total pore volume are similar (Section 2.7). Simple dilution is also unlikely to account for it: calcite makes up only ≈6.7 wt% of the hardened GP-ES, so a binder diluted by this amount would still be expected to reduce the culturable E. coli almost completely within 4 h. This argument assumes that the activity scales smoothly with the amount of binder; a steep dose threshold close to the test dose (0.2 g L−1) cannot be excluded without a dose–response test of GP-0. GP-ES also contains ≈11% more alkali per Al than GP-0 (Table 4). Its suspension pH (6.66) was slightly higher than that of GP-0 (6.51), so carbonate buffering of a bulk alkalinity is not involved either. The loss of activity of GP-ES was examined with respect to three possible causes. Alkalinity. The suspension pH was nearly neutral for all materials (6.51–6.66), so bulk alkalinity explains neither the activity of GP-0 nor its loss in GP-ES; local pH gradients at particle surfaces were not measured. Ion release. At the test dose, GP-ES contains ≈0.13 mg of calcite per 10 mL, which can release at most ≈0.13 mmol L−1 Ca2+. ES-250 alone could release more Ca2+ and was inactive, so calcite is not antibacterial by itself. A Ca2+-mediated protection of the cells, e.g., by stabilisation of the lipopolysaccharide layer of the outer membrane [49], is consistent with these observations but was not demonstrated, because dissolved ions were not measured. Surface interactions. Adsorption of Ca2+ and carbonate on the negatively charged gel, and the 11% higher activator/metakaolin ratio of GP-ES (Section 2.7), may change the gel surface that interacts with the cells; this also remains a hypothesis. A test of GP-0 with dissolved CaCl2 at the same Ca2+ concentration, together with ion analysis, zeta potential and live/dead staining, would distinguish these mechanisms.
These results have a clear practical implication. The metakaolin geopolymer itself strongly reduced the culturable E. coli at a dose as low as 0.2 g L−1, without raising the pH of the surrounding water. Decarbonation-free eggshell, although attractive as a biogenic filler whose preparation avoids carbonate decomposition, does not add antibacterial function and, when it replaces 10 wt% of the metakaolin, the activity of the binder is largely lost. Where antibacterial performance is required, the eggshell dosage must be limited, or the eggshell must be combined with an active agent.
2.9. Methylene Blue Removal in the Dark and Under UV Irradiation
Spectral correction. All supernatants showed a non-zero absorbance at 790 nm: 0.13–0.25 for GP-0 and 0.24–0.38 for GP-ES in the dark, and 0.37–0.42 for GP-0 and 0.24–0.32 for GP-ES under UV. It is caused by fine geopolymer particles that passed the filter. Without correction, this extinction adds to the MB band and lowers the apparent removal. For GP-0 in the dark, the uncorrected A664 gives 42.4% removal, the value reported in [27], whereas the corrected value is 51% (Table 7). The uncorrected spectra of all four series are shown in Figure S5. The corrected spectra (Figure 10a–d) show the MB monomer band at 663–664 nm with its vibronic shoulder at ≈612 nm and a flat baseline above 720 nm.
Table 7.
Methylene blue removal by the geopolymers (0.1 g in 100 mL, 15 mg L−1) from the scattering-corrected absorbance at 664 nm; t counted after a 30 min dark pre-contact.
Figure 10.
Methylene blue removal by GP-0 and GP-ES in the dark and under UV-A irradiation (0.1 g in 100 mL, 15 mg L−1; t counted after a 30 min dark pre-contact). Scattering-corrected spectra of the filtered supernatants: (a) GP-0, dark (data of [27], re-evaluated); (b) GP-ES, dark; (c) GP-0, UV; (d) GP-ES, UV; dotted lines mark 590 and 664 nm. Corrected A664 relative to t = 0 with pseudo-first-order fits, comparing GP-0 and GP-ES (e) in the dark and (f) under UV; (f) also shows the MB solution without powder under UV (A700). Single runs; the decrease after 160 min (relative to t = 0) and the apparent rate constants are given in the legends and in Table 7.
Removal in the dark. Figure 10a,b,e compares the two geopolymers in the dark. Both removed MB continuously over 160 min (Table 7). The t = 0 aliquots, taken after the 30 min pre-contact, already absorbed much less than the MB solution alone (A700 = 0.16 for GP-0 and 0.12 for GP-ES, against 0.23), so part of the dye was taken up during the pre-contact. The values of η therefore describe the decrease within the monitored interval, not the total removal efficiency. Relative to t = 0, the MB band decreased by 51% for GP-0 and by 64% for GP-ES, with apparent constants of 0.0045 and 0.0064 min−1. GP-0 started slowly (2% in the first 20 min), whereas GP-ES decreased by 20% in the same interval. The two runs, however, started from different A0 (1.72 and 1.36), so the relative decrease is not a direct measure of the amount removed. The absolute decrease in the corrected A664 over 160 min was the same for both materials (ΔA = 0.873). The corrected spectral signal therefore decreased by a similar amount for both materials. Because the proportionality between absorbance and MB concentration was not verified with a calibration curve, and because the runs differ in A0 and were single determinations, this similarity of the spectral change is not a demonstrated equality of the amounts of dye adsorbed. In particular, they give no indication that the GP-ES formulation lowers the dye removal, even though its SBET is 12.7% lower (Section 2.7). The cationic dye is expected to bind mainly to the negatively charged aluminosilicate gel, by exchange with Na+ and K+; binding to the residual organic matter of the eggshell (Section 2.3) or to the calcite surface may also contribute, but these contributions were not resolved here. In the dark, the band-shape index remained at 0.32–0.36 for both materials (Figure S3a) and the maximum did not shift, which is consistent with the removal of the intact monomer by adsorption, without aggregation in solution or chemical transformation.
Effect of UV irradiation. The MB solution without powder was stable under UV (A700 within 0.94–1.03 of its initial value; Figure 10f and Figure S3b), so direct photolysis was negligible at this wavelength. The shoulder at ≈610 nm of the same solution, however, increased progressively during irradiation (Figure S3b), which may reflect warming or evaporation of the solution or a change in dye aggregation; because the band maximum exceeded the detector range, this change could not be quantified, and the stability of the control is established only on the flank of the band. With GP-0, the decrease under UV reached 79% and the apparent constant was about twice that in the dark (0.0091 against 0.0045 min−1). These two GP-0 runs, however, started from very different absorbances after the same 30 min dark pre-contact (A0 = 1.72 in the dark run of [27] and 0.86 in the UV run), which shows that the run-to-run variability of the uptake is at least as large as the differences between the conditions; the comparison of the rate constants is therefore qualitative. The spectra also changed shape (Figure 10c). The 664 nm band decreased faster than its short-wavelength side, the maximum shifted from 664 to 661 nm, and A590/A664 rose from 0.35 to 0.64. These changes did not occur in the dark. They are consistent with the stepwise oxidative N-demethylation of MB to azure B, azure A, azure C and thionine, whose maxima lie at ≈648, 633, 620 and 598 nm [50], but A590/A664 also increases when the dye aggregates. A further contribution may come from MB adsorbed, and partly aggregated, on fine particles that passed the filter; this would affect most strongly the GP-0 UV series, which had the highest extinction at 790 nm (0.37–0.42) and the lowest final A664 (0.18). The data therefore show that, under UV-A, a process other than simple adsorption contributes to the spectral changes observed with GP-0, but they do not identify it: N-demethylation of MB, aggregation of the dye at particle surfaces and dye adsorbed on fine particles that passed the filter are all compatible with the observations. Haematite inherited from the metakaolin (Section 2.5; [51]) might act as a photoactive phase, but this remains a hypothesis. Desorption of the adsorbed dye, product analysis (e.g., LC-MS), TOC measurements and scavenger tests would be needed to distinguish adsorption from transformation quantitatively. With GP-ES, the decrease under UV was 71% (k = 0.0069 min−1), close to the dark values of the same material (64%, 0.0064 min−1), and A590/A664 increased only from 0.34 to 0.45 (Figure S3a). Under UV, GP-ES thus showed a smaller decrease and a smaller spectral change than GP-0 (Figure 10f). Because these are single runs with different A0 and the uncertainties of k describe only the fit, these differences are trends and are not statistically demonstrated. They suggest that the possible UV-assisted transformation observed for GP-0 is attenuated in the GP-ES formulation. Possible reasons, which remain to be tested, are the dilution of photoactive constituents by calcite, the lower metakaolin content of GP-ES and the scavenging of hydroxyl radicals by carbonate released at the calcite surface [52]. The 140 min point of the GP-ES UV series deviates upwards (A664 = 0.675 against 0.553 at 120 min), which lowers the quality of the linear fit (R2 = 0.89).
2.10. Comparison with Previous Studies
Previous studies on eggshell in alkali-activated binders used raw or calcined eggshell powder and focused on mechanical and high-temperature performance: in one-part metakaolin binders [28], in metakaolin geopolymer concrete [29], in fly-ash-based lightweight panels [40] and in geopolymer-stabilised soil [39]. Our previous study [27] used marine shells calcined at 900 °C in the same metakaolin geopolymer. The present work differs from these studies in three respects. First, it uses an intermediate, decarbonation-free conditioning step and quantifies its effect on the biogenic calcite. Second, it examines the calcite–gel interface and the texture of the gel. Third, it relates these to functional properties, dye removal and antibacterial activity, of the same binder. Table 8 summarises these differences.
Table 8.
Comparison of the present eggshell-modified geopolymer with related systems.
Table 8 compares the present results with those of our earlier study on the same metakaolin geopolymer system modified with calcined marine shells [27], and with representative literature on eggshell and carbonate additions to alkali-activated metakaolin and on shell-derived antibacterial materials.
Calcined versus decarbonation-free shells. The comparison with [27] concerns the same binder, but the additives differ in origin (marine shells versus hen eggshell), dosage (2.5 versus 10 wt%) and calcination state, so it does not isolate the effect of any single variable. Shells calcined at 900 °C introduce reactive CaO. In the alkaline paste this hydrates to Ca(OH)2, supplies dissolved Ca2+ and partly recarbonates to calcite or aragonite. In [27] this produced Ca distributed throughout the gel (EDX Ca/Si = 0.12–0.16, attributed to hybrid C–(N,K)–A–S–H), a 1.8–2.6-fold increase in SBET and a shift in the mean BJH pore diameter from 35 to 12–17 nm, even at only 2.5 wt% addition. In contrast, ES-250, at a four-fold higher dosage, remained as discrete calcite particles and left the pore volume practically unchanged (Section 2.6 and Section 2.7). The calcination state is likely to be a major factor in whether a shell additive acts as a reactive, pore-refining modifier or as an inert micro-filler, although the differences in origin and dosage also contribute. Only the reactive form achieves the textural gains of [27], and it does so at the cost of ≈0.44 kg CO2 per kg of CaCO3 and of the 900 °C heat treatment. The filler-like behaviour of ES-250 agrees with earlier observations that calcite and limestone additions to metakaolin geopolymers dissolve only to a limited extent and act mainly as fillers and nucleation substrates [36,37]. Omur et al. [28] reported C–A–S–H formation and strength gains with up to 40% eggshell in a one-part metakaolin binder, which suggests that eggshell calcite may become more reactive under different activation conditions (solid activator, higher dosage, longer curing). In metakaolin-based geopolymer concrete, the best mechanical and high-temperature performance was obtained when eggshell powder replaced 25 wt% of the metakaolin [29]. The mechanical properties of GP-ES were not measured here and should be determined.
Antibacterial response. The strong and rapid reduction in culturable E. coli by the unmodified geopolymer is reproducible. In [27], the reference GP reduced the recoverable colonies by 29.8, 98.8 and 100% after 0.5, 4 and 24 h. In the present duplicate test, GP-0 gave 53.6, 100 and 100%, and an earlier screening series gave the same ranking (Table S1). Every shell-derived calcium additive examined so far weakened this effect. With the five calcined shells of [27], the reduction at 4 h fell from ≈99% to 0–20%, and only two formulations recovered to 84% after 24 h. With the decarbonation-free ES-250 (this work), the reduction at 4 h fell to 22% (not significant). Taken together, and with the caveat that the additives also differ in origin and dosage, these six additives are compatible with a common, Ca-related suppression mechanism rather than a textural one; this is a possible explanation that the comparison itself cannot test. The candidate mechanisms are discussed in Section 2.8. The calcined shells increased the surface area and pore volume, whereas ES-250 left them almost unchanged, yet both suppressed the rapid reduction in culturable cells. This differs from disk-diffusion tests on metakaolin geopolymers, in which the inhibition was attributed to the alkaline environment created by activation [26]; in such tests, the local amount of material, and hence of released alkali, is much higher than at 0.2 g L−1. The partial recovery seen after 24 h with some calcined shells [27] may be linked to residual Ca(OH)2, whose high pH is known to be bactericidal [14,15]. Pure calcite, as in ES-250, lacks both. Consistent with this, ES-250 alone was inert at 0.2 g L−1, whereas calcined eggshell (CaO nanoparticles, 700 °C) produced 18–20 mm inhibition zones at 3 g L−1 [15], and heated shell powders are bactericidal because they generate Ca(OH)2 [14]. The present results thus confirm, with a direct control, the conclusion of [27] that shell-derived calcium does not act as an antimicrobial agent in these geopolymers. They extend it by showing that the activity of the binder is largely lost when non-calcined, calcitic eggshell replaces 10 wt% of the metakaolin.
Dye removal. In [27], the shells calcined at 900 °C raised the dark MB removal of the same geopolymer from 42.4% to 62–64% (uncorrected absorbance), together with a 1.8–2.6-fold increase in SBET. On the same uncorrected basis, GP-ES removed 53% (Table 8), and after correction the decrease in its corrected MB signal was similar to that of GP-0 (Section 2.9). Within the limits of these single-run tests, decarbonation-free eggshell therefore does not appear to lower the dye removal of the binder, but it does not enhance it either, consistent with its role as an inert filler, whereas calcined shells enhance it through pore refinement. Under UV, the spectral changes attributed to a possible photo-assisted transformation of MB were much weaker with GP-ES than with the plain geopolymer. For geopolymers intended for photo-assisted dye removal, this effect would have to be offset, e.g., by a photocatalytic phase such as ZnO [51].
Structure–property relationships. Taken together, the results link the state of the filler to the behaviour of the gel. Because the 250 °C treatment leaves the calcite intact (Section 2.1), ES-250 dissolves little in the activator and remains as discrete particles without detectable Ca enrichment of the surrounding gel (Section 2.5 and Section 2.6). The gel therefore keeps a similar Si–O–T bonding and similar area-averaged composition, and its texture changes mainly by dilution: SBET decreases by 12.7%, whereas the total pore volume and porosity remain similar (Section 2.7). The functional properties follow different patterns. The dark dye removal, which depends mainly on the accessible gel surface and its cation-exchange sites, changed little in the single-run tests, whereas the UV-induced spectral changes and the reduction in culturable E. coli, which may depend on minor surface-active constituents and on the surface chemistry of the gel, were strongly attenuated in the GP-ES formulation. This contrast suggests that, for these two functions, the surface chemistry of the gel matters more than its texture. This remains a hypothesis to be tested with surface-sensitive methods (zeta potential, XPS, ion release).
Limitations. The conclusions of this study are subject to the following limitations. One eggshell source (a single backyard flock) and one replacement level (10 wt%) were examined. The substitution also changed the activator/metakaolin ratio (Section 2.7). Each material was measured once by N2 physisorption. The MB tests were single runs without a calibration curve, and the antibacterial test used technical duplicates of one experiment with a single strain (E. coli). The thermogravimetric behaviour of the eggshell (TGA), its particle-size distribution, skeletal density and water absorption, the dissolved ions and the mechanical properties were not measured. The mechanisms proposed for the loss of antibacterial activity and for the UV behaviour of MB therefore remain hypotheses to be tested.
3. Conclusions
This work showed that hen eggshell can be incorporated into metakaolin geopolymer gels through a low-temperature route that avoids decarbonation. The main conclusions are as follows:
- Conditioning at 250 °C (2 h), after drying at 150 °C, yields a pure biogenic calcite. XRD detected no CaO, portlandite or other decomposition products, and the lattice parameters (Mg-bearing calcite, ≈1.5–2.6 mol% MgCO3), coherent domain size and microstrain did not change between 150 and 250 °C. The intracrystalline vesicles (median 0.18 µm) and part of the organic matrix were preserved.
- The route avoids 0.44 kg of process CO2 per kg of CaCO3. Its theoretical heat demand, including drying, is ≈3–6 times lower than that of a drying–calcination route (8–12 times for the thermal step alone). Replacing 10 wt% of the metakaolin lowers the thermal energy embodied in the solid precursor by ≈6–9%; a life-cycle assessment based on metered energy consumption is still required.
- In the geopolymer, ES-250 acts as an inert or weakly reactive micro-filler. It remained as discrete 2–5 µm calcite particles, without new crystalline phases or detectable Ca diffusion into the (N,K)–A–S–H gel (Si/Al ≈ 1.5), and the Si–O–T bonding of the gel was unchanged.
- The texture of the gel was largely preserved: the total pore volume and the N2-accessible porosity (≈41%) were unchanged, and the BET surface area decreased by 12.7%, mostly by dilution.
- The functional response depended on the property. Dye uptake in the dark was maintained in single-run tests, whereas the UV-induced spectral changes in methylene blue were weaker. The rapid loss of culturable E. coli caused by the plain geopolymer (no colonies after 4 h at 0.2 g L−1) was largely suppressed in GP-ES (22–34% reduction), and ES-250 alone was inert.
- Low-temperature-conditioned eggshell is therefore suitable as a decarbonation-free filler where the structure and texture of the gel must be maintained, but not where antibacterial activity is required. Future work should address the mechanical properties, the optimisation of the conditioning temperature, particle size and dosage, eggshell from other sources, replicated functional tests with calibration, other bacterial species, and the mechanism of the lost antibacterial activity.
4. Materials and Methods
4.1. Eggshell Collection and Thermal Conditioning
Hen eggshells (Gallus gallus domesticus) were collected in May 2024 from a single backyard flock of free-range, one-year-old laying hens of a common, non-commercial breed in Mioveni (Argeș County, Romania). Because eggshell composition depends on the breed or strain, age and nutrition of the hens [45,46], the shells were taken from this single documented source and processed as one pooled batch. They were washed thoroughly with tap water and then distilled water to remove residual albumen, loose contamination and the shell membranes, dried at 150 °C for 5 h in a laboratory oven (Biobase Bioland Co., Ltd., Jinan, China), and ground manually in an agate mortar (batches of ≈25 g), without subsequent sieving; agate was used to avoid contamination from the milling media. This material is designated ES-150. The drying conditions (150 °C, 5 h, ambient air) were not optimised. They were chosen to remove free and adsorbed water while remaining below the main degradation range of the organic matrix (≈250–600 °C) [11], and to exceed the standard dry-heat sterilisation schedule at this temperature (150 °C, 150 min) [18]. The grinding was not optimised for a target particle size; the particle size of the resulting powder is characterised in Section 2.2. A portion of ES-150 was heat-treated at 250 °C in a Mikrotest MKF-05 muffle furnace (Mikrotest, Ankara, Türkiye; air atmosphere, heating rate 10 °C min−1, dwell time 2 h, furnace cooling) and is designated ES-250. A 25.007 g batch of ES-150 weighed 24.425 g after conditioning, i.e., the mass loss at 250 °C was 0.582 g (2.33 wt%). The 250 °C step is a thermal conditioning, not a calcination. It was chosen to remain far below the decomposition temperature of calcite (≈650–700 °C), so that no CaO is formed (confirmed by XRD, Section 2.1), while removing water and the most labile organic fraction. The conditioning temperature was not optimised; a systematic series (e.g., 150–400 °C) is planned.
4.2. Geopolymer Synthesis
Metakaolin was obtained by calcining kaolin (Naturall Home, Salonta, Romania) at 750 °C for 2 h in a Mikrotest MKF-05 muffle furnace, as described in [27]; it consists of amorphous metakaolin with minor quartz, muscovite and haematite [27,51]. The activator combined sodium silicate solution (Kynita SRL, Bârza, Romania; ≥31.1 wt% SiO2, ≥13.7 wt% Na2O, molar SiO2/Na2O = 2.2–2.5, density 1.50–1.56 g cm−3, according to the supplier’s technical data sheet) with 8 M NaOH and 8 M KOH solutions, prepared from reagent-grade NaOH and KOH pellets (Sigma-Aldrich, St. Louis, MO, USA) and cooled to room temperature before use. The reference geopolymer GP-0 was prepared from 50 g metakaolin, 42.375 g sodium silicate solution, 9 g 8 M NaOH and 9 g 8 M KOH, i.e., with the same proportions as the unmodified geopolymer (GP) of [27]. GP-0 is a metakaolin-based geopolymer with a mixed (Na,K) activator and a nominal Si/Al of ≈1.5, i.e., between the poly(sialate) and poly(sialate-siloxo) frameworks [20]. Its proportions were set to obtain this Si/Al by adding SiO2 through the sodium silicate, to keep (Na2O + K2O)/Al2O3 below 1 and so limit free alkali, and to give a castable paste (liquid/solid ≈ 1.21). The resulting nominal ratios (Table 9) lie within the range studied for metakaolin geopolymers [53]. The activator concentrations (8 M NaOH and 8 M KOH) and proportions were not optimised in this work. They were kept identical to those of the reference geopolymer of [27,51], so that the effect of the eggshell substitution could be isolated, and they lie within the range commonly used for (meta)kaolin geopolymers [54]. In the eggshell-containing geopolymer (GP-ES), 5 g ES-250 replaced 5 g (10 wt%) of the metakaolin (45 g metakaolin + 5 g ES-250), while the masses of all activator solutions were kept constant (Table 9). The replacement level of 10 wt% was chosen to be high enough for the eggshell to be detected in the hardened binder and to affect its texture and functions measurably (four times the 2.5 wt% of calcined shells used in [27]), and low enough to keep the paste castable at constant liquid/solid ratio and to stay well below the 25–40 wt% at which eggshell has been used in metakaolin binders [28,29]. Only one level was tested (see Section 2.10, Limitations). The total solid mass and the liquid/solid mass ratio (≈1.21) are therefore identical in the two mixes, and ES-250 accounts for ≈4.5 wt% of the fresh paste. Because ES-250 replaced part of the reactive precursor, the activator/metakaolin mass ratio increases from 1.21 to 1.34 (+11%), and the nominal Si/Al, SiO2/Al2O3 and (Na2O + K2O)/Al2O3 ratios of GP-ES are 3–12% higher than those of GP-0 (Table 9). The effects reported for GP-ES therefore reflect the substitution, i.e., the presence of ES-250 particles together with the resulting change in the activator-to-metakaolin ratio; a control mix with the same activator/metakaolin ratio was not prepared. For both mixes, the solids (metakaolin, or metakaolin and ES-250) were dry-blended, the NaOH and KOH solutions were added gradually under mechanical stirring, followed by the sodium silicate, and mixing continued until a homogeneous, agglomerate-free paste was obtained. The pastes were cast into cylindrical moulds (Ø 4 cm), sealed with polyethylene film, cured at 60 °C for 24 h and then kept sealed at 23 ± 2 °C for 28 days, following the protocol of [27]. The preparation route is summarised in Scheme 1. GP-0 is the same material as the GP of [27]; its N2 physisorption data and part of its XRD and FTIR characterisation were reported in [27] and are reproduced here for direct comparison. GP-0 and GP-ES were prepared in the same synthesis series as the materials of [27], from the same metakaolin and the same NaOH, KOH and sodium silicate solutions, and were cured and stored under identical conditions; only the N2 physisorption of GP-ES was measured at a later date.
Scheme 1.
Preparation of the reference geopolymer GP-0 and of the eggshell-containing geopolymer GP-ES. ES-250 (5 g) replaced 10 wt% of the metakaolin in GP-ES; the activator masses were identical in both mixes.
Table 9.
Mix design of the reference geopolymer GP-0 [27] and of the eggshell-containing geopolymer GP-ES, in which ES-250 replaced 10 wt% of the metakaolin at constant activator masses, with nominal molar ratios.
4.3. X-Ray Diffraction
X-ray diffraction (XRD) patterns of ES-150 and ES-250 were recorded on a Rigaku Ultima IV diffractometer (Rigaku Corporation, Tokyo, Japan) under identical conditions: Cu Kα radiation (45 kV, 40 mA), 1.00 mm incident slit, no diffracted-beam monochromator, D/teX Ultra 1D silicon strip detector, continuous 2θ/θ scan over 20–115° 2θ at 1° min−1 with a 0.02° step. Phases were identified with PDXL 2 software (Rigaku Corporation, Tokyo, Japan) against the ICDD PDF-5+ 2026 database (International Centre for Diffraction Data, Newtown Square, PA, USA; calcite, card 04-008-0788). Both patterns were refined over the full range by whole-powder-pattern fitting with a structural model of calcite (Rietveld-type refinement in PDXL; space group R-3c, Z = 6, 16 refined parameters): B-spline background, split pseudo-Voigt profile with Caglioti-type FWHM parameters (U, V, W), asymmetry and axial-displacement corrections, March–Dollase preferred orientation along (104), lattice parameters, the O x coordinate and isotropic displacement parameters. The apparent crystallite (coherent domain) size D and microstrain ε were estimated by the Williamson–Hall method [55] from the breadths of the fitted reflections. No instrumental-profile standard was measured, so D and ε are apparent values; because both samples were measured and refined in the same way, they can, however, be compared with each other. The hardened geopolymers GP-0 and GP-ES were ground and measured on the same instrument (45 kV, 40 mA, 10–85° 2θ, 2° min−1, step 0.05°), as in [27], and their patterns were evaluated qualitatively (PDXL search–match, ICDD PDF-5+ 2025).
4.4. Scanning Electron Microscopy and Energy-Dispersive X-Ray Spectroscopy
Secondary-electron images of ES-250 were acquired on a Hitachi SU5000 field-emission SEM (Hitachi High-Tech, Tokyo, Japan; upper SE detector, 10 kV, working distance 4.8–5.0 mm, ×5000). The powders were mounted on conductive carbon tape and examined uncoated. Elemental maps and map-sum spectra were collected at ×3000 on three areas (Z1–Z3) with an energy-dispersive spectrometer (Oxford Instruments, High Wycombe, UK) controlled by AZtec software 6.1 (Tru-Q quantification). The hardened geopolymer GP-ES was examined in the same way, on uncoated fracture surfaces: SE images at ×5000 (10 kV, working distance 5.0–5.1 mm) on three areas, and EDS maps with map-sum spectra at ×3000 on three further areas (Z1–Z3; C, O, Na, Al, Si, K, Ca, Fe). Because the specimens were rough and partly charging, EDS results for light elements (C, O) are considered semi-quantitative [43].
4.5. ATR-FTIR Spectroscopy
ATR-FTIR spectra of ES-150, ES-250, the reference geopolymer GP-0 and GP-ES were recorded on a Bruker Tensor 27 spectrometer (Bruker Optik GmbH, Ettlingen, Germany) with an attenuated total reflectance accessory with a diamond crystal, accumulating 32 scans per spectrum, as in [27], over 4000–350 cm−1 at 4 cm−1 resolution, and are reported in absorbance units (OPUS software, version 7.0, Bruker Optik GmbH). Band positions and baseline-corrected integrated band areas were determined from the spectra. Band-area ratios were used as semi-quantitative indicators: amide I (1590–1720 cm−1) and O–H stretching (2700–3700 cm−1) relative to the carbonate ν2 band (840–900 cm−1) for eggshell, and the carbonate band (1330–1500 cm−1) relative to the Si–O–T stretching band (820–1250 cm−1) for the geopolymers.
4.6. Quantitative Image Analysis of Vesicles
Intracrystalline vesicles were quantified on two ×5000 SE micrographs (Section 2.2; 1280 × 893 px each; pixel size 19.8 nm, calibrated from the instrument scale bar). The images were processed in Python 3.12.10 with scikit-image [56] using Gaussian smoothing (σ = 1.2 px), a black top-hat transform (disk radius 22 px) to isolate small dark features, Otsu thresholding combined with an intensity criterion, and morphological opening. Objects ≥ 15 px, with circularity 4πA/P2 > 0.55 and eccentricity < 0.9, were retained, and the area-equivalent diameter of each was calculated. Faint or partially occluded vesicles were missed by the conservative criteria, so the reported number density and areal fraction are lower bounds.
4.7. N2 Physisorption
Nitrogen adsorption–desorption isotherms of the eggshell powders ES-150 (0.3526 g) and ES-250 (0.4886 g) were measured in the same run on the same instrument after degassing at 150 °C for 5 h under flowing N2; this temperature does not exceed the thermal history of either powder. The BET ranges were P/P0 = 0.079–0.296 (ES-150) and 0.066–0.296 (ES-250), with r = 0.9996 and 0.9979 and positive C constants, and the literature density of calcite (2.710 g cm−3) was used as skeletal density. Isotherms of the geopolymers (GP-0 previously reported in [27]) were measured at 77.35 K on a Micromeritics TriStar II Plus analyser (software v3.03; Micromeritics Instrument Corporation, Norcross, GA, USA) using 0.42 g (GP-0) and 0.30 g (GP-ES) of crushed sample, degassed under flowing N2 at 150 °C for ≈5 h. The specific surface area was calculated by the BET method [57] over P/P0 = 0.05–0.30 (GP-0: 0.075–0.297; GP-ES: 0.053–0.297; r > 0.9998, positive C constant), following the IUPAC criteria [42]. Micropore volume and external surface area were obtained by the t-plot method (Harkins–Jura thickness equation, t = [13.99/(0.034 − log(P/P0))]0.5 Å, fitted over t = 0.35–0.50 nm, i.e., P/P0 ≈ 0.08–0.30). Each material was measured once; the uncertainties given for SBET are those of the BET fit and do not include sample-to-sample reproducibility. Pore size distributions were calculated by the BJH method [58] from the adsorption branch (Harkins–Jura thickness, Faas correction, 1.7–300 nm). The desorption branch was used only to locate pore necks, because desorption below P/P0 ≈ 0.45 is affected by cavitation [42]. The total pore volume Vp was taken from the amount adsorbed at the highest relative pressure (P/P0 = 0.998 for GP-0 and 0.997 for GP-ES), converted to liquid N2 (density conversion factor 0.0015468). The N2-accessible porosity was calculated as ε = Vpρs/(1 + Vpρs), the mean pore diameter as 4V/SBET, with V either the single-point volume at P/P0 = 0.95 (instrument output) or the total pore volume Vp, and the BET-equivalent particle diameter as dBET = 6/(ρsSBET), where ρs is the sample density used in the analyses (2.38 g cm−3 for GP-0 and 2.50 g cm−3 for GP-ES, measured by helium pycnometry (AccuPyc II 1340; Micromeritics Instrument Corporation, Norcross, GA, USA)).
4.8. Antibacterial Activity
The antibacterial activity of finely ground GP-0, GP-ES and ES-250 powders was evaluated in a suspension (contact) test against the reference strain Escherichia coli WDCM 00013/VT000132 (Gram-negative), supplied by Merck KGaA (Darmstadt, Germany). E. coli was used as the standard Gram-negative test organism and as the main indicator of faecal contamination of water. Other organisms, including Gram-positive bacteria (e.g., Staphylococcus aureus, Enterococcus faecalis) and other pathogens (Pseudomonas aeruginosa, Salmonella spp.), were not tested in this work. Because the materials were tested as powders, the film-contact method standardised for non-porous surfaces (ISO 22196 [59]) was not applicable. The powders were decontaminated by UV irradiation (laboratory-built UV device) for 15 min. For E. coli, two independent 2 mg portions of each powder were weighed on an analytical balance (92SM-202A; Precisa, Dietikon, Switzerland), giving two parallel sets of samples. Both sets were prepared on the same day from the same bacterial suspension and therefore represent technical duplicates of one experiment. Each portion was added to 9 mL of sterile distilled water and 1 mL of an artificial E. coli suspension (≈103 CFU mL−1; nominal final load ≈100 CFU mL−1) and homogenised on a vortex mixer (Vortex V-1 plus; Biosan, Riga, Latvia). Each set included a positive control (9 mL of sterile water and 1 mL of inoculum, no powder) and a negative control (10 mL of sterile water). All suspensions were kept at 25 °C between samplings. After 0.5, 4 and 24 h of contact, 1 mL of each suspension was filtered through a membrane (polyvinylidene fluoride, 0.45 µm pore size, HVWP047S6; Merck Millipore, Merck KGaA, Darmstadt, Germany), which was placed on Chromocult Coliform Agar (Merck KGaA, Darmstadt, Germany) and incubated at 37 °C (Incucell 55L; MMM Medcenter Einrichtungen, Planegg, Germany) for 24 h; E. coli forms dark-blue to violet colonies on this medium. Results are expressed as culturable counts, CFU mL−1, with a detection limit of 1 CFU mL−1 per replicate. The reduction relative to the positive control at the same contact time was calculated from the replicate means as R = (1 − N/NC) × 100% and log R = log10(NC/N); when no colonies were found, N was set to the detection limit. Because equal volumes were filtered, the pooled counts of the two replicates were compared with those of the control by the exact conditional (binomial) test for two Poisson counts (α = 0.05), and 95% confidence intervals were calculated from the Poisson distribution. These statistics describe the counting uncertainty within the experiment, not the variability between independent experiments. The pH of a separate, uninoculated set (2 mg of powder in 10 mL of sterile distilled water, with sterile water as reference) was measured with an inoLab pH 730 m (WTW, Weilheim, Germany).
4.9. Methylene Blue Removal in the Dark and Under UV Irradiation
Methylene blue (MB) removal was tested following our previous protocols [27,51]. For each test, 0.1 g of powder (GP-0 or GP-ES) was dispersed in 100 mL of an aqueous MB solution (methylene blue, C.I. 52015, reagent Ph. Eur.; Merck KGaA, Darmstadt, Germany; 15 mg L−1) and magnetically stirred (300 rpm, MS-H280-Pro stirrer, DLAB Scientific Co., Ltd., Beijing, China, room temperature) in the dark for 30 min to approach adsorption equilibrium. The first aliquot (t = 0) was then taken, and stirring continued for 160 min either in the dark or under UV-A irradiation. Irradiation was carried out in the laboratory-built UV reactor used in [51]: a cylindrical chamber of opaque plastic (height 28 cm, inner diameter 35 cm) fitted with four actinic UV-A fluorescent tubes (6 W nominal electrical power each, active length 225 mm), mounted vertically and equidistantly on a circle concentric with the chamber axis. Aliquots were withdrawn every 20 min, filtered through nylon syringe filters (0.45 µm, Ø 25 mm; Fisher Scientific, Waltham, MA, USA) and analysed without dilution. As a photolysis control, the MB solution without powder was irradiated under the same conditions. Absorption spectra were recorded with an Ocean Optics USB2000+ UV–Vis spectrometer coupled to a DH-2000-BAL deuterium–halogen light source (both Ocean Optics, Inc., Dunedin, FL, USA). The GP-0 dark test is the one reported in [27], re-evaluated here. Because of the limited capacity of the UV reactor, the GP-ES tests were run on a separate day with a freshly prepared MB solution. Scattering by fine particles that passed the filter was removed by subtracting a straight baseline through the mean absorbances at 515 ± 5 and 790 ± 10 nm; because no calibration curve was recorded, the results are expressed as corrected absorbances at 664 and 590 nm.
The removal relative to the first aliquot is η = (1 − At/A0) × 100%, and an apparent pseudo-first-order constant k was obtained from ln(A0/At) = kt + b by linear least squares. The pseudo-first-order expression is used as an empirical descriptor of the decay, not as a mechanistic model, and k depends on the initial absorbance and on the uptake during the pre-contact. The control was followed at 700 nm, on the flank of the band, after subtraction of the 790 nm absorbance. The ratio A590/A664 was used as a band-shape index; it increases on MB aggregation (metachromasy) [60,61] and on the formation of N-demethylated derivatives, whose maxima lie at shorter wavelengths [50].
Supplementary Materials
The following supporting information can be downloaded at https://www.mdpi.com/article/10.3390/gels12111008/s1, Figure S1: N2 physisorption of the eggshell powders ES-150 and ES-250; Figure S2: E. coli colonies on Chromocult Coliform Agar membranes in the duplicate antibacterial test; Figure S3: Band-shape index and spectra of the MB solution without powder in the methylene blue tests; Figure S4: EDS mapping of the geopolymer GP-ES, areas Z2 and Z3; Figure S5: Uncorrected UV–Vis spectra of all methylene blue tests in the dark and under UV irradiation; Table S1: Single-replicate E. coli screening series.
Author Contributions
Conceptualization, A.-G.S. and M.O.; methodology, M.O.; software, S.G.M.; validation, M.-C.D.; formal analysis, M.-C.D.; investigation, P.M., E.M.M., S.G.M., M.-A.I., A.B., Ș.M., M.-C.D., E.A.V. and D.I.; resources, A.-G.S.; data curation, A.-G.S.; writing—original draft preparation, A.-G.S.; writing—review and editing, A.-G.S.; visualization, M.O.; supervision, M.O.; project administration, A.-G.S.; funding acquisition, A.-G.S. All authors have read and agreed to the published version of the manuscript.
Funding
This research has received funding from the European Union’s Horizon Europe research and innovation programme under grant agreement No 101131793.
Institutional Review Board Statement
Not applicable.
Informed Consent Statement
Not applicable.
Data Availability Statement
The data presented in this study, including the raw XRD patterns, N2 isotherms, UV–Vis spectra and colony counts, are available on request from the corresponding author.
Conflicts of Interest
The authors declare no conflicts of interest.
References
- Cree, D.; Rutter, A. Sustainable bio-inspired limestone eggshell powder for potential industrialized applications. ACS Sustain. Chem. Eng. 2015, 3, 941–949. [Google Scholar] [CrossRef] [Scilit]
- Waheed, M.; Butt, M.S.; Shehzad, A.; Adzahan, N.M.; Shabbir, M.A.; Suleria, H.A.R.; Aadil, R.M. Eggshell calcium: A cheap alternative to expensive supplements. Trends Food Sci. Technol. 2019, 91, 219–230. [Google Scholar] [CrossRef] [Scilit]
- Faridi, H.; Arabhosseini, A. Application of eggshell wastes as valuable and utilizable products: A review. Res. Agr. Eng. 2018, 64, 104–114. [Google Scholar] [CrossRef] [Scilit]
- Hincke, M.T.; Nys, Y.; Gautron, J.; Mann, K.; Rodriguez-Navarro, A.B.; McKee, M.D. The eggshell: Structure, composition and mineralization. Front. Biosci. 2012, 17, 1266–1280. [Google Scholar] [CrossRef] [Scilit]
- Nys, Y.; Gautron, J.; Garcia-Ruiz, J.M.; Hincke, M.T. Avian eggshell mineralization: Biochemical and functional characterization of matrix proteins. Comptes Rendus Palevol 2004, 3, 549–562. [Google Scholar] [CrossRef] [Scilit]
- Wong, M.; Hendrix, M.J.C.; von der Mark, K.; Little, C.; Stern, R. Collagen in the egg shell membranes of the hen. Dev. Biol. 1984, 104, 28–36. [Google Scholar] [CrossRef] [Scilit]
- Rodriguez-Navarro, A.; Kalin, O.; Nys, Y.; Garcia-Ruiz, J.M. Influence of the microstructure on the shell strength of eggs laid by hens of different ages. Br. Poult. Sci. 2002, 43, 395–403. [Google Scholar] [CrossRef] [Scilit]
- Mann, K.; Maček, B.; Olsen, J.V. Proteomic analysis of the acid-soluble organic matrix of the chicken calcified eggshell layer. Proteomics 2006, 6, 3801–3810. [Google Scholar] [CrossRef] [Scilit]
- Pokroy, B.; Fitch, A.N.; Marin, F.; Kapon, M.; Adir, N.; Zolotoyabko, E. Anisotropic lattice distortions in biogenic calcite induced by intra-crystalline organic molecules. J. Struct. Biol. 2006, 155, 96–103. [Google Scholar] [CrossRef] [Scilit]
- Pokroy, B.; Quintana, J.P.; Caspi, E.N.; Berner, A.; Zolotoyabko, E. Anisotropic lattice distortions in biogenic aragonite. Nat. Mater. 2004, 3, 900–902. [Google Scholar] [CrossRef] [Scilit]
- Tsai, W.T.; Yang, J.M.; Lai, C.W.; Cheng, Y.H.; Lin, C.C.; Yeh, C.W. Characterization and adsorption properties of eggshells and eggshell membrane. Bioresour. Technol. 2006, 97, 488–493. [Google Scholar] [CrossRef] [Scilit]
- Robie, R.A.; Hemingway, B.S. Thermodynamic Properties of Minerals and Related Substances at 298.15 K and 1 Bar (105 Pascals) Pressure and at Higher Temperatures; U.S. Geological Survey Bulletin 2131; U.S. Government Printing Office: Washington, DC, USA, 1995.
- Bernstein, L.; Roy, J.; Delhotal, K.C.; Harnisch, J.; Matsuhashi, R.; Price, L.; Tanaka, K.; Worrell, E.; Yamba, F.; Fengqi, Z. Industry. In Climate Change 2007: Mitigation. Contribution of Working Group III to the Fourth Assessment Report of the Intergovernmental Panel on Climate Change; Metz, B., Davidson, O.R., Bosch, P.R., Dave, R., Meyer, L.A., Eds.; Cambridge University Press: Cambridge, UK, 2007; pp. 447–496. [Google Scholar]
- Sawai, J. Antimicrobial characteristics of heated scallop shell powder and its application. Biocontrol Sci. 2011, 16, 95–102. [Google Scholar] [CrossRef] [Scilit]
- Hemmami, H.; Zeghoud, S.; Ben Amor, I.; Alnazza Alhamad, A.; Tliba, A.; Alsalme, A.; Cornu, D.; Bechelany, M.; Barhoum, A. Green synthesis of CaO nanoparticles from chicken eggshells: Antibacterial, antifungal, and heavy metal (Pb2+, Cr2+, Cd2+ and Hg2+) adsorption properties. Front. Environ. Sci. 2024, 12, 1450485. [Google Scholar] [CrossRef] [Scilit]
- Cevoli, C.; Fabbri, A.; Pasquali, F.; Berardinelli, A.; Guarnieri, A. Hot air treatment, in natural convection conditions, for egg surface decontamination. J. Agric. Eng. 2010, 41, 23–27. [Google Scholar] [CrossRef] [Scilit]
- Akintomide, A.A.; Feyisara, O.R.; Onibi, G.E. Microbial quality of stored eggshells for potential feedstuff application. Niger. J. Anim. Prod. 2025, 1275–1277. [Google Scholar] [CrossRef]
- Rutala, W.A.; Weber, D.J.; Healthcare Infection Control Practices Advisory Committee (HICPAC). Guideline for Disinfection and Sterilization in Healthcare Facilities, 2008; Centers for Disease Control and Prevention: Atlanta, GA, USA, 2008. [Google Scholar]
- United States Pharmacopeia. United States Pharmacopeial Convention; Rockville, MD, USA.
- Davidovits, J. Geopolymers: Inorganic polymeric new materials. J. Therm. Anal. 1991, 37, 1633–1656. [Google Scholar]
- Duxson, P.; Fernández-Jiménez, A.; Provis, J.L.; Lukey, G.C.; Palomo, A.; van Deventer, J.S.J. Geopolymer technology: The current state of the art. J. Mater. Sci. 2007, 42, 2917–2933. [Google Scholar] [CrossRef] [Scilit]
- Provis, J.L.; van Deventer, J.S.J. (Eds.) Alkali Activated Materials: State-of-the-Art Report, RILEM TC 224-AAM; Springer: Dordrecht, The Netherlands, 2014. [Google Scholar]
- Li, Y.; Dong, Y.; El-Naggar, M.R.; Wang, F.; Zhao, Y. The Influence of Particle Size and Calcium Content on Performance Characteristics of Metakaolin- and Fly-Ash-Based Geopolymer Gels. Gels 2024, 10, 639. [Google Scholar] [CrossRef] [Scilit]
- Yip, C.K.; Lukey, G.C.; van Deventer, J.S.J. The coexistence of geopolymeric gel and calcium silicate hydrate at the early stage of alkaline activation. Cem. Concr. Res. 2005, 35, 1688–1697. [Google Scholar] [CrossRef] [Scilit]
- Adak, D.; Sarkar, M.; Maiti, M.; Tamang, A.; Mandal, S.; Chattopadhyay, B. Anti-microbial efficiency of nano silver–silica modified geopolymer mortar for eco-friendly green construction technology. RSC Adv. 2015, 5, 64037–64045. [Google Scholar] [CrossRef] [Scilit]
- Viola, V.; D’Angelo, A.; Vertuccio, L.; Catauro, M. Metakaolin-based geopolymers filled with industrial wastes: Improvement of physicochemical properties through sustainable waste recycling. Polymers 2024, 16, 2118. [Google Scholar] [CrossRef] [Scilit]
- Schiopu, A.-G.; Oproescu, M.; Mereuţă, P.; Moga, S.G.; Modan, E.M.; Ioţa, M.-A.; Berevoianu, A.; Mira, Ş.; Ducu, M.-C.; Vijan, E.A.; et al. Structure–property relationships in metakaolin geopolymers modified with shell-derived calcium particles for multifunctional wastewater treatment. Polymers 2026, 18, 2005. [Google Scholar] [CrossRef] [Scilit]
- Omur, T.; Miyan, N.; Kabay, N. Utilization of eggshell powder in one-part alkali-activated metakaolin based binder. Constr. Build. Mater. 2024, 445, 137981. [Google Scholar] [CrossRef] [Scilit]
- Yavuz, D. Incorporation of eggshell powder in metakaolin-based geopolymer concrete exposed to elevated temperatures. J. Aust. Ceram. Soc. 2026, 62, 219–231. [Google Scholar] [CrossRef] [Scilit]
- Provis, J.L. Alkali-activated materials. Cem. Concr. Res. 2018, 114, 40–48. [Google Scholar] [CrossRef] [Scilit]
- Tasiopoulou, T.; Katsourinis, D.; Giannopoulos, D.; Founti, M. Production-process simulation and life-cycle assessment of metakaolin as supplementary cementitious material. Eng 2023, 4, 761–779. [Google Scholar] [CrossRef] [Scilit]
- Alvarez-Coscojuela, A.; Mañosa, J.; Marco-Gibert, J.; Córdoba, J.C.; Chimenos, J.M. Insights into mechanothermal activation of kaolinite: A novel multistep process for cement precursors. Constr. Build. Mater. 2025, 492, 142848. [Google Scholar] [CrossRef] [Scilit]
- Luukkonen, T.; Abdollahnejad, Z.; Yliniemi, J.; Kinnunen, P.; Illikainen, M. One-part alkali-activated materials: A review. Cem. Concr. Res. 2018, 103, 21–34. [Google Scholar] [CrossRef] [Scilit]
- Lopes, A.; Lopes, S.; Pinto, I. Influence of curing temperature on the strength of a metakaolin-based geopolymer. Materials 2023, 16, 7460. [Google Scholar] [CrossRef] [Scilit]
- Habert, G.; d’Espinose de Lacaillerie, J.B.; Roussel, N. An environmental evaluation of geopolymer based concrete production: Reviewing current research trends. J. Clean. Prod. 2011, 19, 1229–1238. [Google Scholar] [CrossRef] [Scilit]
- Yip, C.K.; Provis, J.L.; Lukey, G.C.; van Deventer, J.S.J. Carbonate mineral addition to metakaolin-based geopolymers. Cem. Concr. Compos. 2008, 30, 979–985. [Google Scholar] [CrossRef] [Scilit]
- Ćwirzeń, A.; Provis, J.L.; Penttala, V.; Habermehl-Ćwirzeń, K. The effect of limestone on sodium hydroxide-activated metakaolin-based geopolymers. Constr. Build. Mater. 2014, 66, 53–62. [Google Scholar] [CrossRef] [Scilit]
- Ngayakamo, B.; Onwualu, A.P. Recent advances in green processing technologies for valorisation of eggshell waste for sustainable construction materials. Heliyon 2022, 8, e09649. [Google Scholar] [CrossRef] [Scilit]
- Shekhawat, P.; Sharma, G.; Singh, R.M. Strength characteristics of hazardous wastes flyash and eggshell powder-based geopolymer-stabilized soft soil cured at ambient temperature. Arab. J. Geosci. 2023, 16, 127. [Google Scholar] [CrossRef] [Scilit]
- Rathinavel, N.; Kannadasan, K.; Ismail, A.A.M.; Mammo, W.D.; Alagar, M. Impact of eggshell powder on the mechanical and thermal properties of lightweight geopolymer. Adv. Civ. Eng. 2023, 2023, 6655921. [Google Scholar] [CrossRef] [Scilit]
- Effenberger, H.; Mereiter, K.; Zemann, J. Crystal structure refinements of magnesite, calcite, rhodochrosite, siderite, smithonite, and dolomite, with discussion of some aspects of the stereochemistry of calcite type carbonates. Z. Krist. 1981, 156, 233–243. [Google Scholar] [CrossRef] [Scilit]
- Thommes, M.; Kaneko, K.; Neimark, A.V.; Olivier, J.P.; Rodriguez-Reinoso, F.; Rouquerol, J.; Sing, K.S.W. Physisorption of gases, with special reference to the evaluation of surface area and pore size distribution (IUPAC Technical Report). Pure Appl. Chem. 2015, 87, 1051–1069. [Google Scholar] [CrossRef] [Scilit]
- Newbury, D.E.; Ritchie, N.W.M. Is scanning electron microscopy/energy dispersive X-ray spectrometry (SEM/EDS) quantitative? Scanning 2013, 35, 141–168. [Google Scholar] [CrossRef] [Scilit]
- Regev, L.; Poduska, K.M.; Addadi, L.; Weiner, S.; Boaretto, E. Distinguishing between calcites formed by different mechanisms using infrared spectrometry: Archaeological applications. J. Archaeol. Sci. 2010, 37, 3022–3029. [Google Scholar] [CrossRef] [Scilit]
- Ketta, M.; Tůmová, E. Eggshell structure, measurements, and quality-affecting factors in laying hens: A review. Czech. J. Anim. Sci. 2016, 61, 299–309. [Google Scholar] [CrossRef] [Scilit]
- Drabik, K.; Karwowska, M.; Wengerska, K.; Próchniak, T.; Adamczuk, A.; Batkowska, J. The variability of quality traits of table eggs and eggshell mineral composition depending on hens’ breed and eggshell color. Animals 2021, 11, 1204. [Google Scholar] [CrossRef] [Scilit]
- Zhang, Z.; Wang, H.; Provis, J.L.; Bullen, F.; Reid, A.; Zhu, Y. Quantitative kinetic and structural analysis of geopolymers. Part 1. The activation of metakaolin with sodium hydroxide. Thermochim. Acta 2012, 539, 23–33. [Google Scholar] [CrossRef] [Scilit]
- Padan, E.; Bibi, E.; Ito, M.; Krulwich, T.A. Alkaline pH homeostasis in bacteria: New insights. Biochim. Biophys. Acta 2005, 1717, 67–88. [Google Scholar] [CrossRef] [Scilit]
- Vaara, M. Agents that increase the permeability of the outer membrane. Microbiol. Rev. 1992, 56, 395–411. [Google Scholar] [CrossRef] [Scilit]
- Zhang, T.; Oyama, T.; Aoshima, A.; Hidaka, H.; Zhao, J.; Serpone, N. Photooxidative N-demethylation of methylene blue in aqueous TiO2 dispersions under UV irradiation. J. Photochem. Photobiol. A Chem. 2001, 140, 163–172. [Google Scholar] [CrossRef] [Scilit]
- Schiopu, A.-G.; Oproescu, M.; Mira, Ş.; Moga, S.G.; Modan, E.M.; Mereuţă, P.; Ioţa, M.-A.; Berevoianu, A. Influence of functionalization on the textural properties and photocatalytic performance of ZnO-modified metakaolin based-geopolymer. Polymers 2026, 18, 1110. [Google Scholar] [CrossRef] [Scilit]
- Buxton, G.V.; Greenstock, C.L.; Helman, W.P.; Ross, A.B. Critical review of rate constants for reactions of hydrated electrons, hydrogen atoms and hydroxyl radicals (OH/O−) in aqueous solution. J. Phys. Chem. Ref. Data 1988, 17, 513–886. [Google Scholar] [CrossRef] [Scilit]
- Duxson, P.; Provis, J.L.; Lukey, G.C.; Mallicoat, S.W.; Kriven, W.M.; van Deventer, J.S.J. Understanding the relationship between geopolymer composition, microstructure and mechanical properties. Colloids Surf. A 2005, 269, 47–58. [Google Scholar] [CrossRef] [Scilit]
- Heah, C.Y.; Kamarudin, H.; Mustafa Al Bakri, A.M.; Bnhussain, M.; Luqman, M.; Khairul Nizar, I.; Ruzaidi, C.M.; Liew, Y.M. Kaolin-based geopolymers with various NaOH concentrations. Int. J. Miner. Metall. Mater. 2013, 20, 313–322. [Google Scholar] [CrossRef] [Scilit]
- Williamson, G.K.; Hall, W.H. X-ray line broadening from filed aluminium and wolfram. Acta Metall. 1953, 1, 22–31. [Google Scholar] [CrossRef] [Scilit]
- van der Walt, S.; Schönberger, J.L.; Nunez-Iglesias, J.; Boulogne, F.; Warner, J.D.; Yager, N.; Gouillart, E.; Yu, T.; The Scikit-Image Contributors. scikit-image: Image processing in Python. PeerJ 2014, 2, e453. [Google Scholar] [CrossRef] [Scilit]
- Brunauer, S.; Emmett, P.H.; Teller, E. Adsorption of gases in multimolecular layers. J. Am. Chem. Soc. 1938, 60, 309–319. [Google Scholar] [CrossRef] [Scilit]
- Barrett, E.P.; Joyner, L.G.; Halenda, P.P. The determination of pore volume and area distributions in porous substances. I. Computations from nitrogen isotherms. J. Am. Chem. Soc. 1951, 73, 373–380. [Google Scholar] [CrossRef] [Scilit]
- ISO 22196:2011; Measurement of Antibacterial Activity on Plastics and Other Non-Porous Surfaces. International Organization for Standardization: Geneva, Switzerland, 2011.
- Bergmann, K.; O’Konski, C.T. A spectroscopic study of methylene blue monomer, dimer, and complexes with montmorillonite. J. Phys. Chem. 1963, 67, 2169–2177. [Google Scholar] [CrossRef] [Scilit]
- Schoonheydt, R.A.; Heughebaert, L. Clay adsorbed dyes: Methylene blue on laponite. Clay Miner. 1992, 27, 91–100. [Google Scholar] [CrossRef] [Scilit]
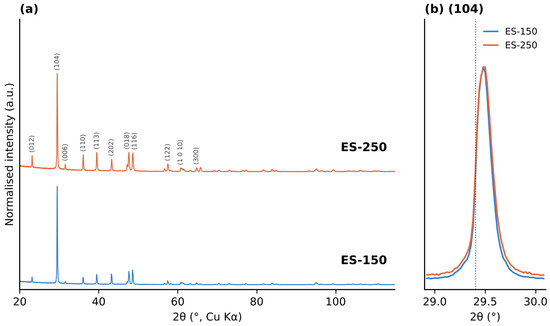
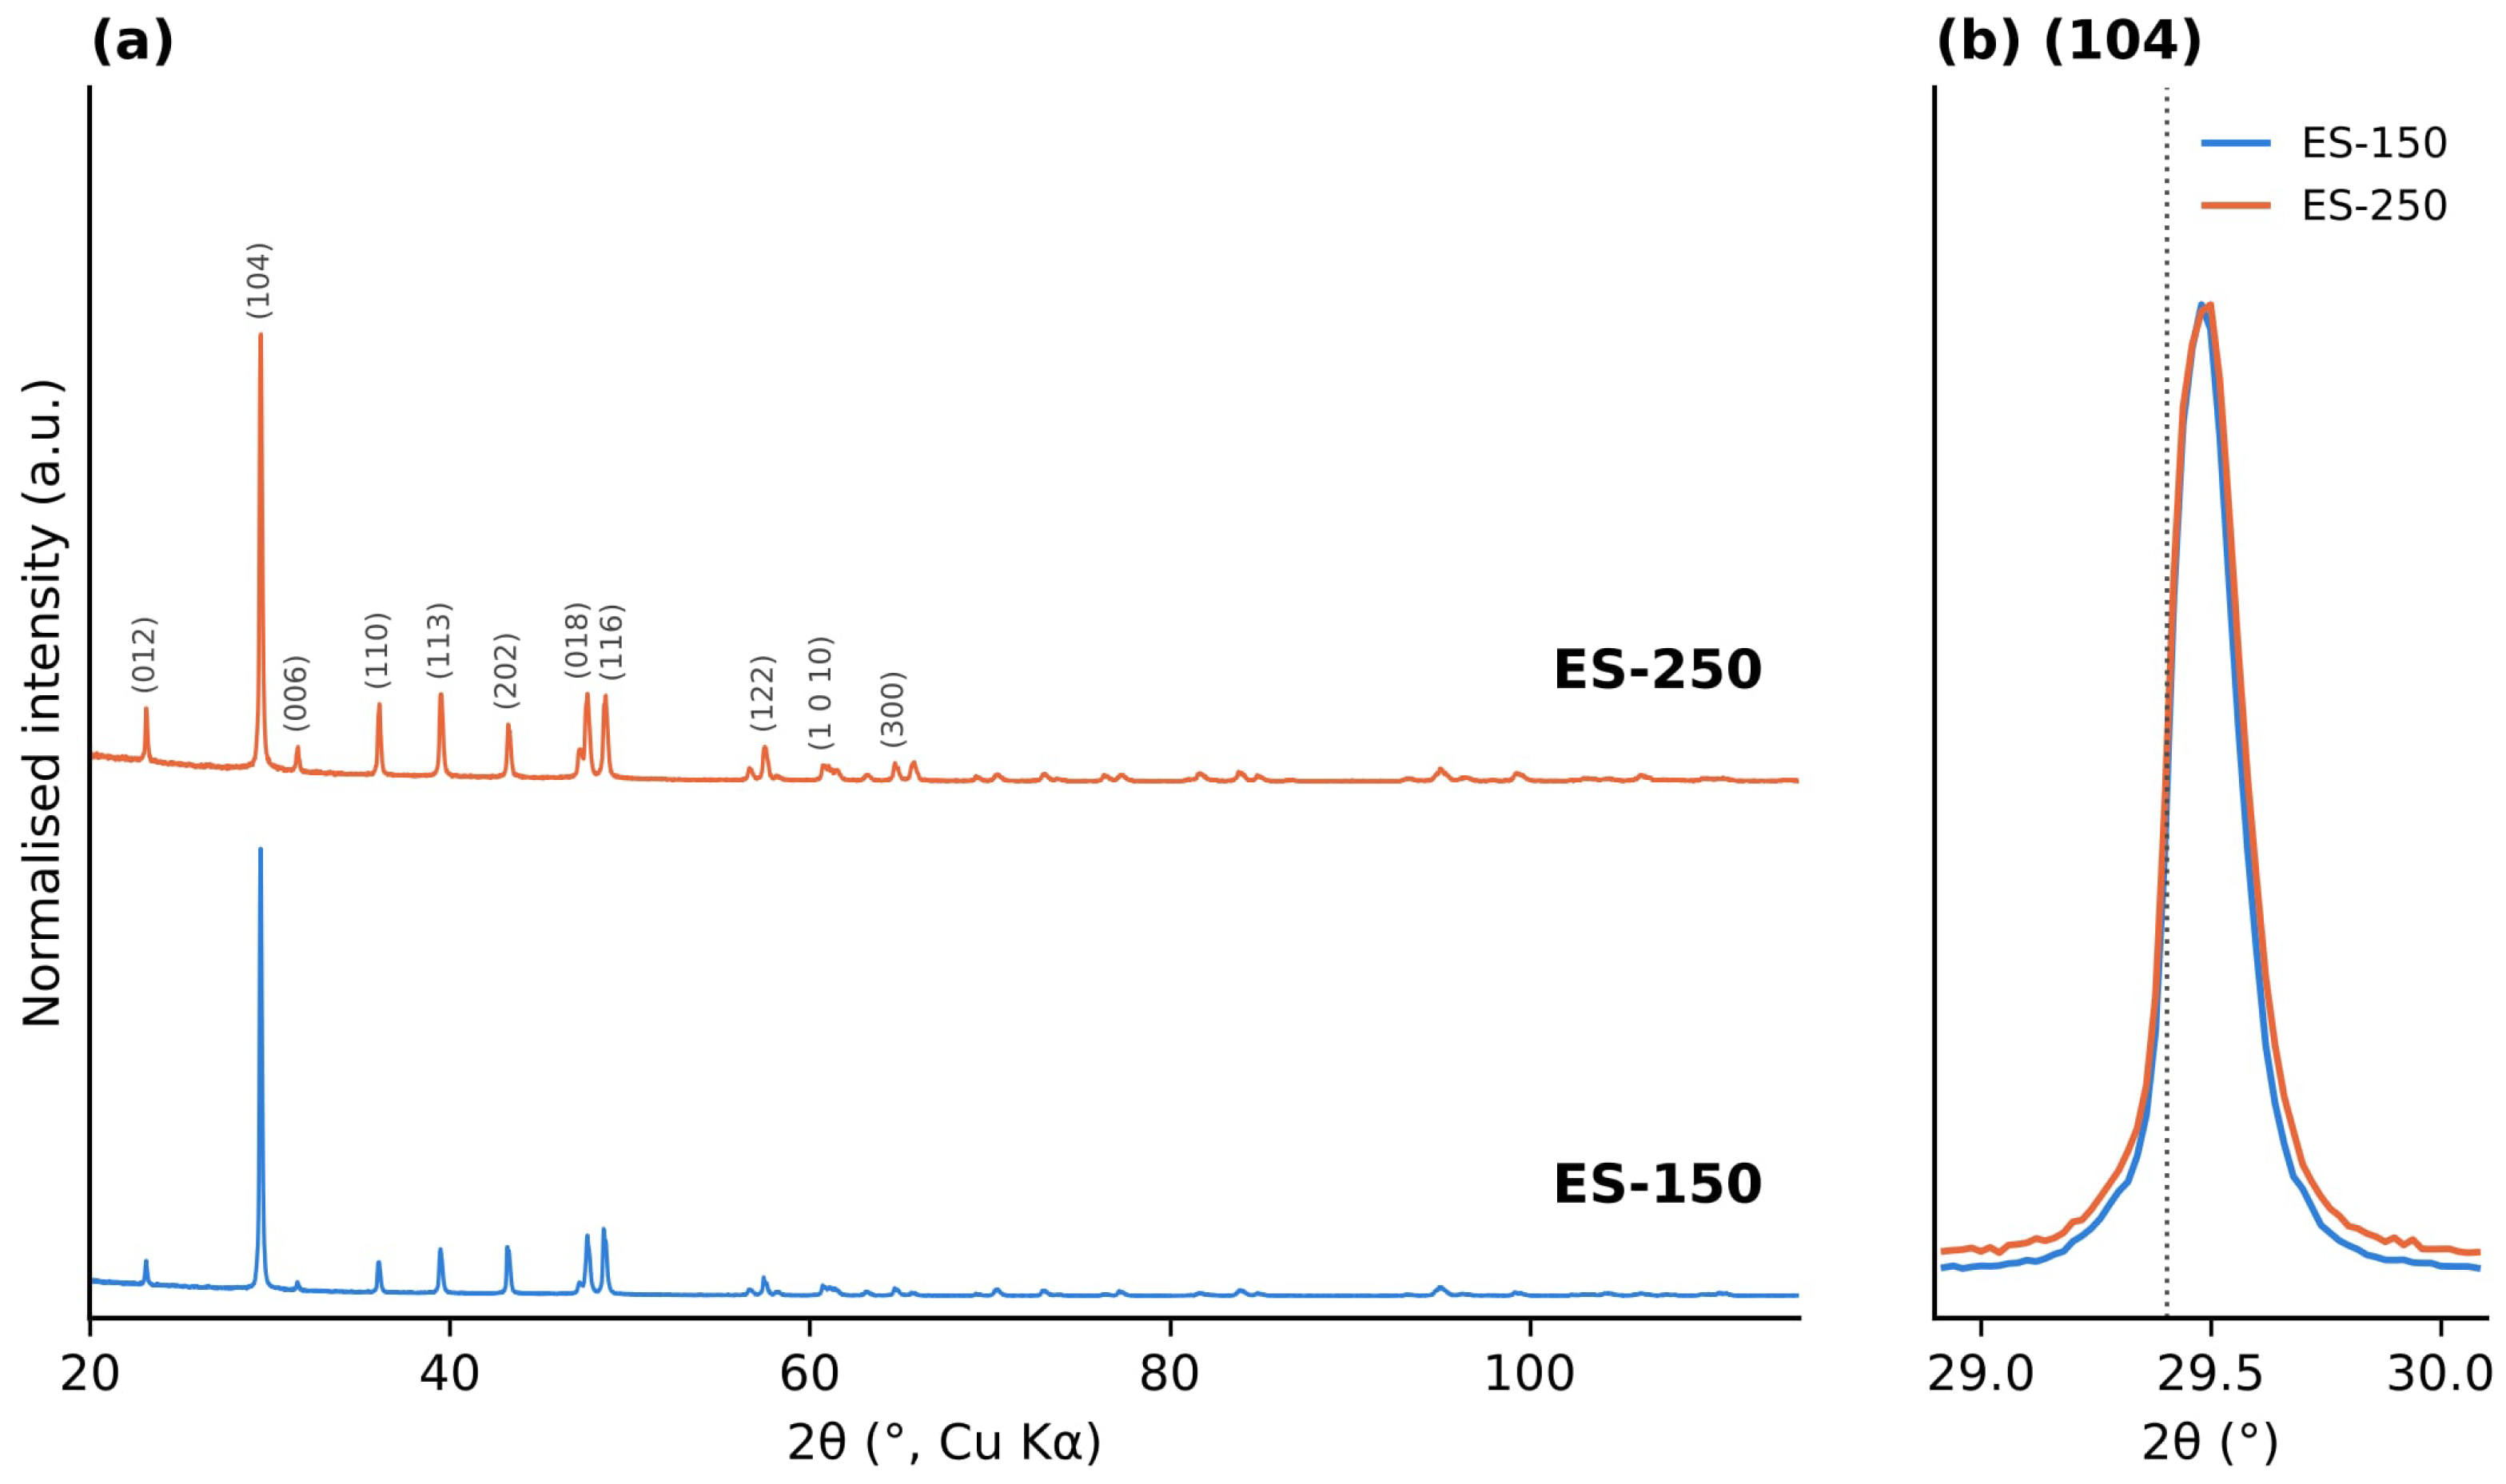
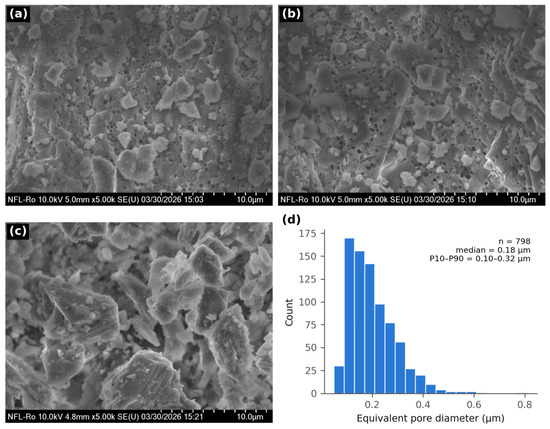
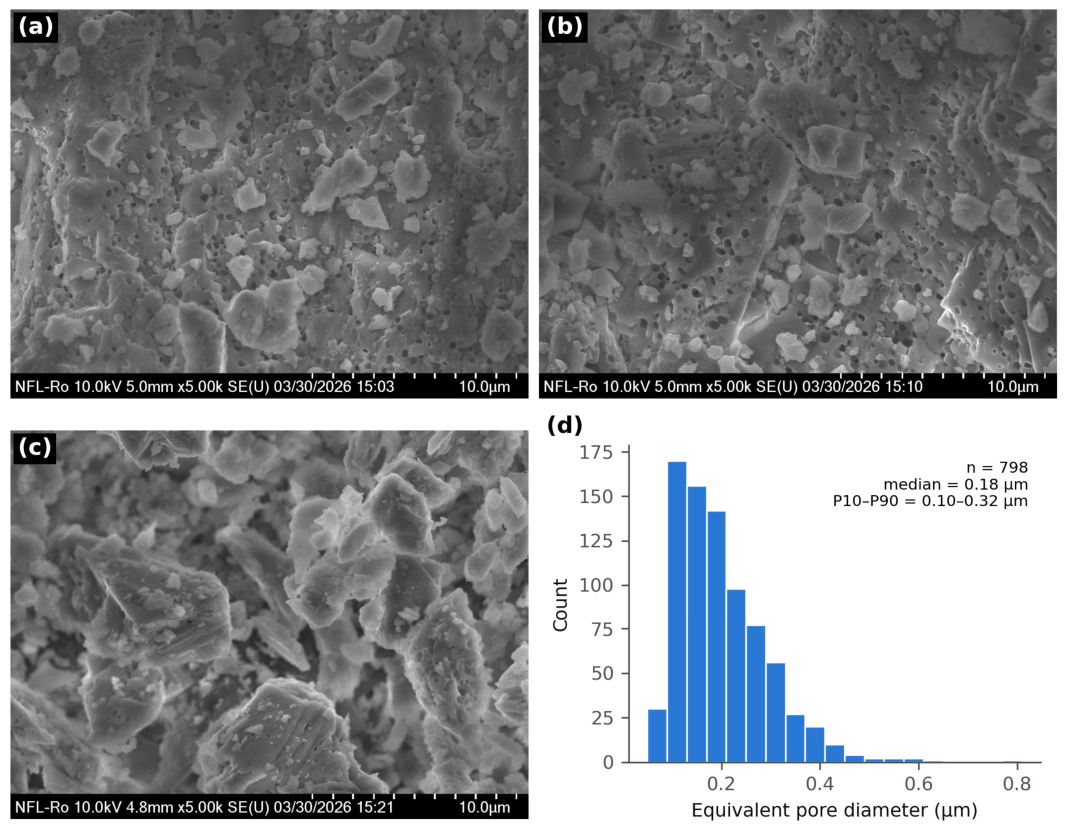
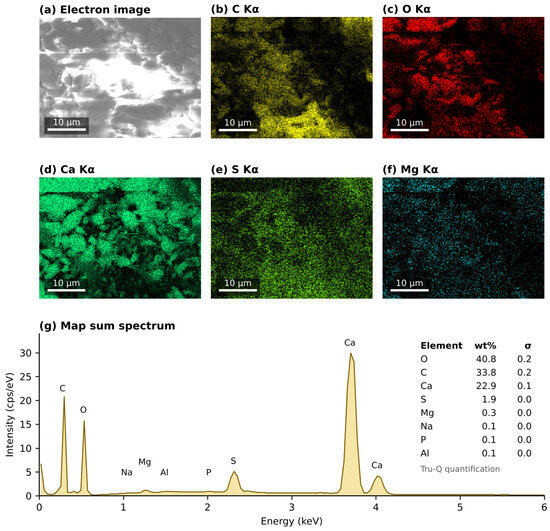
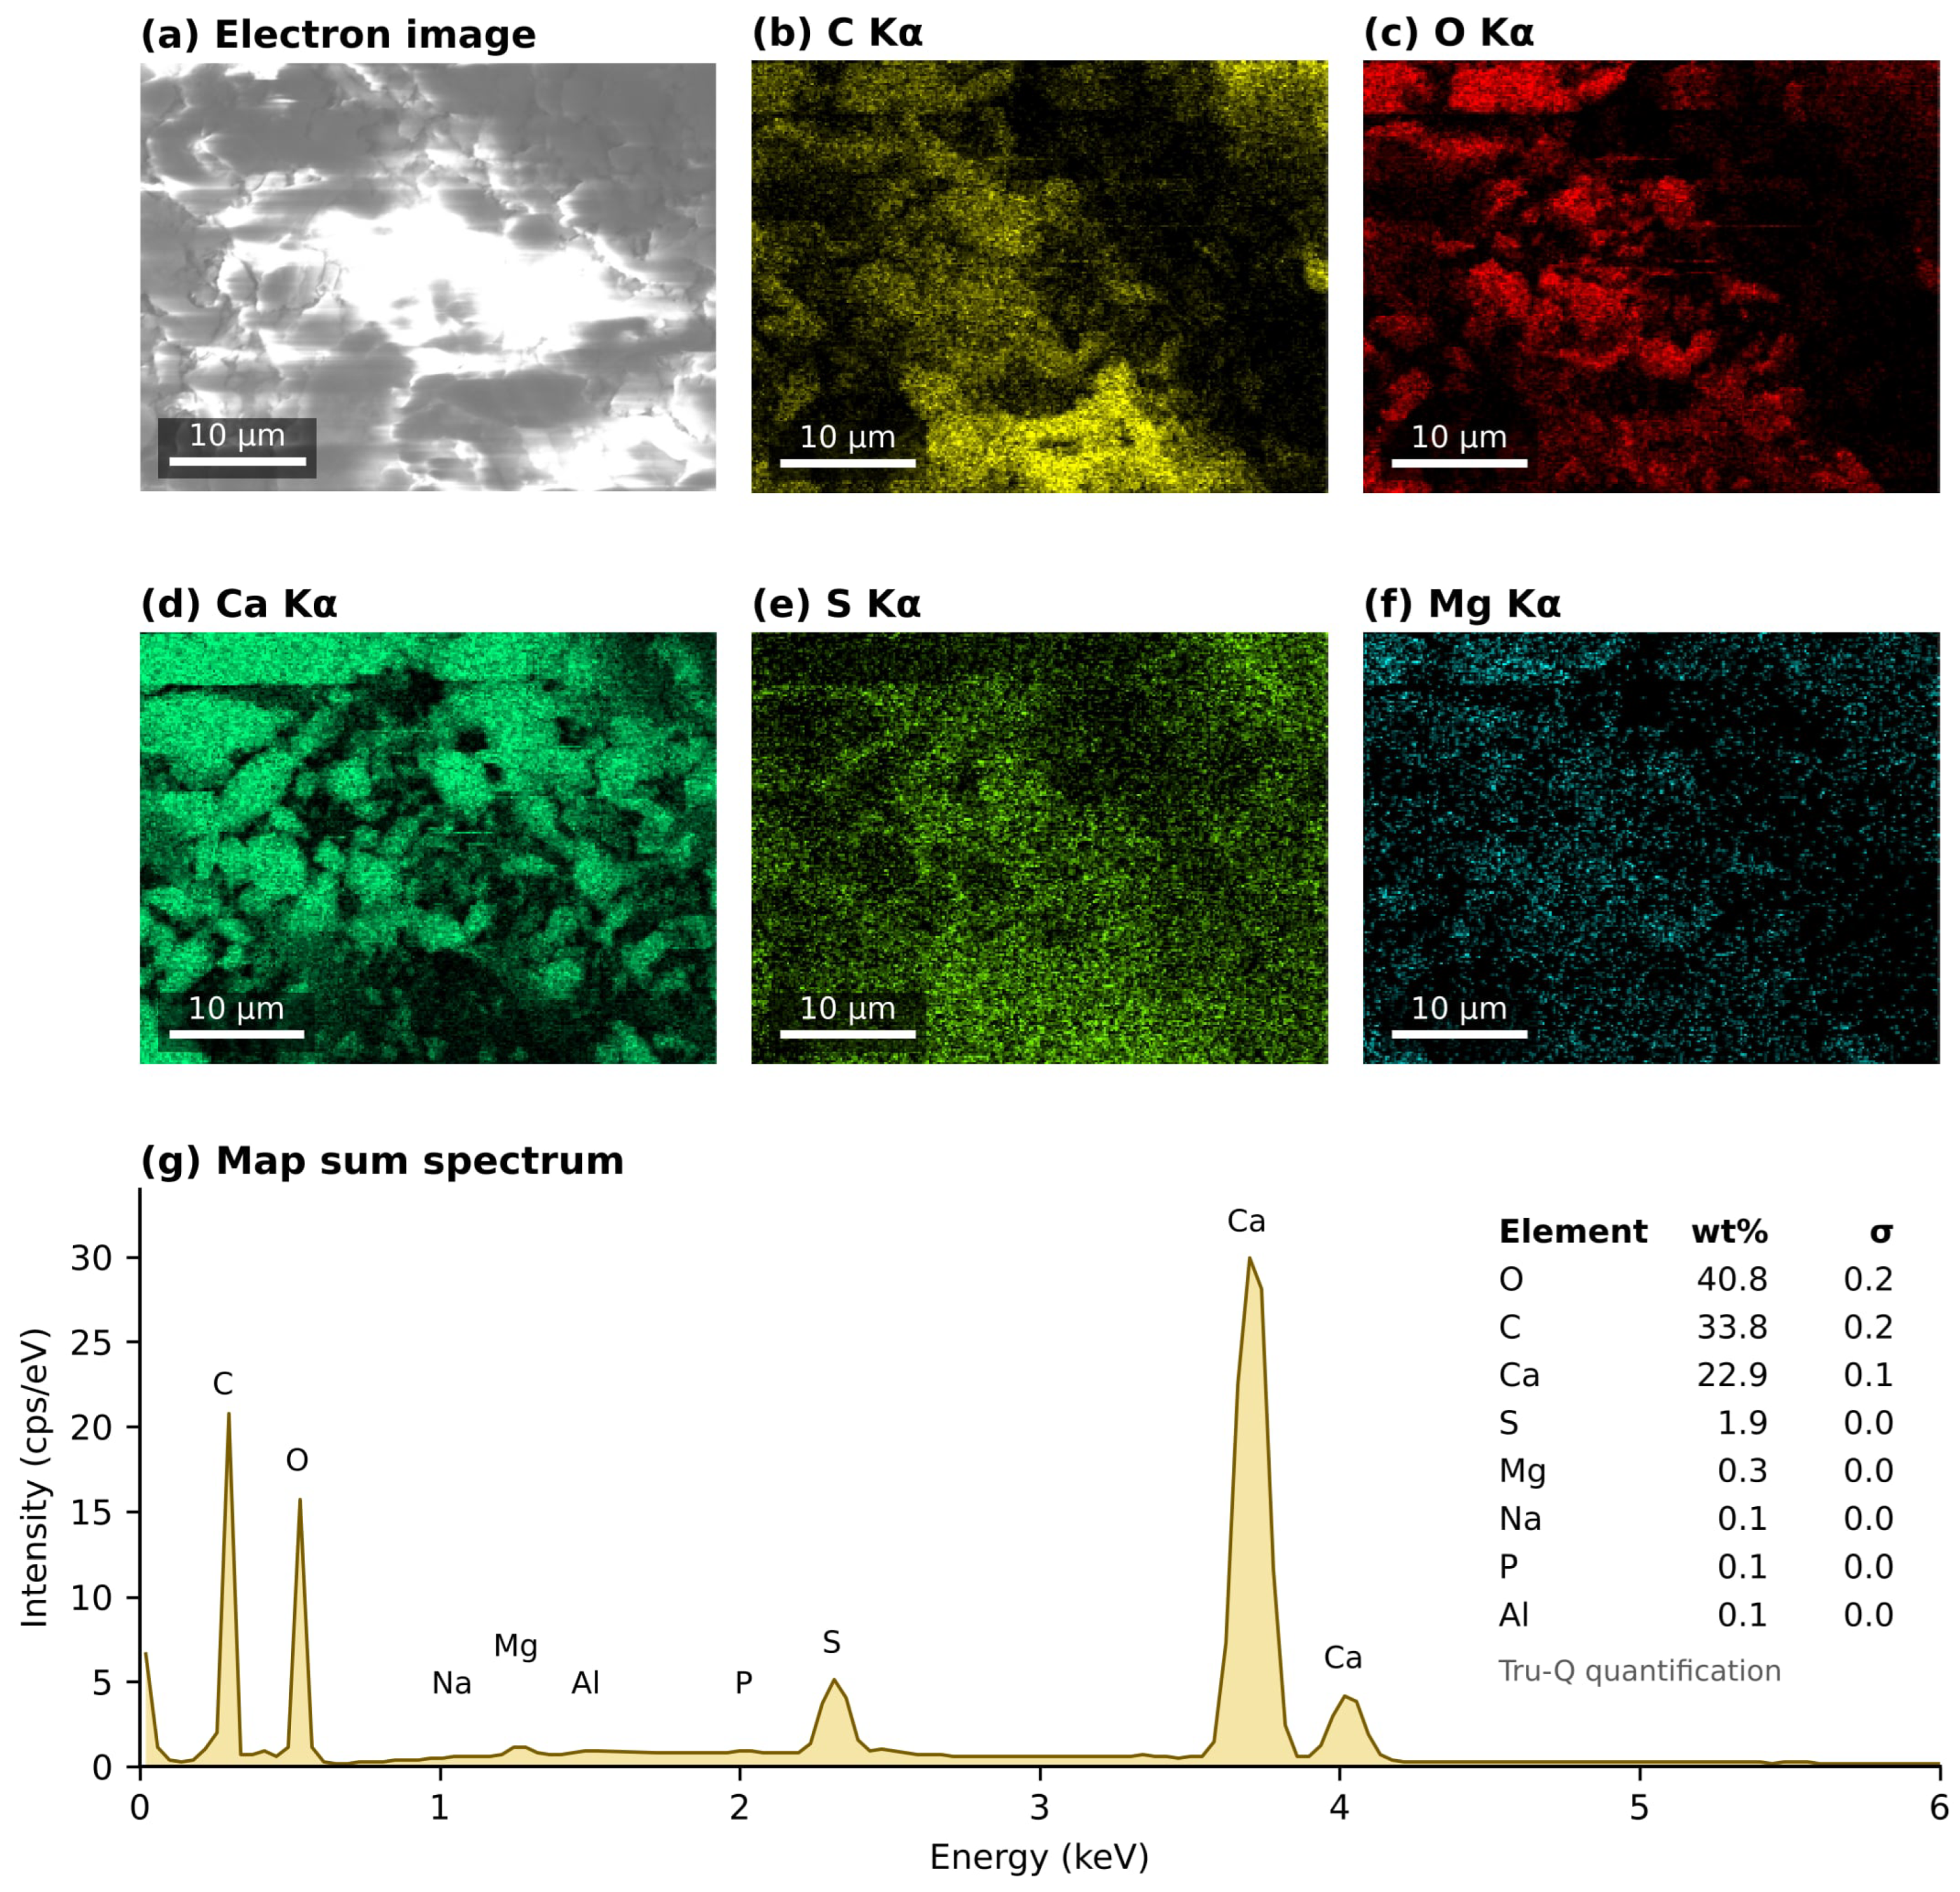
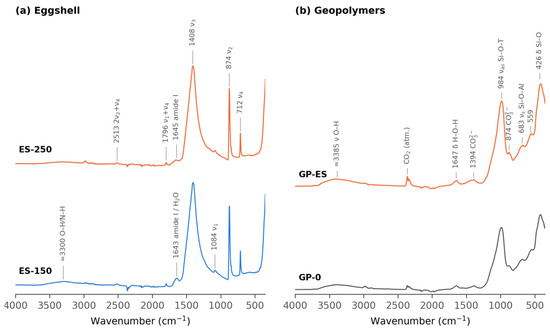
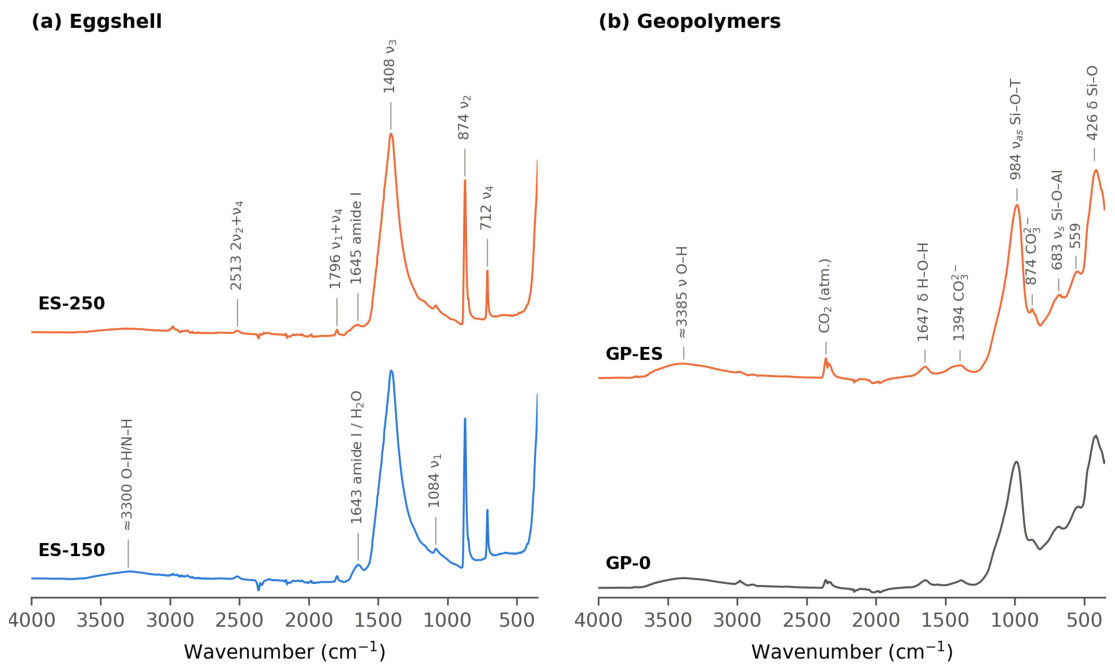
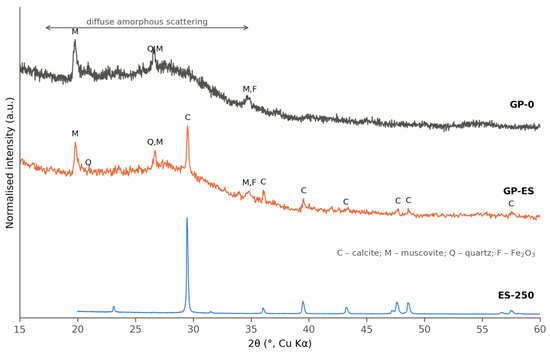
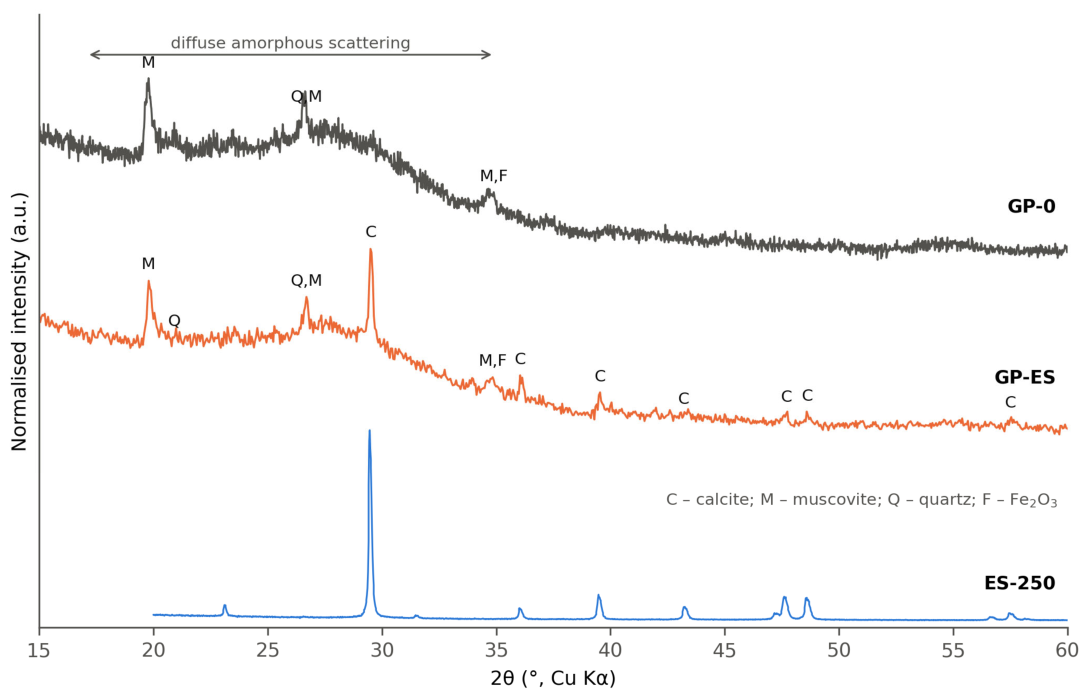
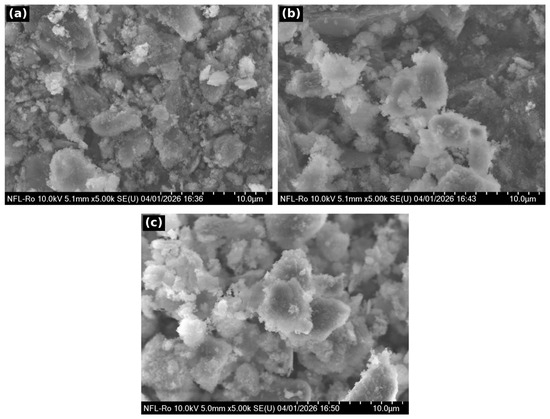
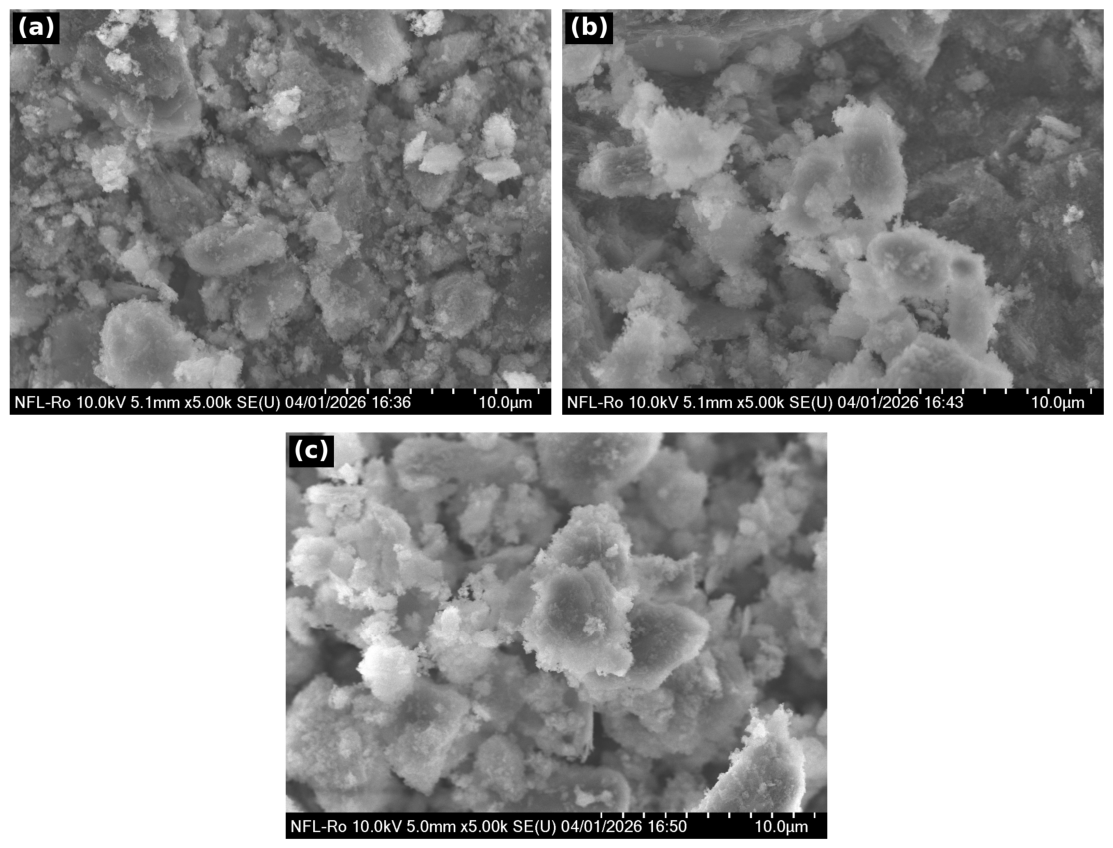
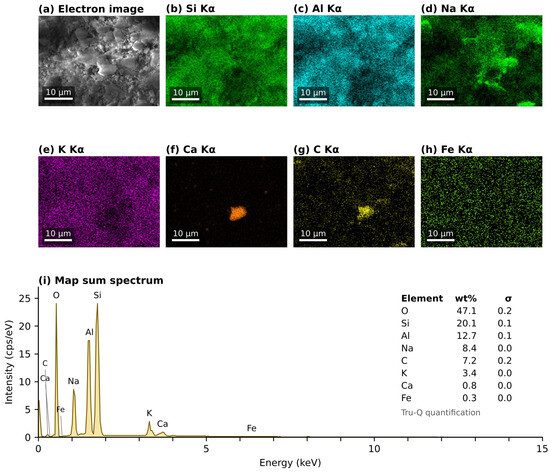
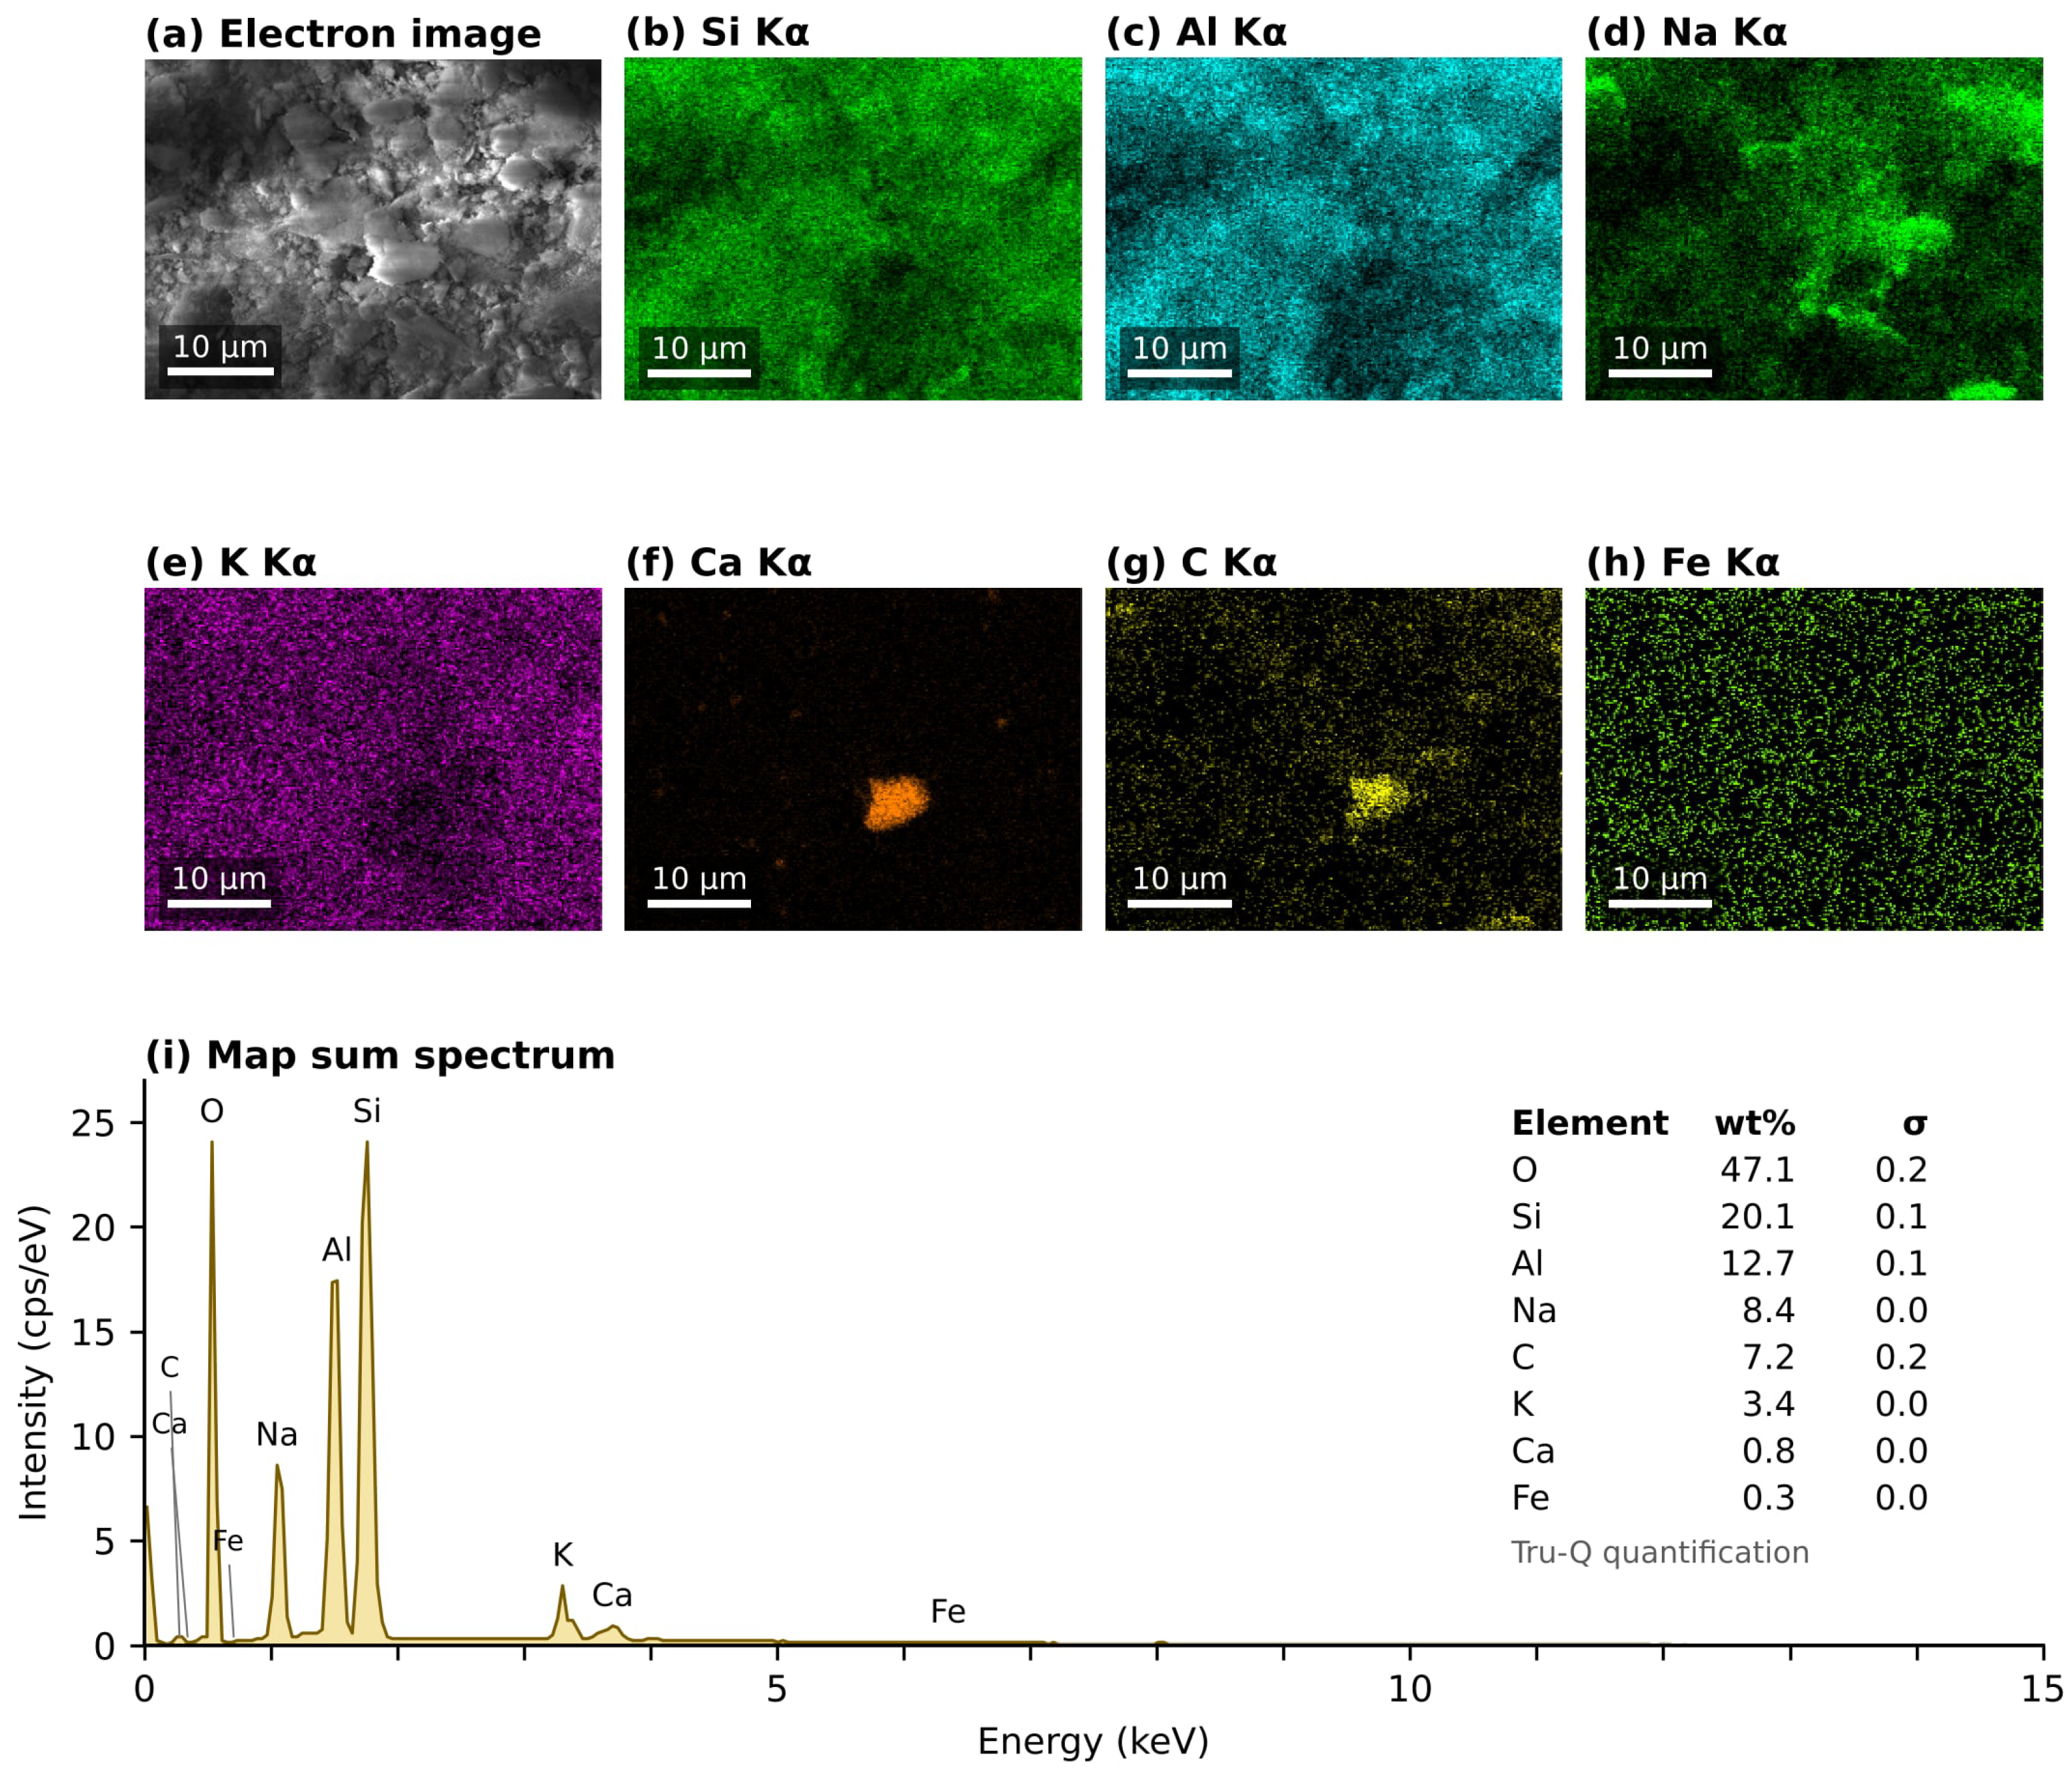
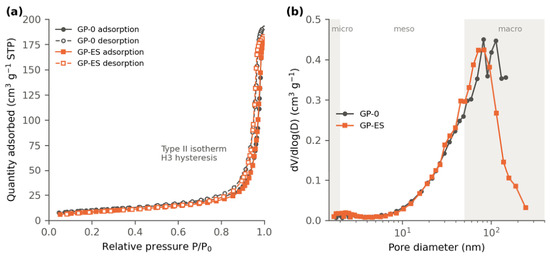
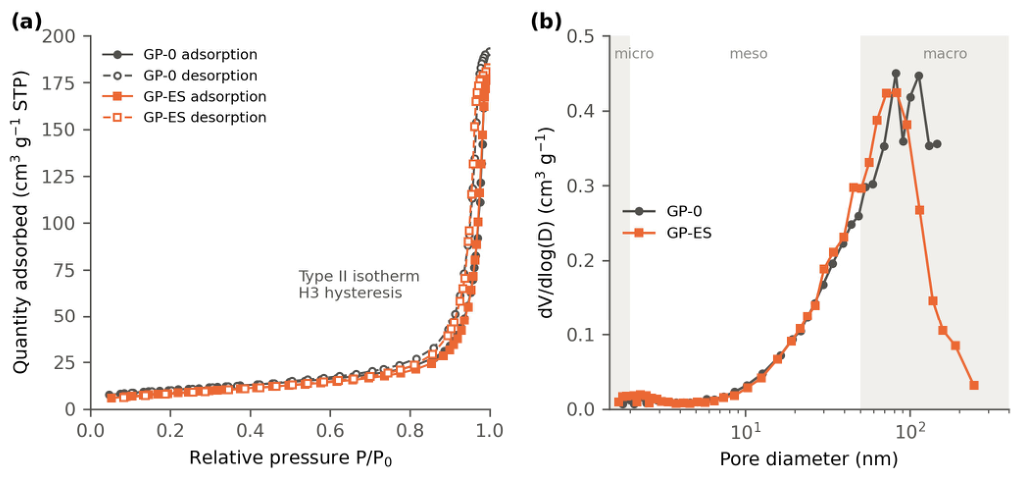
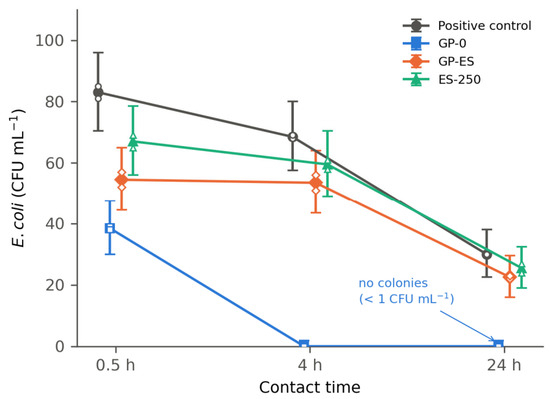
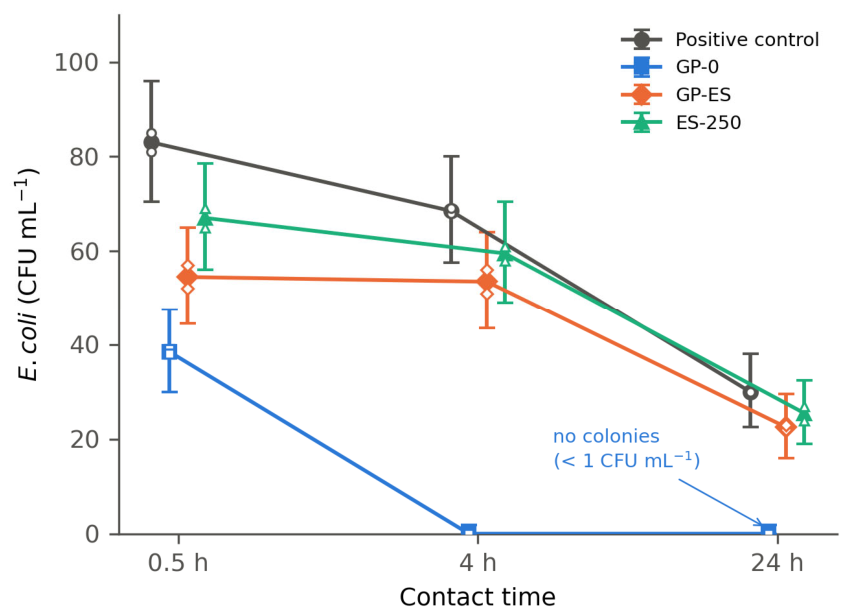
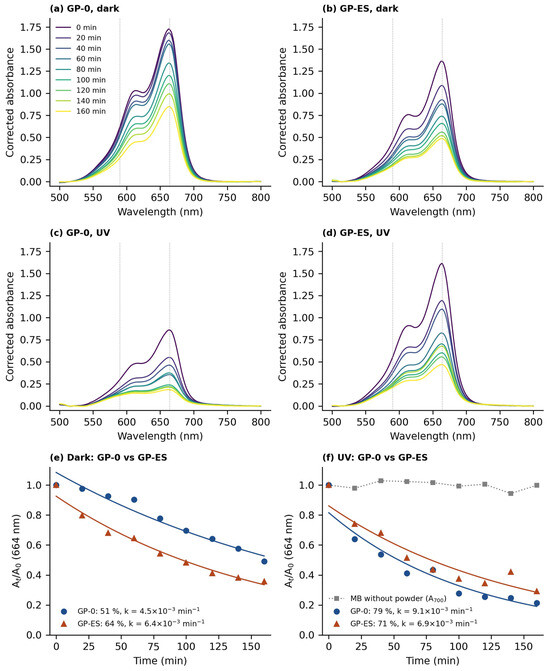
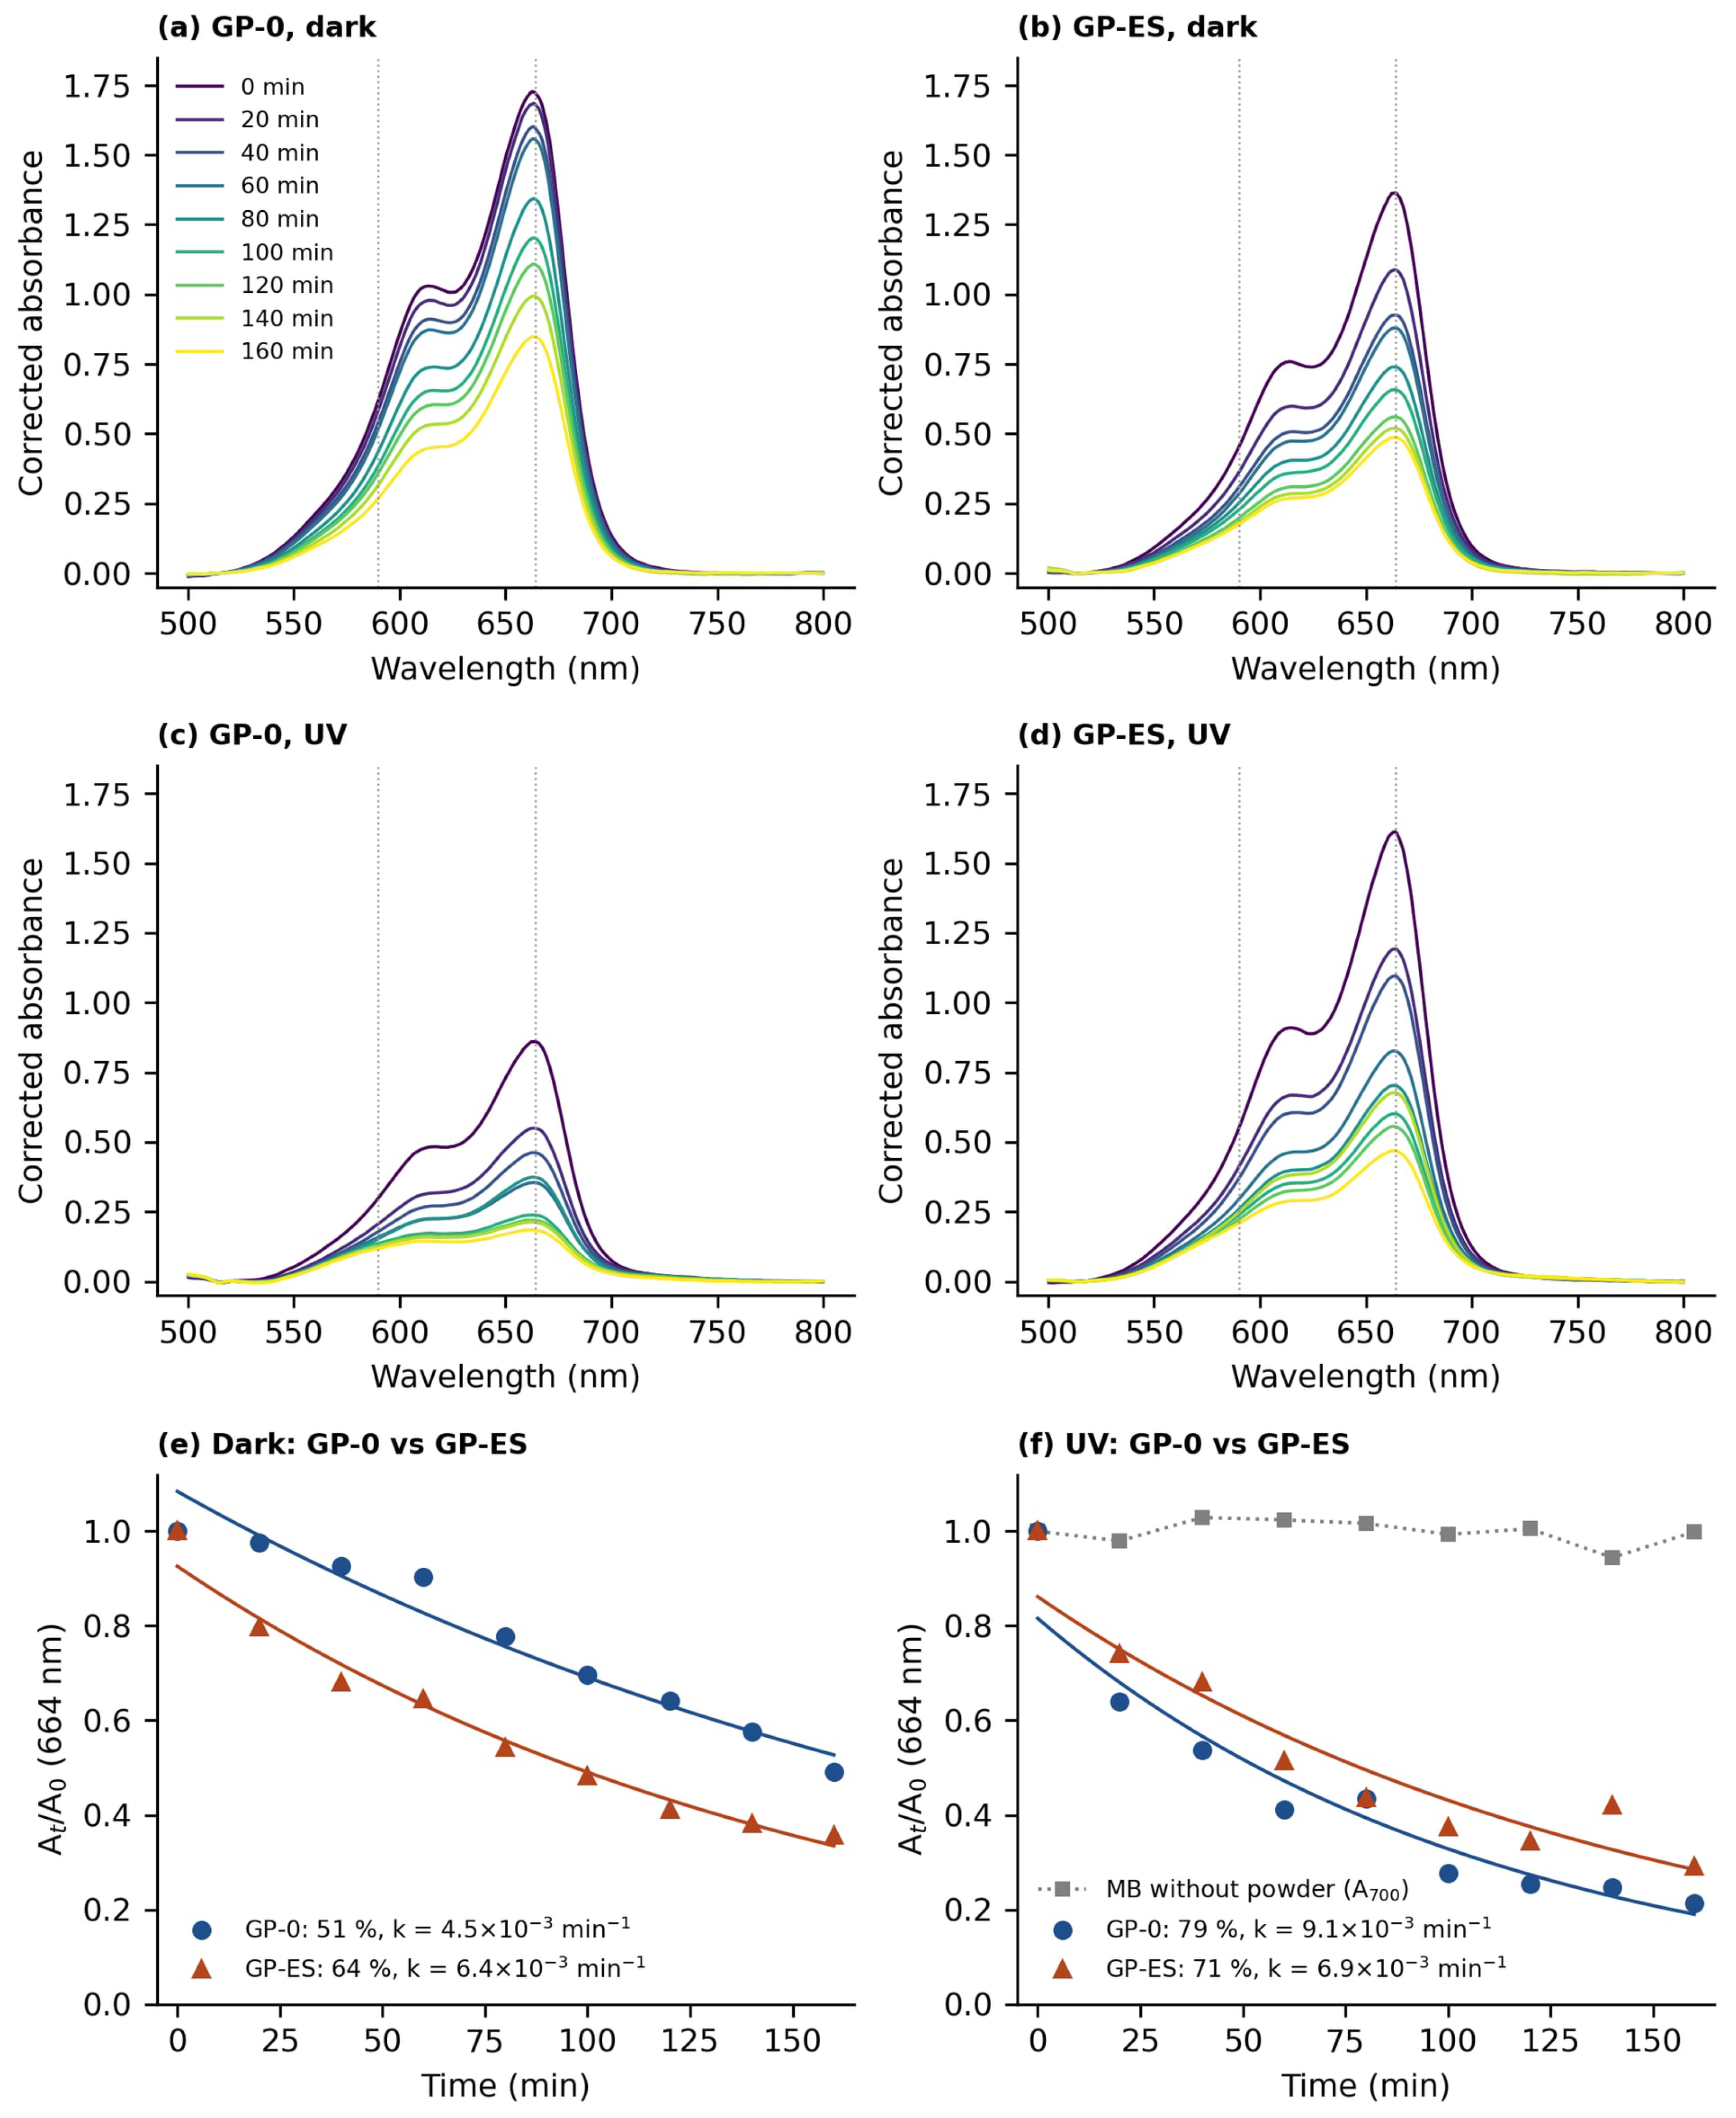
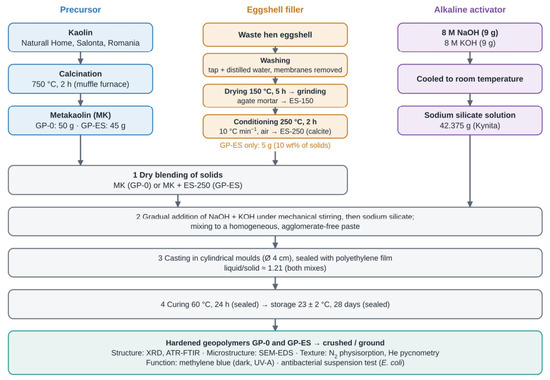
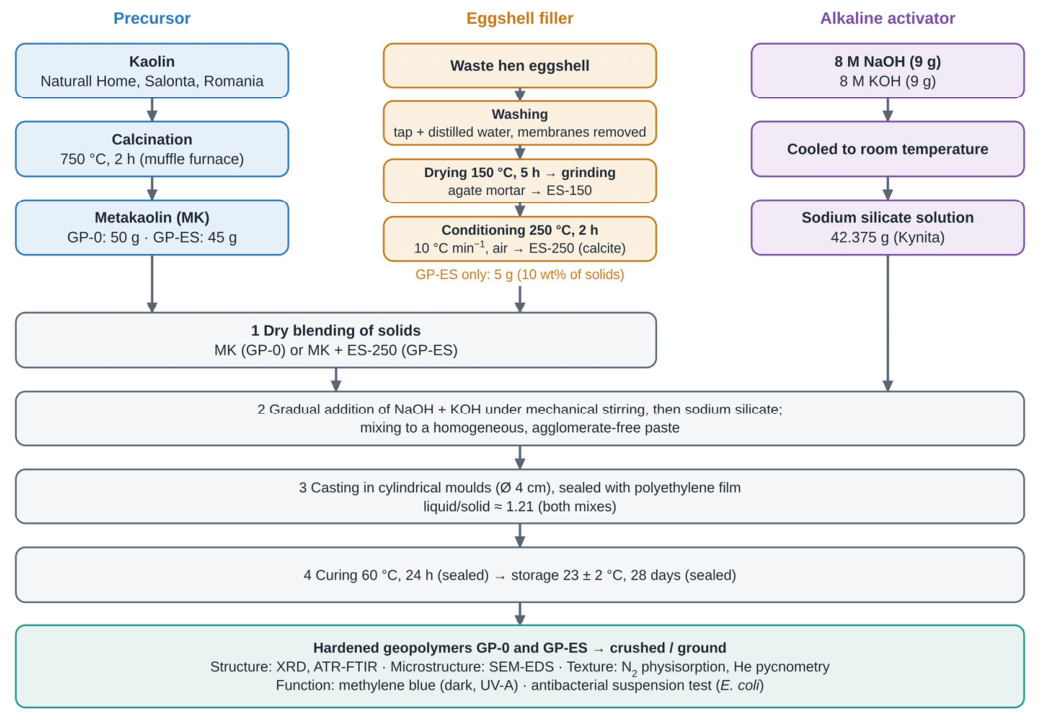

Disclaimer/Publisher’s Note: The statements, opinions and data contained in all publications are solely those of the individual author(s) and contributor(s) and not of MDPI and/or the editor(s). MDPI and/or the editor(s) disclaim responsibility for any injury to people or property resulting from any ideas, methods, instructions or products referred to in the content. |
© 2026 by the authors. Licensee MDPI, Basel, Switzerland. This article is an open access article distributed under the terms and conditions of the Creative Commons Attribution (CC BY) license.