


Abstract
Background: The Prognostic Nutritional Index (PNI), derived from serum albumin and lymphocyte count, integrates nutritional, inflammatory, and immune status. Objective: To evaluate the association between the PNI and 10-year all-cause mortality after acute myocardial infarction (AMI). Methods: We retrospectively analyzed consecutive AMI survivors with available albumin and lymphocyte data. PNI was analyzed continuously and across four categories (<40, 40–45, 45–50, and ≥50). The primary outcome was all-cause mortality through 10 years after discharge. Results: The cohort included 14,834 patients (mean age 65.6 ± 13.9 years; 69.7% men); median PNI was 46.35 (IQR 41.50–51.15). During a median follow-up of 3004 days, 6744 (45.5%) patients died. Mortality demonstrated a graded inverse relationship with PNI: 76.4%, 57.2%, 39.1%, and 22.2% across increasing PNI categories (p-for-trend < 0.001). Each 1-unit decrease in PNI was independently associated with a 2.8% higher mortality hazard (AdjHR 1.028, 95% CI 1.022–1.034; p < 0.001). Compared with PNI ≥ 50, AdjHRs were 1.409, 1.510, and 1.899 for PNI 45–50, 40–45, and <40, respectively (all p < 0.001). Adding PNI improved the C-index from 0.807 to 0.812 and 10-year AUC from 0.859 to 0.865 (both p < 0.001). Conclusions: Lower admission PNI was independently and progressively associated with long-term mortality after AMI and provided modest incremental discrimination beyond a comprehensive clinical model. As an inexpensive index derived from readily available laboratory testing, PNI may complement post-AMI risk assessment; prospective validation is warranted.
1. Introduction
The prognosis after acute myocardial infarction (AMI) is determined not only by the extent of myocardial injury and coronary disease, but also by age, comorbidity burden, ventricular function, treatment strategy, systemic inflammation, and physiologic reserve [1,2]. Contemporary reperfusion and secondary-prevention strategies have improved short-term survival, increasing the importance of identifying readily available markers that may refine long-term risk assessment among patients who survive the index hospitalization [2,3].
The Prognostic Nutritional Index (PNI) is a simple composite measure derived from serum albumin concentration and peripheral lymphocyte count. Originally developed to characterize immunonutritional status in surgical populations, PNI has subsequently been evaluated across oncology, critical illness, cardiovascular diseases, and other clinical settings [4,5,6,7,8,9,10,11]. The index is attractive because its two components are readily available, inexpensive, and biologically linked to systemic illness: albumin reflects nutritional reserve, but is also strongly influenced by inflammation, hepatic synthesis, vascular permeability, and catabolic state; whereas lymphocyte count may reflect immune competence and stress-related inflammatory responses [12,13].
Prior studies have associated lower PNI with adverse outcomes in patients with ST-segment elevation myocardial infarction (STEMI), acute coronary syndromes (ACS), and critically ill AMI populations [14,15,16,17]. However, many reports have been limited by relatively small cohorts, selected populations undergoing percutaneous coronary intervention (PCI), short or intermediate follow-up, or dichotomization of PNI at a single threshold. Recent meta-analyses support an association between low PNI and mortality after AMI or ACS, while also demonstrating substantial heterogeneity across studies [18,19]. In addition, the magnitude of incremental prognostic information supplied by PNI beyond comprehensive clinical characteristics remains incompletely defined.
Both components of PNI carry long-term prognostic information after AMI. Lower admission serum albumin was associated with long-term mortality among AMI survivors, and leukocyte subtypes, including lymphocyte measures, were also related to subsequent mortality [13,20]. These observations provide a rationale for evaluating such a composite index that integrates these complementary domains.
Accordingly, the present study aimed to evaluate the association between admission PNI and all-cause mortality during up to 10 years of follow-up in a large, real-world cohort of AMI survivors.
2. Materials and Methods
2.1. Study Design and Population
This retrospective cohort study used the Soroka Acute Myocardial Infarction (SAMI) registry at Soroka University Medical Center (SUMC), a tertiary medical center in southern Israel. The registry includes consecutive AMI hospitalizations and has been described in prior publications from the SAMI program [13,20]. Adult patients hospitalized with AMI (1 January 2002–25 October 2017) as the primary diagnosis were considered for inclusion. Patients were excluded if age was unavailable, if they were not Israeli citizens, if admission albumin and/or lymphocyte measurements required for PNI calculation were unavailable, or if they died during the index hospitalization. For patients with more than one AMI hospitalization during the study period, the earliest hospitalization with complete PNI data was selected as the index event.
2.2. Data Collection and Definitions
Clinical data were obtained from the institutional electronic medical record and registry infrastructure. Baseline comorbidities and clinical diagnoses were based on diagnoses documented during routine care, consistent with prior SAMI publications [13,20]. AMI was identified using the International Classification of Diseases, Ninth Revision, Clinical Modification (ICD-9-CM) discharge diagnosis code 410, based on the clinical diagnostic criteria applicable during the study period, including ischemic symptoms and/or electrocardiographic changes together with a characteristic rise and fall in cardiac biomarkers. STEMI and non-ST-segment elevation myocardial infarction (NSTEMI) were classified using ICD-9-CM codes 410.0–410.6 and 410.7–410.9, respectively, as previously described [13,20]. Available variables included demographics, cardiovascular and noncardiovascular comorbidities, cardiovascular risk factors, body mass index (BMI), laboratory measurements, AMI type, intensive cardiac care unit admission, length of stay, echocardiographic findings, angiographic extent of coronary artery disease, treatment strategy, and major in-hospital events.
As previously described [13,20], baseline comorbidities, including heart failure, chronic obstructive pulmonary disease (COPD), malignancy, and schizophrenia/psychosis were identified from the institutional electronic medical records using ICD-9-CM diagnostic codes documented by the treating physicians. Anemia was defined as hemoglobin < 13 g/dL in men or <12 g/dL in women. COPD was identified using ICD-9-CM codes 491, 492, and 496.
Echocardiographic findings were obtained from the original clinical reports. Severe left ventricular (LV) systolic dysfunction was defined as a left ventricular ejection fraction < 30%, and pulmonary hypertension as an estimated pulmonary artery systolic pressure ≥ 37 mmHg on the initial in-hospital echocardiogram. Tricuspid regurgitation was graded by experienced echocardiographers in accordance with American Society of Echocardiography guidelines, with moderate or greater regurgitation considered clinically significant.
Patients who underwent both PCI and CABG during the index hospitalization were classified in the CABG group. Blood transfusion was identified using ICD-9-CM procedure code 99.0.
PNI was calculated using serum albumin concentrations and total lymphocyte counts obtained during the initial hospital evaluation, including measurements performed in the emergency department before formal admission or within 24 h of hospital admission. Total lymphocyte counts were obtained from routine complete blood counts with differential performed by the hospital’s clinical laboratory. When multiple measurements were available, the earliest eligible measurement was used.
PNI was calculated using the established formula: PNI = [10 × serum albumin (g/dL)] + [0.005 × total lymphocyte count (/µL)] [4,5,6,7,8,9,10,11]. PNI was analyzed as a continuous variable and in four prespecified categories: <40, 40–45, 45–50, and ≥50 [11].
2.3. Outcome and Follow-Up
The study outcome was all-cause mortality. Vital status was ascertained through linkage with the Israeli Ministry of the Interior Population Registry, consistent with prior SAMI studies. Follow-up extended from hospital discharge until death, 10 years after discharge (maximum 3652 days), or 31 July 2023, whichever occurred first.
2.4. Statistical Analysis
All statistical analyses were conducted using IBM SPSS Statistics version 31 and R version 4.6.2. Categorical data are presented as counts and percentages, and continuous data as mean ± standard deviation (SD) or median with interquartile range (IQR), according to their distribution. Differences in baseline characteristics across PNI categories were assessed using Pearson’s chi-square test, including tests for linear trend where appropriate, for categorical variables, and analysis of variance (ANOVA), with linear trend testing when applicable, for continuous variables.
Time-to-event analyses were performed using Kaplan–Meier estimates, with differences between survival curves assessed by the log-rank test. The proportional hazards assumption was examined graphically using log-minus-log survival plots. Cox proportional hazards regression was used to evaluate the association between PNI and all-cause mortality, with results expressed as hazard ratios (HRs) and adjusted hazard ratios (AdjHRs) with 95% confidence intervals (CIs). PNI was modeled both continuously and using the four prespecified categories; PNI ≥ 50 was the reference group for categorical analyses. Multivariable models incorporated clinically relevant covariates together with variables associated with mortality in univariable analysis at p < 0.10. Effect modification was explored in prespecified subgroups by incorporating interaction terms between PNI and each subgroup variable into the adjusted Cox models. Missing BMI data were handled using a complete-case approach in the primary multivariable Cox regression analysis. Patients without echocardiographic assessment were retained in the analysis through a separate category indicating that echocardiography was not performed. To evaluate the potential influence of missing BMI data, an additional sensitivity analysis was performed using a multivariable Cox regression model excluding BMI while retaining the remaining covariates. Interaction p-values were used to assess heterogeneity of associations, and subgroup-specific estimates are reported as AdjHRs with 95% CIs.
The shape of the relationship between continuous PNI and mortality was further explored using restricted cubic splines within the adjusted Cox model. Four knots were positioned at the 5th, 35th, 65th, and 95th percentiles of the PNI distribution. Evidence of nonlinearity was assessed using a Wald test of the nonlinear spline terms.
The incremental prognostic contribution of PNI was assessed by comparing the baseline multivariable model with an extended model incorporating PNI categories. Discrimination was quantified using Harrell’s concordance index (C-index) and the time-dependent area under the receiver operating characteristic curve (AUC) for 10-year mortality. Changes in the C-index and AUC were evaluated using bootstrap-derived 95% CIs. Relative model fit was assessed using the likelihood ratio test and Akaike information criterion (AIC). Calibration of the PNI-extended model at 10 years was evaluated using an optimism-corrected calibration plot generated from 1000 bootstrap resamples, comparing predicted with observed mortality probabilities against the line of perfect calibration. All tests were two-sided, with p < 0.05 considered statistically significant.
2.5. Ethics
The SAMI project conformed to the principles of the Declaration of Helsinki and was approved by the Soroka University Medical Center Institutional Review Board (SOR-0174-23). The requirement for informed consent was waived because of the retrospective study design.
3. Results
3.1. Study Cohort and PNI Distribution
The source dataset included 17,656 patients accounting for 25,240 AMI admissions. Following sequential application of the predefined eligibility criteria, selection of the first eligible admission per patient with available albumin and lymphocyte measurements, and exclusion of 1159 patients who died during hospitalization, the final study cohort comprised 14,834 AMI survivors. The detailed selection process, including exclusion criteria and corresponding patient numbers, is presented in Supplementary Figure S1. Mean age was 65.6 ± 13.9 years, and 10,341 (69.7%) were men.
Mean serum albumin was 3.70 ± 0.48 g/dL (median 3.7, IQR 3.4–4.0), mean lymphocyte count was 1.93 ± 1.17 × 10³/µL (median 1.70, IQR 1.19–2.38), and mean PNI was 46.67 ± 8.12 (median 46.35, IQR 41.50–51.15; range 15.40–107.35). Albumin and lymphocyte count demonstrated a weak positive correlation (r = 0.158; p < 0.001). Overall, 2840 patients (19.1%) had PNI < 40, 3478 (23.3%) had PNI 40–45, 4105 (27.7%) had PNI 45–50, and 4411 (29.7%) had PNI ≥ 50.
3.2. Baseline Characteristics Across PNI Categories
Lower PNI identified a substantially older and more comorbid population (Table 1). Mean age decreased progressively across the PNI groups (p for trend < 0.001), while the proportion of men increased. Lower PNI was associated with higher prevalence of congestive heart failure, renal disease, peripheral vascular disease, chronic obstructive pulmonary disease, neurological disease, malignancy, anemia, prior MI, and several markers of more severe acute illness. Severe LV dysfunction and un hospital complications, such as cardiogenic shock, mechanical ventilation, blood transfusion, and sepsis were more frequent at lower PNI. On the other hand, higher-PNI patients were more often treated invasively.
Table 1.
Baseline characteristics of the study population by prognostic nutritional index (PNI) category.
3.3. Long-Term Mortality
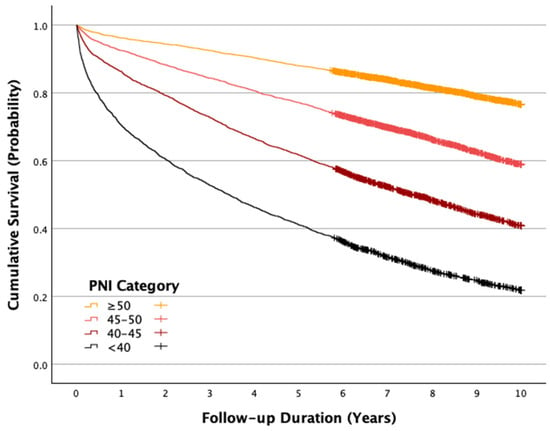
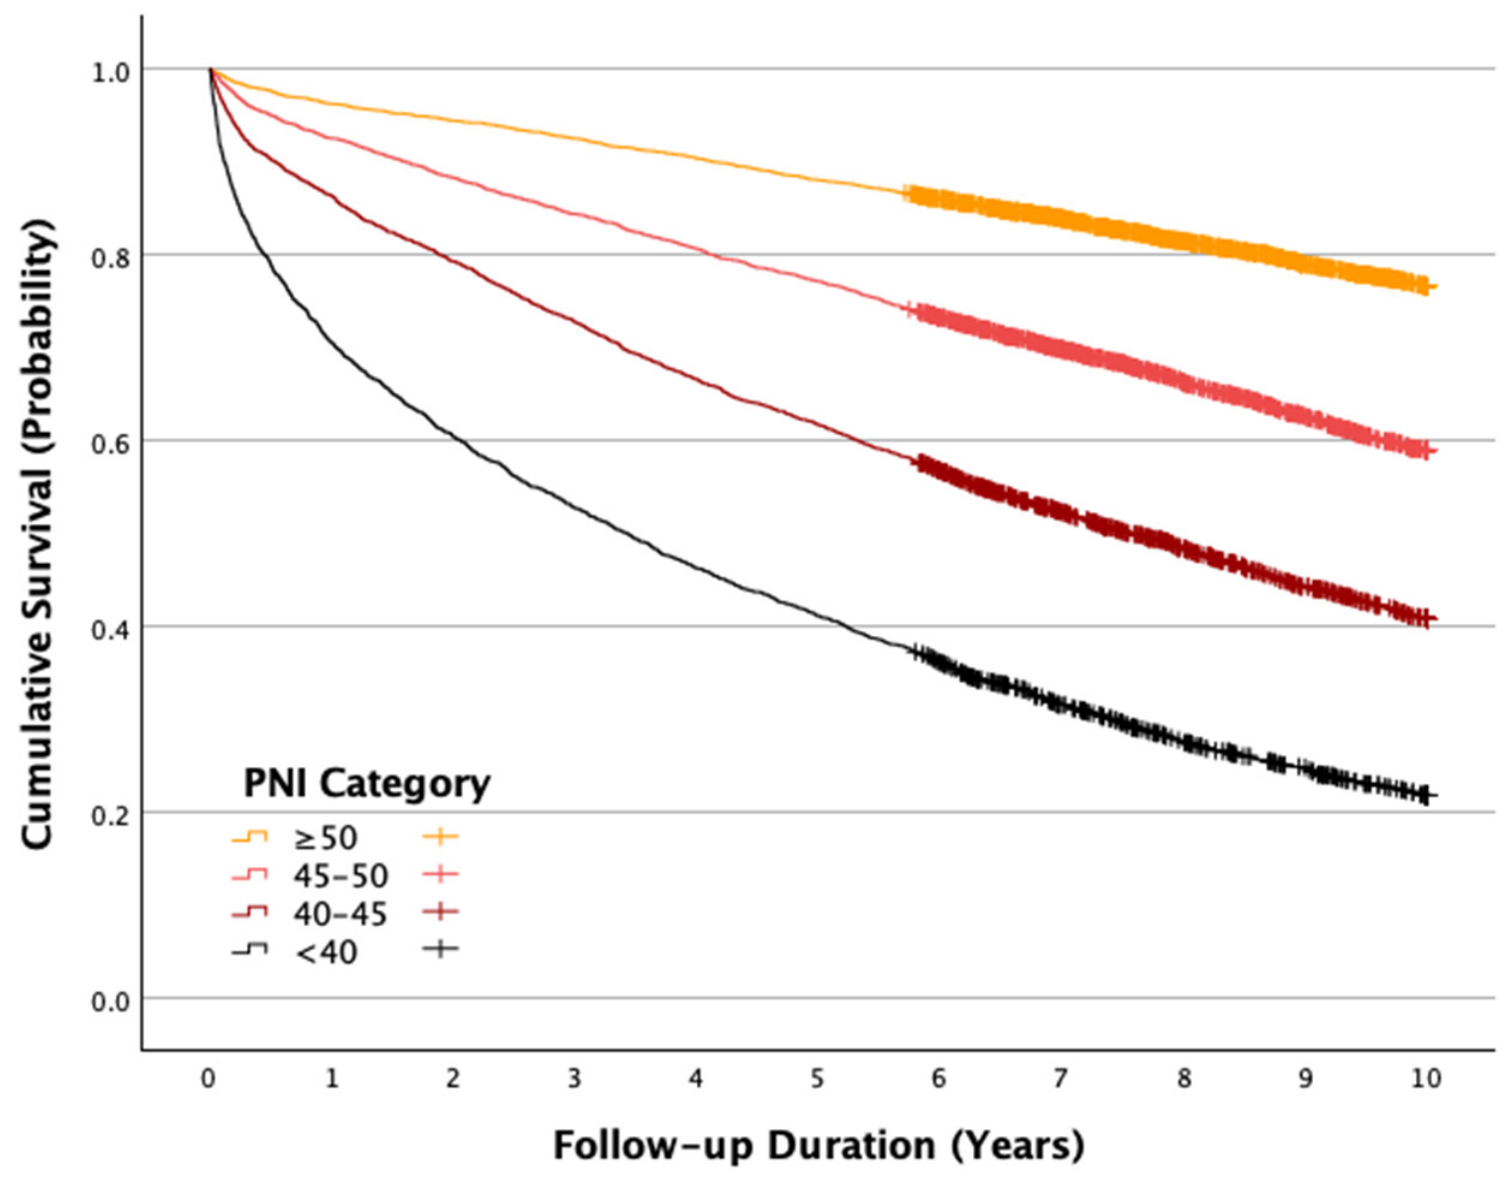
Median follow-up was 3004.5 days (IQR 1344–3652), with follow-up capped at 10 years. Overall, 6744 patients (45.5%) died. Mortality demonstrated a marked stepwise inverse gradient across PNI categories: 2170/2840 (76.4%) for PNI < 40, 1990/3478 (57.2%) for PNI 40–45, 1606/4105 (39.1%) for PNI 45–50, and 978/4411 (22.2%) for PNI ≥ 50 (p for trend < 0.001). Similarly, the estimated cumulative mortalities decreased across increasing PNI categories, from 0.782 to 0.591, 0.410, and 0.234, respectively (p for trend < 0.001). Kaplan–Meier curves separated early and remained progressively divergent during follow-up (Figure 1).
Figure 1.
Kaplan–Meier survival curves according to prognostic nutritional index (PNI) category and long-term mortality after acute myocardial infarction. Abbreviation: PNI; prognostic nutritional index.
In unadjusted categorical Cox analysis, compared with PNI ≥ 50, mortality hazards were 1.981 (95% CI 1.830–2.145) for PNI 45–50, 3.436 (95% CI 3.183–3.710) for PNI 40–45, and 6.256 (95% CI 5.798–6.750) for PNI < 40 (all p < 0.001).
3.4. Multivariable Association Between PNI and Mortality
After adjustment for the comprehensive clinical model, lower PNI remained independently associated with mortality. When modeled continuously, each 1-unit decrease in PNI was associated with a 2.8% higher mortality hazard (AdjHR 1.028, 95% CI 1.022–1.034; p < 0.001) (Supplementary Table S1).
A graded association also persisted when PNI was modeled categorically. Relative to PNI ≥ 50, AdjHRs were 1.409 (95% CI 1.238–1.604) for PNI 45–50, 1.510 (95% CI 1.324–1.722) for PNI 40–45, and 1.899 (95% CI 1.656–2.178) for PNI < 40 (all p < 0.001) (Table 2). Thus, although adjustment substantially attenuated the unadjusted association, PNI retained an independent, dose-ordered relationship with long-term mortality.
Table 2.
Relationship between prognostic nutritional index (PNI) level category and long-term mortality after acute myocardial infarction—multivariable analysis.
In a sensitivity analysis excluding BMI to allow inclusion of a larger study population, lower PNI remained independently associated with increased long-term mortality, with AdjHRs of 1.303, 1.553, and 1.847 for PNI categories of 45–<50, 40–<45, and <40, respectively, compared with PNI ≥ 50 (all p < 0.001; Supplementary Table S1).
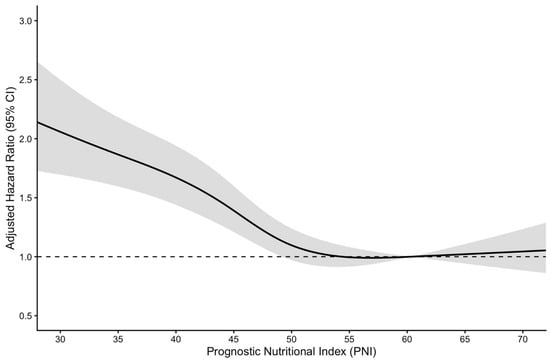
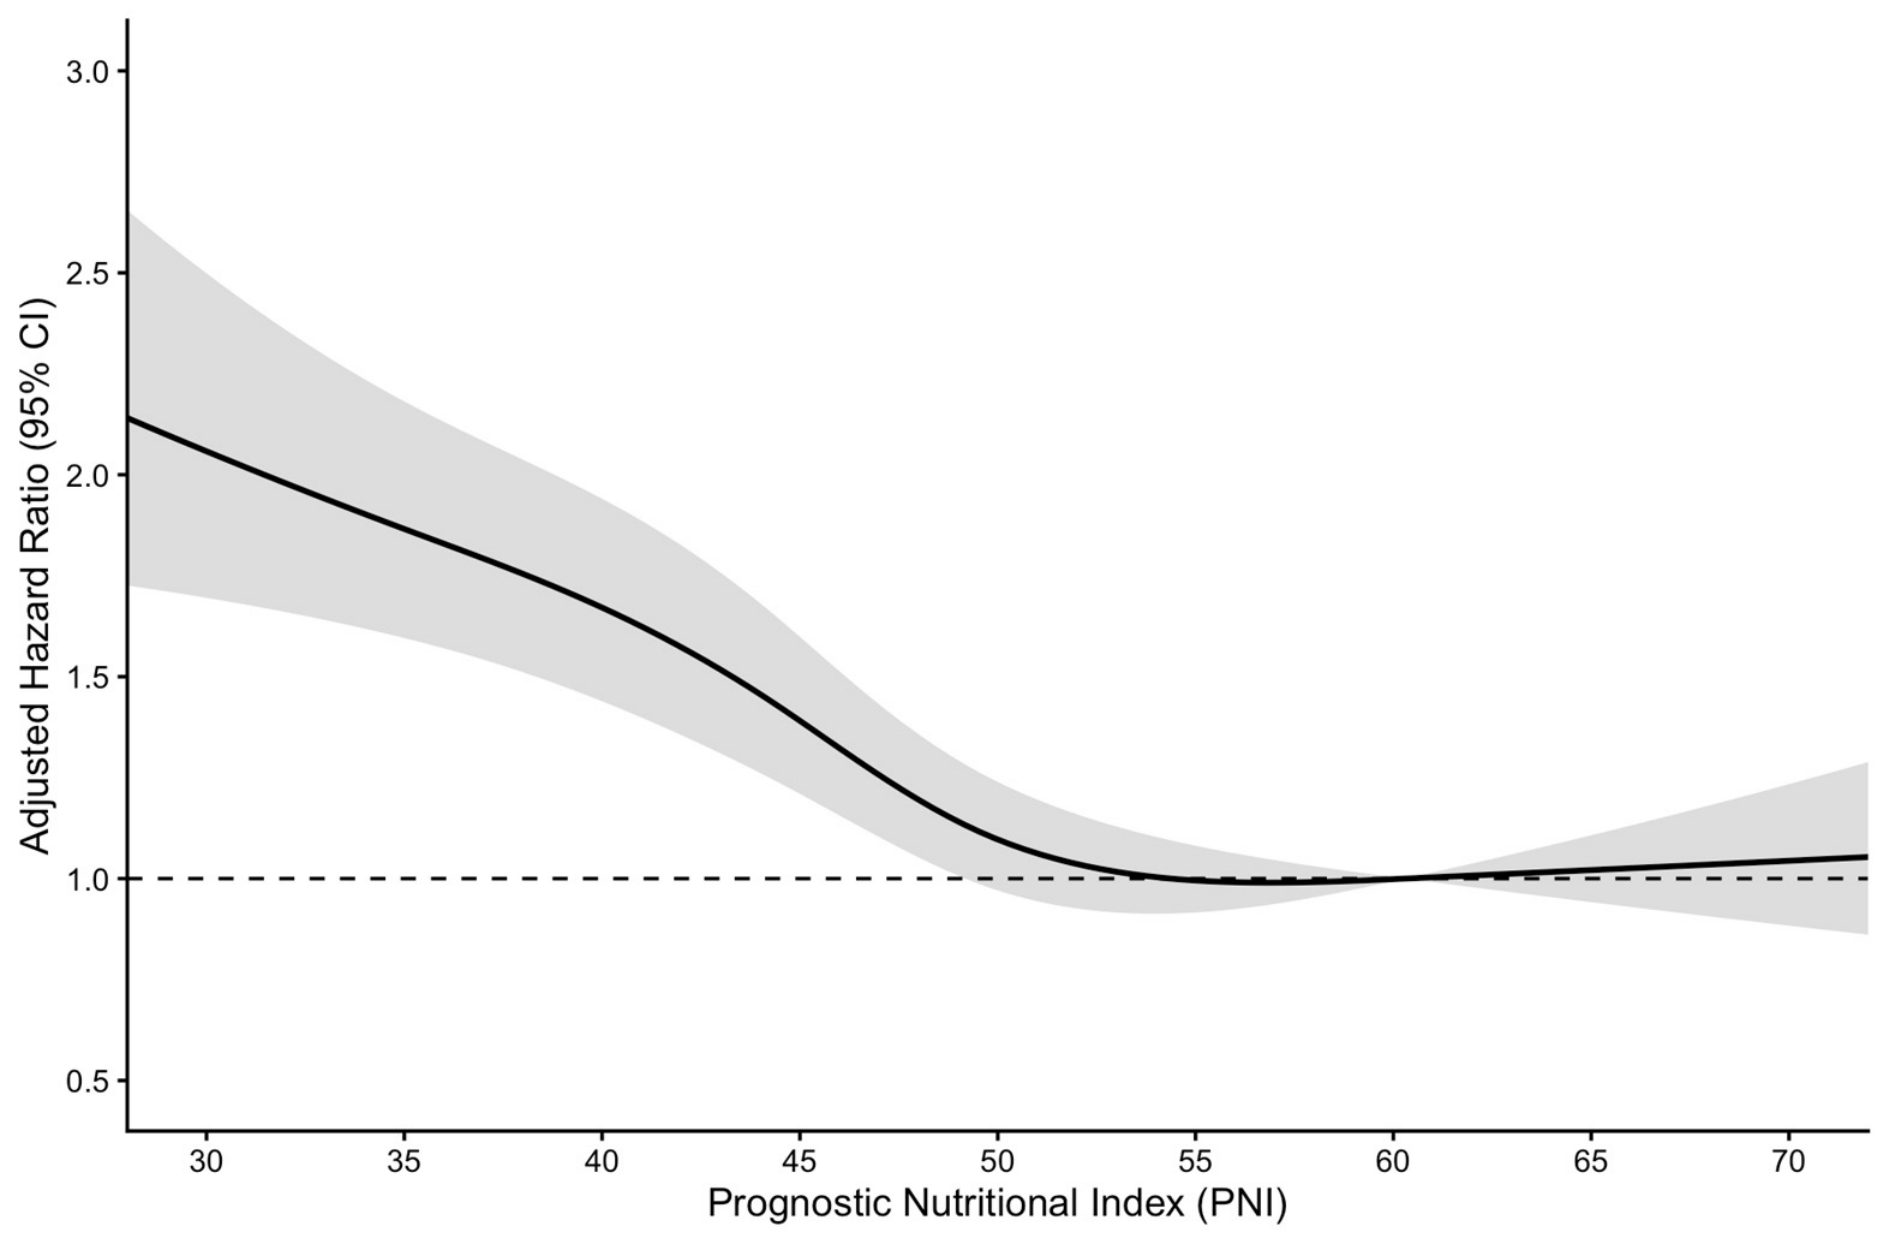
Restricted cubic spline analysis demonstrated a significant overall association between PNI and long-term all-cause mortality (overall p < 0.001), with evidence of a nonlinear relationship (p for nonlinearity < 0.001) (Figure 2). The adjusted mortality hazard increased progressively with decreasing PNI, with a more pronounced increase at lower PNI values, whereas the association became relatively flat at higher PNI levels.
Figure 2.
Adjusted association between prognostic nutritional index (PNI) and long-term mortality using restricted cubic spline analysis. The solid line represents the adjusted hazard ratio (HR), the shaded area indicates the 95% confidence interval (CI), and the dashed horizontal line represents the reference value (HR = 1).
3.5. Subgroup Analyses
The association between lower PNI and mortality was observed across several clinically important subgroups (Supplementary Table S2). There was evidence of effect modification by BMI (p for interaction < 0.001), age (p for interaction = 0.007), and AMI type (p for interaction < 0.001), but not clearly by sex (p for interaction = 0.071). The association was strongest among patients with BMI 18.5–25 kg/m2 (AdjHR 1.053 per 1-unit PNI decrease, 95% CI 1.041–1.064) and remained significant in those with BMI 25–30 kg/m2 (AdjHR 1.022, 95% CI 1.011–1.032). It was not statistically significant within the underweight or obesity categories in the provided subgroup analysis. Lower PNI was associated with mortality in both women (AdjHR 1.024, 95% CI 1.012–1.035) and men (AdjHR 1.030, 95% CI 1.021–1.038). The association was stronger in STEMI (AdjHR 1.042, 95% CI 1.029–1.054) than non-ST-segment elevation MI (NSTEMI) (AdjHR 1.021, 95% CI 1.014–1.030).
3.6. Incremental Prognostic Value and Calibration
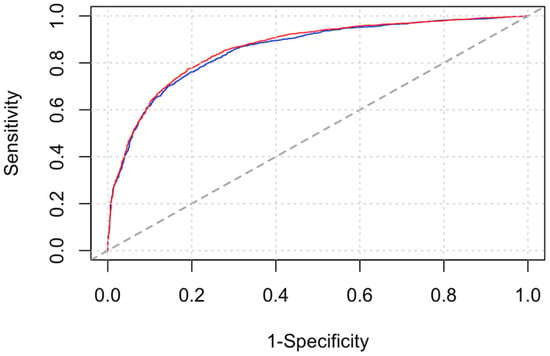
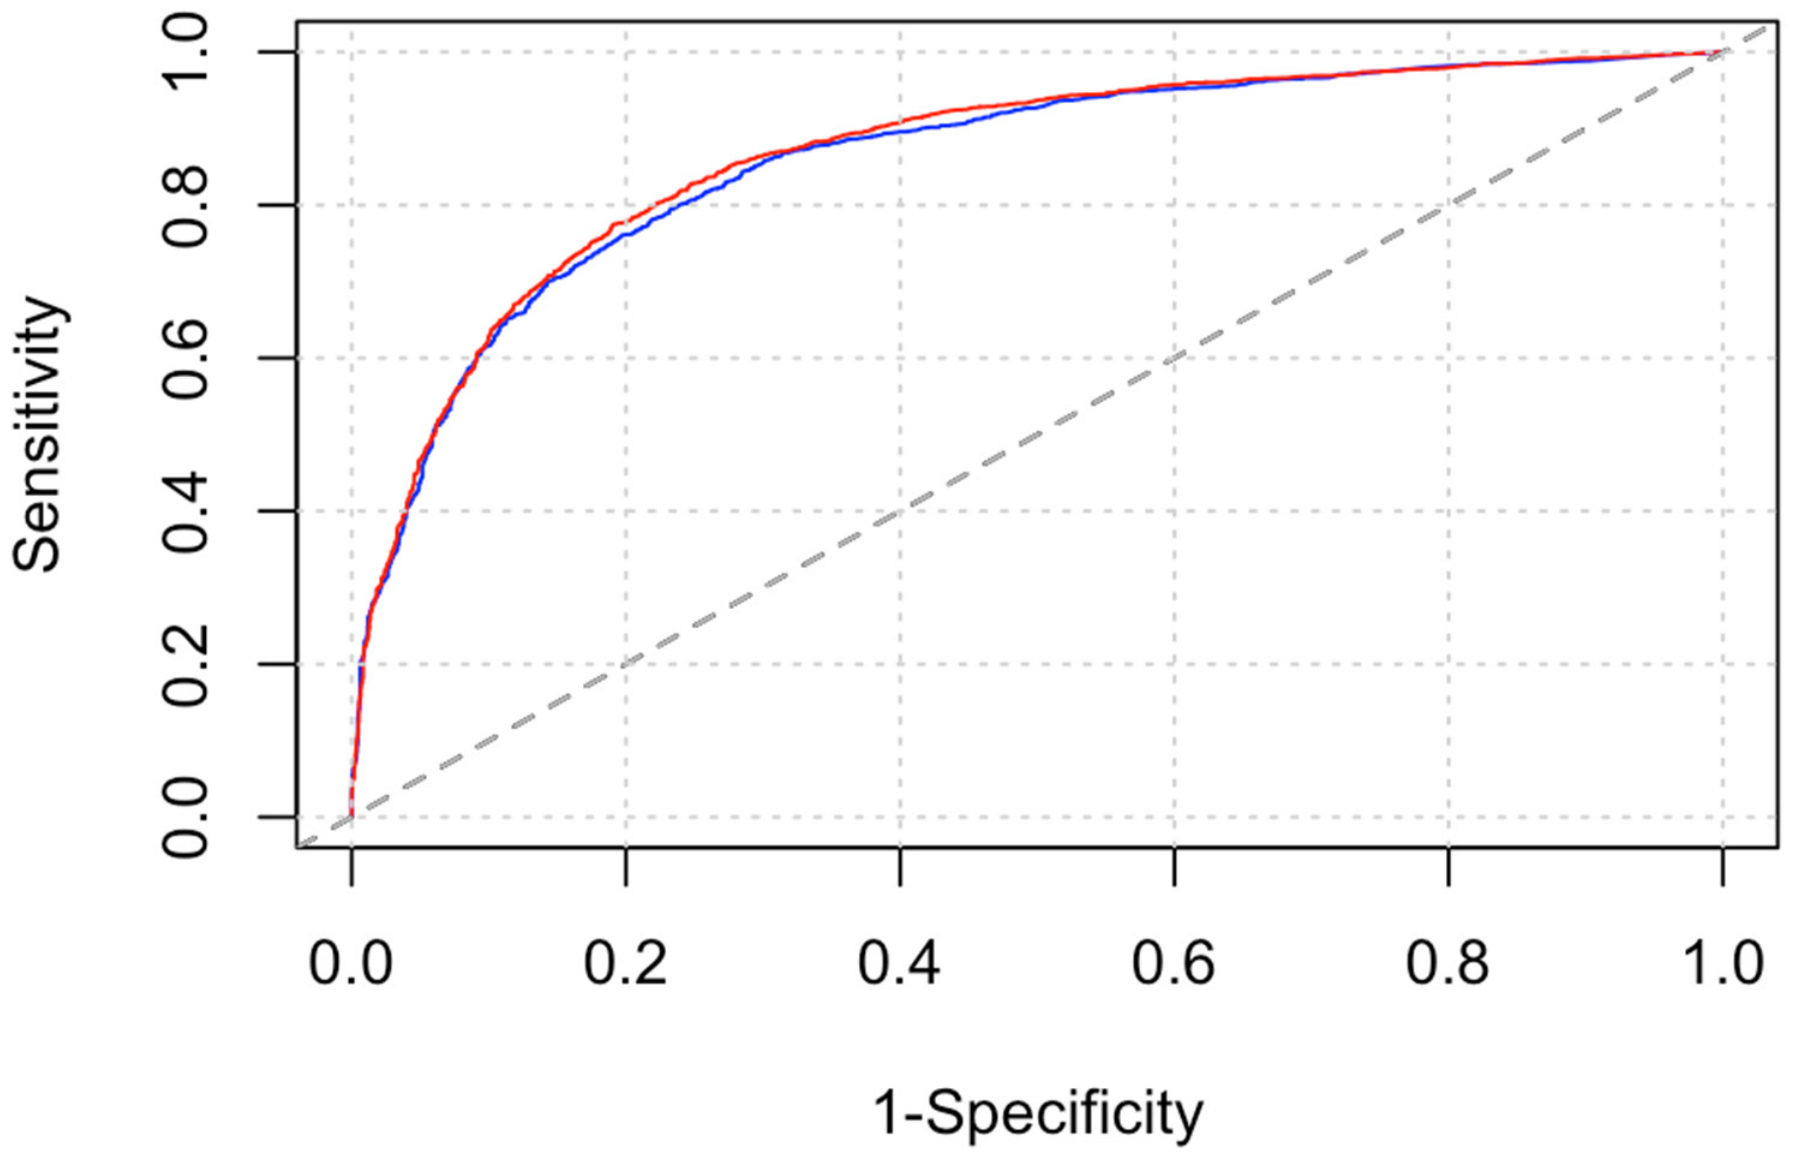
The baseline clinical model demonstrated strong discrimination, with a Harrell C-index of 0.807 (95% CI 0.799–0.816). Addition of PNI categories increased the C-index to 0.812 (95% CI 0.803–0.820), corresponding to ΔC-index 0.005 (95% CI 0.003–0.007; p < 0.001). Similarly, the 10-year time-dependent AUC increased from 0.859 (95% CI 0.848–0.868) to 0.865 (95% CI 0.855–0.875), ΔAUC 0.007 (95% CI 0.004–0.010; p < 0.001) (Figure 3).
Figure 3.
The areas under the 10-year time-dependent receiver operating characteristic curves (AUC) based on the multivariable models with the baseline characteristics only (blue line) and the baseline characteristics with the prognostic nutritional index (PNI) level categories (red line). The dashed diagonal line represents the line of no discrimination (AUC = 0.5).
Model fit also improved: log-likelihood changed from −17,858.23 to −17,814.60 (likelihood-ratio p < 0.001), and AIC decreased from 35,776.46 to 35,695.21 (reduction 81.25) (Table 3).
Table 3.
Incremental prognostic value of adding prognostic nutritional index (PNI) categories to the baseline mortality prediction model.
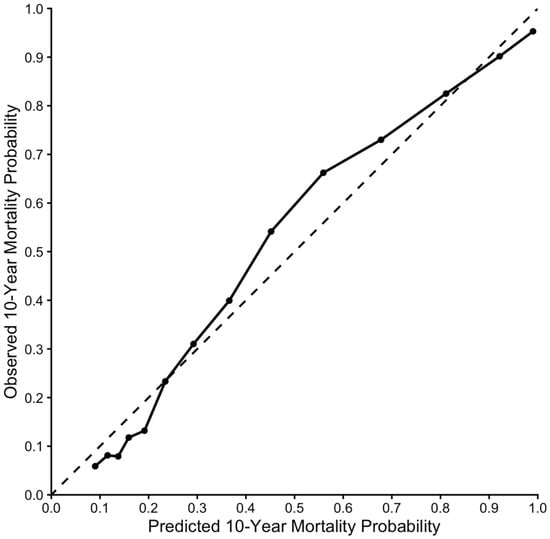
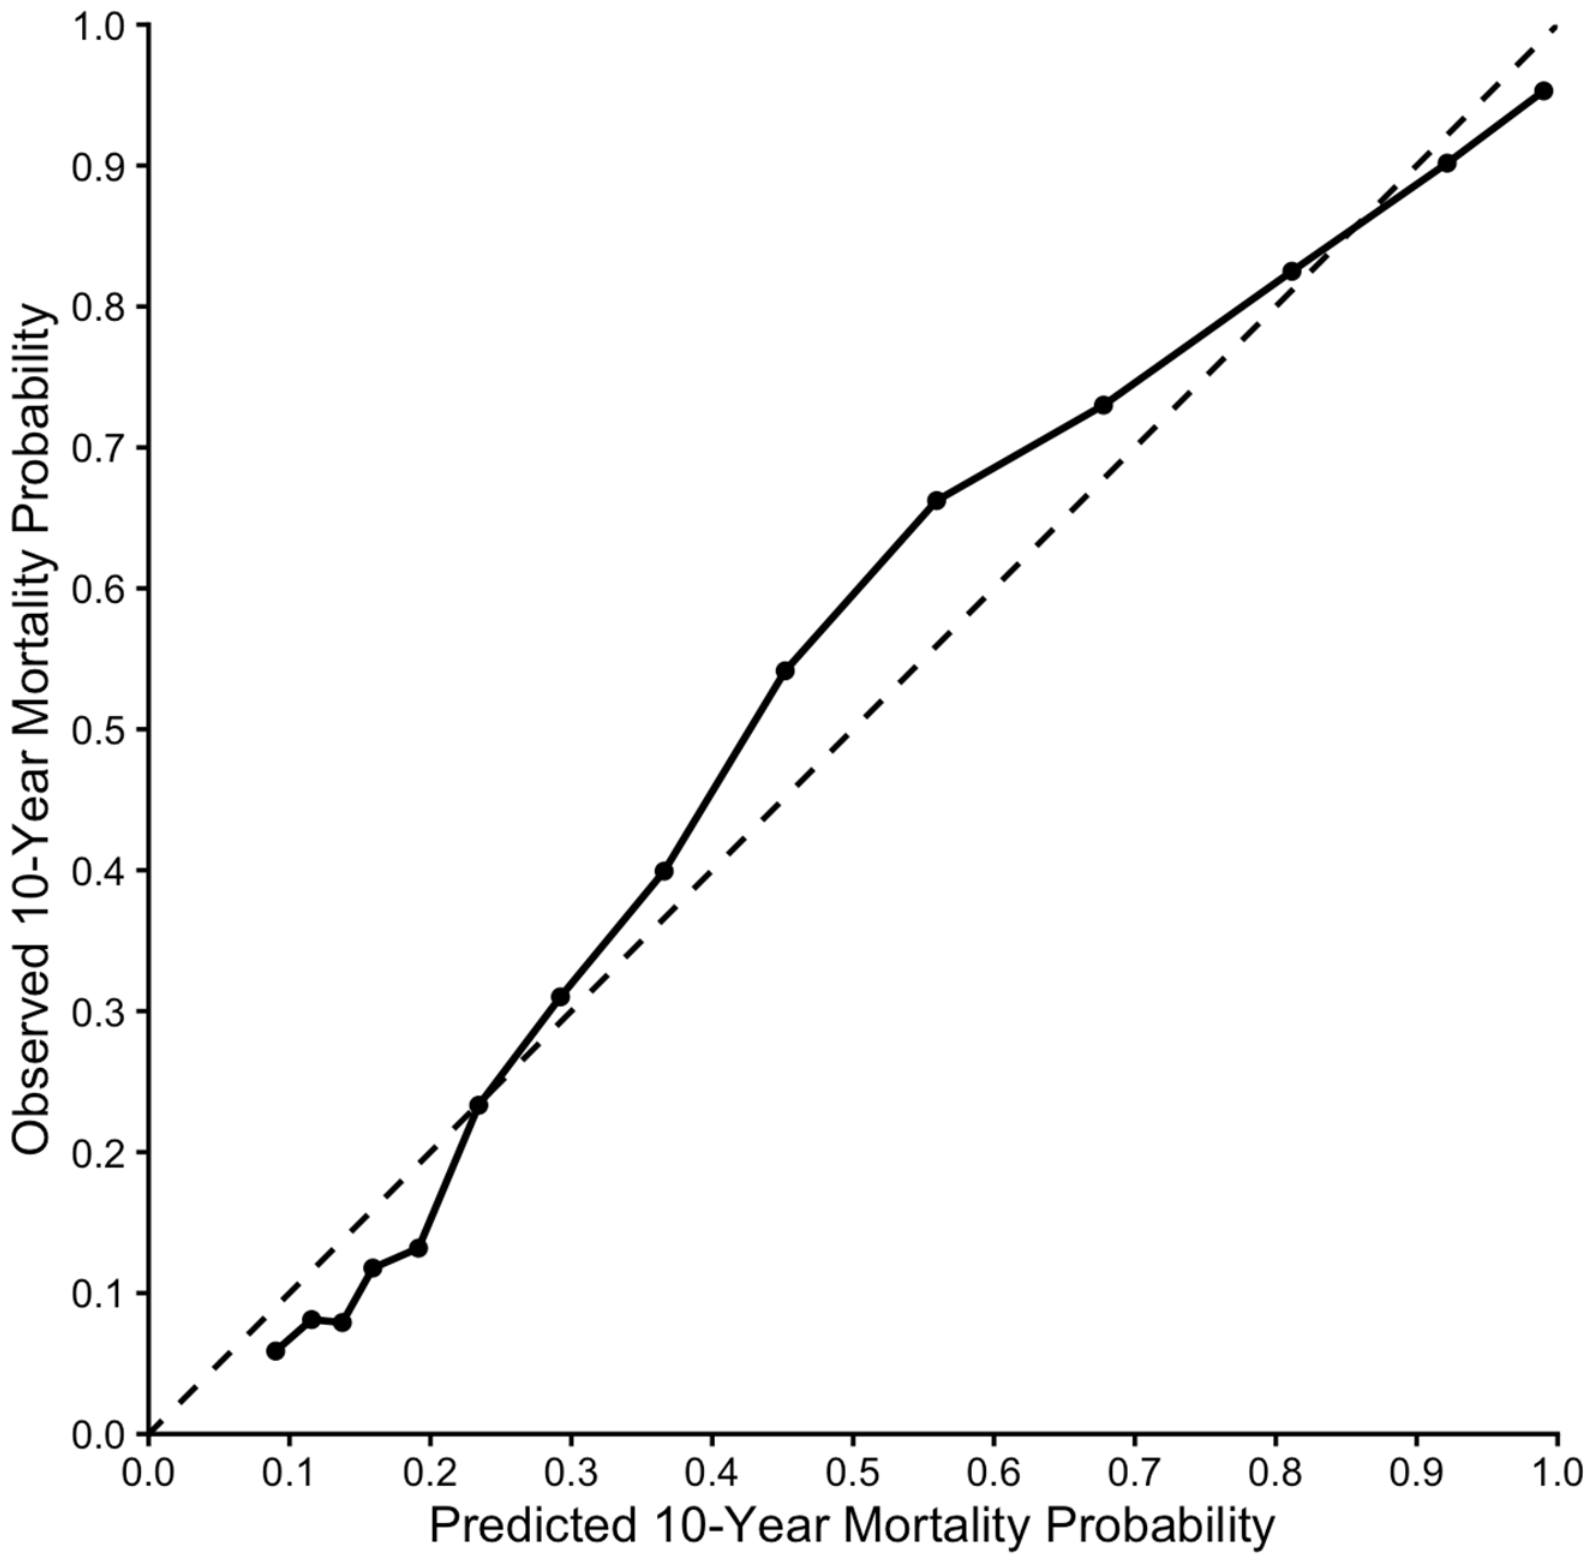
Bootstrap-corrected calibration analysis demonstrated generally good agreement between predicted and observed 10-year mortality probabilities, although some deviations from ideal calibration were observed, particularly in the intermediate range of predicted mortality (Figure 4).
Figure 4.
Bootstrap-corrected calibration of the prognostic nutritional index (PNI)-based model for 10-year all-cause mortality. The dashed diagonal line represents perfect calibration (predicted probability = observed probability). The solid line and points represent the bootstrap-corrected calibration of the prognostic nutritional index (PNI)-based multivariable Cox model for 10-year all-cause mortality, based on 1000 bootstrap resamples. Predicted and observed mortality probabilities are shown on the x- and y-axes, respectively.
3.7. Sensitivity Analysis Using PNI Quartiles
To assess the robustness of our findings, an additional sensitivity analysis was performed using PNI quartiles: Q1 (<41.50), Q2 (41.50–<46.35), Q3 (46.35–<51.15), and Q4 (≥51.15). Compared with patients in the highest quartile (Q4), progressively higher adjusted risks of all-cause mortality were observed in Q3 (adjusted HR 1.29, 95% CI 1.12–1.49), Q2 (adjusted HR 1.54, 95% CI 1.34–1.77), and Q1 (adjusted HR 1.85, 95% CI 1.59–2.11; p < 0.001 for all). These findings were consistent with the primary analysis, supporting the robustness of the association between lower PNI and increased long-term mortality across different categorization approaches.
4. Discussion
In this large cohort of 14,834 AMI survivors followed for up to 10 years, admission PNI was strongly associated with long-term all-cause mortality. There are four main findings. First, mortality increased progressively with decreasing PNI, ranging from 22.2% among patients with PNI ≥ 50 to 76.4% among those with PNI < 40. Second, this association remained significant after adjustment for a comprehensive set of demographic characteristics, comorbidities, acute illness characteristics, treatment-related factors, and echocardiographic findings. Third, the association was nonlinear and generally consistent across major clinical subgroups, although its magnitude varied by BMI, age, and AMI type. Fourth, incorporating PNI into an already highly discriminative clinical model significantly improved overall model fit and provided modest but statistically significant improvements in the Harrell’s C-index and 10-year AUC.
Our findings extend prior studies of PNI in AMI. Earlier investigations in STEMI populations undergoing primary PCI showed substantially higher short- and long-term mortality among patients with lower PNI [14,15]. A study of critically ill patients with AMI similarly found PNI to be independently associated with mortality and to improve discrimination when added to conventional severity or comorbidity scores [16]. Large PCI cohorts have also demonstrated inverse associations between PNI and long-term mortality across glucose-metabolism categories [21]. Furthermore, meta-analytic evidence now supports an overall relationship between low PNI and mortality after AMI or ACS, although substantial between-study heterogeneity remains [18,19]. The present analysis adds a substantially longer follow-up horizon, a large real-world AMI population, including both STEMI and NSTEMI, evaluation across multiple PNI categories, and direct assessment of incremental prognostic performance.
The observed association is biologically plausible but should not be interpreted as evidence that PNI is a specific measure of nutritional status or a causal determinant of mortality. Albumin is influenced by nutrition, systemic inflammation, hepatic synthetic function, vascular permeability, renal loss, and acute illness [22,23,24,25,26,27,28,29,30,31]. Lymphopenia may reflect neurohormonal stress, inflammatory activation, immune dysregulation, comorbidity, and frailty [32,33,34,35,36,37]. PNI therefore likely integrates several dimensions of physiologic reserve and disease burden rather than representing nutrition alone [11]. This interpretation is supported by the marked clinical gradients in our cohort: patients with lower PNI were older and had substantially greater burdens of heart failure, renal disease, chronic obstructive pulmonary disease, neurological disease, malignancy, anemia, severe LV dysfunction, and acute complications. Importantly, the observed association may also be partly influenced by systemic inflammatory activity and other unmeasured factors affecting albumin concentrations and lymphocyte counts, which could not be fully accounted for in the multivariable analyses.
The mechanisms underlying the association between admission PNI and mortality may also differ according to the time horizon. In the short term, lower PNI may predominantly reflect the acute inflammatory response, severity of myocardial injury, and physiological stress accompanying AMI. Over longer follow-up, its prognostic association may increasingly reflect more persistent characteristics, including chronic comorbidity burden, nutritional vulnerability, systemic inflammation, frailty, and reduced physiological reserve. Thus, a single admission PNI measurement may capture underlying patient vulnerability with prognostic implications extending well beyond the acute event, without necessarily implying that PNI itself remains stable over time. However, these mechanisms remain hypothetical, as serial PNI measurements were unavailable and associations with early and late mortality were not separately evaluated.
The persistence of the association between PNI and mortality after extensive multivariable adjustment is notable. Each 1-unit lower PNI was associated with a 2.8% higher adjusted mortality hazard, while patients with PNI < 40 had an approximately 90% higher adjusted hazard compared with those with PNI ≥ 50. However, the substantial attenuation of the unadjusted categorical hazard ratios after adjustment suggests that a considerable proportion of the crude association is explained by differences in age, comorbidities, treatment patterns, and severity of illness. Thus, PNI appears to capture prognostically relevant information beyond established clinical characteristics, but should be regarded as a complementary risk marker rather than a stand-alone prognostic classifier.
The subgroup findings warrant cautious interpretation. The association between lower PNI and mortality appeared stronger among patients with STEMI than NSTEMI and varied across BMI strata. The strongest continuous association was observed among patients with normal BMI, whereas statistical significance was not demonstrated in several obesity categories. These differences may reflect variation in nutritional reserve, systemic inflammation, competing risks, sample size, or the complex relationship between BMI and outcomes in established cardiovascular disease [20]. Given the reduced power and potential for multiple comparisons inherent to subgroup analyses, these findings should be considered hypothesis-generating and do not support subgroup-specific PNI thresholds.
The incremental prognostic analyses also warrant a balanced interpretation. The baseline clinical model already demonstrated strong discrimination (Harrell’s C-index 0.807; 10-year AUC 0.859). Addition of PNI resulted in statistically significant improvements in discrimination and model fit, although the absolute increases in C-index and AUC were modest. Such incremental gains are not unexpected when a new marker is added to an already well-performing multivariable model. Importantly, the strong independent association between PNI and mortality should be distinguished from its more limited incremental predictive value, as statistically significant improvements in discrimination do not necessarily translate into clinically meaningful improvements in individual risk stratification. Accordingly, the potential value of PNI may lie less in substantially improving complex prediction models and more in its ability to provide readily available prognostic information without additional testing or cost. Nevertheless, whether incorporating PNI into clinical risk assessment meaningfully improves decision-making or patient outcomes remains uncertain and warrants further investigation.
4.1. Clinical Implications and Future Considerations
PNI has several pragmatic features that may facilitate its clinical use. It is inexpensive, easily calculated from readily available laboratory parameters, and available early during hospitalization. Rather than replacing established AMI risk assessment, PNI may complement it by identifying a high-risk phenotype that integrates nutritional, inflammatory, and immune status.
A low PNI may prompt consideration of potentially modifiable or clinically relevant contributors, including inadequate nutritional intake, frailty, systemic inflammation, occult malignancy, and renal or hepatic dysfunction. It may therefore help identify patients in whom more comprehensive clinical and nutritional assessment, rehabilitation, or closer follow-up should be considered. However, prospective studies are needed to determine whether PNI-guided nutritional, rehabilitative, or multidisciplinary strategies can translate improved risk identification into better post-AMI outcomes.
Future research should also address several methodological and clinical questions. PNI thresholds vary considerably across cardiovascular studies, commonly clustering between approximately 40 and 50 [11]. Differences in study populations, clinical settings, and follow-up durations may contribute to this variability, and thresholds associated with short- or intermediate-term outcomes may not necessarily be optimal for long-term risk prediction. In the present study, restricted cubic spline analysis demonstrated a nonlinear association between PNI and long-term mortality, with a more pronounced risk gradient at lower PNI values and attenuation at higher values. These findings support considering PNI as a continuous risk marker rather than relying exclusively on predefined categories or universal cutoffs. Although deriving a cohort-specific optimal cutoff was beyond the scope of the present study, future investigations incorporating time-dependent ROC analysis and appropriate internal and external validation may help establish clinically meaningful thresholds for long-term risk stratification. Serial PNI measurements may also provide additional prognostic information, as both albumin and lymphocyte counts can change substantially over time. External validation in contemporary and geographically diverse cohorts, together with comparisons with established AMI risk scores, frailty measures, and other nutritional indices, will be important to further define the clinical utility of PNI.
4.2. Limitations
Several limitations should be acknowledged. First, this was a retrospective, single-center observational study and residual or unmeasured confounding cannot be excluded. Second, PNI was based on a single measurement obtained during the initial hospital evaluation, and exact sampling times relative to admission were unavailable. Variability in measurement timing, along with acute hemodynamic changes, inflammation, hydration status, and other transient factors, may have influenced albumin and lymphocyte values and, consequently, PNI estimates. Furthermore, blood samples were obtained as part of routine clinical care without standardized collection times or fasting conditions, precluding adjustment for potential circadian variation in circulating lymphocyte counts. Serial PNI measurements were also unavailable, and we could not determine whether its prognostic association differed between early and late follow-up. Third, the cohort spans an extended treatment era during which AMI definitions, diagnostic approaches, reperfusion strategies, pharmacotherapy, and secondary prevention evolved potentially influencing patient management and long-term outcomes. Furthermore, systematic classification of AMI into type 1 and type 2 events according to the Universal Definition of Myocardial Infarction was not consistently available, precluding reliable differentiation between these subtypes. This may have introduced additional heterogeneity into the study population and influenced the observed associations.
Fourth, cause-specific mortality was not available; consequently, the association with cardiovascular mortality cannot be determined. Fifth, detailed measures of dietary intake, frailty, socioeconomic status, inflammatory biomarkers, inflammatory disease activity, hepatic function, and longitudinal nutritional interventions were not available or systematically incorporated into the provided analysis. Consequently, residual confounding related to unmeasured systemic inflammation and other factors influencing PNI cannot be excluded. Furthermore, detailed information on pharmacological treatment, particularly discharge medications such as antiplatelet agents and other guideline-directed secondary prevention therapies, was unavailable, precluding adjustment for potential differences in medical management that may have influenced long-term outcomes. Sixth, patients without available PNI measurements were excluded, and differences in clinical characteristics between included and excluded patients may have introduced selection bias. In addition, some variables, including BMI, echocardiography, and angiography, were available only in subsets of the cohort. The substantial proportion of missing BMI data reduced the sample size of the primary adjusted analysis and may have introduced further selection bias, particularly if missingness was associated with patient characteristics or outcomes. However, a sensitivity analysis excluding BMI, which allowed inclusion of a larger study population, demonstrated consistent associations between PNI and long-term mortality, supporting the robustness of the findings. Nevertheless, residual confounding and potential bias related to missing data cannot be entirely excluded. Seventh, the incremental improvement in discrimination was statistically significant but small in absolute magnitude, and no decision-curve, net-reclassification, or prospective clinical-utility analysis was provided. Eighth, although Soroka University Medical Center serves as the principal tertiary referral hospital in the region, previous AMI events occurring at other institutions may not have been fully captured. Consequently, the index hospitalization may not necessarily represent the patient’s first lifetime AMI. Finally, the findings require external validation before specific PNI thresholds are incorporated into routine post-AMI risk pathways.
5. Conclusions
In a large cohort of AMI hospital survivors with up to 10 years of follow-up, lower admission PNI was strongly and progressively associated with higher all-cause mortality. The association remained independent after comprehensive clinical adjustment, and PNI provided modest but statistically significant incremental prognostic information beyond a high-performing baseline model. Because PNI can be calculated from routine albumin and lymphocyte measurements at negligible additional cost, it may serve as a pragmatic complementary marker of long-term risk after AMI. Prospective external validation and studies evaluating whether PNI-guided interventions improve outcomes are warranted. Furthermore, although the addition of PNI resulted in statistically significant improvements in model discrimination, the absolute increases in the C-index and 10-year AUC were small. Thus, the strong independent association between PNI and mortality should be distinguished from its more limited incremental predictive value beyond established clinical variables. These findings suggest that PNI may provide complementary prognostic information, but its ability to meaningfully improve individual risk stratification or guide clinical decisions remains uncertain and requires further evaluation.
Supplementary Materials
The following supporting information can be downloaded at: https://www.mdpi.com/article/10.3390/jcdd13110611/s1, Figure S1: Study flowchart; Table S1: Relationship between prognostic nutritional index (PNI) level (as a continuous variable) and long-term mortality after acute myocardial infarction–multivariable analysis; Table S2: Relationship between prognostic nutritional index (PNI) level (as a continuous variable) and long-term mortality after acute myocardial infarction, by the selected subgroups–multivariable interactive analysis.
Author Contributions
Conceptualization, A.S., T.H. and Y.P.; methodology, A.S., T.H. and Y.P.; formal analysis, Y.P.; investigation, Y.P., S.D., H.G., T.H. and A.S.; data curation, Y.P.; writing—original draft preparation, A.S. and Y.P.; writing—review and editing, Y.P., S.D., H.G. and A.S.; visualization, A.S. and Y.P.; supervision, A.S. and Y.P. All authors have read and agreed to the published version of the manuscript.
Funding
This research received no external funding.
Institutional Review Board Statement
The study was conducted in accordance with the Declaration of Helsinki and approved by the Soroka University Medical Center Institutional Review Board (6 August 2023, SOR-0174-23).
Informed Consent Statement
Patient consent was waived because of the retrospective nature of the study.
Data Availability Statement
The data underlying this study are not publicly available due to institutional and patient privacy restrictions. De-identified data may be made available from the corresponding author upon reasonable request and subject to institutional approval and applicable data-use agreements.
Conflicts of Interest
The authors declare no conflict of interest.
References
- Plakht, Y.; Gilutz, H.; Shiyovich, A. Excess long-term mortality among hospital survivors of acute myocardial infarction. Soroka Acute Myocardial Infarction (SAMI) project. Public Health 2017, 143, 25–36. [Google Scholar] [CrossRef] [Scilit] [PubMed]
- Shiyovich, A.; Shlomo, N.; Cohen, T.; Iakobishvili, Z.; Kornowski, R.; Eisen, A. Temporal trends of patients with acute coronary syndrome and multi-vessel coronary artery disease—From the ACSIS registry. Int. J. Cardiol. 2020, 304, 8–13. [Google Scholar] [CrossRef] [Scilit] [PubMed]
- Writing Committee Members; Lawton, J.S.; Tamis-Holland, J.E.; Bangalore, S.; Bates, E.R.; Beckie, T.M.; Bischoff, J.M.; Bittl, J.A.; Cohen, M.G.; DiMaio, J.M. 2021 ACC/AHA/SCAI Guideline for Coronary Artery Revascularization: A Report of the American College of Cardiology/American Heart Association Joint Committee on Clinical Practice Guidelines. J. Am. Coll. Cardiol. 2022, 79, e21–e129. [Google Scholar] [PubMed]
- Okada, S.; Shimada, J.; Kato, D.; Tsunezuka, H.; Teramukai, S.; Inoue, M. Clinical Significance of Prognostic Nutritional Index After Surgical Treatment in Lung Cancer. Ann. Thorac. Surg. 2017, 104, 296–302. [Google Scholar] [CrossRef] [Scilit] [PubMed]
- Yang, Z.; Zhang, B.; Hou, L.; Xie, Y.; Cao, X. Pre-operative prognostic nutritional index predicts the outcomes for triple-negative breast cancer. Tumour Biol. J. Int. Soc. Oncodevelopmental Biol. Med. 2014, 35, 12165–12171. [Google Scholar] [CrossRef] [Scilit] [PubMed]
- Tobing, E.; Tansol, C.; Tania, C.; Sihombing, A.T. Prognostic Nutritional Index (PNI) as Independent Predictor of Poor Survival in Prostate Cancer: A Systematic Review and Meta-Analysis. Clin. Genitourin. Cancer 2024, 22, 102142. [Google Scholar] [CrossRef] [Scilit] [PubMed]
- Chen, M.Y.; Wen, J.X.; Lu, M.T.; Jian, X.Y.; Wan, X.L.; Xu, Z.W.; Liang, J.Q.; Wu, J.D. Association Between Prognostic Nutritional Index and Prognosis in Patients With Heart Failure: A Meta-Analysis. Front. Cardiovasc. Med. 2022, 9, 918566. [Google Scholar] [CrossRef] [Scilit] [PubMed]
- Zhao, B.H.; Yuan, T.; Zhao, L.; Ruze, A.; Li, Q.L.; Deng, A.X.; Hu, S.; Gao, X.M. Prognostic nutritional index in the prediction of adverse cardiac and cerebrovascular events in ST-segment elevation myocardial infarction patients with type 2 diabetes mellitus in Urumqi, China: A retrospective cohort study. BMJ Open 2025, 15, e099750. [Google Scholar] [CrossRef] [Scilit] [PubMed]
- Xu, L.; Lin, X.; Li, T.; Wen, J.; Chen, G. Association between prognostic nutritional index and diabetic retinopathy among U.S. diabetic adults in NHANES. Sci. Rep. 2025, 15, 12986. [Google Scholar] [CrossRef] [Scilit] [PubMed]
- Wang, R.; He, M.; Yin, W.; Liao, X.; Wang, B.; Jin, X.; Ma, Y.; Yue, J.; Bai, L.; Liu, D.; et al. The Prognostic Nutritional Index is associated with mortality of COVID-19 patients in Wuhan, China. J. Clin. Lab. Anal. 2020, 34, e23566. [Google Scholar] [CrossRef] [Scilit] [PubMed]
- Kudeken, N. Prognostic nutritional index: A comprehensive review across clinical specialties. Clin. Nutr. Open Sci. 2026, 66, 100601. [Google Scholar] [CrossRef] [Scilit]
- Shiyovich, A.; Bental, T.; Assali, A.; Vaknin-Assa, H.; Kornowski, R.; Perl, L. Changes over time in serum albumin levels predict outcomes following percutaneous coronary intervention. J. Cardiol. 2020, 75, 381–386. [Google Scholar] [CrossRef] [Scilit] [PubMed]
- Shiyovich, A.; Gilutz, H.; Plakht, Y. White Blood Cell Subtypes Are Associated with a Greater Long-Term Risk of Death after Acute Myocardial Infarction. Tex. Heart Inst. J. 2017, 44, 176–188. [Google Scholar] [CrossRef] [Scilit] [PubMed]
- Keskin, M.; Hayıroğlu, M.I.; Keskin, T.; Kaya, A.; Tatlısu, M.A.; Altay, S.; Uzun, A.O.; Börklü, E.B.; Güvenç, T.S.; Avcı, I.I.; et al. A novel and useful predictive indicator of prognosis in ST-segment elevation myocardial infarction, the prognostic nutritional index. Nutr. Metab. Cardiovasc. Dis. NMCD 2017, 27, 438–446. [Google Scholar] [CrossRef] [Scilit] [PubMed]
- Chen, Q.J.; Qu, H.J.; Li, D.Z.; Li, X.M.; Zhu, J.J.; Xiang, Y.; Li, L.; Ma, Y.T.; Yang, Y.N. Prognostic nutritional index predicts clinical outcome in patients with acute ST-segment elevation myocardial infarction undergoing primary percutaneous coronary intervention. Sci. Rep. 2017, 7, 3285. [Google Scholar] [CrossRef] [Scilit] [PubMed]
- Huang, Y.; Zhang, Q.; Li, P.; Chen, M.; Wang, R.; Hu, J.; Chi, J.; Cai, H.; Wu, N.; Xu, L. The prognostic nutritional index predicts all-cause mortality in critically ill patients with acute myocardial infarction. BMC Cardiovasc. Disord. 2023, 23, 339. [Google Scholar] [CrossRef] [Scilit] [PubMed]
- Safak, O.; Yildirim, T.; Emren, V.; Avci, E.; Argan, O.; Aktas, Z.; Yildirim, S.E.; Akgun, D.E.; Kisacik, H.L. Prognostic Nutritional Index as a Predictor of No-Reflow Occurrence in Patients With ST-Segment Elevation Myocardial Infarction Who Underwent Primary Percutaneous Coronary Intervention. Angiology 2024, 75, 689–695. [Google Scholar] [CrossRef] [Scilit] [PubMed]
- Chang, W.T.; Sun, C.K.; Wu, J.Y.; Yu, C.H.; Chang, Y.J.; Lin, M.C.; Lan, K.M.; Chen, I.W.; Hung, K.C. Association of prognostic nutritional index with long-term mortality in patients receiving percutaneous coronary intervention for acute coronary syndrome: A meta-analysis. Sci. Rep. 2023, 13, 13102. [Google Scholar] [CrossRef] [Scilit] [PubMed]
- Wang, D.; Jia, C.; Yu, T. Association between prognostic nutritional index and the clinical outcomes of patients with acute myocardial infarction: A systematic review and meta-analysis. Front. Cardiovasc. Med. 2025, 12, 1650043. [Google Scholar] [CrossRef] [Scilit] [PubMed]
- Shechter, A.; Dahan, S.; Shiyovich, A.; Gilutz, H.; Plakht, Y. Impact of Baseline Hypoalbuminemia on Long-Term Survival Following Acute Myocardial Infarction According to Body Mass Index. J. Cardiovasc. Dev. Dis. 2024, 11, 378. [Google Scholar] [CrossRef] [Scilit] [PubMed]
- Ling, X.; Lin, C.; Liu, J.; He, Y.; Yang, Y.; Lu, N.; Jie, W.; Liu, Y.; Chen, S.; Guo, J. Prognostic value of the prognostic nutritional index for patients with acute myocardial infarction undergoing percutaneous coronary intervention with variable glucose metabolism statuses: A retrospective cohort study. Diabetol. Metab. Syndr. 2023, 15, 207. [Google Scholar] [CrossRef] [Scilit] [PubMed]
- Don, B.R.; Kaysen, G. Serum albumin: Relationship to inflammation and nutrition. Semin. Dial. 2004, 17, 432–437. [Google Scholar] [CrossRef] [Scilit] [PubMed]
- Danesh, J.; Collins, R.; Appleby, P.; Peto, R. Association of fibrinogen, C-reactive protein, albumin, or leukocyte count with coronary heart disease: Meta-analyses of prospective studies. JAMA 1998, 279, 1477–1482. [Google Scholar] [PubMed]
- Gabay, C.; Kushner, I. Acute-phase proteins and other systemic responses to inflammation. N. Engl. J. Med. 1999, 340, 448–454, Erratum in N. Engl. J. Med. 1999, 340, 1376. [Google Scholar] [CrossRef] [Scilit] [PubMed]
- Zhang, W.J.; Frei, B. Albumin selectively inhibits TNF alpha-induced expression of vascular cell adhesion molecule-1 in human aortic endothelial cells. Cardiovasc. Res. 2002, 55, 820–829. [Google Scholar] [CrossRef] [Scilit] [PubMed]
- Thomson, S.P.; Gibbons, R.J.; Smars, P.A.; Suman, V.J.; Pierre, R.V.; Santrach, P.J.; Jiang, N.S. Incremental value of the leukocyte differential and the rapid creatine kinase-MB isoenzyme for the early diagnosis of myocardial infarction. Ann. Intern. Med. 1995, 122, 335–341. [Google Scholar] [CrossRef] [Scilit] [PubMed]
- Ross, R. Atherosclerosis--an inflammatory disease. N. Engl. J. Med. 1999, 340, 115–126. [Google Scholar] [PubMed]
- De Servi, S.; Mariani, M.; Mariani, G.; Mazzone, A. C-reactive protein increase in unstable coronary disease cause or effect? J. Am. Coll. Cardiol. 2005, 46, 1496–1502. [Google Scholar] [CrossRef] [Scilit] [PubMed]
- Gerber, Y.; McConnell, J.P.; Jaffe, A.S.; Weston, S.A.; Killian, J.M.; Roger, V.L. Lipoprotein-associated phospholipase A2 and prognosis after myocardial infarction in the community. Arterioscler. Thromb. Vasc. Biol. 2006, 26, 2517–2522. [Google Scholar] [CrossRef] [Scilit] [PubMed]
- Bursi, F.; Weston, S.A.; Killian, J.M.; Gabriel, S.E.; Jacobsen, S.J.; Roger, V.L. C-reactive protein and heart failure after myocardial infarction in the community. Am. J. Med. 2007, 120, 616–622. [Google Scholar] [CrossRef] [Scilit] [PubMed]
- Oduncu, V.; Erkol, A.; Karabay, C.Y.; Kurt, M.; Akgün, T.; Bulut, M.; Pala, S.; Kirma, C. The prognostic value of serum albumin levels on admission in patients with acute ST-segment elevation myocardial infarction undergoing a primary percutaneous coronary intervention. Coron. Artery Dis. 2013, 24, 88–94. [Google Scholar] [CrossRef] [Scilit] [PubMed]
- Onsrud, M. Influence of in vivo hydrocortisone on some human blood leucocyte sub-populations. II. Effects on T cell-monocyte cooperation. Acta Pathol. Microbiol. Scand. Sect. C Immunol. 1981, 89, 321–327. [Google Scholar]
- Gupta, S.; Agrawal, A.; Agrawal, S.; Su, H.; Gollapudi, S. A paradox of immunodeficiency and inflammation in human aging: Lessons learned from apoptosis. Immun. Ageing 2006, 3, 5. [Google Scholar] [CrossRef] [Scilit] [PubMed]
- Horne, B.D.; Anderson, J.L.; John, J.M.; Weaver, A.; Bair, T.L.; Jensen, K.R. Intermountain Heart Collaborative (IHC) Study Group. Which white blood cell subtypes predict increased cardiovascular risk? J. Am. Coll. Cardiol. 2005, 45, 1638–1643, Correction in J. Am. Coll. Cardiol. 2005, 46, 565. [Google Scholar] [PubMed]
- Zouridakis, E.G.; Garcia-Moll, X.; Kaski, J.C. Usefulness of the blood lymphocyte count in predicting recurrent instability and death in patients with unstable angina pectoris. Am. J. Cardiol. 2000, 86, 449–451. [Google Scholar] [CrossRef] [Scilit] [PubMed]
- Núñez, J.; Núñez, E.; Bodí, V.; Sanchis, J.; Mainar, L.; Miñana, G.; Fácila, L.; Bertomeu, V.; Merlos, P.; Darmofal, H.; et al. Low lymphocyte count in acute phase of ST-segment elevation myocardial infarction predicts long-term recurrent myocardial infarction. Coron. Artery Dis. 2010, 21, 1–7. [Google Scholar] [CrossRef] [Scilit] [PubMed]
- Khandaker, M.H.; Lennon, R.J.; Simari, R.D.; Lerman, A.; Rihal, C.S. Elevated Lymphocyte Count Prior to Coronary Stenting is the Best Predictor of Long-Term Outcome Among White Blood Cell Subtypes. Circulation 2007, 116, II-852. [Google Scholar]

Disclaimer/Publisher’s Note: The statements, opinions and data contained in all publications are solely those of the individual author(s) and contributor(s) and not of MDPI and/or the editor(s). MDPI and/or the editor(s) disclaim responsibility for any injury to people or property resulting from any ideas, methods, instructions or products referred to in the content. |
© 2026 by the authors. Licensee MDPI, Basel, Switzerland. This article is an open access article distributed under the terms and conditions of the Creative Commons Attribution (CC BY) license.