


Simple Summary
Swine diarrhoea diseases caused by two common swine coronaviruses bring large economic losses to pig-raising industries worldwide. Fast and easy-to-use detection tools are helpful for disease monitoring on pig farms. In this study, we tested a set of detection reagents on a portable cartridge-based nucleic acid testing device. We checked whether this device could find these two swine viruses using prepared virus genetic material and virus-spiked pig faecal samples. Our test showed the device could detect target virus genetic material in laboratory-prepared samples, but further real-world tests with clinical pig samples are still needed. This work provides basic laboratory data for developing future easy-to-carry diagnostic tools for swine coronavirus diseases, which may support pig disease surveillance in the future.
Abstract
Porcine epidemic diarrhea virus (PEDV) and porcine deltacoronavirus (PDCoV) cause severe diarrhoea in piglets, requiring rapid laboratory differentiation. In this technical note, we evaluated primer–probe sets from Chinese quarantine industry standards on the Coyote Flash10 cartridge-based POCT combined primer–probe RT qPCR platform. Assays were characterised using a digitally PCR-quantified single-target in vitro transcribed viral RNA and RNA-spiked porcine faecal matrix. Exploratory low-concentration amplifications were observed at 3.222 copies/μL (PEDV) and 2.28 copies/μL (PDCoV); however, the corresponding Ct values fell within an indeterminate range, and no statistically validated limits of detection were established. The PEDV standard curve included concentrations with mean Ct values in the indeterminate and negative ranges, so its apparent efficiency was not considered a validated performance metric. PDCoV efficiency was sub-optimal (~77.7%). Low intra run Ct variability (CV < 3%) was observed in spiked matrix tests. No cross amplification was detected against four selected swine pathogens under the tested conditions. Notably, mixed-ratio co-template viral RNA experiments simulating co-infection were not performed. The proprietary internal control (IC) was recorded descriptively and was not used to assess extraction efficiency or sample validity. This work demonstrates preliminary analytical feasibility of this primer–probe combination on the Flash10 platform; full clinical diagnostic performance remains to be validated in further studies.
1. Introduction
Porcine epidemic diarrhea virus (PEDV) and porcine deltacoronavirus (PDCoV) are enveloped, single-stranded, positive-sense RNA viruses belonging to the family Coronaviridae. They primarily infect intestinal epithelial cells in pigs, causing an acute enteric disease characterized by vomiting, watery diarrhea, and dehydration, which poses a continuous and significant threat to the global pig industry [1,2]. First identified in Europe during the 1970s [3], PEDV has since caused devastating outbreaks across Asia and North America. Its high virulence and rapid transmission can result in high mortality in neonatal piglets, leading to catastrophic economic losses for intensive farming operations [4]. PDCoV, a more recent member of the coronavirus family, was initially reported in pig herds in Hong Kong, China, in 2012 [5] and has subsequently been detected in several Asian and North American countries [2,6]. PDCoV can occur as a single infection or in coinfection with PEDV. Experimental PEDV/PDCoV coinfection has been shown to cause more severe diarrheal disease and a longer diarrheal duration than either monoinfection [7].
Because PEDV and PDCoV produce overlapping enteric clinical manifestations, reliable etiological differentiation requires pathogen-specific laboratory testing. Methods capable of detecting both viruses within the same analytical workflow may therefore facilitate their rapid differential identification.
Real-time quantitative RT qPCR is widely used for the detection and differentiation of animal RNA viruses because of its analytical sensitivity, specificity, and capacity for real-time fluorescence detection [8]. Compact nucleic acid testing platforms have the potential to shorten instrument-based detection workflows and reduce dependence on conventional laboratory instrumentation, although their practical utility depends on the extent of off-instrument sample processing required [9]. The Coyote Flash10 is a compact nucleic-acid amplification and fluorescence-detection platform that supports rapid thermal cycling and multichannel fluorescence detection. In the workflow evaluated here, sample preparation was performed manually off-instrument, whereas RT-qPCR amplification, fluorescence acquisition, and Ct determination were performed on the Flash10 platform.
Multiplex RT-qPCR technology allows for the simultaneous amplification and detection of multiple targets in a single reaction tube, thereby reducing the number of separate reactions required for differential detection [10]. Currently, RT-qPCR assays for PEDV are frequently designed based on the conserved sequences of the nucleocapsid (N) gene [11] or the spike (S) gene [12], while PDCoV detection commonly targets the membrane (M) gene [11,13] or the ORF1ab gene [14]. Several multiplex RT-qPCR assays capable of detecting PEDV and PDCoV have previously been reported. In addition, duplex pathogen detection has been implemented on the Flash10 platform for porcine respiratory pathogens [15]. Therefore, the novelty of the present study does not lie in the general concept of duplex RT-qPCR or in the first use of Flash10 for multi-target pathogen detection. Rather, this technical note adapts established PEDV N- and PDCoV M-targeting primer–probe sets to a combined primer–probe RT-qPCR format and provides a preliminary analytical evaluation. No mixed-template co-detection experiments were performed, and no claim of validated duplex co-detection is made. Rather, the present work extends this platform to a porcine enteric-virus application by adapting established PEDV N- and PDCoV M-targeting primer/probe sets to a combined primer–probe RT-qPCR format and analytically evaluating this configuration using RNA reference materials and an RNA-spiked porcine fecal matrix. Although the compact cartridge-based configuration may have potential utility for decentralized testing, its field usability and any potential cost advantage were not evaluated in the present study.
Accordingly, this study aimed to analytically characterize the performance of combined PEDV- and PDCoV-targeting primer–probe sets on the Flash10 combined primer–probe RT-qPCR platform. Primer/probe concentrations and thermal cycling conditions were optimized, and assay performance was evaluated using quantified viral RNA reference materials, a limited non-target pathogen panel, and an RNA-spiked porcine fecal matrix. A proprietary internal control (IC) was included in a separate CY5 fluorescence channel; its target and sequences are not disclosed. No exogenous IC template was added, and the IC was not used as an extraction or sample-validity control. Thus, “combined primer–probe RT-qPCR” refers specifically to the two viral diagnostic targets, PEDV and PDCoV, rather than to the number of fluorescence channels. Given the analytical design of the present study and the absence of independent authentic clinical specimens, the assay is evaluated here as a qualitative analytical detection method, while its clinical diagnostic performance and field applicability require further validation.
2. Materials and Methods
2.1. Design of Primers and Probes
Complete genome sequences of 14 PEDV strains and 31 PDCoV strains were obtained from the NCBI GenBank database and imported into SnapGene software (Version 6.0.2, GSL Biotech LLC, San Diego, CA, USA) for multiple-sequence alignment. The alignments were used to examine sequence conservation at the binding sites of the primers and probes included in this study. The sequences were not selected through a predefined systematic sampling strategy intended to comprehensively represent all currently circulating genotypes or lineages. Accession numbers and available metadata for the sequences included in the alignment, including genotype/lineage, geographic origin, and collection year where explicitly available, are provided in Supplementary Table S2. Metadata unavailable or unannotated in the corresponding sequence or associated record were not inferred. Sequence conservation was therefore assessed only within this analyzed sequence set and was not used to infer coverage of all circulating PEDV or PDCoV lineages.
Primers and TaqMan probes for PEDV and PDCoV were adopted from Chinese entry exit inspection and quarantine industry standards SN/T 1699 2017 [16] and SN/T 5124 2019 [17], respectively. The IC was proprietary; its target and sequences are not disclosed. No exogenous IC template was added to the reaction. Amplicon lengths were kept within 150 base pairs. The probes were labeled with reporter dyes and quenchers as follows: PEDV probe—FAM and BHQ1; PDCoV probe—ROX and BHQ2; IC probe—CY5 and BHQ2. All primers and probes were synthesized and PAGE-purified by Sangon Biotech (Shanghai) Co., Ltd., Shanghai, China. and their sequences are listed in Table 1.
Table 1.
Primers and Probes used for combined primer–probe RT-qPCR.
In this study, “combined primer–probe RT-qPCR” refers specifically to simultaneous inclusion of the PEDV- and PDCoV-specific primer/probe sets in the reaction system. The proprietary IC was detected separately in the CY5 fluorescence channel and was not considered a third diagnostic target.
2.2. Nucleic Acid Controls
Nucleic acid controls for PEDV and PDCoV (in vitro transcribed RNA reference materials with known copy numbers), as well as nucleic acid controls for specificity testing (TGEV, porcine rotavirus [PoRV], highly pathogenic porcine reproductive and respiratory syndrome virus [HP-PRRSV], and African swine fever virus [ASFV]), were purchased from Pudao Standard, Beijing, China. The exact input concentrations of the four non-target pathogen controls used in the specificity experiment were not retained in the available experimental record and were therefore not retrospectively reconstructed or inferred.
The PEDV and PDCoV RNA reference materials were independently quantified by digital PCR before use. The available experimental records reported digital-PCR-derived concentrations of 3.22 copies/μL for PEDV and 22.8 copies/μL for PDCoV in the low-concentration experiments. The copy-number concentrations used in the standard-curve experiments are reported separately in Section 2.4 according to the corresponding experimental records. No preparation relationship between these recorded digital-PCR concentrations and the standard-curve concentration levels was inferred beyond the information retained in the experimental records.
Recombinant plasmid DNA constructs carrying PEDV N and PDCoV M target fragments were synthesized for assay development and reaction condition screening. Unfortunately, reliable copy number quantification of these plasmid preparations could not be achieved by digital PCR; thus, plasmid data were only used to assess amplification performance and linear trends and were not adopted for limit of detection calculation or formal quantitative evaluation.
PEDV and PDCoV RNA reference materials were tested separately and were not mixed to generate an equal-proportion viral RNA template. Thus, the term “combined primer–probe RT-PCR” describes the combined PEDV/PDCoV primer–probe reaction system rather than a mixture of the two viral RNA templates.
2.3. Reaction System and Amplification Conditions
To establish a robust combined primer–probe RT qPCR system, we performed a series of optimization experiments. Reaction buffers, primer/probe conditions, and annealing temperatures were evaluated during assay development using both recombinant plasmid DNA templates and in vitro transcribed viral RNA. Single-target reactions were initially used to evaluate the individual PEDV and PDCoV assay components, after which the PEDV- and PDCoV-specific primer/probe sets were combined in the combined reaction system. Development stage single-target controls were also evaluated alongside the combined primer/probe system at a selected template concentration to assess compatibility after incorporation into the combined primer–probe format. This comparison was not designed as a matched singleplex versus combined dilution series efficiency study. A no template control (NTC) was included to monitor for non-specific amplification. Final conditions were selected on the basis of the observed Ct values and fluorescence signals for the viral targets together with the absence of amplification in the NTC. The optimal conditions were used for all subsequent validation experiments.
The final combined RT-qPCR reaction mixture (50 μL total) contained 35 μL of enzyme mix, 5 μL of primer–probe mix, and 10 μL of template. The enzyme mix comprised 25.0 μL of reaction buffer, 3.0 μL of Lyo-Ready Taq DNA polymerase, 0.7 μL of Lyo-Ready dNTP mix, 2.0 μL of One-Step RT-qPCR Kit (Lyo-Ready) reverse transcriptase, and 4.3 μL of DNase/RNase-free ddH2O.
The 5-μL primer–probe mix contained 0.1 μL each of IC-F (100 μM), IC-R (100 μM), and IC-P-CY5 (100 μM); 0.5 μL each of PEDV-F (100 μM) and PEDV-R (100 μM); 0.2 μL of PEDV-P (100 μM); 0.2 μL each of PDCoV-F (100 μM) and PDCoV-R (100 μM); 0.1 μL of PDCoV-P (100 μM); and 3.0 μL of DNase/RNase-free ddH2O. Accordingly, the final concentrations in the 50-μL reaction were 1.0 μM each for the PEDV forward and reverse primers, 0.4 μM for the PEDV probe, 0.4 μM each for the PDCoV forward and reverse primers, 0.2 μM for the PDCoV probe, and 0.2 μM each for the IC forward primer, reverse primer, and probe. Amplification was performed on the Coyote Flash10 analyzer (Beijing Coyote Biotech Co., Ltd., Beijing, China) (Supplementary Figure S1) using the following program: reverse transcription at 50 °C for 1 min (1 cycle), initial denaturation at 95 °C for 1 min (1 cycle), followed by 45 cycles of 95 °C for 1 s, 60 °C for 5 s (with fluorescence data collection), and 72 °C for 1 s. The fluorescence signals were acquired in the FAM (PEDV), ROX (PDCoV), and CY5 (IC) channels. Fluorescence baseline and threshold determination and Ct calling were performed automatically by the Flash10 software. The instrument-based RT-qPCR amplification and fluorescence-detection process required approximately 30 min; this time did not include off-instrument preparation of the fecal matrix or other manual sample-preparation procedures. The RT-qPCR reaction occurs in a liquid-state chamber within the disposable cartridge; the pre-lyophilized reagents inside the cartridge are resuspended after loading the liquid reaction mixture (Supplementary Figure S3).
For viral-target interpretation in this analytical study, Ct < 35 together with a characteristic amplification curve was classified as positive, 35 ≤ Ct < 40 was classified as indeterminate and required repeat testing, and Ct ≥ 40 or absence of a Ct value was classified as negative. A Ct value within the indeterminate interval was therefore not treated as a confirmed positive result in the absence of the required repeat test.
For reactions containing porcine fecal matrix, the proprietary IC signal in the CY5 channel was recorded. However, because no exogenous IC template was added and the IC target is proprietary, CY5 signals were not used to assess sample validity, extraction efficiency, or RT efficiency. CY5 results are reported descriptively only.
Singleplex RT-qPCR assays were used as the reference methods for comparison, following the standard protocols described in the Chinese entry-exit inspection and quarantine industry standards (SN/T 1699-2017 [16] for PEDV and SN/T 5124-2019 [17] for PDCoV). These reference assays were performed on a QuantStudio™ 1 Plus real-time PCR instrument (Thermo Fisher Scientific, Waltham, MA, USA). RNA Dilution Series and Standard-Curve Analysis.
2.4. RNA Dilution Series and Standard-Curve Analysis
Serial dilutions of the PEDV and PDCoV RNA reference materials were prepared separately in RNase-free ddH2O. The two viral RNA preparations were not mixed. Each concentration level was tested in three technical replicates using the combined primer–probe reaction system. Individual Ct values, including Ct values within the indeterminate range and measurements for which no Ct was obtained, are reported in Supplementary Table S1. No confirmatory retesting of the exploratory low-concentration reactions was performed.
For PEDV, the concentration levels included in the standard-curve regression were 32.22, 3.222, and 0.3222 copies/μL. For PDCoV, the concentration levels included in the regression were 228, 45.6, 22.8, and 2.28 copies/μL. Standard curves were generated by linear regression of the mean Ct value of the three technical replicates at each concentration level against the log10-transformed RNA concentration. The regression equation and coefficient of determination (R2) were calculated. Because 10 μL of template was added to each 50-μL reaction, the corresponding nominal template copies per reaction were calculated as the reported concentration (copies/μL) × 10 μL.
The low-concentration experiments were exploratory and were not designed to establish a statistically validated limit of detection. In particular, PEDV at 3.222 copies/μL yielded Ct values of 37.66, 36.95, and 37.98, and PDCoV at 2.28 copies/μL yielded Ct values of 38.17, 38.29, and 38.27. Under the prespecified interpretation criteria, these Ct values fall within the indeterminate range (35 ≤ Ct < 40), and no confirmatory retesting was performed. Accordingly, these concentrations were treated as exploratory low-concentration amplification observations rather than formal LOD estimates.
2.5. Amplification Efficiency Calculation
Amplification efficiency (E) for PEDV and PDCoV was calculated from the slope of the standard curve generated using serial gradient dilutions (including 10-fold and 5-fold dilution steps) of nucleic acid controls. The slope (k) of each regression line was obtained from the equation
Amplification efficiency (E) was calculated using the MIQE-recommended formula:
The PEDV efficiency estimate was not presented as a validated performance metric because the regression included concentrations with mean Ct values in the indeterminate and negative ranges. The efficiency estimates describe the amplification behavior of the respective standard curves under the combined reaction conditions and were not used to claim quantitative equivalence between the two viral targets. In particular, no matched dilution-series comparison of PDCoV amplification efficiency between singleplex and combined formats was performed.
All calculations were performed using Microsoft Excel 2021 (Microsoft Corporation, Redmond, WA, USA).
2.6. Evaluation Using RNA-Spiked Porcine Fecal Matrix
A single fecal swab specimen obtained from one clinically healthy pig was used to prepare the porcine fecal background matrix. Before preparation of the working matrix, the specimen was confirmed negative for PEDV and PDCoV using the corresponding reference RT-qPCR assays. Thus, one independent negative fecal matrix was evaluated in this study. This specimen was used only to prepare the fecal background matrix and was not evaluated as part of an independent clinical specificity cohort.
The PEDV/PDCoV-negative fecal swab material was mixed 1:1 (v/v) with fecal processing buffer to prepare the working matrix. Pre-prepared and quantified PEDV or PDCoV RNA reference material was then spiked directly into the resulting fecal working matrix. No nucleic-acid extraction was performed after viral RNA spiking. Therefore, these experiments evaluated RT-qPCR detection in an RNA-spiked fecal background but did not evaluate viral lysis, RNA extraction or recovery, or extraction-associated variability.
PEDV and PDCoV RNA were spiked and tested separately rather than as a mixed viral-template preparation. PEDV-spiked matrix was evaluated neat and after 10-fold dilution, whereas PDCoV-spiked matrix was evaluated neat and after 10-fold and 100-fold dilution. These samples were tested in parallel using both the combined primer–probe RT-qPCR assay on the Flash10 platform and the corresponding reference RT-qPCR assays on the QuantStudio™ 1 Plus instrument, Thermo Fisher Scientific, Waltham, MA, USA. Each preparation was tested in three technical replicates, and the mean Ct, standard deviation (SD), and Ct-based coefficient of variation (CV) were calculated to describe within-run variability among the technical replicates. The triplicate measurements represented technical replicates derived from the same prepared sample and were not treated as independent biological specimens. Consequently, these experiments were used for descriptive comparison of Ct values and within-run Ct variability and were not used to establish clinical diagnostic agreement or equivalence between the two platforms.
For the PEDV 10-fold diluted RNA-spiked matrix, the three Flash10 Ct values were 37.16, 36.92, and 36.39. These results fell within the prespecified indeterminate interval (35 ≤ Ct < 40). Because no repeat testing was performed, this condition was recorded as an initial indeterminate result rather than a confirmed positive result.
2.7. Specificity Evaluation
To assess cross-reactivity, nucleic acid controls from four common swine pathogens, including transmissible gastroenteritis virus (TGEV), porcine rotavirus (PoRV), highly pathogenic porcine reproductive and respiratory syndrome virus (HP PRRSV), and African swine fever virus (ASFV)-were evaluated using the combined primer–probe RT-qPCR assay. Each non-target pathogen was evaluated in a single reaction. The exact input concentrations of these four non-target pathogen controls were not retained in the available experimental record; therefore, these values were not retrospectively reconstructed or inferred. The tested material was combined with the negative porcine fecal background matrix so that the proprietary IC amplification could be assessed concurrently.
Absence of amplification in the FAM and ROX channels was interpreted as absence of detectable cross-amplification for the corresponding PEDV and PDCoV targets under the tested conditions. The proprietary IC signal in the CY5 channel (Ct < 35) was recorded descriptively. Because no exogenous IC template was added and the target is proprietary, it was not used as a reaction-validity indicator, extraction control, or sample-validity control. Because only four non-target pathogens were evaluated and each was tested once, the analytical-specificity conclusion was restricted to this tested panel and was not extrapolated to other porcine enteric or respiratory pathogens.
2.8. Statistical Analysis
All statistical calculations including mean value, standard deviation (SD), coefficient of variation (CV), and linear regression for standard curve fitting were performed in Microsoft Excel 365.
Triplicate measurements within a given concentration or RNA-spiked matrix preparation were treated as technical replicates rather than independent biological specimens. Mean, SD, and CV were therefore used only to describe within-run Ct variability. Ct-based CV values were not interpreted as CVs of viral copy number or as evidence of inter-run or inter-day reproducibility. No independent inter-run or inter-day reproducibility experiment was performed.
For standard-curve analysis, linear regression was performed using the mean Ct value at each concentration level. Regression equations, R2 values, and amplification efficiencies derived from the regression slopes were reported descriptively.
No formal equivalence test, Bland–Altman limits-of-agreement analysis, or positive/negative agreement analysis was performed between the Flash10 and reference RT-qPCR platforms because the comparison was based on a limited number of RNA-spiked preparations and technical replicates rather than an adequate set of independent clinical specimens. Likewise, no binomial confidence interval was used to define an LOD because a statistically validated detection limit was not established in this study.
3. Results
3.1. Primer and Probe Sequence-Conservation Analysis for the Combined Primer–Probe RT-qPCR Assay
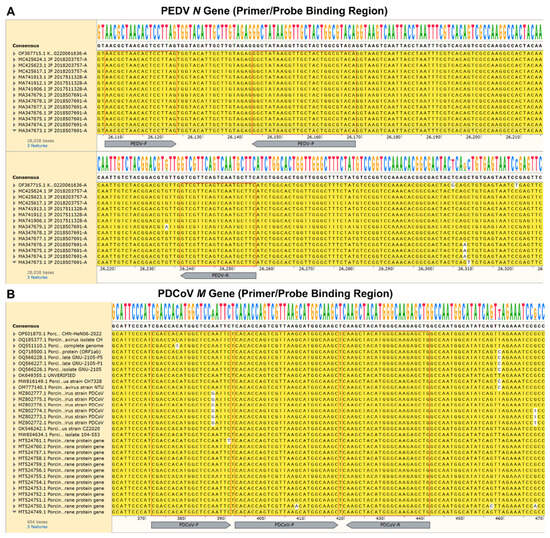
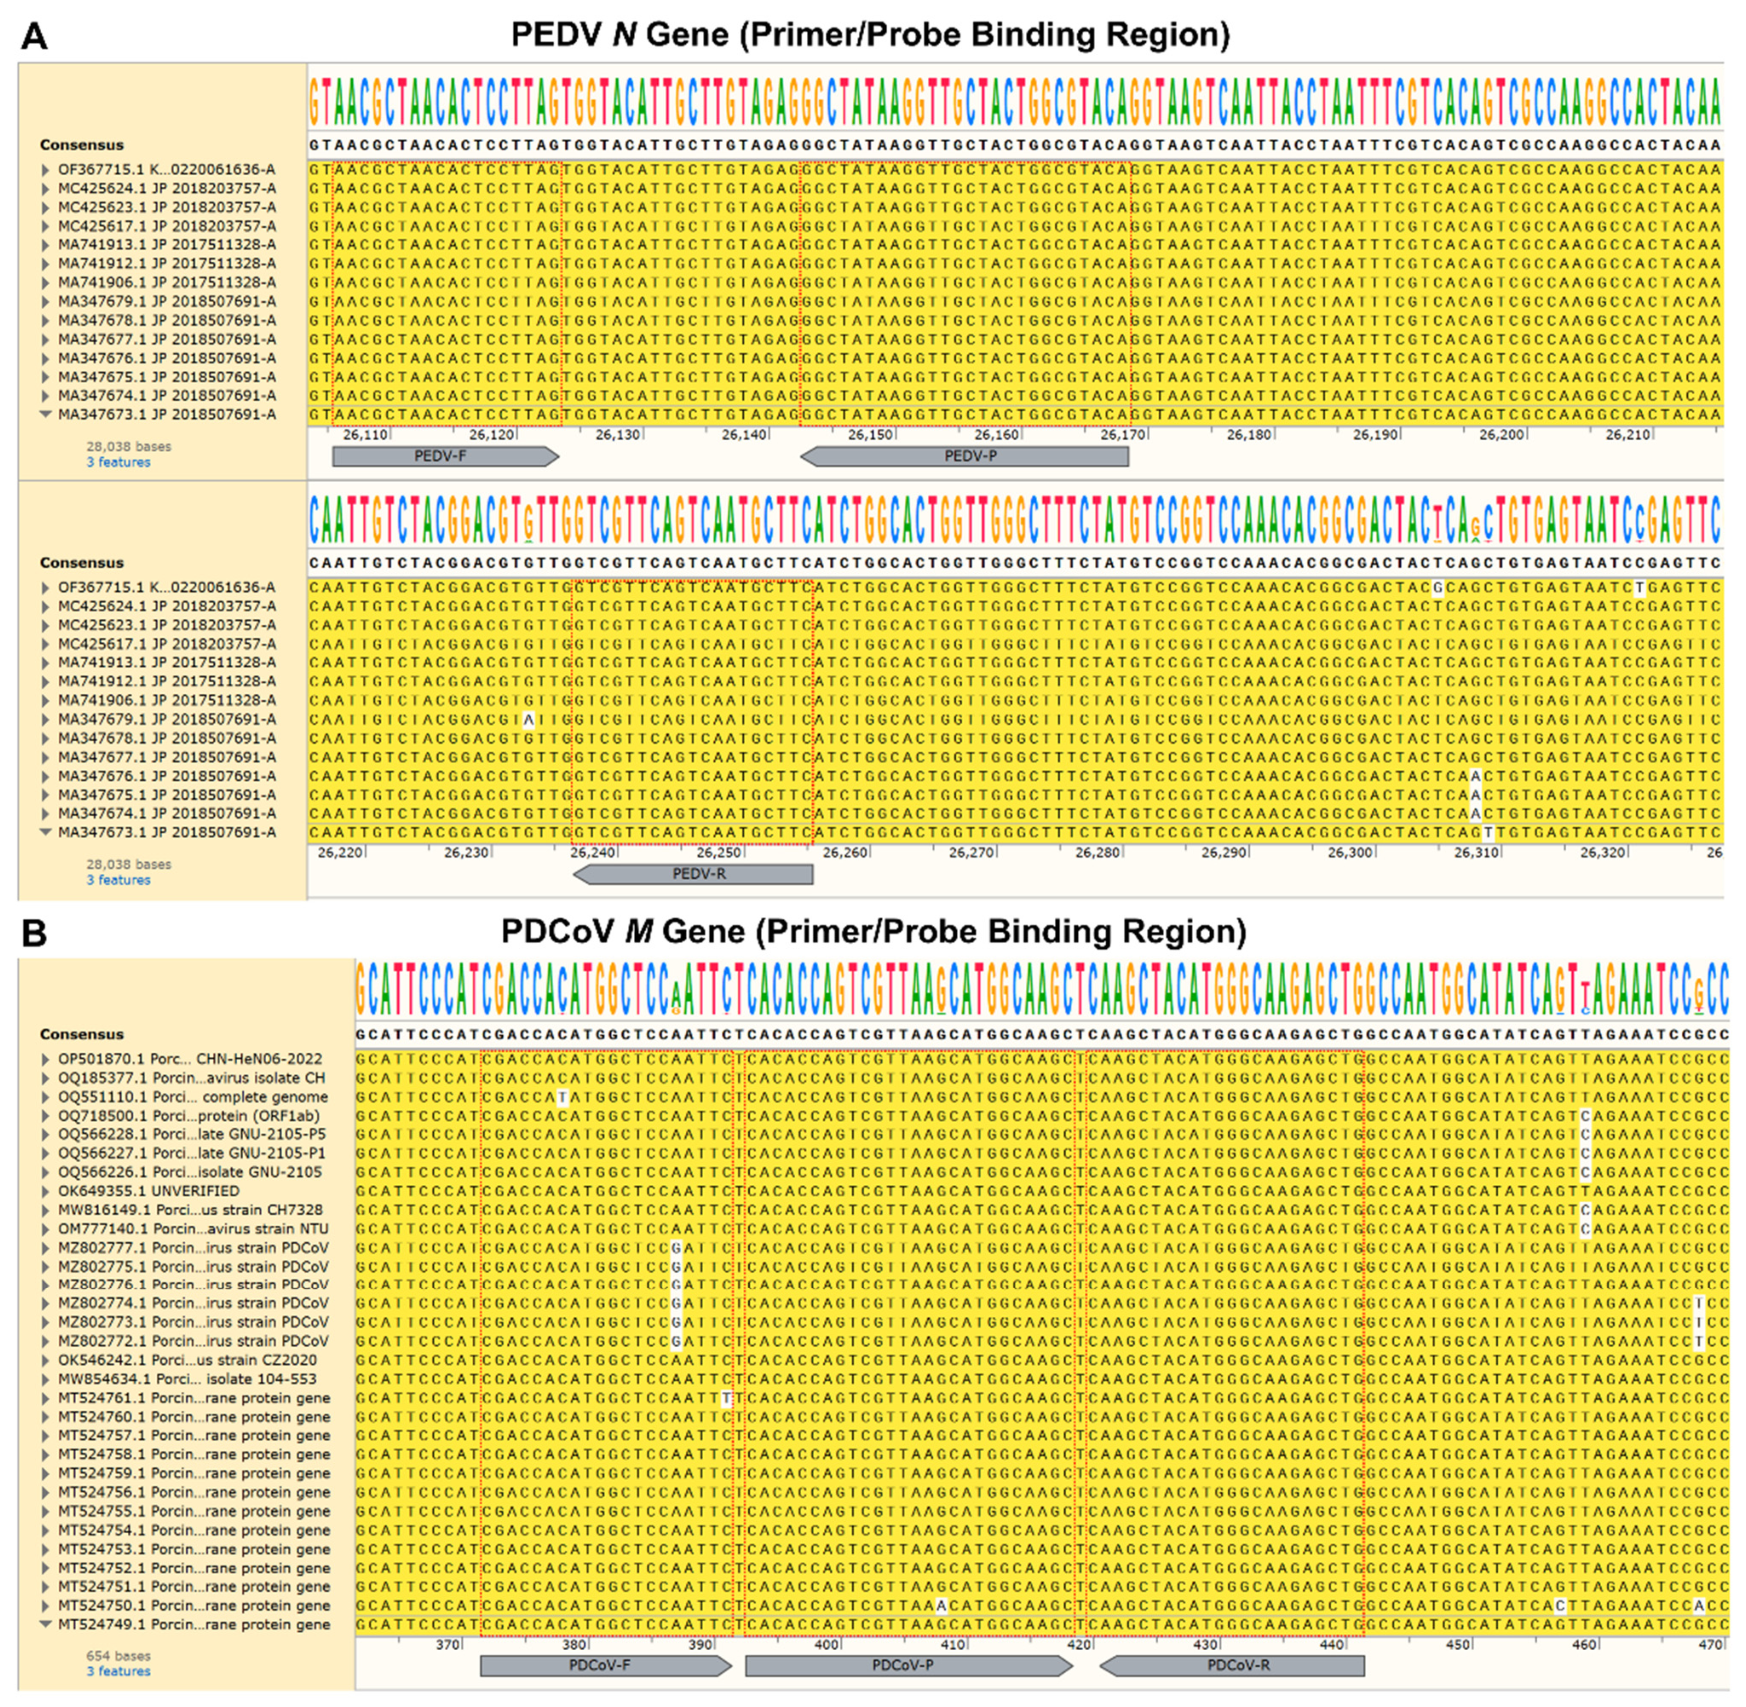
Multiple-sequence alignments of the complete genome sequences of 14 PEDV strains and 31 PDCoV strains showed that the examined primer- and probe-binding regions were conserved within the respective sequence sets analyzed in this study. A small number of nucleotide mismatches were observed in the PDCoV-F binding region in some sequences (e.g., MZ802777.1), while the PEDV regions were conserved within the analyzed dataset (Figure 1). These findings demonstrate conservation of the examined binding regions within the analyzed sequence dataset but do not establish coverage of all circulating PEDV or PDCoV lineages.
Figure 1.
Multiple-sequence alignment of the primer- and probe-binding regions among the PEDV (A) and PDCoV (B) complete genome sequences included in the analysis. Complete viral genome sequences were imported into SnapGene (Version 6.0.2) for alignment. The primers and probes were adopted from SN/T 1699-2017 for PEDV and SN/T 5124-2019 for PDCoV. F, forward primer; R, reverse primer; P, dual-labeled TaqMan probe. A small number of mismatches were observed in the PDCoV-F region in some sequences. Red boxes indicate the binding regions of primers and probes. Accession numbers and available sequence metadata are provided in Supplementary Table S2.
3.2. Optimization of the Combined Primer–Probe RT-qPCR Reaction System
The optimization of the annealing temperature showed that 60 °C provided the earliest Ct values and the highest fluorescence signal increase (ΔRn) among the conditions evaluated for both PEDV and PDCoV. No amplification was observed in the corresponding NTC reactions under the selected conditions.
Primer/probe amounts were subsequently optimized under the selected reaction conditions. The selected final concentrations were 1.0 μM each for the PEDV forward and reverse primers, 0.4 μM for the PEDV probe, 0.4 μM each for the PDCoV forward and reverse primers, 0.2 μM for the PDCoV probe, and 0.2 μM each for the proprietary IC forward primer, reverse primer, and probe. These conditions were used in the subsequent analytical experiments. The amplification efficiencies reported from the subsequent RNA standard-curve experiments were not used as acceptance criteria during this assay-development optimization.
During assay development, single-target controls were also evaluated at a selected template concentration alongside reactions containing the combined PEDV- and PDCoV-specific primer/probe sets. Incorporation of the two primer/probe sets into the combined primer–probe reaction did not produce an evident deterioration in the observed target Ct values or fluorescence signals under the tested condition. This development stage comparison was performed at a selected template concentration rather than across matched dilution series and therefore was not used to compare singleplex and combined primer–probe amplification efficiencies.
Recombinant plasmid DNA templates were also utilized in this optimization phase. Serial dilutions of plasmid constructs generated measurable amplification signals for both PEDV and PDCoV targets and showed dilution dependent amplification responses (Supplementary Figure S2). Nevertheless, because digital PCR failed to yield reliable absolute copy number values for the plasmid stocks, plasmid derived amplification results serve only as qualitative supporting evidence for target sequence amplifiability. All formal sensitivity and standard curve characterization reported in this manuscript rely exclusively on quantified in vitro transcribed viral RNA reference materials.
3.3. RNA Dilution Series Amplification and Standard-Curve Analysis
PEDV and PDCoV RNA reference materials were evaluated separately using the combined primer–probe reaction system; the two viral RNA preparations were not mixed. Each concentration level was tested in three technical replicates, and all individual Ct values are provided in Supplementary Table S1.
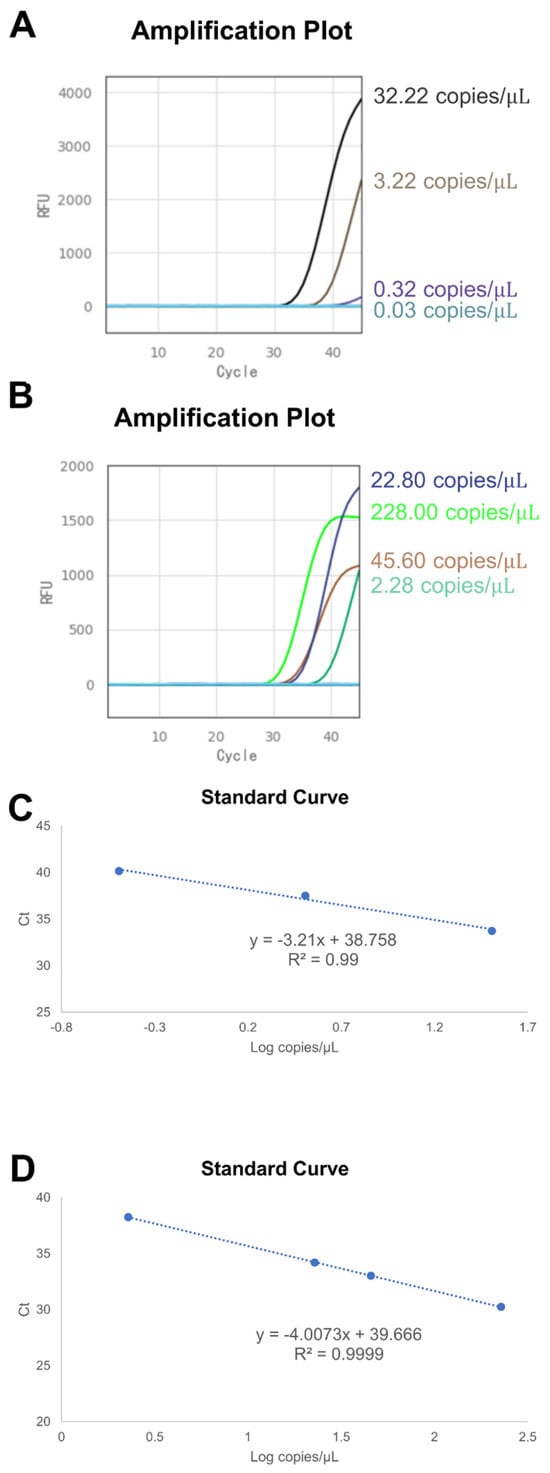
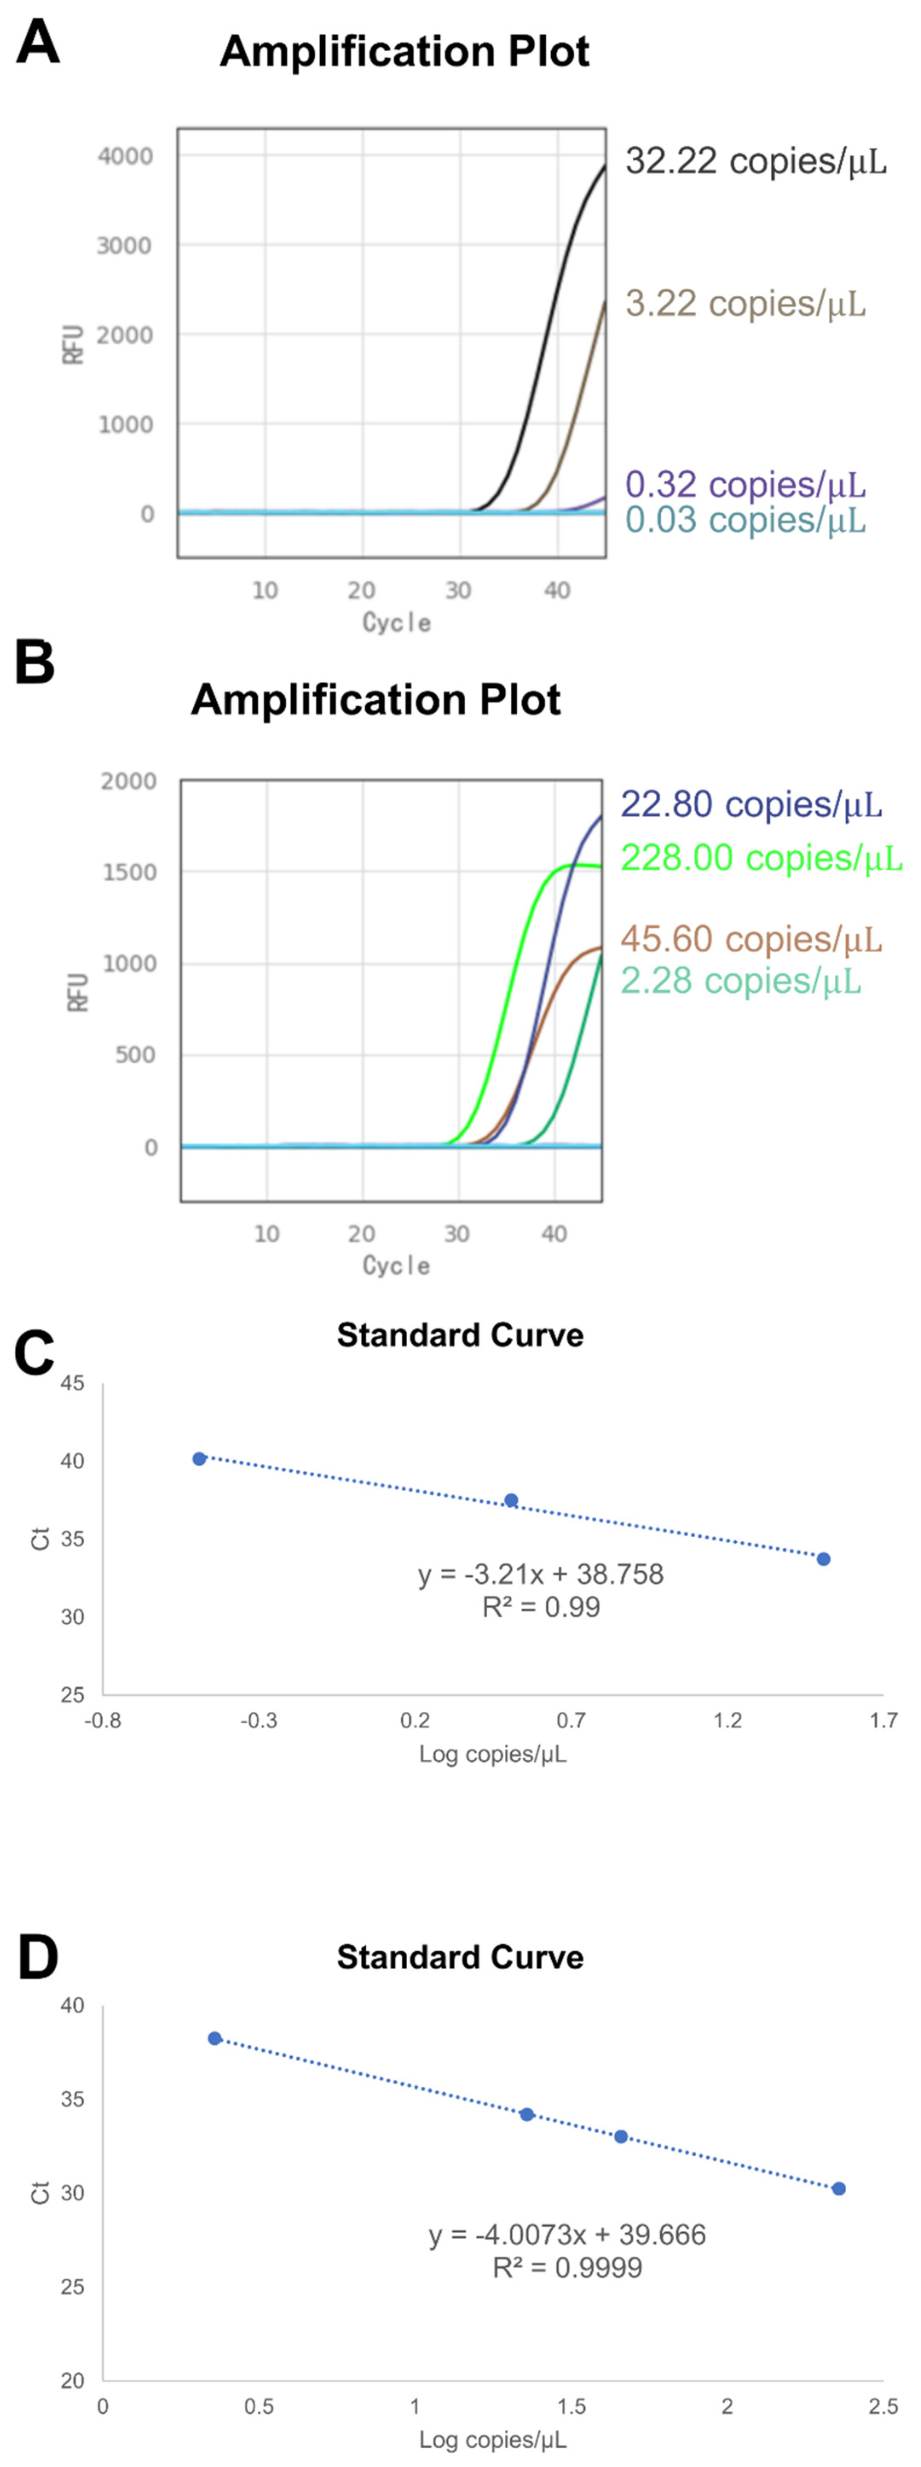
Representative amplification plots and standard-curve fittings are shown in Figure 2.
Figure 2.
Amplification and standard-curve analysis of PEDV and PDCoV RNA reference materials using the combined primer–probe RT-qPCR reaction system. (A,B) Representative amplification curves obtained for the PEDV and PDCoV RNA dilution series, respectively. (C) PEDV standard curve generated from three concentration levels (32.22, 3.222, and 0.3222 copies/μL). (D) PDCoV standard curve generated from four concentration levels (228, 45.6, 22.8, and 2.28 copies/μL). Each concentration was tested in three technical replicates, and regression was performed using the mean Ct value at each concentration level. Individual replicate Ct values, including measurements within the indeterminate range and non-detections, are provided in Supplementary Table S1.
For PEDV, the three concentration levels included in the standard-curve regression were 32.22, 3.222, and 0.3222 copies/μL. The corresponding mean Ct values were 33.73, 37.53, and 40.15, respectively. Because the mean Ct values at 3.222 and 0.3222 copies/μL fell within the indeterminate and negative ranges, respectively, the fitted regression is reported for exploratory trend observation only and does not represent a validated amplification efficiency.
For PDCoV, the four concentration levels included in the regression were 228, 45.6, 22.8, and 2.28 copies/μL. The corresponding mean Ct values were 30.24, 33.01, 34.19, and 38.24, respectively. Linear regression yielded an equation of approximately y = −4.00x + 39.66 (R2 > 0.999), corresponding to an amplification efficiency of approximately 77.7%. Although the PDCoV Ct values showed a linear relationship with log10 RNA concentration over the tested concentration levels, the amplification efficiency was suboptimal. Accordingly, the high R2 reflects linearity of the fitted regression within the tested dataset but does not establish quantitative accuracy.
At the lower concentrations examined, PEDV at 3.222 copies/μL yielded Ct values of 37.66, 36.95, and 37.98, whereas PDCoV at 2.28 copies/μL yielded Ct values of 38.17, 38.29, and 38.27. All of these Ct values fell within the prespecified indeterminate interval of 35 ≤ Ct < 40. Because confirmatory repeat testing was not performed, these concentrations represent exploratory low-concentration amplification observations rather than formally established limits of detection. With 10 μL of template per reaction, 3.222 copies/μL PEDV and 2.28 copies/μL PDCoV corresponded nominally to 32.22 and 22.8 copies per reaction, respectively.
In addition to RNA-based standard curve characterization, serially diluted recombinant plasmids containing PEDV N and PDCoV M inserts were tested in the combined primer–probe mix. Amplification was observed for both targets, and linear relationships between Ct values and plasmid dilution factors were obtained (Supplementary Figure S2). However, due to unsuccessful digital PCR quantification of the starting plasmid material, absolute copy number values for each dilution remain unknown. Consequently, these plasmid-based results are presented as supplementary evidence for target sequence amplifiability and were not used for LOD calculation or quantitative performance assessment.
3.4. Evaluation in RNA-Spiked Porcine Fecal Matrix
The assay was further evaluated using PEDV- or PDCoV-RNA-spiked porcine fecal matrix. The experiments used a single negative fecal matrix prepared from one pig, and the viral RNA reference materials were spiked directly into the pre-prepared fecal working matrix without subsequent RNA extraction. PEDV and PDCoV RNA were evaluated separately. The resulting Ct values were compared descriptively with those obtained using the corresponding reference RT-qPCR assays (Table 2). The single negative fecal matrix served only as the background matrix for RNA-spiking experiments and did not constitute an independent clinical specificity cohort.
Table 2.
Ct values obtained with the Flash10 combined primer–probe RT-qPCR and reference RT-qPCR assays for RNA-spiked porcine fecal-matrix preparations.
For PEDV, the Flash10 combined RT-qPCR assay yielded Ct values of 33.28, 33.53, and 34.92 for the neat RNA-spiked matrix, with a mean Ct of 33.910 (SD = 0.884; CV = 2.61%). All three measurements were below the Ct < 35 positive threshold. For the 10-fold diluted preparation, Ct values were 37.16, 36.92, and 36.39, with a mean Ct of 36.823 (SD = 0.394; CV = 1.07%). All three values were within the prespecified indeterminate interval (35 ≤ Ct < 40). Because the required repeat testing was not performed, the PEDV 10-fold diluted condition was classified as an initial indeterminate result rather than a confirmed positive result. The reference RT-qPCR assay yielded mean Ct values of 30.924 (CV = 2.36%) and 34.356 (CV = 0.90%) for the corresponding neat and 10-fold diluted preparations.
For PDCoV, the Flash10 combined RT-qPCR assay yielded Ct values below 35 in all three technical replicates of the neat, 10-fold, and 100-fold diluted preparations. The mean Ct values were 27.683 (CV = 0.37%), 30.663 (CV = 0.23%), and 34.017 (CV = 1.00%), respectively. The reference RT-qPCR assay provided mean Ct values of 24.604 (CV = 0.06%), 27.743 (CV = 0.38%), and 31.078 (CV = 0.04%).
Across these tested preparations, the Flash10 mean Ct values were higher than the corresponding reference RT-qPCR mean Ct values by approximately 2.47–3.08 cycles. Specifically, the mean Ct differences (Flash10 minus reference RT-qPCR) were 2.986 and 2.467 cycles for the PEDV neat and 10-fold preparations, respectively, and 3.079, 2.920, and 2.939 cycles for the PDCoV neat, 10-fold, and 100-fold preparations, respectively. These differences were described without formal equivalence testing because the measurements were based on technical replicates from a limited number of RNA-spiked preparations rather than independent clinical specimens. Accordingly, the observed Ct differences should not be interpreted as demonstrating equivalence or interchangeability between the Flash10 and reference RT-qPCR platforms.
Within-run Ct CVs for the Flash10 measurements ranged from 0.23% to 2.61% across the tested preparations, showing low within-run Ct variability among technical replicates under these experimental conditions. These CVs describe technical within-run variability only and do not establish inter-run reproducibility or equivalence with the reference RT-qPCR method. No authentic PEDV-positive, PDCoV-positive, or naturally PEDV/PDCoV-coinfected clinical specimens were evaluated; therefore, clinical diagnostic performance cannot be inferred from these RNA-spiked fecal-matrix experiments.
3.5. Analytical Specificity Within the Tested Non-Target Pathogen Panel
The analytical specificity of the combined primer–probe RT-qPCR assay was evaluated against the four non-target swine pathogens available in the test panel: TGEV, PoRV, HP-PRRSV, and ASFV. Each non-target pathogen was evaluated in a single reaction. The exact input concentrations of these four non-target pathogen controls were not retained in the available experimental record and therefore could not be reported. As shown in Table 3, no amplification was observed in either the FAM (PEDV) or ROX (PDCoV) channel for any of the four non-target pathogens. The proprietary IC was detected in the CY5 channel, with Ct values of 23.90 for TGEV, 25.89 for PoRV, 25.81 for HP-PRRSV, and 25.71 for ASFV, corresponding to a range of 23.90–25.89. Thus, no cross-amplification was observed within the limited non-target pathogen panel evaluated in this study. Because only four non-target pathogens were evaluated and each was tested in a single reaction, these results do not constitute an extensive or replicated analytical specificity validation.
Table 3.
Analytical specificity results for the tested non-target pathogen panel.
4. Discussion
This technical note reports the analytical performance of combined PEDV- and PDCoV-targeting primer–probe sets within a combined primer–probe RT-qPCR reaction on the Coyote Flash10 POCT platform. The primer–probe sets were adopted from Chinese industry standards targeting conserved regions of the PEDV N gene and the PDCoV M gene. The specific contribution of this work is the adaptation and preliminary analytical evaluation of these sets for a porcine enteric-virus application on the Flash10 platform, rather than the introduction of duplex detection on this platform. The assay should be regarded as a qualitative viral-target detection method, not as a validated quantitative viral-load assay.
The RNA dilution-series experiments showed concentration-dependent amplification for both targets. For PEDV, the regression included concentrations with mean Ct values in the indeterminate and negative ranges; therefore, the apparent efficiency is reported for exploratory trend observation only and is not presented as a validated performance metric. For PDCoV, the standard curve showed strong linearity (R2 > 0.999) but suboptimal efficiency (~77.7%), indicating that the assay should be interpreted as qualitative only. Consistent with MIQE principles, amplification efficiency, linearity, and low-concentration detection are distinct analytical characteristics [18,19]. Because the standard curves were generated in RNase-free water, fecal-matrix inhibition does not explain the reduced PDCoV efficiency. Further optimization and matched singleplex-versus-combined dilution-series comparisons will be required.
The low-concentration results also require cautious interpretation. PEDV at 3.222 copies/μL and PDCoV at 2.28 copies/μL produced amplification in all three initial technical replicates, but the corresponding Ct values fell within the prespecified indeterminate interval (35 ≤ Ct < 40). Because confirmatory repeat testing was not performed, these concentrations cannot be considered confirmed positive detection limits. They are reported as exploratory low-concentration amplification observations rather than formally established LODs. A statistically validated LOD was not established in this study; future LOD determination will require additional replicates around candidate boundaries and predefined detection-probability criteria.
In the RNA-spiked fecal-matrix experiments, both targets showed low within-run Ct variability among technical replicates (CV < 3%). However, these replicates were derived from the same prepared samples and were not independent biological specimens; the observed CVs therefore describe within-run variability only. Flash10 Ct values were approximately 2.47–3.08 cycles higher than those of the reference RT-qPCR assays. These differences are descriptive only and should not be interpreted as demonstrating equivalence between platforms. The fecal-matrix experiments used a single negative matrix from one pig, and viral RNA was spiked directly into the pre-processed matrix without nucleic-acid extraction. Consequently, these experiments evaluated amplification in a fecal background but did not assess viral lysis, RNA recovery, extraction variability, or between-animal matrix variation. The proprietary IC signal was recorded descriptively. Because no exogenous IC template was added and the IC target is proprietary, IC results were not used to assess extraction efficiency, RT efficiency, PCR inhibition, or sample validity. In addition, no mixed-ratio co-template experiments were performed, and performance under imbalanced PEDV/PDCoV coinfection therefore remains unknown.
Specificity testing showed no amplification in the PEDV or PDCoV channels for the four non-target pathogens evaluated (TGEV, PoRV, HP-PRRSV, and ASFV), while the proprietary IC channel remained detectable. Each non-target pathogen was tested in a single reaction, and the exact input concentrations were not retained. Because the panel was limited to four pathogens, these results do not constitute an extensive or replicated analytical-specificity validation.
Several multiplex nucleic-acid detection assays targeting PEDV and PDCoV have been reported [20,21], as well as rapid POCT or antigen-sensing platforms for PEDV [22,23]. Representative methods are summarized in Table 4. Direct numerical comparison of analytical sensitivity is not appropriate because these studies differ in target genes, reference materials, concentration assignment, template input, specimen matrix, and LOD criteria. Because no statistically validated LOD was established here, no claim of superior or comparable analytical sensitivity is made. The Flash10 instrument completed amplification and fluorescence detection in approximately 30 min; this duration excludes off-instrument sample preparation. The present study did not evaluate a complete sample-to-result workflow, total hands-on time, operational robustness, throughput, contamination control, or field usability.
Table 4.
Comparison of the present assay with representative previously reported molecular and rapid detection methods for PEDV and PDCoV.
This work has several important limitations. Reliable digital-PCR quantification of plasmid stocks was not achieved; plasmid data therefore serve only as qualitative evidence of target amplifiability. No mixed-ratio co-template testing with quantified PEDV and PDCoV RNA was performed. All primary validation used RNA-spiked fecal matrix rather than authentic clinical specimens, and no nucleic-acid extraction was performed after spiking. The fecal background was derived from a single animal, and between-animal matrix variation was not assessed. The specificity panel was limited to four pathogens, each tested once. No authentic PEDV-positive, PDCoV-positive, or naturally coinfected clinical specimens were evaluated; consequently, diagnostic sensitivity, diagnostic specificity, and clinical agreement with reference methods cannot be established.
Future work should include blinded testing of clinical specimen panels against established reference methods; mixed-ratio co-template experiments across different PEDV:PDCoV ratios; matched singleplex-versus-combined dilution-series comparisons; independent fecal matrices and inter-run reproducibility testing; expanded specificity panels; larger replicate numbers for statistically supported LOD determination; and evaluation of genetically diverse contemporary field isolates.
In summary, this study supports the preliminary analytical feasibility of combined PEDV/PDCoV primer–probe RT-qPCR on the Flash10 platform. The assay showed concentration-dependent amplification of both targets, low within-run Ct variability, and no observed cross-amplification within the limited four-pathogen panel. However, suboptimal PDCoV efficiency, absence of a statistically validated LOD, a single negative fecal matrix without extraction, limited reproducibility and specificity testing, absence of mixed-template experiments, and lack of authentic clinical specimens define the current scope of the evidence. Clinical diagnostic performance and field utility remain to be established.
Supplementary Materials
The following supporting information can be downloaded at https://www.mdpi.com/article/10.3390/vetsci13111215/s1: Table S1: Raw Ct values obtained for RNA dilution-series experiments; Table S2: GenBank accession numbers and metadata of PEDV and PDCoV sequences used for multiple-sequence alignment; Figure S1. Photograph of the Coyote Flash10 RT-qPCR analyzer and disposable reaction cartridge used in this study. (A) Coyote Flash10 analyzer. (B) Disposable reaction cartridge used for the PEDV/PDCoV combined primer–probe RT-qPCR assay. Figure S2. Standard-curve plots from serially diluted recombinant plasmids carrying PEDV-N (A) and PDCoV-M (B) target inserts. X-axis: log10 plasmid dilution factor; Y-axis: Ct value. Reliable absolute copy-number quantification of the original plasmid stock could not be achieved via digital PCR; therefore, these plasmid data serve only to demonstrate target amplifiability and dilution-dependent linear trends and were not applied for limit-of-detection or quantitative analysis. Figure S3. Schematic illustration of the liquid-state reaction workflow inside the Flash10 cartridge.
Author Contributions
Conceptualization, Y.-J.R., L.-L.R. and X.L.; methodology, Y.-J.R., X.-L.Z. and F.Y.; software, J.-R.D.; validation, Y.-J.R., H.L. and J.Z.; formal analysis, Y.-J.R.; investigation, Y.-J.R., X.-L.Z., H.W.; resources, B.Z., J.-L.P., Y.-Q.D. and H.-X.L.; data curation, Y.-J.R.; writing—original draft preparation, Y.-J.R.; writing—review and editing, L.-L.R. and X.L.; visualization, Y.-J.R.; supervision, L.-L.R. and X.L.; project administration, L.-L.R.; funding acquisition, L.-L.R. All authors have read and agreed to the published version of the manuscript.
Funding
The authors declared that financial support was received for this work and its publication. This work was supported by the National Key Research and Development Program of China (grant no. 2024YFF0618304), the Scientific Research Project of the General Administration of Customs (grant no. 2025HK197) and the Independent Scientific Research Project of Science and Technology Research Center of China Customs (grant no. 2024HX11).
Institutional Review Board Statement
Ethical review and approval were waived for this study. Only archived swine faecal specimens leftover from routine diagnostic testing were used in this study; no live-animal experiments were performed.
Informed Consent Statement
Not applicable.
Data Availability Statement
The original contributions presented in the study are included in the article/Supplementary Material. Further inquiries can be directed to the corresponding authors.
Acknowledgments
The authors thank the laboratory colleagues for technical support during the experimental work. During the preparation of this manuscript, the authors used AI tools for grammar and punctuation polishing only. The authors have reviewed and edited the output and take full responsibility for the content of this publication.
Conflicts of Interest
Author H.-X.L. is employed by Beijing Coyote Biotech Co., Ltd., the manufacturer of the Flash10 POCT device evaluated in this study. Beijing Coyote Biotech Co., Ltd. provided the Flash10 instrument and disposable reaction cartridges used in this study. The remaining authors declare no conflicts of interest. The funders had no role in the design of the study; in the collection, analyses, or interpretation of data; in the writing of the manuscript; or in the decision to publish the results.
Abbreviations
The following abbreviations are used in this manuscript:
| POCT | point-of-care testing |
| RT-qPCR | real-time quantitative reverse-transcription polymerase chain reaction |
| PEDV | Porcine epidemic diarrhoea virus |
| PDCoV | Porcine deltacoronavirus |
| dPCR | digital polymerase chain reaction |
| MIQE | Minimum Information for Publication of Quantitative Real-Time PCR Experiments |
| CV | coefficient of variation |
| N | nucleocapsid gene |
| M | membrane gene |
| IC | internal control |
References
- Jung, K.; Saif, L.J.; Wang, Q. Porcine epidemic diarrhea virus (PEDV): An update on etiology, transmission, pathogenesis, and prevention and control. Virus Res. 2020, 286, 198045. [Google Scholar] [CrossRef] [Scilit]
- Zhang, J. Porcine deltacoronavirus: Overview of infection dynamics, diagnostic methods, prevalence and genetic evolution. Virus Res. 2016, 226, 71–84. [Google Scholar] [CrossRef] [Scilit]
- Pensaert, M.B.; de Bouck, P. A new coronavirus-like particle associated with diarrhea in swine. Arch. Virol. 1978, 58, 243–247. [Google Scholar] [CrossRef] [Scilit]
- Lee, C. Porcine epidemic diarrhea virus: An emerging and re-emerging epizootic swine virus. Virol. J. 2015, 12, 193. [Google Scholar] [CrossRef] [Scilit]
- Woo, P.C.; Lau, S.K.; Lam, C.S.; Lau, C.C.; Tsang, A.K.; Lau, J.H.; Bai, R.; Teng, J.L.; Tsang, C.C.; Wang, M.; et al. Discovery of seven novel Mammalian and avian coronaviruses in the genus Deltacoronavirus supports bat coronaviruses as the gene source of Alphacoronavirus and Betacoronavirus and avian coronaviruses as the gene source of Gammacoronavirus and Deltacoronavirus. J. Virol. 2012, 86, 3995–4008. [Google Scholar] [CrossRef] [Scilit]
- Hsueh, F.C.; Hsu, F.Y.; Chen, Y.H.; Shih, H.C.; Lin, W.H.; Yang, C.Y.; Lin, C.F.; Chiou, M.T.; Lin, C.N. Phylogenetic Classification of Global Porcine Deltacoronavirus (PDCoV) Reference Strains and Molecular Characterization of PDCoV in Taiwan. Viruses 2021, 13, 1337. [Google Scholar] [CrossRef] [Scilit]
- Zhang, H.; Han, F.; Shu, X.; Li, Q.; Ding, Q.; Hao, C.; Yan, X.; Xu, M.; Hu, H. Co-infection of porcine epidemic diarrhoea virus and porcine deltacoronavirus enhances the disease severity in piglets. Transbound. Emerg. Dis. 2022, 69, 1715–1726. [Google Scholar] [CrossRef] [Scilit]
- Mackay, I.M.; Arden, K.E.; Nitsche, A. Real-time PCR in virology. Nucleic Acids Res. 2002, 30, 1292–1305. [Google Scholar] [CrossRef] [Scilit]
- Velayudhan, B.T.; Naikare, H.K. Point-of-care testing in companion and food animal disease diagnostics. Front. Vet. Sci. 2022, 9, 1056440. [Google Scholar] [CrossRef] [Scilit]
- Elnifro, E.M.; Ashshi, A.M.; Cooper, R.J.; Klapper, P.E. Multiplex PCR: Optimization and application in diagnostic virology. Clin. Microbiol. Rev. 2000, 13, 559–570. [Google Scholar] [CrossRef]
- Chen, J.; Liu, R.; Liu, H.; Chen, J.; Li, X.; Zhang, J.; Zhou, B. Development of a Multiplex Quantitative PCR for Detecting Porcine Epidemic Diarrhea Virus, Transmissible Gastroenteritis Virus, and Porcine Deltacoronavirus Simultaneously in China. Vet. Sci. 2023, 10, 402. [Google Scholar] [CrossRef] [Scilit]
- Yang, Y.; Xiao, X.; Ren, M.; Jiang, N.; Xie, X.; Zheng, X.; Yin, R.; Luan, S.; Wang, J.; Li, P. Development of a triplex RT-qPCR assay for rapid and accurate detection of porcine rotavirus, porcine epidemic diarrhea virus, and porcine deltacoronavirus. Vet. Res. Commun. 2026, 50, 259. [Google Scholar] [CrossRef] [Scilit]
- Li, Y.; Niu, J.W.; Zhou, X.; Chu, P.P.; Zhang, K.L.; Gou, H.C.; Yang, D.X.; Zhang, J.F.; Li, C.L.; Liao, M.; et al. Development of a multiplex qRT-PCR assay for the detection of porcine epidemic diarrhea virus, porcine transmissible gastroenteritis virus and porcine Deltacoronavirus. Front. Vet. Sci. 2023, 10, 1158585. [Google Scholar] [CrossRef] [Scilit]
- Zeng, J.; Wang, W.; Zhou, L.; Ge, X.; Han, J.; Guo, X.; Chen, Y.; Zhang, Y.; Yang, H. A nucleic acid detection assay combining reverse transcription recombinase-aided amplification with a lateral flow dipstick for the rapid visual detection of porcine deltacoronavirus. Virulence 2022, 13, 1471–1485. [Google Scholar] [CrossRef] [Scilit]
- Ren, Y.J.; Lin, H.; Yu, D.J.; Zhang, J.; Yang, F.; Zhang, B.Y.; Chen, Y.Q.; Long, H.X.; Ren, L.L. A duplex real-time fluorescent quantitative PCR method for simultaneous and rapid detection of Actinobacillus pleuropneumoniae and influenza A virus. Front. Vet. Sci. 2026, 13, 1774637. [Google Scholar] [CrossRef] [Scilit]
- Standard’s SN/T 1699-2017; Quarantine Protocol for Porcine Epidemic Diarrhea. General Administration of Customs of China: Beijing, China, 2017.
- Standard’s SN/T 5124-2019; Quarantine Protocol for Porcine Deltacoronavirus. General Administration of Customs of China: Beijing, China, 2019.
- Bustin, S.A.; Benes, V.; Garson, J.A.; Hellemans, J.; Huggett, J.; Kubista, M.; Mueller, R.; Nolan, T.; Pfaffl, M.W.; Shipley, G.L.; et al. The MIQE guidelines: Minimum information for publication of quantitative real-time PCR experiments. Clin. Chem. 2009, 55, 611–622. [Google Scholar] [CrossRef] [Scilit]
- Bustin, S.A.; Ruijter, J.M.; van den Hoff, M.J.B.; Kubista, M.; Pfaffl, M.W.; Shipley, G.L.; Tran, N.; Rodiger, S.; Untergasser, A.; Mueller, R.; et al. MIQE 2.0: Revision of the Minimum Information for Publication of Quantitative Real-Time PCR Experiments Guidelines. Clin. Chem. 2025, 71, 634–651. [Google Scholar] [CrossRef] [Scilit]
- Lazov, C.M.; Papetti, A.; Belsham, G.J.; Botner, A.; Rasmussen, T.B.; Boniotti, M.B. Multiplex Real-Time RT-PCR Assays for Detection and Differentiation of Porcine Enteric Coronaviruses. Pathogens 2023, 12, 1040. [Google Scholar] [CrossRef] [Scilit]
- Baek, J.H.; Lee, Y.M.; Vu, N.D.; Kim, M.H.; Zhao, J.; Le, V.P.; Cho, J.H.; Park, J.E. A multiplex real-time RT-qPCR assay for simultaneous detection of porcine epidemic diarrhea virus, porcine deltacoronavirus, and swine acute diarrhea syndrome coronavirus. Arch. Virol. 2024, 169, 82. [Google Scholar] [CrossRef] [Scilit]
- Victorious, A.; Zhang, Z.; Chang, D.; Maclachlan, R.; Pandey, R.; Xia, J.; Gu, J.; Hoare, T.; Soleymani, L.; Li, Y. Inside Back Cover: A DNA Barcode-Based Aptasensor Enables Rapid Testing of Porcine Epidemic Diarrhea Viruses in Swine Saliva Using Electrochemical Readout (Angew. Chem. Int. Ed. 31/2022). Angew. Chem. Int. Ed. 2022, 61, e202209207. [Google Scholar] [CrossRef] [Scilit]
- Umrao, S.; Naru, A.; Gandavadi, D.; Zheng, M.; Lanka, S.; Cho, H.; Hoang, C.N.M.; Zhang, J.; Fang, Y.; Wang, X. Ultrasensitive Detection of Porcine Epidemic Diarrhea Virus Infections Using Multivalent DNA Nanostructure-Enabled Lateral Flow Assay. Adv. Healthc. Mater. 2026, 15, e04037. [Google Scholar] [CrossRef] [Scilit]

Disclaimer/Publisher’s Note: The statements, opinions and data contained in all publications are solely those of the individual author(s) and contributor(s) and not of MDPI and/or the editor(s). MDPI and/or the editor(s) disclaim responsibility for any injury to people or property resulting from any ideas, methods, instructions or products referred to in the content. |
© 2026 by the authors. Licensee MDPI, Basel, Switzerland. This article is an open access article distributed under the terms and conditions of the Creative Commons Attribution (CC BY) license.