


Abstract
The global transition toward low-carbon energy and advanced technologies has intensified demands for rare earth elements (REEs), while available data remain fragmented across government and academic sources. To address this gap, this study compiles and standardizes a publicly accessible geochemical database of REE concentrations (among other variables) across Peru, motivated by the need for consolidated, evidence-based resource assessment. The dataset integrates over 30,000 records from national agencies and university repositories, classified by sample source (stream sediments, rocks and minerals, deep and surface soils, tailings, and industrial materials). This structure enhances comparability and interpretation across geological and environmental contexts. By providing a centralized, high-resolution dataset for an undercharacterized mineral province, this work offers a resource for exploration, policy development, and sustainable management amid growing global demand and strategic interest in critical minerals.
Dataset License: Creative Commons Attribution 4.0 International.
1. Summary
The current state of knowledge on rare earth elements (REEs) in Peru remains incipient, despite progressive advances in geological understanding. Early studies identified REE occurrences associated with both primary deposits (linked to alkaline igneous rocks, carbonatites, pegmatites, and skarn systems) and secondary deposits such as placers and laterites distributed along the coast and major morpho-structural units, with minerals such as monazite, allanite, and apatite reported in several locations [1]. More recent work has incorporated systematic exploration approaches including geochemical, mineralogical and tectono-structural analyses, allowing the identification of prospective zones (with emphasis in southern Peru), where medium-to-high potential has been associated with Niobium–Yttrium–Fluorine-type pegmatites and variable concentrations of light REEs [2]. However, despite these advances, REE exploration in Peru remains limited with minimal industry involvement, no comprehensive assessment of economic potential, and a largely undetermined national resource base [3]. Additionally, the available data remain highly fragmented across institutional and academic sources, significantly constraining their effective use for research, exploration, and investment.
In this context, the lack of a consolidated national database emerges as a critical gap. The integration, standardization, and open accessibility of geochemical and geological data on REEs are essential not only to improve the understanding of Peru’s resource potential but also to support strategic decision-making in a context of rapidly increasing global demand for critical minerals. Without a robust and centralized data platform, Peru faces structural limitations in its ability to position itself competitively in the global REE sector.
To address this gap, this study presents a novel, publicly available geochemical database comprising over 30 thousand individual records of REE concentrations across Peru. The dataset integrates information from two primary sources: First, although a significant proportion of the data compiled in this study originates from the Peruvian Institute of Geology, Mining, and Metallurgy (INGEMMET), its practical accessibility remains limited. While the information is technically public, it is not readily discoverable through standard search mechanisms and typically requires prior knowledge of its existence and formal institutional requests to obtain it. This creates a substantial barrier to its use by researchers, industry professionals, and policymakers, particularly at the international level. Furthermore, the data are predominantly available only in Spanish and often distributed across multiple unstandardized files corresponding to different campaigns and formats, which further restricts usability, interoperability, and analyses. In this context, the present work adds clear value by consolidating, standardizing, and translating these dispersed datasets into a single, structured, and English-language database, thereby significantly enhancing accessibility, transparency, and analytical usability. This transformation is essential for enabling broader scientific engagement and supporting evidence-based decision-making in the context of increasing global demand for REE. A second component of the data was mined from documents obtained from national and institutional repositories that contained information on REE concentrations. The identification of relevant academic documents was conducted using artificial intelligence-assisted keyword searches, followed by rigorous manual screening to ensure data relevance and quality.
All compiled data were standardized and organized based on sample origin. This classification framework enables consistent comparison across diverse geological and environmental contexts, enhancing the interpretability and analytical value of the dataset. By consolidating dispersed information into a unified structure, this work provides a high-resolution geochemical resource.
2. Data Description
The dataset presented in this effort is a comprehensive, standardized compilation of REE concentrations across Peru, consisting of 31,183 individual records. Each record corresponds to a georeferenced sample with associated geochemical information, representing the most extensive collection of REE data currently available for the country. The database integrates information from multiple sources and has been harmonized into a unified structure to ensure consistency and comparability.
The dataset is organized into six primary categories based on sample origin, following INGEMMET’s original criteria (for consistency): stream sediments, rocks and ores, surface soils, deep soils, tailings, and industrial minerals. This classification enables users to differentiate between primary geological contexts and secondary depositional environments. Each entry includes, where available, spatial coordinates (latitude and longitude), sample type, source reference, and concentrations of individual REE in parts per million (ppm).
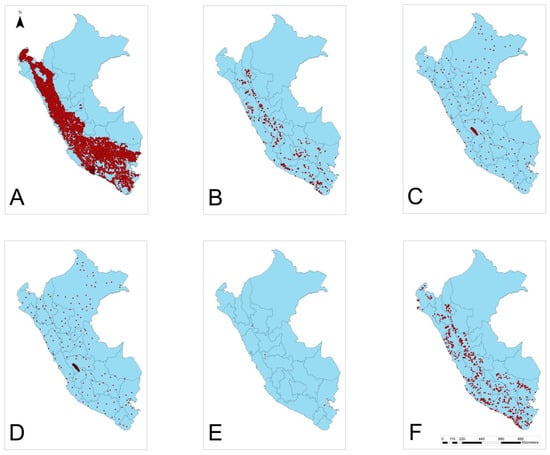
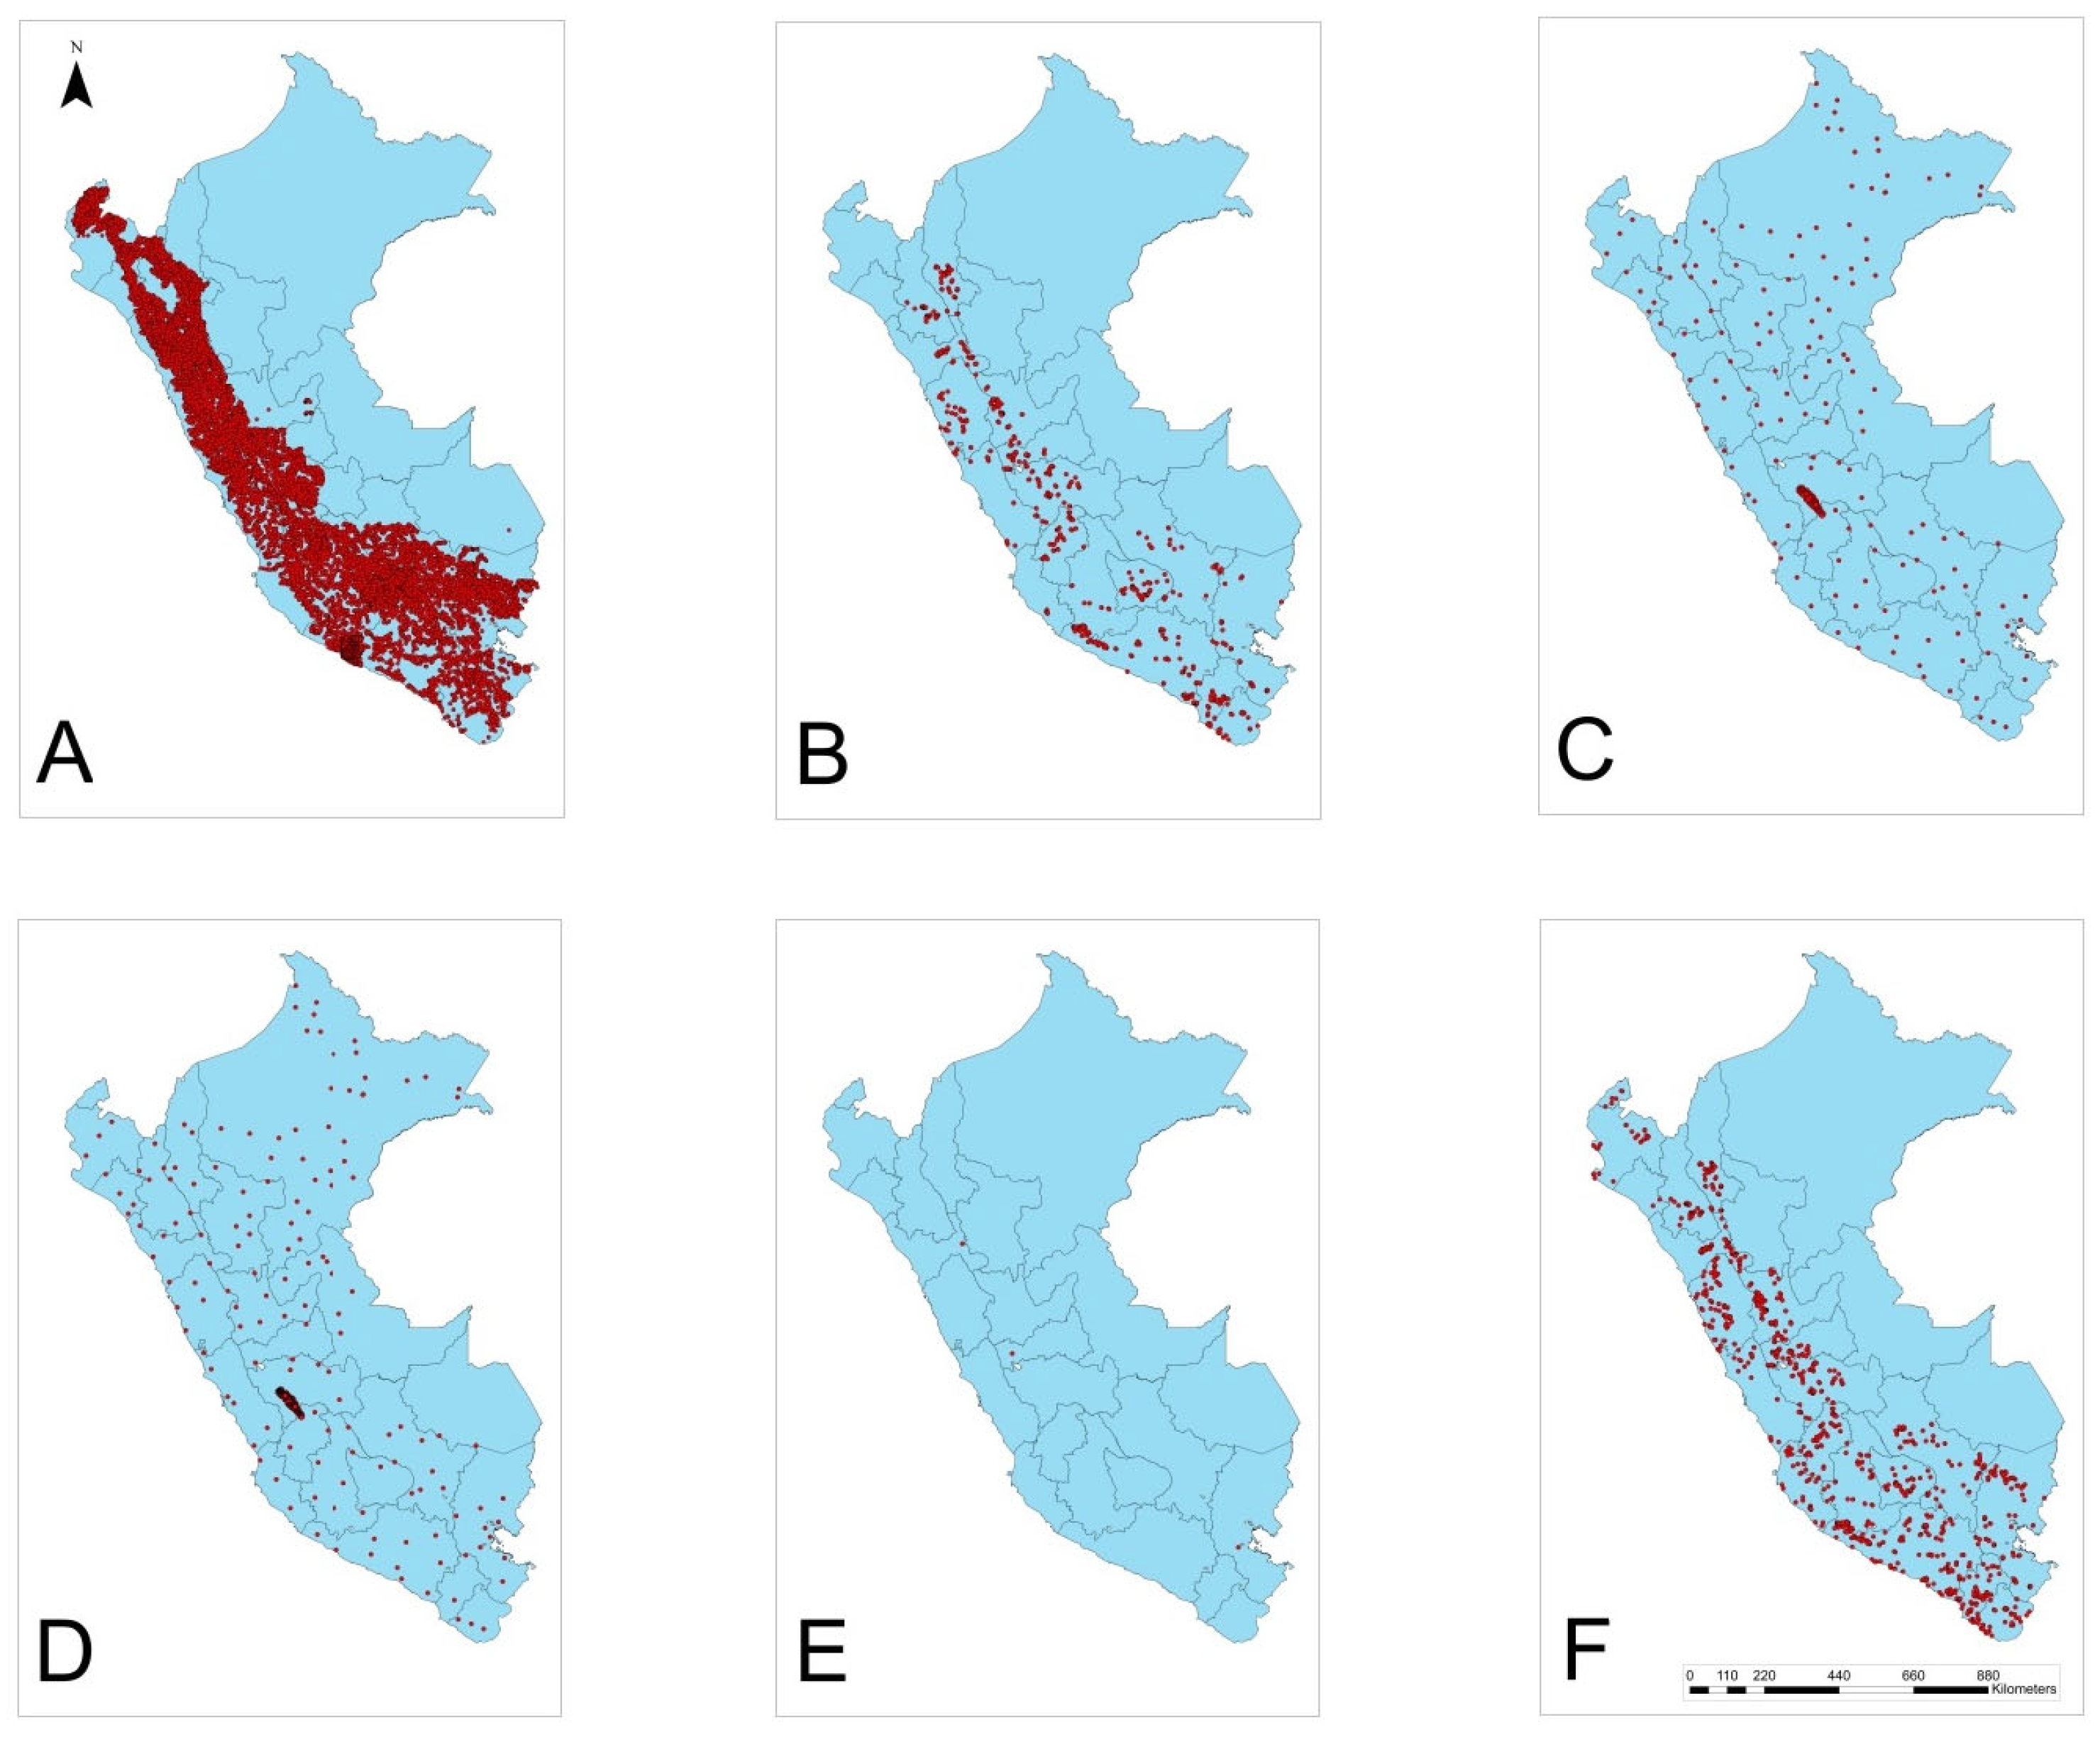
Figure 1 illustrates the spatial distribution of REE sampling locations across Peru, differentiated by source. Overall, sampling density is highly uneven among categories. Stream sediment samples show the broadest and most continuous coverage focused along the Andean corridor, indicating systematic regional surveys. In contrast, rocks and ores, as well as industrial mineral samples, are more spatially clustered, reflecting targeted exploration in mineralized zones. Soil samples (both surface and deep) display moderate and more scattered coverage, while tailings are sparsely distributed and concentrated in specific mining districts. Collectively, the maps highlight a strong bias toward the central and southern Andes, with comparatively limited data coverage in the Amazonian lowlands and northern regions.
Figure 1.
REE sampling locations (red dots) within Peru (blue area), according to source type: stream sediments (A), rocks and minerals (B), deep soils (C), surface soils (D), tailings (E), and industrial materials (F).
Moreover, a statistical breakdown of REE concentrations was conducted by sample source to improve data interpretability. Descriptive statistics (mean, median, and minimum values) were calculated for each sample category (Appendix A). The minimum values reported do not represent uniform detection limits, but rather the lowest values observed within each subset. This reflects the integration of data from multiple sampling campaigns, laboratories, and analytical methods, each with different detection limits. Some records include values near or below detection limits (e.g., negative or unreported), which were retained to preserve data integrity and traceability. Given this methodological heterogeneity, a single representative detection limit could not be defined. Therefore, minimum values should be interpreted as relative references within each sample category, not as strict analytical thresholds.
At the column level, the database is structured to support both geochemical interpretation and spatial analysis. In addition to REE concentrations (including individual elements such as La, Ce, Nd, Sm, and Eu, among others), each record contains key metadata fields, including: (i) administrative location (region, province, and district); (ii) year of sampling or publication; (iii) sample category and material type; (iv) data source classification (e.g., government, academic, or other); (v) analytical method used (when reported); and (vi) a reference field including, where available, a direct link or identifier to access the original document (in Spanish). Additional fields capture information on data provenance and contextual descriptors to ensure traceability and reproducibility.
To improve interoperability, all data were standardized in terms of units, nomenclature, and formatting. Element names were unified following international geochemical conventions, and inconsistent reporting formats across original sources were normalized. Where necessary, metadata fields were created to preserve information about data provenance, analytical methods, and sample context, allowing users to trace each record back to its original source while working within a consistent analytical framework.
The database is provided in a tabular, Excel-compatible format designed for immediate and user-friendly analytical use. Each row represents a single sample and contains both geochemical variables and associated metadata, enabling seamless filtering, sorting, and querying. The structure facilitates direct integration with statistical software, geographic information systems (ArcGIS Pro 3.5), and machine learning workflows. Its relational consistency and standardized schema allow users to perform multivariate analysis, spatial interpolation, geostatistical modeling, temporal and spatial distributions, and cross-referencing with external geological or geophysical datasets without additional preprocessing. By consolidating dispersed and heterogeneous information into a single, well-structured dataset, this resource significantly enhances the capacity for regional-scale analysis of REE distribution and supports applications in mineral exploration, environmental assessment, and strategic resource planning.
3. Methods
3.1. Data Acquisition
The dataset was compiled from two primary sources: (1) governmental geochemical records and (2) non-governmental academic and institutional documents, using the methodology developed by Venegas-Quiñones et al. [4]. The governmental dataset was obtained from INGEMMET’s geochemical information system. The information was first downloaded in multiple Excel files corresponding to different sampling campaigns and data sources. These files were reviewed, reorganized, and consolidated, resulting in a total of 31,125 records, which represent the majority of currently available REE geochemical information in Peru.
Additionally, national and institutional repositories were systematically explored, including the National Council of Science, Technology and Innovation (CONCYTEC), the Open Access to Scientific Information for Innovation Platform (ALICIA), INGEMMET repositories, and individual university digital repositories across the country. The primary search term was “rare earth”, complemented by targeted searches for each individual rare earth element (Sc, Y, La, Ce, Pr, Nd, Sm, Eu, Gd, Tb, Dy, Ho, Er, Tm, Yb, and Lu), using both chemical symbols and full names.
3.2. Document Screening and Data Extraction
The initial keyword search across the aforementioned repositories yielded approximately 50,000 documents. To efficiently process this high volume of unstructured data, an AI-assisted screening approach was implemented using a Large Language Model (ChatGPT-4). The AI was prompted to act as a professional exploration geologist to analyze the text, tables, and methodologies of these documents and identify extractable, quantitative geochemical data for REEs. Due to its length and complexity, the exact system prompt used for this extraction is provided in Appendix B.
To ensure reproducibility and mitigate AI hallucinations or false positives, a rigorous human-in-the-loop validation protocol was established. The AI served strictly as a preliminary filter. A team of trained students from Universidad Nacional de San Agustín (UNSA) conducted a systematic manual review of all documents and data points flagged by the AI as relevant. During this double-checking phase, any document incorrectly identified by the AI (e.g., qualitative mentions of REEs misinterpreted as quantitative data) was classified as a false positive and manually discarded. The final data extraction into the dataset was subsequently verified by the researchers, reducing the portfolio to 95 genuinely relevant documents. Of these, 20 documents contained robust quantitative REE concentration data, resulting in an additional 58 georeferenced records being added to the database.
3.3. Data Integration and Standardization
Both datasets were merged into a single master database in Excel format, available on the platform Zenodo [5]. Records were organized according to their source and classified based on sample type, as previously detailed. Data standardization procedures included harmonizing units (ppm), unifying element nomenclature, and structuring metadata fields to ensure consistency across all entries. Duplicate records were identified and removed, and inconsistencies in formatting were corrected. The final dataset was structured to facilitate interoperability with statistical and geospatial analysis tools, ensuring usability for a wide range of applications.
To ensure comparability among different analytical methods (e.g., ICP-MS and XRF), the analytical technique reported for each record was evaluated and a standardized criterion was applied for handling unquantified values across the dataset. Three data types were distinguished: (i) unreported values (“—”), treated as missing data; (ii) values below the detection limit (e.g., “<value”); and (iii) negative values, which reflect instrumental responses near or below detection limits. Given the heterogeneity of data sources and the lack of consistent detection limit information, values below detection limits and negative values were retained in their original form to preserve data integrity and traceability. Consequently, comparisons involving low concentrations should be interpreted with caution.
Finally, the authors acknowledge the use of ChatGPT-4 for the initial automated screening of unstructured repository documents, as previously detailed in the methodology. Additionally, ChatGPT was used to assist with translation, text formatting, and grammatical editing of the manuscript. The authors meticulously reviewed, validated, and take full responsibility for all AI-assisted data extraction and the final written content.
Author Contributions
Conceptualization, P.A.G.-C., H.L.V.-Q., G.S., C.C., E.H. and R.E.; methodology, S.T., P.A.G.-C. and H.L.V.-Q.; software, H.L.V.-Q. and S.T.; validation, O.W.G.V., Z.R.P.G. and J.T.C.; formal analysis, H.L.V.-Q. and S.T.; investigation, S.T., H.L.V.-Q., G.S., O.W.G.V., Z.R.P.G., J.T.C., M.G., G.M., R.Q., M.H., Y.C., E.Z. and M.N.; resources, G.S. and R.E.; data curation, S.T., H.L.V.-Q., G.S., O.W.G.V., Z.R.P.G., J.T.C., M.G., G.M., R.Q., M.H., Y.C., E.Z. and M.N.; writing—original draft preparation, P.A.G.-C.; writing—review and editing, S.T., H.L.V.-Q., G.S., M.G., G.M., R.Q., M.H., Y.C., E.Z., M.N., C.C., E.H. and R.E.; visualization, P.A.G.-C., G.S., C.C. and R.E.; supervision, P.A.G.-C., G.S., C.C., E.H. and R.E.; project administration, G.S., P.A.G.-C., C.C. and R.E.; funding acquisition, G.S. and R.E. All authors have read and agreed to the published version of the manuscript.
Funding
This research was funded by the Center for Mining Sustainability, Project 3.4 (“Investigation of the presence and viability of rare earth minerals in the south of Peru”, grant number 470265).
Institutional Review Board Statement
Not applicable.
Informed Consent Statement
Not applicable.
Data Availability Statement
The original data presented in the study are openly available at https://doi.org/10.5281/zenodo.19391036.
Acknowledgments
The authors thank INGEMMET for providing support and available REE information. Similarly, the authors appreciate the support of the Center for Mining Sustainability, a joint venture between Colorado School of Mines (USA) and Universidad Nacional de San Agustín (Peru), Grant #470265 (Project 3.4: “Investigation of the Presence and Viability of Rare Earth Minerals in the South of Peru”). Finally, the authors acknowledge the use of ChatGPT for identifying REE-related documents within repositories from government agencies and universities nationwide, as well as ensuring proper grammar and writing of the text.
Conflicts of Interest
The authors declare no conflicts of interest.
Abbreviation
The following abbreviation is used in this manuscript:
| REEs | Rare-earth elements |
Appendix A
Table A1.
General REE Statistics (Mean, Median, and Minimum Value) Obtained from Available Data in Peru.
Appendix B. AI Screening Prompt (In Spanish, as the Original Documentation Was Written in Such Language)
**Misión:** Eres un geólogo experto especializado en geoquímica de tierras raras (REE) y minerales críticos. Analiza el texto y extrae CADA punto de muestreo, fila de tabla, o análisis geoquímico que encuentres.
**REGLAS CRÍTICAS DE EXTRACCIÓN:**
- **Estructura de Respuesta:**
- -
- La respuesta DEBE ser un único y válido objeto JSON
- -
- El JSON debe ser una LISTA de diccionarios
- -
- Cada diccionario representa UNA muestra o análisis
- -
- Si no encuentras datos geoquímicos, devuelve una lista vacía []
- -
- NO incluyas texto, comentarios o markdown antes o después del JSON
- **=== NUEVAS REGLAS PARA FECHAS DE MEDICIÓN ===**
- -
- **Fecha_Medicion**: Busca fechas específicas de muestreo, colección o análisis
- *
- Formato preferido: “YYYY-MM-DD”
- *
- Si solo tienes año: “YYYY-01-01”
- *
- Si tienes mes y año: “YYYY-MM-01”
- *
- Si no hay información de fecha: “-”
- -
- **Justificacion_Fecha_Medicion**: Explica la fuente de la fecha
- *
- “Fecha específica”—cuando hay fecha exacta en el documento
- *
- “Año de publicación”—cuando usas el año del documento
- *
- “Año de proyecto”—cuando se menciona el año del proyecto/estudio
- *
- “Año de tesis”—cuando es una tesis y usas ese año
- *
- “Estimada por contexto”—cuando infiere por información contextual
- *
- “Sin información”—cuando no hay datos de fecha
- **Coordenadas y su Precisión—MEJORADO:**
- -
- **Coordenadas Explícitas** (cuando aparecen en el documento):
- *
- Si son UTM: llenar ‘Coordenada_Este_UTM’, ‘Coordenada_Norte_UTM’, ‘Zona_UTM’
- *
- Si son geográficas: llenar ‘Latitud_Decimal’, ‘Longitud_Decimal’
- *
- ‘Fuente_Coordenadas’: “Explícita”
- *
- ‘Precision_Coordenadas’: “Alta”
- -
- **Coordenadas Inferidas** (cuando NO aparecen pero se puede deducir la ubicación):
- *
- Basándote en la descripción de ubicación, proporciona coordenadas ESPECÍFICAS y DIFERENTES para cada muestra
- *
- Para muestras del mismo proyecto pero diferentes (M-1, M-2, etc.), asigna coordenadas ligeramente diferentes (variar por 50–200 metros)
- *
- ‘Fuente_Coordenadas’: “Inferida”
- *
- ‘Precision_Coordenadas’: “Media” si la ubicación es específica, “Baja” si es muy general
- **Extracción de Datos por Registro:**
- -
- **Metadatos:** Información como Autor, Año_Publicacion, Metodo_Analisis_Quimico puede ser la misma para varios registros de una tabla
- -
- **Datos Numéricos:** Extrae SOLO el valor numérico para campos _concentracion. Las unidades van en campos _unidad
- -
- **Valores No Encontrados:** Si un dato no se encuentra, usa “-”
- -
- **Nombre de Archivo:** Para “Nombre_del_archivo” usa siempre “{filename}”
- **Campos Específicos Importantes:**
- -
- **ID_Muestra:** Extrae códigos como “M-1”, “Sample-A”, “RC-001”, etc.
- -
- **Metodo_Analisis_Quimico:** Busca “ICP-MS”, “XRF”, “AAS”, “Fire Assay”, “INAA”, etc.
- -
- **Tipo_Yacimiento:** “Pórfido Cu-Au”, “Skarn”, “IOCG”, “Pegmatita”, “Placer”, etc.
- -
- **Departamento:** Si está en Perú, identifica el departamento (Arequipa, Cusco, etc.)
- **Elementos de Tierras Raras (REE):**
- -
- **LREE (Ligeras):** La, Ce, Pr, Nd, Sm, Eu
- -
- **HREE (Pesadas):** Gd, Tb, Dy, Ho, Er, Tm, Yb, Lu
- -
- **Elementos relacionados:** Y, Sc, Th, U
- -
- **Unidades comunes:** ppm, ppb, %, g/t, mg/kg
- **Óxidos Mayores:**
- -
- SiO2, Al2O3, Fe2O3, MgO, CaO, Na2O, K2O, TiO2, P2O5, MnO
- -
- **Unidades comunes:** %, wt%
- **Minerales Críticos:**
- -
- Te, As, Sb, Ga, In, Co, Pt, Pd, Ir, Bi, Mo, Ag, W, Cd, Ge, Ni, Zn, Cu, Pb, Au
- -
- **Unidades comunes:** ppm, ppb, g/t, %
- **Aspectos Socioeconómicos:**
- -
- Para campos “Menciona_*”, responde “Sí” si el texto discute el tema, “No” si no
- -
- **Temas:** empleo local, ingresos regionales, conflictos socioambientales, ordenamiento territorial, riesgo de desastres, impacto ambiental
**Esquema JSON de salida (usar exactamente estas claves):**
{json.dumps(self.COLUMNS)}
**EJEMPLOS DE MANEJO DE FECHAS:**
- -
- Si encuentras “muestras colectadas en julio de 2019”: Fecha_Medicion=“2019-07-01”, Justificacion_Fecha_Medicion=“Fecha específica”
- -
- Si solo dice “Proyecto realizado en 2020”: Fecha_Medicion=“2020-01-01”, Justificacion_Fecha_Medicion=“Año de proyecto”
- -
- Si es una tesis de 2018 sin fecha específica: Fecha_Medicion=“2018-01-01”, Justificacion_Fecha_Medicion=“Año de tesis”
- -
- Si no hay información temporal: Fecha_Medicion=“-”, Justificacion_Fecha_Medicion=“Sin información”
**IMPORTANTE:**
- -
- Si encuentras tablas con múltiples muestras, crea UN registro por cada fila de muestra
- -
- Para datos ausentes, usa “-” (no null ni vacío)
- -
- Para muestras diferentes del mismo proyecto, asigna coordenadas inferidas DIFERENTES (no uses las mismas coordenadas para M-1, M-2, M-3, etc.)
- -
- Si hay varios métodos analíticos en una tabla, especifica el método para cada elemento si es posible
- -
- Presta especial atención a tablas de análisis químicos, listados de muestras, y resultados de laboratorio
- -
- **CRÍTICO:** Busca activamente información de fechas en el texto, es muy importante para la trazabilidad
**Texto del Documento:**
References
- Bohórquez, J.; Jara, R.; Mamani, Y.; Guerrero, L.; Villafranca, A. Ocurrencias de Tierras Raras en el Perú. Bol. Soc. Geol. Perú 2013, 107, 146–150. [Google Scholar]
- Torre Antay, J.S.; Fuentes Palomino, J.; Carpio Ronquillo, M. Nuevos Hallazgos en la Prospección por Tierras Raras en el Perú. Conferencia Perumin 37, Arequipa (Perú). 22–26 September 2025; Available online: https://perumin.com/perumin37/public/uploads/shares/programas-doc/foro-tis/totems/Geol_y_Exploraciones/TT-228%20Geología.pdf (accessed on 3 March 2026).
- Rios Carranza, A.M. Exploración por Tierras Raras en el Perú. Bol. Soc. Geol. Perú 2014, 109, 145–149. [Google Scholar]
- Venegas-Quiñones, H.L.; Garcia-Chevesich, P.A.; Guillen, M.; Alejo, F.; McCray, J.E. Addressing the Problem of Hard-to-Reach Unpublished Data from Theses in University Repositories. Groundwater 2025, 63, 922–925. [Google Scholar] [CrossRef] [Scilit] [PubMed]
- Ticona, S.; Garcia-Chevesich, P.; Venegas-Quiñones, H.L.; Salas, G.; Gómez Villagra, O.W.; Pachari Gutierrez, Z.R.; Trujillo Choque, J.; Guillen, M.; Martínez, G.; Quispe, R.; et al. Rare earth database for Peru [Data set]. Zenodo 2026. [Google Scholar] [CrossRef]
Disclaimer/Publisher’s Note: The statements, opinions and data contained in all publications are solely those of the individual author(s) and contributor(s) and not of MDPI and/or the editor(s). MDPI and/or the editor(s) disclaim responsibility for any injury to people or property resulting from any ideas, methods, instructions or products referred to in the content. |
© 2026 by the authors. Licensee MDPI, Basel, Switzerland. This article is an open access article distributed under the terms and conditions of the Creative Commons Attribution (CC BY) license.