Data Descriptor

A Dataset: Experimental Analysis of Outdoor Exposed Four-Year-Old Photovoltaic Modules in Dhaka, Bangladesh

by
Md. Sabbir Alam
1,
Ahmed Al Mansur
2,*,
Shahariar Ahmed Himo
2,
Md. Imamul Islam
1,
Khawza Iftekhar Uddin Ahmed
3 and
Md. Fayyaz Khan
4
1
Research Graduate School, Bangladesh University of Business and Technology, Dhaka 1216, Bangladesh
2
Department of Electrical and Electronic Engineering, Bangladesh University of Business and Technology, Dhaka 1216, Bangladesh
3
Department of Electrical and Electronic Engineering, Green University of Bangladesh, Narayanganj 1461, Bangladesh
4
Department of Electrical and Electronic Engineering, United International University, Dhaka 1212, Bangladesh
*
Author to whom correspondence should be addressed.
Data 2026, 11(5), 118; https://doi.org/10.3390/data11050118
Submission received: 18 March 2026 / Revised: 20 April 2026 / Accepted: 6 May 2026 / Published: 14 May 2026

Abstract

The long-term performance of photovoltaic (PV) modules significantly affects the reliability and economic viability of solar energy systems, as various environmental and operational factors can gradually degrade module efficiency and reduce energy output. This study investigates the long-term performance degradation analysis of 40 outdoor photovoltaic (PV) modules exposed for four years on a five-level building in Mirpur, Dhaka, Bangladesh. Electrical parameters, including voltage, current, power, and fill factor, were measured using a PROVA 1011 PV analyzer under IEC60904-1 standard test conditions, and analyzed to evaluate the extent of long-term degradation of PV modules. The image-based analysis identified degradation factors such as dust accumulation, soiling, hotspots, discoloration, micro-cracks, delamination, and corrosion. All test data were normalized to standard conditions (1000 W/m2, 25 °C) for consistency. The measured average maximum power output was 9.85 W, with an average fill factor of 0.713 and a standard deviation of 0.939 for the 40 photovoltaic modules with a rated capacity of 10 W each. The dataset provides valuable insights for researchers and industry professionals to assess long-term PV performance, optimize maintenance strategies, and support solar energy deployment in tropical environments. Additionally, it can aid policymakers in developing regulatory frameworks for improving solar infrastructure resilience.
Dataset License: CC0 1.0

1. Summary

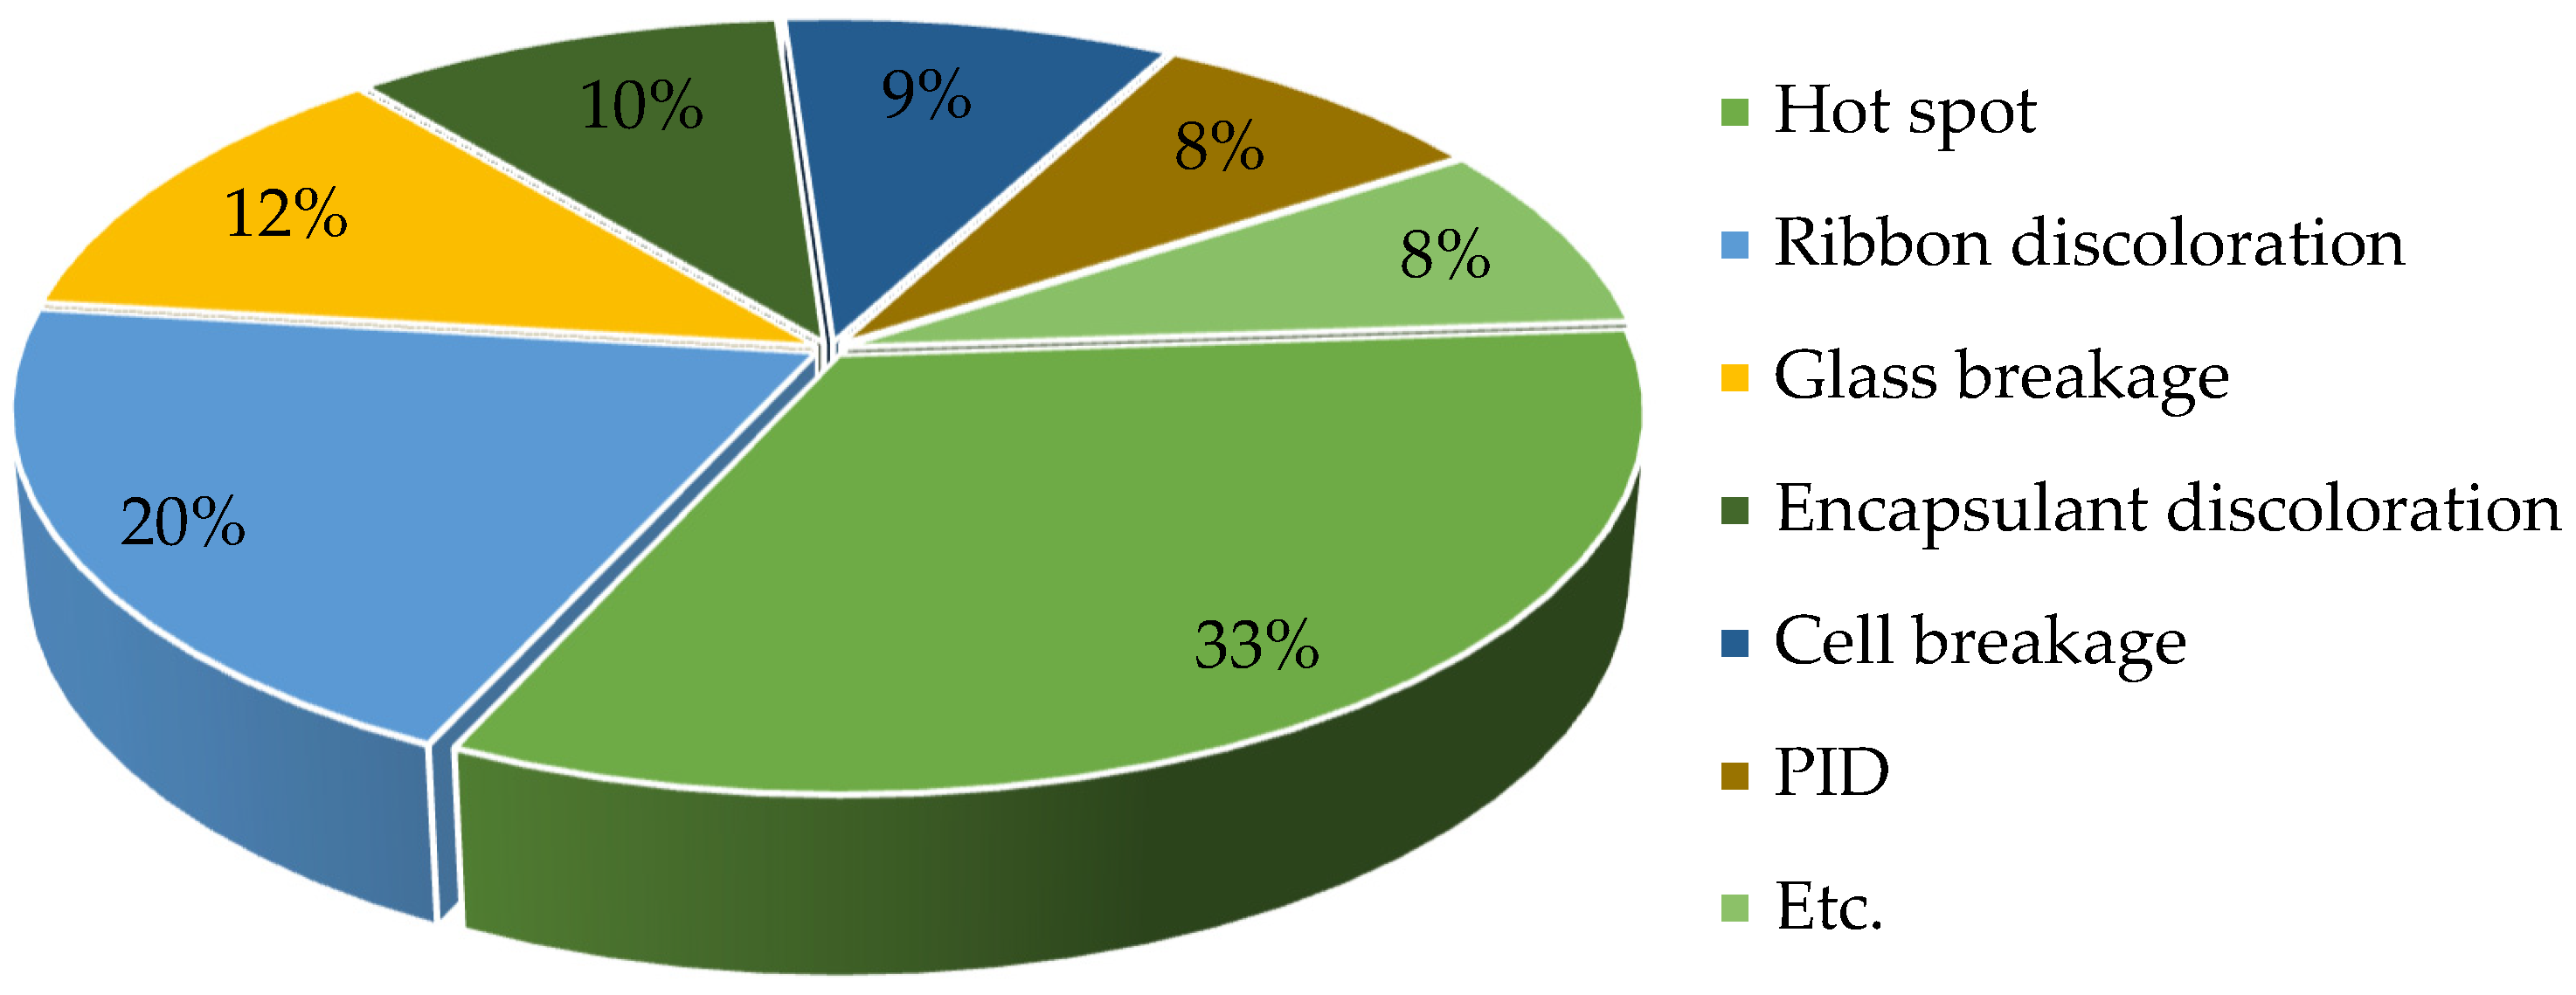
Solar energy, one of the most important forms of renewable energy, has gained significant attention worldwide due to its environmental benefits and the growing need for sustainable energy sources [1]. However, the degradation of solar module output power is a significant problem that affects the long-term viability and economic efficiency of solar energy systems [2]. Several factors, including natural substance deterioration, temperature variations, and dust and grime formation on the module surface, cause the degradation [3]. There is also the aging and degradation of solar PV modules, analyzing factors such as temperature, humidity, dust, discoloration, cracks, and delamination, their impacts on lifetime, efficiency, material deterioration, overheating, and mismatch [4]. Figure 1 shows the degradation factors of silicon PV modules for the last 10 years. A field study of 22 monocrystalline silicon PV modules installed in northern Ghana for 16 years showed a maximum power (Pmax) degradation of 18.2–38.8%, corresponding to an annual degradation rate of 1.54%, mainly due to encapsulant discoloration and junction box adhesive degradation [5]. Another study was an aging assessment of five photovoltaic (PV) systems in desert conditions, which identified degradation modes such as snail trails, delamination, discoloration, hot spots, potential-induced degradation (PID), and micro-cracks through visual inspection, infrared imaging, electroluminescence analysis, and I–V measurements, revealing high degradation rates of up to 2.7% per year [6].
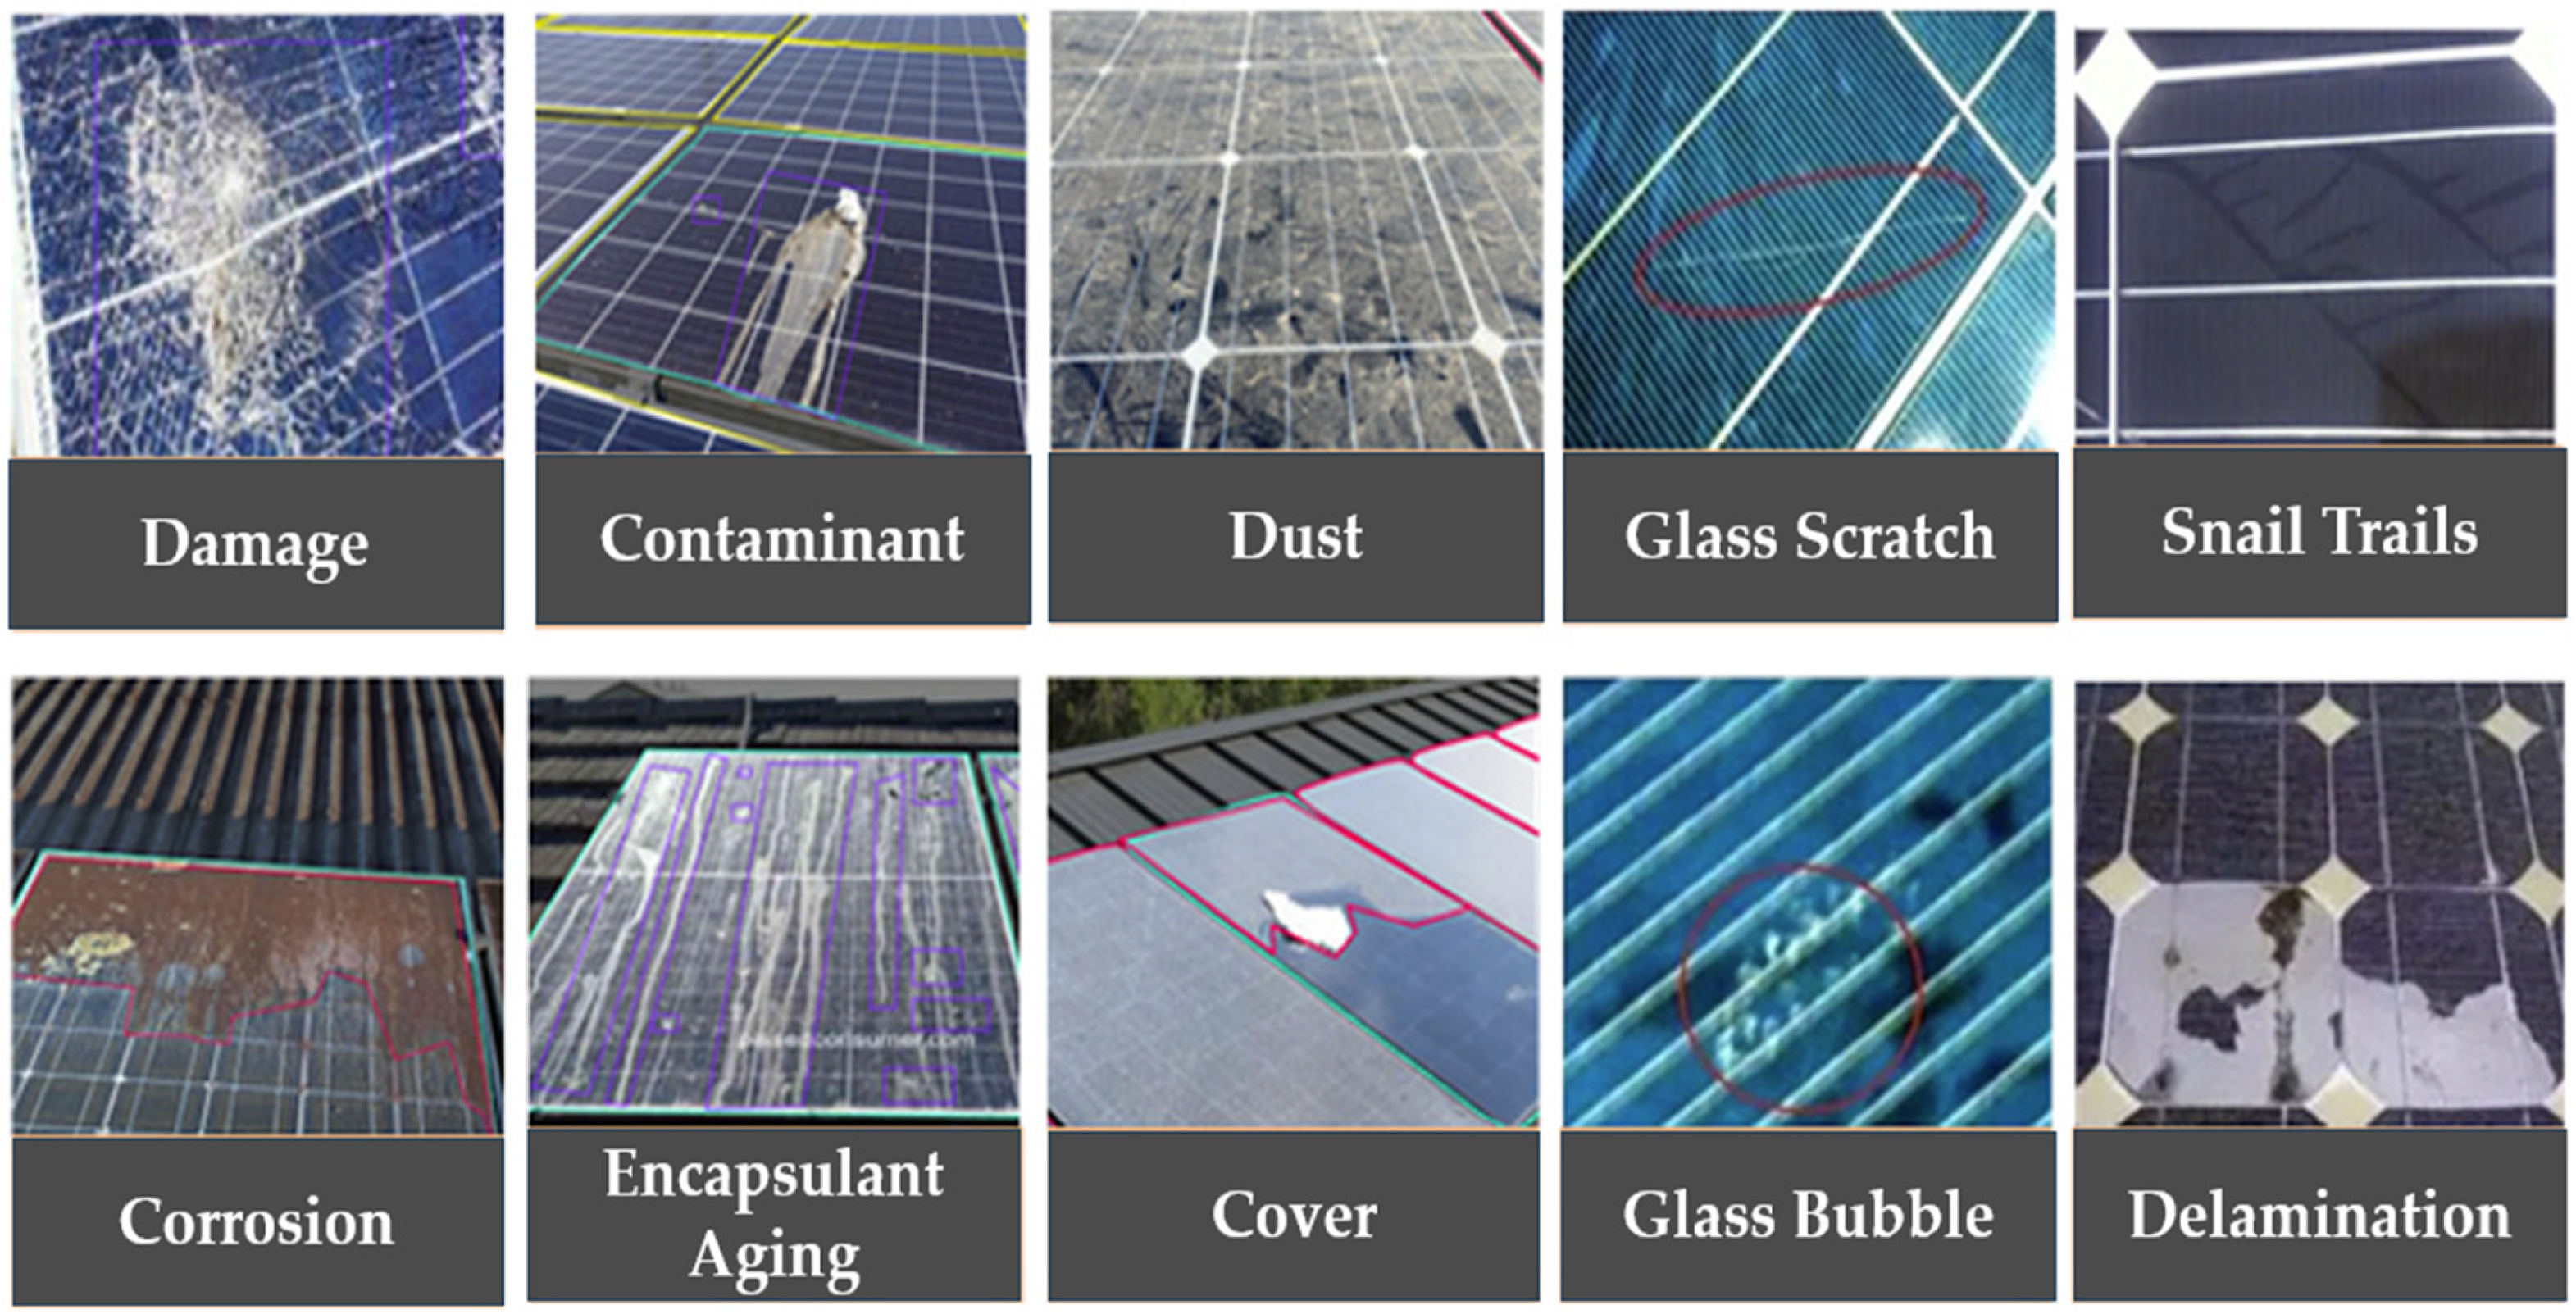
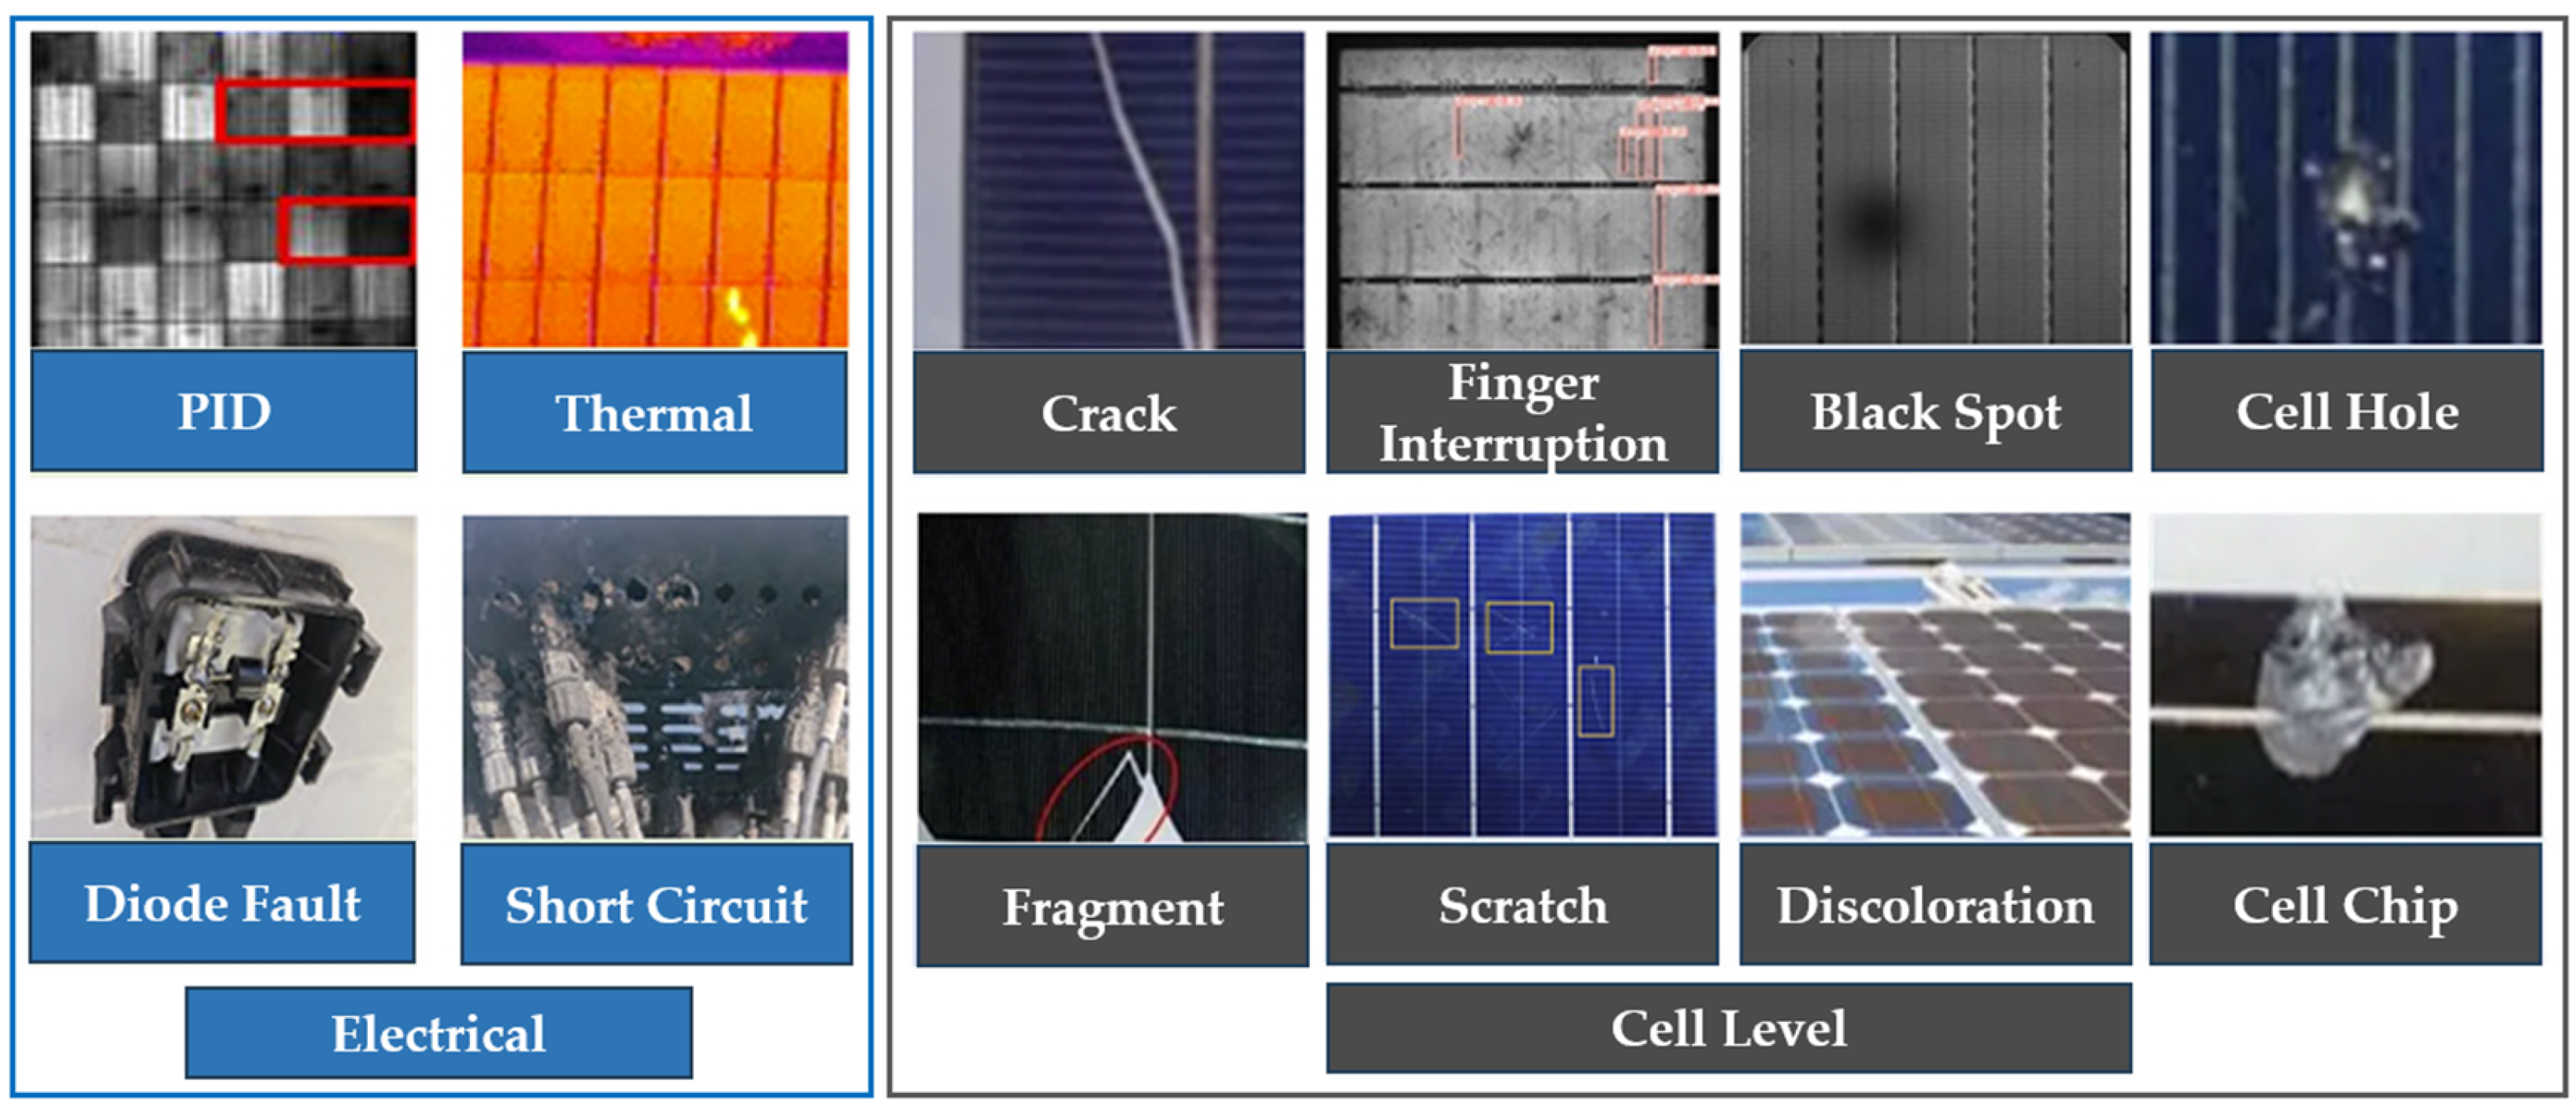
Özkalay et al. investigate the temperature impact of building-integrated photovoltaic (BIPV) modules, which accelerate the degradation of polymer components such as encapsulants and back sheets, leading to current and fill factor losses due to discoloration, damaged cells, and interconnect failures [8]. A field study of 56 monocrystalline silicon PV modules exposed for 22 years reported a mean peak power degradation of 30.9% and approximately 1.4% per year [9]. Rahman et al. conducted an experimental study on 8-year-old 30 W and 10-year-old 40 W photovoltaic (PV) modules and found that aging factors such as dust accumulation, discoloration, delamination, and cracks significantly influence degradation [10]. A field study of three PV modules operating for more than 20 years showed noticeable power degradation under continuous outdoor exposure, with reductions in peak power attributed to defects such as discoloration, junction damage, humidity ingress into the junction box, encapsulant delamination, and hot spots [11]. In the study, the aging of a 1.4 kW grid-connected photovoltaic system in Sohar, Oman, over seven years caused the system efficiency to decrease by 6.3% and the production rate to 5.88%, while the mean daily array capture loss and system loss were 6.95% and 6.13%, respectively [12]. Another study identified environmental visual defects, including delamination, encapsulant discoloration, metallization corrosion/discoloration, cell cracks, broken glass, antireflection coating deterioration, snail trails, junction box failures, and soiling, and conducted electrical performance tests to correlate these defects [13]. This study investigated six-cell PV test modules with induced failures such as micro-cracks, cell cracks, glass breakage, and connection defects, natural aging in climate chambers, and outdoor sites. The results showed that mechanical failures had minimal impact on performance, but numerous micro-cracks accelerated degradation, while polymeric encapsulants developed detectable fluorescence after 1 year outdoors [14]. Figure 2 and Figure 3 show a common visual defect in PV modules.
Another study critically reviews recent studies on solar PV performance, reliability, and degradation, highlighting how environmental stress, manufacturing defects, and aging affect modules. A visual inspection found in a different study was glass cracks, discoloration, and corrosion, many defects that reduce the efficiency of a PV module, such as micro-cracks [16]. Bansal et al. present a seven-year performance analysis of a 5 MW grid-connected crystalline silicon PV plant in Gujarat, India, observing major degradation modes including hot spots, junction box melting, encapsulant discoloration, snail trails, and corrosion from moisture [17]. The research is motivated by the need to solve these issues by identifying the environmental conditions that cause power loss in solar modules and investigating practical solutions that reduce their effects. This dataset originated from the need to understand the long-term performance degradation of photovoltaic (PV) modules in real-world outdoor conditions, more specifically in tropical climates such as Bangladesh. The dataset contains power, current, and voltage measurements from modules normalized to maintain the standard test condition (STC) for comparability. In addition, an image-based analysis was conducted to identify degradation factors visually after a certain period. This dataset was produced to provide data support for understanding PV module degradation processes, guidance for maintenance procedures, sustainability assessments, and policy choices for implementing solar energy and constructing infrastructure.

2. Value of the Data and Data Specification Table

The value of the experimental data of the four-year-old PV modules in this paper can be briefly described as follows:
  • The dataset includes key electrical parameters of PV modules that are four years old, such as short-circuit current, open-circuit voltage, maximum power point voltage, and maximum power point power after four years of outdoor exposure, offering practical insight into long-term field operation.
  • This dataset is valuable for calculating the performance degradation rate of photovoltaic modules over time in the residential area of Dhaka, Bangladesh.
  • The data can serve as a benchmark dataset for comparing the field performance of small-scale PV modules under similar environmental and operational conditions.
  • Analyzing this data can aid in developing proactive maintenance strategies for photovoltaic systems, thereby enhancing their lifespan and performance.
  • The data are particularly useful for developing and validating data-driven models, including machine learning and AI-based approaches for degradation prediction and fault detection in PV systems.
  • Industry stakeholders and policymakers can utilize this dataset to guide decisions related to infrastructure investments, solar energy deployment, and regulatory frameworks, contributing to the advancement of sustainable energy.
The specifications of the experimental data are shown in Table 1.

3. Method Details

3.1. Experimental Investigation Site

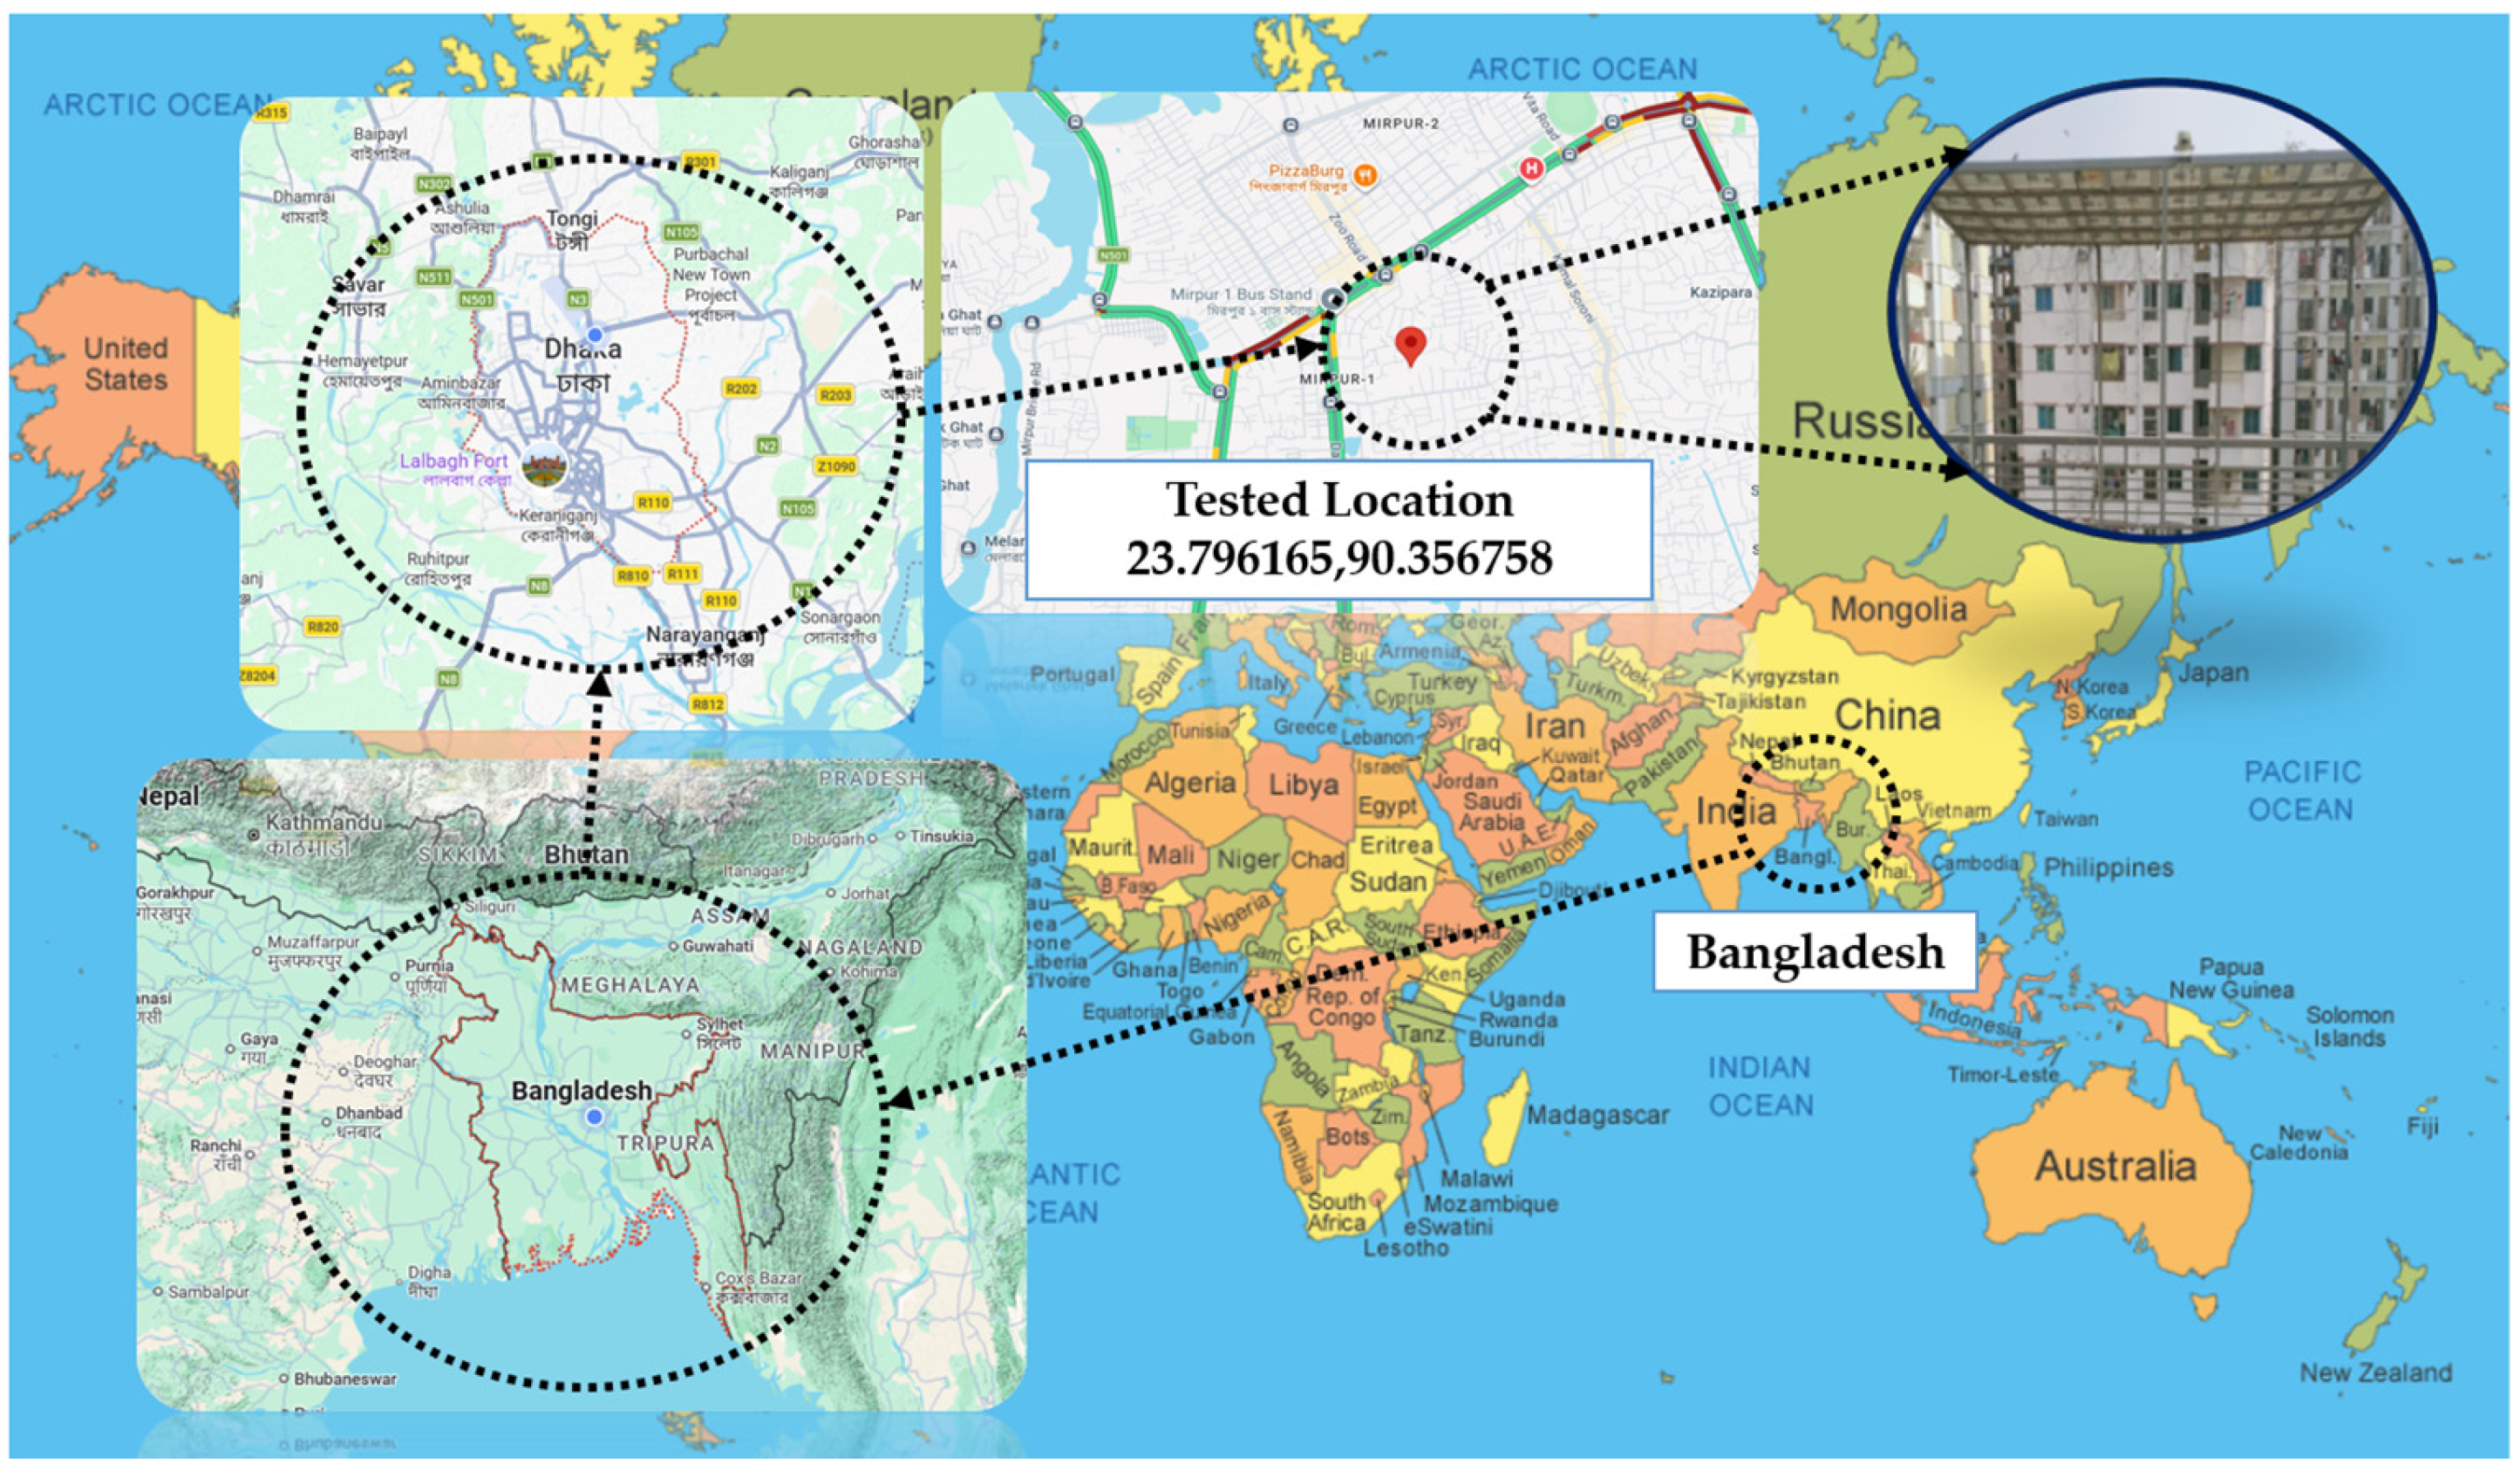
The experimental testing of the photovoltaic modules was conducted in Mirpur, Dhaka, the capital city of Bangladesh. The geographical coordinates of the test site are 23.796165° N latitude and 90.356758° E longitude. This location represents a typical urban environment with a tropical monsoon climate characterized by high solar irradiance, elevated temperature, high humidity, and seasonal rainfall. The tested location is shown in Figure 4. These environmental conditions make the site suitable for evaluating the real operating performance and degradation characteristics of photovoltaic (PV) modules under practical field conditions.

3.2. Specification of the Testing Meter and Tested PV Panels

Table 2 presents the specifications of the tested PV modules and the commercially available I–V tracer modeled PROVA 1011 (PROVA INSTRUMENTS Inc., Taipei, Taiwan).

3.3. Experimental Methods

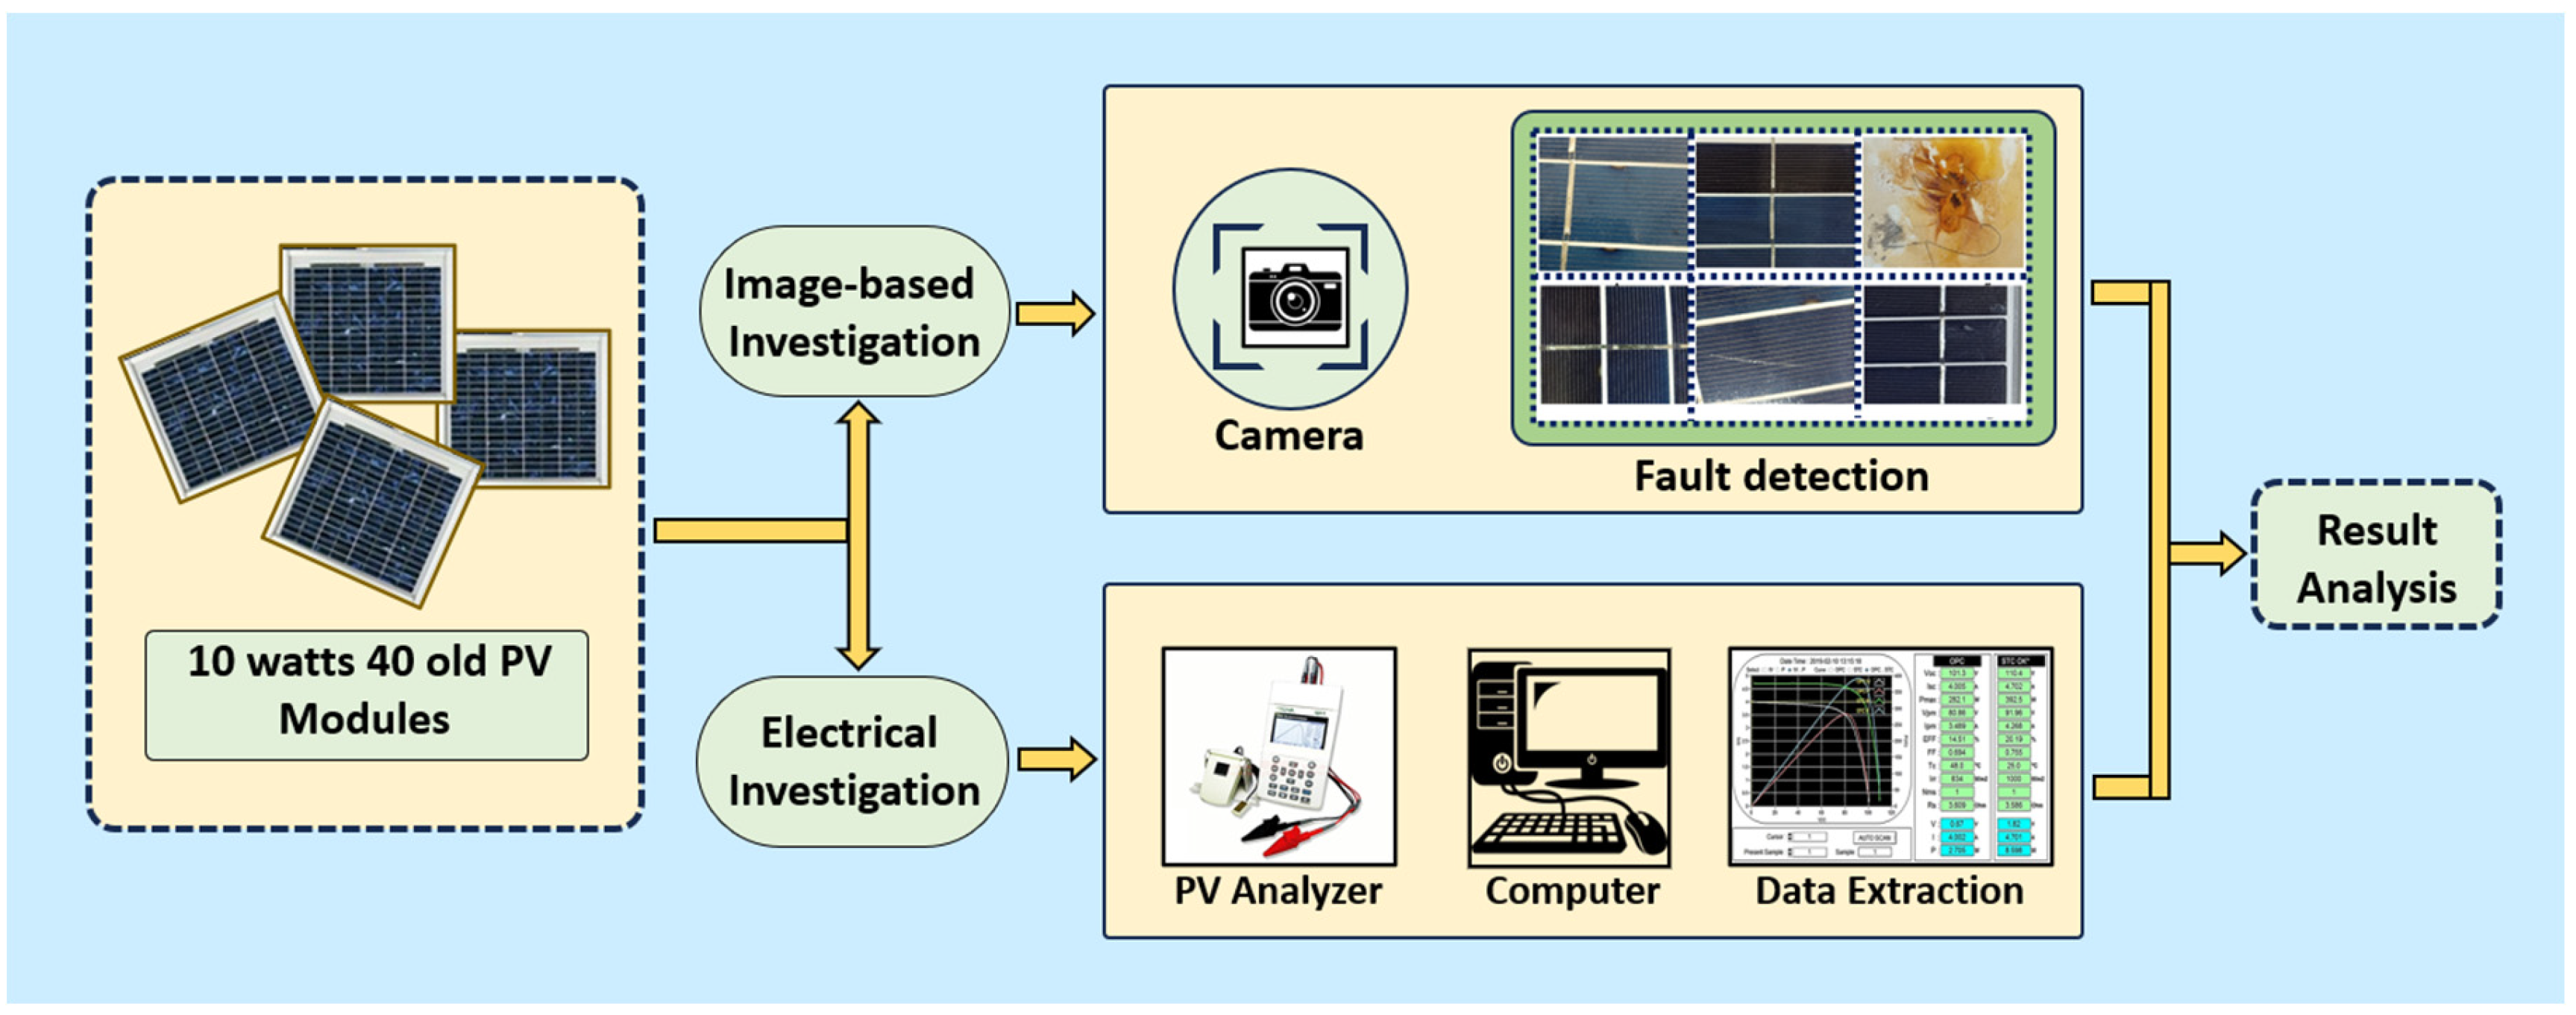
The four-year-old 40 solar panels were collected from an off-grid PV array arrangement on a building rooftop. Each module has a power rating of 10 W at new conditions. The full specification of the 10 W PV module is shown in Table 2, which includes open-circuit voltage, short-circuit current, maximum power output with tolerance, voltage at the maximum power point, current at the maximum power point, nominal operating voltage, and maximum system voltage. This experimental study was conducted in two processes: image-based and electrical investigations. In the absence of installation-time baseline measurements, the degradation assessment in this study is conducted relative to the manufacturer-specified Standard Test Condition (STC) parameters. The presented dataset, therefore, represents the PV module performance after four years of outdoor exposure, rather than a time-series degradation analysis. Figure 5 illustrates the graphical methods used in the investigation process.

3.3.1. Image-Based Investigation

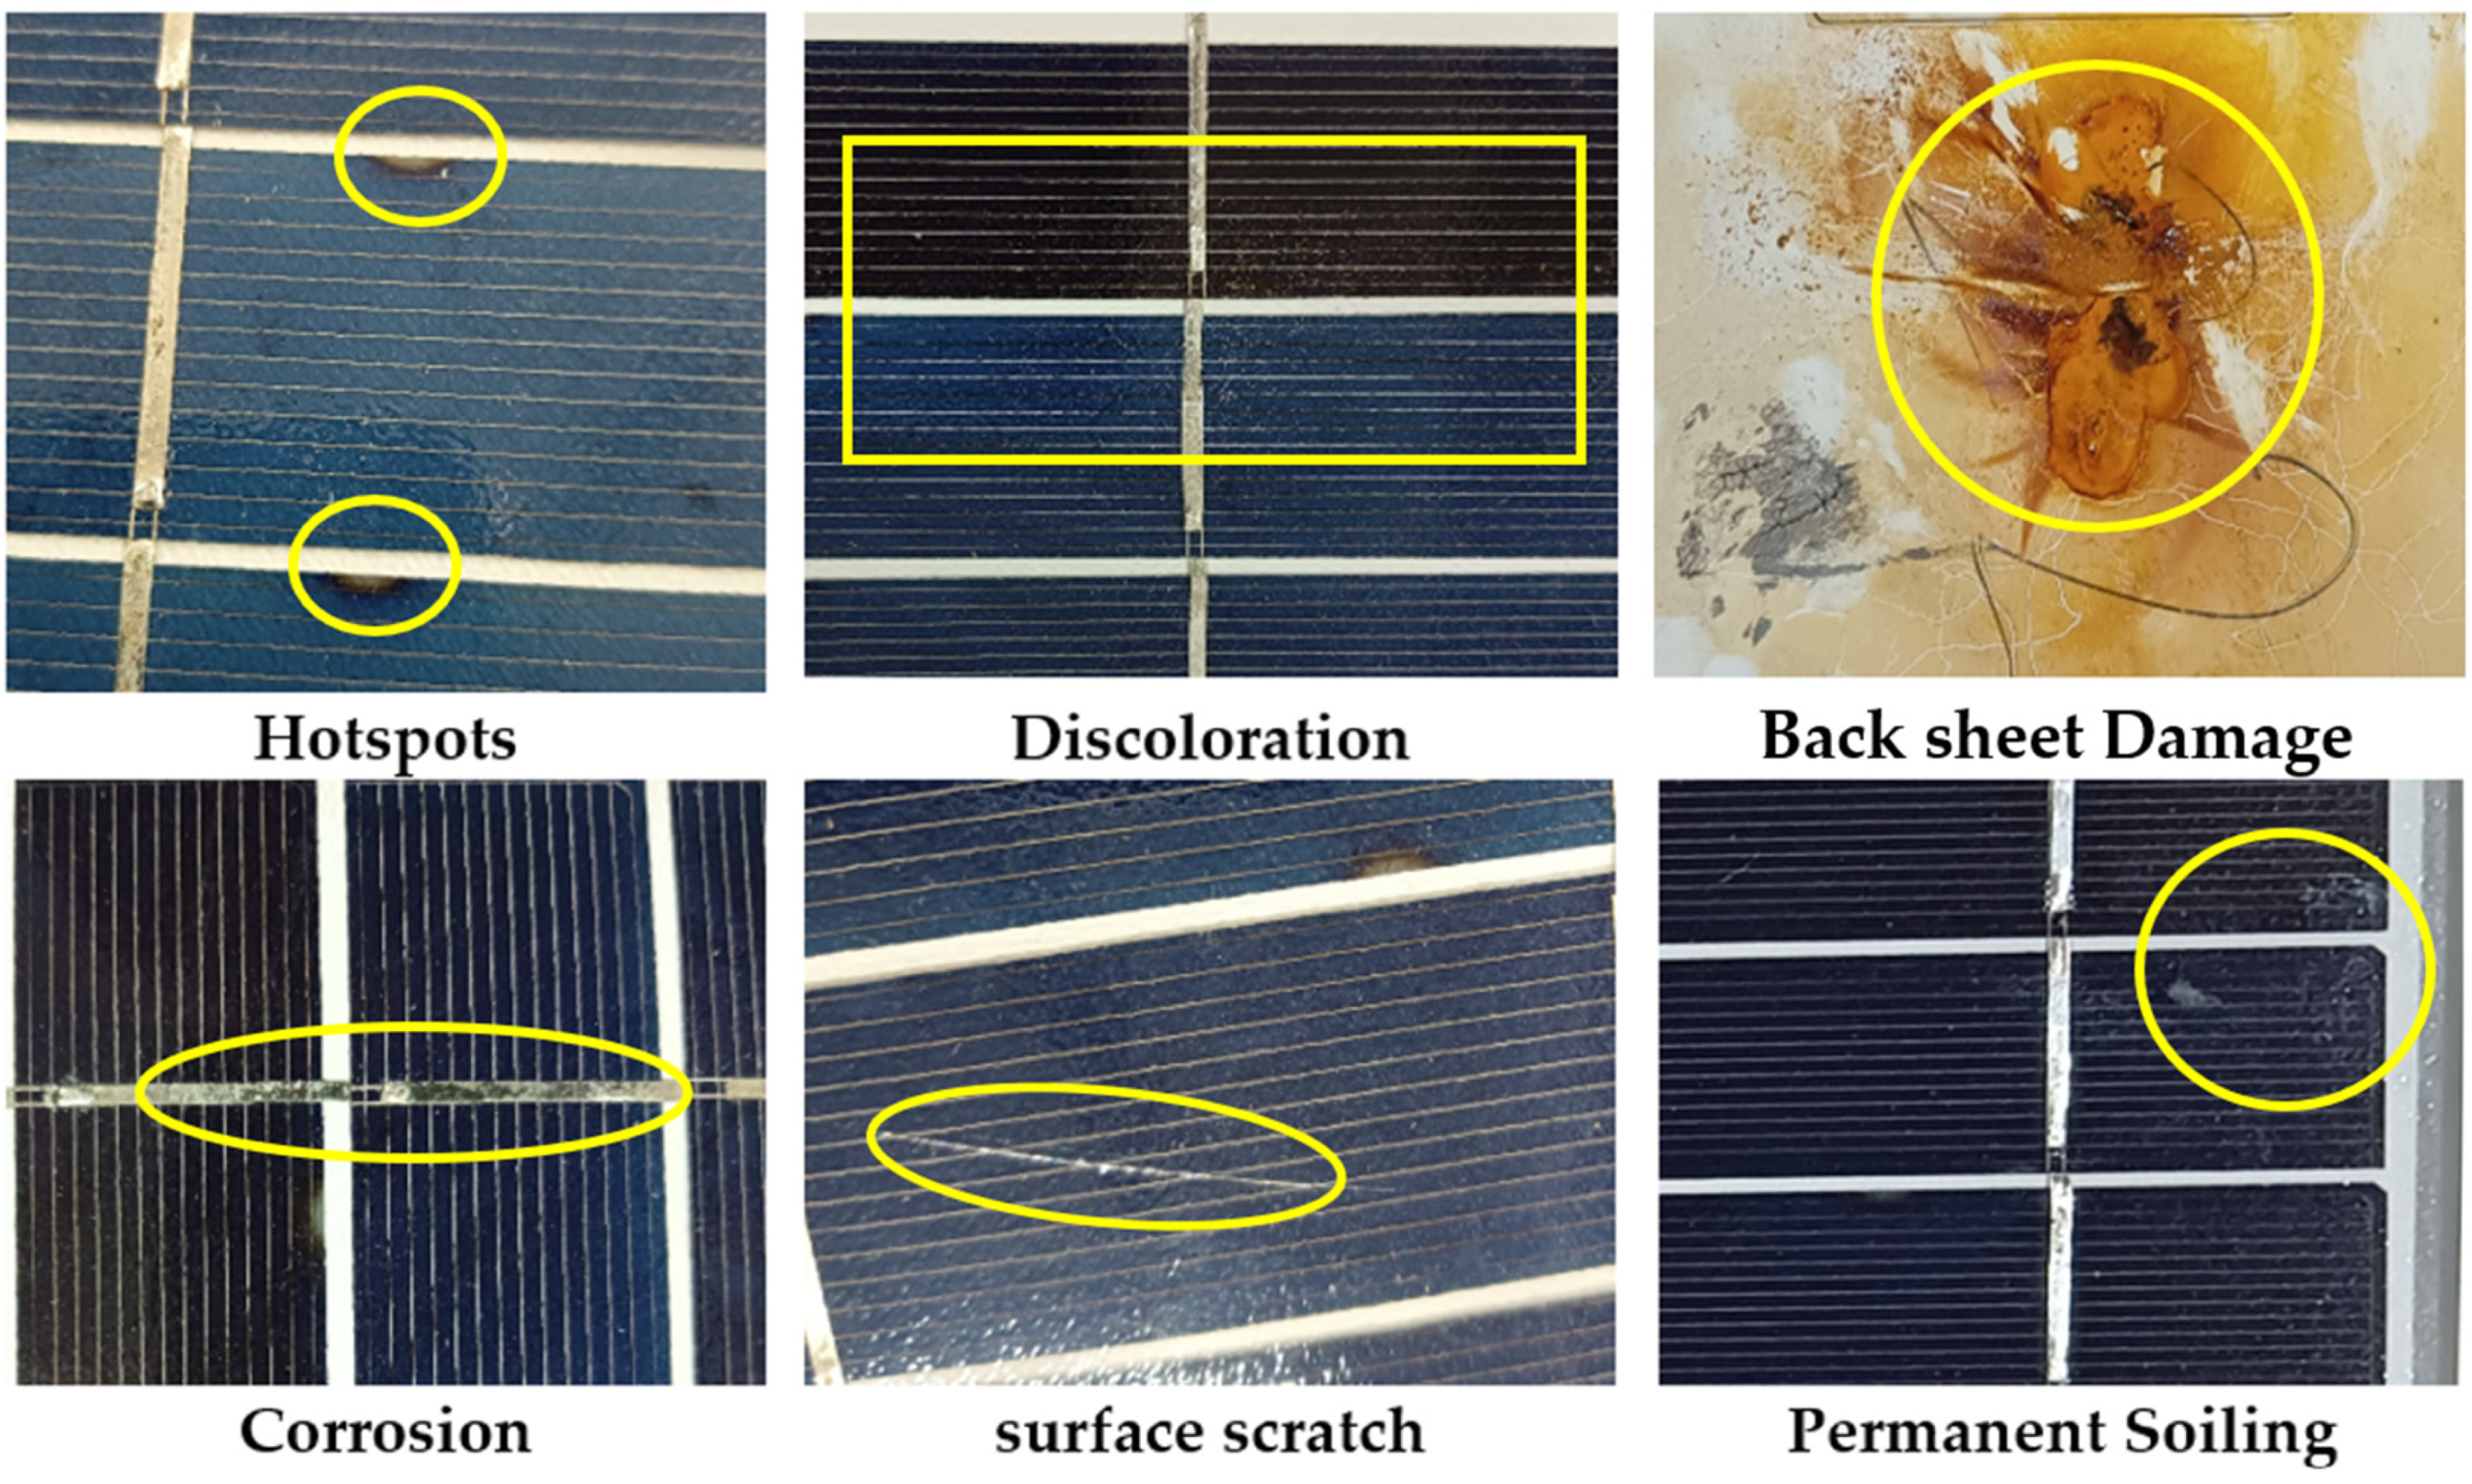
After collecting the four-year-old PV panels from the rooftop array, they were cleaned with water on the rooftop of a building in Mirpur, Dhaka. After that, the faults of the PV modules were identified by visual inspection, as shown in Figure 5. The visual faults of all panels were identified individually, and they shared minor hotspots and discoloration. Some minor faults are present on both the top and bottom sides of the panels: discoloration, hotspots, corrosion, back sheet damage, surface scratches, and permanent soiling. The detected fault on the module surface is shown in Section 4.1 captured by a high-resolution phone camera.

3.3.2. Electrical Investigation

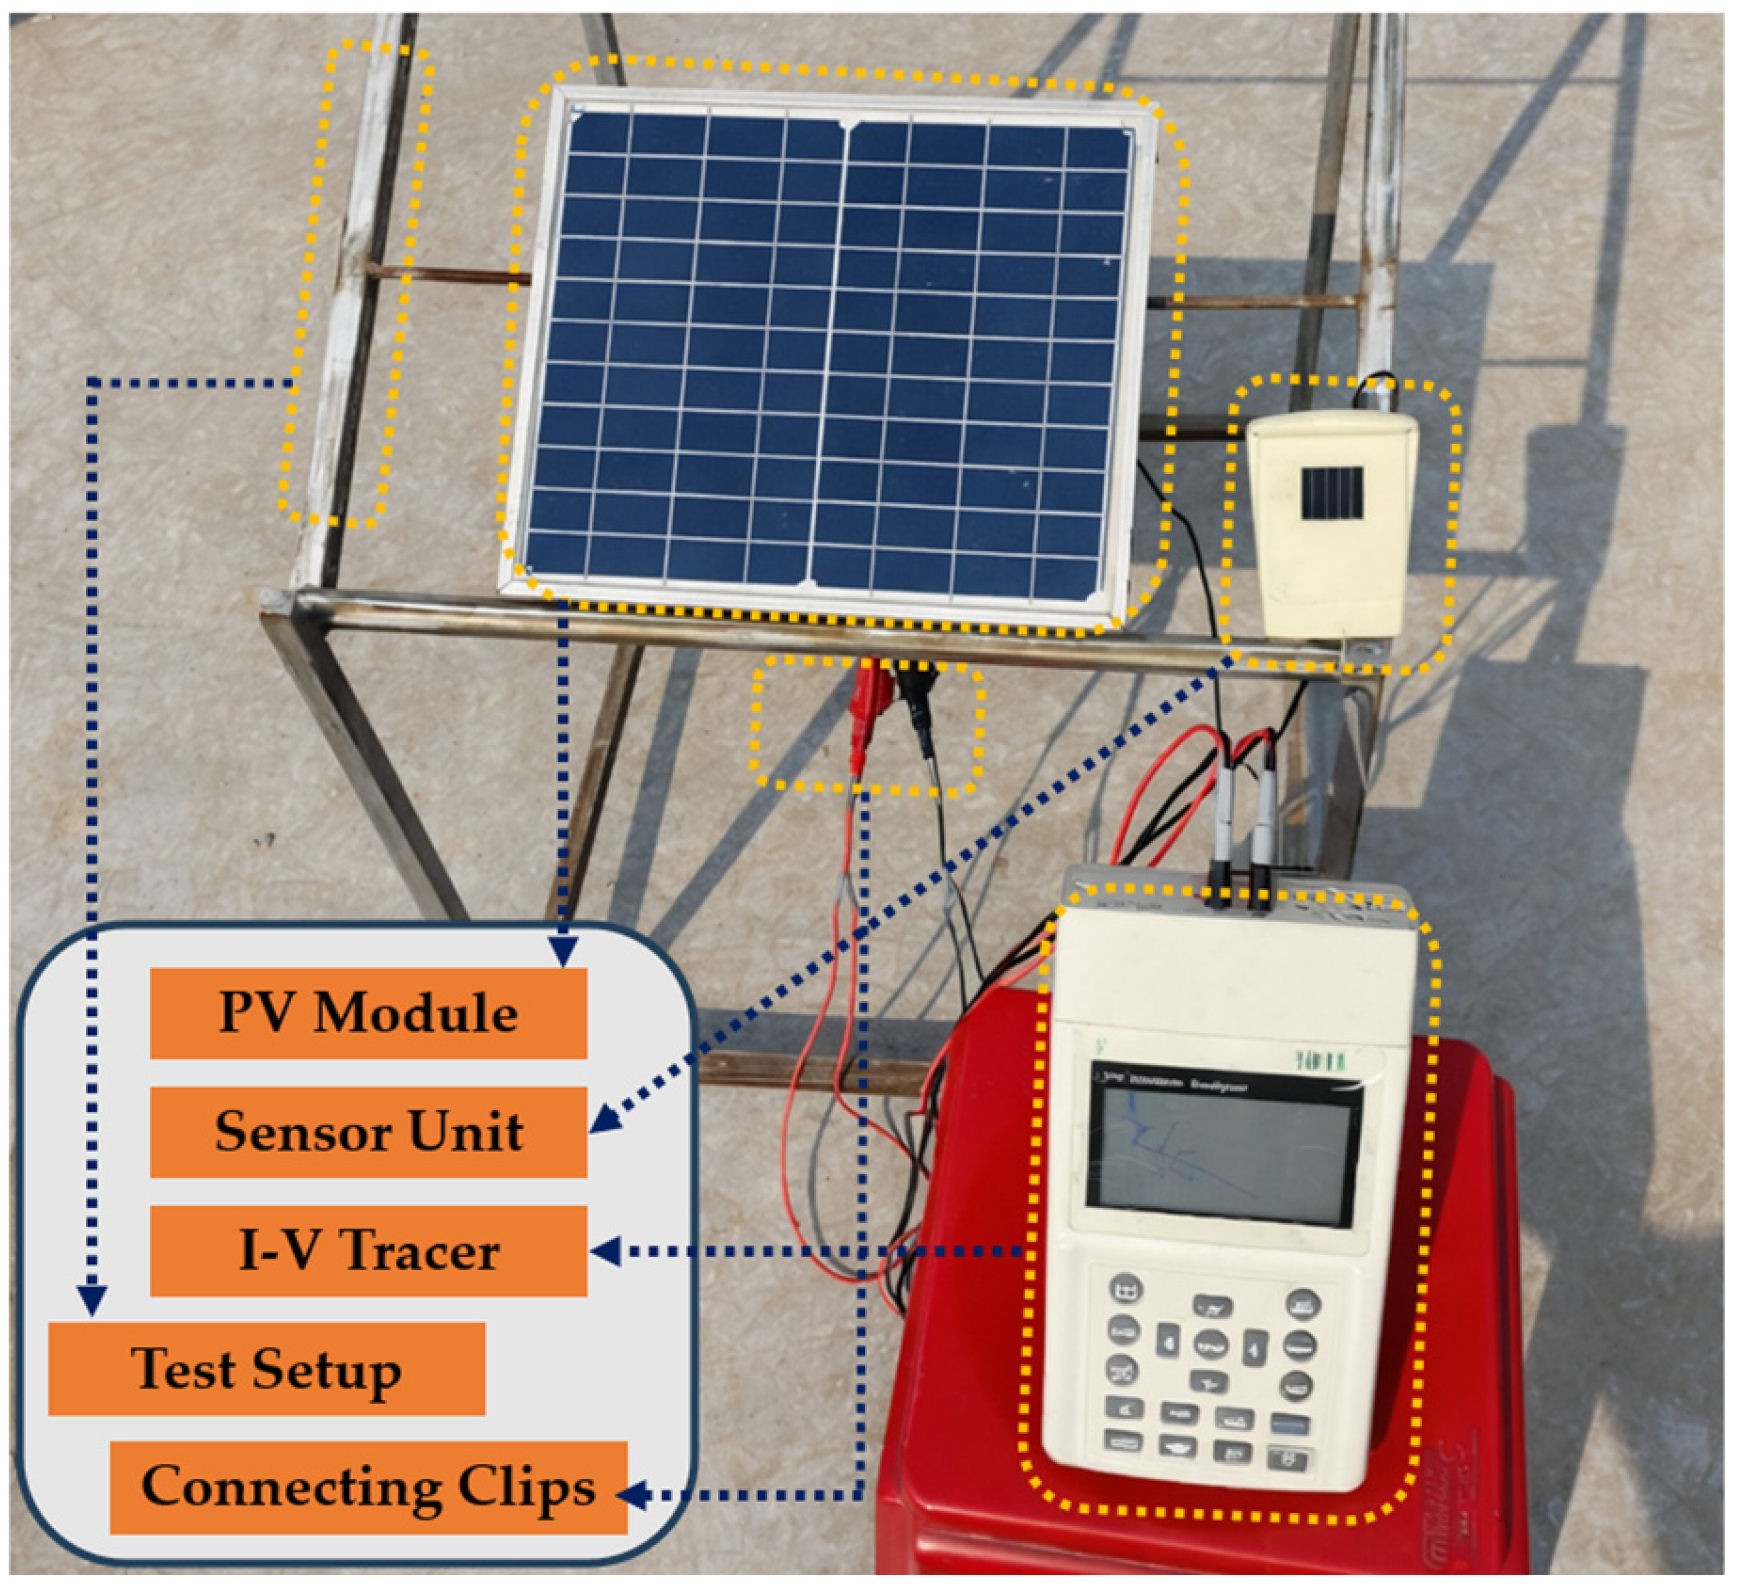
The PV panels were tested in outdoor exposed conditions to analyze the electrical characteristics of the photovoltaic modules. For each test, a steel test frame is maintained at a 23-degree angle to the rooftop surface. Initially, the collected panels were dusty. The panels were tested after proper cleaning. To observe the electrical characteristics of each PV module, an I–V tracer, PROVA-1011, was used, which records discrete data points for current, voltage, power, temperature, and irradiance and computes key electrical parameters. Because of its remarkable precision and wide range, the I–V tracer PROVA-1011 is a highly versatile tool for investigating the electrical behavior of the photovoltaic panel, including its response to extreme heat or freezing temperatures. The reported electrical values primarily represent field measurements under actual environmental conditions. The device’s light weight and simplicity make it appropriate for fieldwork and academic use, as shown in Table 2. The I–V tracer can measure current, voltage, irradiance levels, and temperature. The solar panels were initially set on the test frame for the outdoor test. An I–V tracer was connected to the panels to analyze the electrical parameters of the solar module. The I–V tracer is mainly divided into two parts: the sensor unit and the central analysis unit. The sensor unit consists of two sensing parts: a temperature sensor and an irradiance sensor. Temperature sensors measure the temperature of the solar panels, and the irradiance sensor measures the intensity of sunlight. The temperature sensor was attached to the back of the panel with thermal glue, and the irradiance sensor was placed beside the solar panel on the frame. The sensor unit connects with the central analyzer unit via Bluetooth.
After that, the I–V tracer was attached to the panels by the flexible wired crocodile clips following the appropriate polarity. After completing the connection procedure, the central unit of the I–V tracer was opened by pressing the auto-scan button. The analyzer displayed the electrical parameters, such as open-circuit voltage, short-circuit current, and maximum power point, with appropriate graphical representations. The graph plotted voltage vs. current and voltage vs. power of the panels. The 40 panels were evaluated in outdoor sunlight-exposed conditions at standard test conditions 25 °C, 1000 W/m2, AM 1.5 G, maintaining the IEC60904-1 standard. In each of the forty modules, it takes eight to ten seconds to analyze the electrical parameters of an outdoor test. For each PV module, I–V and P–V characteristics were measured for one times using an I–V tracer. The data were collected under both operational and standard test conditions, with stable irradiance (STC) and fluctuations maintained within an acceptable range of approximately ±5% during each scan. Solar irradiance was monitored using the I–V tracer’s sensor unit, and measurements were taken under clear-sky conditions to minimize variability. The environment’s temperature varied from 36 to 39 degrees Celsius on the testing day. For the store-tested date, press the record button, and the data will be stored in the I–V tracer’s internal memory under a specific record number. The analyzer stored the data in its memory for multiple sets of test data to maintain the proper sequence of record numbers with the data values and the exact test times. A USB cable, a personal computer, and the Solar System Analyzer software (V 3.0.0) were used to extract data from the I–V tracer. Using the computer, the graph and value of the electrical parameter were collected, and Microsoft Excel was used to access the data. The electrical investigation process is shown in Figure 6.

4. Data Description (Raw Data)

This section includes both image-based analysis and electrical results analysis, as shown below.

4.1. Detected Faults from Old PV Modules by Visual Investigation

Initially, the four years of 40 PV modules were collected from an array on the rooftop of a building. The surface of the PV panels was dusty, so a water-cleaning process was applied. For image-based investigation, the detected faults were carefully identified visually and captured using a high-resolution camera. The faults are shown in Figure 7.
This section identified the visual performance degradation factors of old photovoltaic modules. To ensure sufficient lighting, a visual assessment of the PV modules was conducted during the day in clear or mostly clear weather. During the picture-collecting process, care was taken to reduce shadows and reflections. To provide a comprehensive overview of the visual faults detected in various photovoltaic (PV) modules, Table 3 analyzes the different types and quantities of faults found in each panel. Various types of PV faults were detected and categorized based on the literature review, as shown in Figure 2 and Figure 3. The main problems noted in the panels above are pre-hotspots and minor discoloration. Furthermore, multiple panels contain particular faults that vary from panel to panel, such as corrosion, persistent dust, Surface scratches, and damage to the back sheet.
PV modules such as 1612E020002, 1612E020004, 1612E020007, 1612E020014, and 1612E020017 have the most visual faults, including pre-hotspots, minor discoloration, back sheet damage, surface scratches, permanent dust, and corrosion. The various defects in these panels indicate an increased degradation rate, most likely due to prolonged exposure to external factors or work-related stress. Consequently, this table summarizes the faults found in each module and a comparative assessment of the panels’ overall condition.
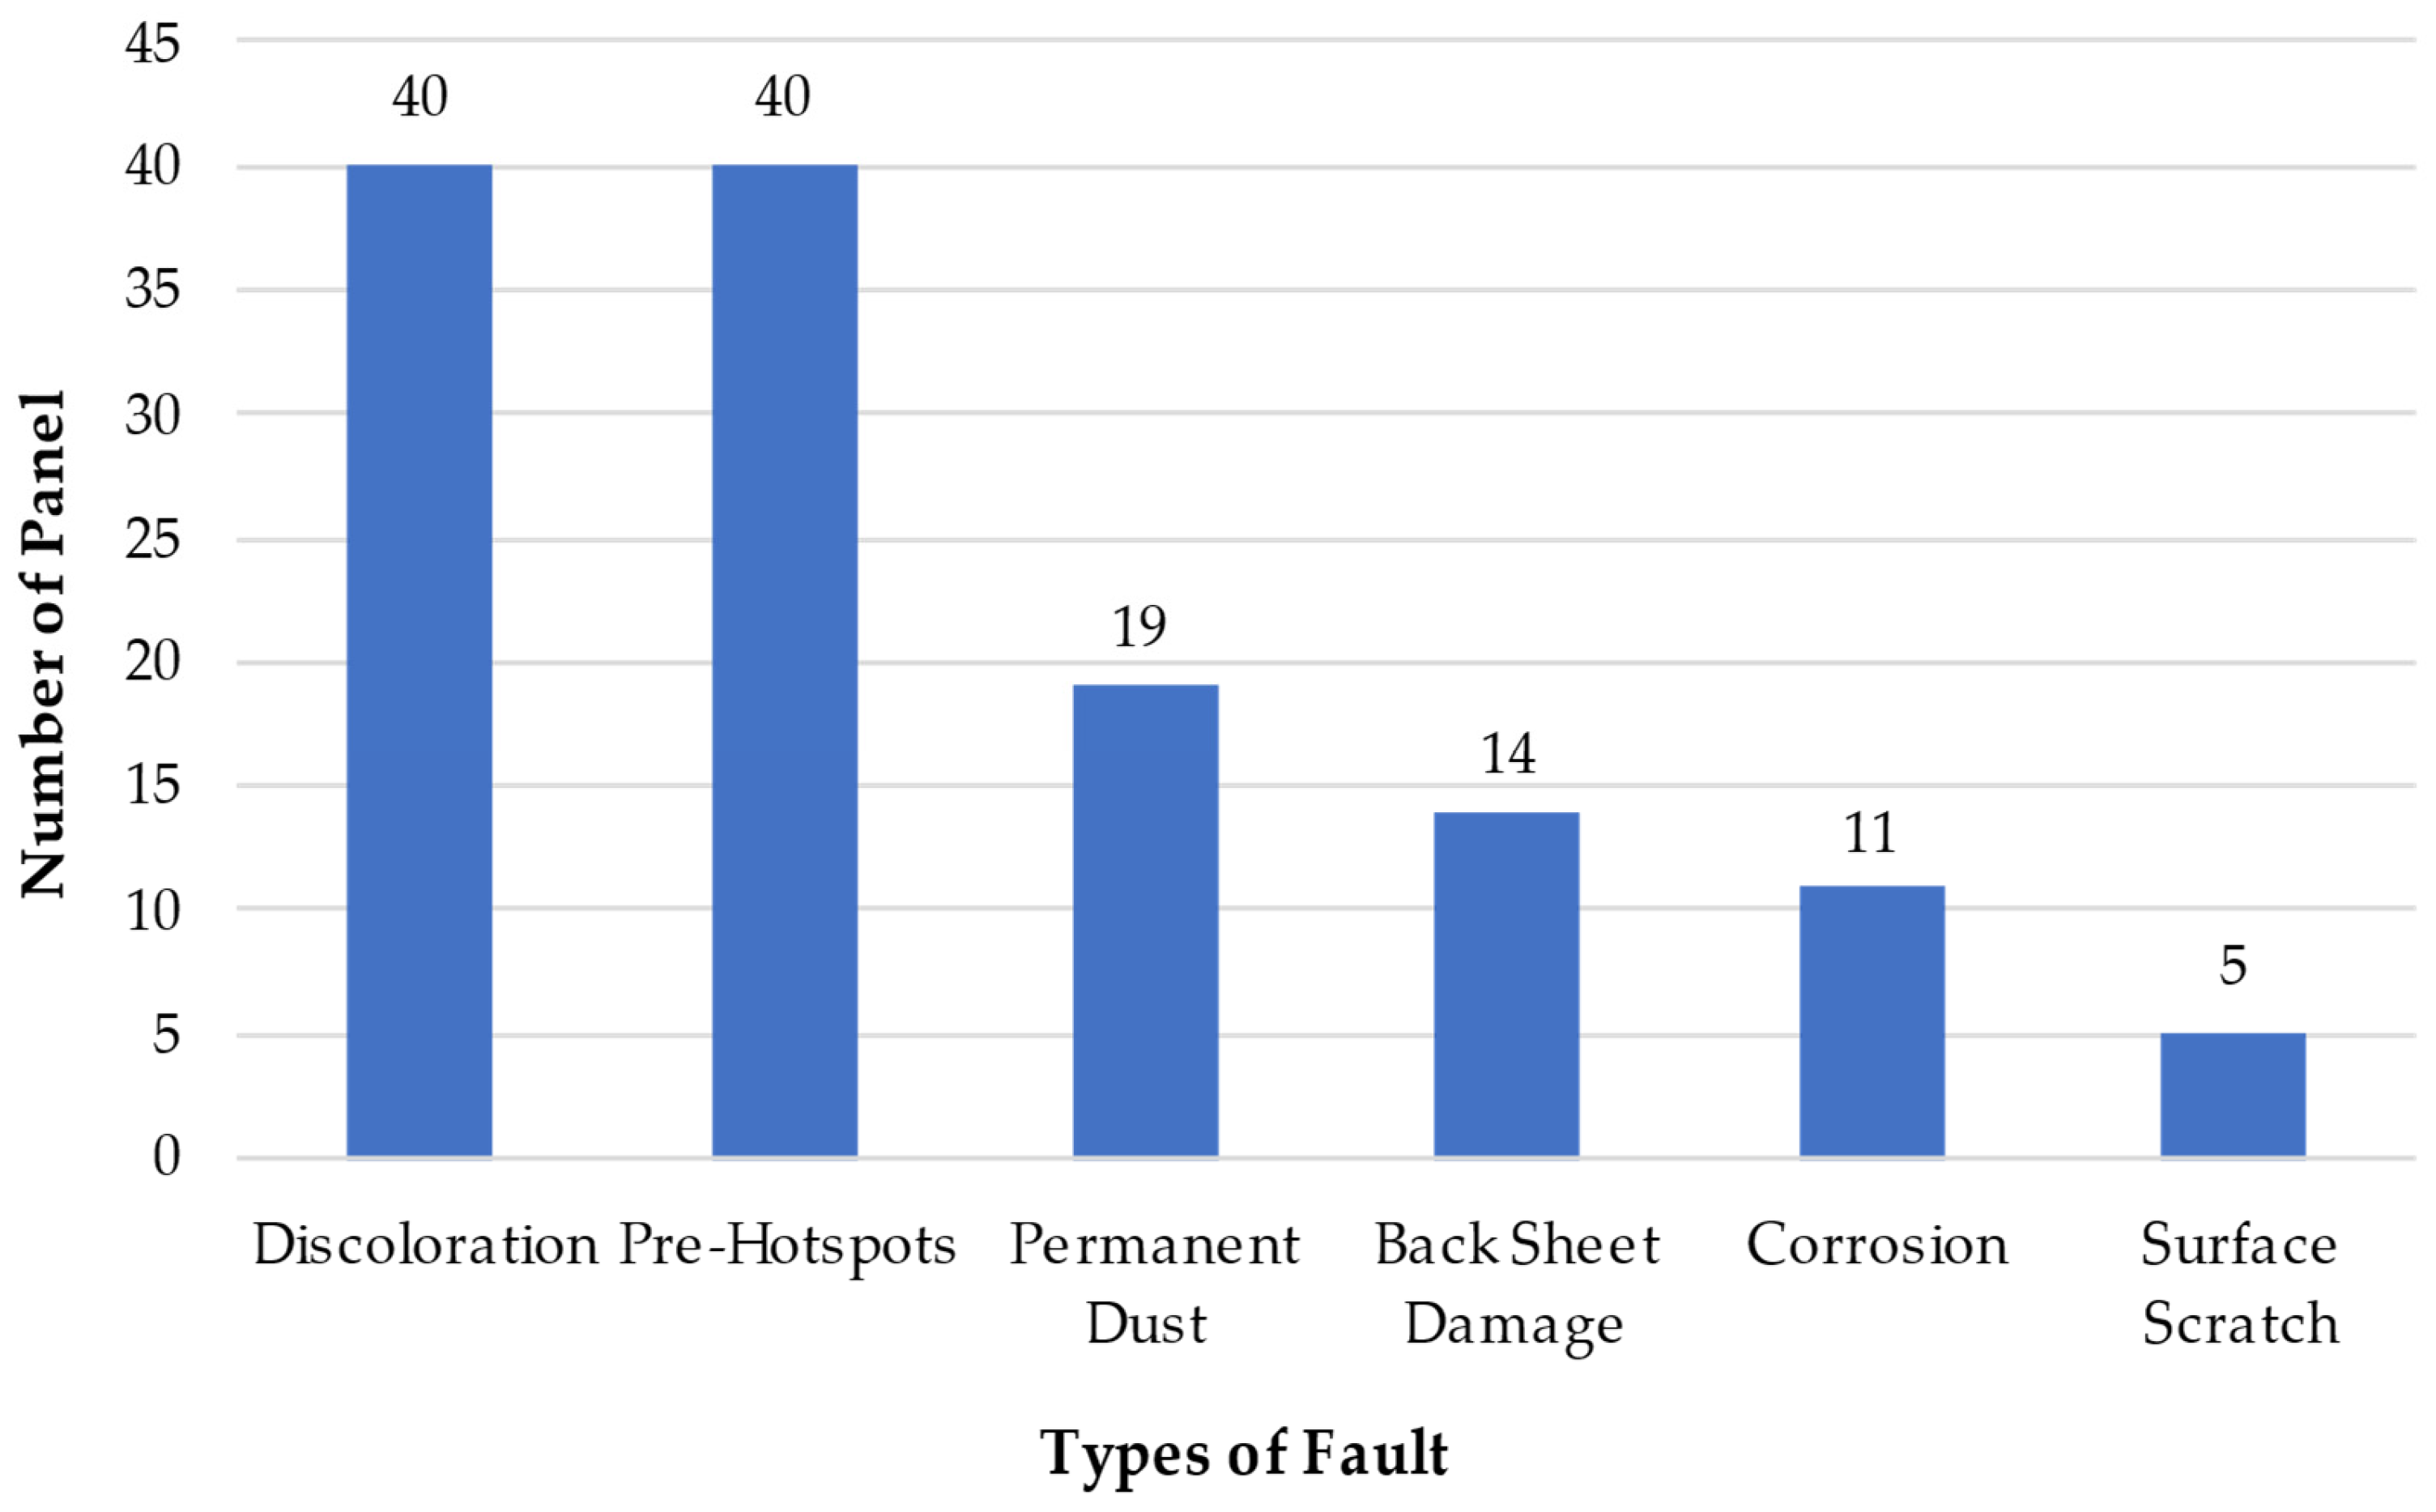
The distribution of visual defects found in 40 PV modules after 4 years of outdoor exposure is summarized in Figure 8. The findings show that pre-hotspot development and discoloration are the most common forms of degradation, occurring across all modules. A significant level of soiling across the system is indicated by permanent dust deposition in 19 modules. Of these, 14 modules have back sheet damage, while 11 modules have corrosion. These flaws point to significant effects of material and environmental stress on the modules. On the other hand, only five modules had surface scratches, which are comparatively rare. Overall, the dataset demonstrates that multiple types of visual degradation coexist within the PV modules, with varying degrees of occurrence.

4.2. Analysis of Electrical Investigation Data

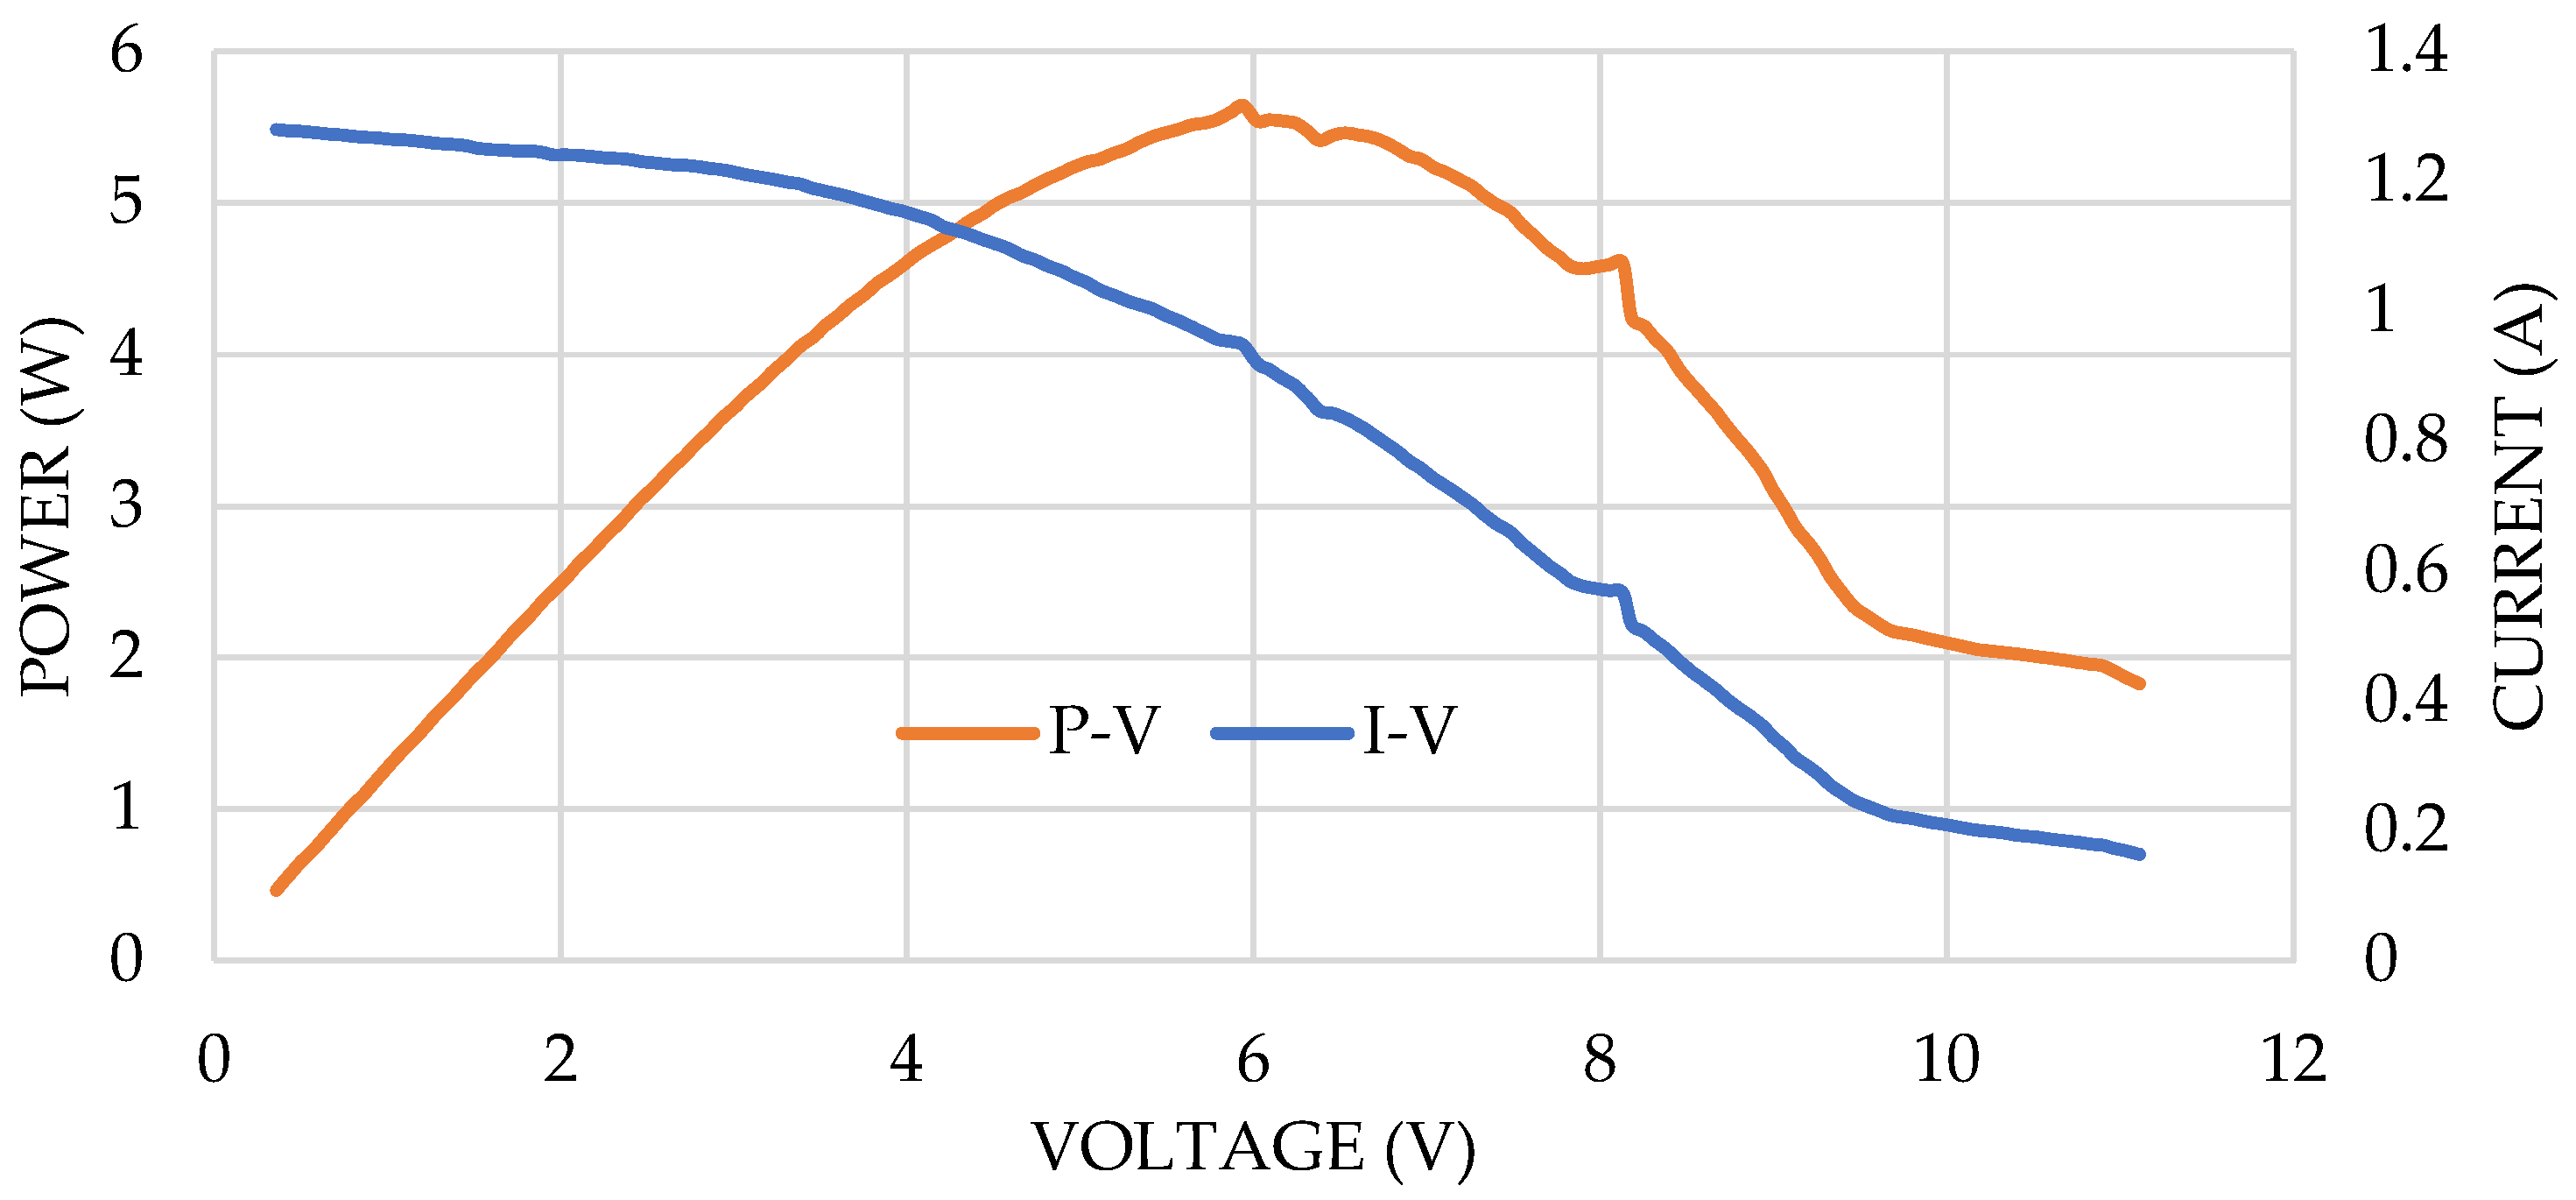
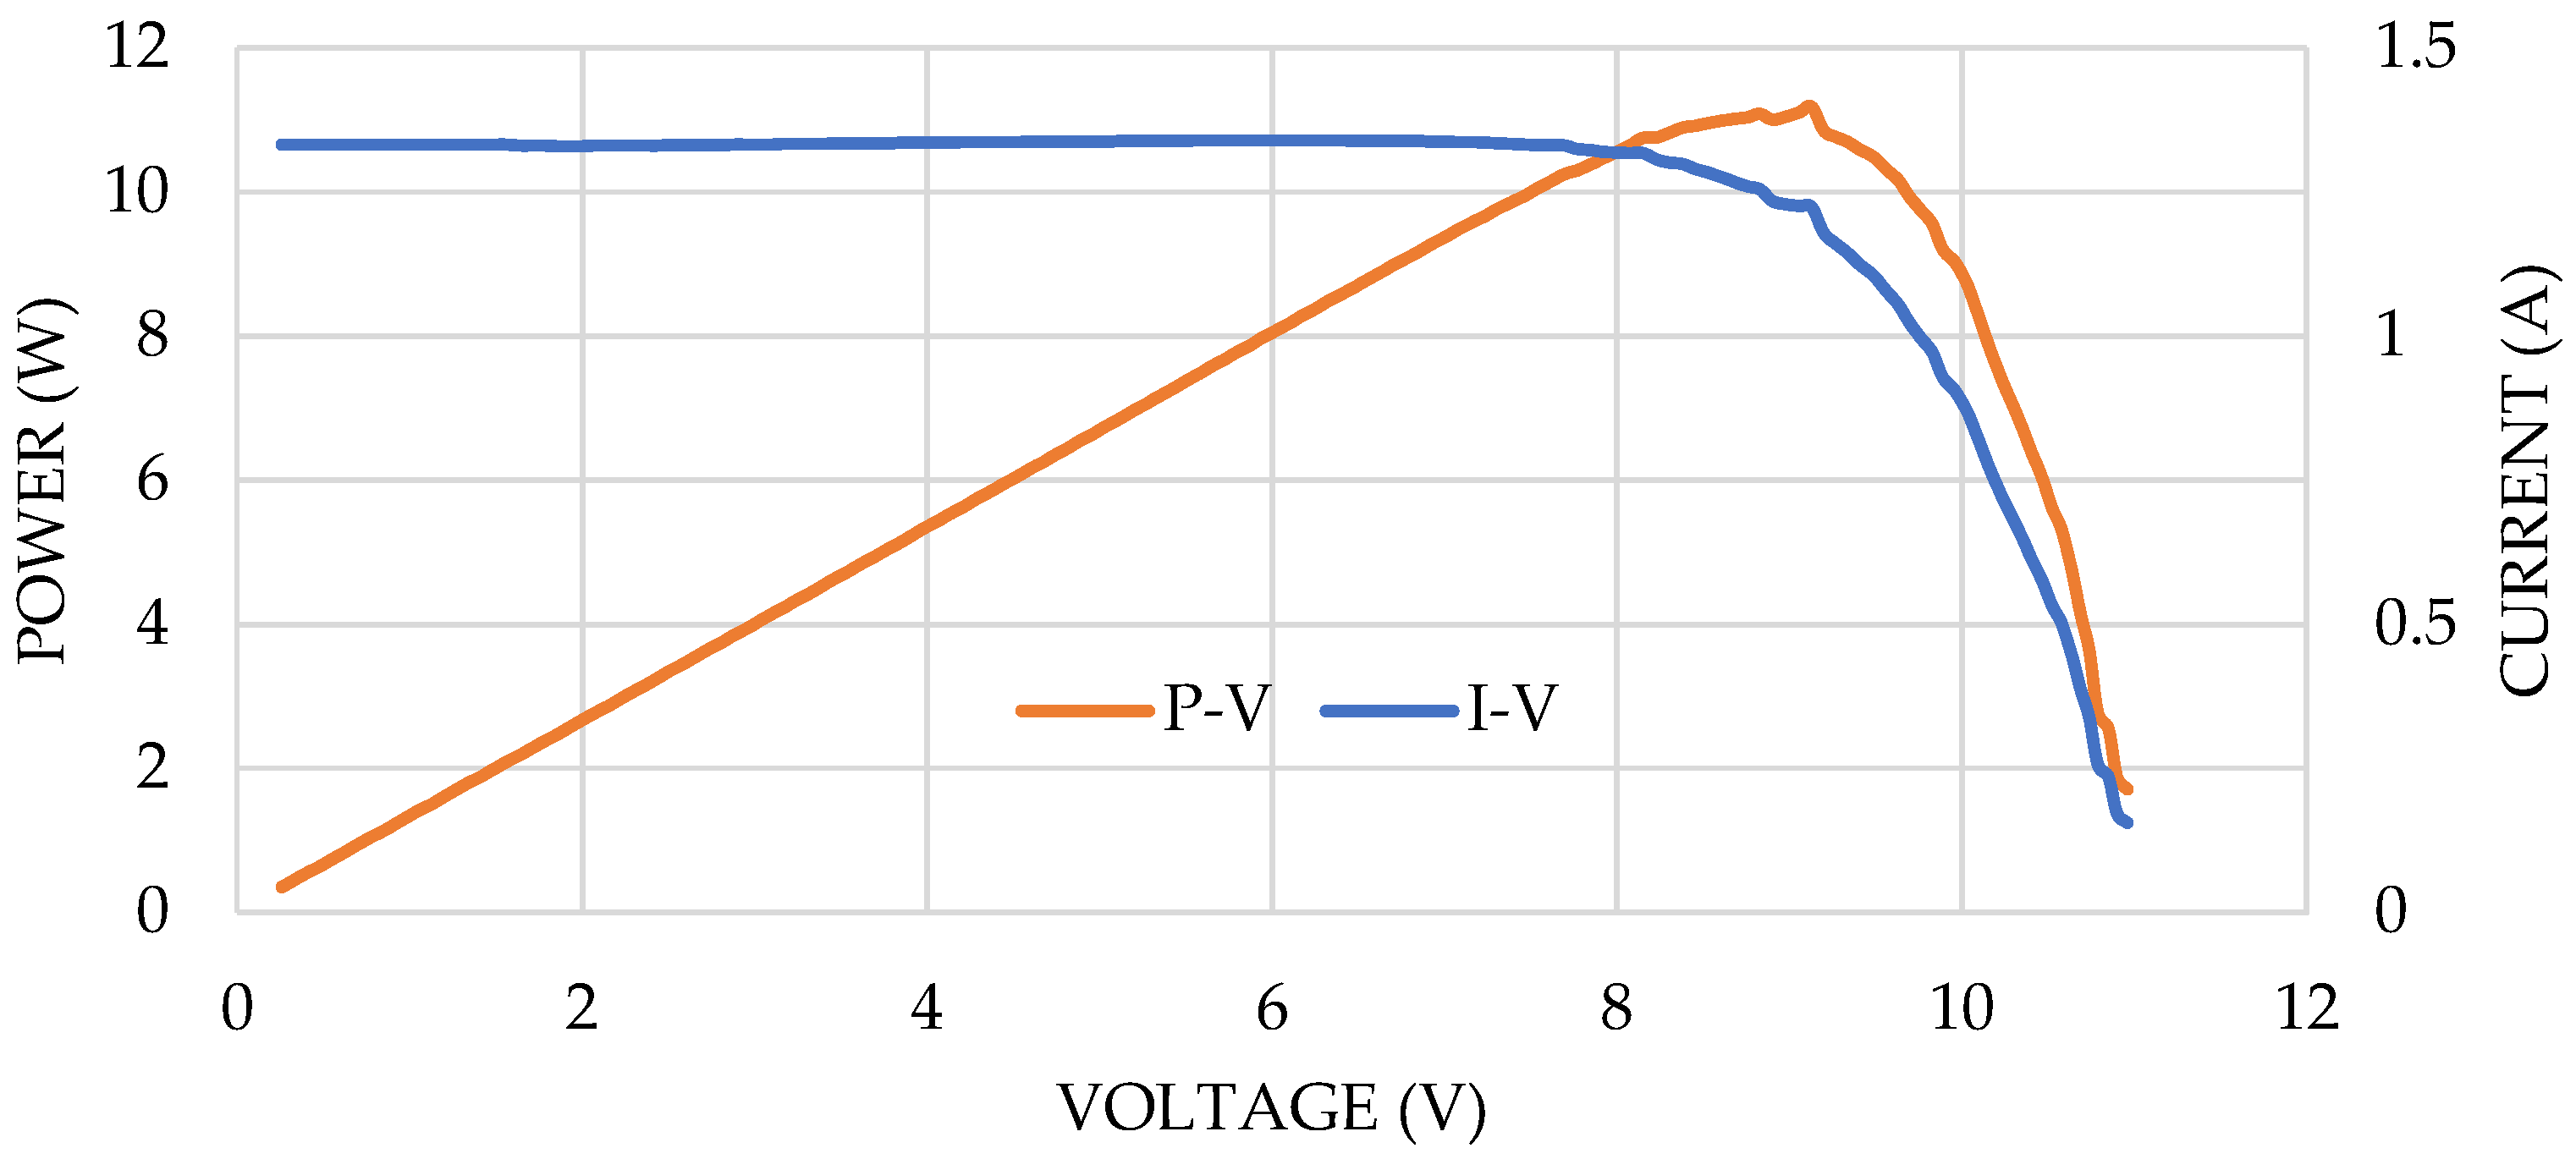
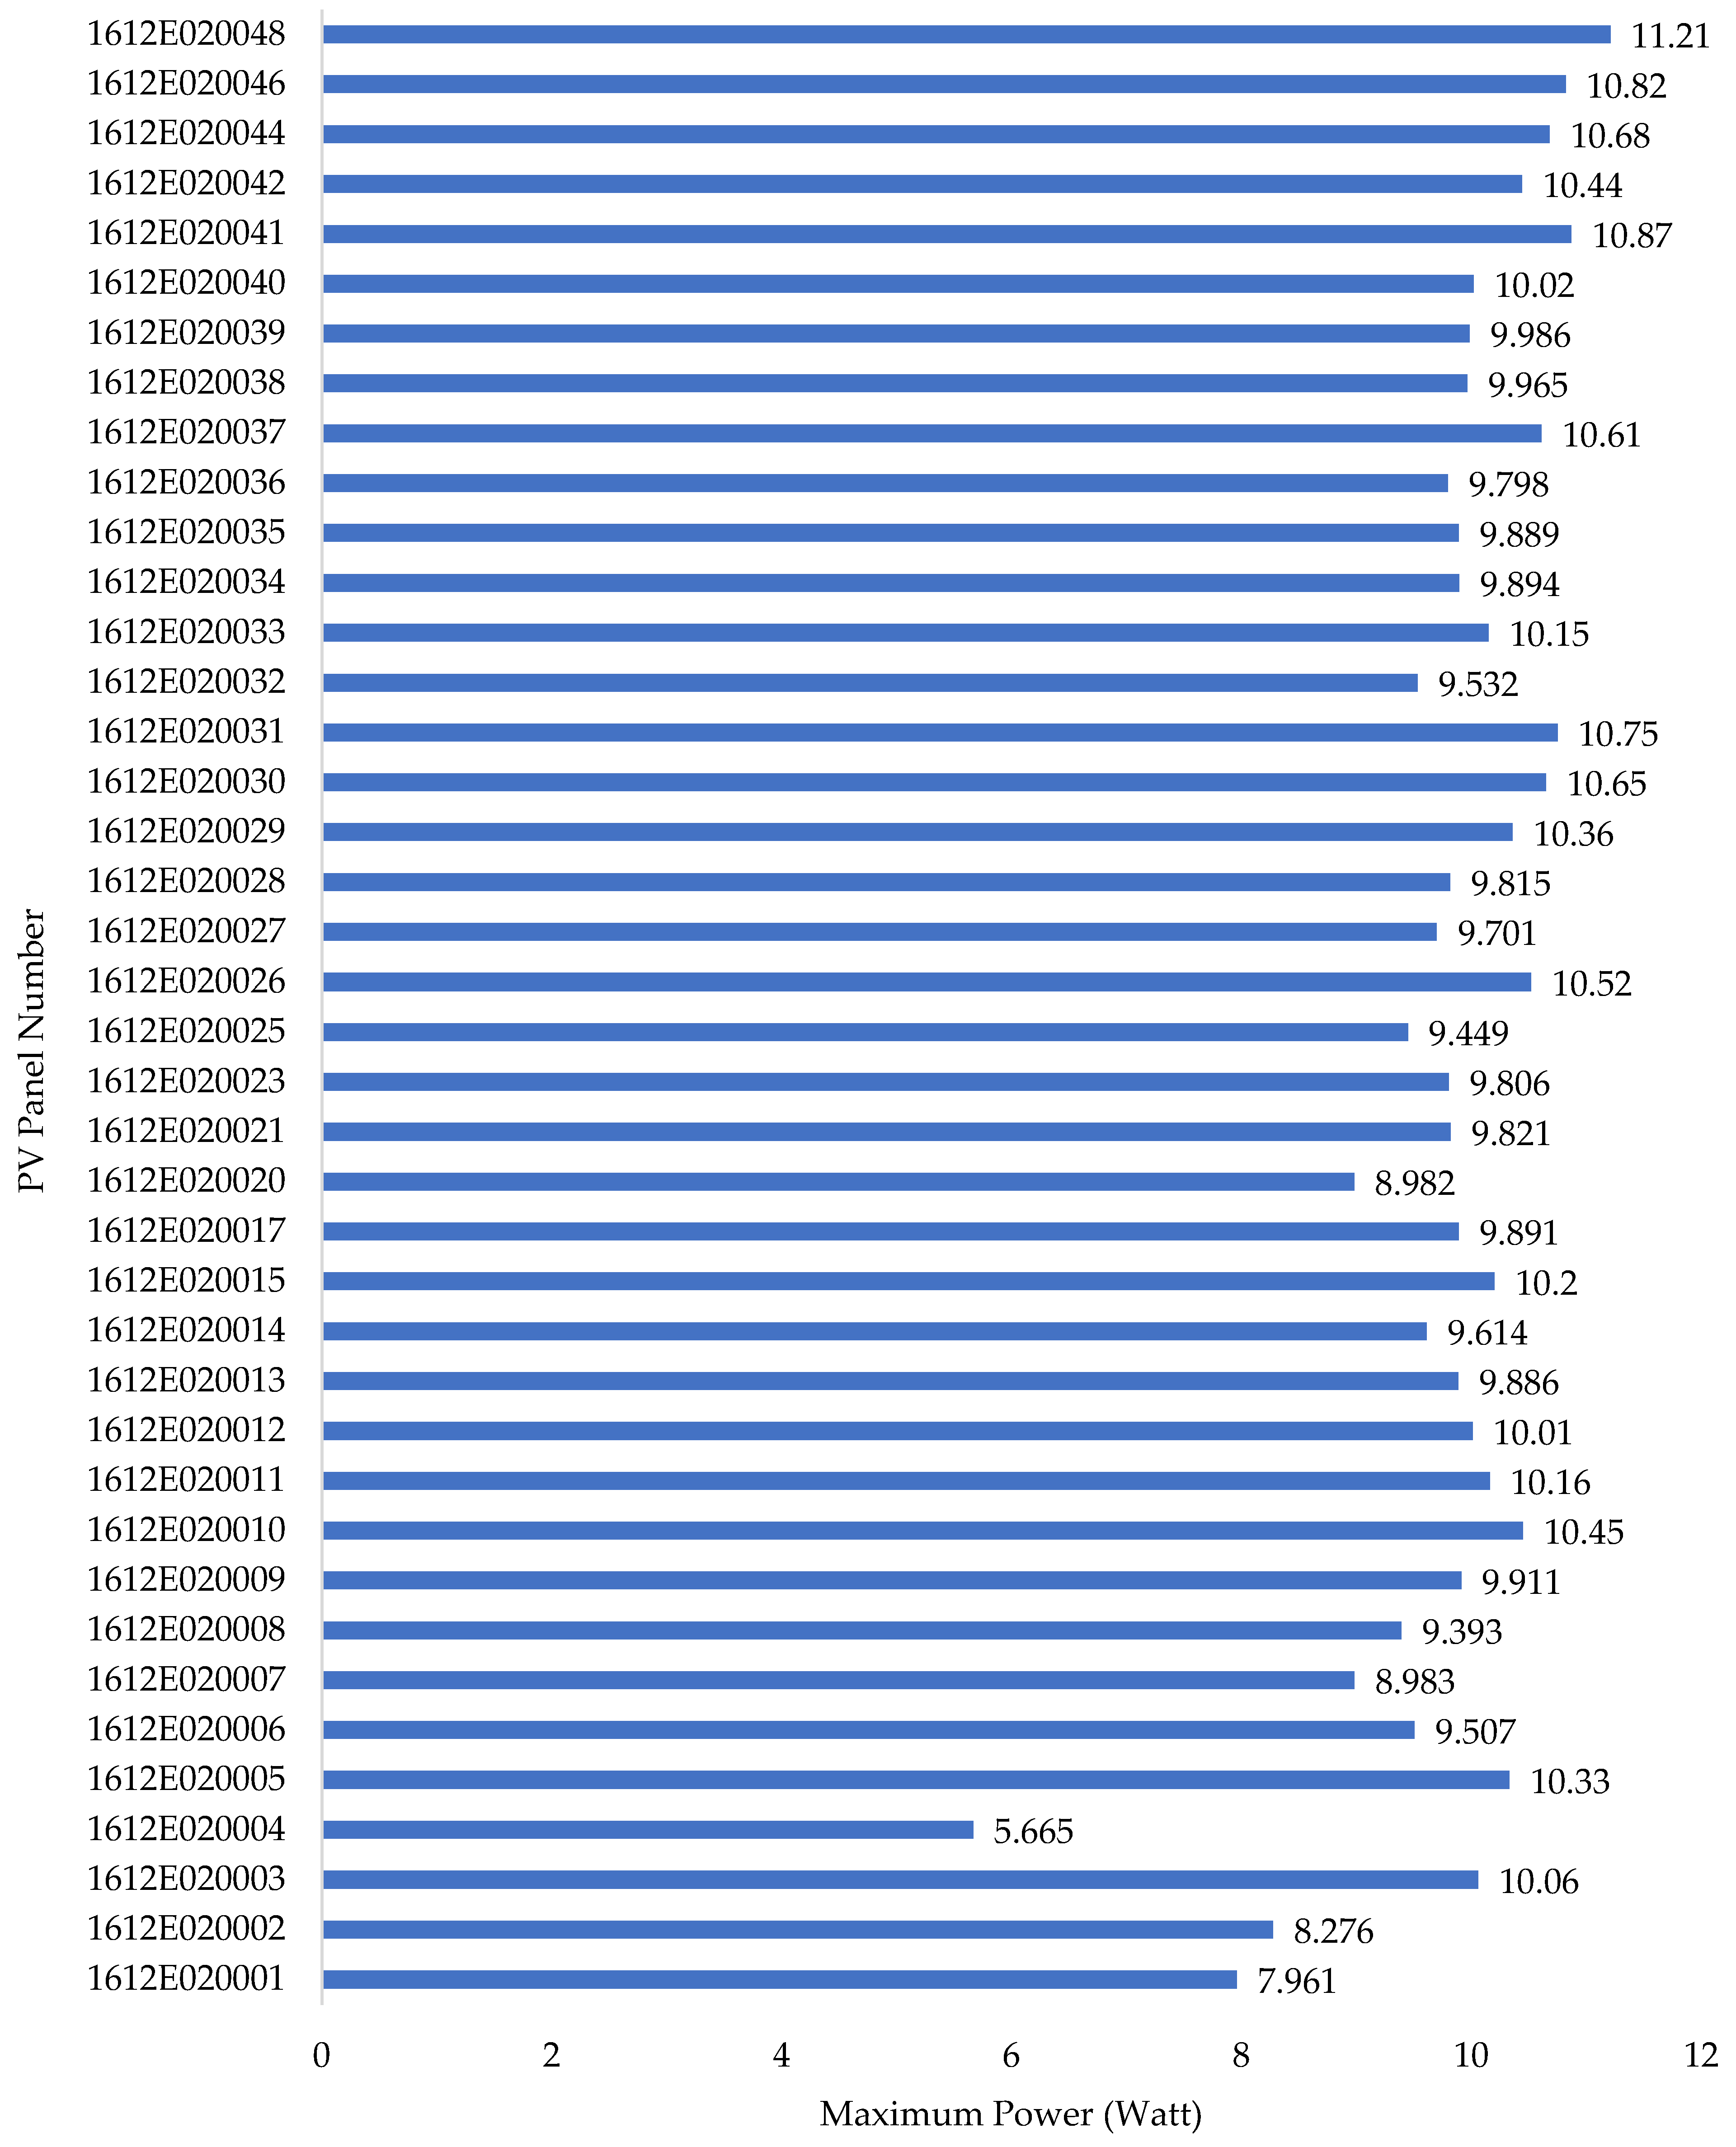
The dataset is acquired from experimentally tested four-year-old PV modules in outdoor exposed conditions at Mirpur in Dhaka, Bangladesh. The datasets were tested experimentally using a commercial I–V tracer, a PV analyzer that adheres to ISO standards for reliable, consistent measurements at Mirpur in Dhaka. The 10 W power-rated 40 solar photovoltaic modules are stored in the dataset database. The data file consists of a single Excel sheet. The articles include the test data for 10 W power-rated modules. There are 40 PV modules on the data sheet. Module number 1612E020004, whose graphical representation is shown in Figure 9, provided the lowest power output among this data set. The module provided a lower voltage and current, 6.01 V and 0.942 A, respectively, than the other modules. In addition, module 1612E020048 provided the maximum output power with maximum current and voltage of 1.223 A and 9.16 V, demonstrated in Figure 10.
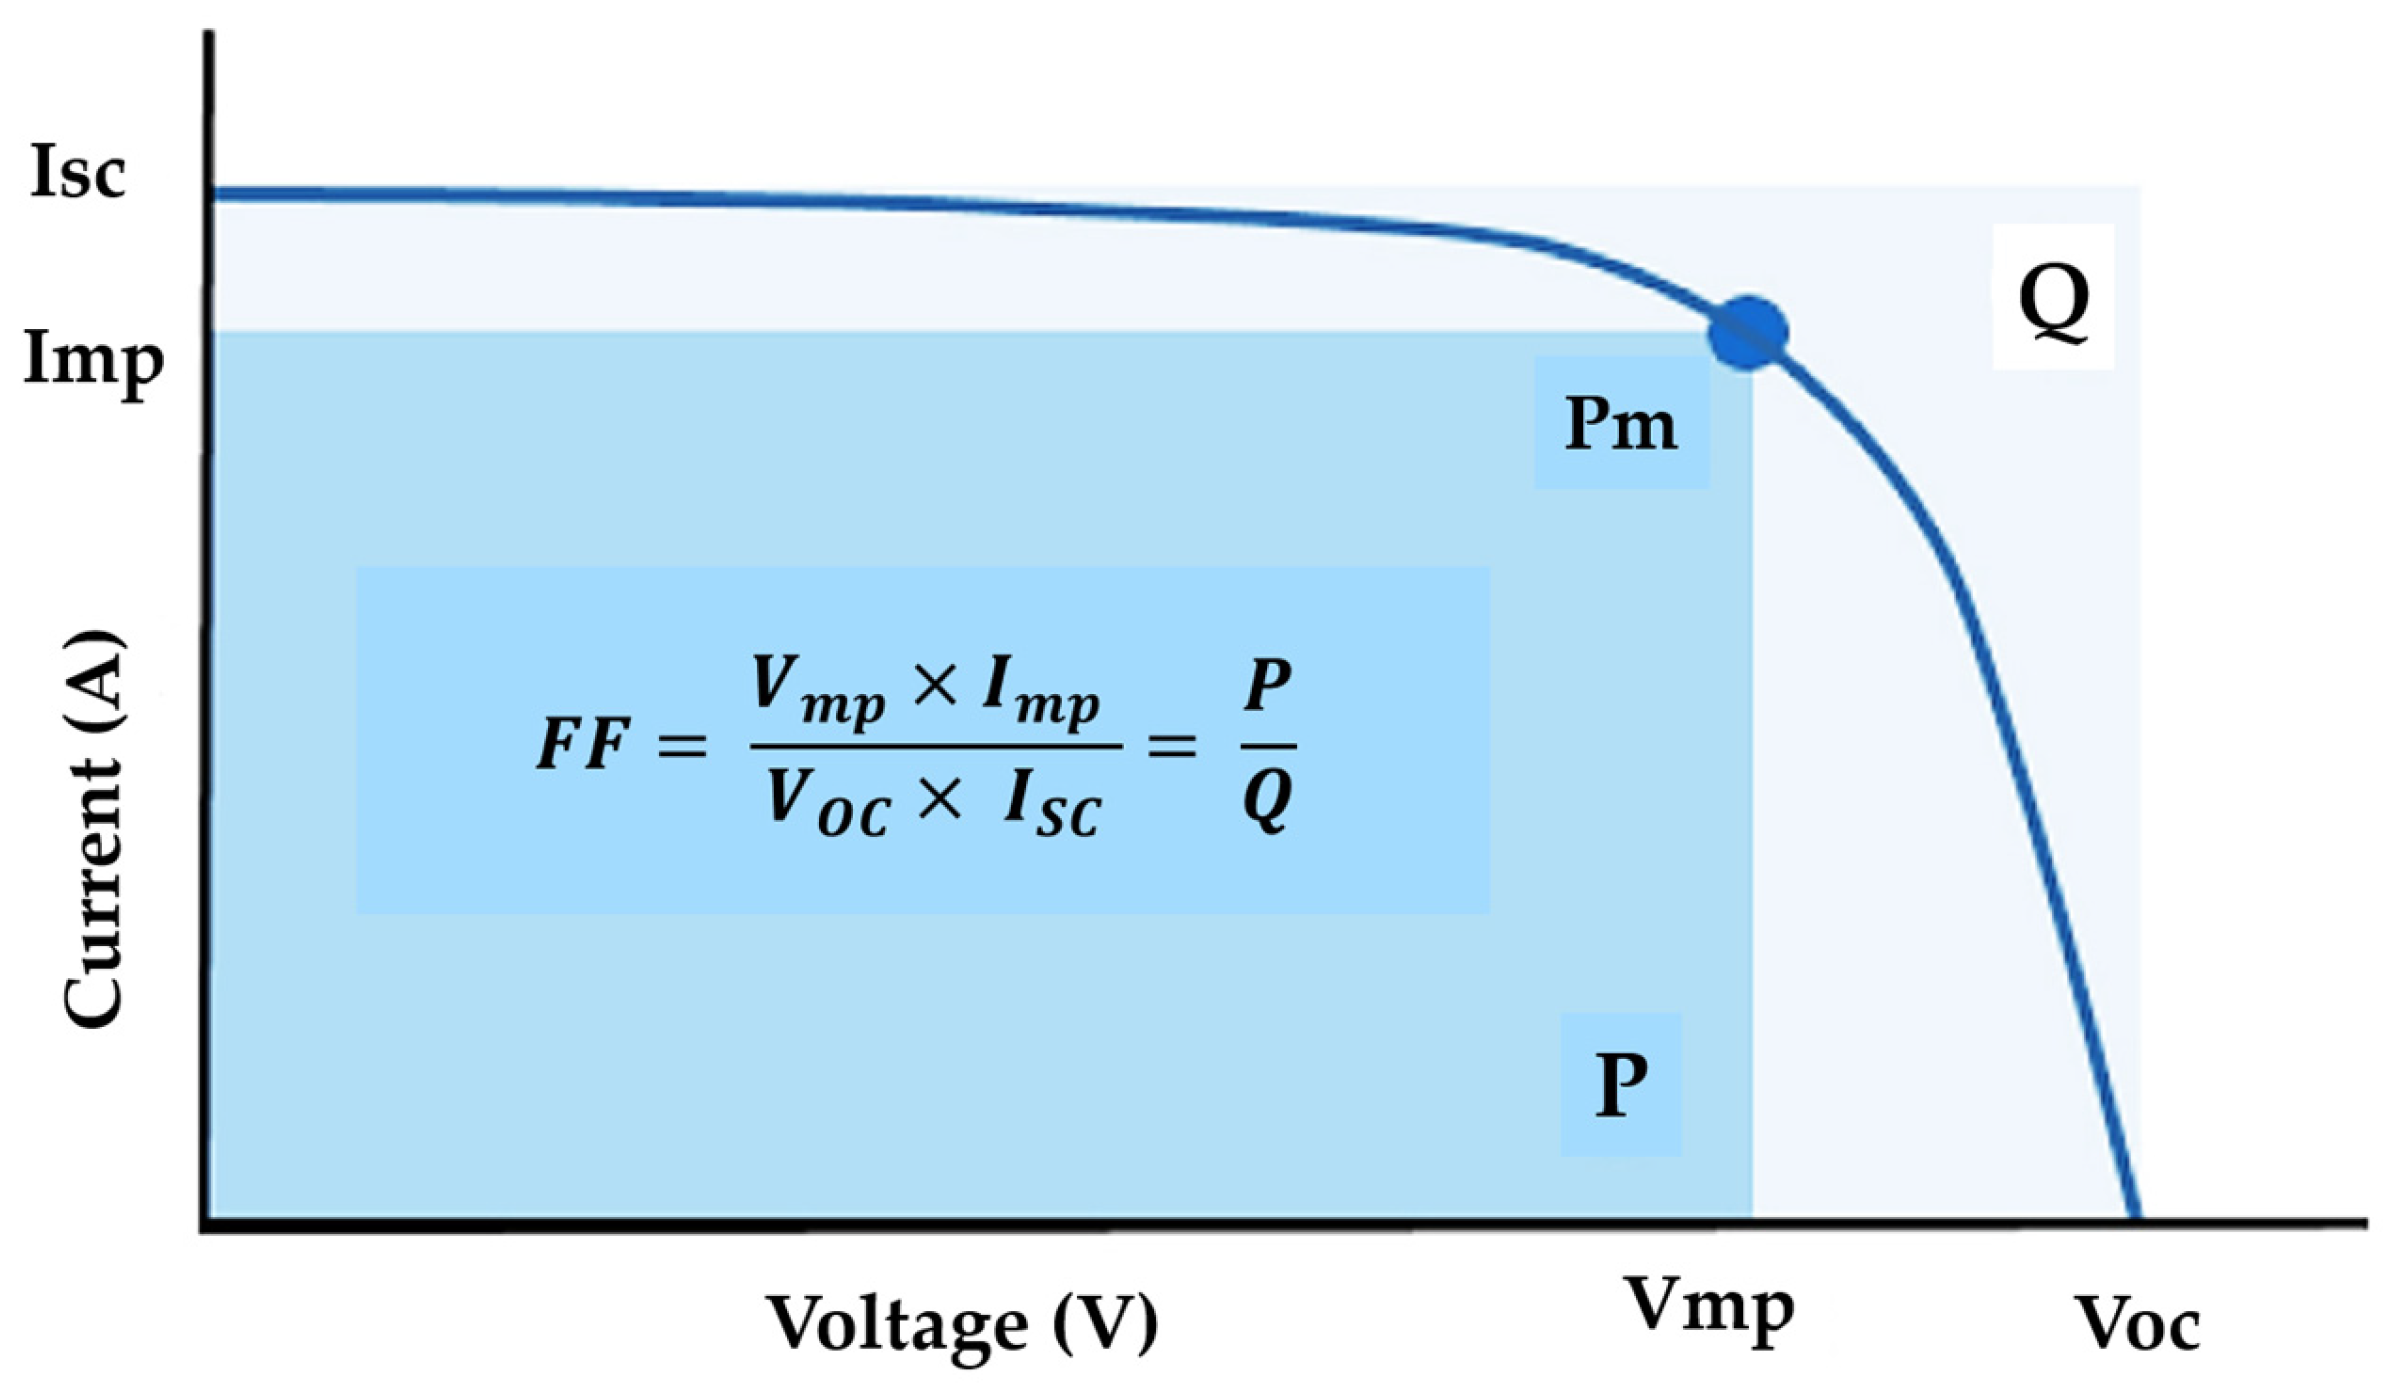
The maximum output voltage and current graph was plotted for the maximum output voltage. Table 4 shows the output characteristics of a single photovoltaic module, including its average open-circuit voltage, average short-circuit current, average maximum power voltage, average maximum power current, average maximum power, and average fill factor (FF), for 40 PV panels. The standard deviation of the output parameter is also included in Table 4. In this table, the minimum standard deviation is 0.025 for short-circuit current, and the maximum is 0.939 for the maximum output power. The fill factor was calculated using Equation 1. The relationship between the FF and the parameters for the module is shown in Figure 11.
F F = V m p × I m p V o c × I s c × 100 ( % )
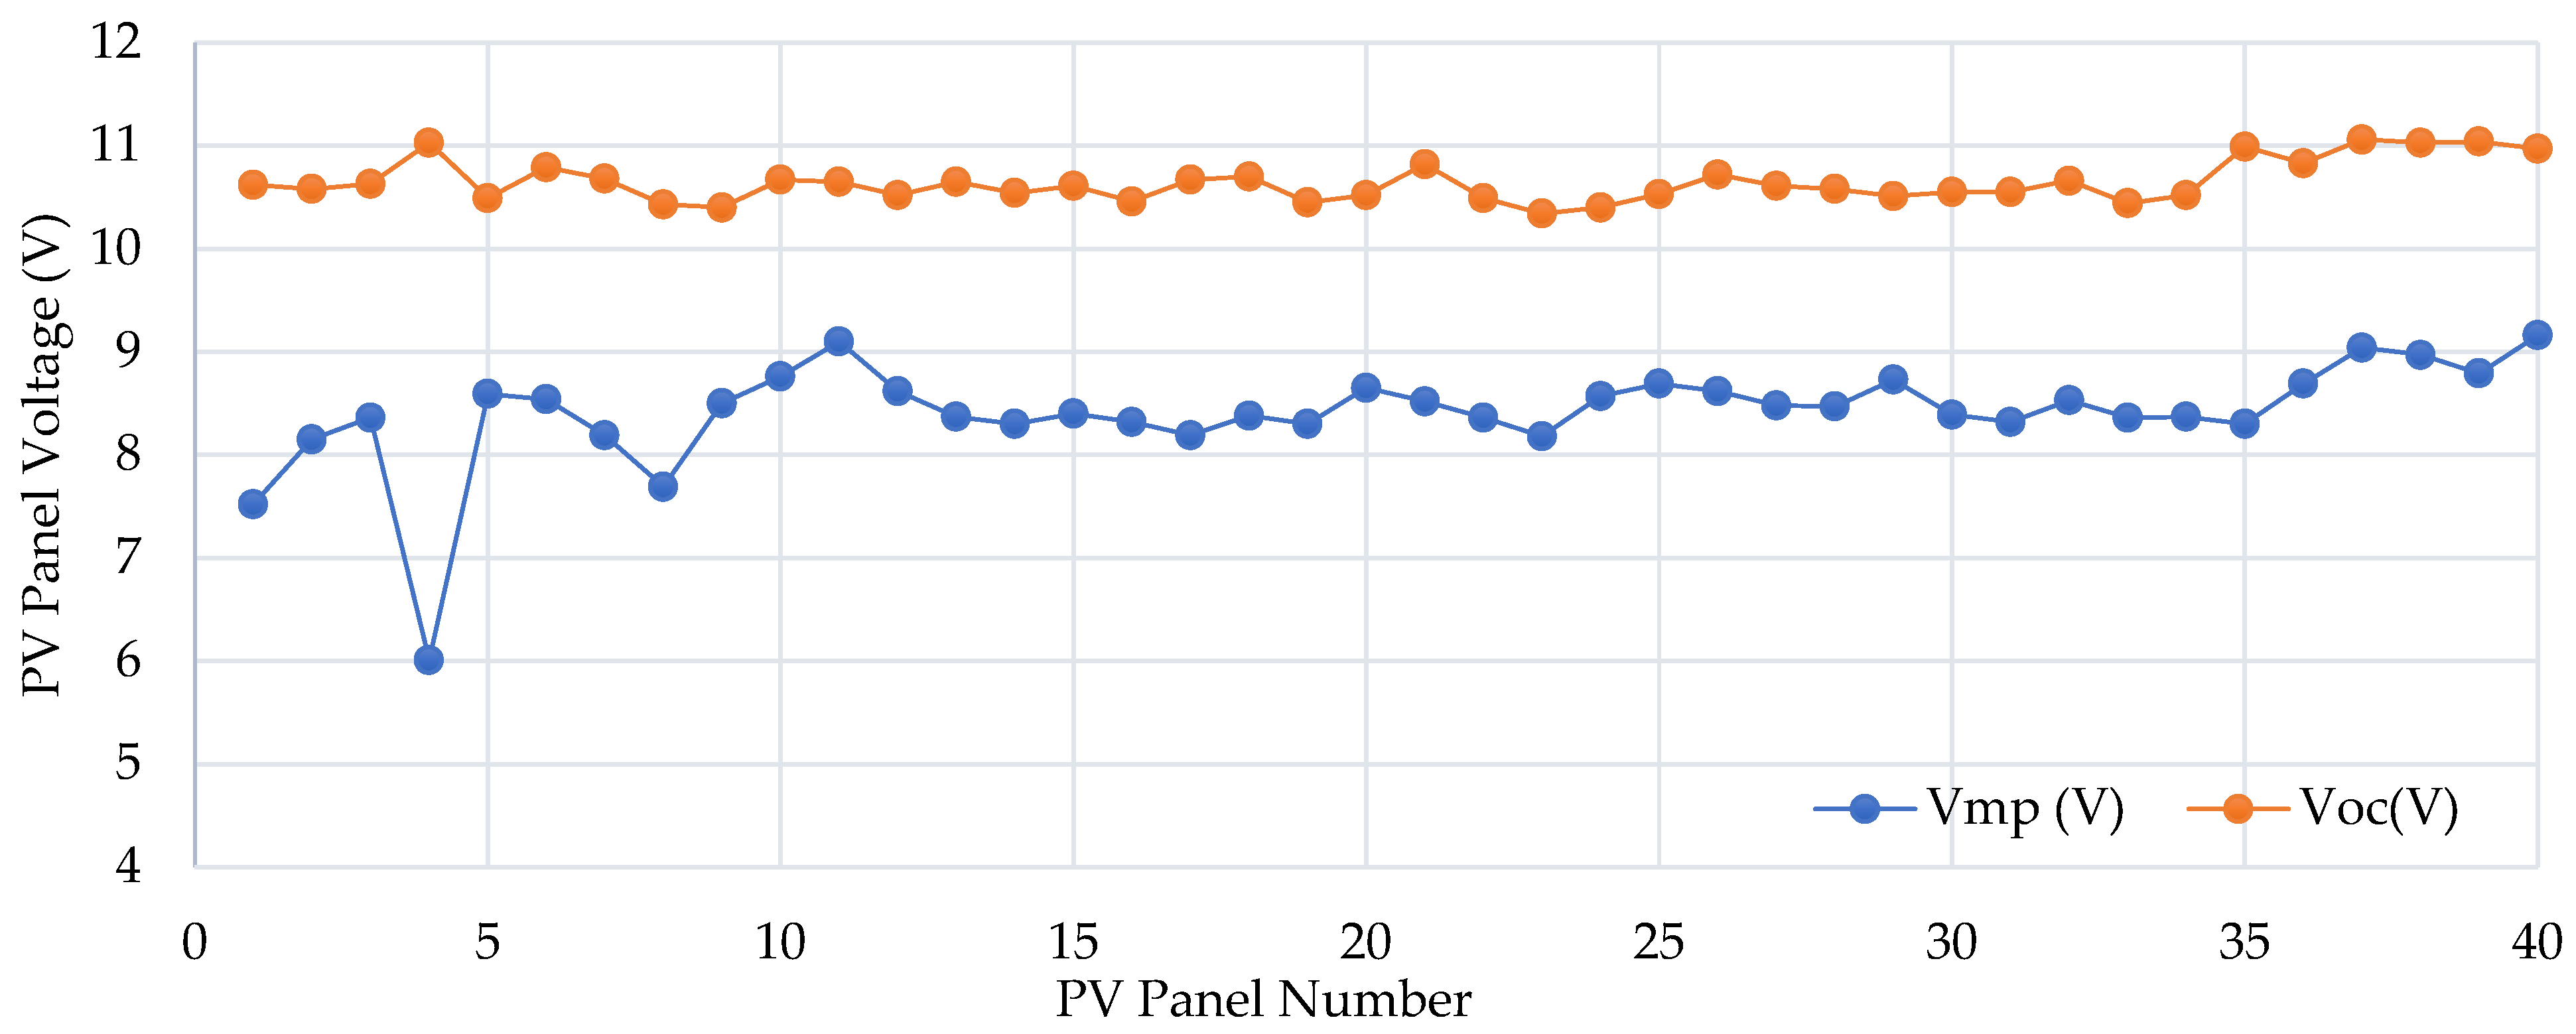
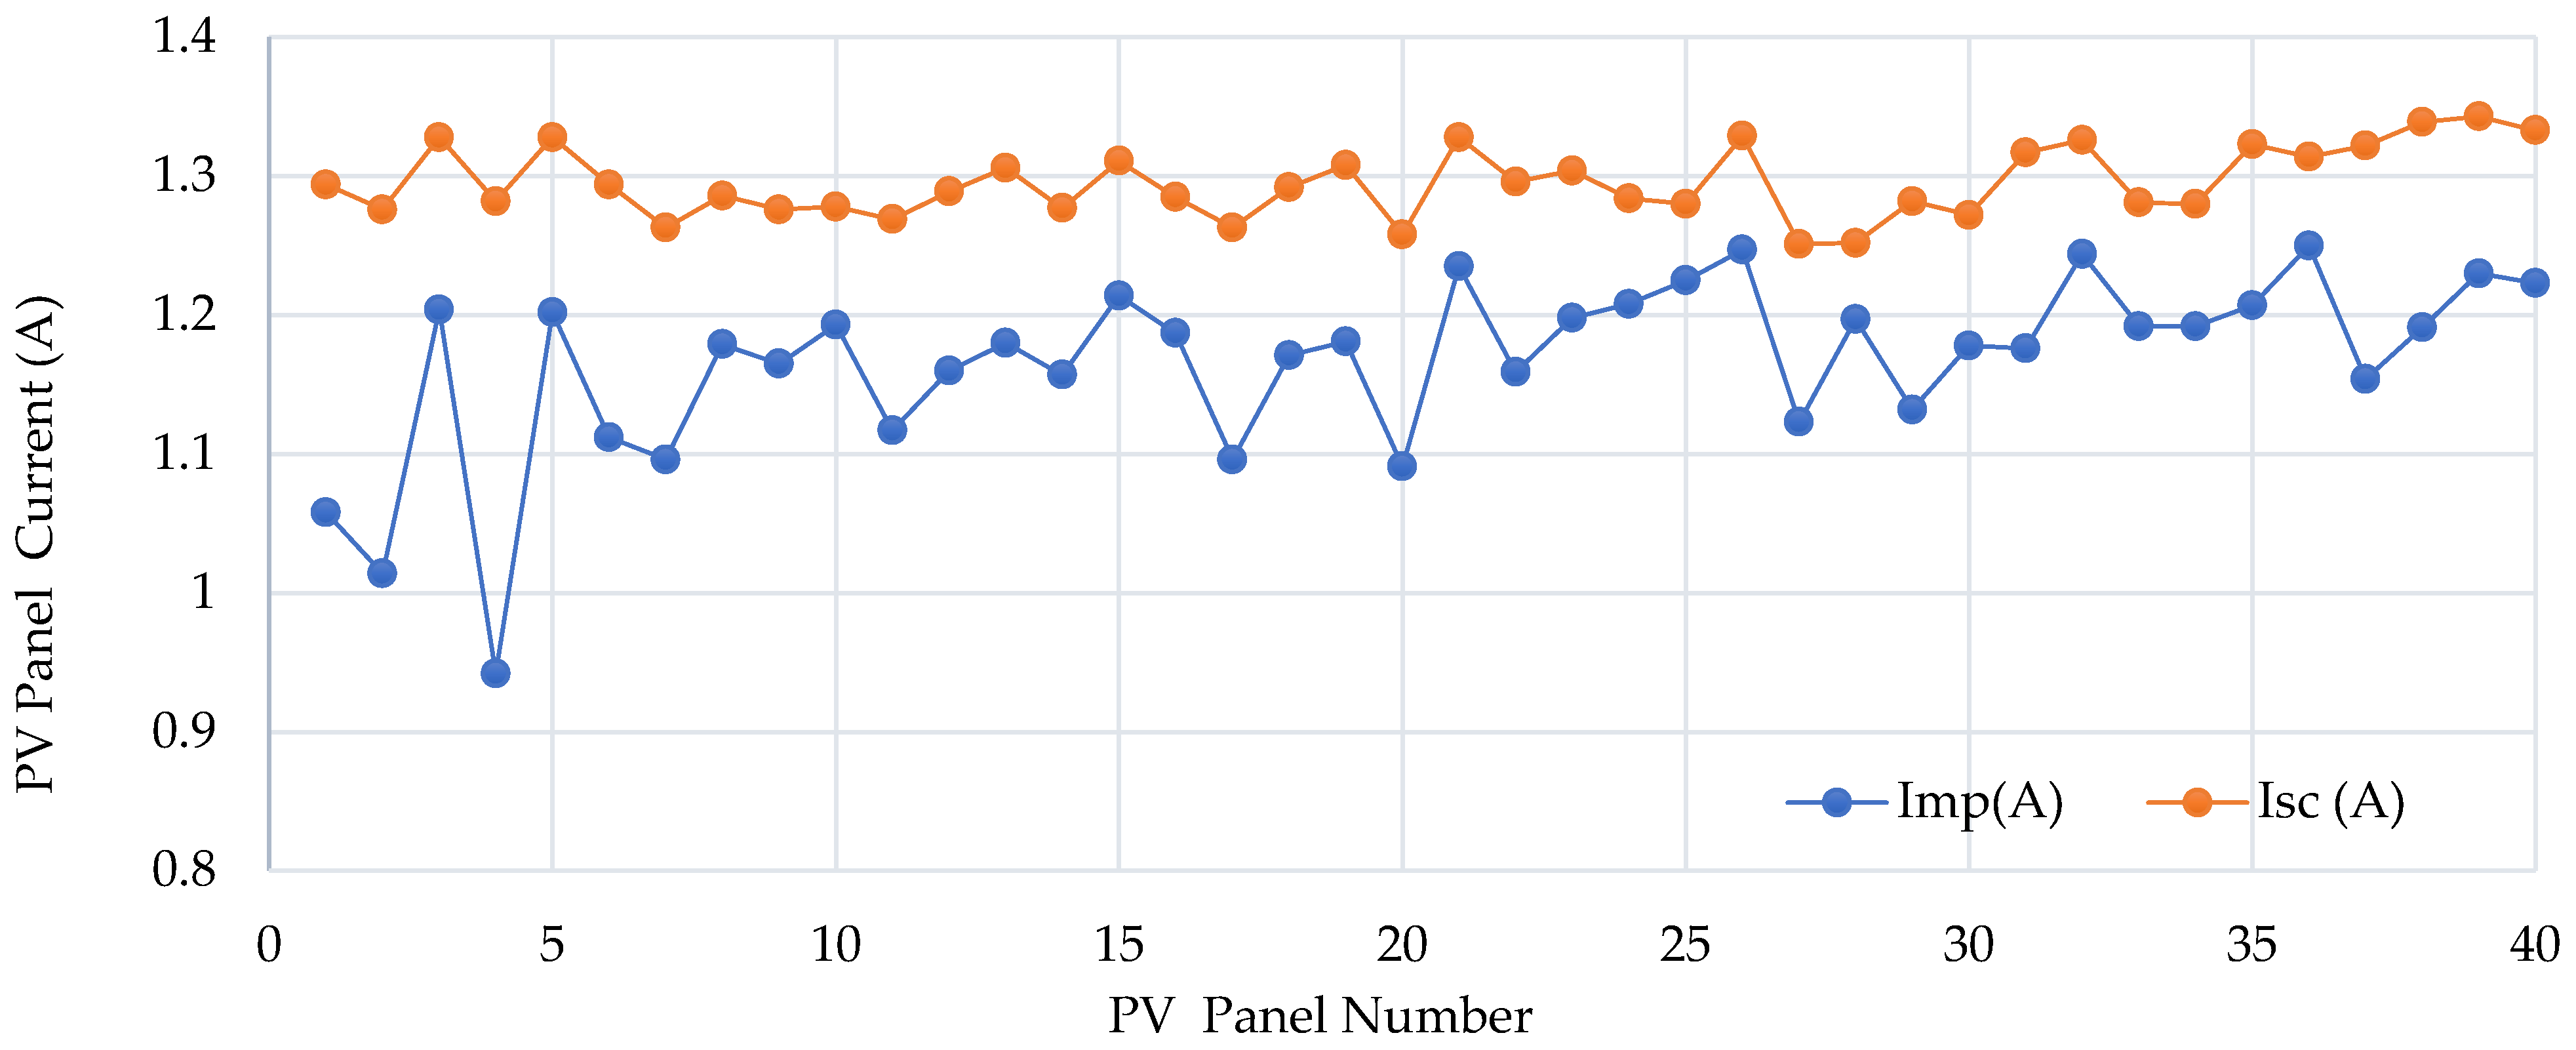
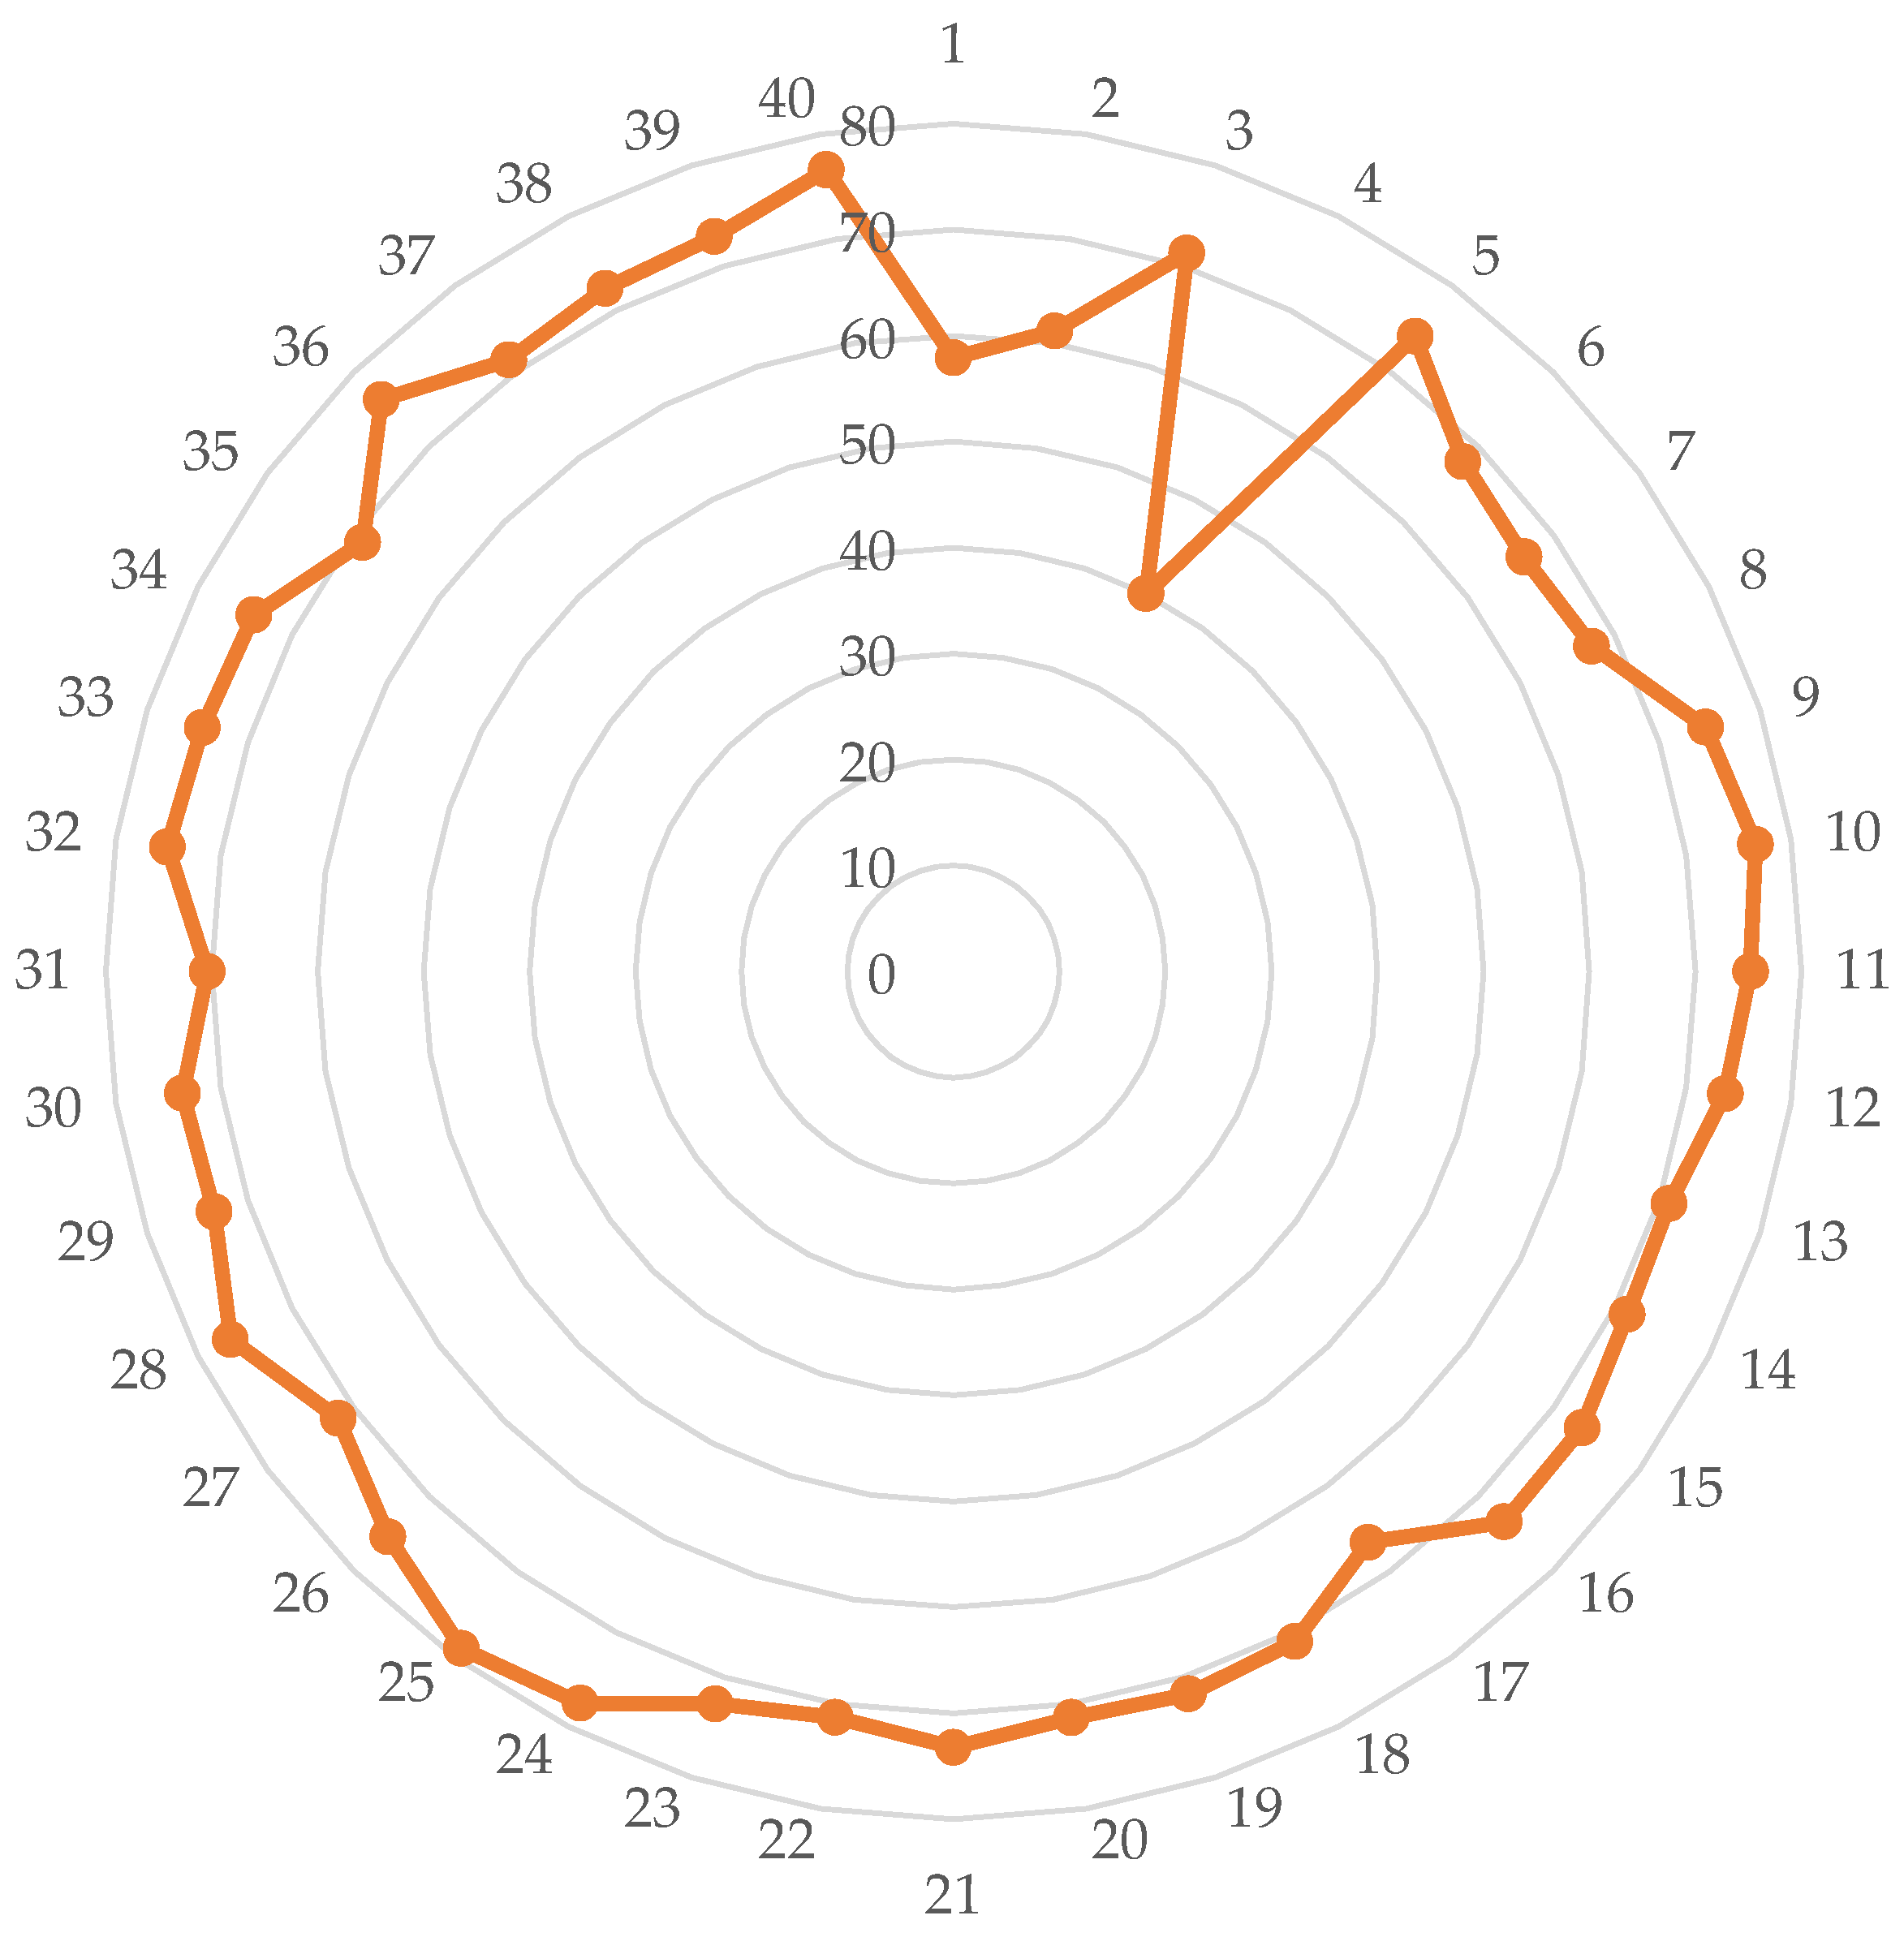
Another graphical representation, Figure 12, shows the maximum power point voltage and open-circuit voltage of the forty PV modules. This graph shows that as the maximum power voltage increases, the open-circuit voltage also increases. When the maximum power voltage decreases, the open-circuit voltage also decreases. The module output power is directly proportional to two of these six parameters: Imp and Isc. As a result, Figure 13 plots these two parameters (Imp and Isc) for this dataset of 10 W modules. Figure 14 illustrates a spider diagram comparing fill factors across 40 different datasets of 10 W PV modules. This data analysis can optimize the solar array power, find the degradation rate in specific periods, and identify the degradation factors.
The output power can also be observed for the performance analysis of the old photovoltaic module. The bar chart shows the output power of the forty 10 W PV modules in Figure 15. Figure 15 demonstrates that the maximum number of PV modules provides an output power below its rated power due to the different types of faults on the module surface. For this type of degradation factor, the output power of the PV modules was degraded. Some PV modules provided output power above their rating due to the lower fault quantity on the PV surface, variations in irradiance and module temperature, as well as positive manufacturing tolerances, and this behavior is commonly reported in field measurements and does not indicate any anomaly in the data acquisition process. The graph shows the maximum output power supplied by module number 1612E020048 and the minimum power provided by module number 1612E020004.
The dataset contains a single Excel sheet with forty-one separate sheets. The module number renamed the sheet numbers from one to forty. Sheet 1 includes two types of data: STC and OPC. STC standard is used for the standard test condition, and the OPC standard is used for the operation condition. The data was tested at 1000 W/m2 of light intensity and 25 °C temperature in the standard test conditions. The operation condition (OPC) maintained the environmental temperature when the PV panel was tested. Additionally, the Excel sheet contains four graphical representations: I–V (current vs. voltage) and P–V (power vs. voltage) for OPC and STC, as well as sheets 02 to 40. Sheet 41 contains the necessary table and graphs, renamed as the graph and 137 table. The table included the PV output’s electrical parameters, which are individual and average open-circuit voltage, average short-circuit current, average maximum power voltage, average maximum power current, average maximum power, and average fill factor (FF) for 40 PV panels.
The Excel data sheet also includes a graphical representation of the module’s output power, a comparison between the open-circuit voltage and the maximum power voltage, and the individual module’s short-circuit current and maximum power current. In addition, a graphical representation of the fill factor for individual modules was drawn.

5. Discussion

The present study provides a comprehensive dataset describing the electrical and visual condition of 10 W PV modules after four years of outdoor exposure. Visual inspection indicates that all modules exhibit pre-hotspot development and discoloration, signs of systematic deterioration caused by prolonged exposure to UV light, humidity, and temperature cycling. Pre-hotspots exhibit localized resistive heating that may hasten long-term damage, while discoloration reduces optical transmittance and current generation. Soiling significantly impacts PV performance, as evidenced by persistent dust on over half of the modules. Short-circuit current and total power output are directly affected by dust accumulation, which reduces the incident irradiance on the module surface. This research highlights the need for routine maintenance and cleaning, especially in dust-prone areas. The relatively high standard deviation observed in the measured electrical parameters indicates significant variability in module performance after long-term outdoor exposure. This variation can be attributed to several factors, including inherent manufacturing tolerances, microenvironmental differences such as non-uniform dust deposition and partial shading, and the presence of diverse degradation mechanisms (e.g., corrosion, discoloration, and back sheet damage). These factors collectively contribute to heterogeneous aging behavior among the modules. After four years of outdoor operation, the 40 PV modules recorded maximum power output, with values ranging from 5.67 W to 11.21 W, indicating substantial performance variability. A sizable portion exhibits significant power deterioration, with several modules outputting less than 9 W and one module dropping to around 5.67 W, even while a considerable portion of modules continue to function near or slightly over their nominal 10 W rating. Deviations from conventional test environments, such as higher irradiation levels and lower module temperatures during measurement, as well as positive manufacturing tolerances, might be responsible for power values exceeding the specified capacity. On the other hand, the presence of severely damaged modules indicates the impact of localized degradation processes and non-uniform aging. Although the dataset is derived from PV modules operating under the environmental conditions of Dhaka, the findings are broadly relevant to other tropical regions with similar climatic characteristics. However, variations in pollution levels, humidity, and local environmental factors may influence the magnitude of degradation. Therefore, direct quantitative extrapolation should be approached with caution, and the dataset is best utilized for comparative and model validation purposes. From a maintenance perspective, the high prevalence of dust and surface-related degradation suggests that regular cleaning and periodic inspection are essential to sustaining performance, particularly in environments like Dhaka, characterized by high humidity and particulate concentrations. Although the dataset is location-specific and represents a cross-sectional assessment without installation-time baseline data, the identified degradation mechanisms are broadly applicable to other tropical regions, while the dataset itself provides valuable input for degradation modeling, reliability assessment, and the development of AI-based fault detection systems, thereby serving as a useful benchmark for future studies.

6. Conclusions

This study investigated the long-term performance characteristics of photovoltaic (PV) modules under outdoor environmental conditions. The experimental measurements were conducted on 40 PV modules rated at 10 W, and their electrical performance was analyzed via current–voltage (I–V) characterization with a portable solar analyzer. The visual results showed that most of the panels exhibited cell discoloration and pre-hotspots, and the electrical results indicated an average maximum power output of 9.85 W for the tested modules, with an average fill factor of 0.713, indicating a slight reduction relative to the rated capacity. The standard deviation of 0.939 W indicates variation in power output among the modules, which may be attributed to environmental exposure, aging, and surface contamination, such as dust accumulation. The experimental setup provided practical insights into PV module performance under typical tropical climatic conditions. Outdoor climate factors significantly influence PV efficiency and long-term reliability. The findings of this study highlight the importance of integrating both electrical and visual monitoring for effective maintenance of PV modules. Significant dust accumulation over several modules indicates that frequent cleaning is necessary to reduce current losses. Visual faults, such as discoloration, can also serve as early warning signs of long-term deterioration, particularly regarding fill factor and maximum power output. Corrosion further highlights the necessity of preventive maintenance in humid conditions, including inspections of electrical contacts and module edges. As a result, it is advisable to use key performance metrics, including Pmax, fill factor, and short-circuit current, as useful indicators for evaluating module health over time. Overall, the findings highlight the importance of regular monitoring and maintenance, particularly cleaning strategies to maintain optimal PV performance. The dataset and analysis presented in this study can contribute to a better understanding of PV module degradation behavior and support improved design, operation, and maintenance strategies for solar energy systems in similar climatic regions.

Author Contributions

Conceptualization, A.A.M.; methodology, M.S.A., S.A.H., M.I.I., K.I.U.A. and M.F.K.; software, M.S.A. and S.A.H.; formal analysis, M.S.A. and S.A.H.; investigation, A.A.M., M.I.I., K.I.U.A. and M.F.K.; resources, A.A.M., M.S.A., S.A.H., M.I.I., K.I.U.A. and M.F.K.; data curation, M.S.A. and S.A.H.; writing—original draft preparation, A.A.M., M.S.A., S.A.H., M.I.I., K.I.U.A. and M.F.K.; writing—review and editing, A.A.M., K.I.U.A. and M.F.K.; supervision, A.A.M., K.I.U.A. and M.F.K.; project administration, K.I.U.A. and M.F.K.; funding acquisition, A.A.M., K.I.U.A. and M.F.K. All authors have read and agreed to the published version of the manuscript.

Funding

This research received no external funding.

Institutional Review Board Statement

Not Applicable.

Informed Consent Statement

Not Applicable.

Data Availability Statement

Available at https://doi.org/10.7910/DVN/Q56G63 (accessed on 21 August 2024).

Conflicts of Interest

The authors declare that they have no known competing financial interests or personal relationships that could have appeared to influence the work reported in this paper.

References

  1. Maciel, J.N.; Ledesma, J.J.G.; Ando Junior, O.H. Dataset for Machine Learning: Explicit All-Sky Image Features to Enhance Solar Irradiance Prediction. Data 2024, 9, 113. [Google Scholar] [CrossRef]
  2. Shen, J.; Han, B.-G.; Kim, J.-M.; Choi, S.-M.; Kim, K.-H.; Lee, H.-D.; Tae, D.-H.; Rho, D.-S. Degradation Evaluation Method with a Test Device for Aging Diagnosis in PV Modules. Energies 2022, 15, 3851. [Google Scholar] [CrossRef]
  3. Singh, R.; Sharma, M.; Yadav, K. Degradation and Reliability Analysis of Photovoltaic Modules after Operating for 12 Years: A Case Study with Comparisons. Renew. Energy 2022, 196, 1170–1186. [Google Scholar] [CrossRef]
  4. Rahman, T.; Mansur, A.A.; Lipu, M.S.H.; Rahman, M.S.; Ashique, R.H.; Houran, M.A.; Elavarasan, R.M.; Hossain, E. Investigation of Degradation of Solar Photovoltaics: A Review of Aging Factors, Impacts, and Future Directions toward Sustainable Energy Management. Energies 2023, 16, 3706. [Google Scholar] [CrossRef]
  5. Quansah, D.A.; Adaramola, M.S. Ageing and Degradation in Solar Photovoltaic Modules Installed in Northern Ghana. Sol. Energy 2018, 173, 834–847. [Google Scholar] [CrossRef]
  6. Bouaichi, A.; Logerais, P.-O.; El Amrani, A.; Ennaoui, A.; Messaoudi, C. Comprehensive Analysis of Aging Mechanisms and Design Solutions for Desert-Resilient Photovoltaic Modules. Sol. Energy Mater. Sol. Cells 2024, 267, 112707. [Google Scholar] [CrossRef]
  7. Kim, J.; Rabelo, M.; Padi, S.P.; Yousuf, H.; Cho, E.-C.; Yi, J. A Review of the Degradation of Photovoltaic Modules for Life Expectancy. Energies 2021, 14, 4278. [Google Scholar] [CrossRef]
  8. Özkalay, E.; Virtuani, A.; Eder, G.; Voronko, Y.; Bonomo, P.; Caccivio, M.; Ballif, C.; Friesen, G. Correlating Long-Term Performance and Aging Behaviour of Building Integrated PV Modules. Energy Build. 2024, 316, 114252. [Google Scholar] [CrossRef]
  9. Lillo-Sánchez, L.; López-Lara, G.; Vera-Medina, J.; Pérez-Aparicio, E.; Lillo-Bravo, I. Degradation Analysis of Photovoltaic Modules after Operating for 22 Years. A Case Study with Comparisons. Sol. Energy 2021, 222, 84–94. [Google Scholar] [CrossRef]
  10. Rahman, T.; Mansur, A.A.; Islam, S.; Islam, M.I.; Sahin, M.; Awal, M.R.; Shihavuddin, A.; Ul Haq, M.A. Effects of Aging Factors on PV Modules Output Power: An Experimental Investigation. In Proceedings of the 2022 4th International Conference on Sustainable Technologies for Industry 4.0 (STI), Dhaka, Bangladesh, 17–18 December 2022; pp. 1–5. [Google Scholar]
  11. Kaplanis, S.; Kaplani, E. Energy Performance and Degradation over 20 Years Performance of BP C-Si PV Modules. Simul. Model. Pract. Theory 2011, 19, 1201–1211. [Google Scholar] [CrossRef]
  12. Kazem, H.A.; Chaichan, M.T.; Al-Waeli, A.H.A.; Sopian, K. Evaluation of Aging and Performance of Grid-Connected Photovoltaic System Northern Oman: Seven Years’ Experimental Study. Sol. Energy 2020, 207, 1247–1258. [Google Scholar] [CrossRef]
  13. Bouraiou, A.; Hamouda, M.; Chaker, A.; Neçaibia, A.; Mostefaoui, M.; Boutasseta, N.; Ziane, A.; Dabou, R.; Sahouane, N.; Lachtar, S. Experimental Investigation of Observed Defects in Crystalline Silicon PV Modules under Outdoor Hot Dry Climatic Conditions in Algeria. Sol. Energy 2018, 159, 475–487. [Google Scholar] [CrossRef]
  14. Eder, G.C.; Voronko, Y.; Hirschl, C.; Ebner, R.; Újvári, G.; Mühleisen, W. Non-Destructive Failure Detection and Visualization of Artificially and Naturally Aged PV Modules. Energies 2018, 11, 1053. [Google Scholar] [CrossRef]
  15. Liu, Y.; Wu, Y. Fault Diagnosis of Photovoltaic Modules: A Review. Sol. Energy 2025, 293, 113489. [Google Scholar] [CrossRef]
  16. Alimi, O.A.; Meyer, E.L.; Olayiwola, O.I. Solar Photovoltaic Modules’ Performance Reliability and Degradation Analysis—A Review. Energies 2022, 15, 5964. [Google Scholar] [CrossRef]
  17. Bansal, N.; Pany, P.; Singh, G. Visual Degradation and Performance Evaluation of Utility Scale Solar Photovoltaic Power Plant in Hot and Dry Climate in Western India. Case Stud. Therm. Eng. 2021, 26, 101010. [Google Scholar] [CrossRef]
  18. Al Mansur, A.; Islam, M.I.; Alam, M.S.; Jadin, M.S.; Sultana, Z.; Ali, M.N.; Shihavuddin, A.S.M. Optimizing Photovoltaic Arrays: A Tested Dataset of Newly Manufactured PV Modules for Data-Driven Analysis and Algorithm Development. Data Brief 2024, 54, 110482. [Google Scholar] [CrossRef] [PubMed]
Figure 1. Degradation modes of silicon PV modules for the last 10 years [7].
Data 11 00118 g001
Figure 2. Common electrical- and cell-level PV module defects [15].
Data 11 00118 g002
Figure 3. Classification of common module-level PV module defects [15].
Data 11 00118 g003
Figure 4. Experimental investigation location of this study.
Data 11 00118 g004
Figure 5. Graphical representation of the methodological process.
Data 11 00118 g005
Figure 6. Experimental setup of electrical data collection using an I–V tracer.
Data 11 00118 g006
Figure 7. Detected faults on the tested solar panels under old conditions.
Data 11 00118 g007
Figure 8. Statistical analysis of the detected visual faults of forty PV modules.
Data 11 00118 g008
Figure 9. Electrical characteristics of the mostly degraded panel (1612E020004).
Data 11 00118 g009
Figure 10. Electrical characteristics of the less degraded panel (1612E020048).
Data 11 00118 g010
Figure 11. Fill factor of PV module [18].
Data 11 00118 g011
Figure 12. The maximum power point voltage and open-circuit voltage for all of the tested modules.
Data 11 00118 g012
Figure 13. Maximum power point current and short-circuit current for all of the tested modules.
Data 11 00118 g013
Figure 14. Comparison of the fill factor of 10 W photovoltaic modules.
Data 11 00118 g014
Figure 15. Comparison of the output power of all tested PV modules under old conditions.
Data 11 00118 g015
Table 1. Specifications table of the experimental data.
SubjectRenewable Energy, Sustainability, and the Environment
Specific subject areaSolar photovoltaic system.
Type of dataTable, image, graph, and figure.
Data collectionThe dataset of polycrystalline PV modules was collected under outdoor test conditions. The modules were installed on the rooftop of a five-story building, where 40 PV modules with 10 W of rated power were installed. Every panel was tested by maintaining the outdoor test standards using an I–V Tracer, PROVA 1011. The electrical characteristics for every photovoltaic module that has been tested include maximum power, maximum voltage, maximum current, open-circuit voltage, short-circuit current, and fill factor.
Data source locationLocation: Mirpur.
City: Dhaka.
Country: Bangladesh.
Latitude and longitude: (23.796165, 90.356758).
Resource availability Repository name: Harvard Dataverse.
Data identification number: https://doi.org/10.7910/DVN/Q56G63
Direct URL to data: https://dataverse.harvard.edu/dataset.xhtml?persistentId=doi:10.7910/DVN/Q56G63 (accessed on 21 August 2024).
Data accessibilityWith the article.
Table 2. Specifications table of the tested PV modules and I–V Tracer.
Photovoltaic PanelSchematic
ParametersUnitNameplate ValueData 11 00118 i001
Open-circuit voltage (Voc)V10.44
Short-circuit current (Isc)A1.34
Maximum power output (Pmax)W10.00
Voltage at MPP (Vmpp)V8.68
Current at MPP (Impp)A1.17
Nominal operating voltageV6.00
Maximum system voltageV600
Commercial I–V Tracer
ParametersMeasurement RangeMeasurement AccuracyData 11 00118 i002
Voltage measurement (Volt)1–1000±1%
Current measurement (Amp)0.1–12±1%
Irradiance (W/m2)0–2000±3%
Temperature (°C)−22 to +85±1%
Table 3. The image-based fault detection of the 10 W 40 Photovoltaic modules over four years.
Sl.PV Panel No.Detected Visual Faults
11612E020001Back sheet damage, corrosion, discoloration, and pre-hotspots
21612E020002Corrosion, permanent dust, back sheet damage, discoloration, and pre-hotspots
31612E020003Corrosion, discoloration, and pre-hotspots
41612E020004Corrosion, surface scratch, permanent dust, discoloration, and pre-hotspots
51612E020005Corrosion, discoloration, and pre-hotspots
61612E020006Discoloration and pre-hotspots
71612E020007Corrosion, permanent dust, back sheet damage, discoloration, and pre-hotspots
81612E020008Discoloration and pre-hotspots
91612E020009Back sheet damage, discoloration, and pre-hotspots
101612E020010Permanent dust, back sheet damage, discoloration, and pre-hotspots
111612E020011Discoloration and pre-hotspots
121612E020012Surface scratch, permanent dust, discoloration, and pre-hotspots
131612E020013Permanent dust, back sheet damage, discoloration, and pre-hotspots
141612E020014Corrosion, permanent dust, back sheet damage, discoloration, and pre-hotspots
151612E020015Discoloration and pre-hotspots
161612E020017Corrosion, permanent dust, back sheet damage, discoloration, and pre-hotspots
171612E020020Permanent dust, discoloration, and pre-hotspots
181612E020021Permanent dust, discoloration, and pre-hotspots
191612E020023Permanent dust, discoloration, and pre-hotspots
201612E020025Permanent dust, back sheet damage, discoloration, and pre-hotspots
211612E020026Back sheet damage, discoloration, and pre-hotspots
221612E020027Permanent dust, discoloration, and pre-hotspots
231612E020028Corrosion, back sheet damage, discoloration, and pre-hotspots
241612E020029Surface scratch, corrosion, discoloration, and pre-hotspots
251612E020030Back sheet damage, discoloration, and pre-hotspots
261612E020031Discoloration and pre-hotspots
271612E020032Discoloration and pre-hotspots
281612E020033Discoloration and pre-hotspots
291612E020034Back sheet damage, discoloration, and pre-hotspots
301612E020035Permanent dust, discoloration, and pre-hotspots
311612E020036Discoloration and pre-hotspots
321612E020037Back sheet damage, discoloration, and pre-hotspots
331612E020038Permanent dust, discoloration, and pre-hotspots
341612E020039Permanent dust, corrosion, discoloration, and pre-hotspots
351612E020040Surface scratch, permanent dust, discoloration, and pre-hotspots
361612E020041Permanent dust, discoloration, and pre-hotspots
371612E020042Surface scratch, permanent dust, discoloration, and pre-hotspots
381612E020044Discoloration and pre-hotspots
391612E020046Discoloration and pre-hotspots
401612E020048Discoloration and pre-hotspots
Table 4. The average value and standard deviation of the output parameters of 10 W PV modules.
Module Rating Open-Circuit Voltage Voc (V)Short-Circuit Current
Isc (A)
Maximum Power Voltage
Vmp (V)
Maximum Power Current
Imp (A)
Maximum Power
Pm (W)
Fill Factor
10 WAvg.10.6431.2958.4121.1679.8500.713
SD0.1950.0250.5030.0640.9390.065
Disclaimer/Publisher’s Note: The statements, opinions and data contained in all publications are solely those of the individual author(s) and contributor(s) and not of MDPI and/or the editor(s). MDPI and/or the editor(s) disclaim responsibility for any injury to people or property resulting from any ideas, methods, instructions or products referred to in the content.