2. Data Description
This dataset contains a collection of high-resolution images designed to develop, test, and benchmark raw fabric defect detection algorithms. To ensure the robustness and generalizability of such methods, the fabrics used for image acquisition were collected from several different manufacturers, thereby introducing necessary variability in key characteristics such as texture, yarn thickness, thread density, and weave pattern.
To ensure a highly controlled experimental baseline, all acquisitions were performed on a standardized commodity fabric sourced from diverse manufacturers. Specifically, the base material consists of 100% cotton with a plain weave structure, featuring typical baseline parameters of approximately 9 threads/cm (warp) and 20 picks/cm (weft) using Ne 24/2 yarn. Sourcing this baseline specification from multiple suppliers introduces critical real-world intra-class variability, such as subtle loom tension differences and yarn batch variations, without confounding the anomaly detection algorithms with entirely different material architectures.
Furthermore, in the textile manufacturing pipeline, raw fabrics are systematically inspected prior to dyeing, printing, or finishing processes. Identifying structural anomalies at this early stage is critical to prevent the propagation of defects and avoid unnecessary chemical, environmental, and economic costs. Consequently, this dataset intentionally focuses on single-channel grayscale images to capture uncolored, structural defects, strictly reflecting this primary stage of industrial quality control.
All data are provided as 8-bit grayscale PNG images. The high-resolution images are stored in the images directory, having been cropped exclusively to remove non-fabric dark borders. This directory contains a total of 709 images, encompassing both defective and defect-free samples. The masks folder contains the 204 corresponding pixel-level ground truth binary masks for the defective images, sharing the exact same filenames as their associated samples. All high-resolution images have a final cropped resolution of 1792 × 1024 pixels, originally captured with a spatial resolution of 4 pixels per millimetre. The binary masks use two intensity values: 0 for non-defective background areas and 255 for defective regions. Under our expert protocol, a defect is defined as any structural or tonal deviation from the normative plain weave. These are primarily local anomalies (such as broken threads, holes, weaving knots, and fluid stains) rather than large-scale global deformations. To avoid the subjectivity inherent to ambiguous borderline cases, and to explicitly align RAW-FABRID with the prevailing Unsupervised Anomaly Detection (UAD) paradigm (e.g., the MVTec AD benchmark), the ground truth annotations are provided strictly as binary labels (anomalous vs. normal pixels). In this industrial context, the primary objective is the precise localization of deviations from the normative weave, regardless of their specific etiology, which facilitates direct evaluation using standard anomaly segmentation metrics.
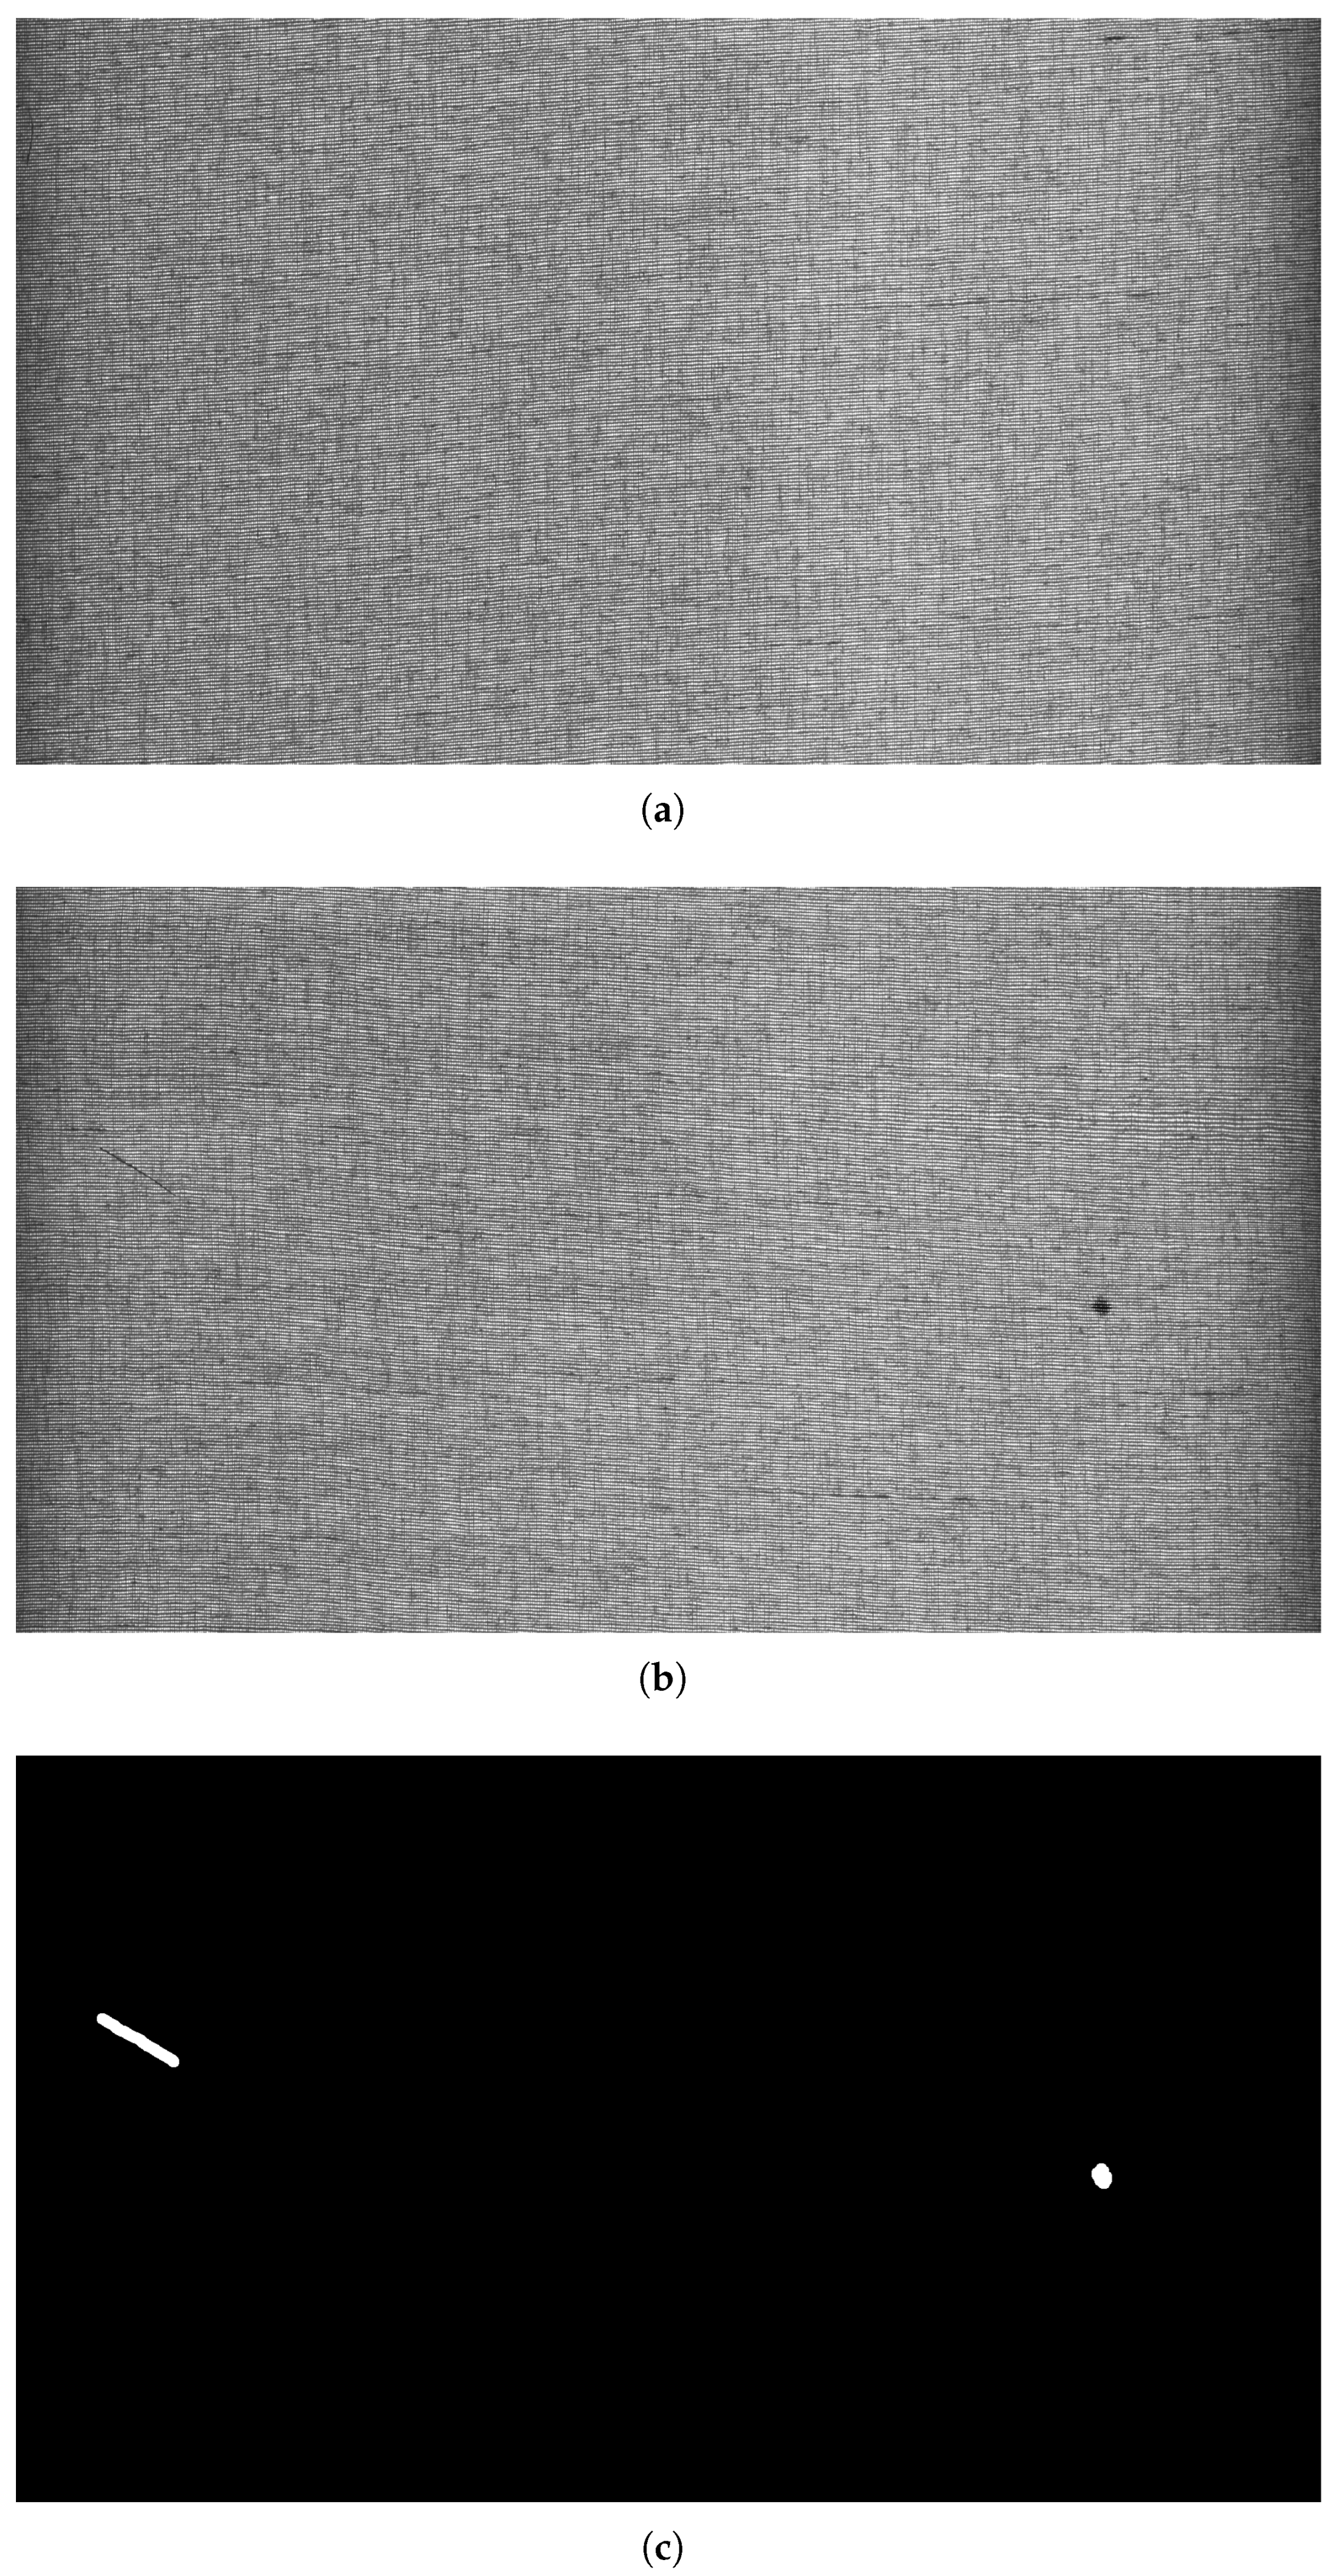
Representative examples of defect-free fabrics, defective samples, and their corresponding pixel-level ground truth masks are presented in
Figure 1. These examples illustrate the variability in fabric textures as well as the pixel-level annotation quality provided in the dataset.
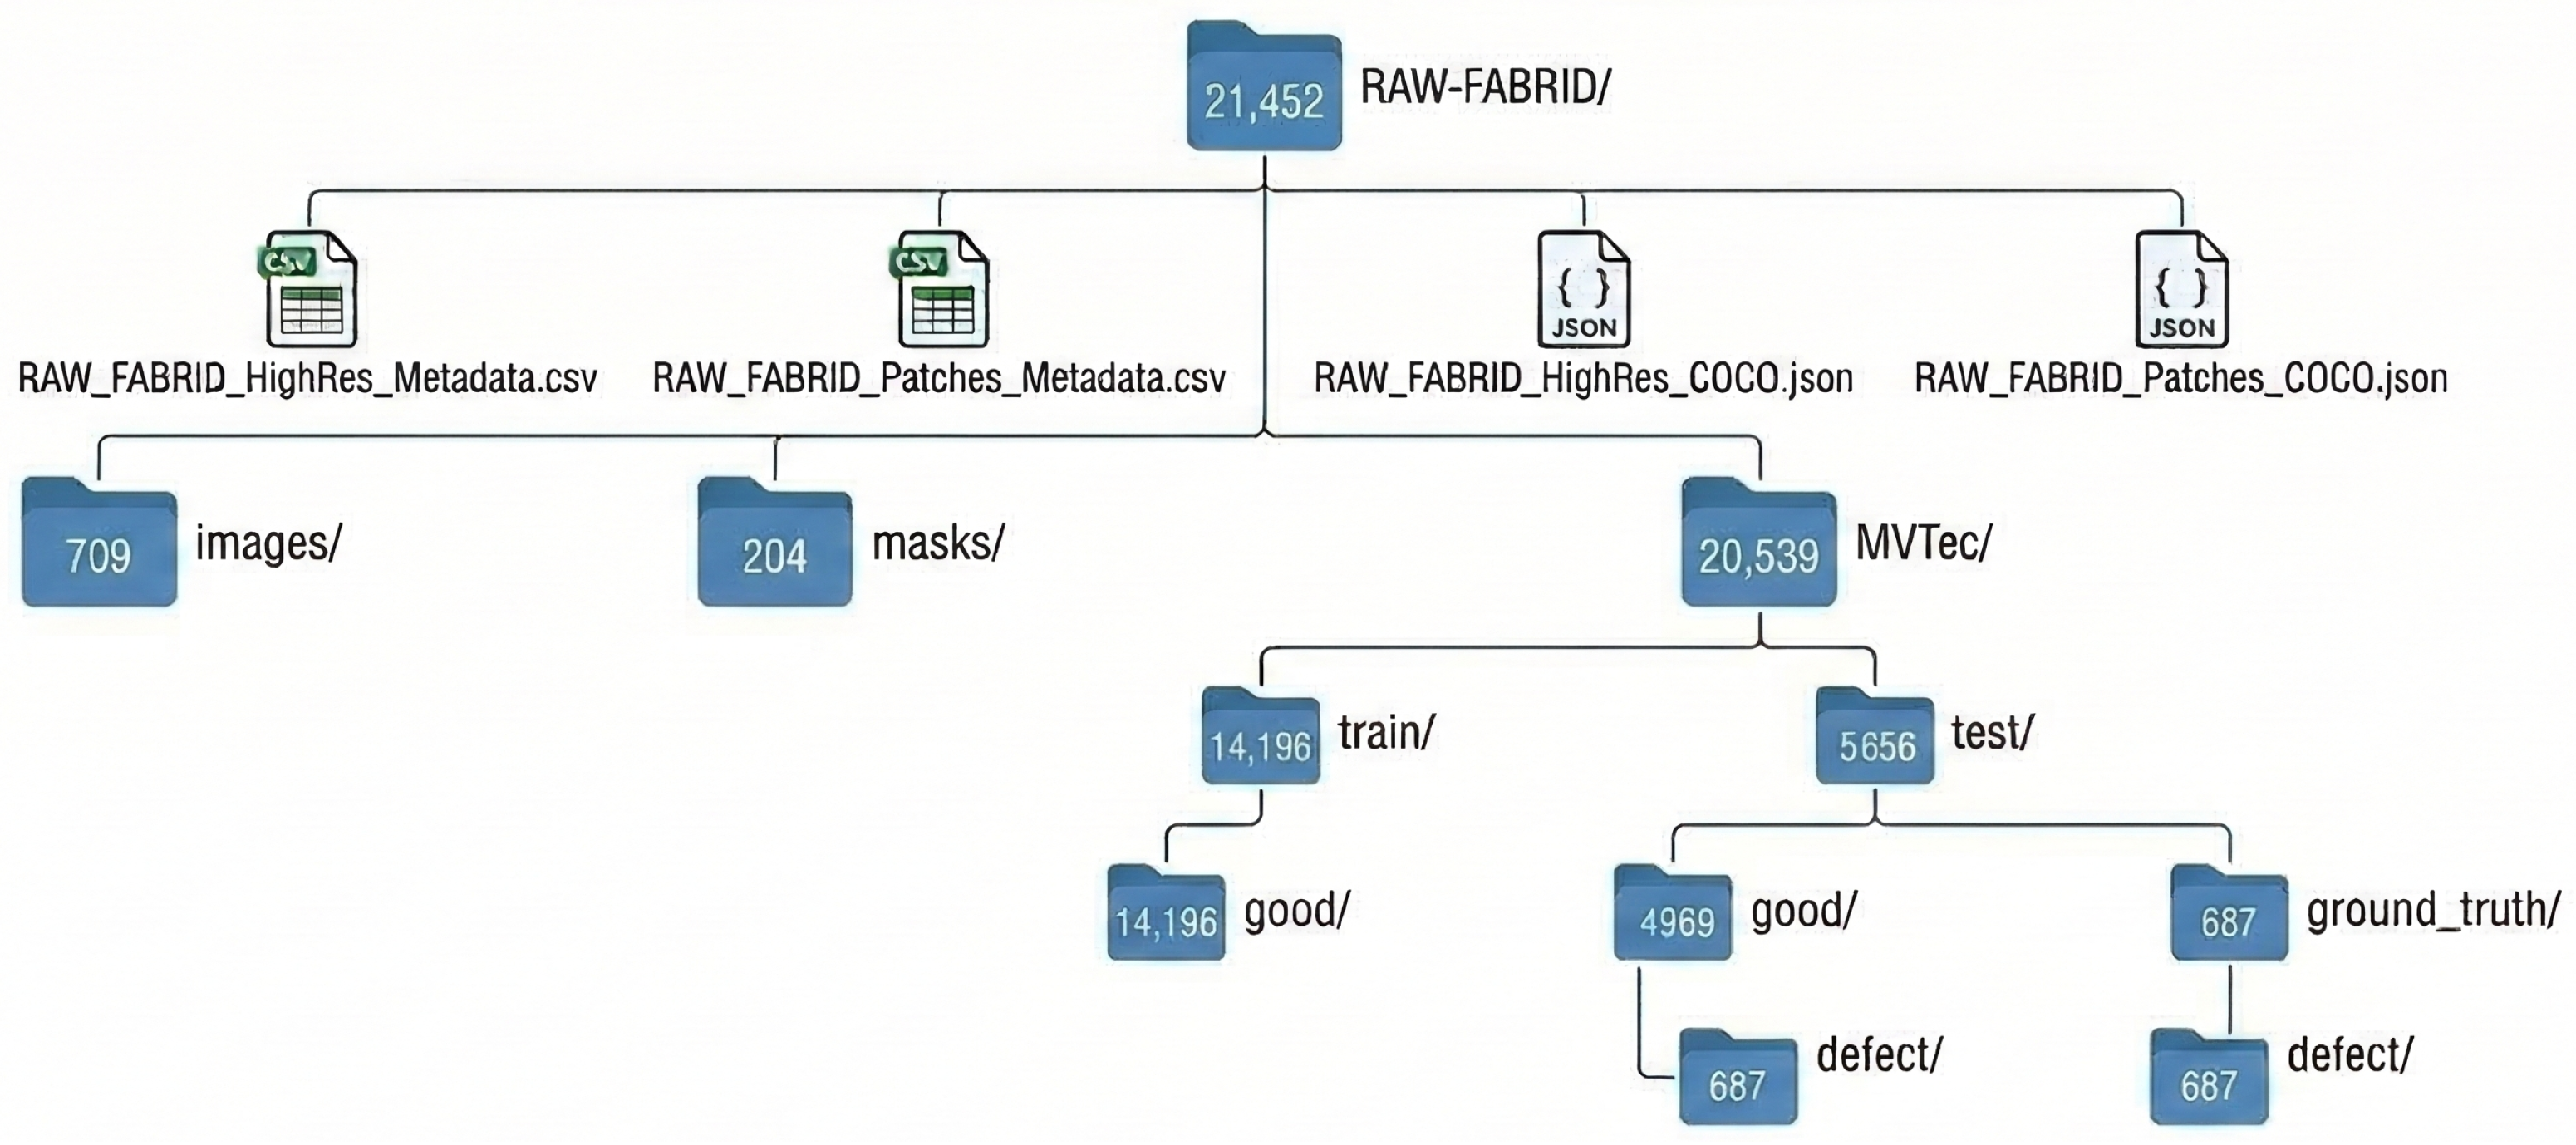
In addition to the high-resolution images, the dataset is also provided in a patch-based organization within the MVTec directory, following the standard folder structure adopted in the MVTec Anomaly Detection benchmark. The images are cropped into 256 × 256 pixel patches, enabling straightforward integration into existing anomaly detection frameworks and facilitating objective benchmarking. The train folder includes a good subfolder (14,196) containing only non-defective patches. The test folder contains two subfolders: good (4969) with non-defective patches, and defect (687) with defective patches. Additionally, the ground_truth folder includes a defect subfolder (687) storing the corresponding binary masks for the defective test images, maintaining identical filenames with the suffix _mask added before the .png extension. These pre-extracted patches are provided as a standardized convenience to ensure direct compatibility with common MVTec-style UAD data loaders. However, researchers are encouraged to utilize the provided high-resolution images to extract custom patch sizes and evaluate their optimal dimensions for specific neural network architectures.
To ensure structured data handling and facilitate reproducibility, four auxiliary files are included in the dataset root directory. Comprehensive metadata are provided in two separate comma-separated values (CSV) files:
RAW_FABRID_HighRes_Metadata.csv for the original high-resolution images, and
RAW_FABRID_Patches_Metadata.csv for the cropped MVTec dataset. Both files contain detailed information for each image or patch, including the filename, anonymized fabric origin ID, binary class label (good/defect), defect area, and number of defects per image. Furthermore, object detection and semantic segmentation annotations are supplied in two JSON files:
RAW_FABRID_HighRes_COCO.json and
RAW_FABRID_Patches_COCO.json. These files correspond to the high-resolution and patch-based datasets, respectively, and are formatted strictly as COCO-compatible JSON, defining precise bounding boxes and polygons [
7,
8]. Crucially, both the CSV and JSON files dedicated to the patch-based dataset explicitly map each 256 × 256 patch back to its original high-resolution source image, ensuring full data traceability.
To better position the novelty and contribution of RAW-FABRID within the existing literature,
Table 1 presents a comparative overview of several prominent public datasets used for textile defect detection. While pioneering databases like TILDA [
9] provided foundational benchmarks, their lower resolution and image-level annotations limit their applicability for modern, highly precise segmentation architectures. General industrial benchmarks such as MVTec AD [
6] offer excellent pixel-level annotations but rely on standard area-scan RGB cameras. Similarly, recent large-scale textile datasets such as ZJU-Leaper [
10] and Lusitano [
11], while providing significant data volume, either rely on area-scan sensors or lack dense pixel-level annotations. On the other hand, earlier works by our research group, such as the AFID dataset [
12], successfully introduced line-scan acquisition to reflect continuous manufacturing, yet utilized standard 8-bit images with multi-class defect annotations at a different resolution. RAW-FABRID differentiates itself by combining a line-scan acquisition modality with photometrically raw grayscale images at high resolution (
). Furthermore, providing pixel-level binary masks alongside COCO-format metadata ensures strong traceability and direct compatibility with prevailing Unsupervised Anomaly Detection (UAD) evaluation protocols.
In
Figure 2, the directory structure of the dataset is illustrated. Additionally,
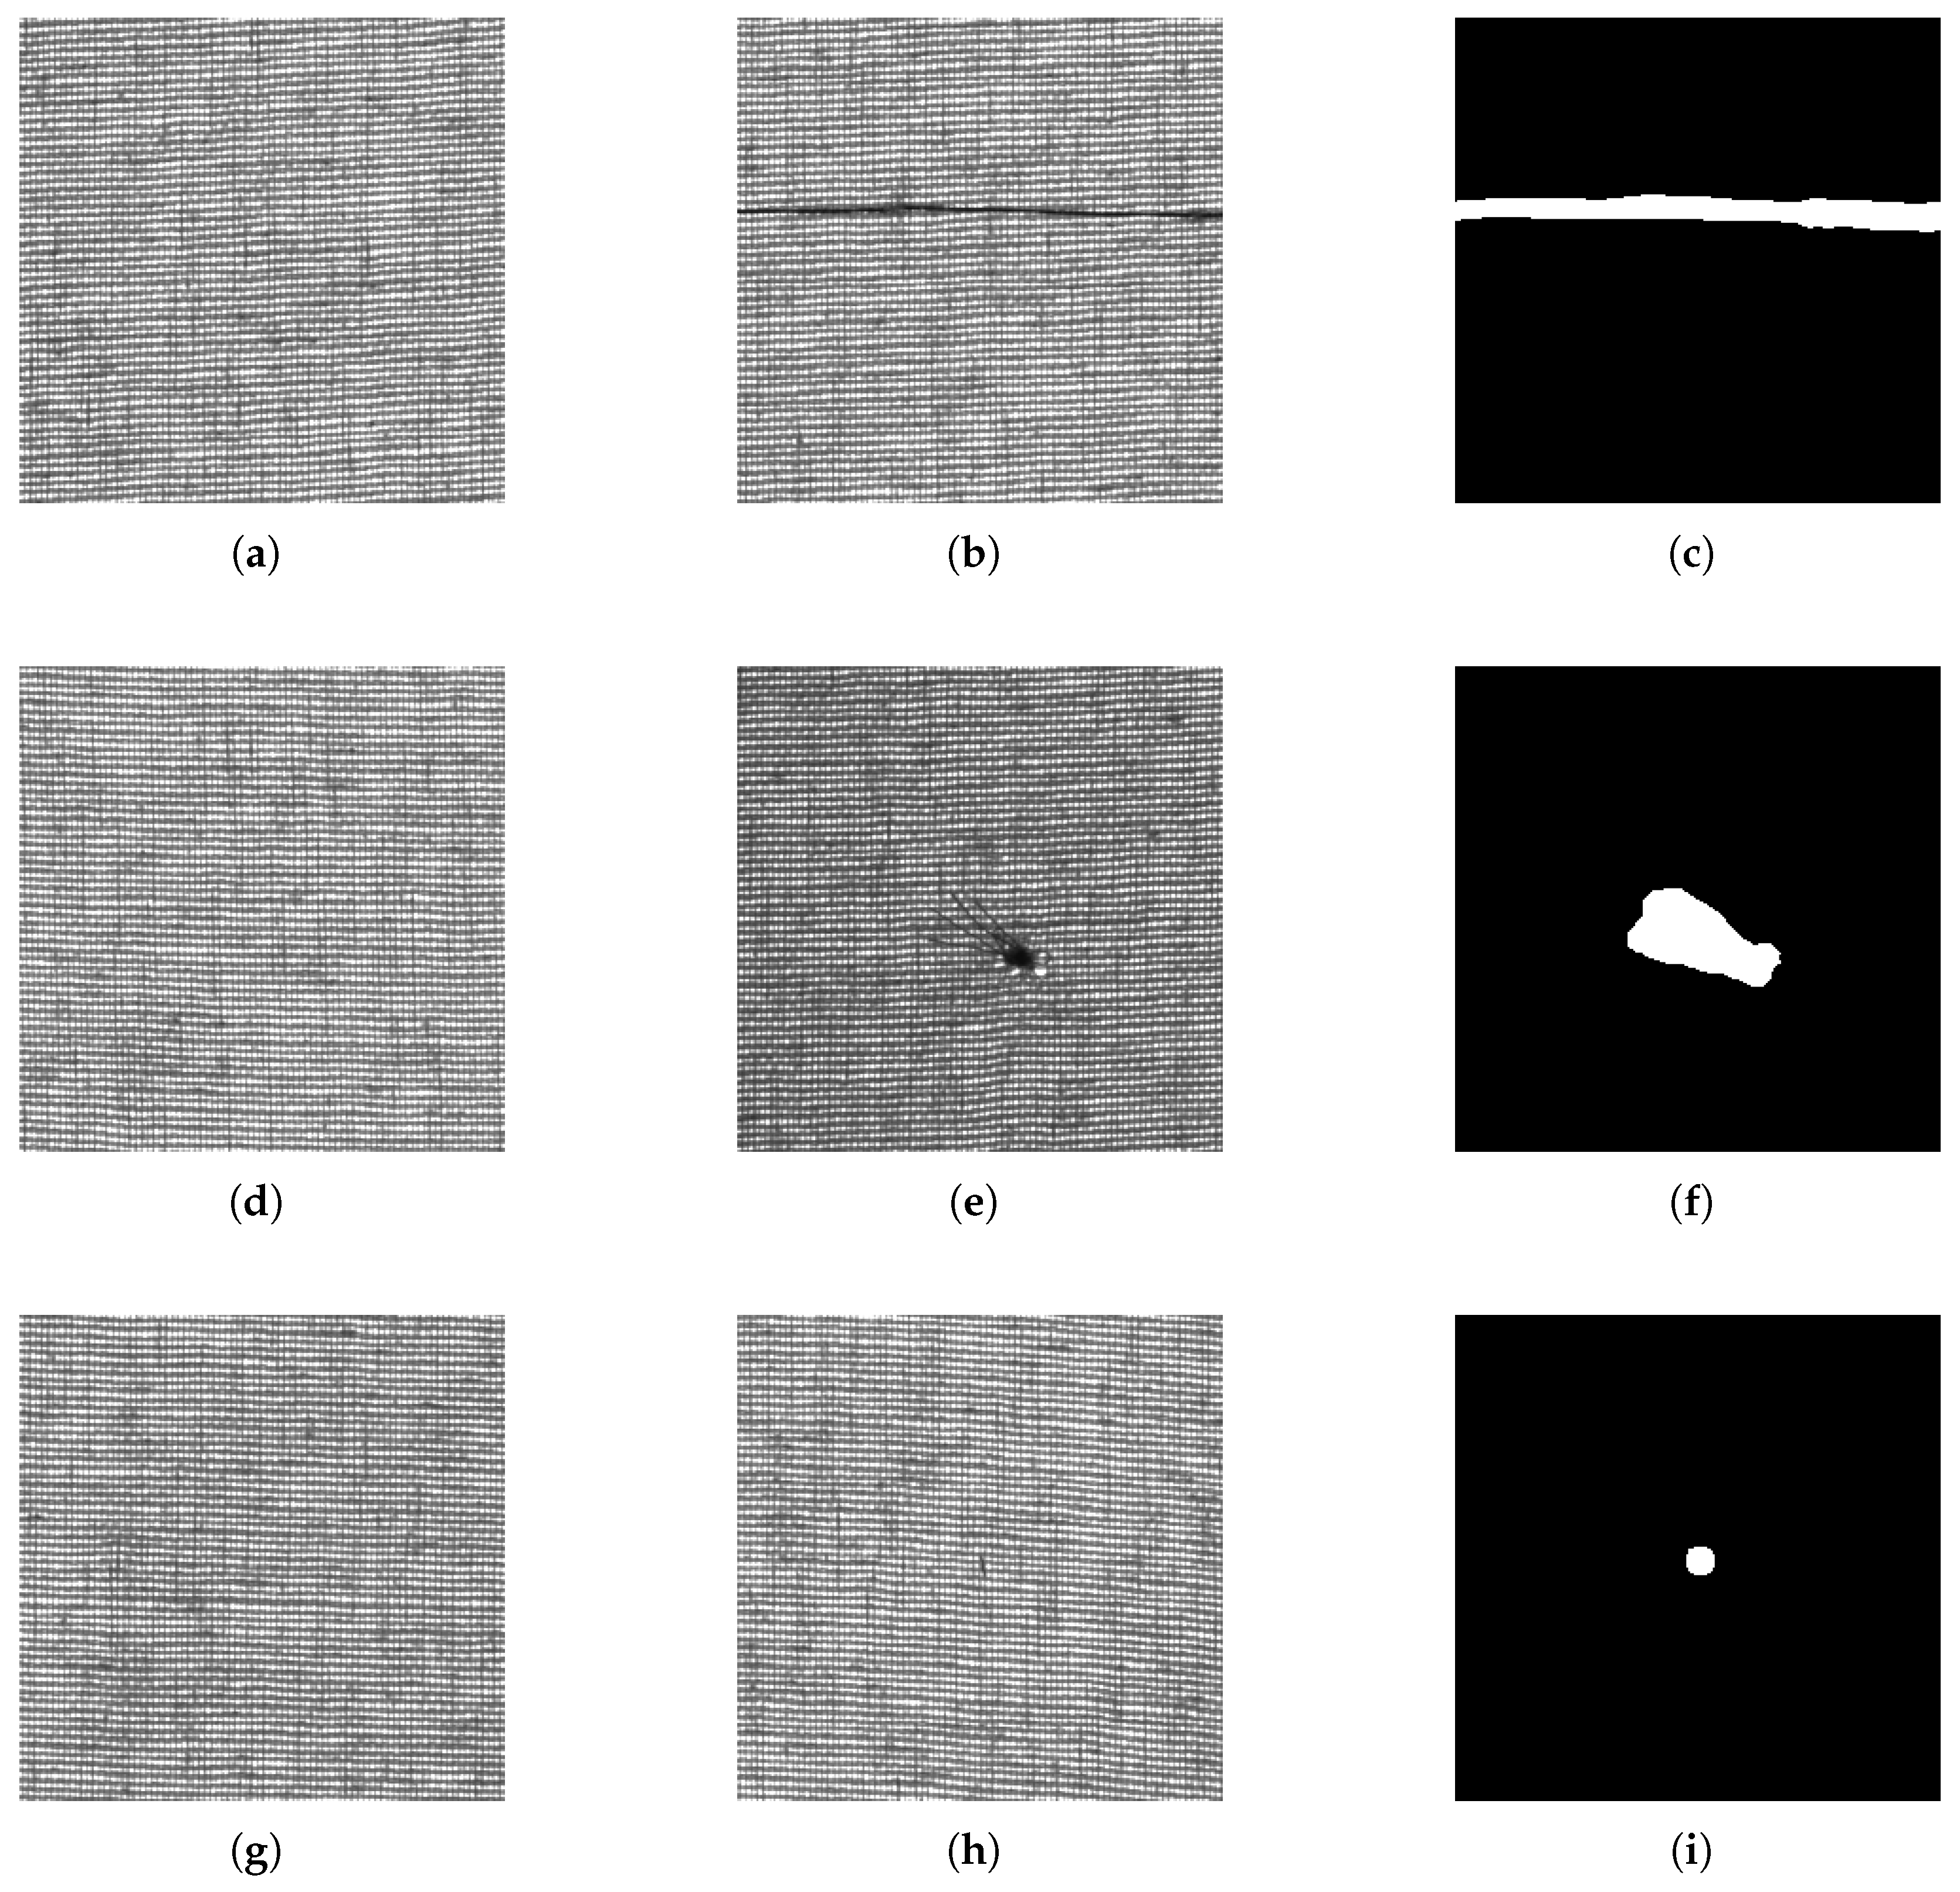
Table 2 provides a statistical summary of the image distribution across the high-resolution and patch-based subsets. Examples of cropped patches organized following the MVTec structure are shown in
Figure 3.
3. Methods
The generation of the RAW-FABRID dataset followed a comprehensive experimental pipeline comprised of four main stages: data acquisition, manual expert annotation, data preprocessing and organization, and patch-based formatting for benchmarking. Initially, fabric rolls sourced from diverse manufacturers were digitized using the custom-built high-speed inspection machine described in the Background section. Following acquisition, the resulting high-resolution grayscale images underwent rigorous manual inspection and subsequent validation by specialists to establish highly reliable pixel-level ground truth masks, alongside precise bounding box and polygon annotations for all defective samples. Finally, to support the dual data organization strategy highlighted in
Section 1, the annotated data were processed into two distinct formats: high-resolution 1792 × 1024 cropped images and standardized 256 × 256 patches organized according to the MVTec anomaly detection structure. The generation of comprehensive CSV metadata and COCO-compatible JSON files was integrated into this final stage to ensure full traceability. The specific hardware components, mechanical setup, and software procedures employed in each stage are detailed in the following subsections.
3.1. Data Acquisition System
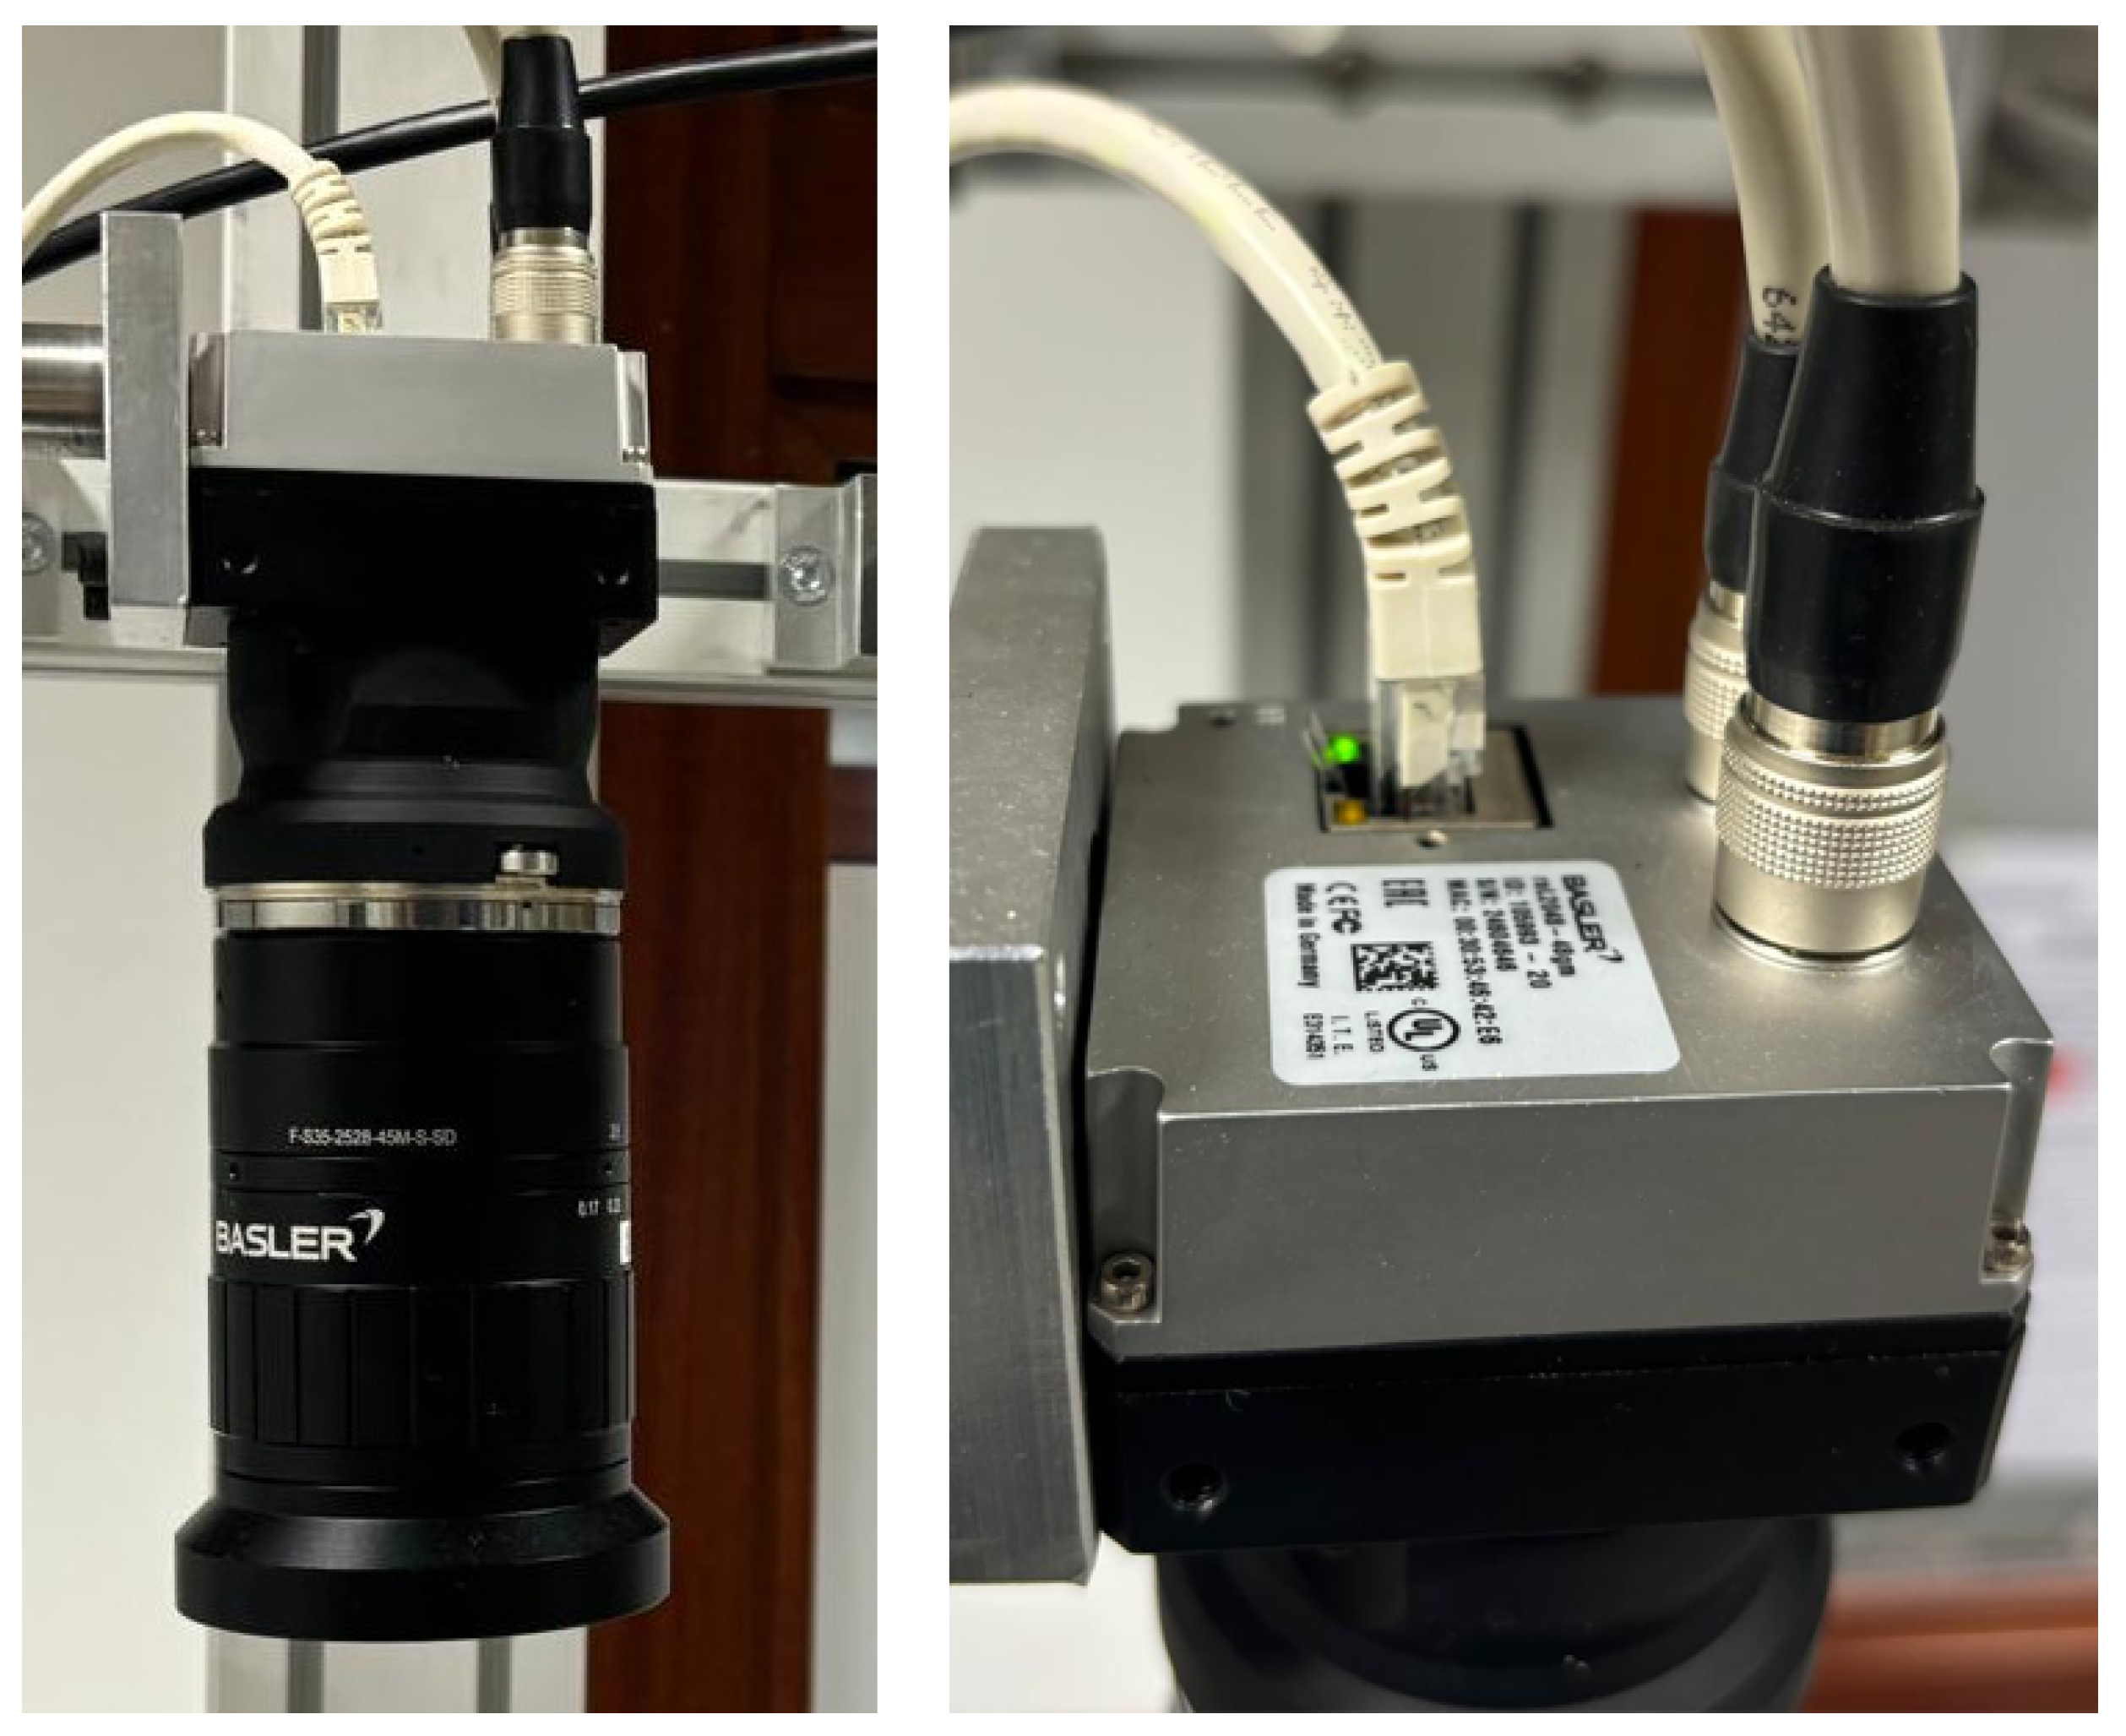
The image acquisition system employed a Basler raL2048-48gm line-scan camera model with a spatial resolution of 2048 pixels. This resolution was selected to adequately cover the inspected textile area in the custom-built inspection machine while maintaining sufficient spatial detail for defect detection. The sensor features a pixel size of . Inspection of larger fabric widths can be achieved by employing higher-resolution sensors or multiple cameras. In the case of using a much larger sensor, for example, an 8192-pixel model, the pixel size is typically reduced to , which implies lower light sensitivity, requiring significantly higher illumination intensity.
The camera operates at a maximum line rate of 51 kHz, which corresponds to fabric speeds exceeding 12 m/s at a spatial resolution of 4 pixels per millimetre, well above typical industrial textile inspection requirements. Image transmission is performed via a GigE interface, which provides sufficient bandwidth for real-time acquisition. The camera supports C-mount, F-mount, and M42 optics, allowing flexible lens selection depending on field of view and working distance requirements.
Figure 4 shows the Basler line-scan camera used in the acquisition system.
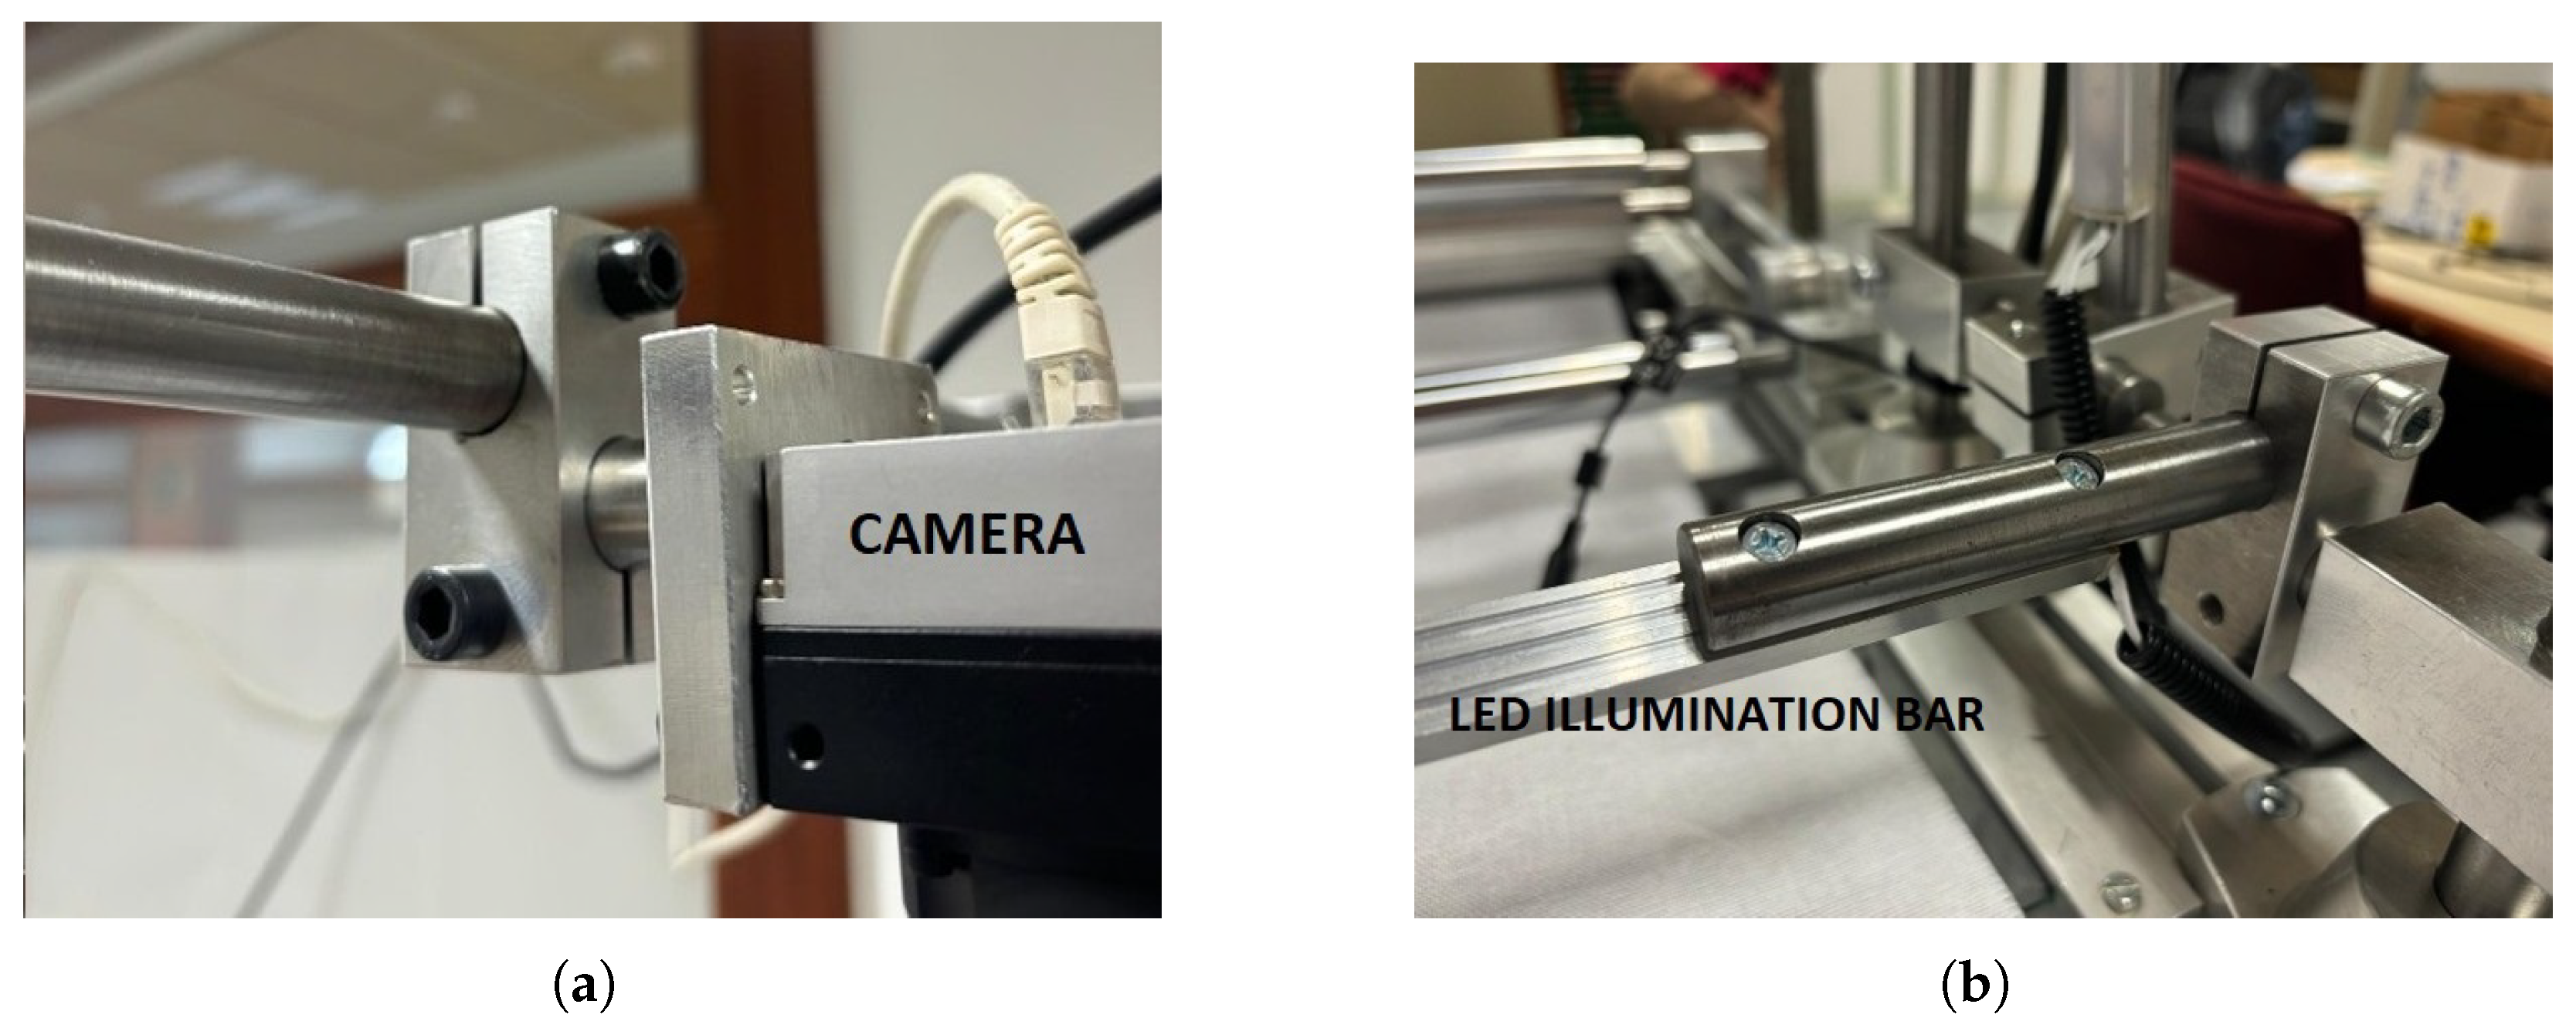
To ensure stable operation and flexible configuration, both the camera and illumination units were mounted on adjustable mechanical supports, as detailed in
Figure 5. Specifically,
Figure 5a shows the pan and tilt mechanisms that allow precise positioning of the camera relative to the fabric surface. A similar adjustable mechanism, presented in
Figure 5b, was implemented for the LED illumination bars, enabling control over both height and angle of incidence, which is critical for highlighting different types of surface defects. For the acquisition of this specific dataset, a dual illumination strategy was employed, activating both back and front lights. The front illumination bars were configured with an incidence angle of 45° and positioned at a working distance of 5 cm from the camera’s field of view.
The fabrics were transported through the inspection area in a controlled manner, while an encoder wheel synchronized the fabric motion with the line-scan camera acquisition to ensure a consistent spatial resolution across all captured images. This synchronization enabled precise line triggering and uniform sampling during image acquisition.
Following the acquisition phase, all captured high-resolution images underwent a rigorous manual quality control process supervised by domain experts. This step ensured that the dataset consists solely of samples with proper focus, adequate sharpness, and consistent illumination across the central region. Consequently, to standardize the data and systematically eliminate unavoidable peripheral shadowing or physical fraying at the roll edges, all approved images were systematically cropped to a final width of 1792 pixels. Any images exhibiting significant capture artifacts within this central region were entirely discarded prior to the annotation stage.
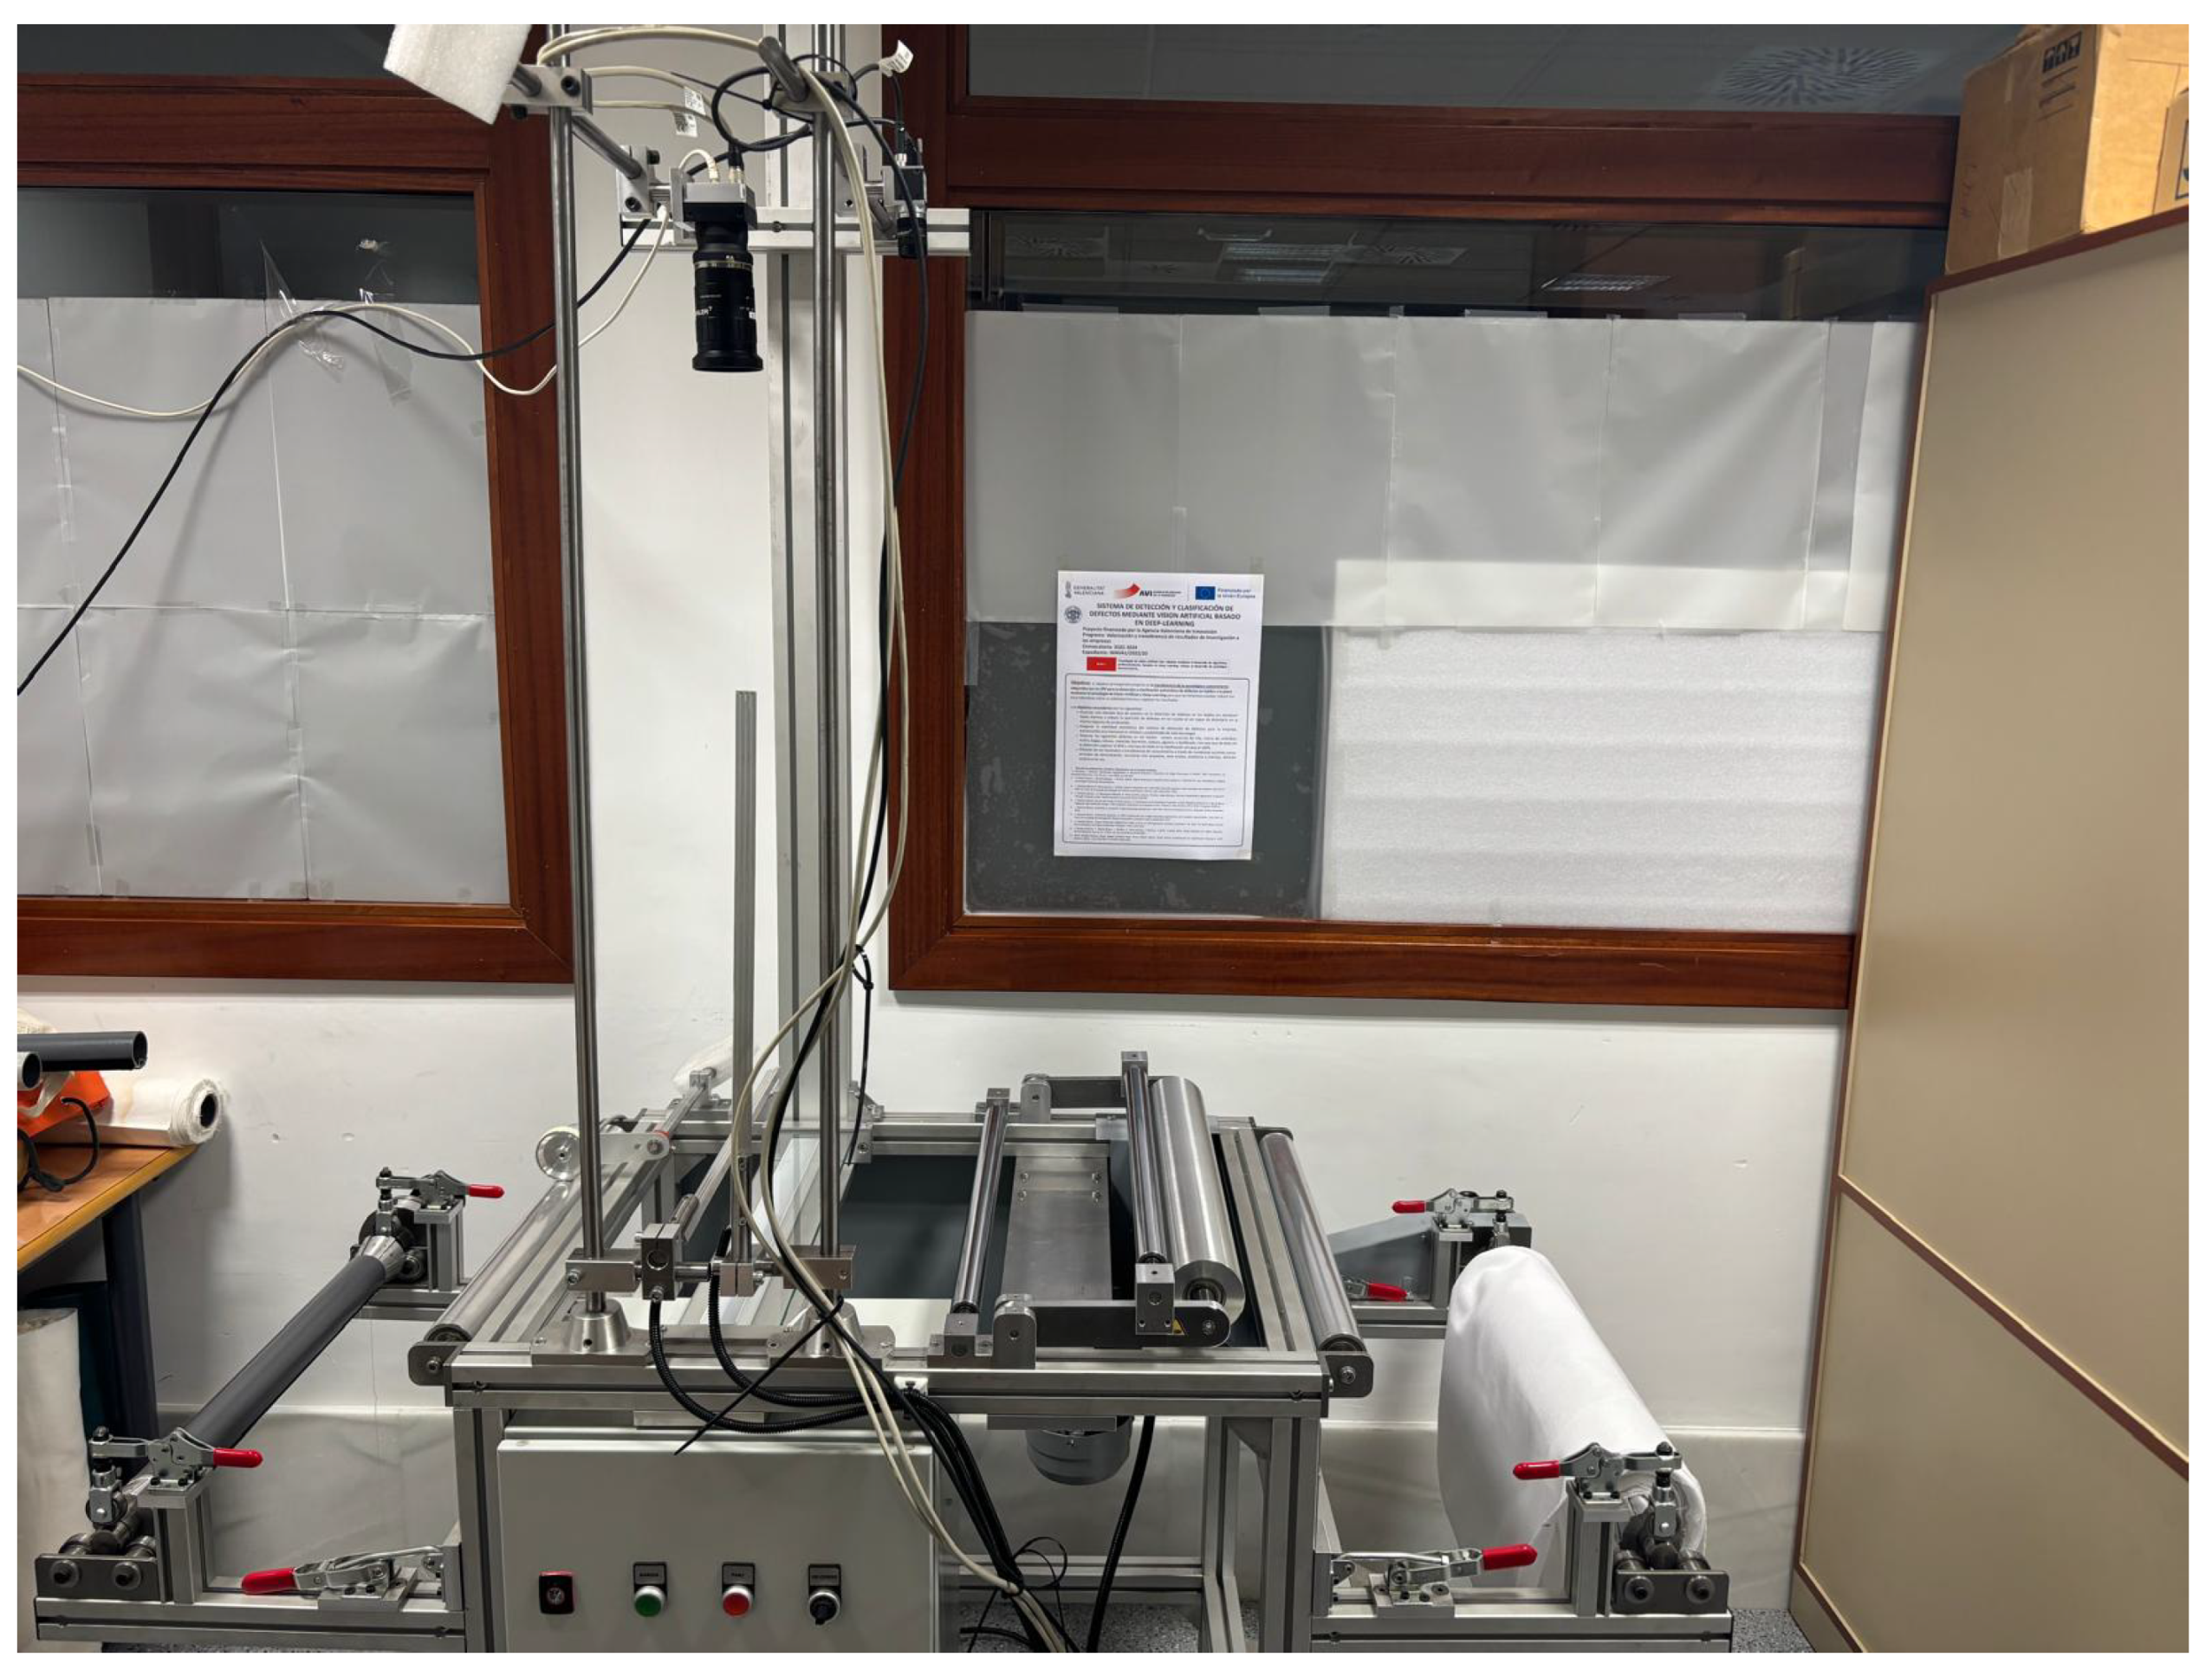
Figure 6 shows the complete custom-built inspection system used for generating the RAW-FABRID dataset.
3.2. Defect Annotation Procedure
To establish reliable ground truth data for supervised learning stages, pixel-level semantic segmentation was performed on all images identified as containing defects. The annotation process was conducted manually by domain experts from the fabric supplier companies, ensuring highly accurate outlines of textile imperfections based on professional visual inspection.
In the defective regions, experts generated precise pixel-level segmentation masks. Consequently, only the defective samples in the images directory have corresponding files in the masks folder; defect-free images do not include mask files. Within these masks, pixels belonging to a defect region are strictly encoded with an intensity value of 255 (white), while non-defective background areas are encoded with a value of 0 (black). Furthermore, the generated annotation files (CSV and JSON) provide comprehensive information about the corresponding images, integrating precise bounding box and polygon coordinates for all defects.
3.3. Image Preprocessing and Formatting
Photometrically, the high-resolution grayscale images stored in the images directory remain in an unprocessed state, exactly as acquired by the camera sensor. No illumination correction, intensity adjustments, or histogram clipping were applied. Spatially, the original 2048-pixel-wide captures were exclusively cropped to a width of 1792 pixels to remove uninformative dark borders. Preserving this photometrically raw format allows future researchers to develop and benchmark their own preprocessing or normalization algorithms.
To facilitate compatibility with standard defect detection frameworks, specifically the MVTec Anomaly Detection benchmark structure, the high-resolution 1792 × 1024 images were divided into a grid of 256 × 256 pixel patches. This specific patch size () was selected to preserve the original spatial resolution (4 px/mm) while generating input dimensions compatible with the receptive fields and memory constraints of standard Convolutional Neural Networks (CNNs) and Vision Transformers (ViTs). Resizing an entire high-resolution image to standard CNN input dimensions would cause severe interpolation artifacts and the potential loss of micro-defects. Therefore, this patch-based approach ensures seamless integration into modern anomaly detection architectures (e.g., PatchCore, PaDiM) without sacrificing critical pixel-level details.
The grid division yields a baseline of patches per original image. To prevent defects from being split across patch boundaries, a dynamic cropping strategy was applied: patches containing defects near the grid edges were recentered, introducing deliberate spatial overlap to ensure the entire anomaly is captured within a single patch and to improve detection robustness at the borders.
The resulting patches were automatically sorted based on their spatial overlap with the ground truth masks. Patches containing zero defective pixels were allocated to either the training (train/good) or testing (test/good) sets. Patches containing at least one defective pixel were placed in the testing set (test/defect). Simultaneously, the corresponding high-resolution ground truth masks were cropped using identical grid coordinates to generate precise 256 × 256 binary masks for every defective patch.
Finally, to facilitate automated data handling and guarantee reproducibility, this formatting stage concluded with the generation of the four comprehensive metadata and annotation files (CSV and JSON) detailed in
Section 2, successfully mapping every patch back to its original source image and recording its specific data split allocation.
4. User Notes
It is important to note the intended evaluation regime of RAW-FABRID. While the dataset contains 204 defective high-resolution images—which might pose a limitation for training traditional supervised multi-class deep learning models from scratch—it is specifically designed for Unsupervised Anomaly Detection (UAD). In the UAD paradigm, models are trained exclusively on defect-free samples to learn the normative distribution of the fabric, and the defective samples are strictly reserved for testing. Furthermore, when the 204 high-resolution images are processed into the MVTec-style 256 × 256 patch format, they generate thousands of anomalous evaluation samples. This volume exceeds the number of testing defects found in individual categories of standard industrial UAD benchmarks, providing a robust testbed for anomaly detection architectures.
Regarding the data properties, the dataset consists of single-channel grayscale images. Therefore, it is specifically designed for the detection of structural and textural defects (holes, broken threads, etc.) and is not intended for analyzing color-based anomalies. Coupled with this imaging modality, a physical limitation of RAW-FABRID is its exclusive focus on 100% cotton plain weave fabric, a specific material composition that stems from the real-world production lines of our collaborating industrial partners. While this restricts structural variety, plain weave represents a standard and ubiquitous baseline in the textile industry. Because the dataset features relatively lightweight and semi-transparent fabrics, models trained on RAW-FABRID are expected to generalize well to other textiles within this topological family, remaining robust against slight natural variations in yarn thickness or thread density. However, we acknowledge that this composition limits the immediate generalization to heavy, opaque, or highly textured architectures, such as denim or automotive upholstery. Despite this constraint, focusing exclusively on raw fabrics (grey fabric) is a strategic choice of primary industrial interest. Detecting structural and tonal defects at this early stage, prior to expensive subsequent processes like dyeing, printing, or chemical finishing, prevents significant economic losses and minimizes unnecessary environmental impact. Researchers utilizing this dataset should consider these topological boundaries when evaluating cross-texture generalization or when applying transfer learning techniques.