


Abstract
Open and reusable road-safety microdata remain scarce in Latin America, particularly when incident records combine detailed temporal information, geocoded event locations, and a clear pathway for extracting fatal outcomes. This article documents a curated administrative dataset for Medellín, Colombia, containing 702,540 reported road-traffic incidents recorded between 1 January 2008 and 31 August 2025. The dataset includes 13 variables describing incident identifier, date, time, incident class, severity, interpolated address, geographic coordinates (latitude and longitude), and planning-unit identifiers. Although the complete dataset contains three severity levels—property damage only, injured, and fatal—it also enables the construction of a fully reproducible fatality subset by filtering incidents classified as fatal, yielding 2762 records. The database covers 21 planning units (communes) in Medellín and includes named neighborhood information for 394 neighborhoods in the complete dataset and 274 neighborhoods in the fatal subset. Spatial completeness is high for administrative data: geographic coordinates are available for 93.63% of all records and 90.77% of fatal incidents. To keep the emphasis on dataset documentation, this data descriptor focuses on compact statistical tables and an illustrative grouped logistic regression model of fatal outcomes. The dataset, accompanied by a complete data dictionary and reproducible R script, is intended to support secondary research in road-traffic safety, spatial epidemiology, transportation planning, urban mobility, and public health.
Dataset: https://doi.org/10.17632/r6g5dfnpgh.1.
Dataset License: Creative Commons Attribution 4.0 International (CC BY 4.0)
1. Background & Summary
Road traffic injury remains a major public health and urban governance challenge. However, the research value of incident databases depends strongly on access to granular, well-documented, and linkable records. Recent studies have shown that the social burden of transport injury cannot be understood solely through counts of deaths or injuries; instead, it reflects unequal exposure, infrastructure vulnerability, and the persistent spatial concentration of risk within specific urban environments [1,2,3]. For this reason, datasets that preserve event-level information on time, location, and severity are essential for reproducible safety research and for designing interventions consistent with the Safe System approach [4,5,6].
In methodological terms, road safety research has increasingly incorporated geospatial and spatiotemporal analysis. Studies from Oman, Ethiopia, Ghana, Brazil, Nepal, and Colombia demonstrate that event-level records can reveal hotspot formation, temporal clustering, severity gradients, and infrastructure-related disparities that cannot be detected using aggregated statistics alone [7,8,9]. These approaches are particularly important for vulnerable road users, including pedestrians, for whom the built environment, street design, and timing of exposure strongly influence the probability of severe injury or death [10,11]. Despite these advances, many studies still rely on restricted police or municipal databases that are difficult to audit, reproduce, or reuse outside the original research teams.
The availability of well-documented open datasets has become increasingly important in contemporary research practice. The FAIR principles provide the most widely recognized framework for scientific data stewardship, emphasizing that datasets should be findable, accessible, interoperable, and reusable [12]. Careful documentation of datasets expands opportunities for secondary analysis, improves transparency, and allows other researchers to reproduce analytical workflows across policy and public health research domains. In road safety research, recent dataset releases illustrate the value of providing structured documentation together with raw data and metadata, enabling a broader range of reuse scenarios and analytical applications [13,14].
Within Latin America, the need for reusable urban road safety data is particularly pressing. Regional and Colombian studies indicate that road injuries are unevenly distributed, socially costly, and closely linked to urban development patterns, mobility systems, and territorial inequality [15,16,17]. Nevertheless, openly accessible, georeferenced administrative datasets covering long time horizons remain uncommon, and many local analyses remain confined within institutional workflows. As a result, researchers and policy analysts often cannot reproduce fatality subsets, compare severity patterns across years, or evaluate the sensitivity of results to geocoding completeness and spatial filters.
Within this context, road safety is commonly understood as a multidimensional system involving interactions between infrastructure design, vehicle conditions, and human behavior. These components jointly influence the occurrence and severity of traffic incidents and are widely recognized as key pillars in road safety research and policy frameworks [18]. In turn, the availability of detailed and reliable incident-level data is essential for understanding how these factors interact over space and time, and for supporting evidence-based interventions aimed at reducing traffic-related injuries and fatalities.
This data descriptor documents a curated administrative dataset containing 702,540 reported road traffic incidents in Medellín, Colombia, spanning 21 planning units and the period from 1 January 2008 to 31 August 2025. The dataset is derived from official administrative records maintained by the Secretaría de Movilidad de Medellín, the municipal authority responsible for traffic management and road safety. Incident data are systematically recorded through standardized reporting procedures involving traffic authorities and institutional information systems, ensuring longitudinal consistency and administrative reliability. The dataset includes three severity levels—property damage only, injured, and fatal—and six incident classes. This structure allows researchers both to analyze the complete incident environment and to construct a fatality-only subset using a transparent and reproducible filter. Applying a filter that selects records classified as fatal in the incident severity field yields 2762 fatal incidents, representing 0.393% of all records in the dataset.
This article is presented as a data descriptor rather than a substantive analytical study. A separate published study applied this dataset to quantify the social burden and spatiotemporal concentration of fatal road traffic incidents in Medellín [19]. To avoid duplicating that application-oriented analysis, the present manuscript focuses on the dataset itself—its structure, coverage, curation, technical validation, and reusable repository materials. The objective is therefore twofold: first, to describe the structure, coverage, and documentation of the dataset in a format suitable for public repository deposition and journal publication; and second, to demonstrate how the complete incident database and its reproducible fatality subset can support future research in road safety, spatial epidemiology, transportation planning, public health, and urban resilience [20,21]. The dataset and the accompanying reproducible R script are publicly available in the Mendeley Data repository [22].
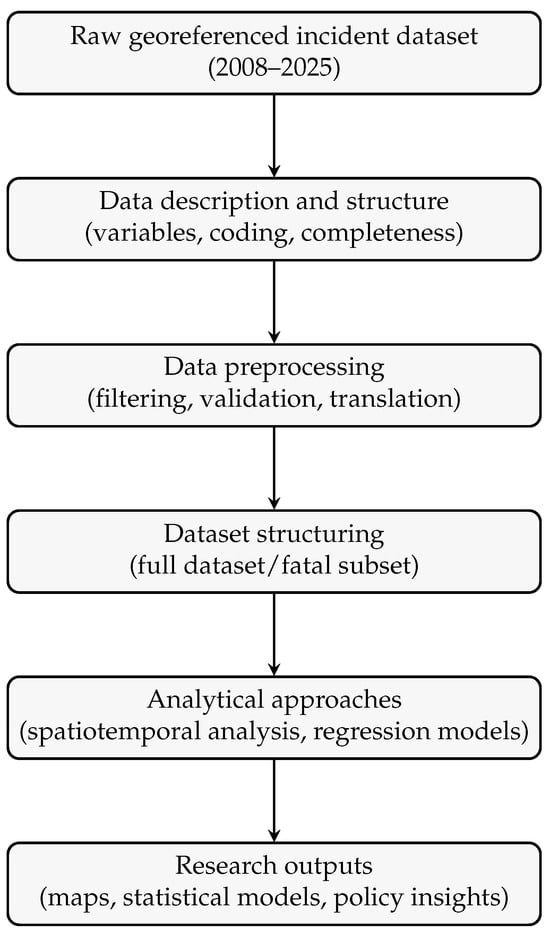
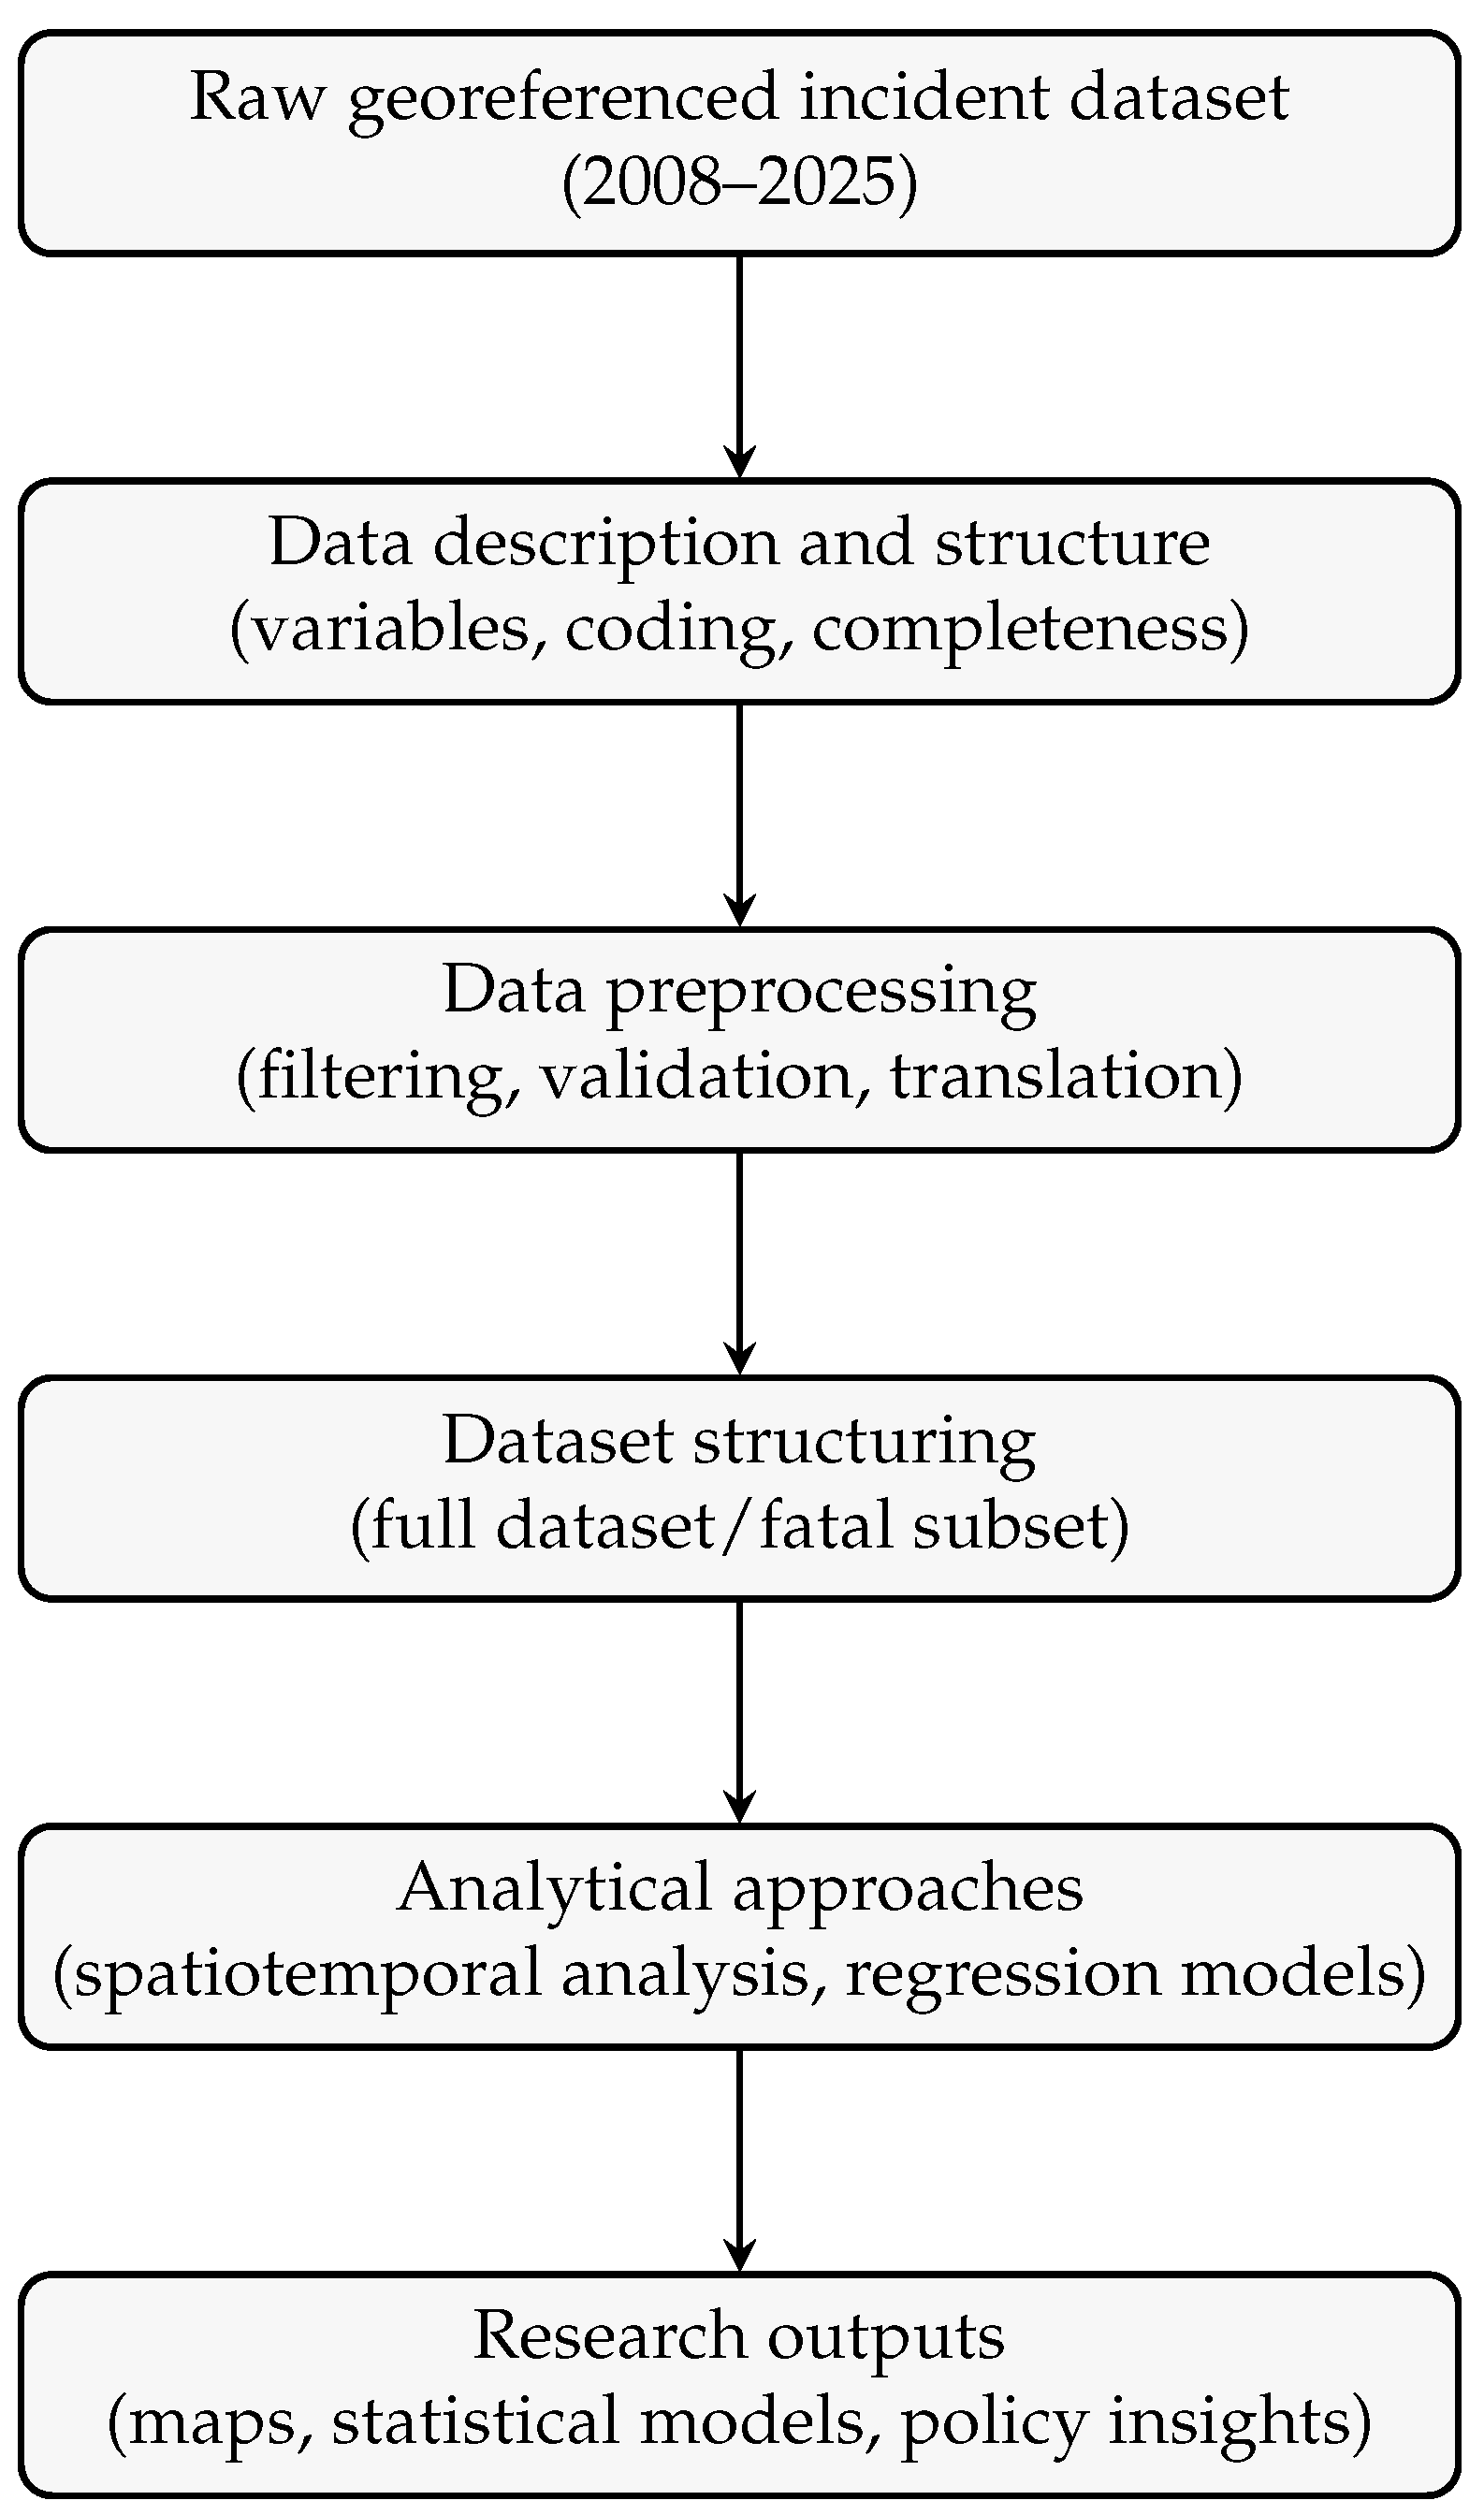
To facilitate interpretation and reuse, Figure 1 provides a schematic overview of a typical application scenario for the dataset. The workflow illustrates the progression from raw georeferenced incident records to structured analytical outputs, beginning with data description (variables, coding, and completeness), followed by preprocessing steps such as filtering, validation, and translation. It then distinguishes between the full dataset and derived subsets, including the fatality subset, and shows how these can support different analytical approaches, such as spatiotemporal analysis and regression modeling. These analyses may generate outputs such as spatial visualizations, statistical summaries, or evidence to inform policy-oriented research. This schematic is intended to guide users in understanding the logical flow of data preparation and reuse without prescribing a specific analytical framework.
Figure 1.
Schematic workflow illustrating a typical application scenario for the Medellín traffic incident dataset. The diagram highlights the role of data description, preprocessing, and structuring steps prior to analytical reuse.
2. Data Description
The uploaded file contains a single worksheet, BD, with 13 columns and 702,540 rows of incident-level observations. Each row represents one reported road traffic incident. The dataset originates from routine administrative reporting processes coordinated by the Secretaría de Movilidad de Medellín. Traffic incidents are recorded by field authorities and subsequently consolidated into institutional information systems following standardized protocols, ensuring consistent data capture over time. As shown in Table 1, the unit of observation is the incident itself rather than the injured person, vehicle, or road segment. This distinction is important because the dataset functions as an event register that can be linked to spatial units and aggregated over time. It should therefore be interpreted as an incident database rather than as a trauma registry or an exposure dataset.
Table 1.
Database details.
The dataset includes temporal, categorical, textual, and spatial fields. The temporal variables are AÑO, FECHA_INCIDENTE, and HORA_INCIDENTE. Incident classification and severity are recorded in the categorical variables CLASE_INCIDENTE and GRAVEDAD_INCIDENTE. The textual location variable DIRECCION_INTERPOLADA stores the interpolated address of the event, while the geographic coordinates are recorded in Latitud and Longitud using decimal degrees. Administrative geography is represented at two nested levels through commune/corregimiento and neighborhood identifiers. Table 2 summarizes the structure of the dataset. A separate spreadsheet included with this dataset provides the complete data dictionary, including variable descriptions, coding details, and missing-data information.
Table 2.
Summary of the variables in the dataset. A full data dictionary is provided as a separate spreadsheet.
The severity distribution shows that the dataset is not limited to fatal crashes. Injurious incidents account for 400,373 records (56.99%), property-damage-only incidents for 299,405 records (42.62%), and fatal incidents for 2762 records (0.393%). This structure provides flexibility for different analytical purposes. Researchers interested in the full spectrum of reported traffic incidents can use the complete dataset, while those focusing on fatal outcomes can extract a clearly defined fatality subset without requiring external linkage files.
Incident class is recorded in six categories: crash (Choque), pedestrian hit (Atropello), other (Otro), occupant fall (Caida Ocupante), rollover (Volcamiento), and fire (Incendio). In the complete dataset, crashes dominate the distribution (460,807 records; 65.59%), followed by other incidents, pedestrian hits, and occupant falls. Within the fatal subset, crashes remain the largest category (1524 records), while pedestrian hits account for a substantial share (961 records). Table 3 presents the cross-class severity distribution. Differences in severity patterns across incident classes make the dataset suitable for severity modeling, class-specific spatial analysis, and studies of vulnerable road users.
Table 3.
Distribution of records by incident class and severity.
The spatial coverage of the dataset is extensive. Across the full dataset, valid commune or corregimiento names appear for 21 planning units, corresponding to Medellín’s 16 urban comunas and 5 rural corregimientos. Named neighborhood information is available for 394 neighborhoods in the full dataset and 274 neighborhoods in the fatal subset. This spatial coverage allows analyses at multiple scales, including citywide aggregation, commune-level comparisons, and neighborhood-level studies. In the fatal subset, La Candelaria contains the highest number of fatal incidents (558 events, 20.20% of the fatal subset), followed by Castilla, Guayabal, Laureles Estadio, and El Poblado (Table 4). These counts illustrate how the dataset can be used to explore spatial concentration patterns.
Table 4.
Top planning units in the fatal subset.
The dataset also spans a long temporal horizon. The earliest recorded incident occurred on 1 January 2008, and the most recent record corresponds to 31 August 2025. Table 5 reports annual totals for both the complete dataset and the fatality subset. Because the dataset ends in August 2025, that year should be treated as a partial observation in time-series analyses. Researchers comparing yearly counts should either truncate earlier years to the same cutoff date or explicitly account for the partial year in their models.
Table 5.
Annual record counts in the complete dataset and in the reproducible fatality subset (2025 is partial through 31 August).
Finally, this data descriptor prioritizes tables over extensive analytical figures. The manuscript focuses on documenting the dataset itself—its structure, completeness, and reuse potential—so that researchers can readily understand and apply it in their own analyses.
3. Methods
The dataset described in this article is a curated administrative dataset derived from official road traffic incident reports from Medellín, Colombia. The uploaded file was treated as the primary source for this data descriptor. Because the dataset is already organized in tabular form, the methodological focus of the present study is not primary data collection but rather dataset documentation, variable inspection, reproducible extraction of the fatality subset, and validation of temporal and spatial fields. This approach follows current data descriptor practice, where the main contribution lies in releasing datasets with clear metadata, transparent documentation, and procedures that allow other researchers to reproduce the analytical steps [23].
The curation workflow began with a structural inspection of the worksheet, including verification of the total number of rows and columns and identification of field types. Date variables were standardized as calendar dates, and time fields were parsed to a consistent 24-h format. The original Spanish values for incident class and severity were preserved in the dataset to maintain reproducibility, while English translations were provided in the accompanying documentation. The data dictionary included with this repository therefore acts as a translation layer, enabling international users to interpret the original Spanish variable names and categories while preserving the integrity of the source data. This approach represents a reproducible and transparent practice for managing multilingual datasets without altering the original records.
A second stage of preparation focused on constructing derived analytical fields. For descriptive summaries and the illustrative usage example, the dataset was reduced to a compact analysis table containing year, hour, weekday indicator, incident class, severity, geographic coordinates, and planning-unit identifiers. The fatality subset was then extracted using the explicit condition that the incident severity variable is classified as fatal:
Because severity is consistently recorded in the dataset, this rule is sufficient to reproduce the fatality subset without additional linkage procedures. As a result, future users can reconstruct the subset reported in this article directly from the original dataset.
The repository package prepared for public release follows a simple file structure designed to facilitate reuse. The package includes the raw dataset, a standalone Excel data dictionary, a README file describing the dataset and analytical workflow, and the reproducible R script used to generate the tables and statistical model reported in this article. Providing raw data, documentation, and analytical code together is consistent with widely adopted open-data practices that promote transparency and reproducibility [13].
To illustrate analytical reuse of the dataset, an example grouped binomial logistic regression model was estimated in which the outcome variable represents the probability of a fatal incident. Instead of estimating the model at the individual incident level, the dataset was aggregated by incident class, hour band, weekend indicator, and calendar year. For each aggregated cell, the probability of a fatal outcome was modeled using a grouped binomial logistic regression, as shown in Equation (1).
This model is included only to demonstrate how the dataset can support inferential analysis. It should not be interpreted as a causal model of traffic fatality risk, because the dataset does not contain person-level information, vehicle characteristics, or exposure measures that would be required for a full etiological analysis [11,14].
4. Data Records
The repository accompanying this article contains three files that together document and reproduce the dataset used in the study. The primary file, Fatal_Road_Traffic.xlsx, contains the administrative incident records described in this paper. Each row represents a reported road traffic incident, and the dataset preserves the original variable names and categorical values as recorded in the administrative source.
A second file, Data_Dictionary_Fatal_Road_Traffic.xlsx, provides detailed documentation for all variables in the dataset. The data dictionary includes the original variable names, English descriptions, data types, measurement levels, and units. It also provides additional notes on coding conventions and missing values to facilitate interpretation and reuse of the dataset.
The third file, Reproduce_tables_models.R, contains the reproducible R script (version 4.5.3) used to generate the descriptive tables and the grouped logistic regression model reported in this article. The script performs the basic data preparation steps, constructs the fatality subset, and reproduces the statistical outputs presented in the manuscript. Providing the script alongside the dataset allows other researchers to replicate the analytical workflow and verify the reported results.
The dataset preserves the original Spanish variable names and categorical values in order to maintain traceability with the administrative source. The English-language documentation supplied in the data dictionary therefore serves as an explanatory layer rather than a transformation of the original data. Researchers who wish to harmonize the dataset with other analytical workflows can create derived versions while retaining the original dataset as the reference dataset.
The dataset and documentation files are publicly available in the Mendeley Data repository. The repository provides the cleaned dataset, the data dictionary, and the reproducible analysis script used in this article, enabling full replication of the statistical tables and model described in the manuscript.
5. Technical Validation
Administrative road safety data are valuable because they provide operational, longitudinal, and spatially specific records of traffic incidents. However, such datasets require careful validation because reporting systems may contain missing coordinates, partial-year data, or administrative placeholders. For this reason, the validation workflow used in this descriptor focused on four aspects: schema completeness, spatial completeness, coordinate plausibility, and temporal consistency.
Schema completeness was strong for the core analytical variables. In the uploaded dataset, the incident identifier, year, date, time, incident class, and incident severity fields were fully populated. This ensures that the fatality subset can be reproduced directly from the original dataset and that temporal aggregation by year, date, or hour does not require data imputation. Minor data-quality limitations appear primarily in spatial and textual fields rather than in the temporal or severity variables.
Spatial completeness is high for an administrative incident dataset of this size. Coordinates are missing for 44,785 records (6.37%) in the complete dataset and for 255 fatal records (9.23%). Missing values occur slightly more often at the neighborhood level than at the commune level, which is typical of geocoding workflows where point coordinates or detailed address matching may fail while higher-level geographic identifiers remain available. This pattern is expected because neighborhood assignment generally requires more precise geocoding than commune-level classification; consequently, records with incomplete or ambiguous address information may still be assigned to a commune but not to a specific neighborhood. Table 6 summarizes missingness across the spatial hierarchy for both the full dataset and the fatal subset.
Table 6.
Missingness in the spatial hierarchy for the complete dataset and the fatal subset.
Coordinate plausibility was assessed using a conservative geographic bounding box covering Medellín (latitude 6.15–6.35; longitude to ). Among geocoded records in the complete dataset, 307 points (0.044% of all records) fall outside this envelope and should be reviewed before map-based analysis. Importantly, no points from the fatal subset fall outside the same municipal envelope. This result increases confidence in spatial analyses focusing on fatal incidents while indicating that a small number of coordinate anomalies remain in the full dataset.
Administrative geographic identifiers were also examined for placeholder or missing values. Commune-level information is unavailable for 28,154 rows (4.01%) in the complete dataset and for 135 rows (4.89%) in the fatal subset. Neighborhood-level identifiers are missing for 46,732 rows (6.65%) in the complete dataset and for 359 fatal rows (13.00%). Although these proportions are relatively small, they should be considered when conducting neighborhood-level spatial analyses or when joining the dataset with external geographic layers.
Temporal validation identified one important metadata issue. The 2025 portion of the dataset ends on 31 August 2025 and therefore represents a partial year rather than a complete annual record. This reflects the extraction date of the administrative dataset rather than a data-quality error. Analyses comparing annual totals should therefore either truncate earlier years to the same endpoint or explicitly treat 2025 as incomplete. Alternatively, researchers may restrict analyses to the 2008–2024 period to ensure full-year comparability across observations. While this approach improves temporal consistency, it reduces the length of the available time series and may limit the analysis of recent trends. Transparent reporting of such extraction windows is important for reproducibility in data descriptor publications [23].
Overall, these checks indicate that the dataset is suitable for temporal and spatial analyses, particularly when working with the fatality subset. The dataset provides long temporal coverage, consistent severity coding, and a relatively low rate of missing geographic information. As with any administrative dataset, researchers should include basic validation checks in their own workflows rather than assuming that geocoded records are entirely error-free [24,25].
6. Usage Notes
The most straightforward analytical use of the dataset is the extraction of the fatality subset. Because incident severity is fully recorded, users can identify fatal events with a simple filter and obtain a dataset of 2762 incidents that includes date, time, incident class, and geographic information. This subset can be used to examine annual fatality patterns, hourly distributions, planning-unit summaries, or spatial concentration of incidents. By contrast, the complete dataset is more appropriate for studies that require the full distribution of reported incidents, including analyses of severity patterns or comparisons between fatal and nonfatal events.
The dataset is also suitable for spatiotemporal analysis. Previous studies in Ghana, Brazil, Ethiopia, Nepal, and Cali demonstrate how incident-level records can be used to identify spatial clusters, examine temporal patterns, and explore the relationship between infrastructure conditions and injury severity [24,25,26]. Because the Medellín dataset preserves both geographic coordinates and event timing, users can apply similar analytical approaches using kernel density estimation, spatial clustering methods, or generalized linear models.
To illustrate one potential reuse scenario, Table 7 reports a grouped binomial logistic regression model, a standard and interpretable approach for modeling binary outcomes such as fatal versus non-fatal incidents. Logistic regression is widely used in road safety research due to its ability to estimate associations between incident characteristics and the probability of a fatal outcome while maintaining a straightforward interpretation of coefficients [14]. The model is included here for illustrative purposes only, to demonstrate how the dataset can support multivariate analysis. Alternative analytical approaches, including count models, survival analysis, machine learning methods, or spatial regression frameworks, may also be applied depending on the research objectives. A comparative assessment of these methods is beyond the scope of this Data Descriptor.
Table 7.
Illustrative grouped binomial logistic regression for the probability of a fatal outcome. The model is provided only as an example of analytical reuse of the dataset.
Relative to crash incidents, pedestrian-hit incidents are associated with higher odds of a fatal outcome . In contrast, occupant falls, rollovers, and incidents classified as other are associated with lower fatal odds. Regarding temporal factors, incidents occurring between midnight and 05:59 are associated with higher odds compared to the 06:00–11:59 reference period , while the evening period (18:00–23:59) shows a modest increase . Weekend incidents are also associated with higher fatal odds than weekday incidents . Finally, the odds ratio for calendar year suggests a slight increase in the probability of fatal outcomes within the reported incident pool over time.
These results should be interpreted as an example of how the dataset can be analyzed rather than as a causal model of traffic fatality risk. The dataset does not include variables such as vehicle speed, user age, sex, alcohol involvement, safety equipment, weather conditions, roadway geometry, or exposure measures such as traffic volumes or pedestrian flows. Consequently, the grouped logistic regression model illustrates the analytical structure of the data but should not be interpreted as a complete explanation of fatality risk [10].
The analytical workflow involves filtering the dataset to extract fatal incidents, constructing grouped variables, and estimating a binomial logistic regression model, as described in the Methods section (Section 3). Beyond this illustrative example, the dataset supports a wide range of research applications. These include studies of temporal patterns of pedestrian fatalities, spatial concentration of fatal incidents at the neighborhood level, comparisons between central and peripheral communes, and analyses linking traffic safety outcomes with urban infrastructure or socioeconomic conditions [14,15,27]. Because the dataset includes the full population of reported incidents rather than only fatalities, it can also be used to examine severity distributions or to develop predictive models of incident severity while accounting for class imbalance.
When reusing the dataset, three practical guidelines are recommended. First, retain the original Spanish categorical values in archival copies and introduce translated variables only in derived analysis files. Second, verify coordinates and administrative identifiers before performing spatial joins or map-based analyses. Third, treat the year 2025 as a partial year unless an updated full-year dataset becomes available. Following these practices will help maintain consistency across studies and improve the reproducibility of derivative analyses.
7. Limitations
The dataset has three main limitations. First, although it provides detailed spatial and temporal information, it does not include person-level demographic variables, vehicle characteristics, clinical outcomes beyond the recorded severity category, or exposure denominators. Consequently, the dataset is better suited for incident-based spatial and temporal analysis than for clinical trauma epidemiology or for estimating risk per traveler, vehicle-kilometer, or pedestrian crossing.
Second, the dataset originates from an administrative reporting system. Administrative datasets are valuable for monitoring real-world conditions, but they may also reflect reporting practices, geocoding procedures, or institutional changes over time. For this reason, changes in the annual proportion of fatal incidents should not be interpreted as evidence of changes in underlying risk without considering reporting practices, policy context, or appropriate exposure denominators [1,28].
Third, the 2025 records are incomplete because the dataset ends on 31 August 2025. This does not affect the internal consistency of the dataset, but it means that 2025 should be treated as a partial year in time-series analyses. Researchers comparing annual totals should therefore either truncate earlier years to the same calendar endpoint or explicitly account for the partial observation period. These limitations do not diminish the usefulness of the dataset. Instead, they define the appropriate analytical scope of the data and clarify the conditions under which valid interpretations can be made.
8. Conclusions
This article documents a longitudinal, georeferenced dataset of road traffic incidents recorded in Medellín, Colombia, between 2008 and 2025. The dataset contains more than 700,000 incident records with temporal, categorical, and spatial information, including incident class, severity, event timing, and administrative location identifiers. Because incident severity is consistently recorded, users can reproduce a fatality subset of 2762 incidents directly from the original dataset without external linkage.
The primary contribution of this data descriptor is the transparent documentation of the dataset and the release of supporting materials that facilitate reuse. The repository includes the original administrative dataset, a detailed data dictionary describing all variables, and a reproducible R script that generates the statistical tables and illustrative logistic regression model reported in this article. Together, these materials allow other researchers to replicate the analytical workflow and verify the reported results.
By preserving event-level spatial and temporal information across a 17-year period, the dataset provides a valuable resource for future research on road safety, spatial epidemiology, urban mobility, and transportation planning. Researchers can use the data to study temporal patterns of traffic incidents, spatial concentration of fatalities, differences between incident classes, and the relationship between traffic safety outcomes and urban infrastructure or policy interventions.
Overall, the dataset expands the availability of open, georeferenced road safety data for Latin American cities. By combining long-term coverage, consistent severity coding, and clear documentation, the repository supports transparent and reproducible research on road traffic incidents and their spatial and temporal dynamics.
Author Contributions
Conceptualization, M.L.A.U. and C.D.C.Á.; methodology, M.L.A.U.; formal analysis, E.Q.R. and C.D.C.Á.; data curation, C.D.C.Á.; writing—original draft, E.Q.R. and M.L.A.U.; writing—review and editing, C.D.C.Á.; visualization, M.L.A.U. and C.D.C.Á.; supervision, E.Q.R. All authors have read and agreed to the published version of the manuscript.
Funding
This research received no external funding.
Institutional Review Board Statement
This study did not involve human participants or animal subjects. Data management complied with Colombia’s Personal Data Protection Act [29].
Data Availability Statement
The dataset supporting this study is publicly available in Mendeley Data: Correa, C. (2026). Dataset on Road Traffic Fatalities in Medellín, Colombia (2008–2025). Mendeley Data, V1. https://doi.org/10.17632/r6g5dfnpgh.1, (accessed on 7 March 2026). The repository contains the administrative dataset of road-traffic incidents, the data dictionary describing all variables included in the dataset, and the reproducible R script used to generate the statistical tables and regression model reported in this study.
Conflicts of Interest
The authors declare no conflicts of interest.
References
- Bougna, T.; Hundal, G.; Taniform, P. Quantitative analysis of the social costs of road traffic crashes literature. Accid. Anal. Prev. 2022, 165, 106282. [Google Scholar] [CrossRef] [Scilit]
- Clark, S.S.; Peterson, S.K.E.; Shelly, M.A.; Jeffers, R.F. Developing an equity-focused metric for quantifying the social burden of infrastructure disruptions. Sustain. Resilient Infrastruct. 2023, 8, 356–369. [Google Scholar] [CrossRef] [Scilit]
- Hart, O.E.; Wachtel, A.; Jones, K.; Jimenez, T.; Gregory, P.; Tam, D. Beyond money: A social burden framework to enhance resilience valuation for tribal communities in the United States. Energy Res. Soc. Sci. 2025, 120, 103934. [Google Scholar] [CrossRef] [Scilit]
- Job, R.F.S.; Truong, J.; Sakashita, C. The ultimate safe system: Redefining the safe system approach for road safety. Sustainability 2022, 14, 2978. [Google Scholar] [CrossRef] [Scilit]
- Mooren, L.; Shuey, R. Systems thinking in road safety management. J. Road Saf. 2024, 35, 63–73. [Google Scholar] [CrossRef] [Scilit]
- McIlroy, R.C.; Banks, V.A.; Parnell, K.J. 25 years of road safety: The journey from thinking humans to systems-thinking. Appl. Ergon. 2022, 98, 103592. [Google Scholar] [CrossRef] [Scilit]
- Al-Aamri, A.K.; Hornby, G.; Zhang, L.-C.; Al-Maniri, A.; Padmadas, S.S. Mapping road traffic crash hotspots using GIS-based methods: A case study of Muscat Governorate in the Sultanate of Oman. Spat. Stat. 2021, 42, 100458. [Google Scholar] [CrossRef] [Scilit]
- Vivas, H.; Rodríguez-Mariaca, D.; Jaramillo, C.; Fandiño-Losada, A.; Gutiérrez-Martínez, M.I. Traffic fatalities and urban infrastructure: A spatial variability study using geographically weighted Poisson regression applied in Cali (Colombia). Safety 2023, 9, 34. [Google Scholar] [CrossRef] [Scilit]
- Tola, A.M.; Demissie, T.A.; Saathoff, F.; Gebissa, A. Severity, spatial pattern and statistical analysis of road traffic crash hot spots in Ethiopia. Appl. Sci. 2021, 11, 8828. [Google Scholar] [CrossRef] [Scilit]
- Foreman, T.; Lin, M.; Tu, W.; Yarbrough, R. Impact of urban form and street infrastructure on pedestrian–motorist collisions. Int. J. Inj. Control Saf. Promot. 2024, 31, 521–533. [Google Scholar] [CrossRef] [Scilit] [PubMed]
- Stiles, J.; Miller, H. The built environment and the determination of fault in urban pedestrian crashes: Toward a systems-oriented crash investigation. J. Transp. Land Use 2024, 17, 97–113. [Google Scholar] [CrossRef] [Scilit]
- Wilkinson, M.D.; Dumontier, M.; Aalbersberg, I.J.; Appleton, G.; Axton, M.; Baak, A.; Blomberg, N.; Boiten, J.W.; da Silva Santos, L.B.; Bourne, P.E.; et al. The FAIR guiding principles for scientific data management and stewardship. Sci. Data 2016, 3, 160018. [Google Scholar] [CrossRef] [Scilit]
- Pradeep, P.; Kant, K. TU-DAT: A computer vision dataset on road traffic anomalies. Sensors 2025, 25, 3259. [Google Scholar] [CrossRef] [Scilit] [PubMed]
- Uribe, M.L.A.; Corredor, J.S.; Correa-Álvarez, C.D. Social impacts and road safety in intermodality: Case study of the Ayacucho Tram in Medellín-Colombia. J. Urban Mobil. 2025, 8, 100154. [Google Scholar] [CrossRef] [Scilit]
- Cardona-Arango, D.; Gutiérrez-Ossa, J.A.; Montenegro-Martínez, G.; Segura-Cardona, ÁM.; Muñoz-Rodríguez, D.I.; Giraldo-Rodríguez, L.; Agudelo-Botero, M. Measurement of the burden of road injuries in Colombia. Int. J. Environ. Res. Public Health 2025, 22, 1201. [Google Scholar] [CrossRef] [Scilit]
- Correa-Álvarez, C.D.; Sánchez-Corredor, J.; Arango-Uribe, M.L. Analysis of sustainable urban mobility in the Medellin-Colombia Ayacucho Tram-Road Corridor. Rev. EIA 2025, 22, 1–30. [Google Scholar] [CrossRef] [Scilit]
- Tanwar, R.; Agarwal, P.K. Multimodal integration in India: Opportunities, challenges, and strategies for sustainable urban mobility. Multimodal Transp. 2025, 4, 100210. [Google Scholar] [CrossRef] [Scilit]
- Gkyrtis, K.; Pomoni, M. Use of historical road incident data for the assessment of road redesign potential. Designs 2024, 8, 88. [Google Scholar] [CrossRef] [Scilit]
- Sánchez-Corredor, J.; Arango-Uribe, M.L.; Correa-Álvarez, C.D. Quantifying the social burden and spatiotemporal concentration of fatal road traffic incidents in Medellín (2008–2025). Sustainability 2026, 18, 2628. [Google Scholar] [CrossRef] [Scilit]
- Pescaroli, G.; Suppasri, A.; Galbusera, L. Progressing the research on systemic risk, cascading disasters, and compound events. Prog. Disaster Sci. 2024, 22, 100319. [Google Scholar] [CrossRef] [Scilit]
- Christie, N.; Jones, S.; O’Toole, S.E. Systemic inequalities in road safety outcomes across high income countries and lessons from intervention approaches. J. Transp. Health 2025, 41, 102006. [Google Scholar] [CrossRef] [Scilit]
- Correa, C. Dataset on Road Traffic Fatalities in Medellín, Colombia (2008–2025) [Dataset]. Mendeley Data, V1. 2026. Available online: https://data.mendeley.com/datasets/r6g5dfnpgh/1 (accessed on 7 March 2026).
- Mora, J.J.; Burbano-Valencia, E.J.; Mondragón-Mayo, A.; Arroyo, J.S. Perceptions of security, victimization, and coexistence: A database from Cali, Colombia. Data 2026, 11, 41. [Google Scholar] [CrossRef] [Scilit]
- Mesic, A.; Damsere-Derry, J.; Feldacker, C.; Mooney, S.J.; Gyedu, A.; Mock, C.; Kitali, A.; Wagenaar, B.H.; Wuaku, D.H.; Afram, M.O.; et al. Identifying emerging hot spots of road traffic injury severity using spatiotemporal methods: Longitudinal analyses on major roads in Ghana from 2005 to 2020. BMC Public Health 2024, 24, 1609. [Google Scholar] [CrossRef] [Scilit] [PubMed]
- Mahato, R.K.; Htike, K.M.; Kafle, A.; Gewali, V.; Sharma, V. Spatial distribution and cluster analysis of road traffic accidents in Nepal. PLoS ONE 2025, 20, e0331333. [Google Scholar] [CrossRef] [Scilit]
- Batomen, B.; Irving, H.; Carabali, M.; Carvalho, M.S.; Ruggiero, E.D.; Brown, P. Vulnerable road-user deaths in Brazil: A Bayesian hierarchical model for spatial-temporal analysis. Int. J. Inj. Control Saf. Promot. 2020, 27, 528–536. [Google Scholar] [CrossRef] [Scilit] [PubMed]
- Murillo-Hoyos, J.; García-Moreno, L.M.; Tinjacá, N.; Jaramillo, C. Mortalidad por lesiones de tránsito y desigualdades sociales en Colombia, 2019. Pan Am. J. Public Health 2023, 47, e121. [Google Scholar] [CrossRef] [Scilit]
- Nankunda, C.; Evdorides, H. A Systematic Review of the Application of Road Safety Valuation Methods in Assessing the Economic Impact of Road Traffic Injuries. Future Transp. 2023, 3, 1253–1271. [Google Scholar] [CrossRef] [Scilit]
- Congreso de Colombia. Por la Cual se Dictan Disposiciones Generales para la Protección de Datos Personales; Ley 1581 de 2012; Diario Oficial No. 48,587, 17 de Octubre de 2012. 2012. Available online: https://www.alcaldiabogota.gov.co/sisjur/normas/Norma1.jsp?i=49981 (accessed on 27 February 2026).

Disclaimer/Publisher’s Note: The statements, opinions and data contained in all publications are solely those of the individual author(s) and contributor(s) and not of MDPI and/or the editor(s). MDPI and/or the editor(s) disclaim responsibility for any injury to people or property resulting from any ideas, methods, instructions or products referred to in the content. |
© 2026 by the authors. Licensee MDPI, Basel, Switzerland. This article is an open access article distributed under the terms and conditions of the Creative Commons Attribution (CC BY) license.