


Abstract
This paper presents how an ontology-based Knowledge Graph (KG) for basketball box scores can be exploited to support several real use cases, and also presents competency questions, including sports analytics, complex question answering and data browsing with semantic filters. To illustrate this, we present the BBall ontology, the modeling decisions and the key advantages of creating a KG based on this ontology. Then, we introduce a KG covering 25 seasons of the EuroLeague and more than 5 million triples, and we showcase the functionality of three research prototypes based on that KG, particularly a faceted search application with semantic filters and two text-to-SPARQL applications leveraging LLMs, including support for multilingual queries. The first LLM-based application enables SPARQL query editing, and the second is a chat-based application offering interactive dialogue between the user and the system. For these applications, we describe their functionality and approach, and we compare them (along with a classical SPARQL query editor) in several dimensions. Finally, we provide the statistics for the constructed KG, indicative SPARQL queries addressing the competency questions, results and error analysis for the text-to-SPARQL method, efficiency results, and a historical analysis showing the evolution of several factors of EuroLeague basketball from 2000 to 2025.
Keywords:
basketball; LLMs; semantic filters; historical analysis; SPARQL; RDF; Knowledge Graph; application; text-to-SPARQL; dialogue based; chat 1. Introduction
In recent years, semantic technologies and Knowledge Graphs (KGs) [1] have been widely adopted to support data integration [2], knowledge representation, and advanced querying across multiple domains. By combining domain ontologies, RDF-based Knowledge Graphs, and query languages such as SPARQL, these systems enable structured access and analysis to complex and heterogeneous data. Such semantic frameworks have been successfully applied in areas including the biomedical domain [3], the marine domain [4], and smart city applications [5], demonstrating the versatility of graph-based data representations.
This can also be of primary importance for domains such as sports, and specifically for basketball (which is the focus of this paper), since such structured representation and analytics can cover several dimensions of the game. In particular, they can include statistics (traditional and advanced), people and their characteristics (e.g., height, age, country, position), game metadata (venue, audience, referees), and many others. Certainly, there may be several connections between all these entities that can be analyzed, e.g., how player height affects shooting percentages, how the audience number and the venue of a game affect the game result, and so forth.
Sports analytics is an emerging research area [6,7] and there are several web applications providing both traditional and advanced statistics in HTML tables. However, there is a lack of RDF KGs including sports data and statistics that would enable the performance of more advanced analytical tasks requiring the semantic connections between the entities. It is worth mentioning that the pioneer researcher G. Weikum has stated [8] that “Capturing quantity properties of entities in sports, is important for KG coverage towards analytic tasks. This is a major gap in today’s major KGs, and search engines are not a good proxy”.
As an example, take the question “I want all the EuroLeague games where a Greek Player with height less than 2 m scored at least 15 points in a home game against a Russian team”. To answer this question, we need to combine information from several entities; i.e., we need to find games where the road team was from Russia, all the players of the home team, their height, nationality and points. This is very time-consuming in a classical scenario where all these data are distributed in different web pages, files or tables in relational databases.
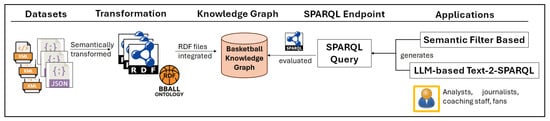
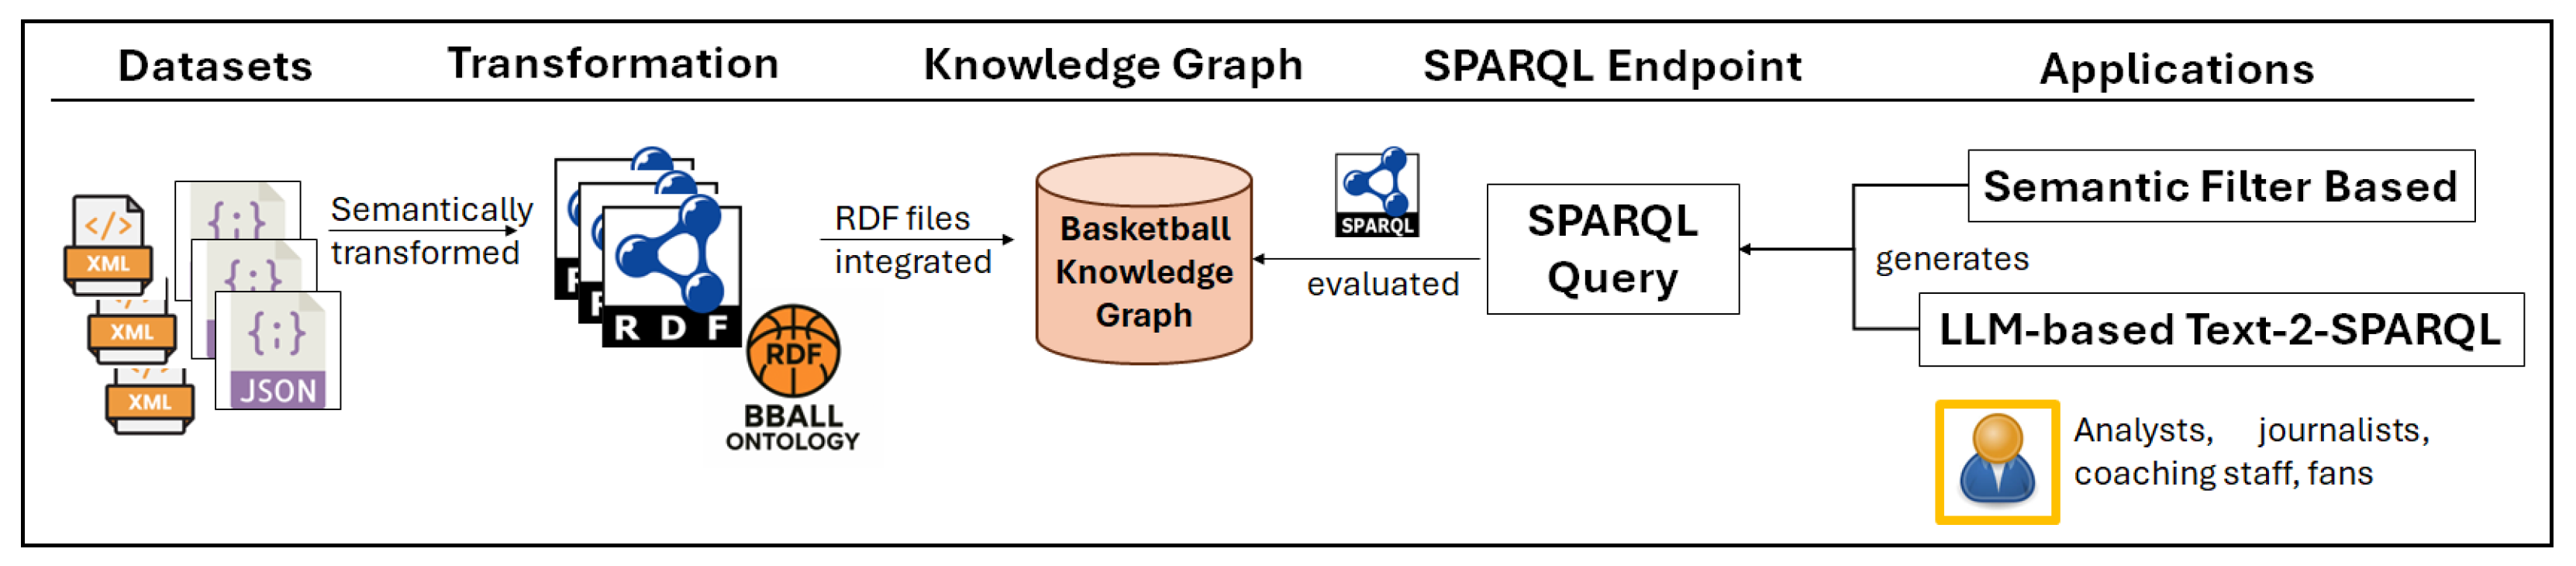
The main objectives of this paper are the following: (i) to show how the creation of an RDF KG using a dedicated ontology can facilitate the process of answering such questions (see Figure 1), (ii) to show how such RDF KGs and the SPARQL query language [9] can be exploited to create advanced applications for users who are not familiar with RDF by leveraging techniques based on semantic filters and LLM-based text-to-SPARQL methods, and (iii) to compare the advantages/disadvantages of these applications.
Figure 1.
The proposed steps for providing a domain-specific semantic framework for basketball data and analytics.
Regarding the contribution of this paper, it is primarily system-oriented, focusing on the design, integration, and deployment of an end-to-end pipeline combining ontology modeling, Knowledge Graph construction, semantic filtering and LLM-based querying. In particular, (a) we describe the BBall ontology, the corresponding use cases, modeling decisions and advantages versus a relational database approach, (b) we present a large-scale curated Knowledge Graph of EuroLeague basketball, including 5 million RDF triples for box scores and associated metadata over the past 25 seasons (from 2000–01 to 2024–25), and (c) we showcase and compare three prototype applications over the KG using filters and text-to-SPARQL techniques. Moreover, (d) we provide efficiency results, an error analysis for the text-to-SPARQL approach and a historical analysis (including statistical testing) showing the evolution of EuroLeague basketball over several key factors of the game, including average numbers of attempted shots and assists, and analysis of coaches, player positions and shooting, and many others.
The rest of this paper is organized as follows: Section 2 provides the related work, Section 3 shows the use cases, decisions, and steps for building an ontology-based basketball KG and Section 4 showcases the prototype applications. Finally, Section 5 provides the experimental evaluation, and Section 6 concludes the paper.
2. Related Work
Here, we first present previous work on basketball analytics, and then we discuss KGs and applications about basketball. Finally, we present SPARQL-based applications, and we compare this work with related approaches.
2.1. Basketball Analytics
In [10], the authors analyzed and compared statistical data from the NBA and EuroLeague Basketball, noting that the EuroLeague is becoming “quantitatively and qualitatively more similar to the NBA.” Moreover, in [11] the authors have measured shooting trends and offensive efficiency between the NBA and EuroLeague for over a decade. Additional research has focused on predicting game outcomes using machine learning, both for the EuroLeague [12] and the NBA [13]. From a statistical perspective, Ref. [14] conducted an analysis of the historical evolution of the EuroLeague. In [15], the authors measured the season-level game-related performance indicators that distinguish successful teams from unsuccessful ones (i.e., teams that qualify for the playoffs and Final Four), by combining statistical techniques and machine learning.
Furthermore, Ref. [16] employed LLMs to evaluate several basketball analytics tasks, including the extraction and interpretation of critical statistics from game summaries, while [17] used association rule mining to assess recovery and economic impacts in the NBA. Moreover, Ref. [18] proposed an efficient algorithm to measure the performance of any combination of players on the court (for both the NBA and EuroLeague). In particular, the authors managed to compute a key set of statistics in less than 2 s for all the K-Player combinations that have played together in the NBA regular season (2023–2024). In addition, the authors in [19] focused on close games and analyzed the offensive patterns and effectiveness of successful play sequences executed in the final minutes of such games.
2.2. Basketball KGs and Applications
First, with respect to ontologies, we were unable to find an ontology to cover our competency questions and application needs. The most related one is the IPTC Sports Schema1; however, it is quite generic and cannot capture the detailed information required for a basketball game. Moreover, the authors of [20] collected team and player data from basketball websites to construct an NBA Knowledge Graph (KG) and applied BERT to perform question answering over that KG. Similarly, Ref. [21] introduced a QA system grounded in a KG about the NBA that integrates natural language processing and machine learning techniques to address user queries. In [22], the authors constructed a multimodal basketball game KG for a single NBA season to store basketball game records data for teams and players for entity-aware video captioning. Furthermore, Ref. [23] presented a web application of Sports Question Answering. Finally, Ref. [24] introduced the SportQA benchmark, comprising 70,000 questions spanning multiple sports, including basketball, and covering topics such as historical information and complex scenarios.
2.3. Application of Semantic Filters and Text-to-SPARQL
Several works using semantic filters for creating SPARQL queries have been proposed, such as SPARKLIS [25] and RDF explorer [26]. Recently, there has been a trend of text-to-SPARQL approaches using LLMs across many real-world domains. Specifically, the authors in [27] provide such an approach for the Cultural Heritage domain, Ref. [28] presents an application for scholarly Knowledge Graphs, and [29] an approach for Medical Information.
2.4. Comparison and Positioning
Regarding approaches that provide analysis for the EuroLeague and NBA (e.g., [10,11,15]), our main focus is to show the capabilities of using a KG to answer semantically based complex questions. Moreover, compared to SPARQL applications (e.g., with semantic filters [25] and LLMs [27]), this work focuses on a different domain (i.e., basketball). The novelty of this work lies in the integrated design of a domain-specific semantic framework for basketball data and analytics. The proposed pipeline integrates (i) ontology-driven modeling, (ii) the construction of a large-scale KG covering 25 EuroLeague seasons with more than 5 million RDF triples, and (iii) multiple query and interaction paradigms, including semantic filtering and LLM-based text-to-SPARQL translation. While prior research has explored KGs for sports or text-to-SPARQL methods, the combined formalization and large-scale deployment of these components for basketball data have not been previously reported. To the best of our knowledge, this is the first work that integrates a EuroLeague basketball KG with LLM-based text-to-SPARQL methods, enabling natural language access to structured basketball analytics data.
3. An Ontology-Based Knowledge Graph for Basketball Box Scores
Here, we describe the use cases, a set of competency questions, the ontology, the modeling decisions, how we construct such a KG for the EuroLeague and the advantages of the KG approach.
3.1. Use Cases and Competency Questions of a Basketball KG
Here, we first analyze the use cases (UCs) for constructing such a KG for basketball box scores. For each use case, we also provide indicative competency questions.
UC1. Basketball (Historical) Analytics. By having all the data in a single KG, we can efficiently calculate basketball analytics for thousands of games and players. Therefore, it is feasible to provide an analysis which can be exploited by experts for several purposes; e.g., one can perform a historical analysis, such as to evaluate how basketball has evolved. For example, see questions Q1–Q5 in Table 1.
Table 1.
Indicative semantically based competency questions.
UC2. Data Browsing with Semantic Filters. Users usually prefer browsing by using several filters simultaneously. This is feasible by using an ontology-based KG and predefined query templates. This can enable the user to search with multi-attribute filters, e.g., nationality, height, position, statistics, dates and others. For example, see questions Q6–Q10 in Table 1.
UC3. Semantically Based Complex Question Answering. Here, a journalist or a fan desires to ask a simple or complex question that requires several data to have been semantically integrated. This is not trivial when the data are represented in several JSON files or even in SQL tables, since many joins and complex SQL queries are needed. On the other hand, by integrating all the data into a single KG based on a given ontology, the process of answering complex questions such as Q11–Q15 in Table 1 is facilitated. Finally, as we will see later, the capabilities of LLMs can aid in the enrichment of such complex questions, such as for question Q14.
3.2. The BBall Ontology
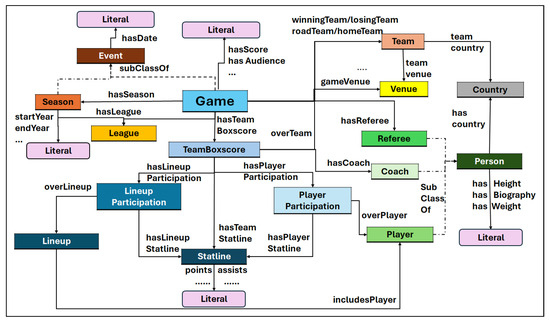
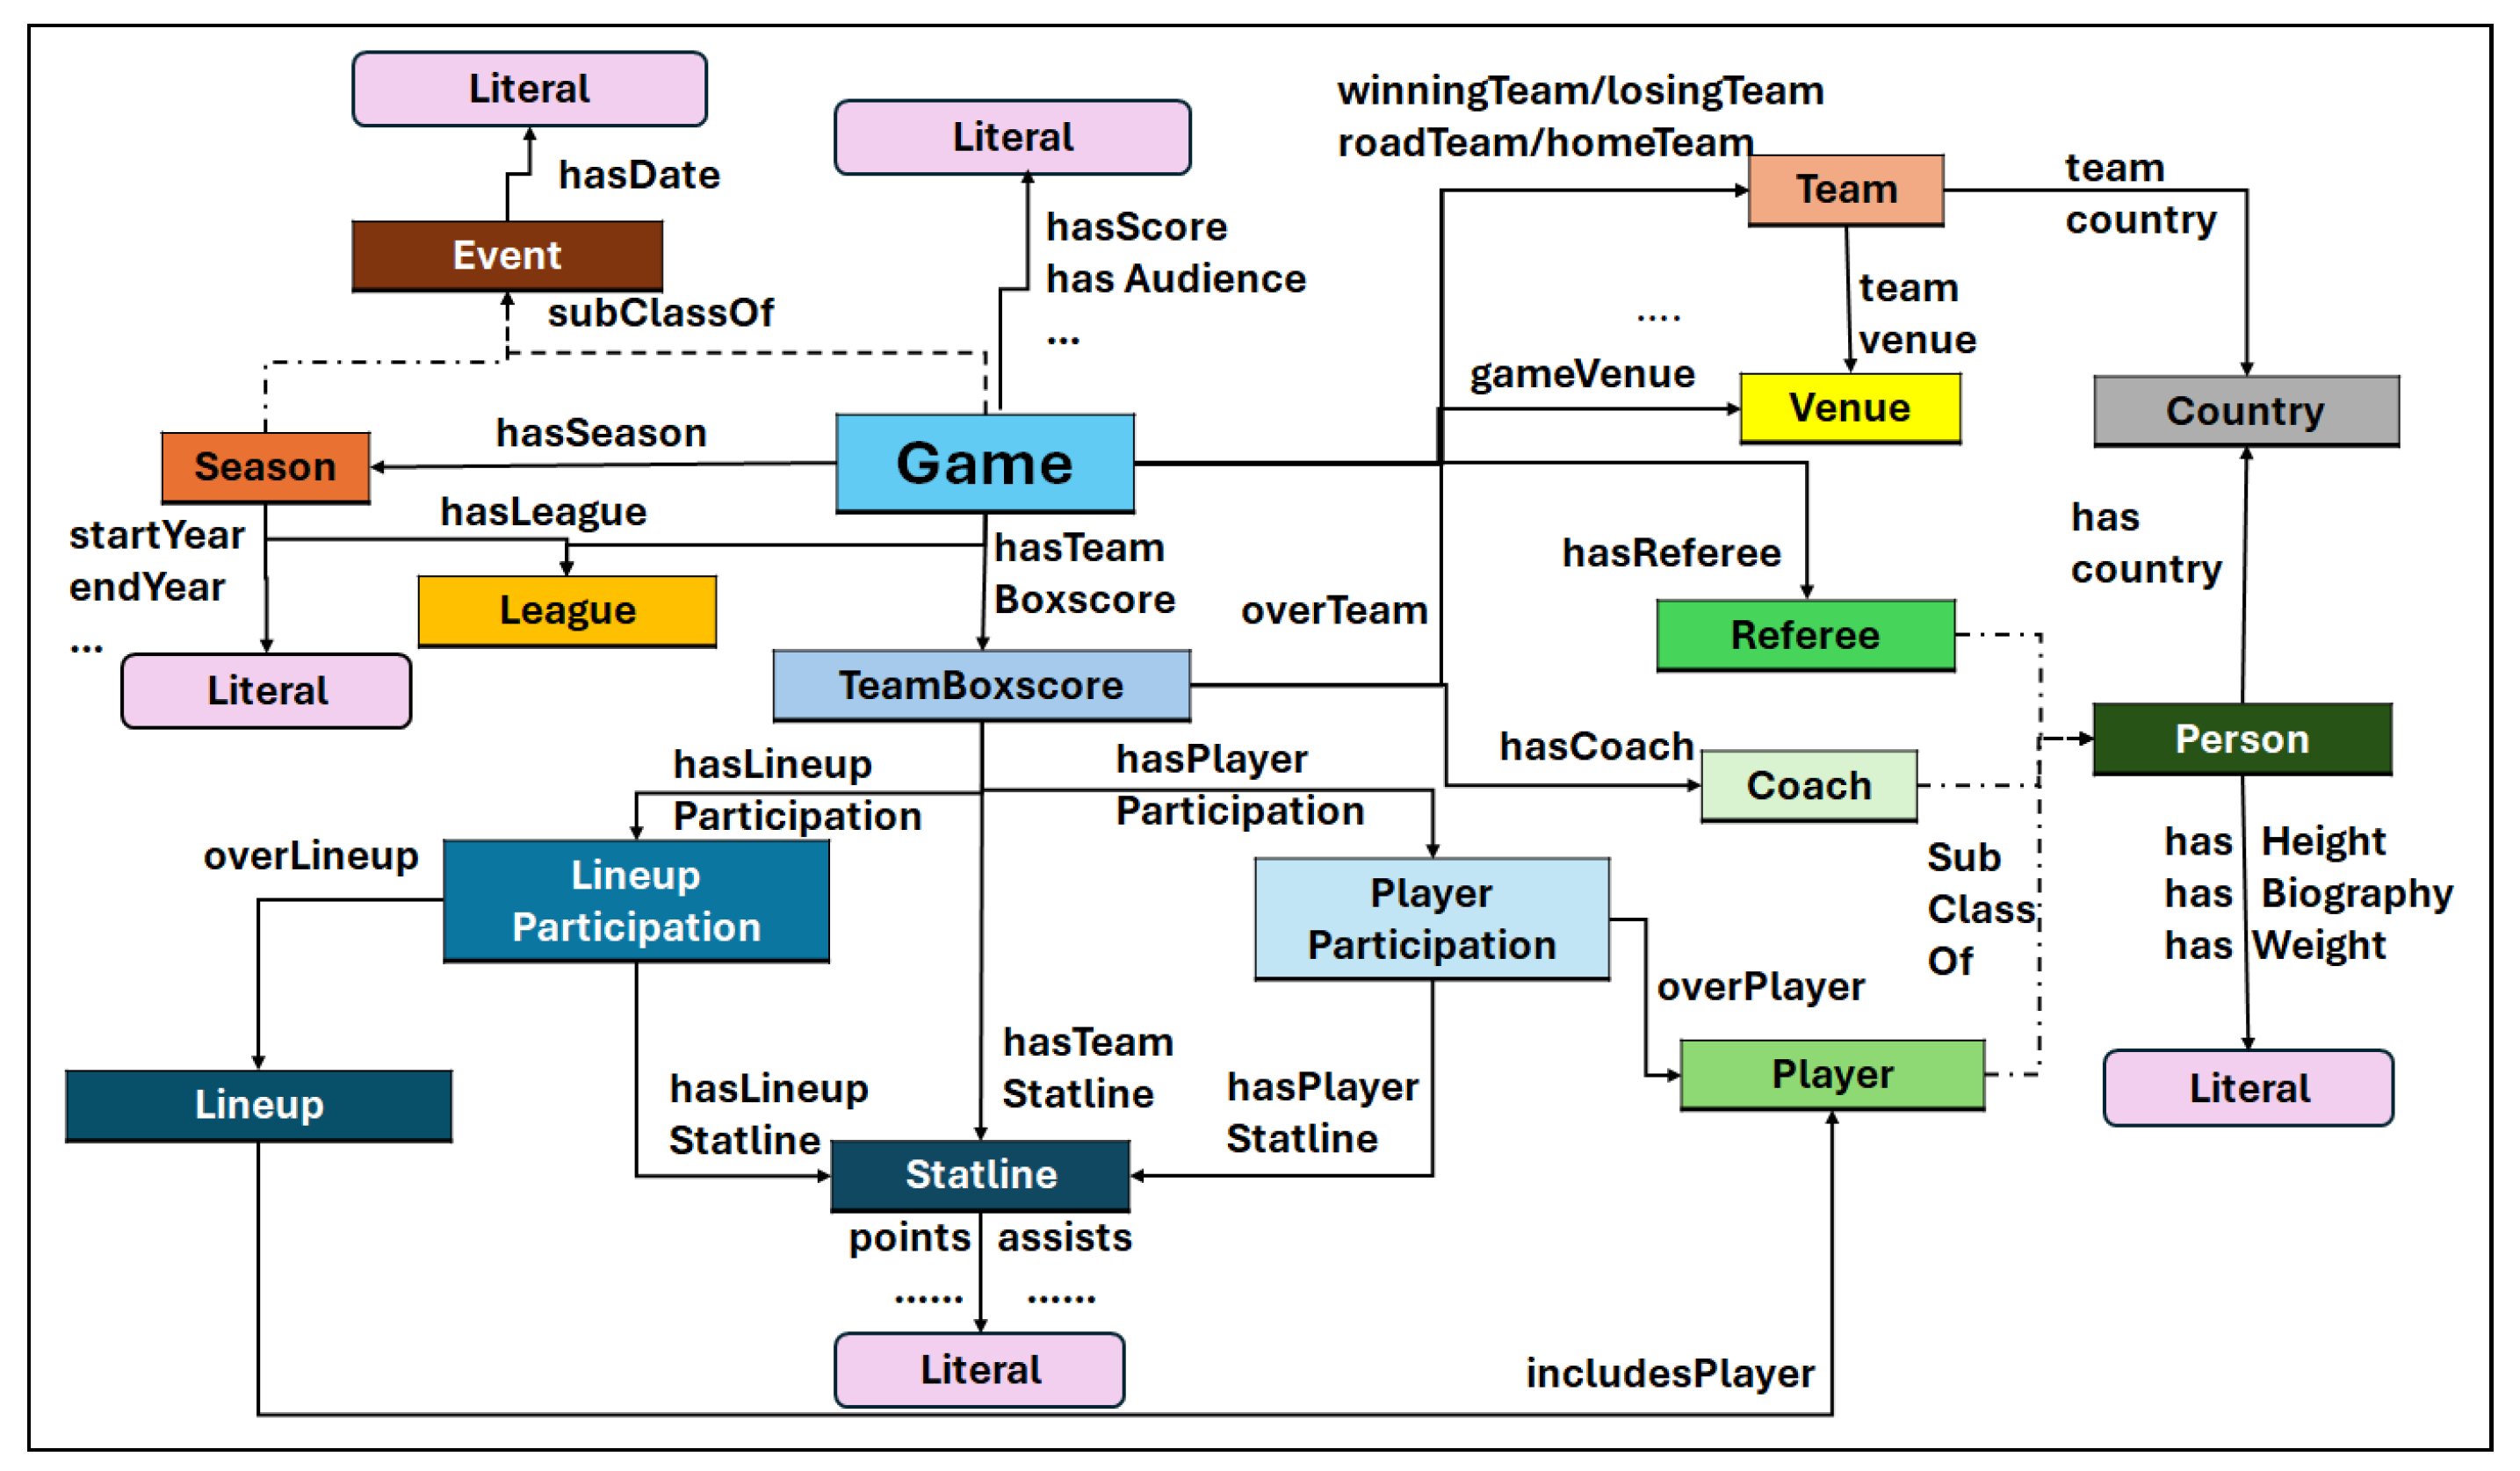
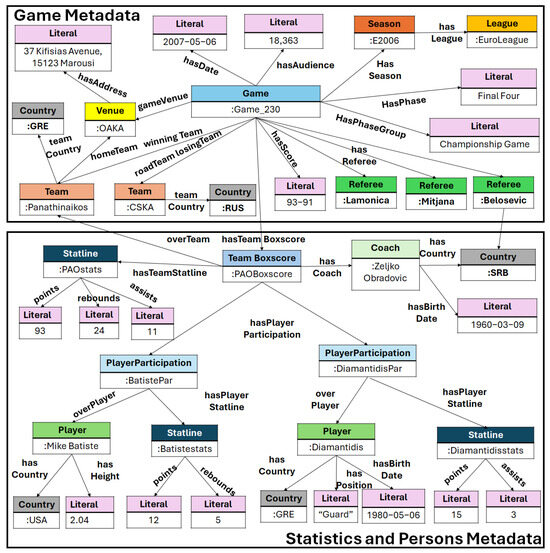
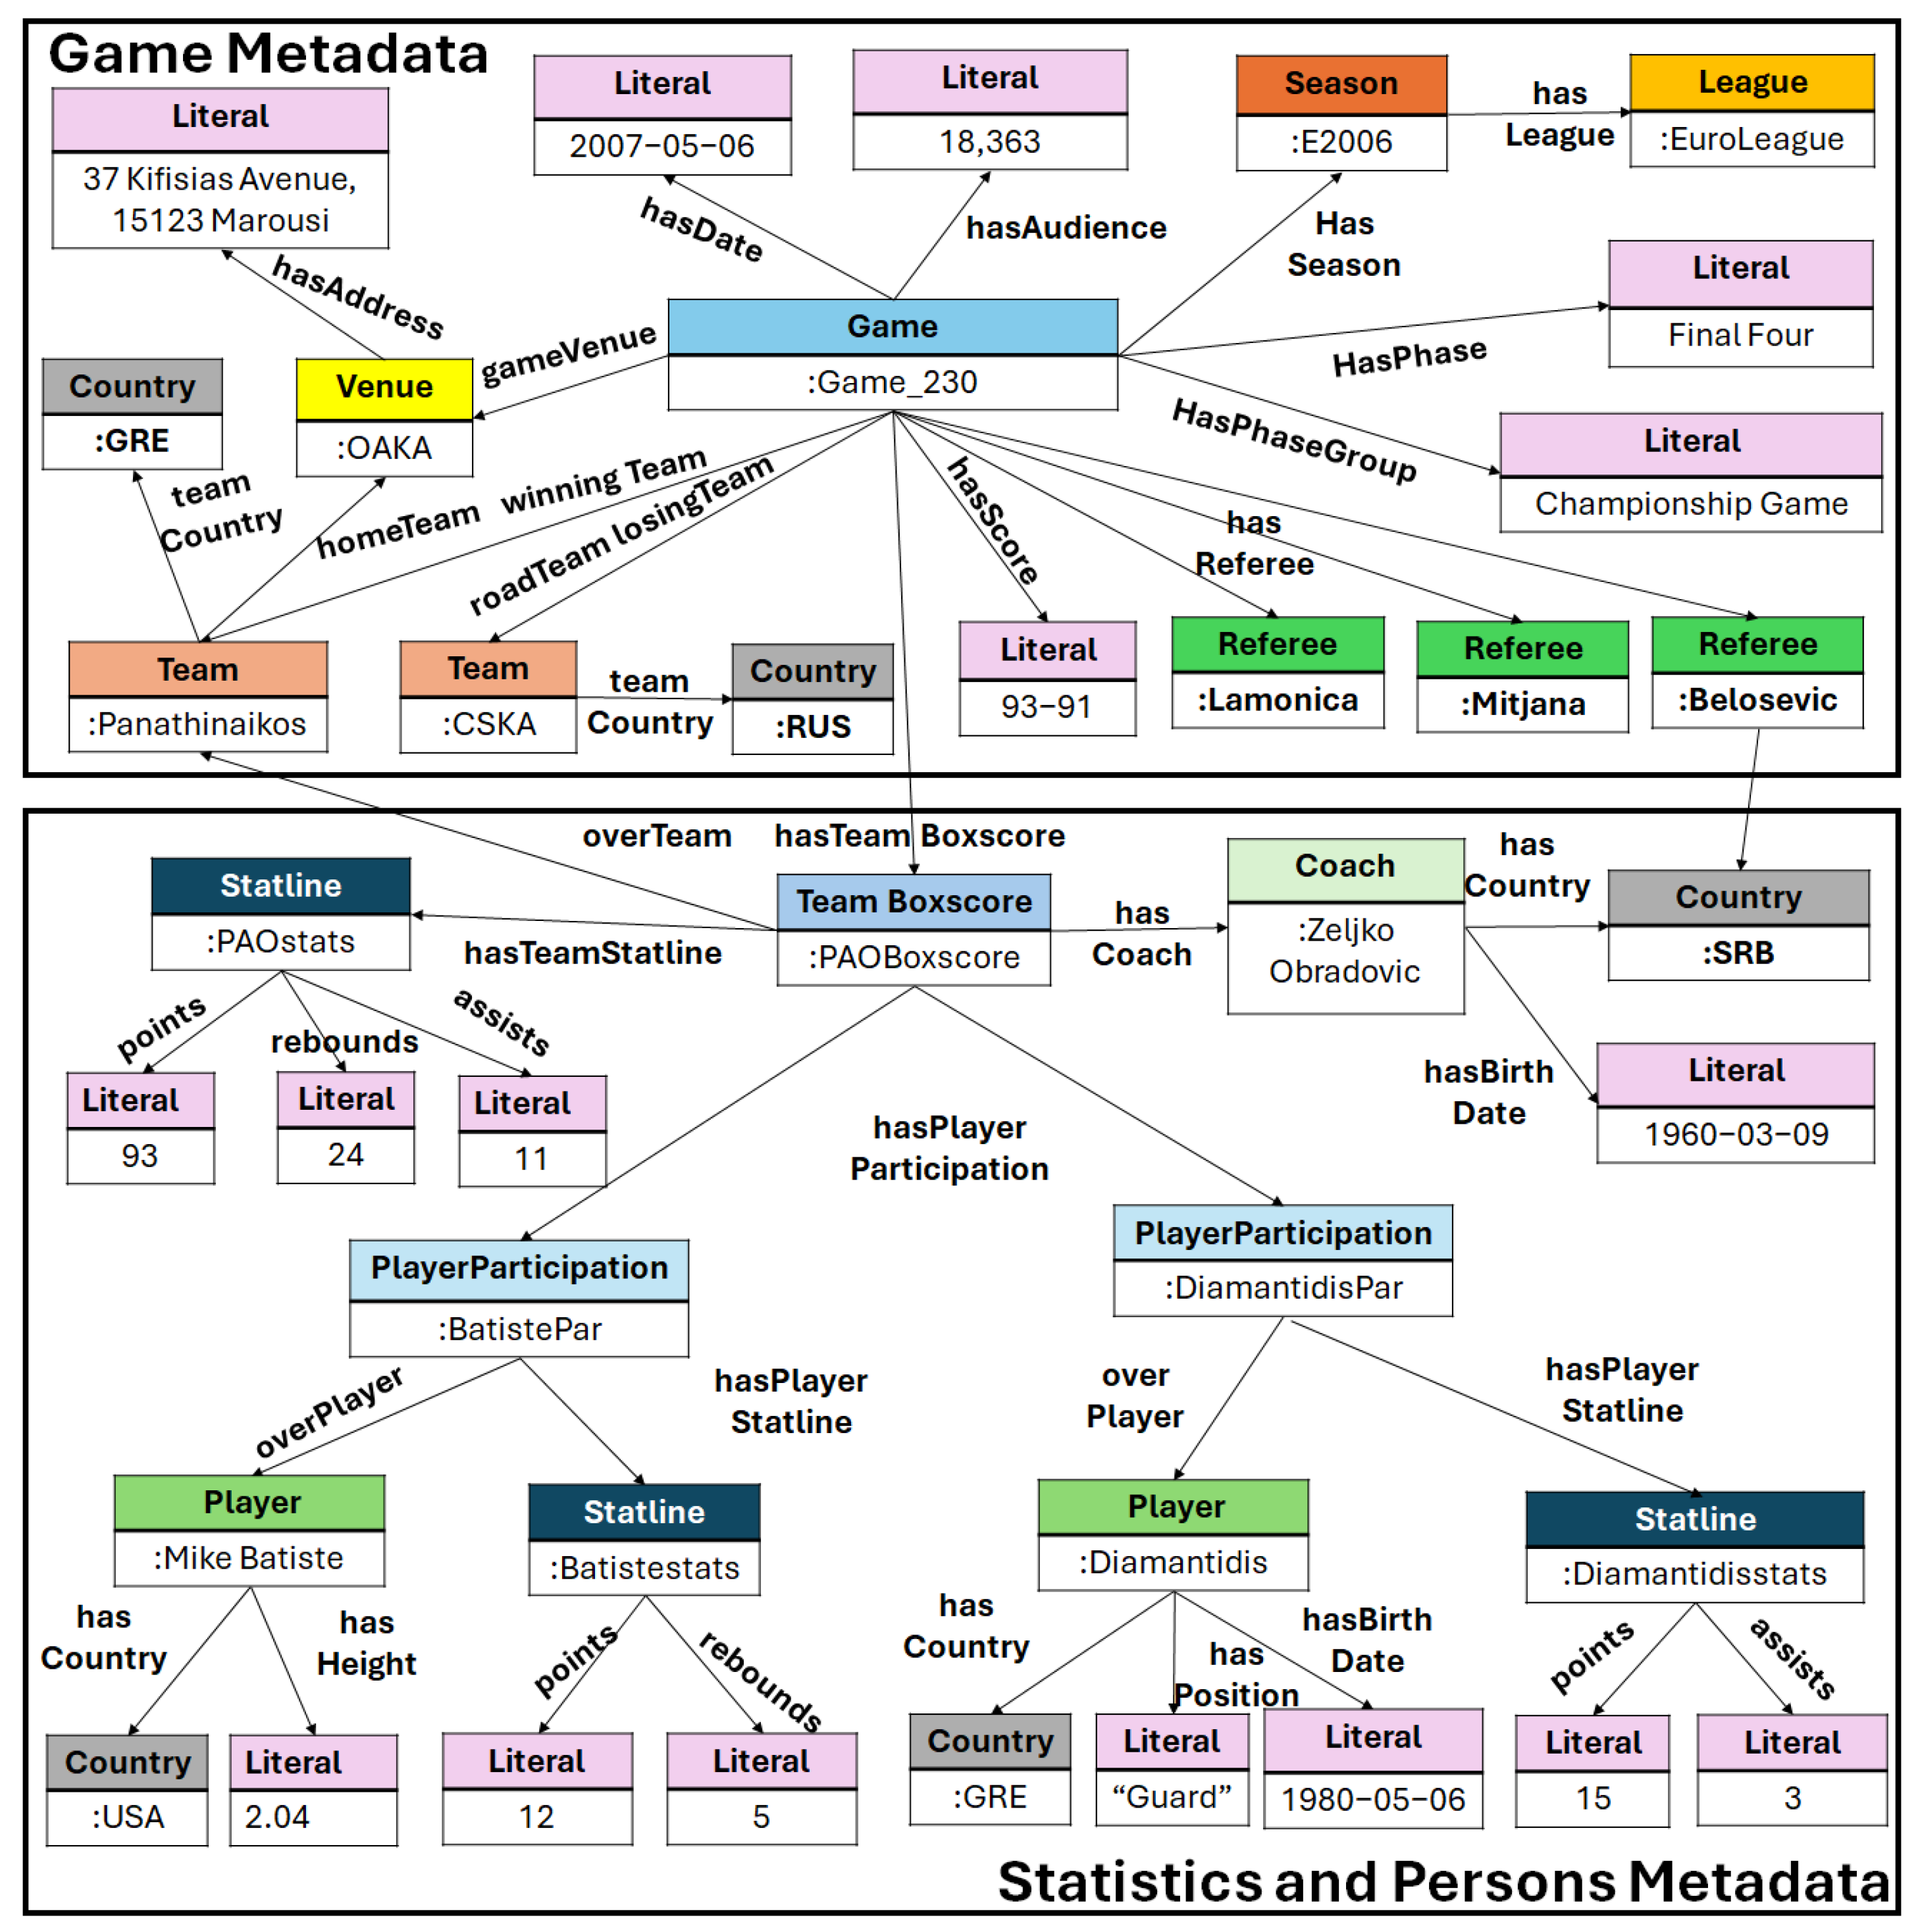
The BBall ontology can describe all the related information about the players and all the statistics that can be found in the box score of a basketball game. Below, we show examples of modeling for the main classes of the ontology. The key classes and properties of the ontology are depicted in Figure 2. As a running example we use the box score of the historical 2007 EuroLeague final (i.e., see Figure 3).
Figure 2.
The BBall ontology (key classes and properties).
Figure 3.
An example of a historical game with the key metadata and statistics.
Modeling the Game. The key class of the ontology is the Game, which includes all the major metadata of the game. As we can see in Figure 2 and Figure 3, it contains information such as its phase, round, venue, league, audience, teams, score, referees and others.
Modeling Teams. Each Team is represented with a unique identifier (URI) and is connected to each Game. For each game, we also include information about whether each Team was playing at home/on the road and if it was the winning or losing team. For each Team, we can store more information such as their Country, Venue and others.
Modeling Team box scores in the game. For each Game, we use the TeamBoxscore for modeling the statistics of each team. Each instance should be connected to a Team and to a Coach. Moreover, it is connected to the Statline where all the statistics of a Team for the given game are recorded. Concerning the Players of the game, the team box score is connected with instances of the class PlayerParticipation, which is explained below.
Modeling the Player Participation in the game. For each Player in the box score, we create a PlayerParticipation instance, which is connected to a single Player and to the player’s statistics in the game (again through an instance of the Statline class).
Modeling the Statline. This class has several properties representing the key statistics of a box score that are associated either with the whole team or with a single player, e.g., points and rebounds.
Modeling Players, Coaches and Referees. These are represented as instances of the Person class, and we need to create one instance per real-world person. For each person, we can have more information, such as their birthdate, country, height, weight and many others.
Other Classes/Properties. The ontology also includes other classes, such as the LineupParticipation and Lineup, in case one needs to record statistics of a given 5-Player Lineup in the game, e.g., see [18]. Consequently, it would be possible to ask questions such as “Give me the best 5-player lineup of Real Madrid in 2024–25 with the highest percentage of three-point shots”.
3.3. Validation and Publication of the BBall Ontology
The ontology comprises 16 classes, 25 object properties, and 63 data properties; some of them are shown in Figure 2. To ensure the quality of the BBall ontology, we employed the tool “Oops!” [30], and BBall passed all the consistency, completeness and conciseness ontology tests without any critical issues. For ontology documentation, we utilized WIDOCO [31], which offers an interactive visualization via the WebVOWL system [32]. Both the ontology and its documentation are accessible online2.
3.4. Domain-Specific Ontological Modeling Challenges
The development of the proposed ontology was driven by a set of domain-specific modeling challenges that arise in basketball analytics.
Dual-Level Statistics. A primary challenge concerns the representation of dual-level statistics. Box score data simultaneously describe the performance of teams and players. To address this, we adopted a participation-centered modeling pattern, separating persistent identity entities (e.g., Player, Team) from contextualized performance entities (e.g., PlayerParticipation, TeamBoxscore). This design ensures semantic clarity, avoids attribute duplication, and enables precise aggregation across seasons.
Temporal Requirements. This is a second major modeling requirement. Basketball competitions evolve across seasons, regular-season phases, playoffs, etc. The ontology therefore models season, phase, round, and date ranges explicitly, enabling statistically valid comparisons and temporal segmentation analyses.
Multi-Role entities and URI policy. Another challenge involves multi-role entities and identity evolution. Individuals may transition from player to coach, or a player can play in different teams even in the same season. The ontology separates a person’s identity from role-specific participation instances, allowing accurate modeling of role transitions without semantic ambiguity. A stable URI policy was adopted for obtaining persistent identifiers for entities that participate in several games, such as players, teams, referees and coaches.
Numeric constraints. Furthermore, numeric constraints and comparative analytics required a modeling strategy that supports efficient aggregation. Statistical measures are represented as typed literals attached to participation entities, facilitating SPARQL aggregation functions (e.g., AVG, SUM, COUNT) while preserving semantic normalization.
Ontology Extensions. The current modeling decisions facilitate future extensions, such as the integration of play-by-play data, by preserving the existing URI policy.
3.5. Constructing a Basketball KG—Case Study for EuroLeague
For the construction of the KG, we exploited the publicly available EuroLeague API3. We downloaded several JSON files through several API requests and we converted them to RDF files using the BBall ontology. For a consistent RDF Knowledge Graph, we use dereferenceable URIs for most of the entities (i.e., games, players, teams and coaches). All the RDF files (over 5 million triples) were uploaded to a single RDF KG through the Virtuoso engine. This engine also offers a SPARQL endpoint which is used by the demo applications for retrieving the desired data.
Updating the KG. The produced KG can be easily updated by producing and adding new RDF files for the upcoming games. Specifically, we perform an update after the end of each EuroLeague round. Since we use a specific URI policy and modeling, we perform an automatic approach that downloads only the JSON files of the games of each round, converts them to RDF and uploads them to the SPARQL endpoint. The complete process for an entire round requires less than 30 s, demonstrating the scalability of the update mechanism. Fast updating can be important in case of adding new types of data that could be used in real-time decision-support systems such as play-by-play systems. Supporting such real-time analytics would, however, require extensions to the ontology and the processing pipeline to enable continuous ingestion from the EuroLeague API, transformation, and semantic integration of event data into the KG.
3.6. Advantages of the Knowledge Graph Approach
Here, we present the advantages of using a KG instead of a relational database system (e.g., SQL-based). Overall, the KG approach provides schema flexibility, semantic interoperability, and conceptual abstraction, whereas relational systems are usually schema-bound and structurally related to predefined tabular representations. The main differences are explained in Table 2 and are analyzed below.
Table 2.
Conceptual comparison between KG and relational modeling in basketball analytics.
Multi-hop Queries. Basketball analytics involves multi-hop relationships between entities, such as players participating in games, games belonging to seasons, and players transitioning to other teams across time. In an RDF-based KG, such relationships are explicitly modeled as graph edges, enabling natural expression of multi-hop queries through SPARQL path patterns. As we can see in Figure 3, through the KG we can traverse the graph to find connections between the entities. For example, we can easily find all the people from the same country (e.g., referee Belosevic and coach Obradovic), all the games of a given season or round, teams from the same country, players with the same height or birth year and many others. In the KG of Figure 3, we can observe that Dimitris Diamantidis’s birthday was the day of the Championship Game of Final Four 2007. Moreover, we can see that even for the complex query Q11, through the proposed modeling we found an answer; i.e., a Greek player “Diamantidis”, with height 1.96 (less than 2.00), scored (at least) 15 points and the road team “CSKA Moscow” was from Russia.
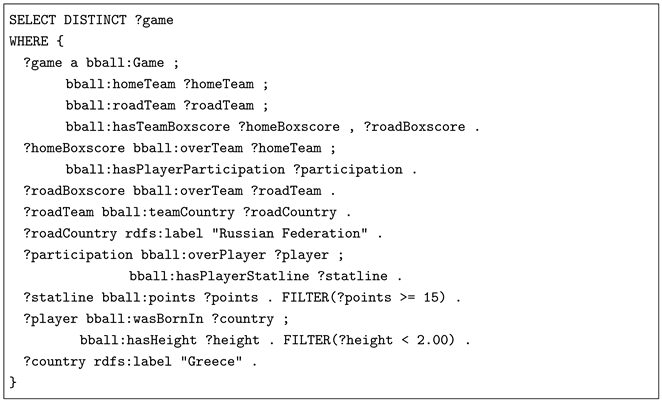
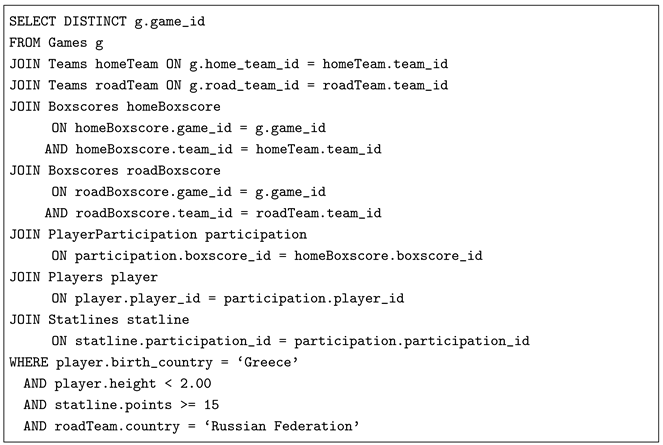
On the other hand, relational databases can represent such queries through joins; however, the number of required join operations increases with relational depth, leading to more complex and less maintainable SQL expressions. For the mentioned question, several joins (i.e., foreign keys in many SQL tables) could be needed, such as for the player information (nationality, height), the country of the team, and others. An example for SPARQL versus SQL for Q11 can be seen in Appendix A.
Data Integration and Flexibility. The ontology enforces modeling consistency across datasets and facilitates incremental integration of additional competitions (e.g., other European competitions or national leagues) by reusing the same classes (e.g., Game, Team, Player and others). New datasets can be added by instantiating these classes, while preserving a consistent URI policy. If it is necessary, entity alignment can be achieved via semantic properties such as the owl:sameAs [2]. This could facilitate the evaluation of queries from different leagues using the same schema, i.e., “I want all the games in any European National League where a player scored 40+ points”. In relational systems, integration of heterogeneous datasets often requires schema modification, creation of new tables and adjustment of foreign keys. The RDF model therefore provides greater flexibility for evolving, heterogeneous sports ecosystems.
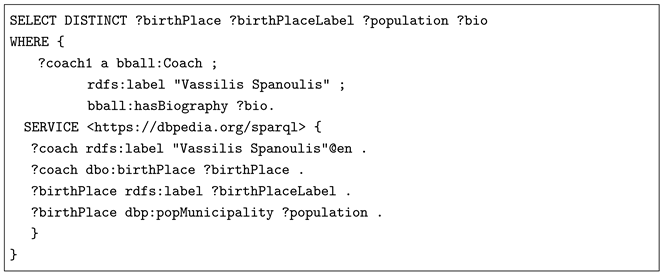
Interoperability with external KGs and Federated Querying. The KG approach supports interoperability with external KGs through standard semantic web mechanisms such as owl:sameAs links and federated SPARQL queries. Using the SERVICE clause, queries can dynamically combine data from external KGs (e.g., DBpedia or Wikidata), without requiring prior data extraction or schema transformation. In contrast, relational systems typically require explicit ETL (Extract, Transform, Load) pipelines, schema mapping, and integration layers to achieve comparable functionality across heterogeneous distributed databases. For example, from the below SPARQL federated query we can retrieve at the same time information for Vassilis Spanoulis from the constructed KG and from DBpedia KG, i.e., his biography from the presented KG and his birth place and its population from DBpedia KG.
Schema Evolution. Basketball analytics systems evolve over time, particularly when incorporating new types of data such as play-by-play events or advanced statistics. Suppose we extend the model to include play-by-play event data. In a relational schema, this would require introducing new tables, foreign keys, and adapting existing queries that rely on game-level statistics. In contrast, by using a KG, we can introduce a new class (e.g., PlayByPlayEvent) and link it to existing Game and Player entities using the existing URIs, without modifying prior data structures or invalidating existing SPARQL queries.
Natural Language Alignment. The ontology layer provides a semantic abstraction that aligns more closely with natural language concepts than relational table schemas. Classes such as Player, Game, and Season, as well as explicitly defined relationships, form a conceptual vocabulary that can be directly leveraged by LLM-based text-to-SPARQL systems. This semantic alignment allows for more accurate mapping between user queries and structured data representations. On the contrary, relational schemas often expose implementation-level constructs (e.g., join tables, foreign keys) that are less intuitive for natural language interfaces.
4. Applications Using the Ontology-Based RDF Basketball KG
Ontology-based RDF KGs can support a variety of applications. In this work, we present three prototype applications that exploit the basketball KG and correspond to the use cases described in Section 3. All applications rely on an RDF triplestore with a SPARQL endpoint, which enables the retrieval of query results. The applications are compared with a classical SPARQL query editor across multiple dimensions.
4.1. EuroLens: A Filter-Based Application Using SPARQL Templates
EuroLens is a prototype application that enables the retrieval of precise answers to complex analytical questions. It leverages a set of predefined filters that are mapped to SPARQL templates, allowing the generation of structured queries from user-specified criteria. The functionality of the application is summarized in the following subsections. The application is available at https://demos.isl.ics.forth.gr/HoopProphets/apps/eurolens (accessed on 18 March 2026) and a tutorial video can be found at https://youtu.be/uxwbzBhJcFU (accessed on 18 March 2026).
4.1.1. Functionality of EuroLens
EuroLens provides semantic data browsing across multiple entity types, including players, coaches, referees, teams, games, and venues.
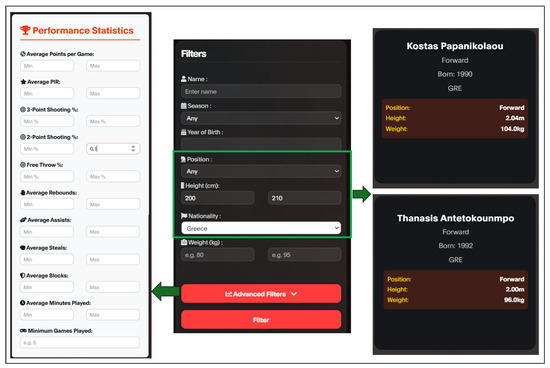
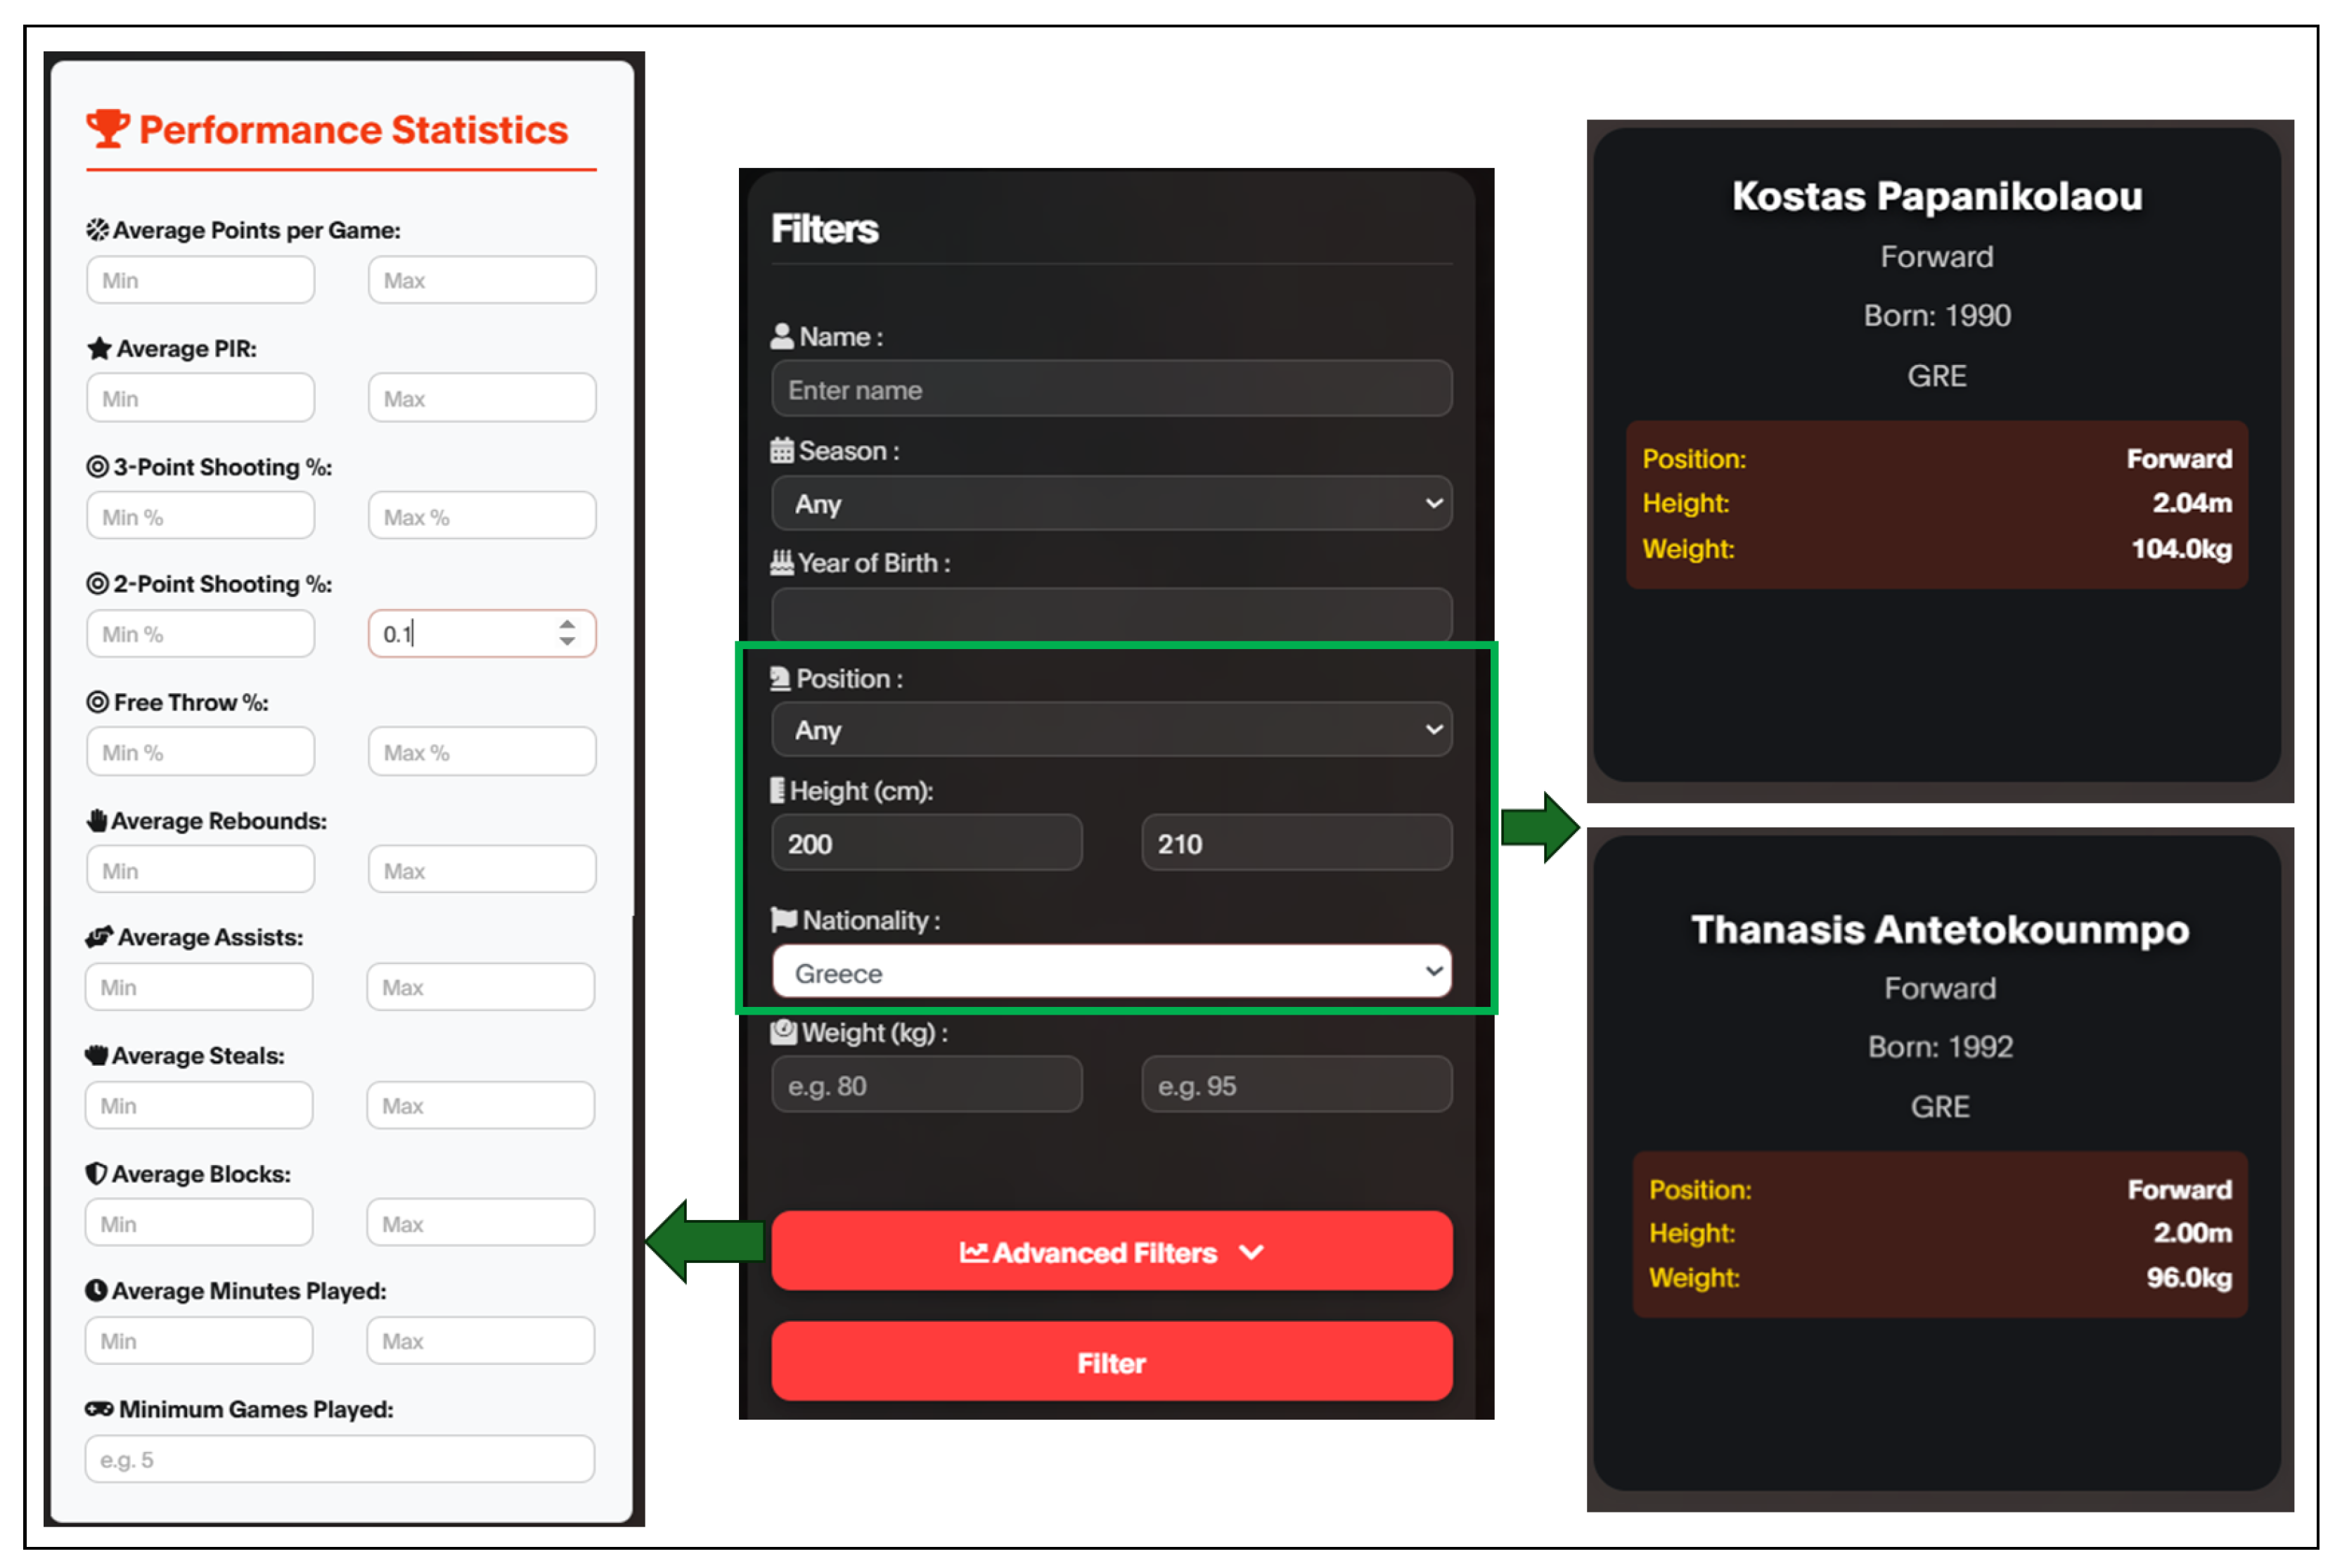
A. Searching for Players. Basic filters include name, position, season, height, weight, nationality, and birth year, while advanced filters capture performance metrics such as points, PIR, shooting percentages, rebounds, assists, steals, blocks, and minutes played. Moreover, advanced filters can be combined with basic filters, with the restriction that a single season must be specified. Figure 4 illustrates an example query for Greek forwards with heights between 2.00 and 2.10 m (here we present the visualization of just two players for space reasons).
Figure 4.
Example of filters for EuroLens application for players for Query Q10.
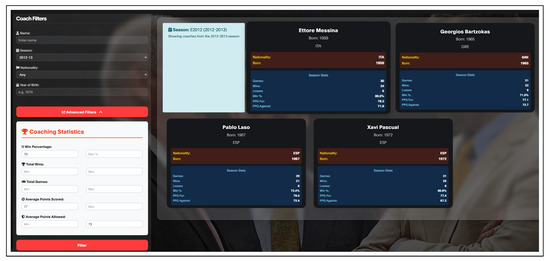
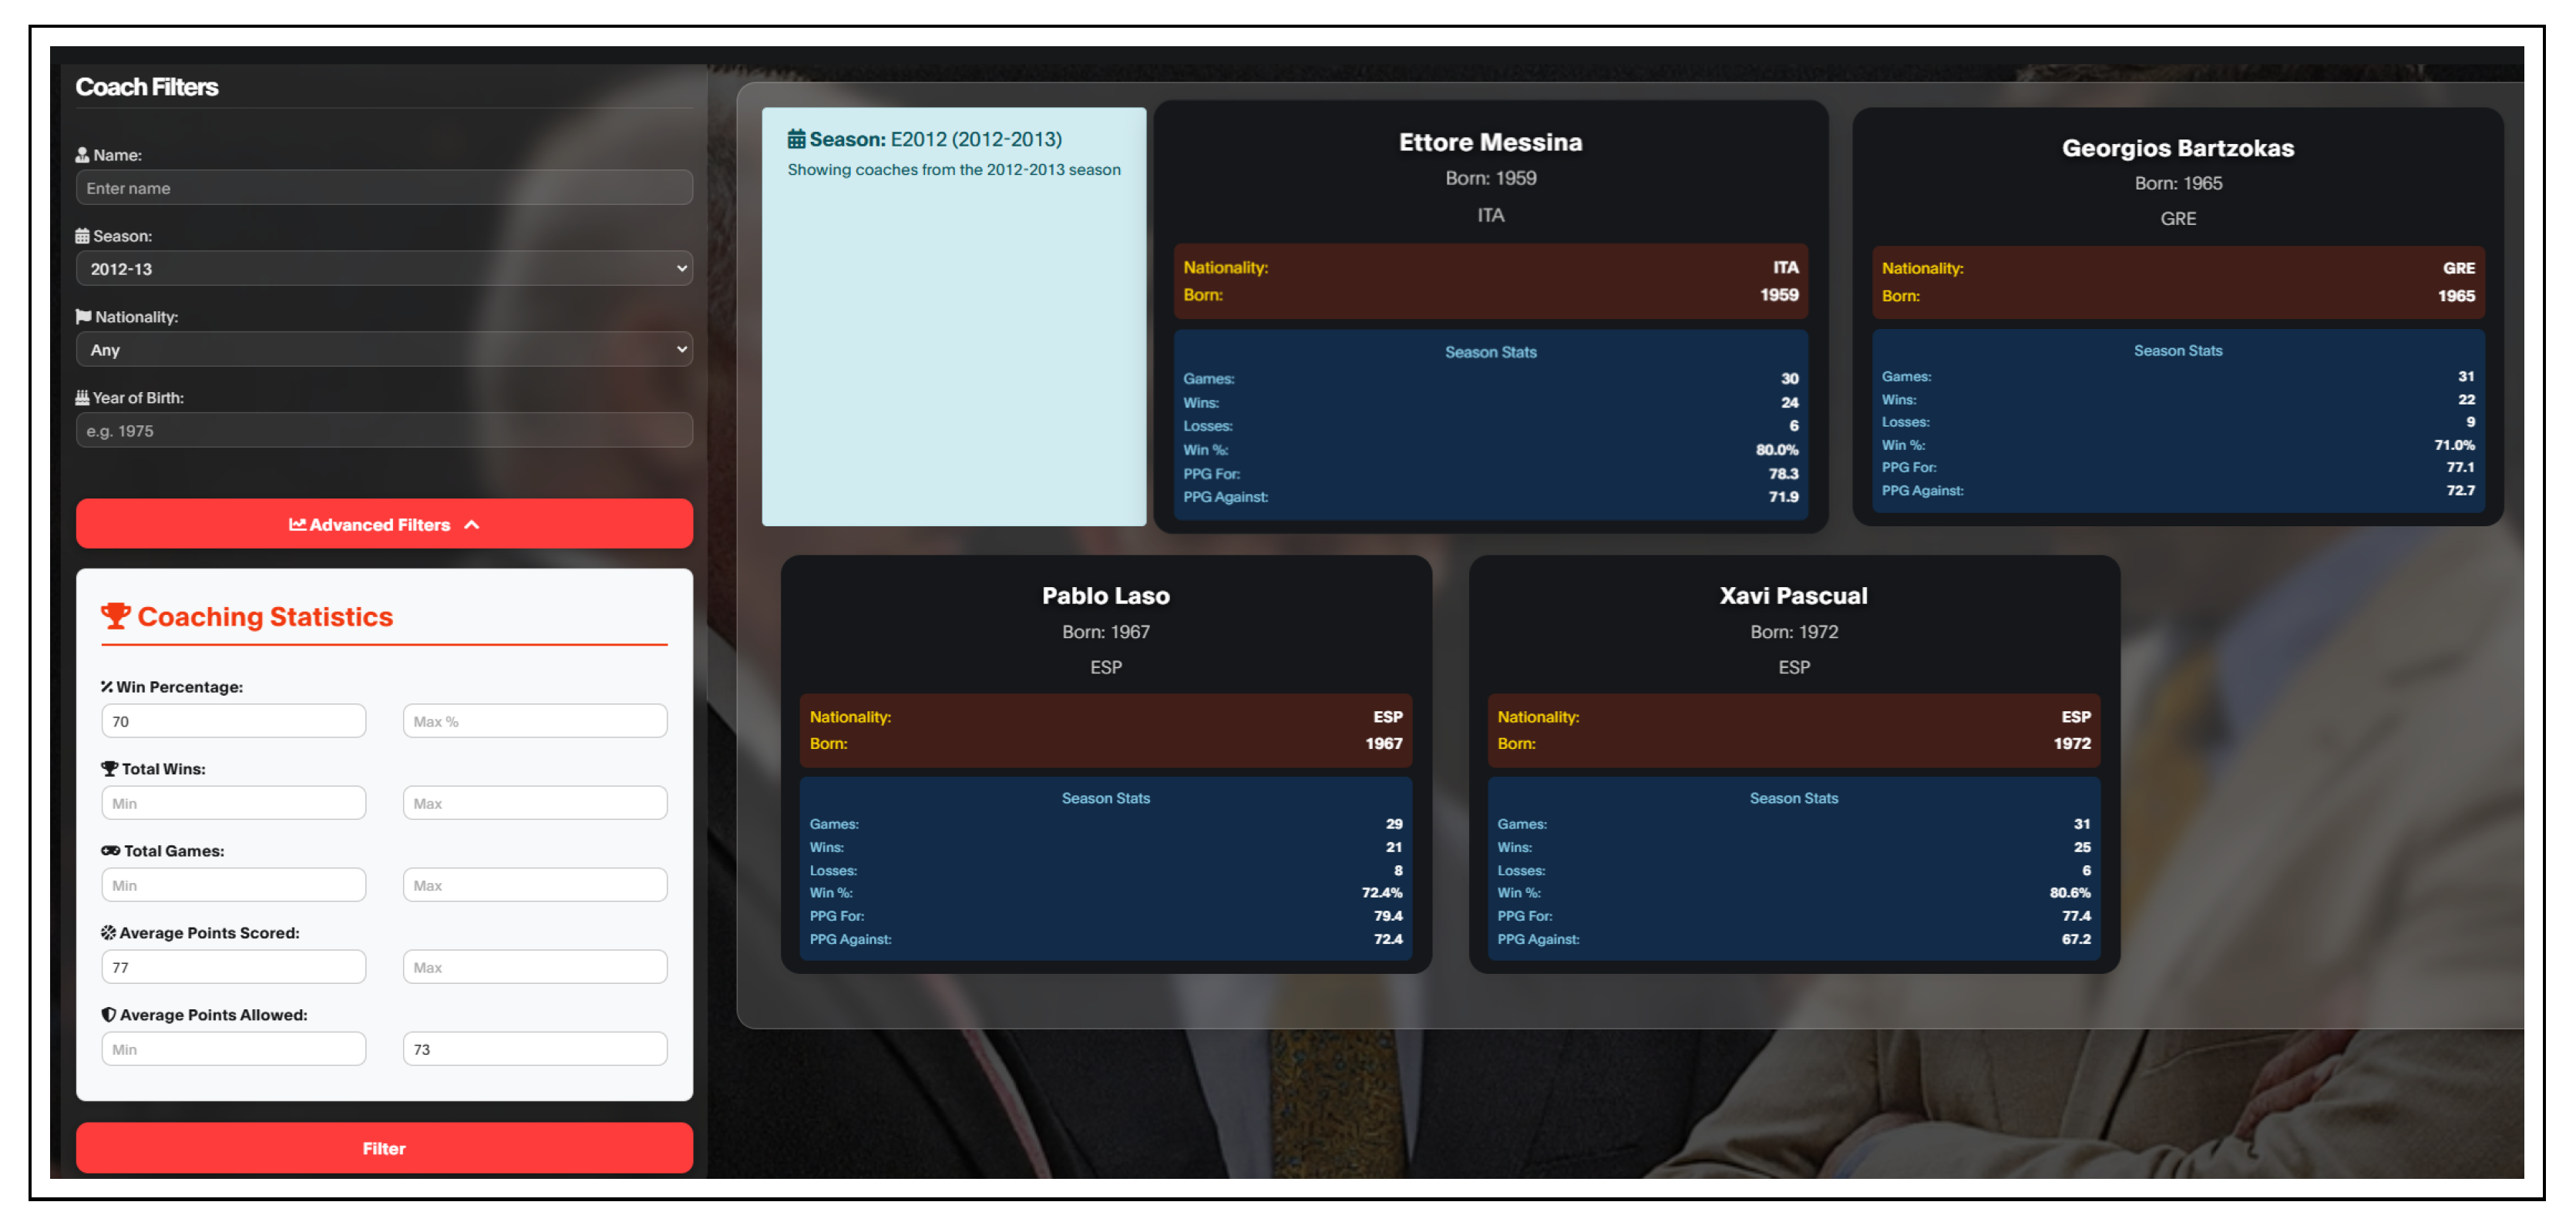
B. Searching for Coaches. Basic filters include name, season, nationality, date of birth, and performance statistics such as win percentage, total wins, total games, and average points scored and allowed. Figure 5 presents an example for the 2012–13 season, where we desire to find the coaches with an at least 70% win percentage, whose team scored on average at least 77 points, and whose opponent scored on average less than 73 points. In that example, the query returned four coaches based on these filters.
Figure 5.
Example of filters for EuroLens application for coaches.
Referees, Teams, Games, and Stadiums. Similar filter-based search mechanisms are provided for referees (e.g., fouls per game, home win percentage), teams (win percentage, average points, total wins), games (season, date range, phase, round, score, venue), and stadiums (capacity, average attendance, home win percentage).
Other functionalities. The website offers a modern user interface, where the user can also browse live standings, and offers an auto-complete mechanism to enable fast searches for specific teams, players, and coaches.
4.1.2. How EuroLens Works
The users arrive on the home page with live standings and recent matches, and to navigate, they click on sections (Players, Coaches, Games, Referees, Stadiums, Teams). They can use the sidebar filters to select their preferences and can click the filter button for retrieving the desired results. By clicking the button, the selected filters are used in SPARQL templates for the generation of the SPARQL query. As an example, below we show the template for the basic filters of players, where the variables “${filters}, ${seasonFilter}” will be replaced with the user options.
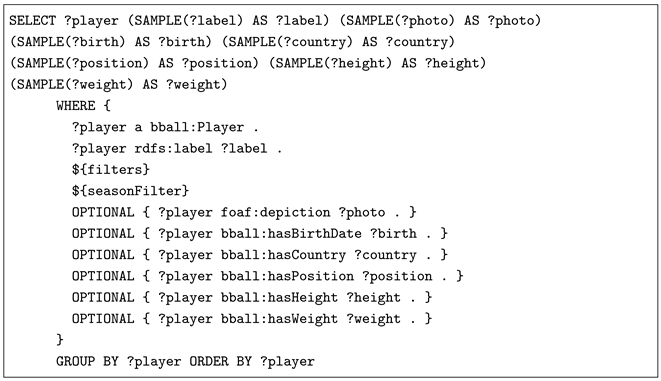
In Figure 4, the user desires to find all the Greek players that are forwards whose height ranges from 2.00 to 2.10. In this case, for the above template, we need the following changes to retrieve the results.
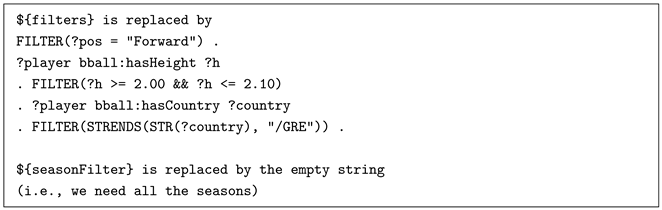
Afterwards, the SPARQL query is sent to the endpoint, and the results are retrieved and visualized with card-based layouts including photos and key statistics (e.g., see the right part of Figure 4). The user can click on the entities to further explore more information about them. The results are automatically updated and shown to the user without the need to reload the web application.
4.2. HoopProphets: A Text-to-SPARQL Application Using LLMs
This system employs a pre-generated prompt template containing RDF classes, literal patterns, and datatypes to guide SPARQL query generation. Users submit questions, which the selected LLM converts into SPARQL queries. Queries are executed against the KG, and results are returned in HTML table format. A demo of this prototype is available at https://demos.isl.ics.forth.gr/HoopProphets/ (accessed on 18 March 2026), and a video showing the application can be accessed at https://www.youtube.com/watch?v=X6HCxxFDgXM (accessed on 18 March 2026).
4.2.1. Functionality of HoopProphets
Below, we provide the main functionality offered by the HoopProphets application, where a screenshot is depicted in Figure 6.
Figure 6.
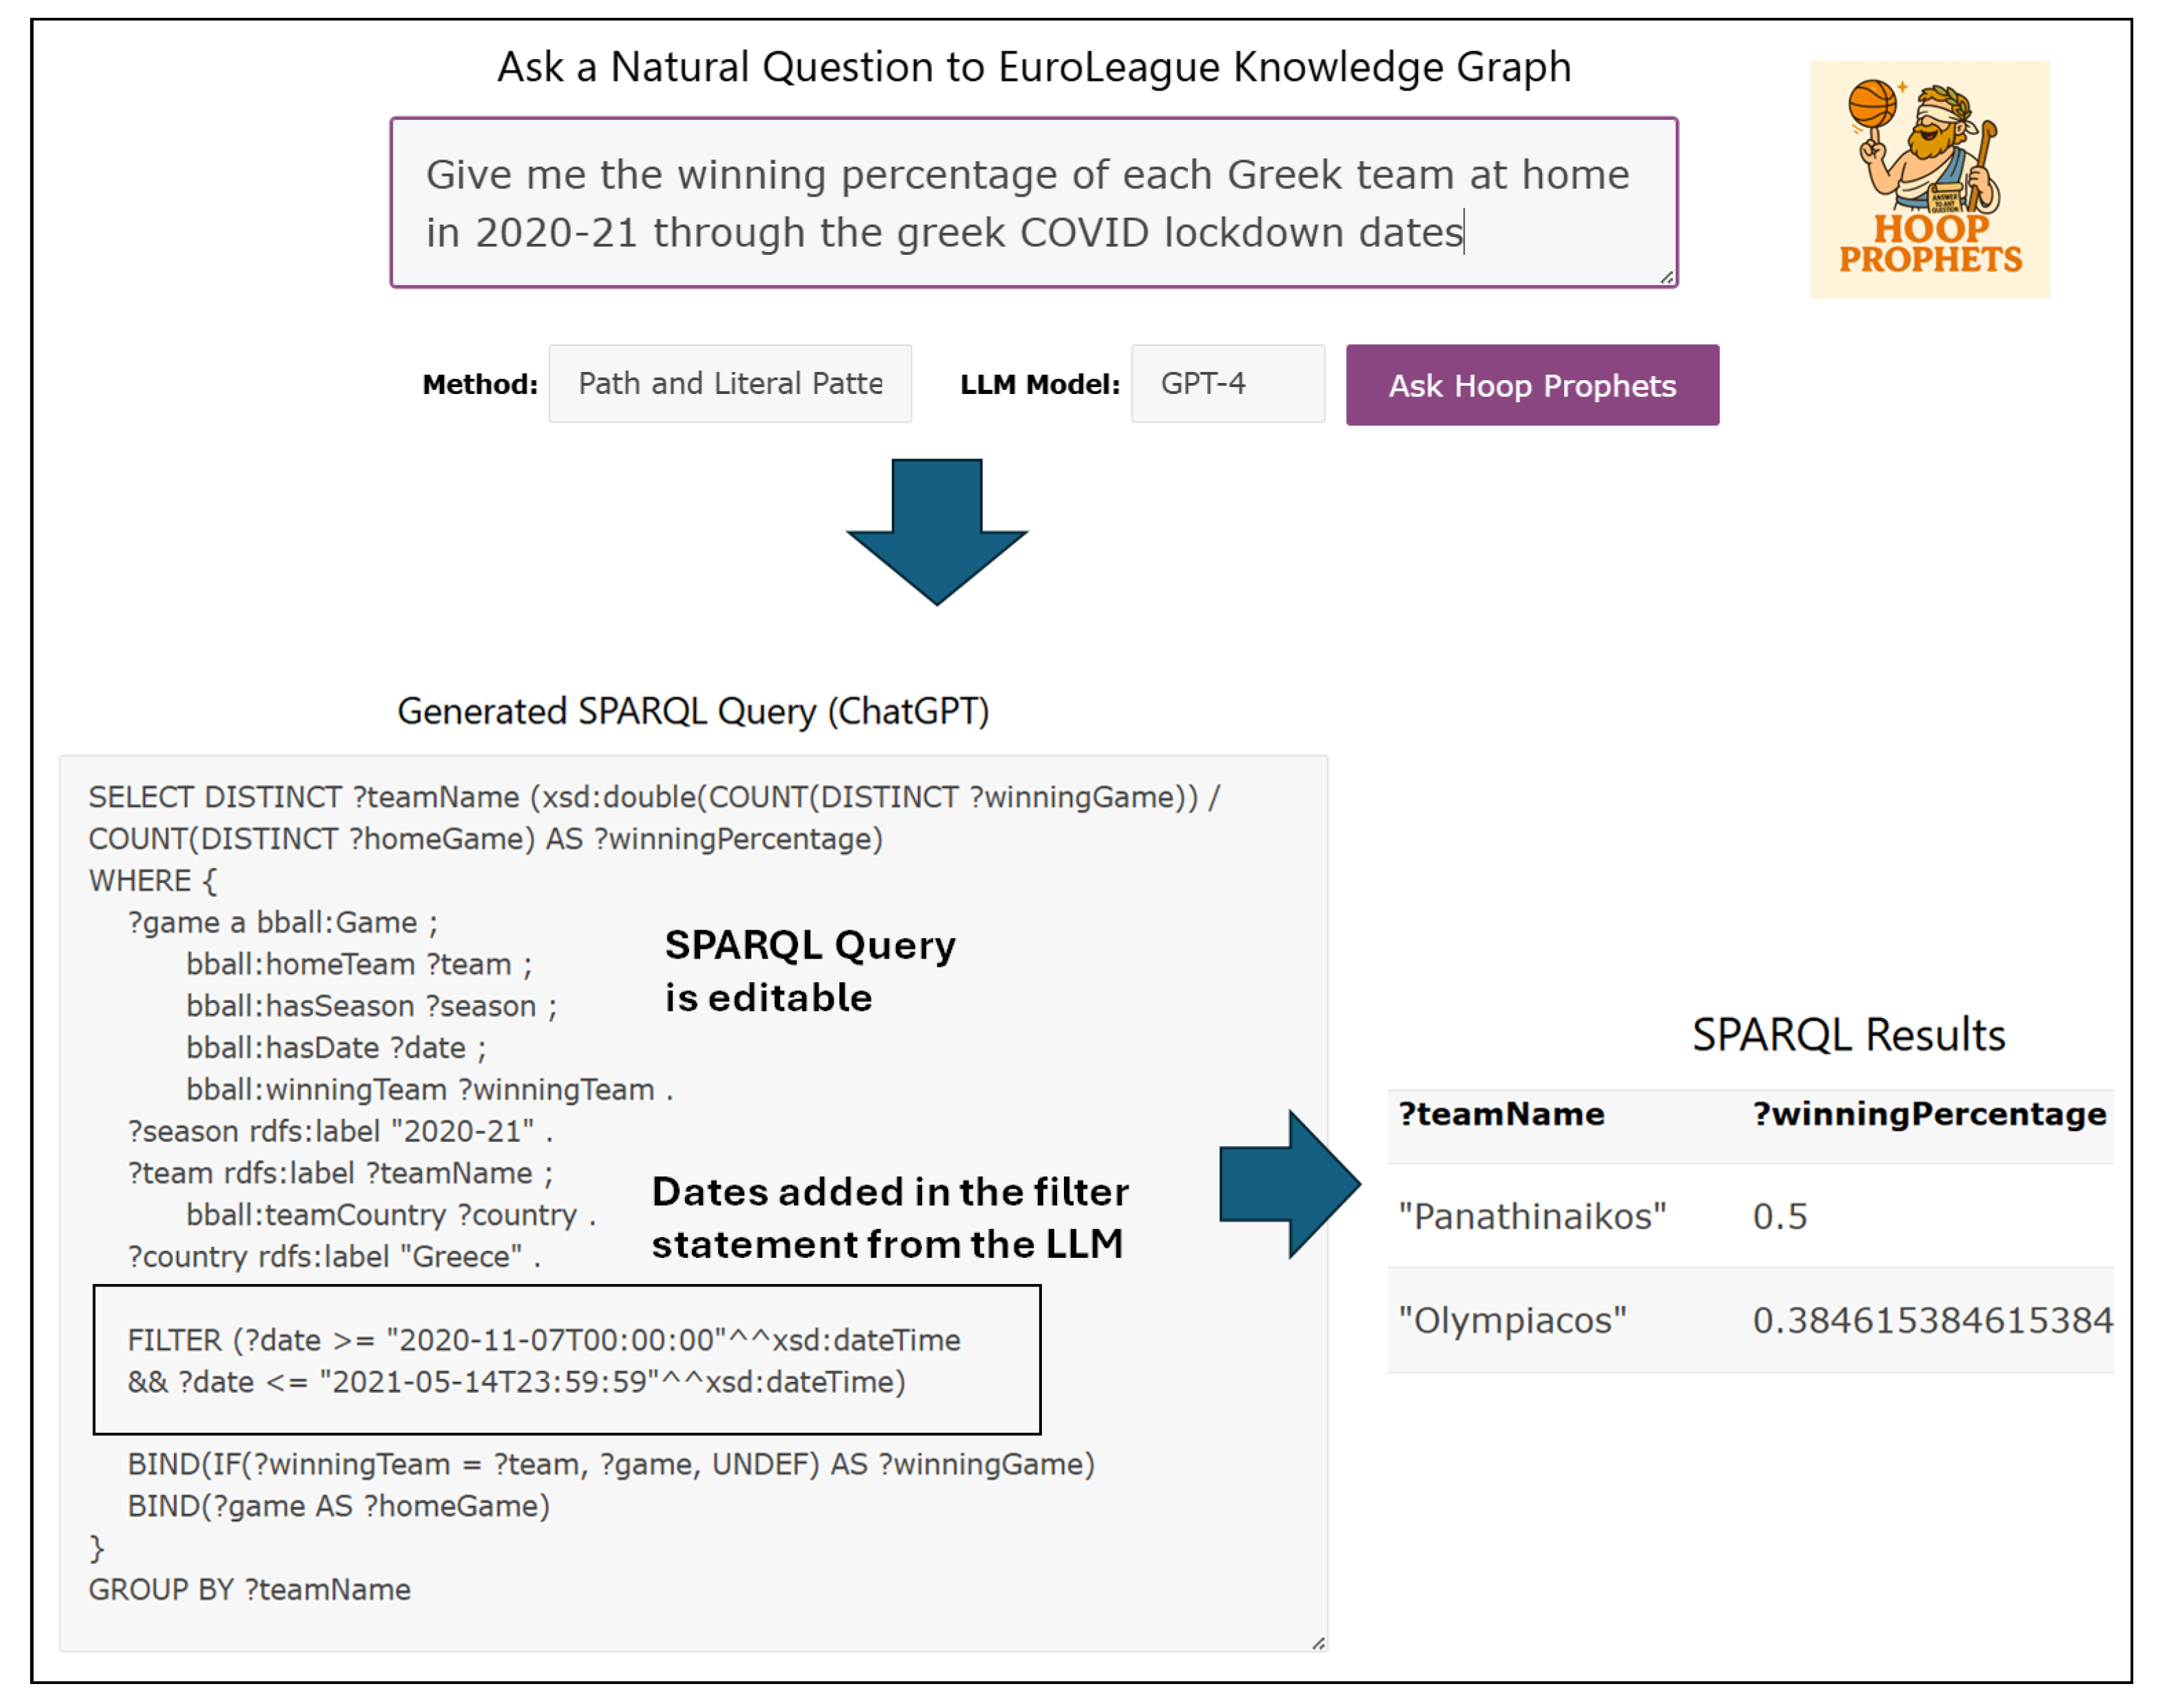
Example of HoopProphets application for question Q14.
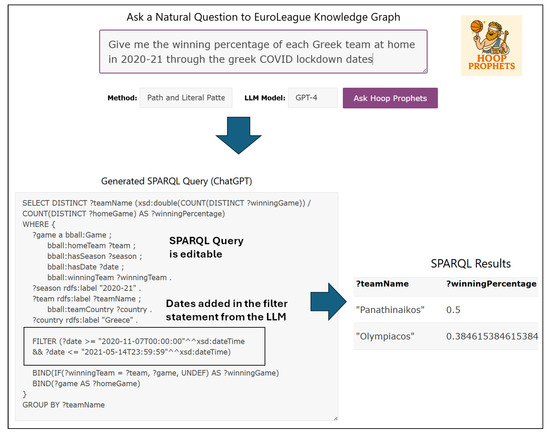
Question Answering (multilingual). HoopProphets retrieves the user question in any natural language (based on a method and an LLM) and exploits LLM prompts to retrieve a SPARQL query. The query is then sent to the SPARQL endpoint and the results are returned to the user, e.g., see Figure 6.
Query Enrichment. An advantage of combining LLMs and KGs is that the LLM can add values that are not part of the KG to the filter statement of the query, e.g., see question Q14 of the competency questions (Table 1). The KG does not contain the exact dates of the Greek lockdown and does not have information about COVID; however, the LLM added the exact dates to the filter statement (of the SPARQL query) and produced the results. This can be seen in the left part of Figure 6.
Query Editing/Ontology Learning. Users can review and edit the generated SPARQL queries, facilitating understanding of the underlying ontology and KG structure; e.g., the user can change the generated SPARQL query depicted in Figure 6.
4.2.2. How HoopProphets Works
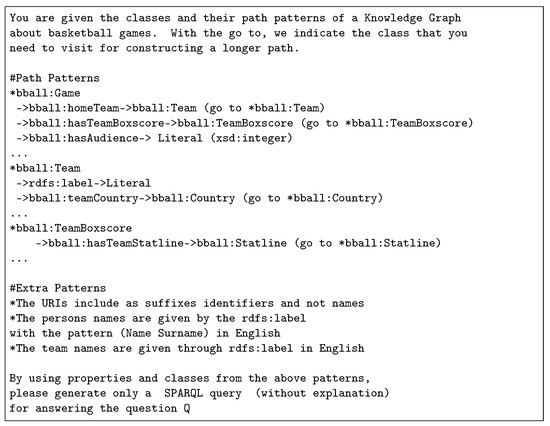
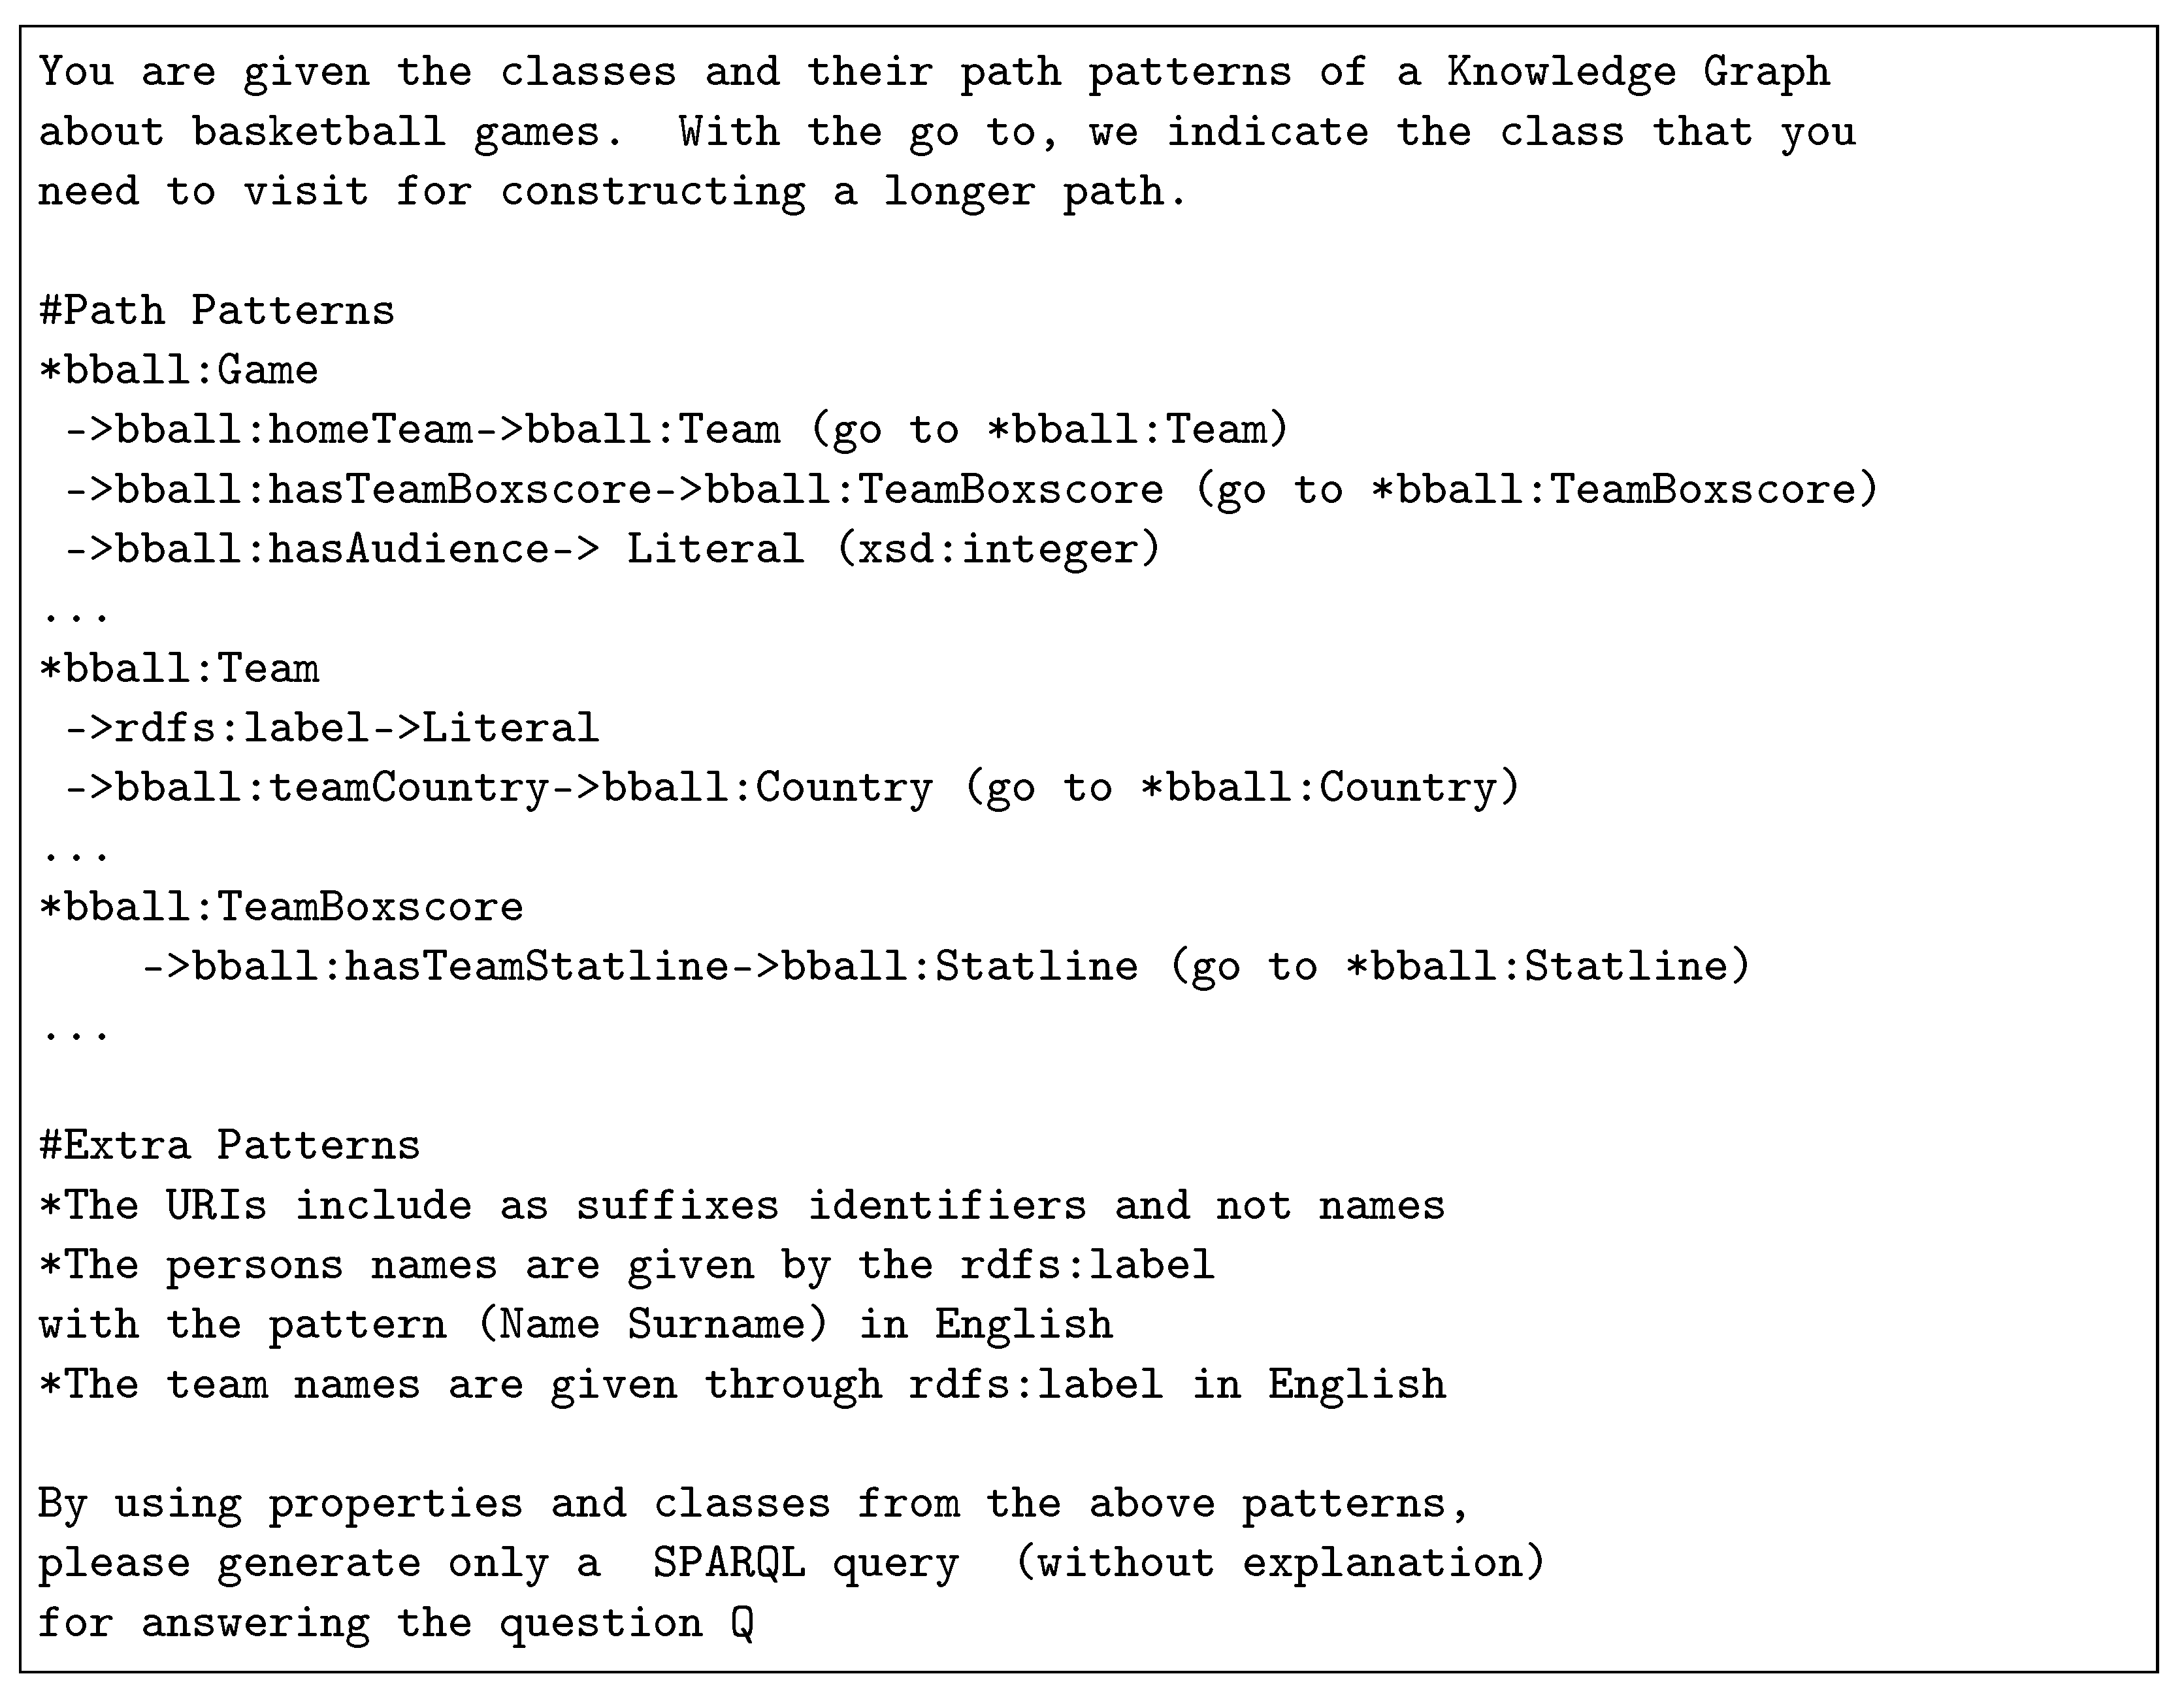
The text-to-SPARQL approach was proposed in [33] and is explained in brief below. Specifically, a pre-generated prompt template is exploited (see Figure 7), which includes the ontology path and literal patterns grouped by each RDF class of the BBall ontology, and the datatypes of literals (they can be important for queries that require sums, averages, comparisons, etc.). These patterns contain properties that can have either a class, such as “Game –> homeTeam –> Team”, or a literal, such as “Game –> hasAudience –> Literal (xsd:integer)”, as an object. For each triple pattern, we differentiate between two categories of objects to support traversal of longer paths (e.g., in multi-hop queries): (a) for classes, we use the “go to” command to indicate the class that should be followed to extend the path, and (b) for literals, we specify the corresponding datatype.
Figure 7.
A part of the prompt template for the path and literals pattern method.
Afterwards, the prompt is submitted to the selected LLM, which produces a SPARQL query according to the specified guidelines. The query is then executed on the SPARQL endpoint to obtain the results. If the query returns an empty set, the previous two steps can be repeated. Finally, the results are converted to HTML tables format for the final user.
4.3. EuroLens-Chat: A Dialogue-Based Text-to-SPARQL Application Using an LLM
EuroLens-Chat extends the functionality of HoopProphets into a dialogue-based interface. The system formats SPARQL results into concise, human-readable answers and retains conversational context across multiple turns, supporting parallel conversation threads and preserving dialogue history. The demo is available at https://demos.isl.ics.forth.gr/HoopProphets/apps/eurolensChat (accessed on 18 March 2026), and a video showing the application can be accessed at https://www.youtube.com/watch?v=Yrso92TYOTc (accessed on 18 March 2026).
4.3.1. Functionality of EuroLens-Chat
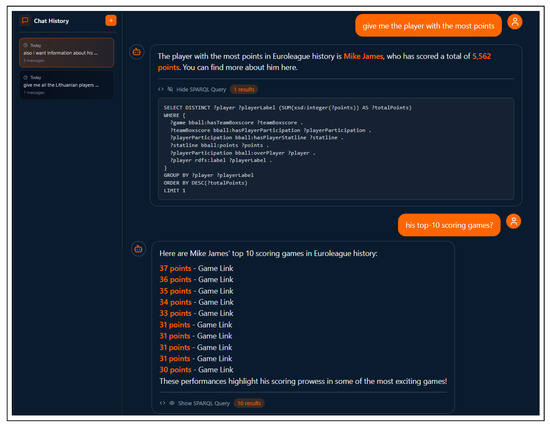
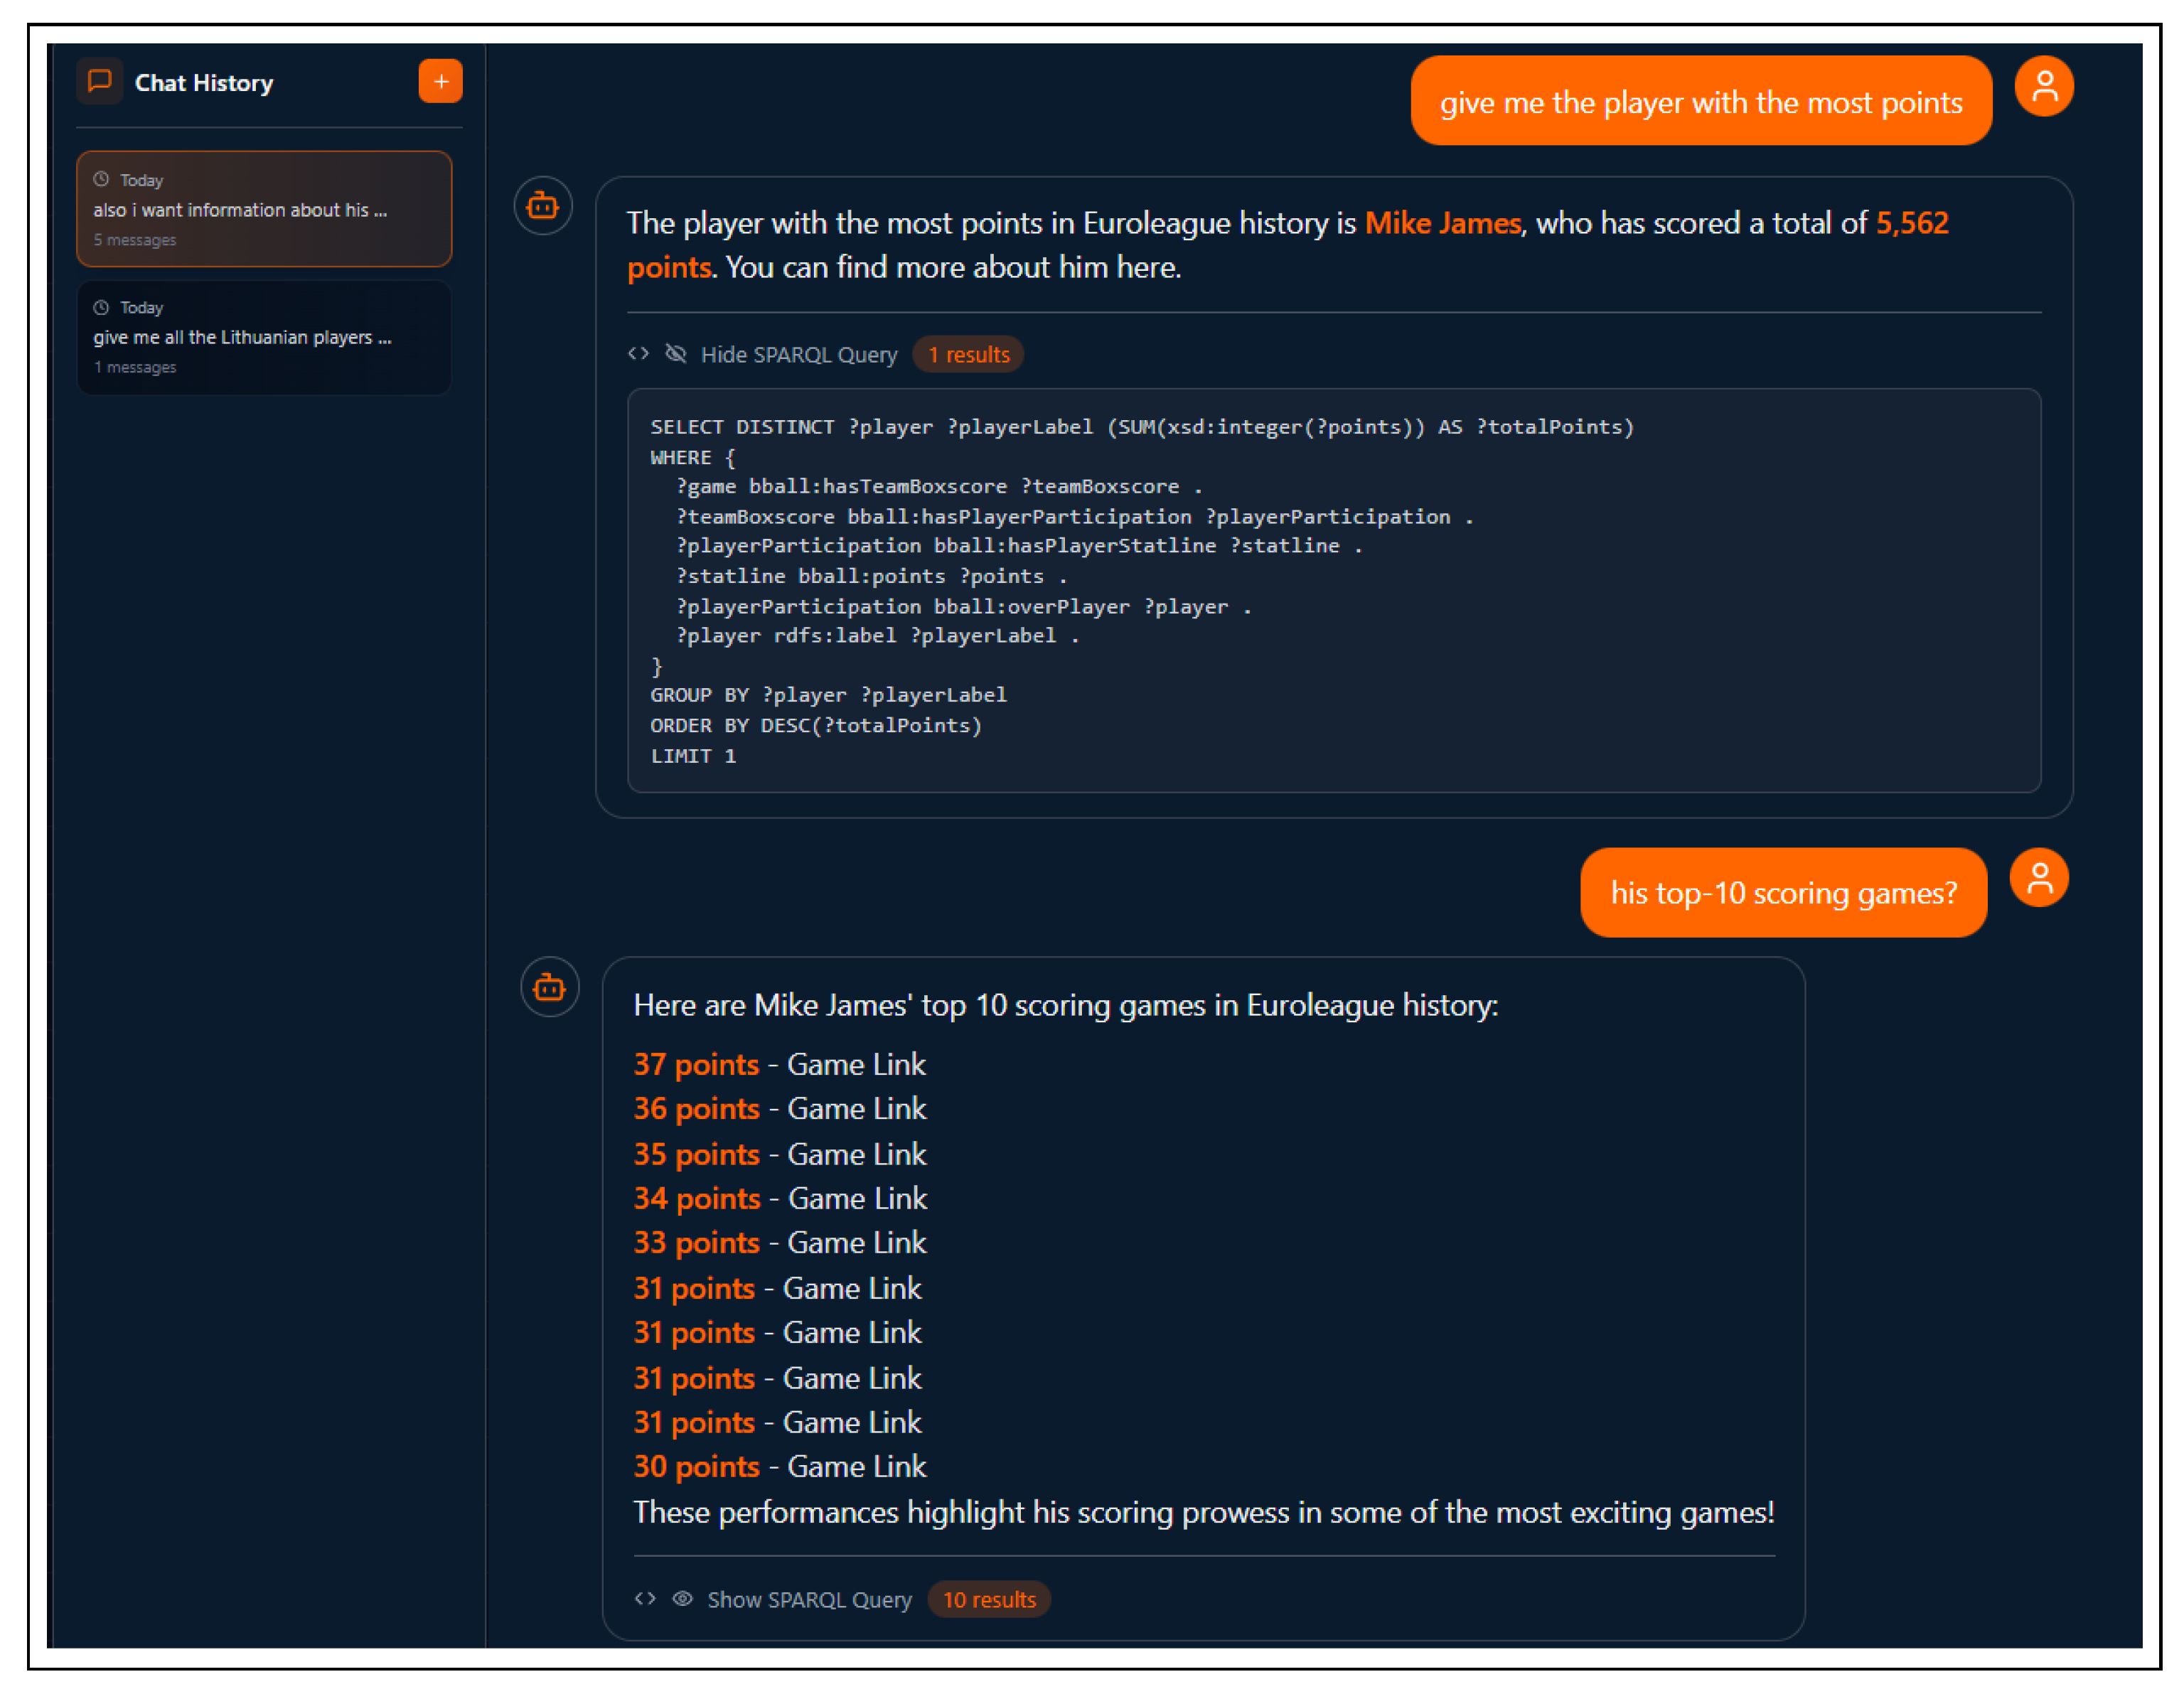
We discuss the main functionality of EuroLens-Chat (see a screenshot in Figure 8).
Figure 8.
Example of EuroLens-Chat dialogue-based system.
Smart Result Formatting. It exploits LLMs to summarize large raw SPARQL result sets and to provide concise and informative responses. Also, it formats numerical values and literals into human-readable representations. For example, see the first question of Figure 8, where the system provided such a response for the first scorer of the EuroLeague.
Conversational context. It can retain context across turns and manage multiple conversation threads. This enables coherent, stateful interactions and allows users to continue discussions without losing prior information. For example, in Figure 8 we continued the dialogue and we asked about the top-10 scoring games of the first scorer.
User Interface Capabilities. It includes an interactive chat interface with conversation history, e.g., see the upper left side of Figure 8. Also, it includes a SPARQL Query Viewer, enabling users to toggle and view (but not edit) the generated SPARQL queries directly (e.g., see the SPARQL query for the first question in Figure 8).
4.3.2. How EuroLens-Chat Works
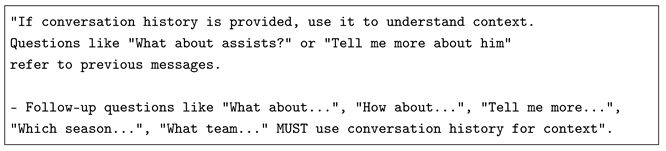
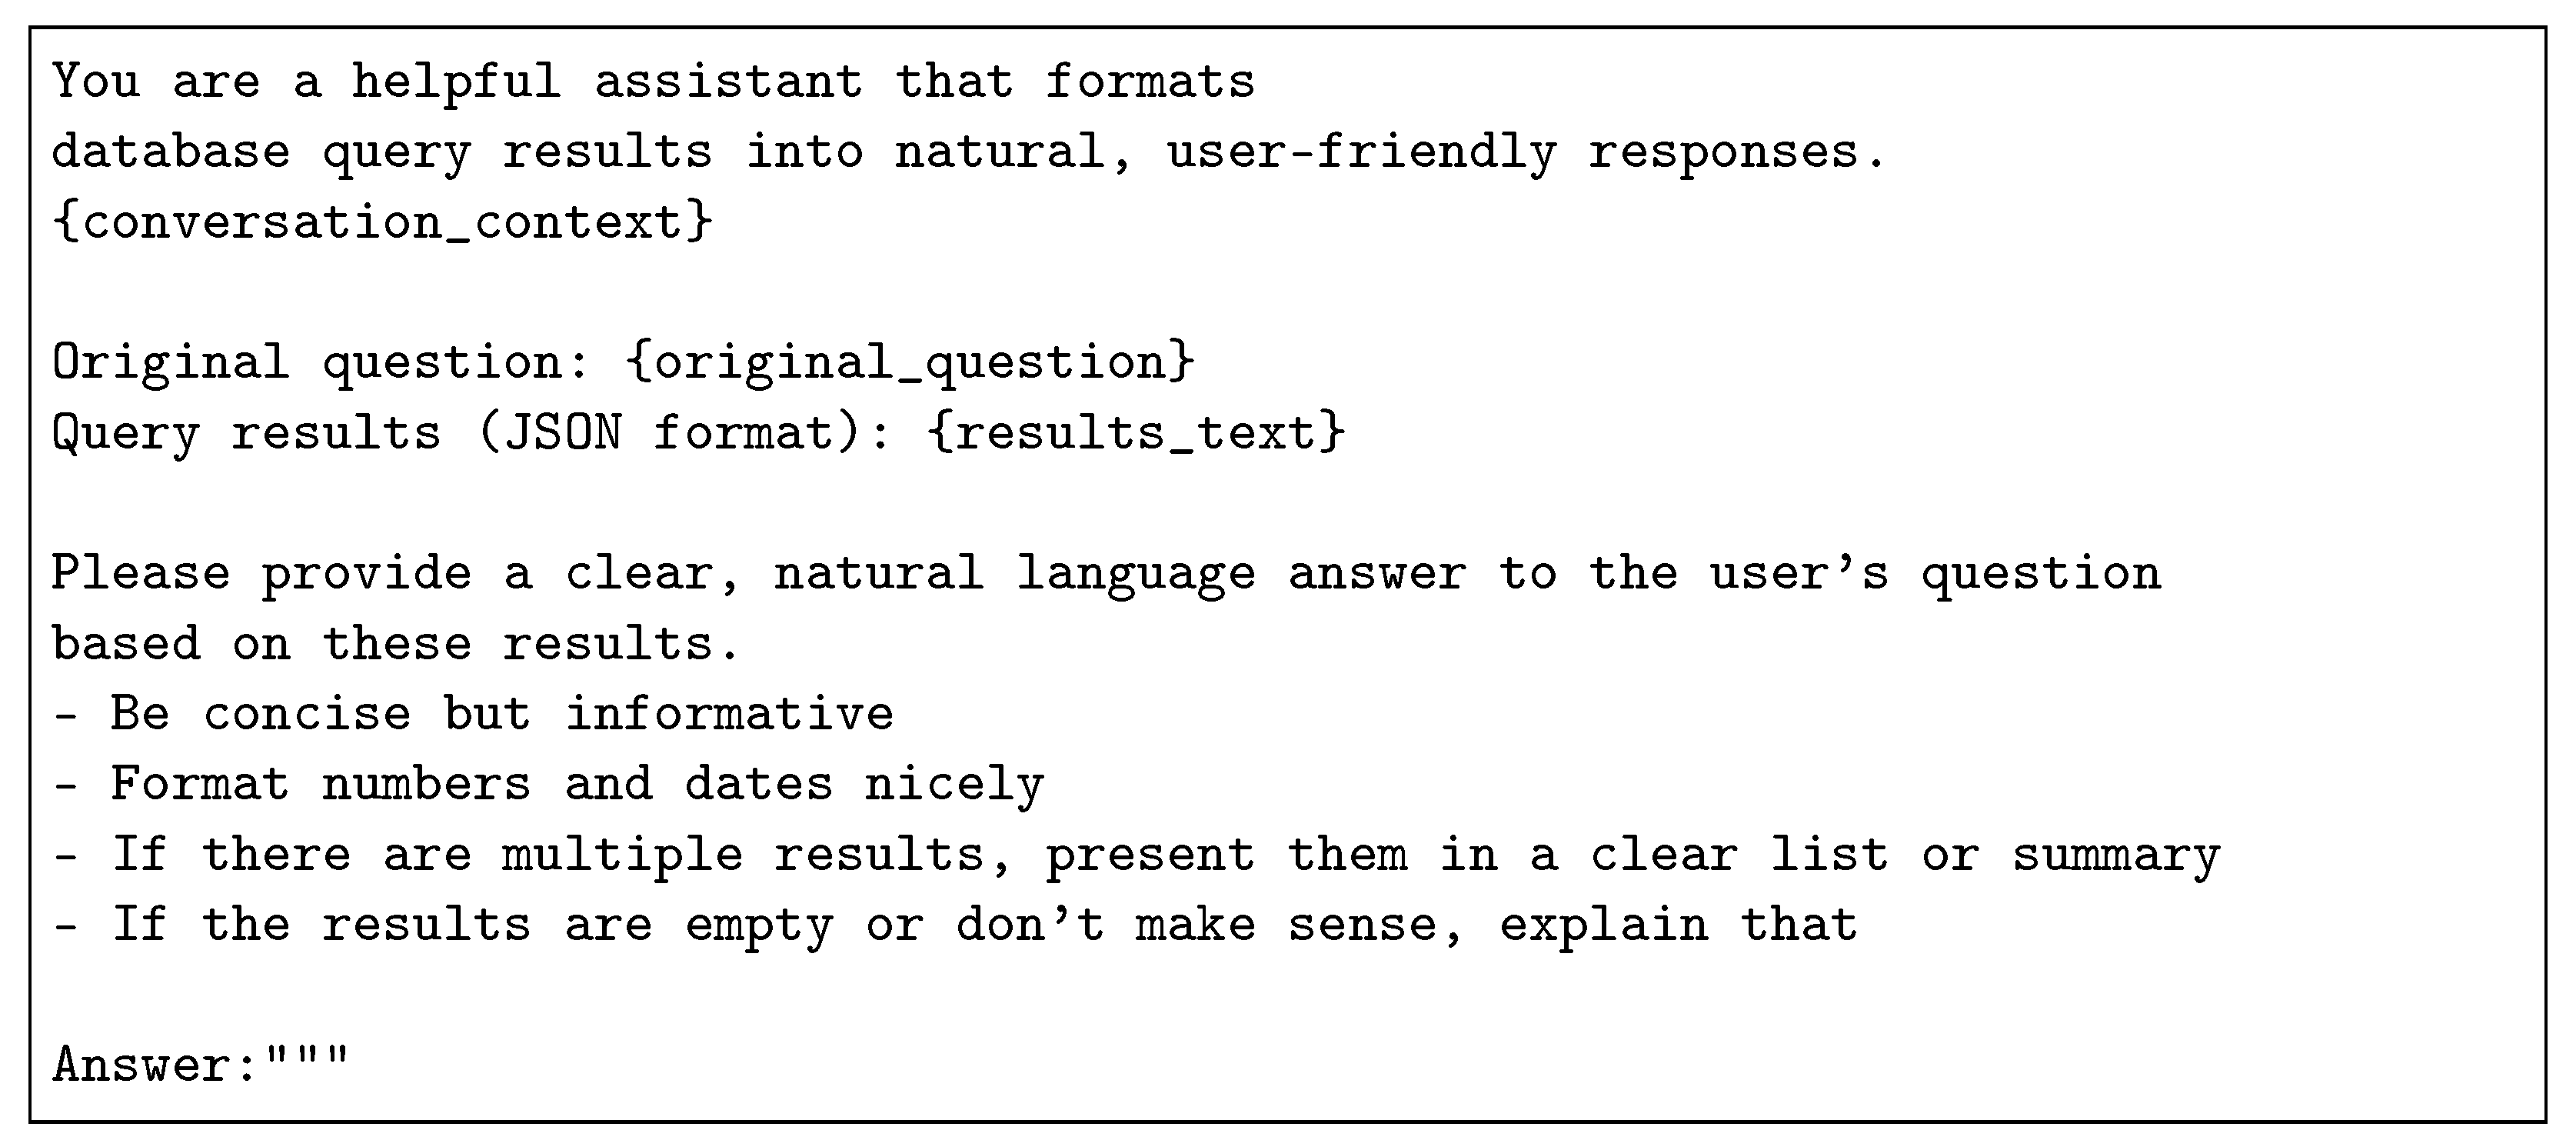
The user can start a dialogue by typing a question. Afterwards, the question is sent to the LLM for retrieving the SPARQL query, by using the same patterns as in the HoopProphets case (i.e., see Figure 7). Afterwards, the SPARQL query is sent to the endpoint and the results are returned in JSON format. Then, we use a small prompt for converting the JSON to a human readable format, i.e., the prompt in Figure 9. Regarding the dialogue history, we give some extra guidelines to the prompt for aiding the LLM to decide if the new question refers to the conversation or it is about a new topic. Some guidelines follow:
Finally, to better support the user during interaction, the system allows the creation of multiple parallel conversation threads. This design allows users to investigate distinct topics in parallel while maintaining contextual coherence. Importantly, the conversation threads remain visible and accessible even if the user refreshes the webpage, ensuring continuity of interaction and reducing cognitive load by preserving the dialogue history.
Figure 9.
The prompt to convert the SPARQL results in JSON format to human-readable responses.
4.4. Comparison of the Applications
Table 3 compares the applications in several dimensions by showing the difference of having a classical SPARQL query editor, which is usually offered by triplestore engines such as Virtuoso.
Table 3.
Comparison of different applications in several dimensions.
SPARQL Query Editor. In particular, the SPARQL query editor can be very useful for SPARQL experts and provides high accuracy. On the other hand, one needs to have a good knowledge not only of the ontology, but also of how the data have been modeled, the data types of literals, URI and literal patterns and so on. Also, one possible issue is that an expert can express SPARQL queries that could be quite heavy for the triplestore engine.
Filter-based Applications. Regarding filter-based applications (e.g., EuroLens), they can provide a more advanced user interface and very high accuracy, since the filters are used in existing SPARQL templates. Due to the templates, the flexibility is limited to filter combinations; however, for this reason the security risk for heavy SPARQL queries is low (the patterns are controlled). Therefore, it is more suitable for non-technical users that need precise answers to their questions. Moreover, such applications could be multilingual by just changing the language in the user interface (this is not yet supported in EuroLens).
Text-to-SPARQL Applications. These applications (e.g., HoopProphets and EuroLens-Chat) offer the user the option to type a free-text natural language (in any given language); therefore, they are quite flexible. However, since the query is generated from the LLM, it may produce an erroneous query and/or results. On the other hand, the query can be enriched by facts that the LLM knows. Therefore, although they can be used by any web user, a SPARQL expert can better exploit such an application, i.e., since he/she can very quickly generate any SPARQL query based on their needs and then check the SPARQL query to understand possible errors (and possibly to edit them like in the HoopProphets case). Finally, there is a monetary cost if one uses non-free LLMs, such as ChatGPT.
5. Experimental Evaluation
In this section we provide (a) statistics of the EuroLeague KG, (b) the evaluation of indicative competency questions, (c) a text-to-SPARQL analysis of results and errors, (d) efficiency results, and (e) an evaluation concerning the evolution of EuroLeague Basketball in the past 25 years.
5.1. Statistics of the KG (From 2000 to 2025)
Table 4 provides some general statistics about the constructed KG, including the number of unique URIs, literals, and others. The statistics in Table 4 include all the games up to 22 December 2025. Overall, it contains more than five million triples, with a substantial proportion; approximately 84% have literals as objects, primarily representing statistical values. Because most of these literals correspond to statistics that occur frequently, the number of distinct literals is relatively small, at approximately 34 thousand.
Table 4.
General KG statistics (seasons 2000–01 to 22 December 2025).
Table 5 details the number of URIs per class, the volume of triples in which those URIs appear as subjects or objects, and the average number of triples associated with each URI. The KG includes more than 6 thousand games and 3 thousand players (from over 85 countries). It also contains 240 coaches from over 25 countries and 307 referees from over 35 countries. Games are associated with, on average, more than 25 triples per URI, whereas players average over 55 triples each. In addition, the Statline class accounts for the largest volume of URIs (over 144 thousand), while teams exhibit the highest average connectivity, with approximately 437 triples per team.
Table 5.
Statistics of the KG classes (seasons 2000–01 to 22 December 2025).
5.2. SPARQL Queries for the Competency Questions
In this section, we evaluate the competency questions by providing, for each use case, the SPARQL query for one question. The whole set of queries and their results are available on the GitHub page https://github.com/mountanton/BBallApplications (accessed on 18 March 2026).
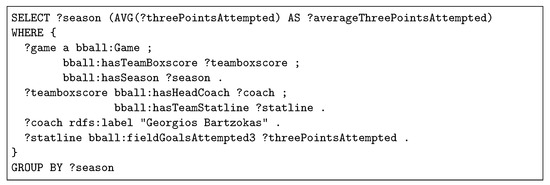
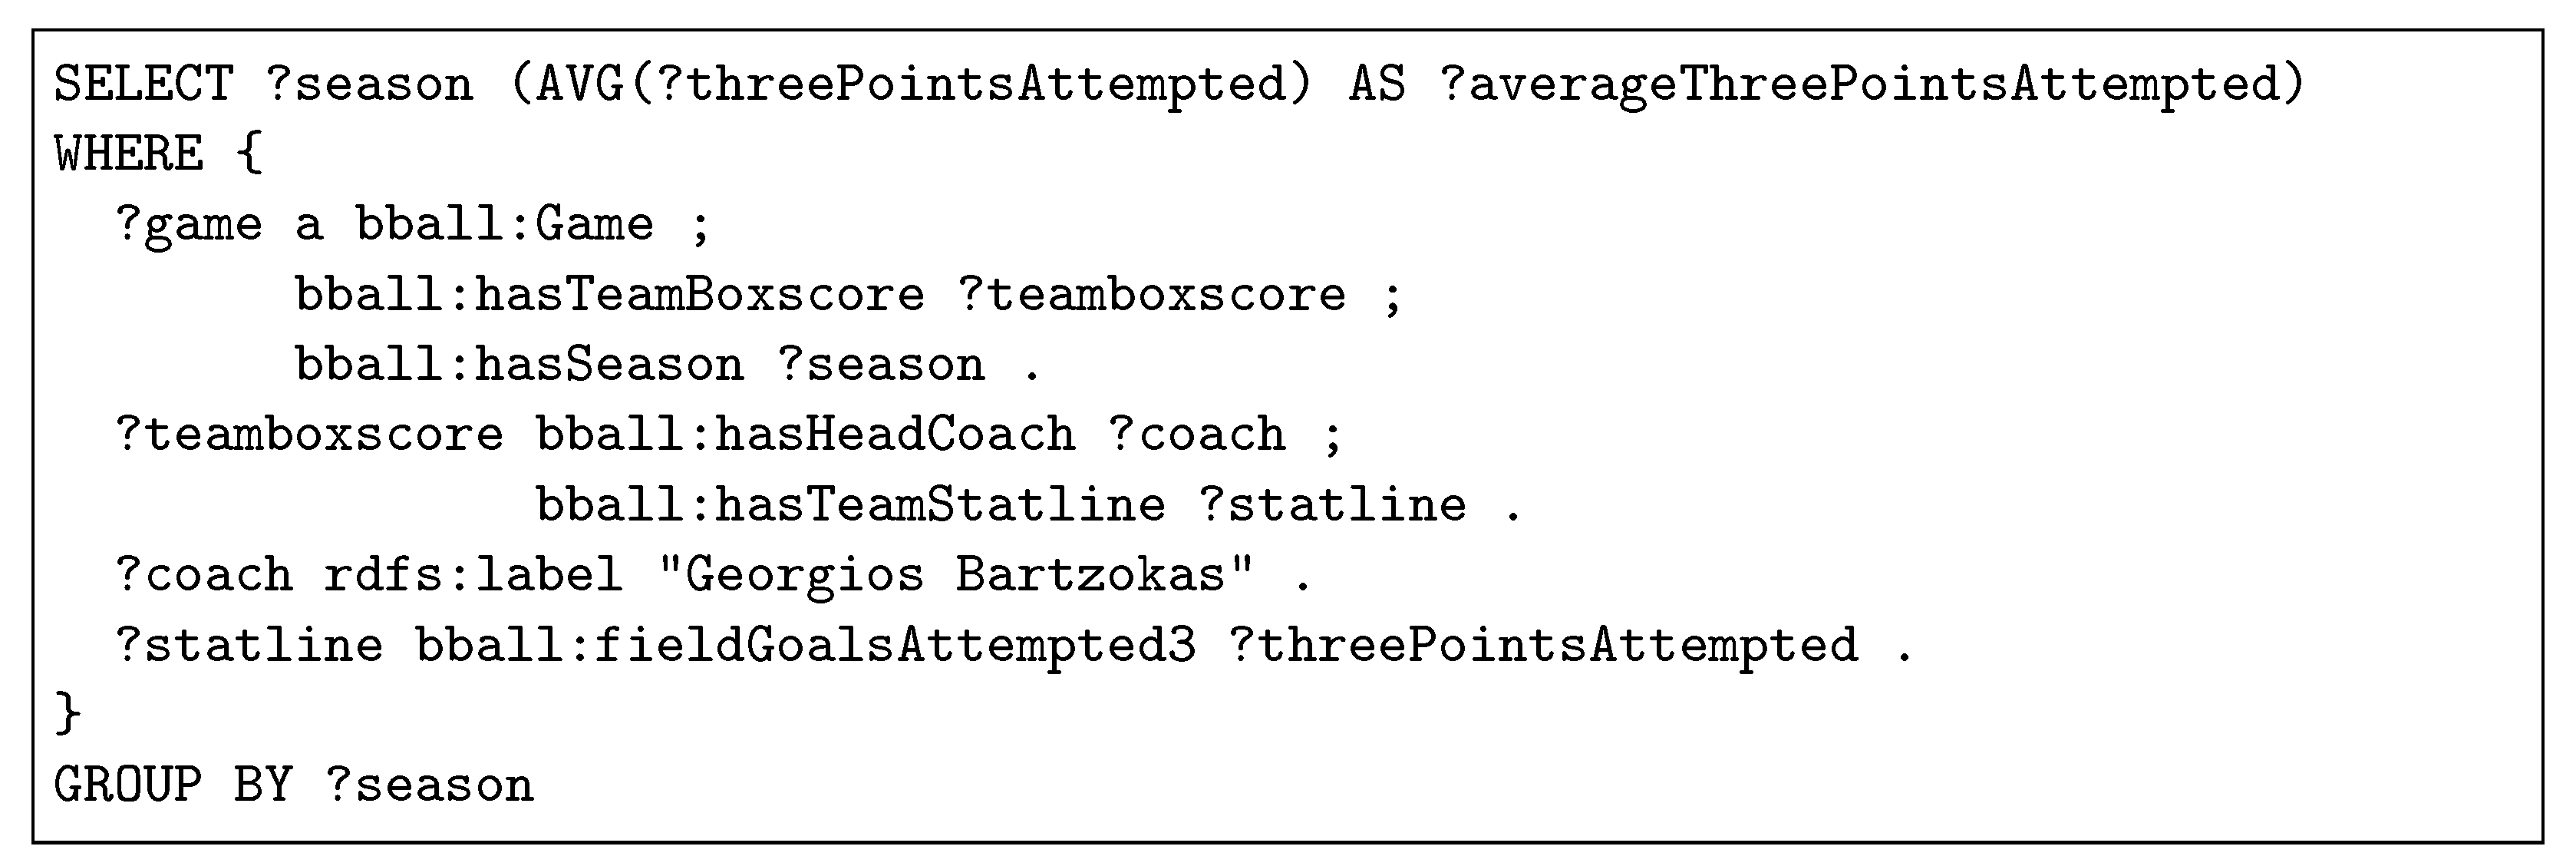
Use Case 1—Example SPARQL Query. First, we provide the query for Q4 of UC1, i.e., “I want the average number of three-point shots attempted from the teams of Georgios Bartzokas per season”. As shown in Figure 10, we need to identify all games in which the team’s box score lists “Georgios Bartzokas” as the coach, and then compute the average number of three-point shots, grouped by season.
Figure 10.
Answer to the query “I want the average number of three-point shots attempted from the teams of Georgios Bartzokas per season”.
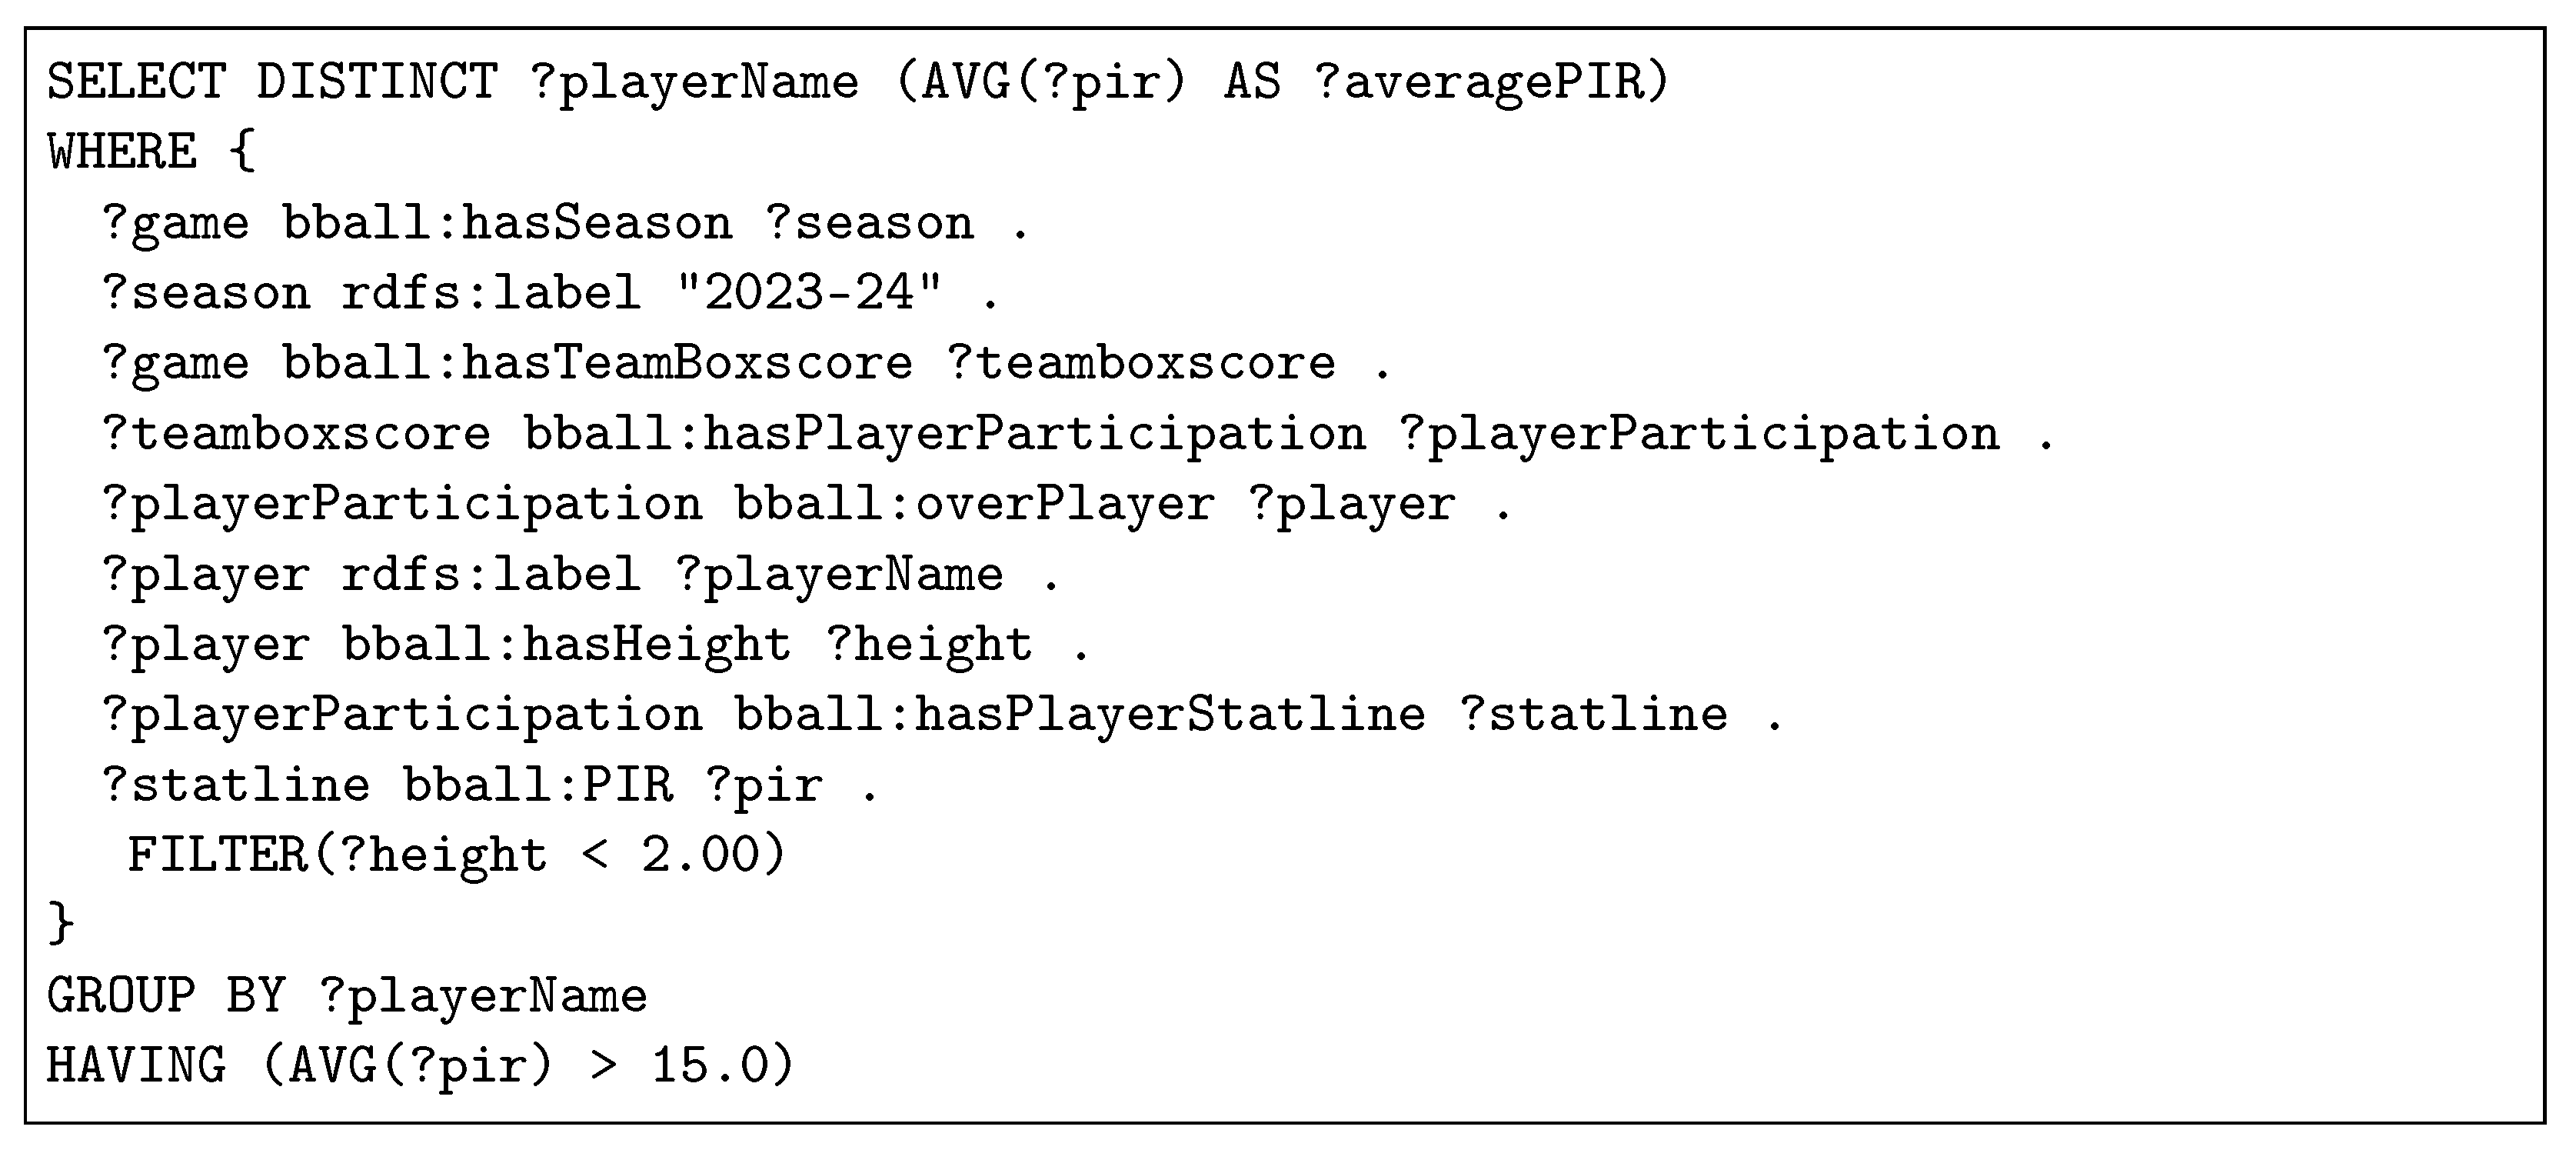
Use Case 2—Example SPARQL Query. Second, we provide the SPARQL query Q6 of UC2, i.e., “Give me all the players based on this filter: Season 2023–24, Height < 2.00, Average PIR > 15.0”. As Figure 11 shows, this query contains a filter statement for height and a “HAVING” statement for the average PIR of each player.
Figure 11.
Answer to the query “Give me all the players based on this filter: Season 2023–24, Height < 2.00, Average PIR > 15.0”.
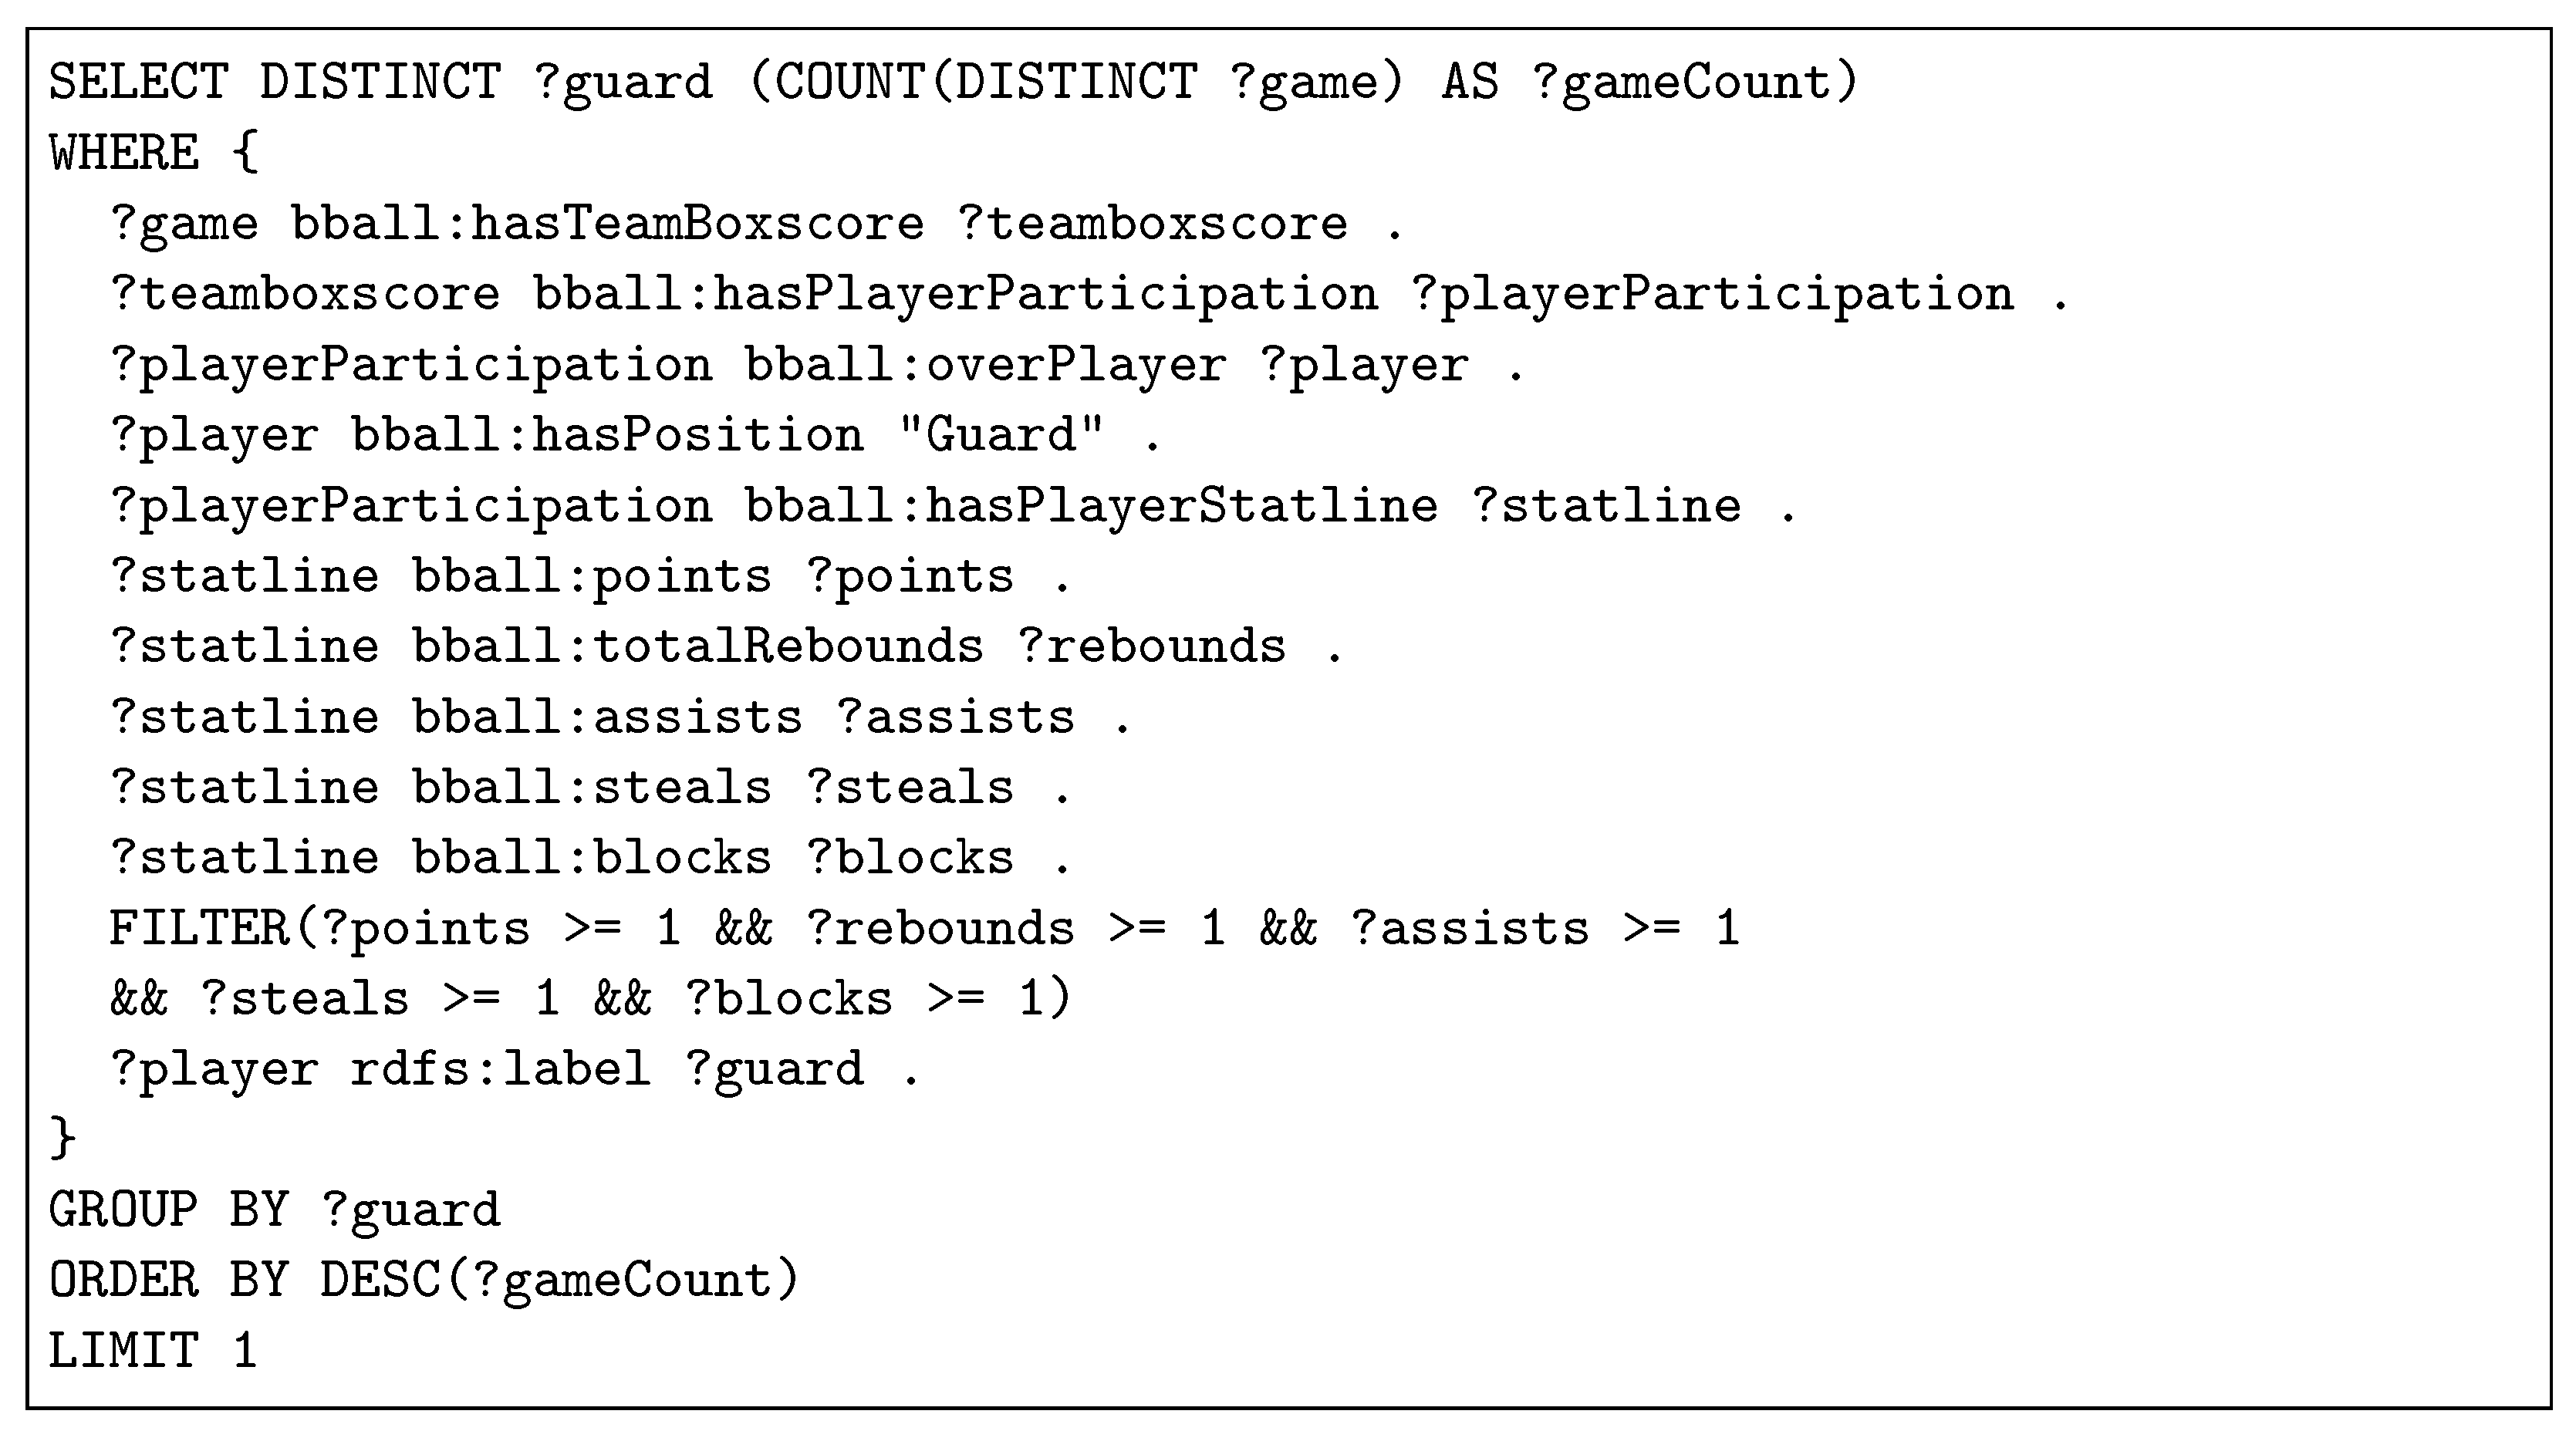
Use Case 3—Example SPARQL Query. Finally, we can assess query Q15 of UC3, i.e., “Give me the Guard with the most games with at least 1 point, rebound, assist, steal and block.” As Figure 12 shows, for each game we determine the participation of each player who is a “guard”, and we use a filter for finding the values that we desire. Since we want to retrieve the top player (who is Dimitris Diamantidis with 70 games), we use the order by and the limit statements.
Figure 12.
Answer to the query “Give me the Guard with the most games with at least 1 point, rebound, assist, steal and block”.
5.3. Text-to-SPARQL Evaluation and Analysis
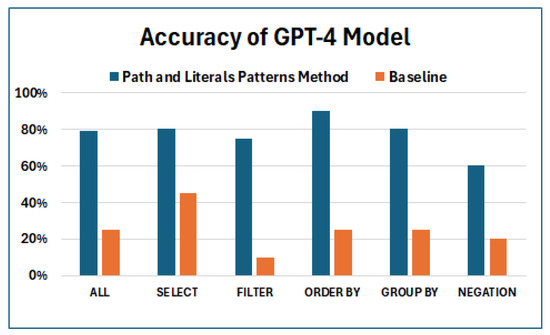
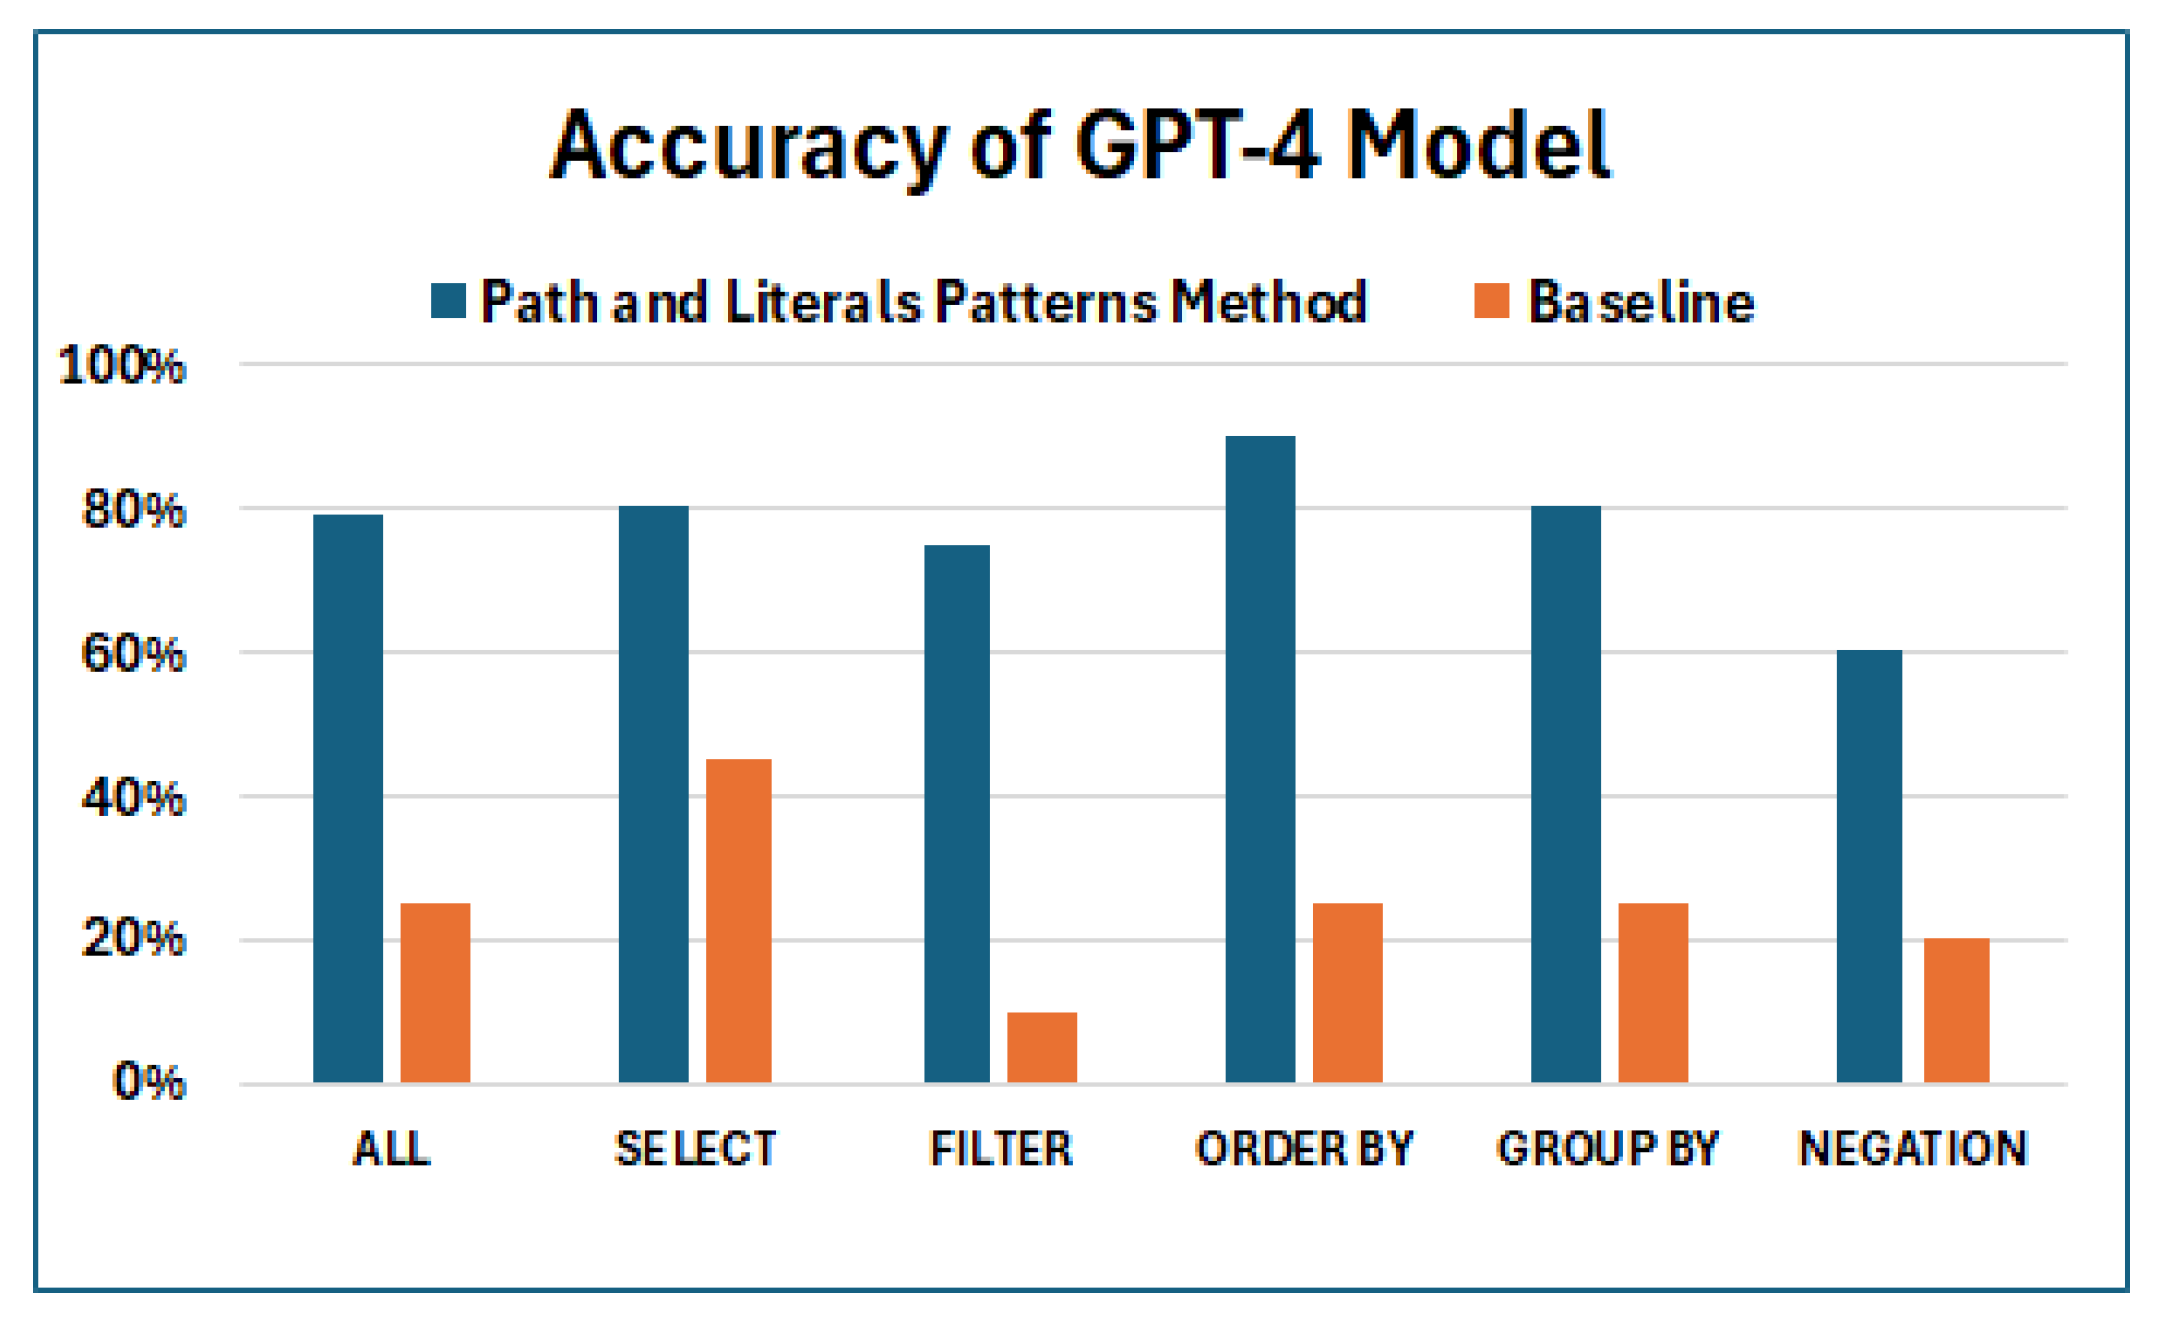
We have created a benchmark4 [33] with 100 natural questions to measure the accuracy of the text-to-SPARQL approach for the given KG and ontology, for evaluating (i) the path and literal pattern method and (ii) a baseline, in which we just give a prompt with a list of all the classes and all the properties of the BBall ontology to the LLM. The mentioned benchmark includes 20 questions of five types based on SPARQL clauses (SELECT, FILTER, ORDER BY, GROUP BY and NEGATION). Here, we provide a synopsis of these results (that were presented in [33]), by using the English version of the benchmark and GPT-4, and then we focus on analyzing the main errors of the most effective method. In particular, we measure the accuracy percentage, i.e., how many of the generated queries returned the desired results. Figure 13 shows that GPT-4 achieved an accuracy of 79% versus 25% of the baseline for the path and literal pattern method. Concerning the different types of SPARQL clauses, it was more effective for the SELECT, ORDER BY and GROUP BY queries, and less effective for the FILTER and NEGATION queries.
Figure 13.
Accuracy of GPT-4 for the English version of the benchmark.
Concerning the error analysis, for the path patterns and literal methods (see Table 6), nearly half of all errors (47.6%) refer to filtering or logical constraints, indicating that many mistakes occur when specifying correct selection criteria by using FILTER and especially FILTER NOT EXISTS. For instance, in a query asking for players that have never played more than 10 min in any game, it returned all the players that played less than 10 min in at least one single game. The second type of error refers to aggregation and calculation errors (28.6%). These issues include incorrect division, missing DISTINCT, and wrong grouping. The third type of error refers to schema and property errors (14.3%) such as referencing non-existent properties or misusing property fields. Finally, semantic misinterpretation (9.5%) errors concern queries that were syntactically valid but failed to capture the intended meaning; e.g., when we asked for the statistics of players who played against Real Madrid, the query incorrectly returned statistics for Real Madrid players instead of the opposing players.
Table 6.
Distribution of errors in 21 analyzed queries (path patterns and literal methods with GPT-4).
5.4. Efficiency Experiments
We provide efficiency experiments for all the components that are used in the applications: (i) SPARQL query execution time (important for both the filter-based and LLM-based applications), (ii) the text-to-SPARQL method (important for LLM-based applications), and (iii) the conversion of the SPARQL results to text (important for the chat application).
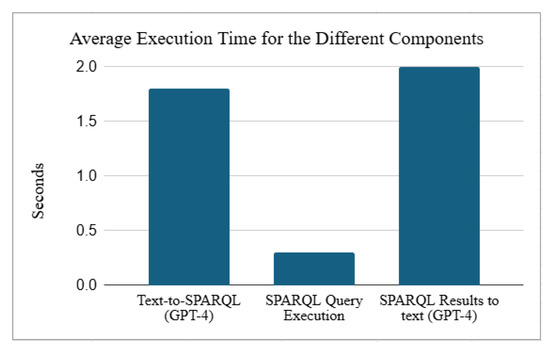
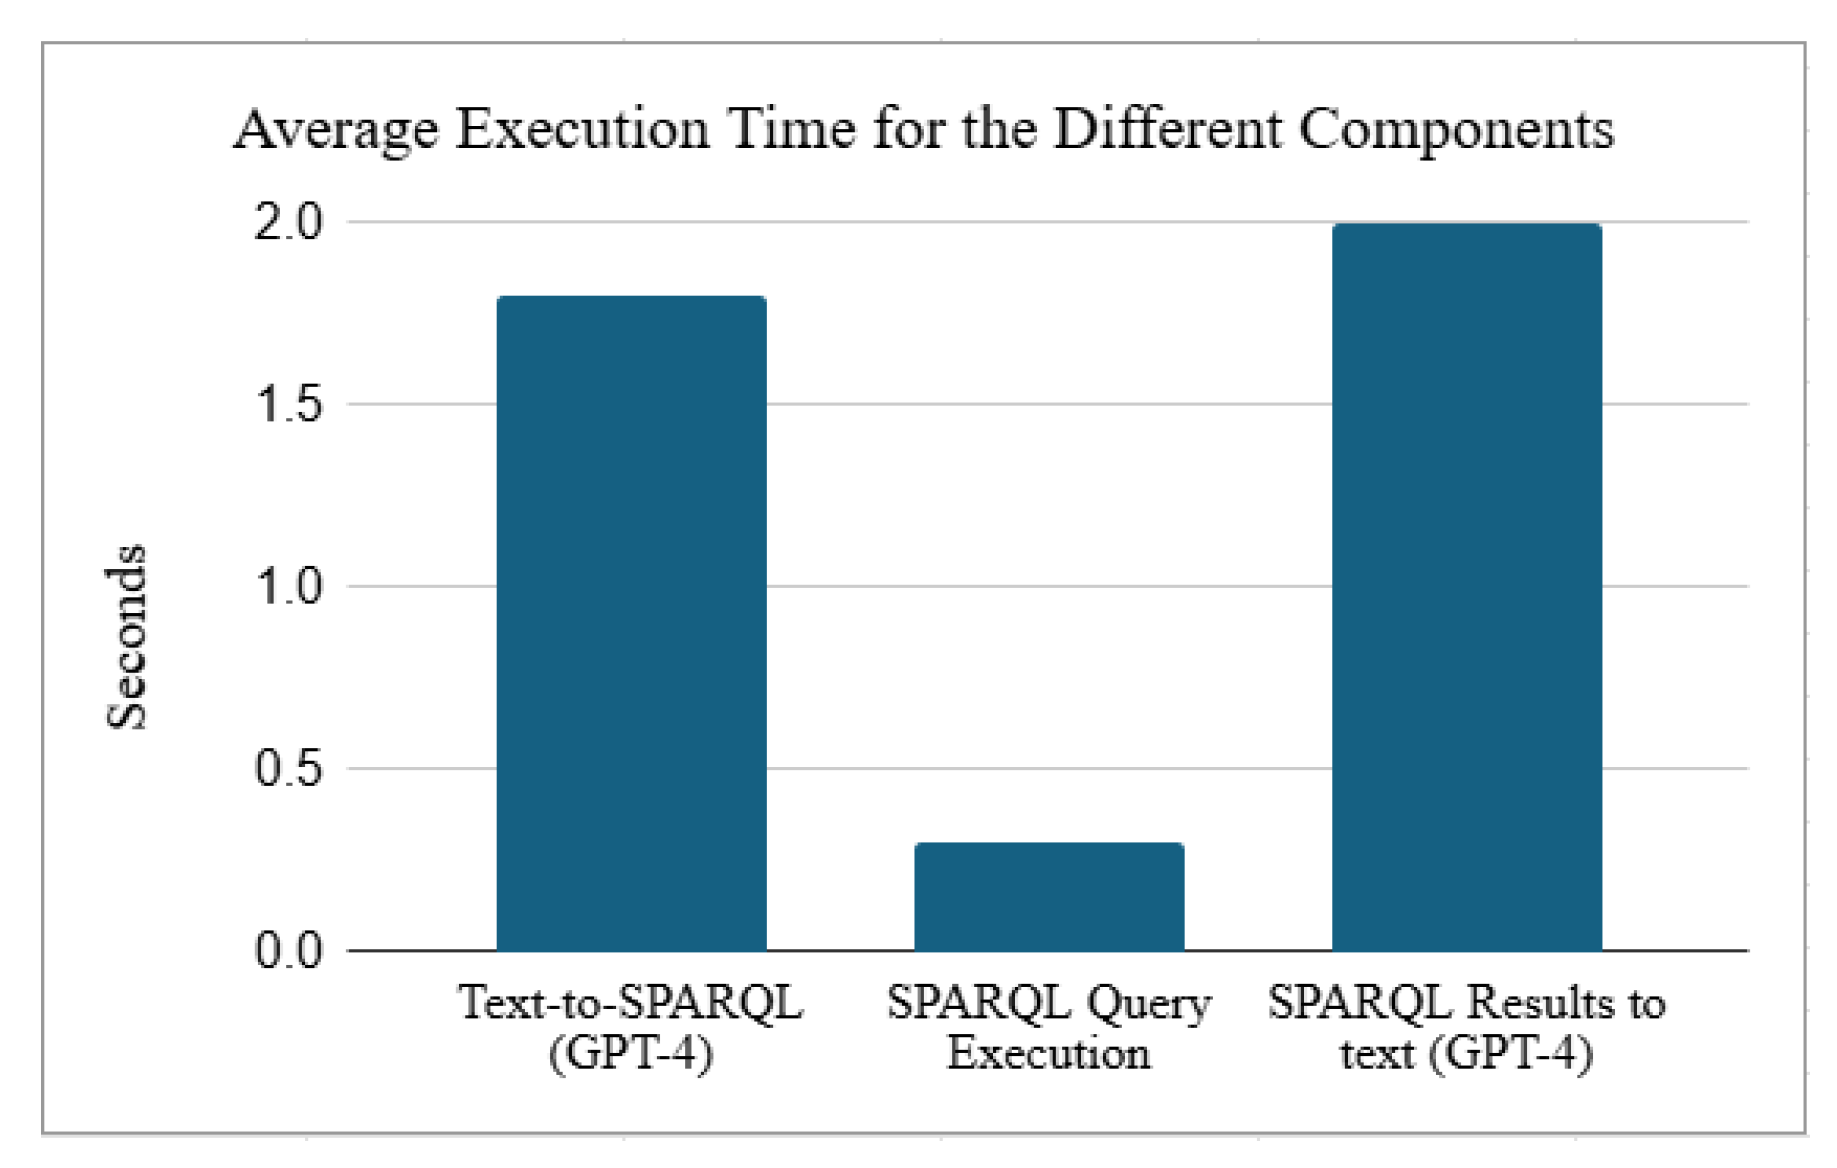
For the experiments, we used the 100 queries of the benchmark. First, Figure 14 shows an overview for the different components. In particular, we need on average 0.3 s for executing a SPARQL query, 1.8 s for the text-to-SPARQL method using the path and literal pattern method and GPT-4, and 2 s for the conversion of the SPARQL results to text format. This means that on average we need approximately 4.1 s for the chat-based application for a single user question. However, it highly depends on the questions and on the results size; e.g., more time is needed for converting a huge result set to text.
Figure 14.
Execution time for the different components.
Moreover, for the SPARQL query execution time, we provide more analytical results as follows. We executed each query five times, and we recorded the response time. We provide aggregated statistics for the five types of queries, and also the minimum and maximum response times that we observed. Table 7 shows that the average time for all the types was from 0.27 to 0.3 s, apart from the negation case (with an average time of 0.39 s). The minimum execution time was 0.253 s and the maximum 1.5 s (for a negation query). These experiments demonstrate that the proposed solution can efficiently support analytical queries over a Knowledge Graph containing more than five million triples.
Table 7.
SPARQL endpoint benchmark results.
5.5. EuroLeague Historical Analysis
Here, we exploit the KG for evaluating the questions of UC1 and some additional questions for checking the evolution of basketball over the last 25 years for several factors.
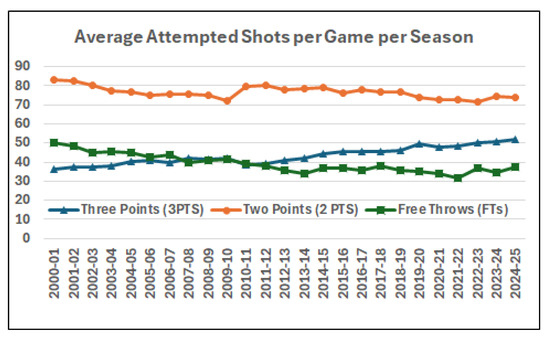
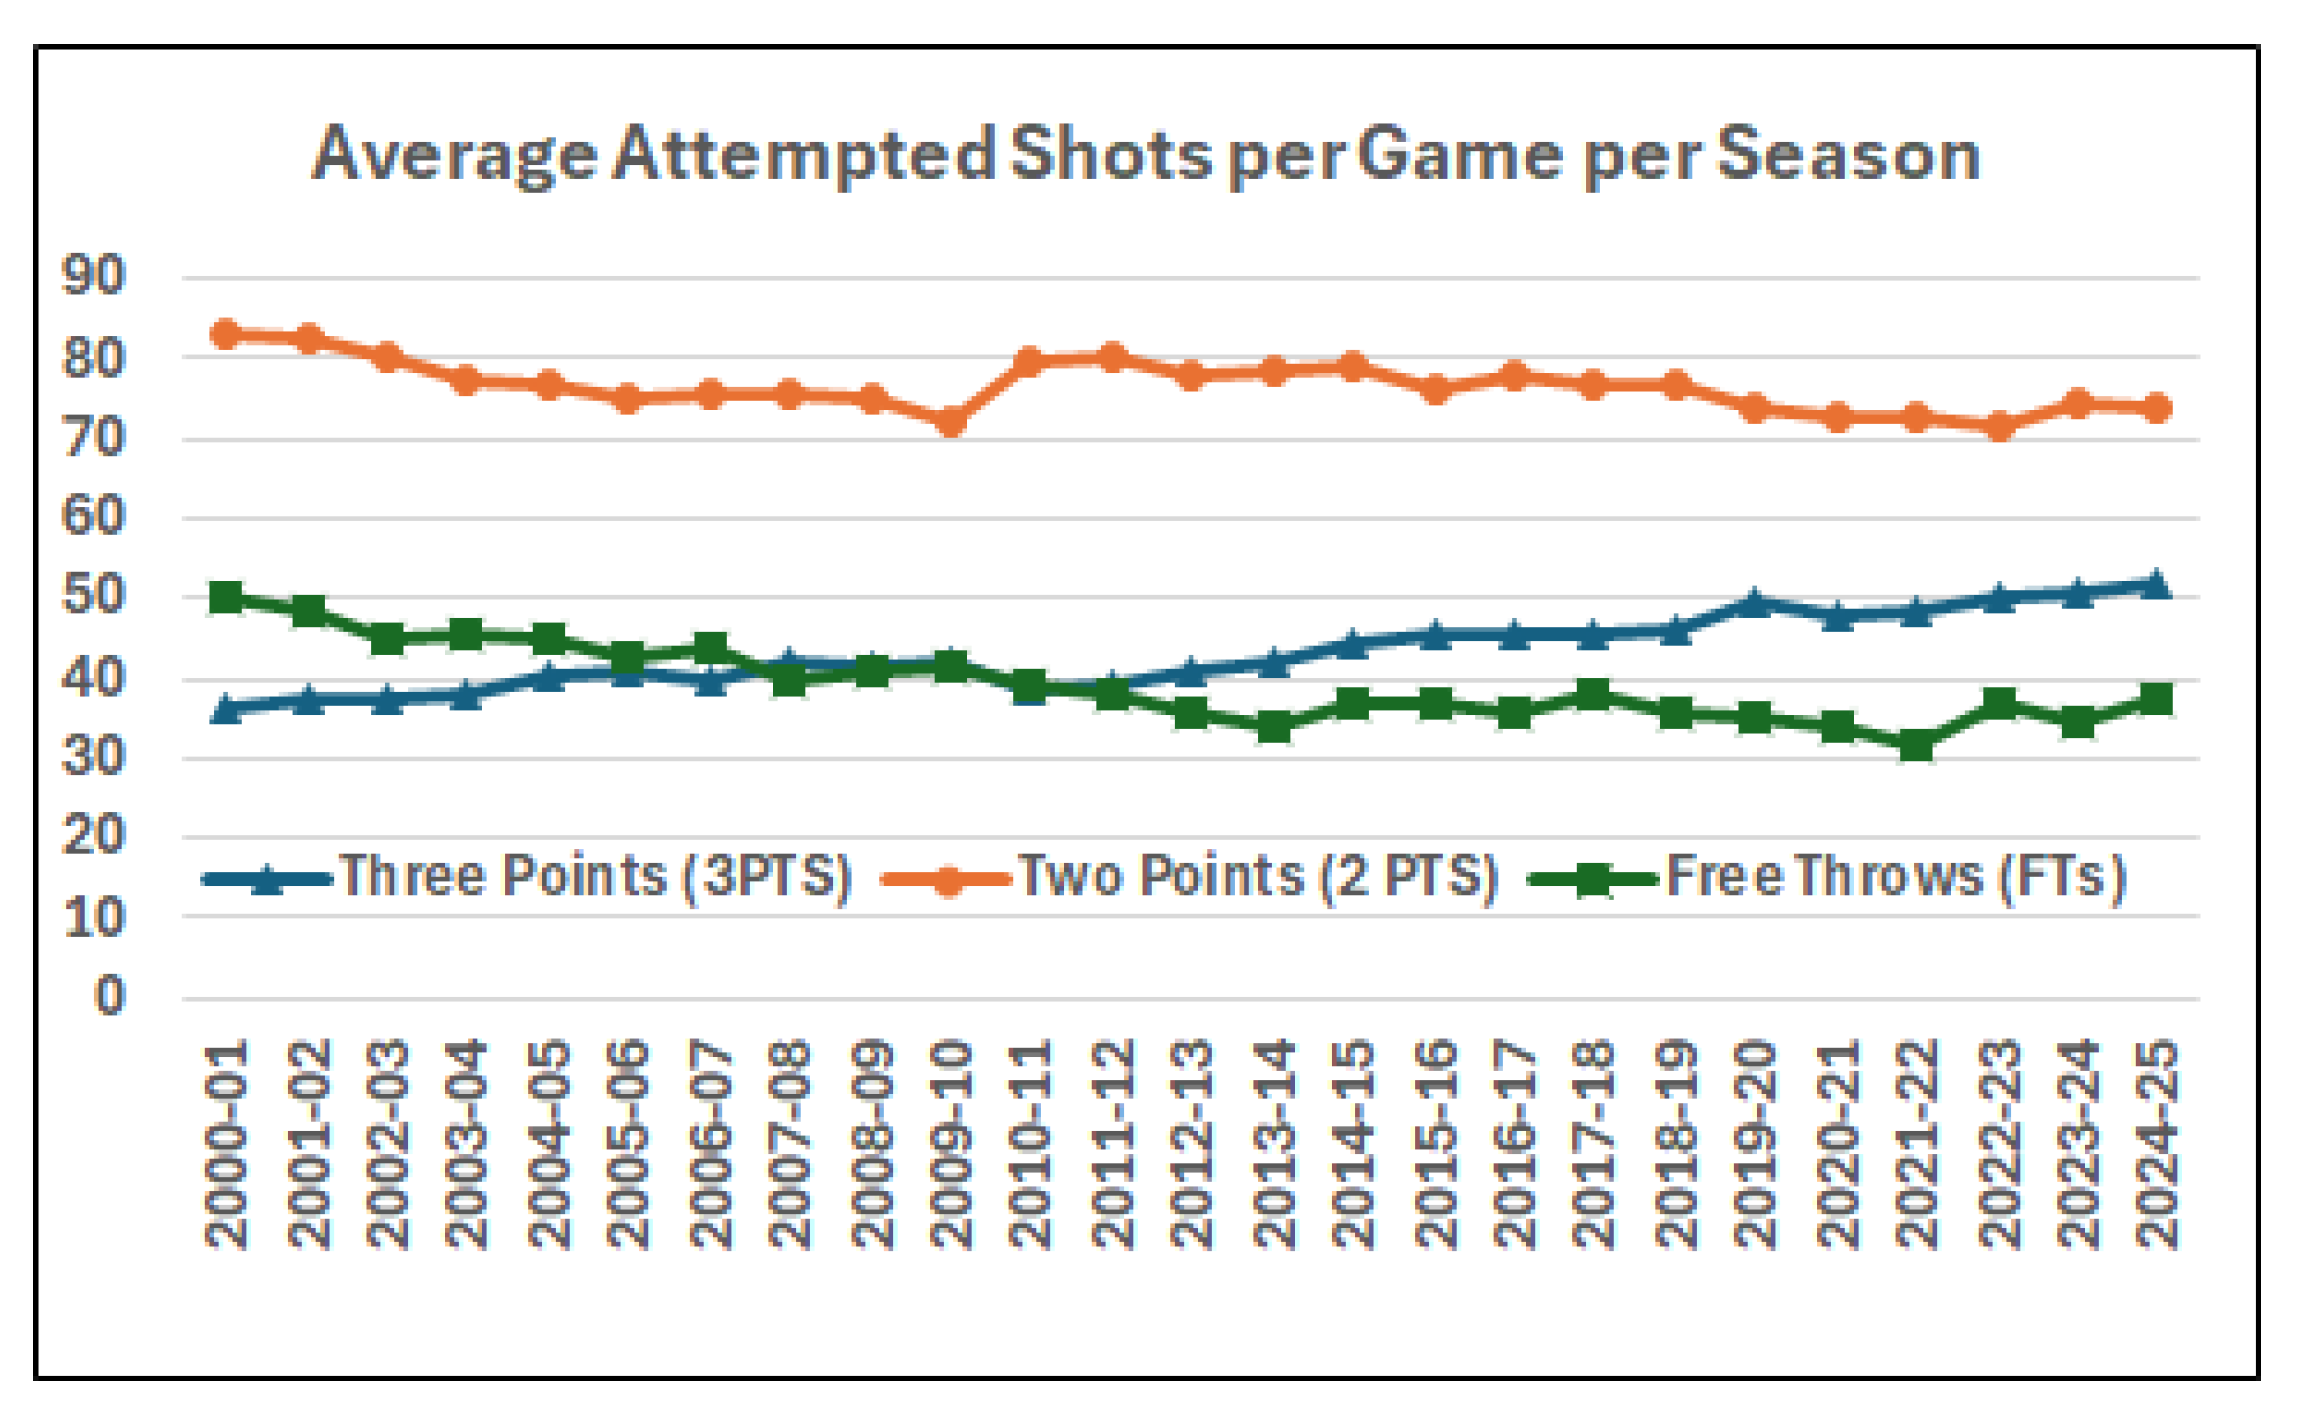
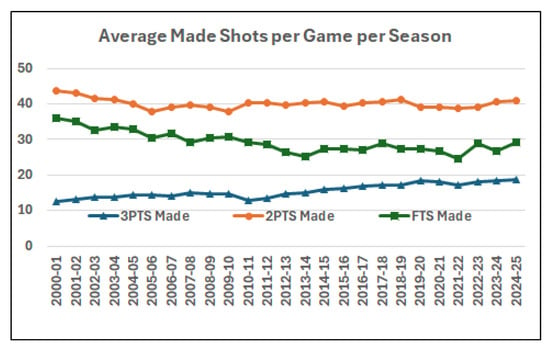
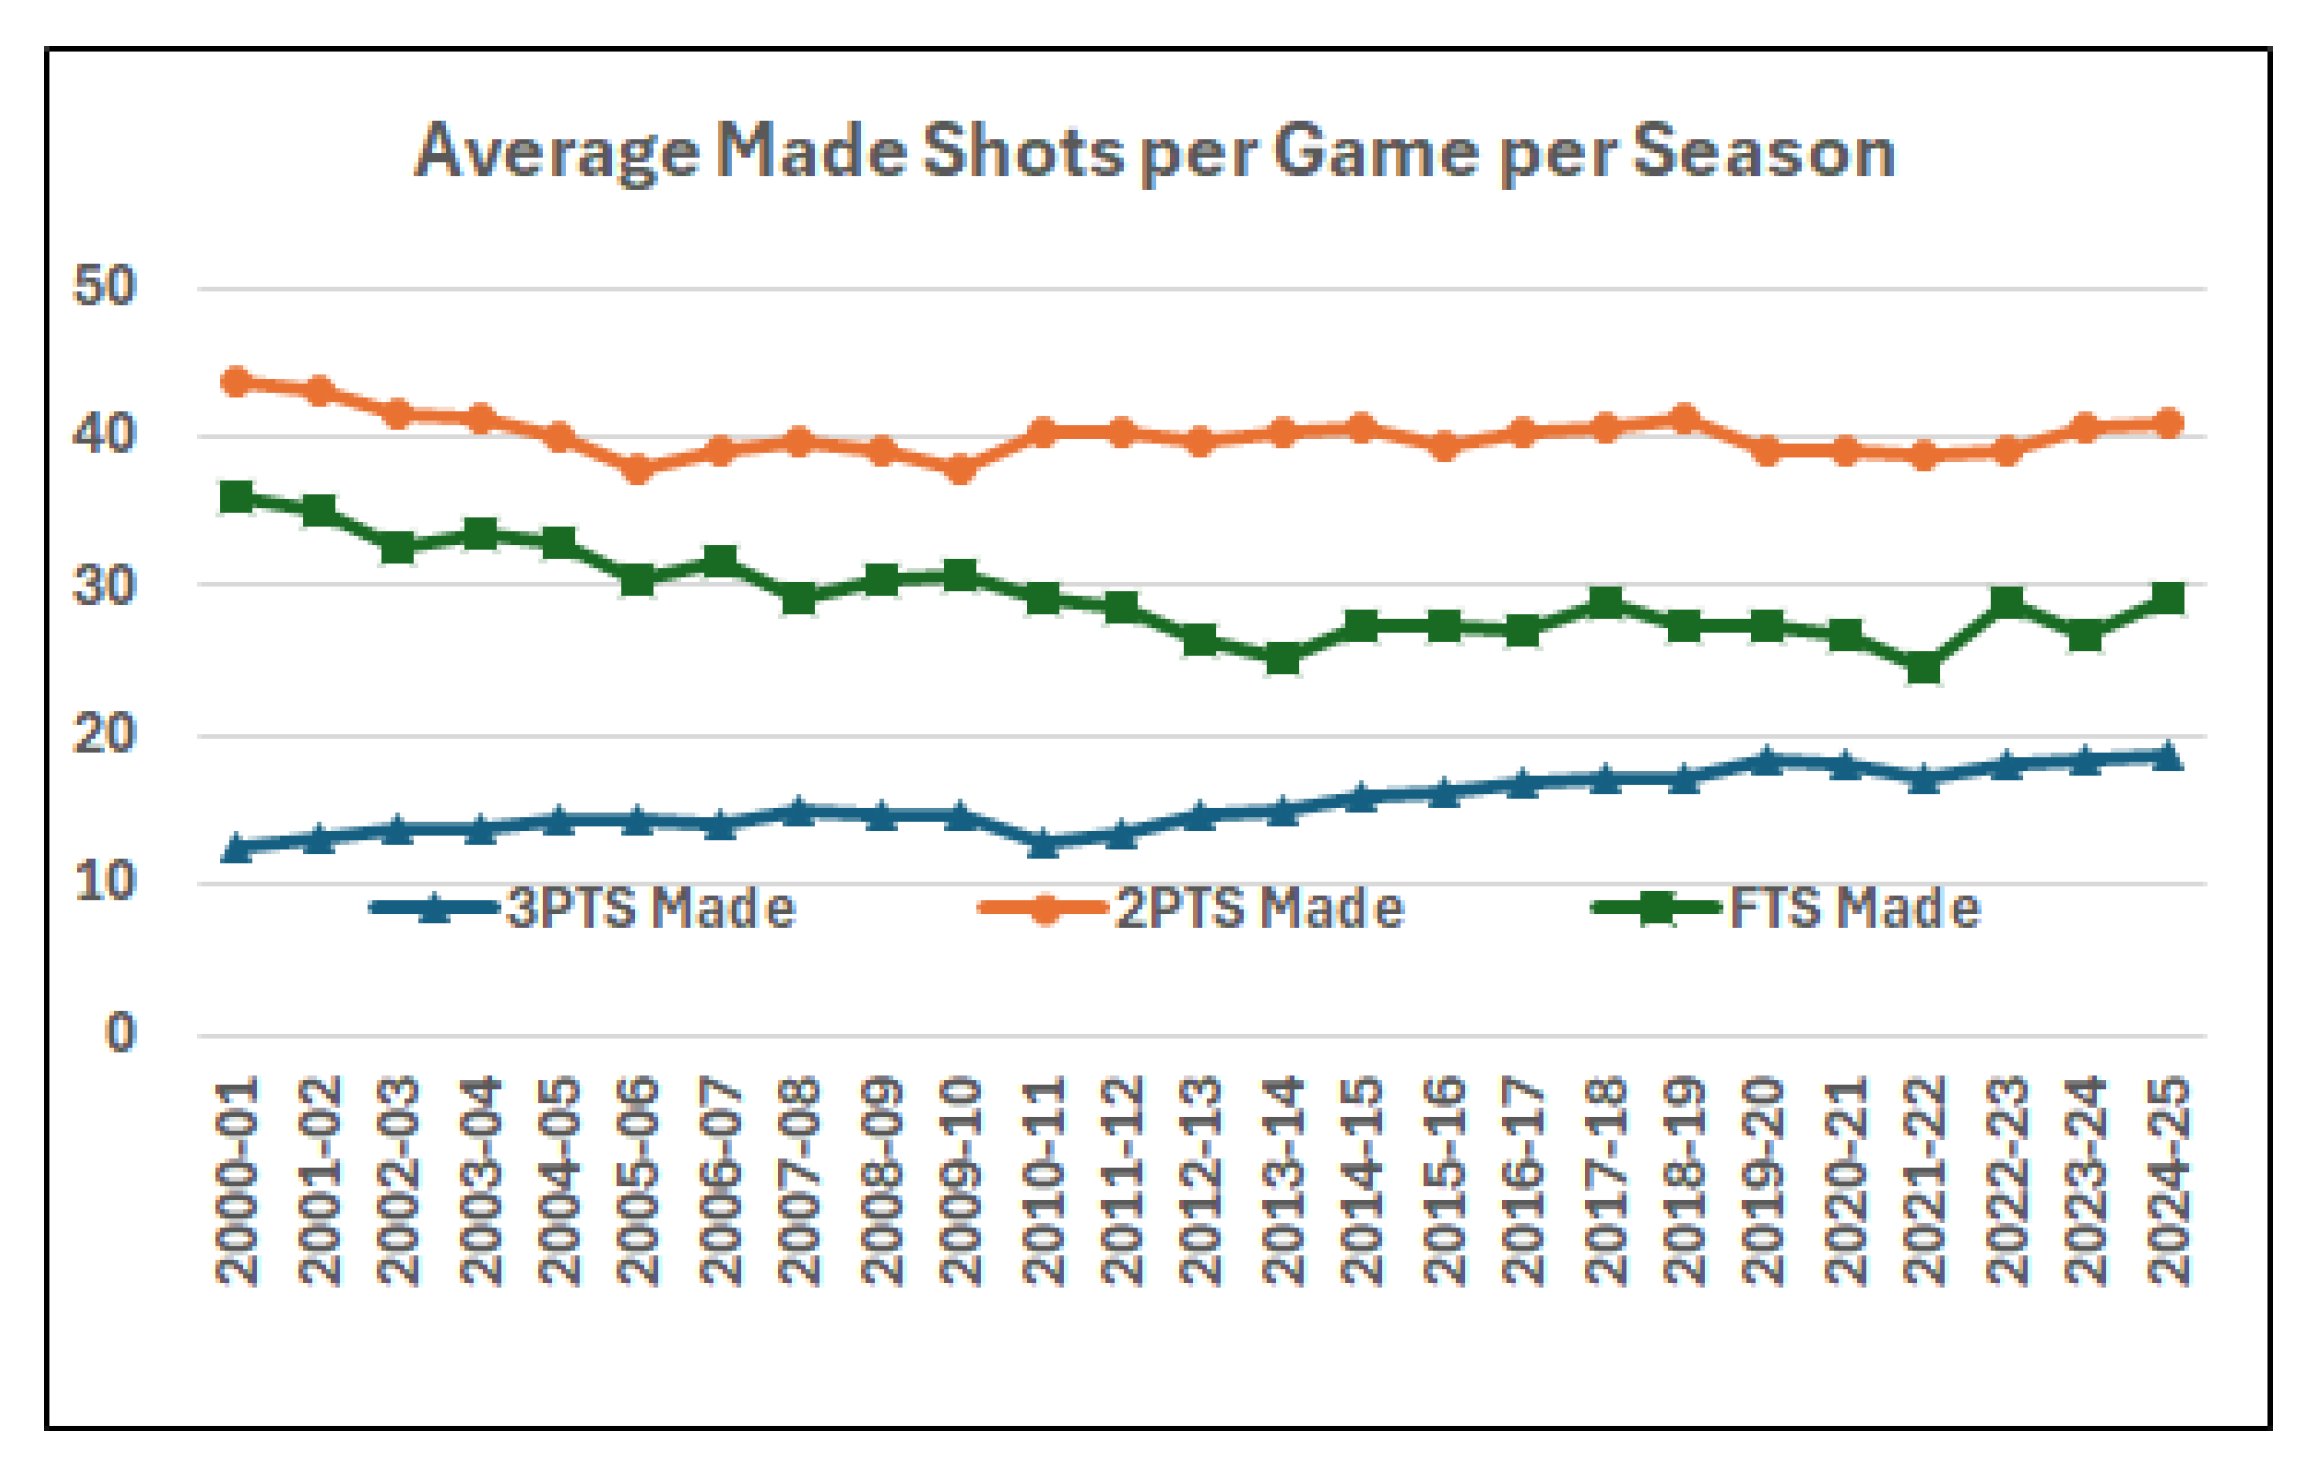
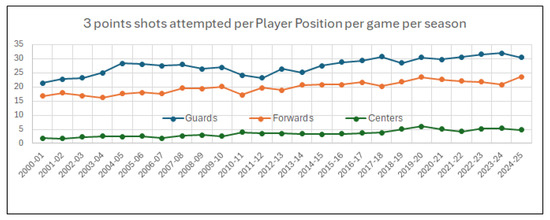
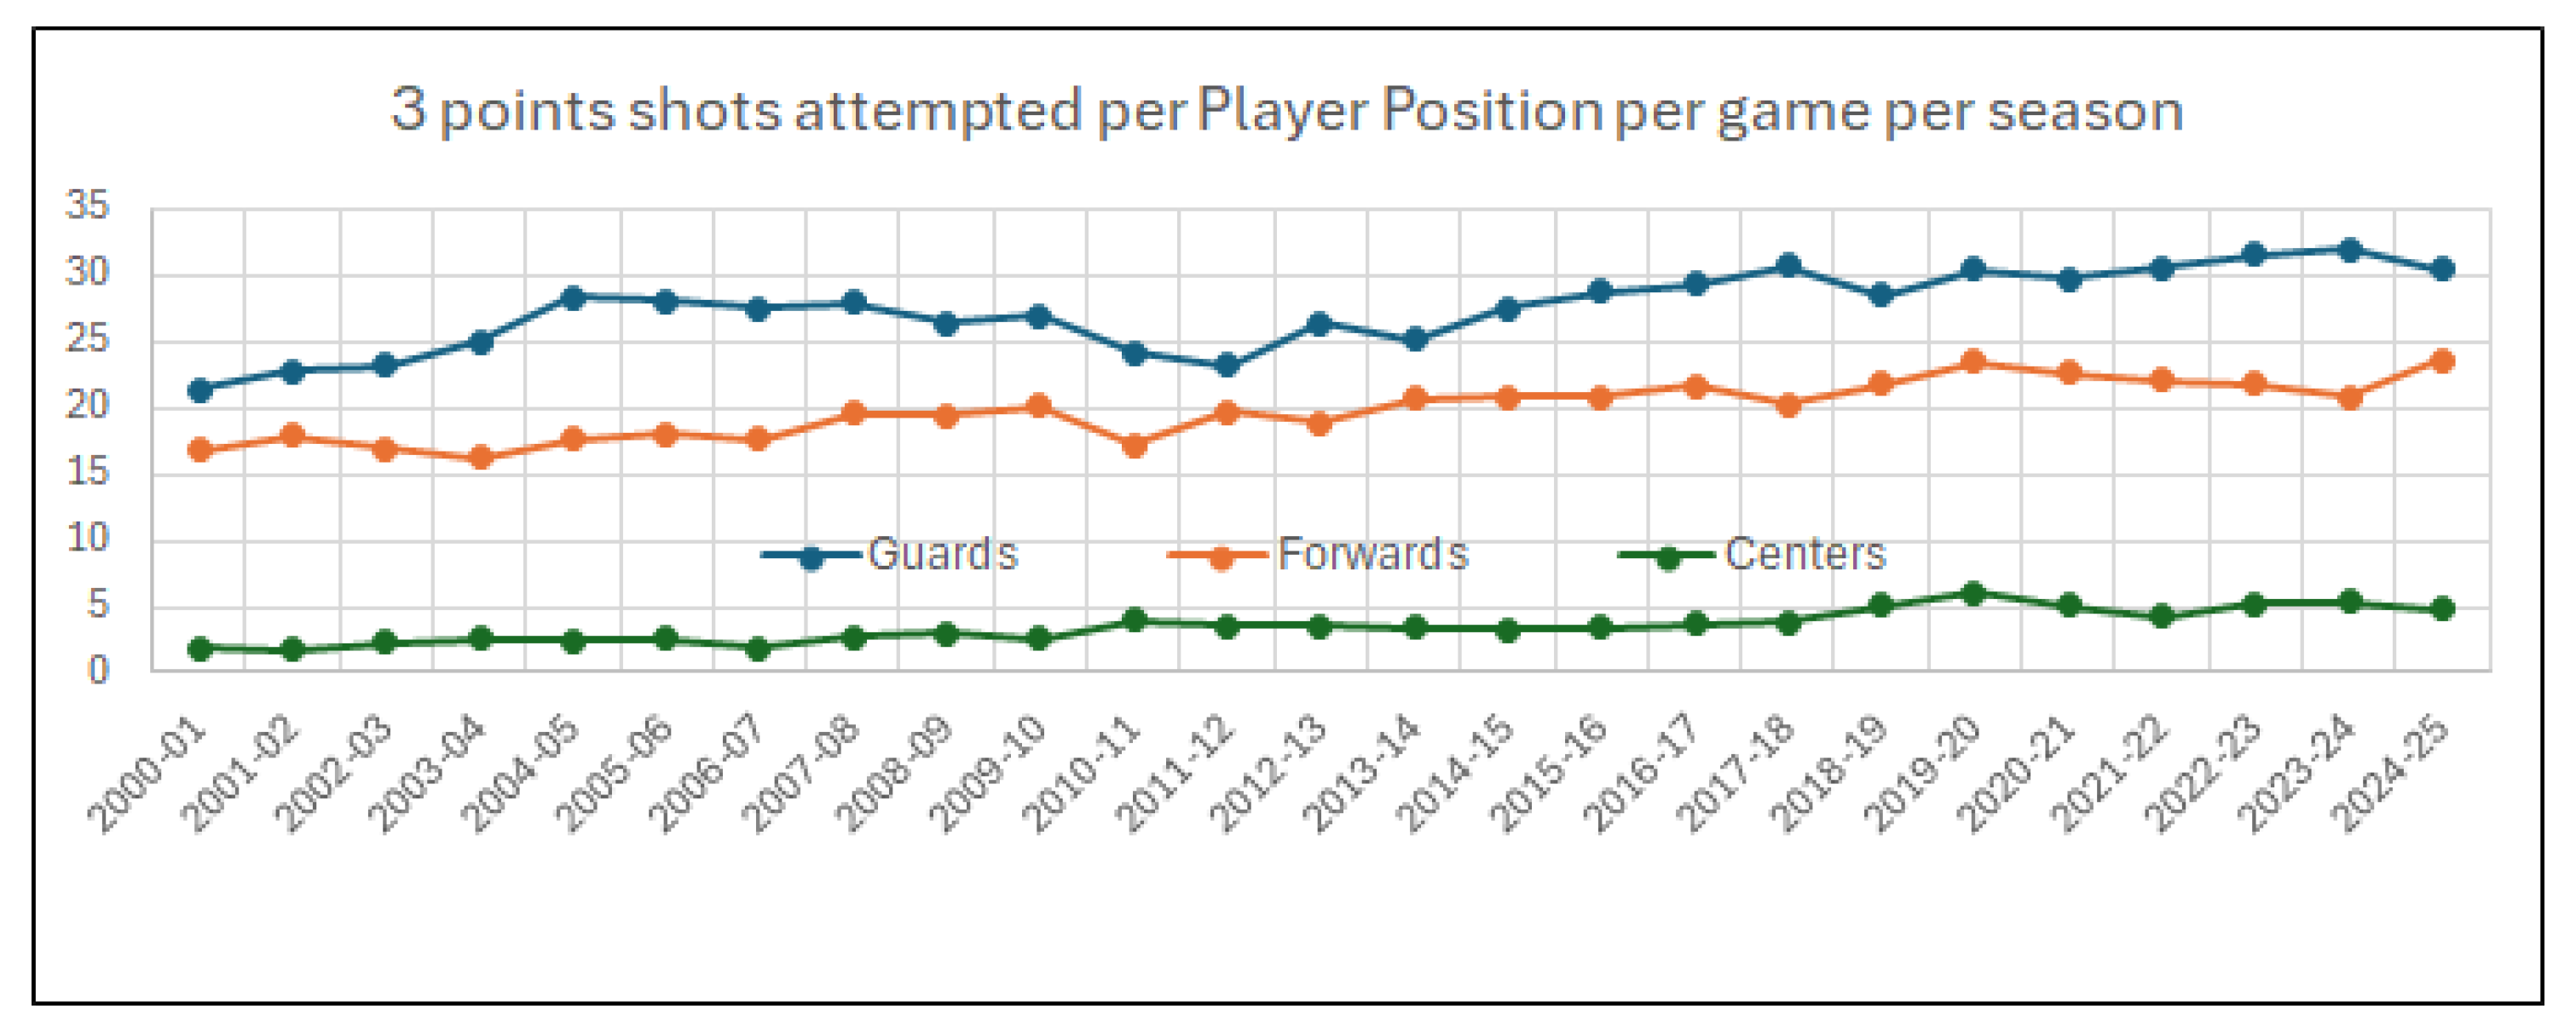
A. Shooting Evolution. Figure 15 shows the average number of shot attempts per game (for both teams). As observed, three-point attempts have steadily increased over time, while free-throw attempts have gradually declined. Two-point attempts remain the most frequent category but exhibit a slight long-term decrease. In the 2000–01 season, the averages were 36 three-point attempts (3PTS) and 82 two-point attempts (2PTS) per game, whereas in 2024–25, the corresponding figures were 52 3PTS and 74 2PTS per game, representing a 44.44% increase in three-point attempts. Regarding made shots (see Figure 16), a clear increase in three-point field goals is also evident. Furthermore, Figure 17 presents the average number of three-point attempts per player position. Notably, the number of three-point attempts by centers has increased substantially over the last 25 years, rising from approximately 2 to 5 attempts per game. A similar trend is observed for forwards (from 16 to 23) and guards (from 21 to 30).
Figure 15.
Average number of attempted shots per game per season (for both teams).
Figure 16.
Average number of shots made per game per season (for both teams).
Figure 17.
Average three-point shots attempted per game per season (different player positions).
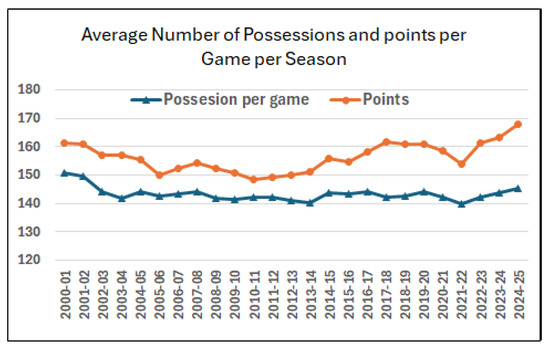
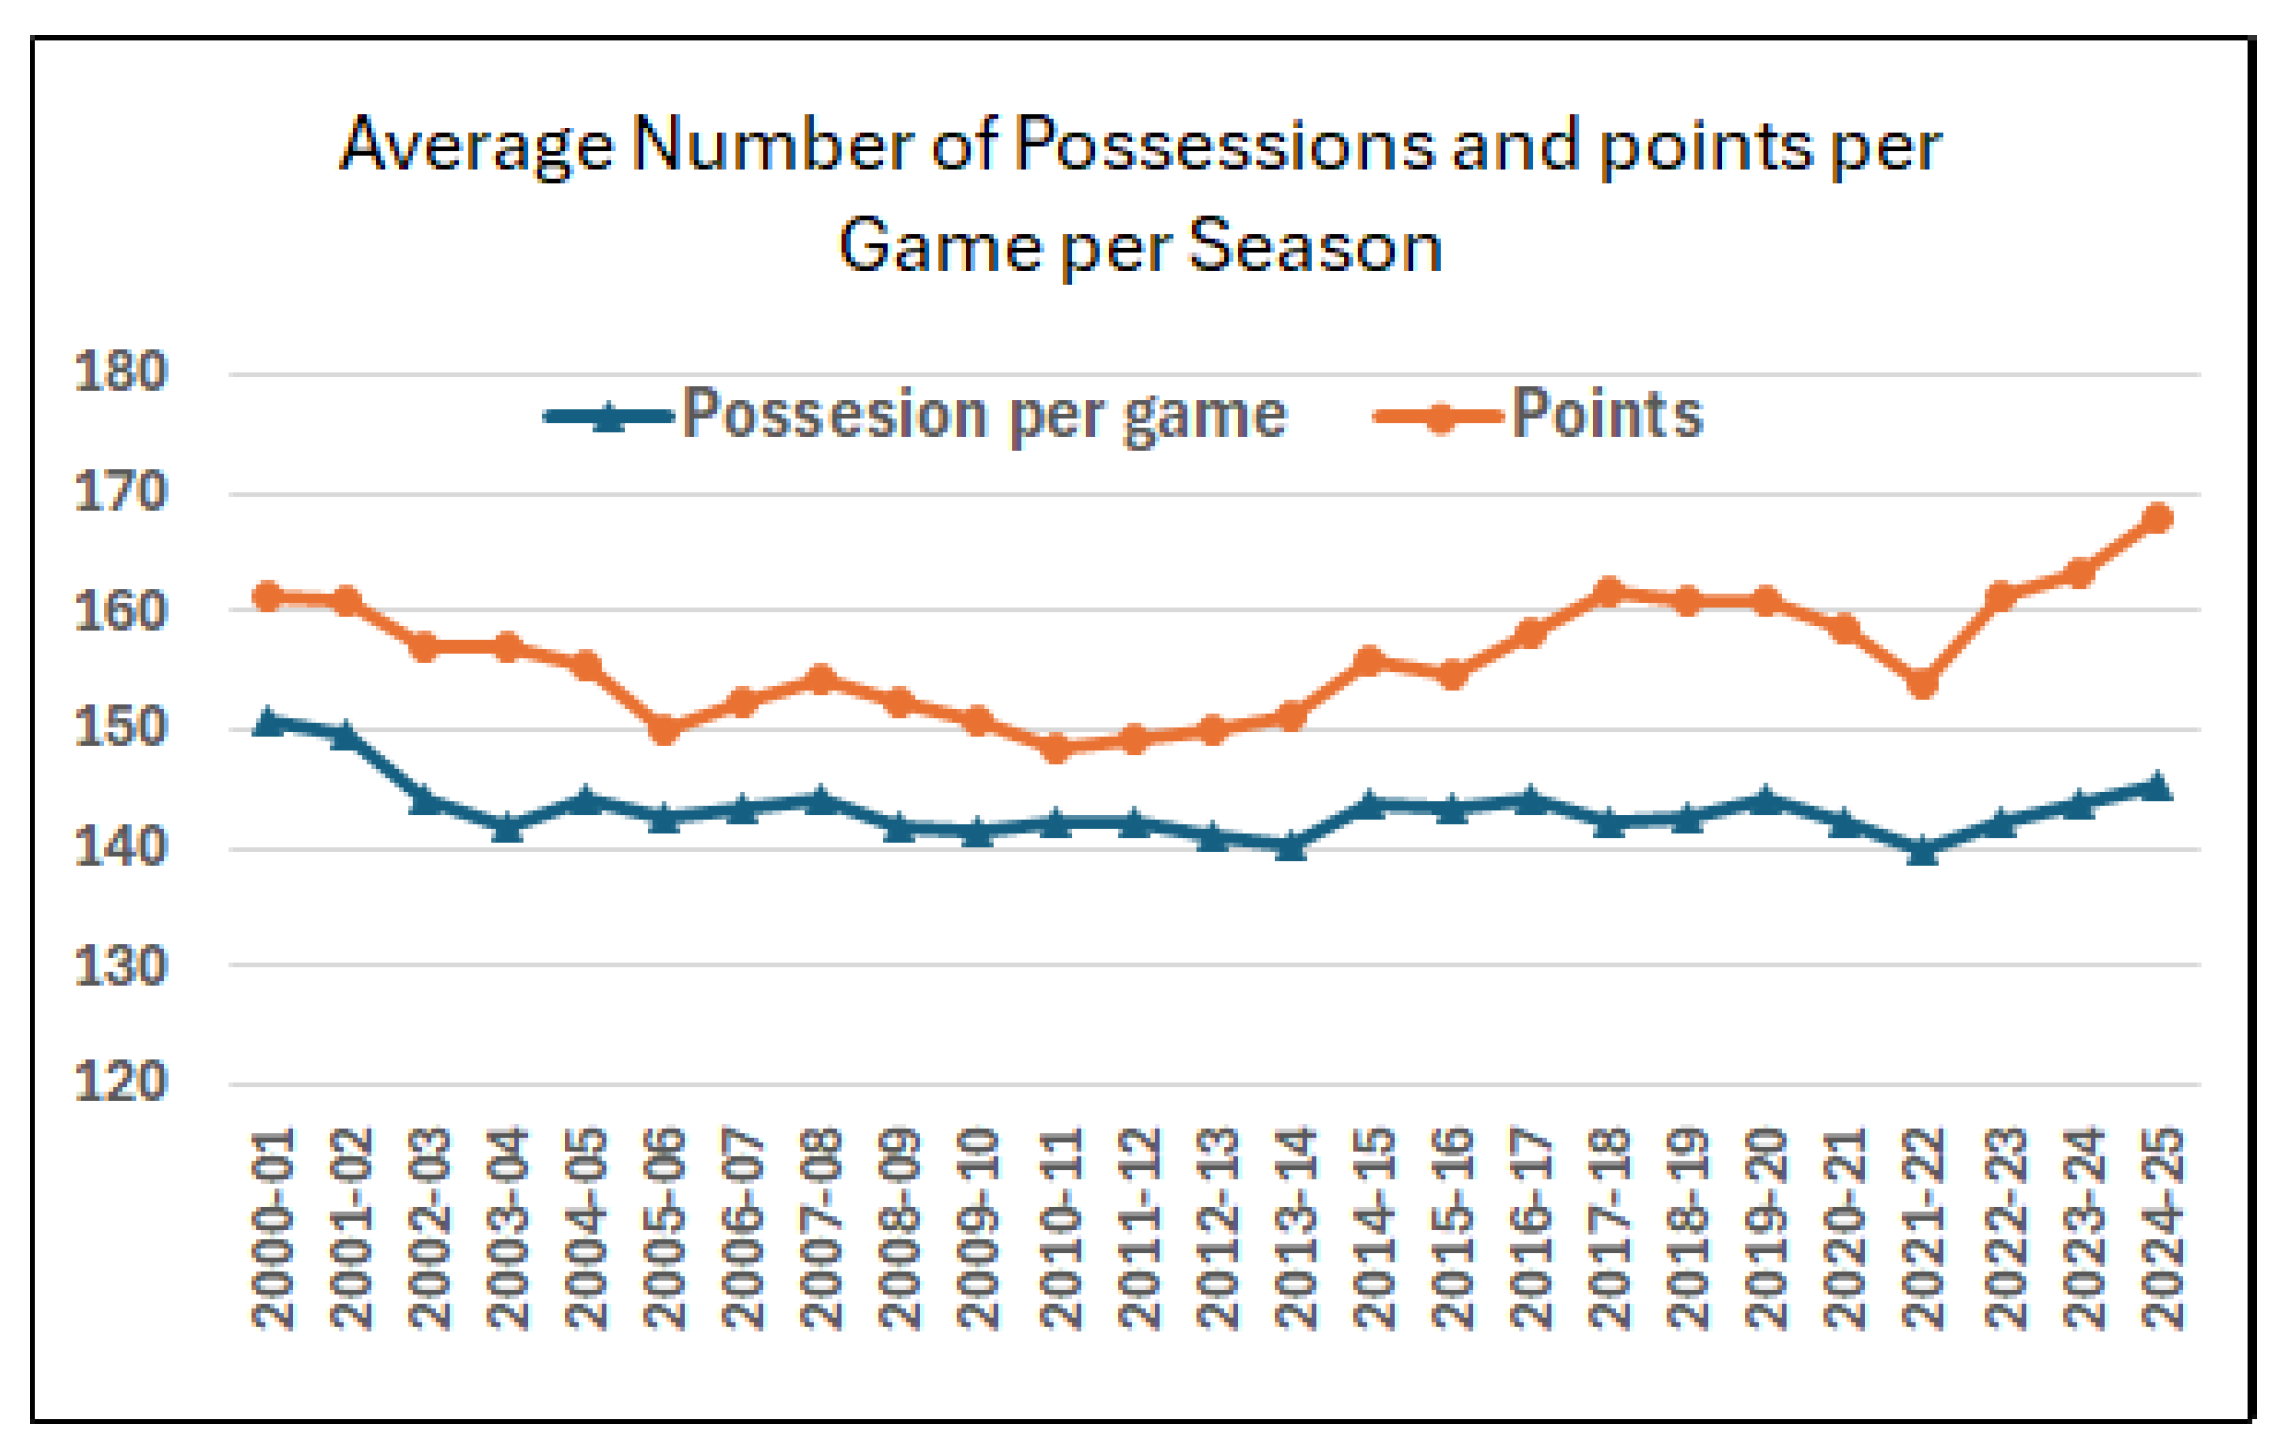
B. Game Point and Possession Evolution. Here, we can see the evolution of the average points and possession per game. The possession is given by the formula , where FGA is the field goals attempted, OR the offensive rebounds, TO the turnovers and FTA the free throws attempted. Variables starting with Opp are the same metrics for the opponent team. Concerning the results, the increase in the number of attempted and made three-point shots has resulted in more points per game, as Figure 18 shows. In the 2024–25 season, we observed the highest average number of points per game, with 167.82 points for 145.41 possessions.
Figure 18.
Average number of possessions and points per game per season (for both teams).
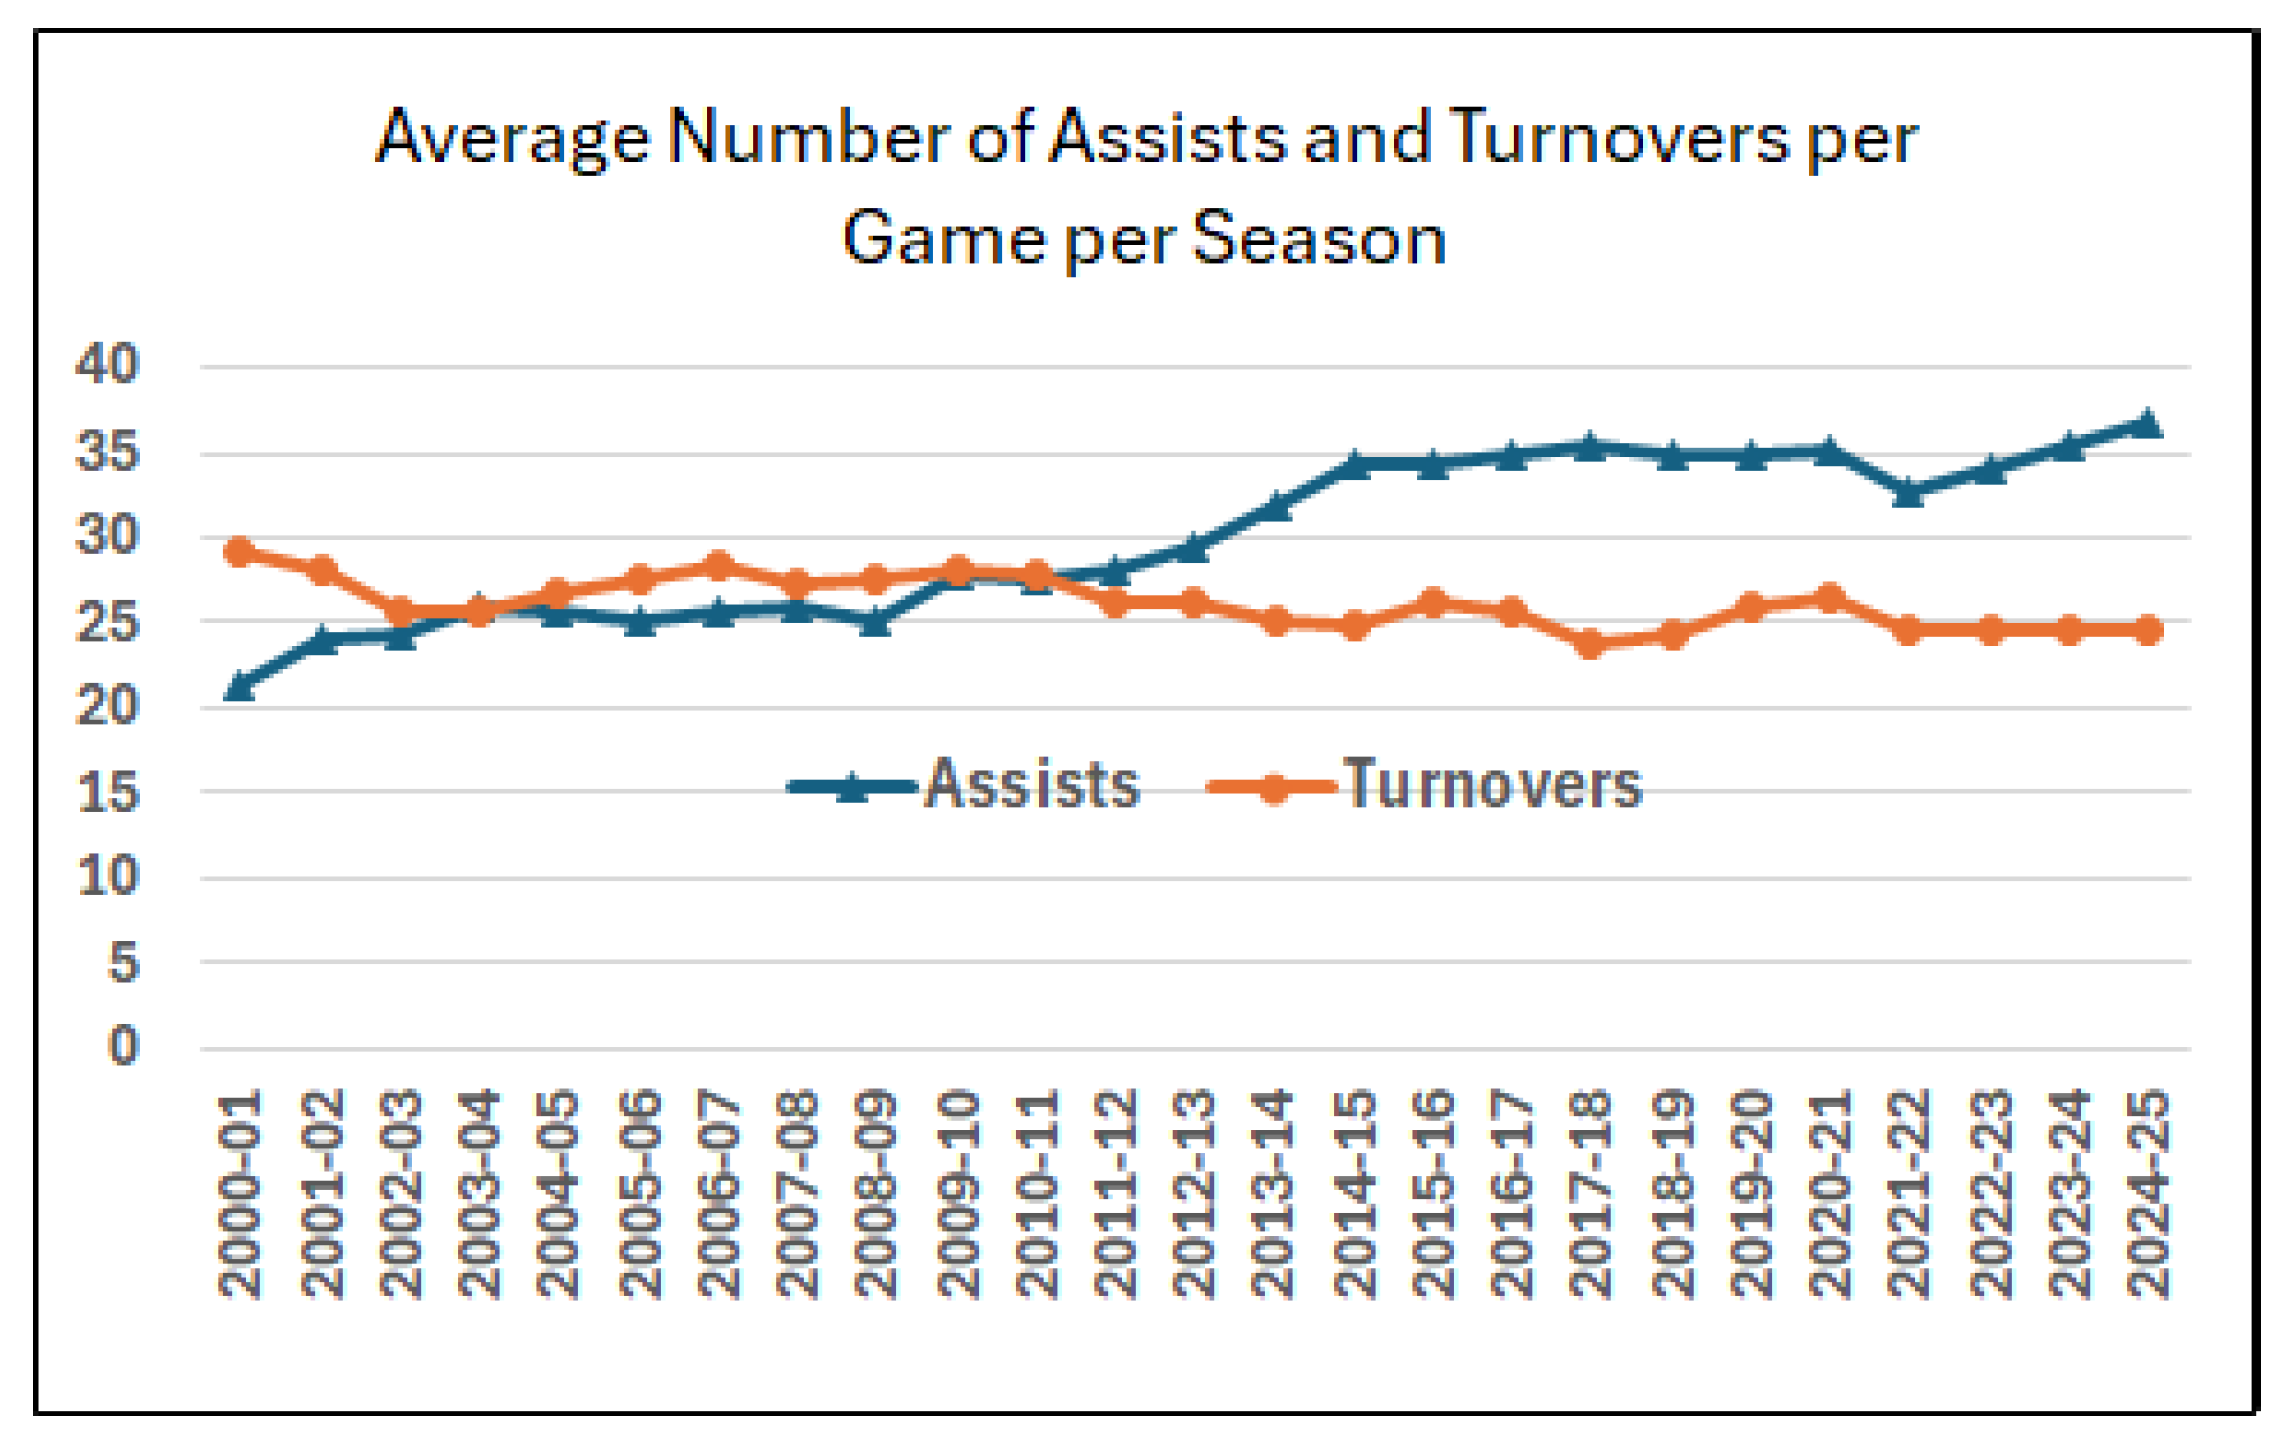
C. Assist and Turnover Evolution. In Figure 19, we show the evolution of assists, which can be explained by the rule change in 2012, by which an assist is now awarded for shooting fouls (where the player scores at least one free throw). Indeed, the number of assists has increased year on year and the number of turnovers has decreased. In the 2024–25 season, we observed 36.8 assists for 24.6 turnovers per game, whereas 15 years ago, i.e., the 2009–2010 season, we observed 27.7 assists for 28.2 turnovers.
Figure 19.
Average number of assists/turnovers per game per season (for both teams).
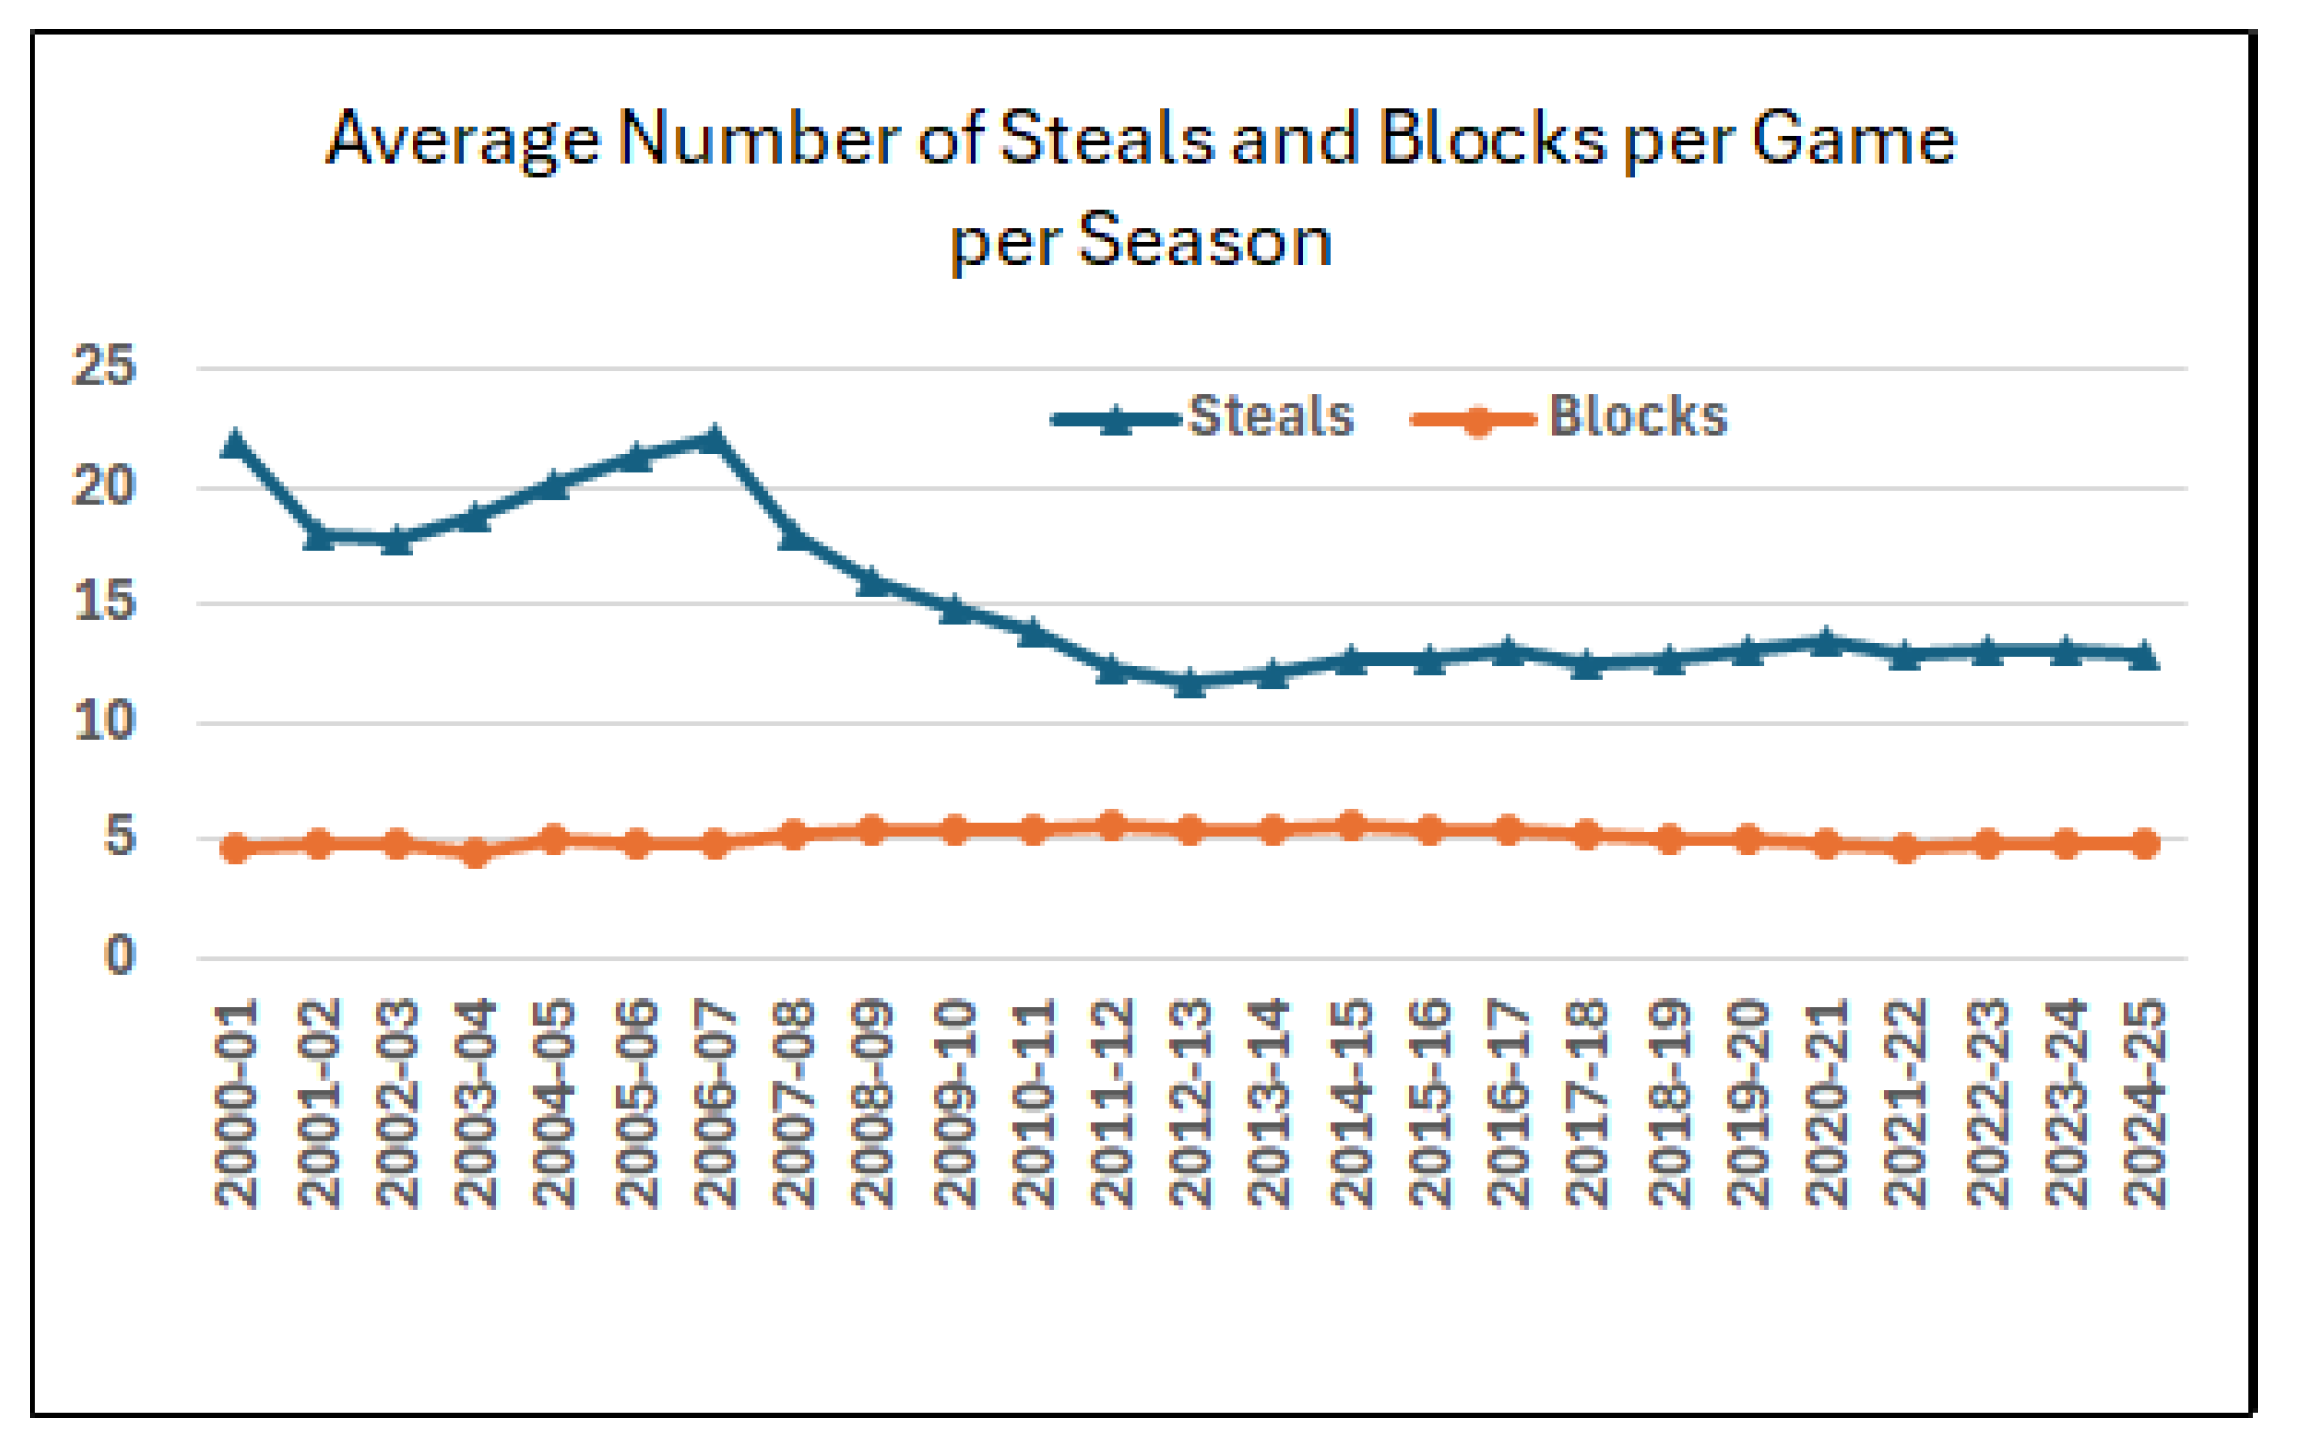
D. Steal and Block Evolution. Figure 20 shows the steals and blocks per game per season. Regarding steals, their average number has highly decreased, which shows the game has evolved, with modern basketball prioritizing offense rather than the defense-oriented approach of earlier eras; i.e., in a past season (2024–25), we observed only 12.8 steals per game. Concerning the blocks, their number is mostly stable through the seasons (approximately 5 blocks per game).
Figure 20.
Average number of steals and blocks per game per season (for both teams).
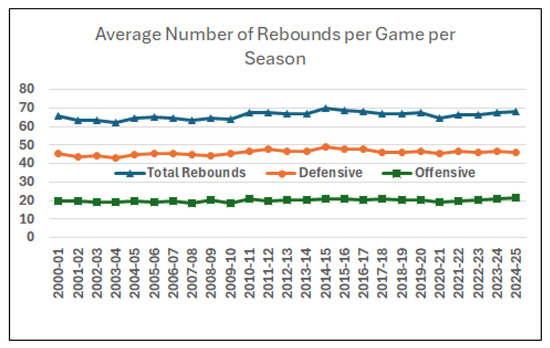
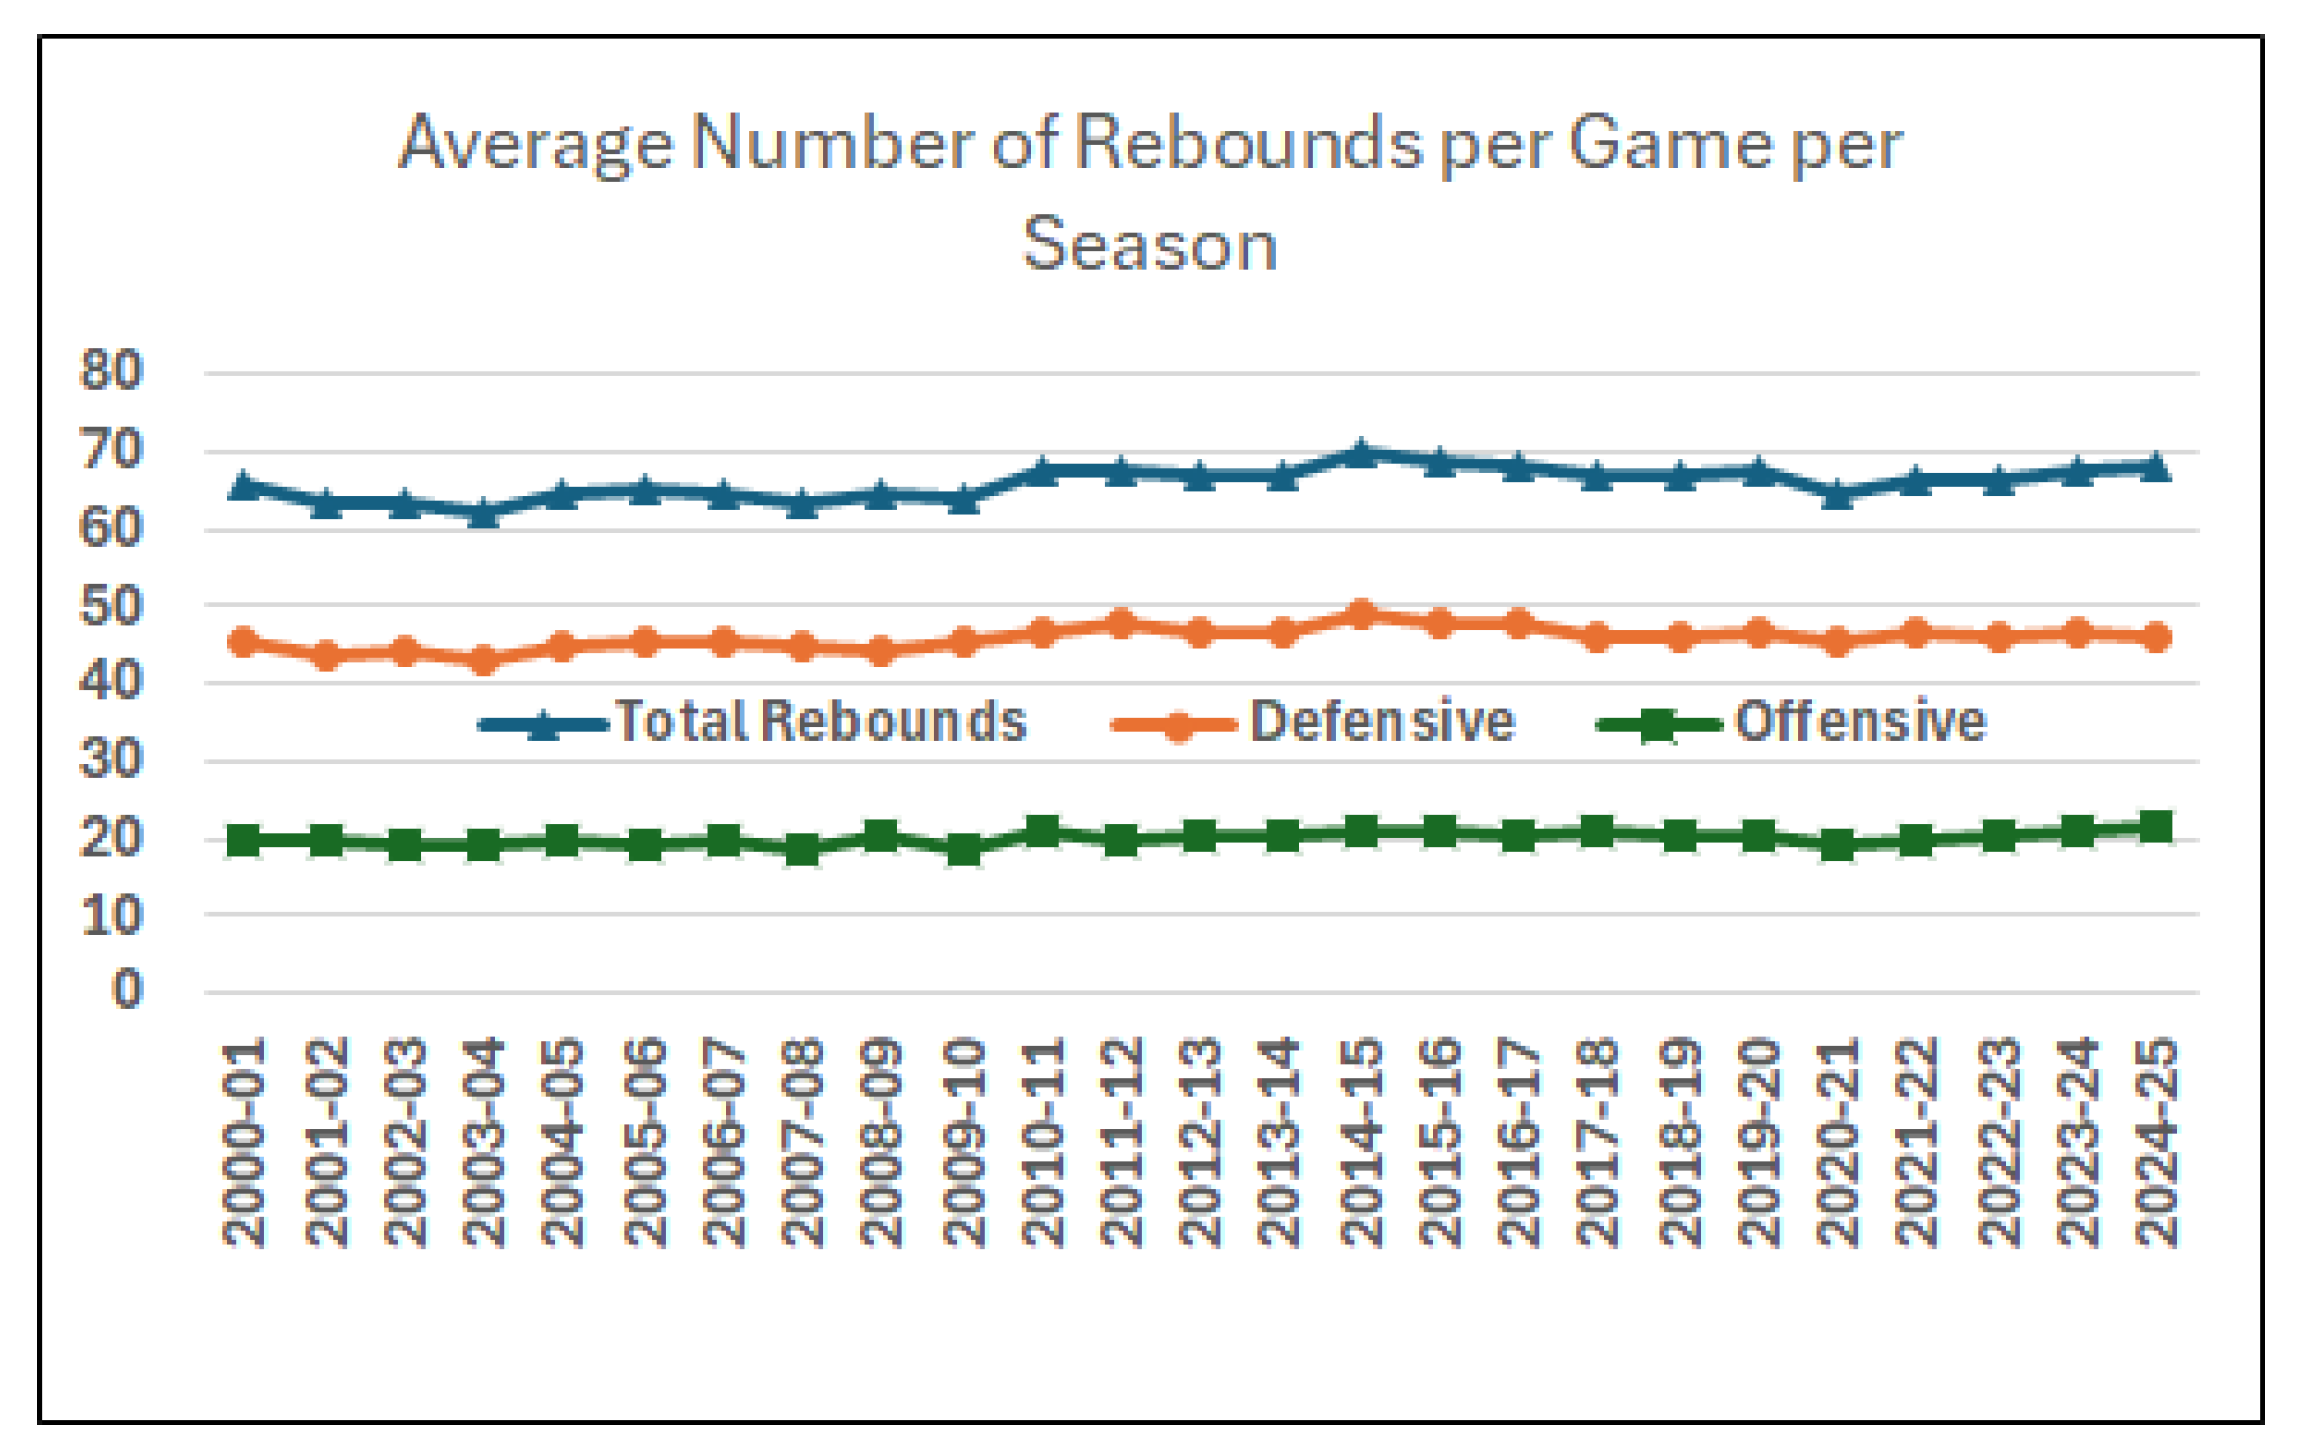
E. Rebounds (Total, Defensive, Offensive). Similarly to the blocks, the average number of rebounds (see Figure 21) has remained mostly stable for all categories, i.e., total, defensive and offensive rebounds. However, in the most recent season (2024–25), the offensive rebounds reached their peak, with 21.59 per game.
Figure 21.
Average number of rebounds per game per season (for both teams).
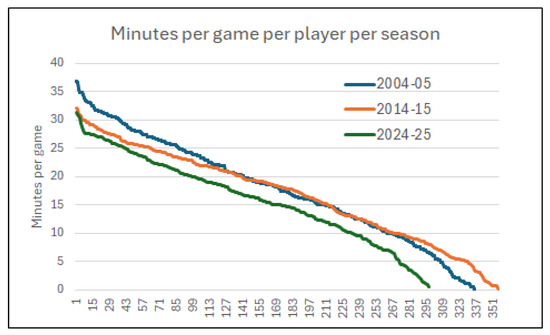
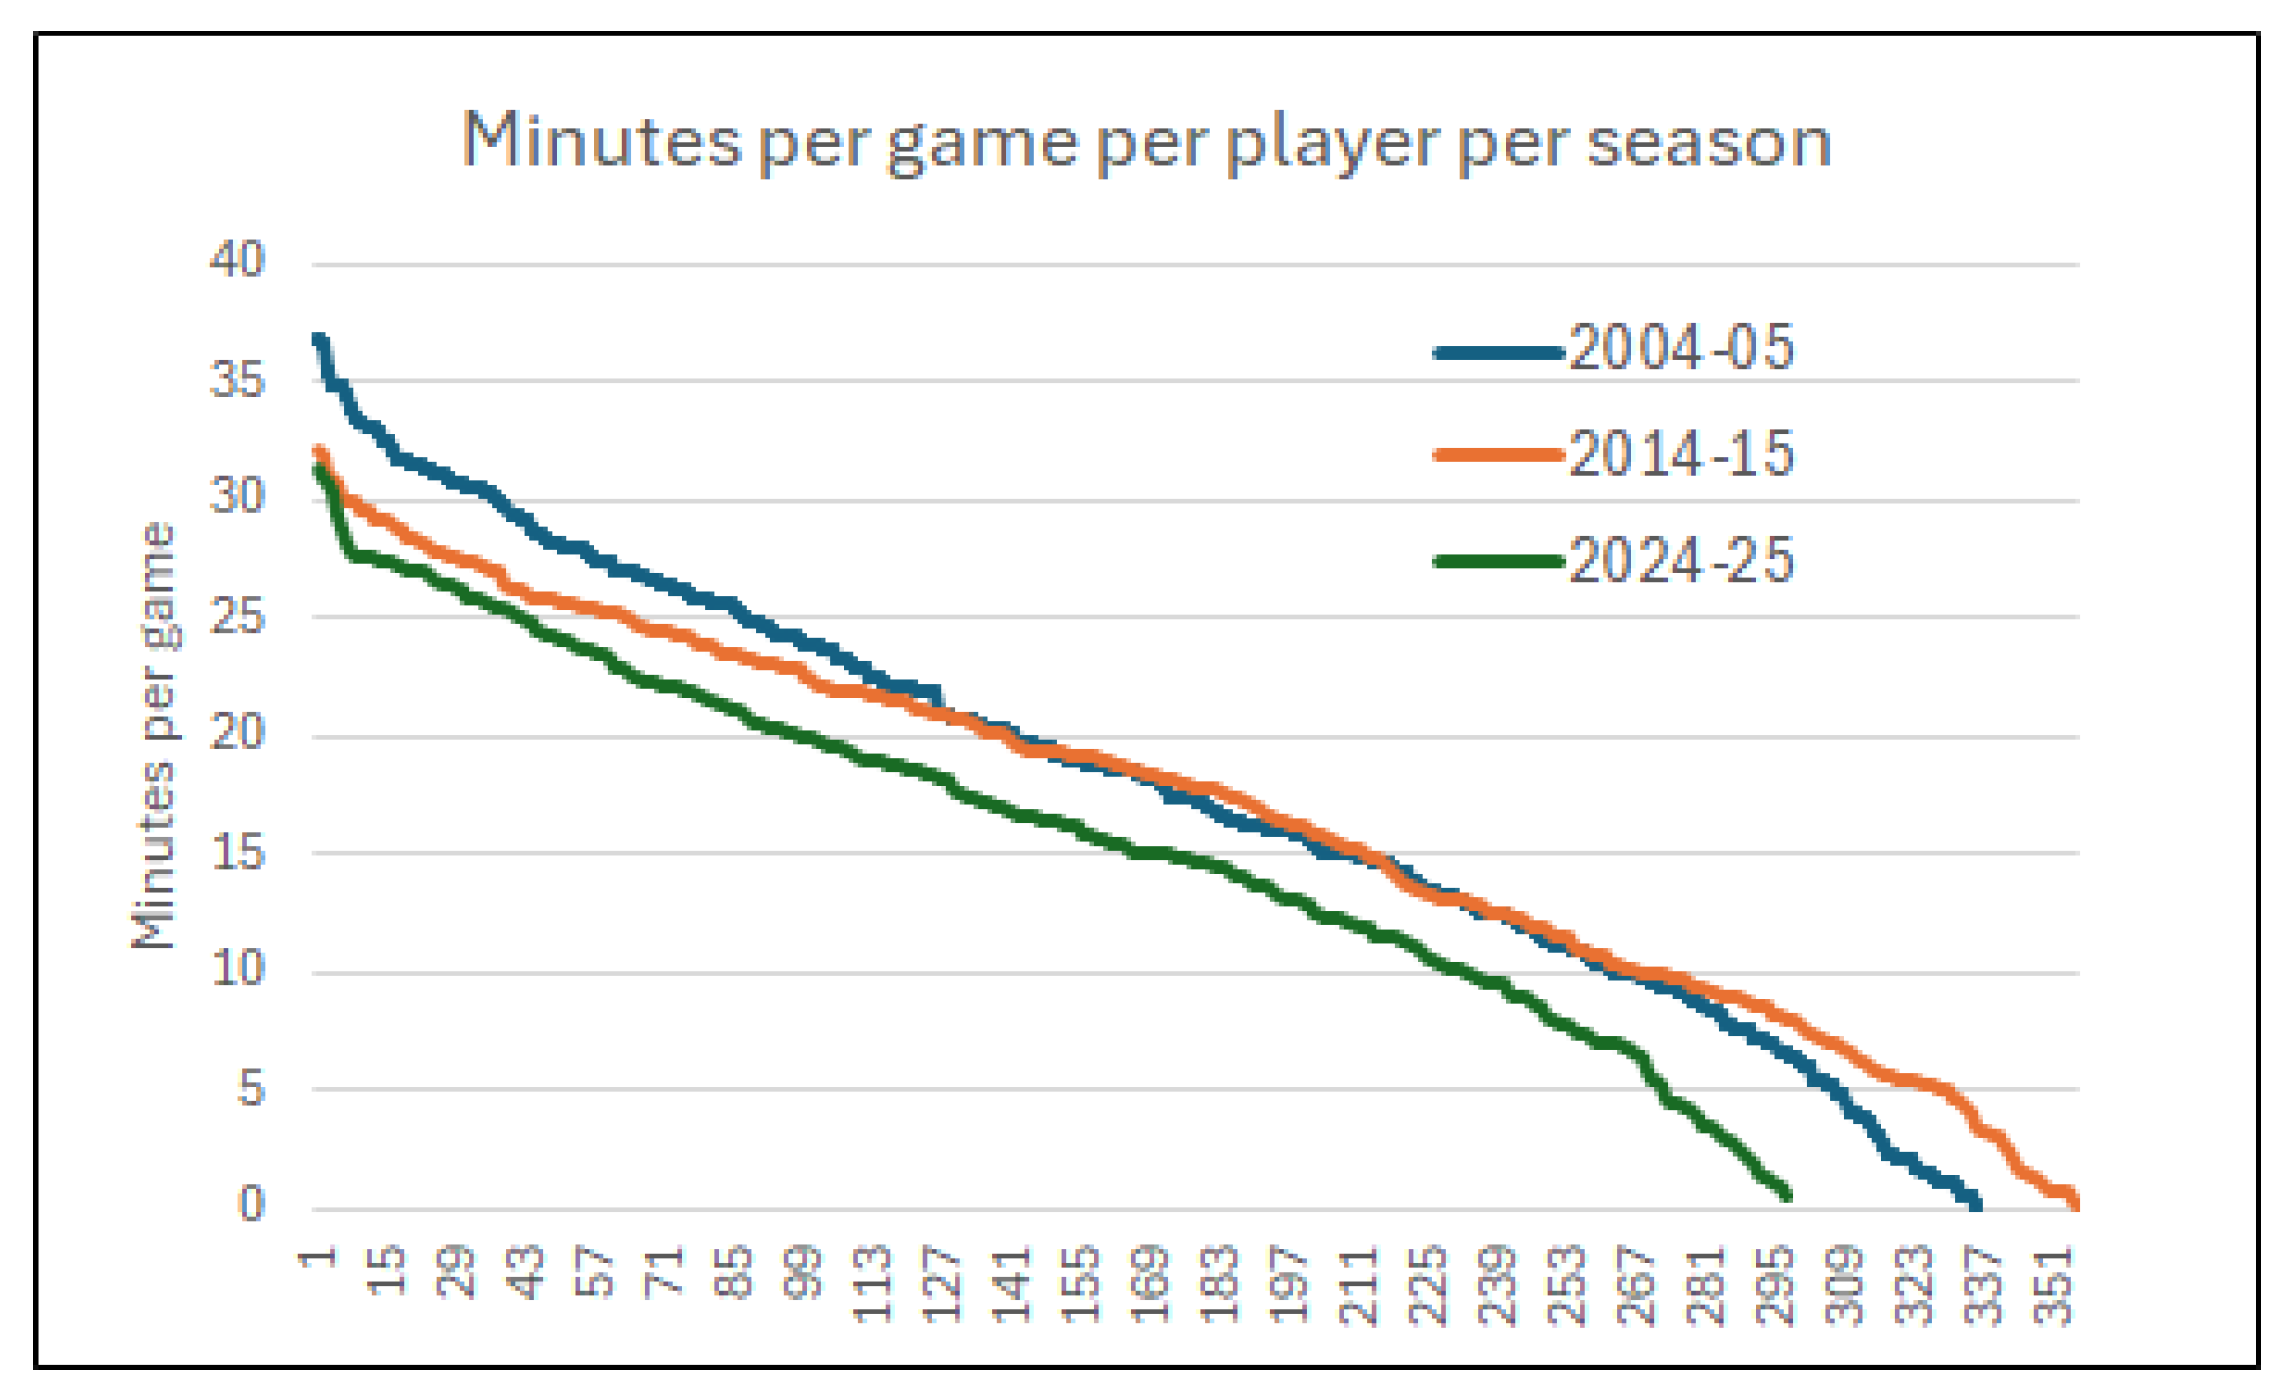
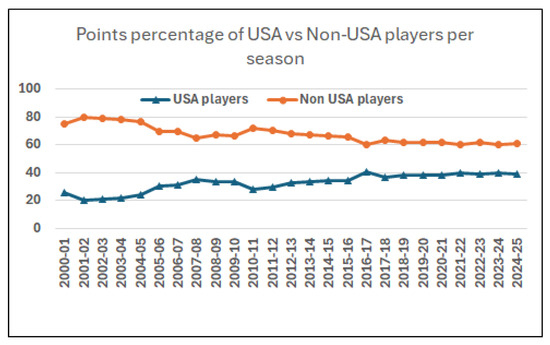
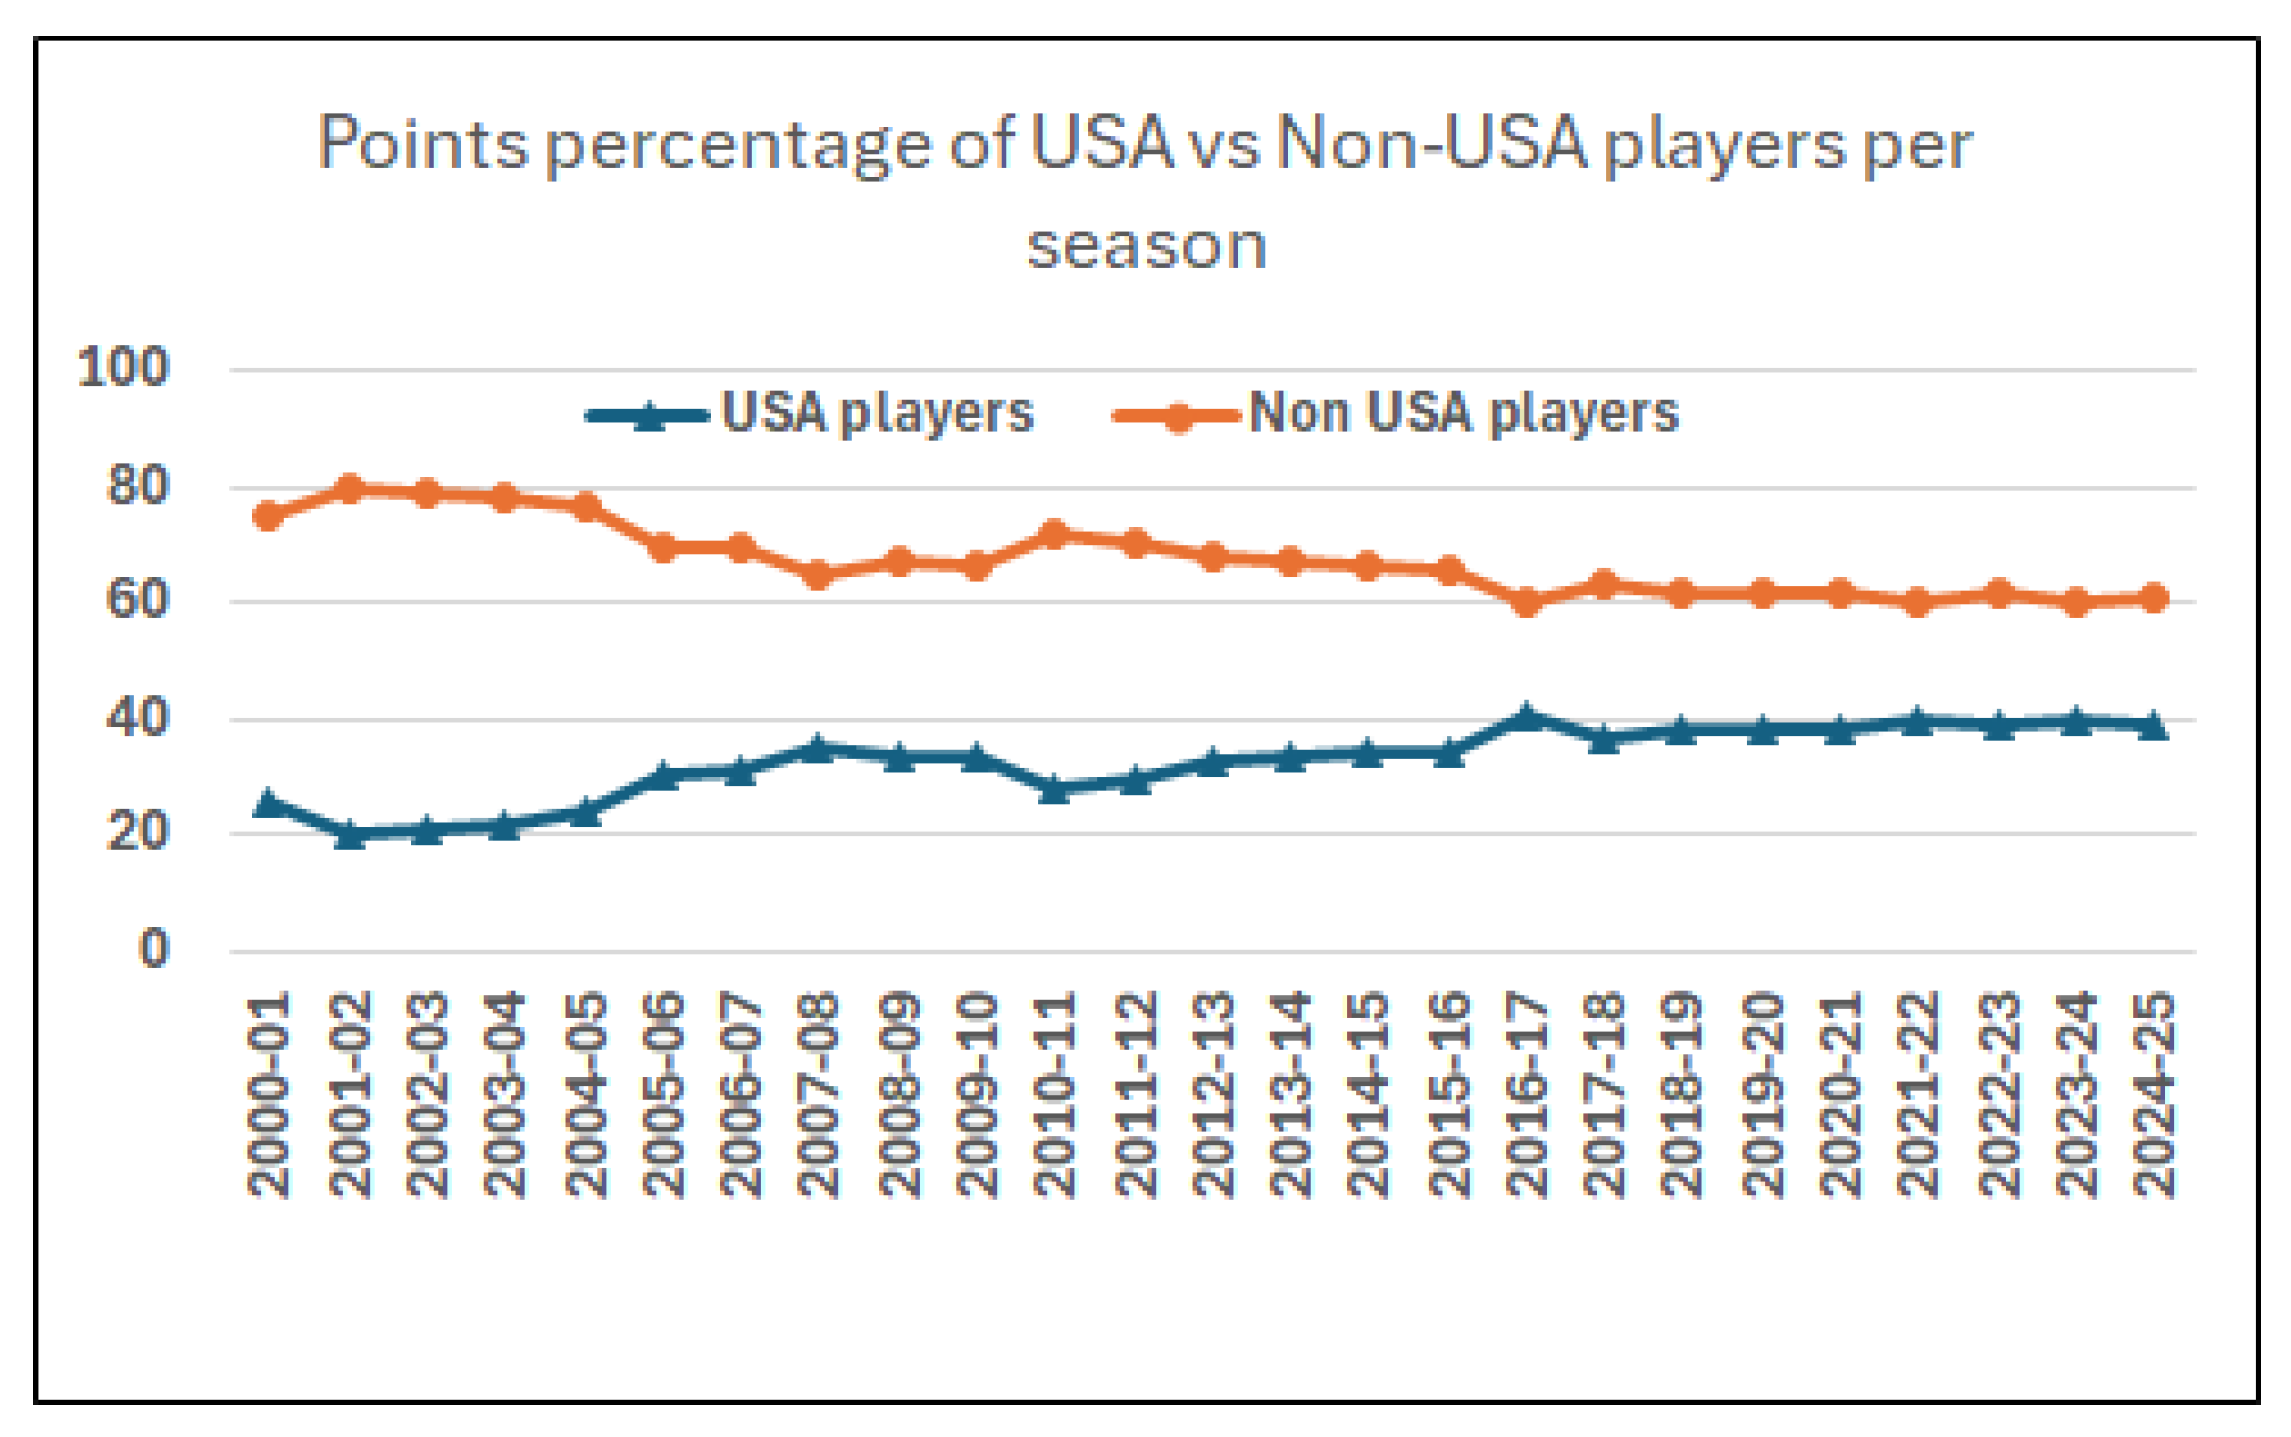
F. Player Minutes and Player Points (USA vs Non-USA). Figure 22 shows the minutes of players over three seasons (of different decades) showing that it was more common in previous decades to have players with more than 30 min average in a game. Moreover, Figure 23 shows the percentage of points for the whole season scored by players from USA and players from the rest of the world. In 2000–01, 25% of season points were scored by American players, whereas in 2024–25 this percentage increased to 39%.
Figure 22.
Minutes per game per player per season (three seasons).
Figure 23.
Points percentage of USA vs Non-USA players per season.
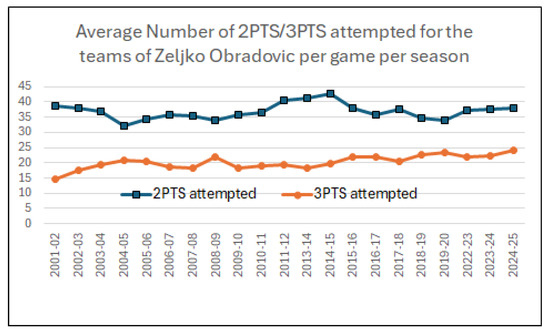
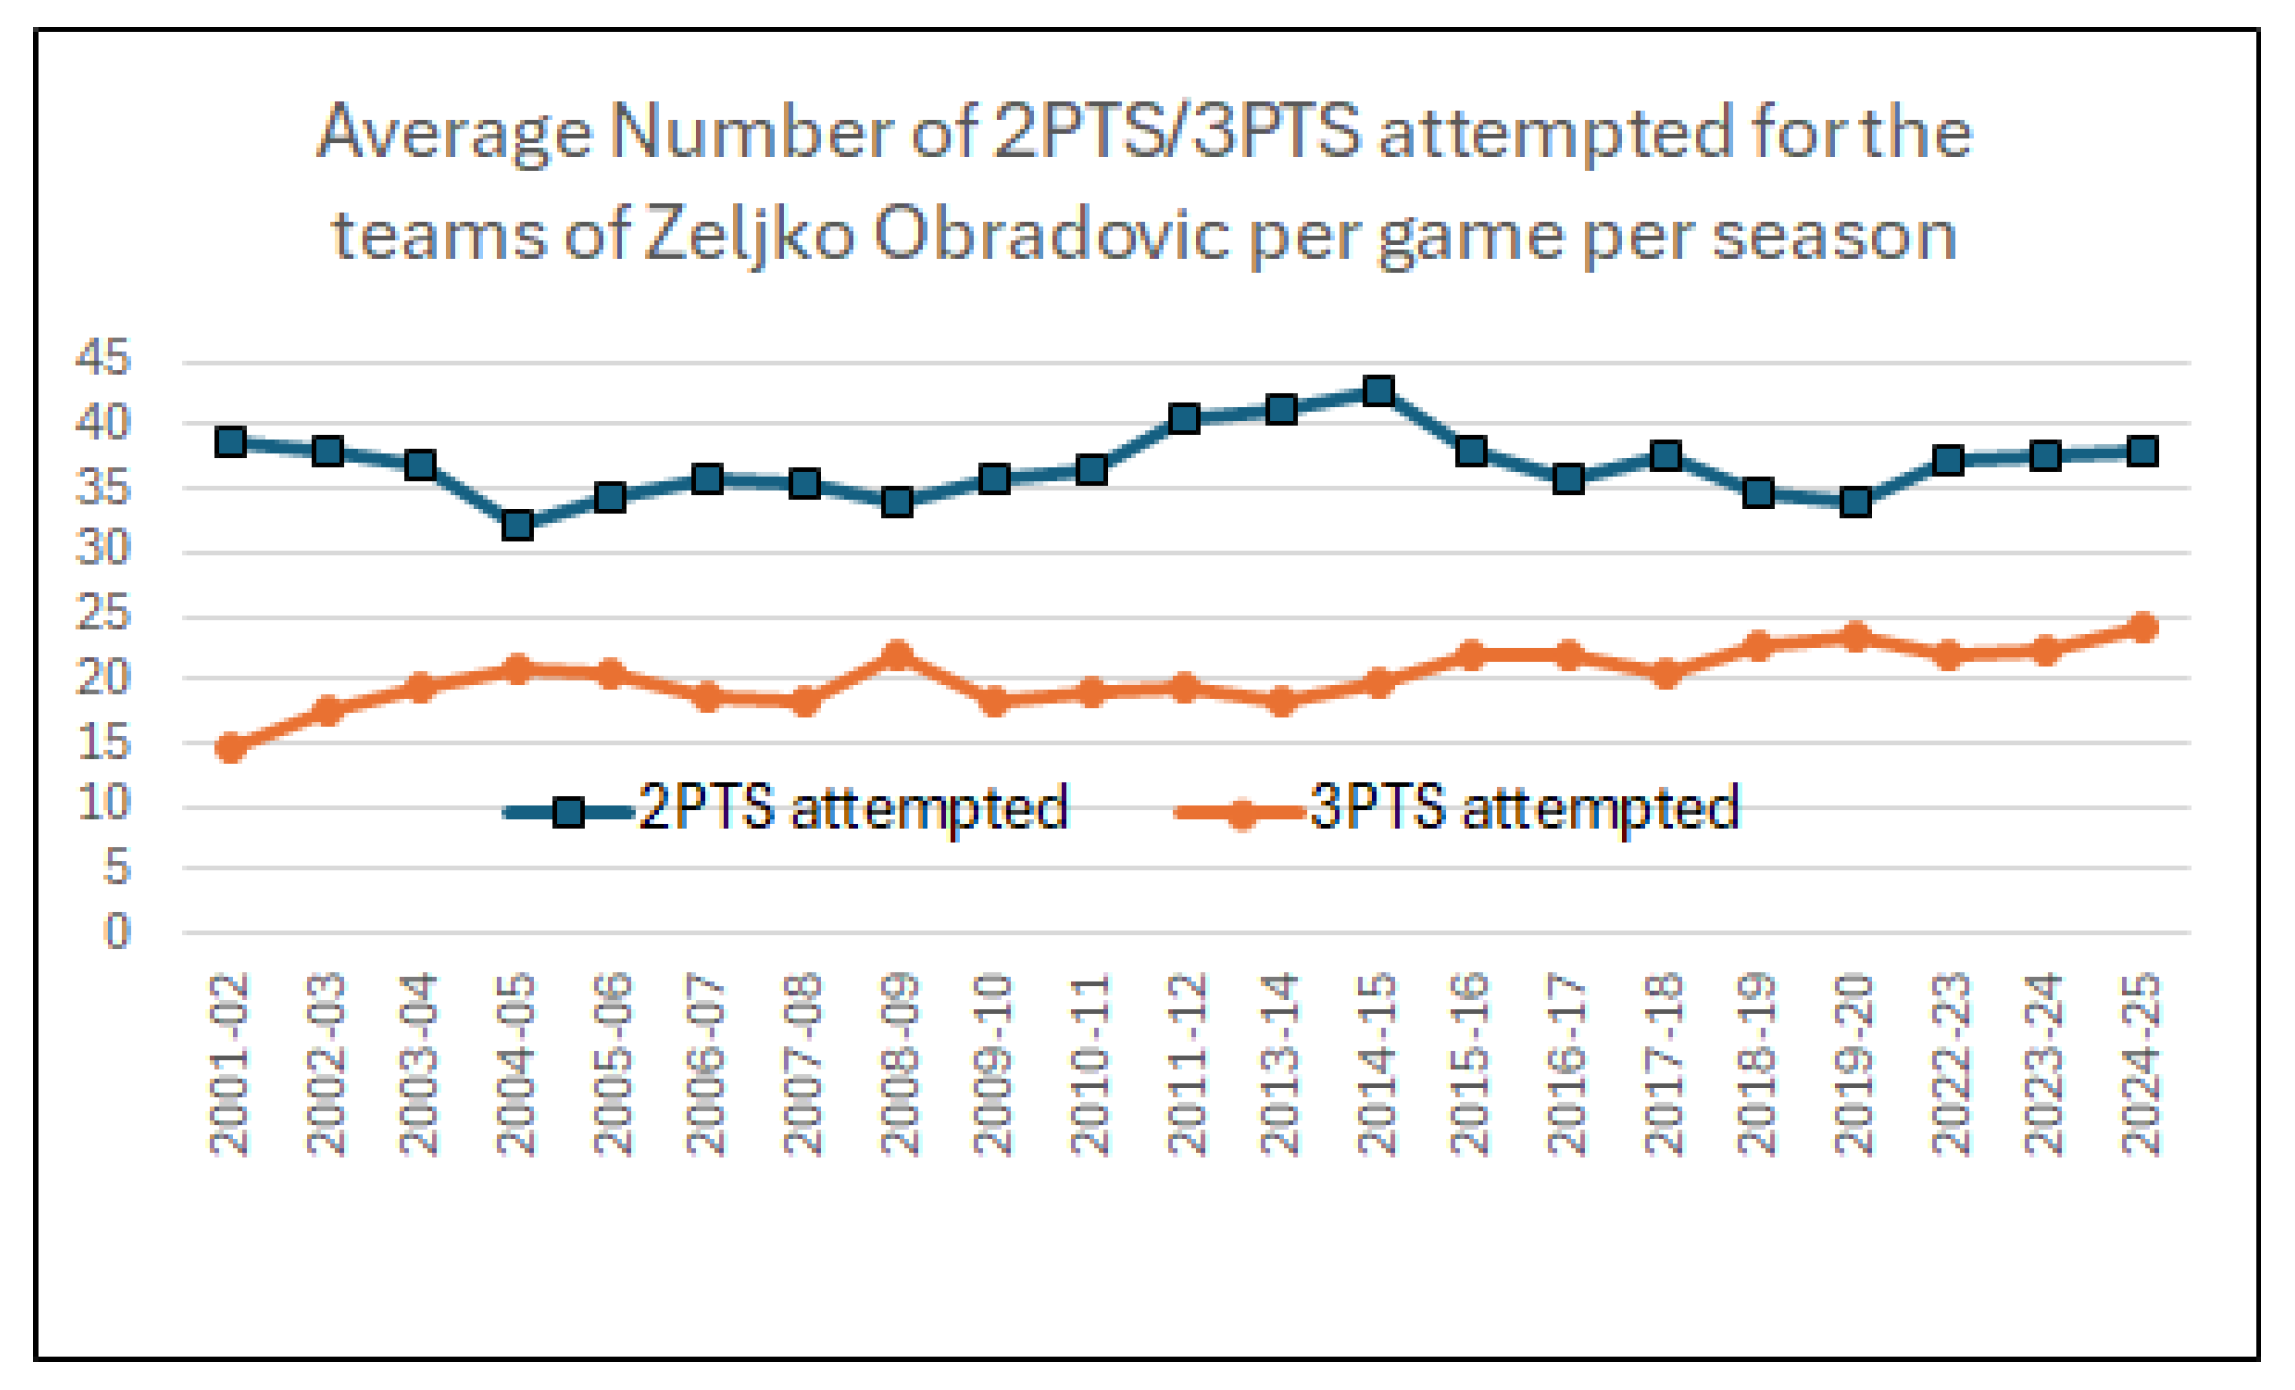
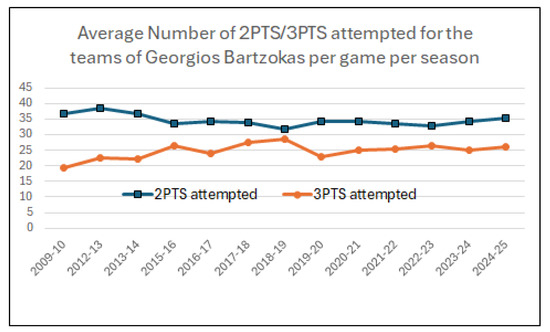
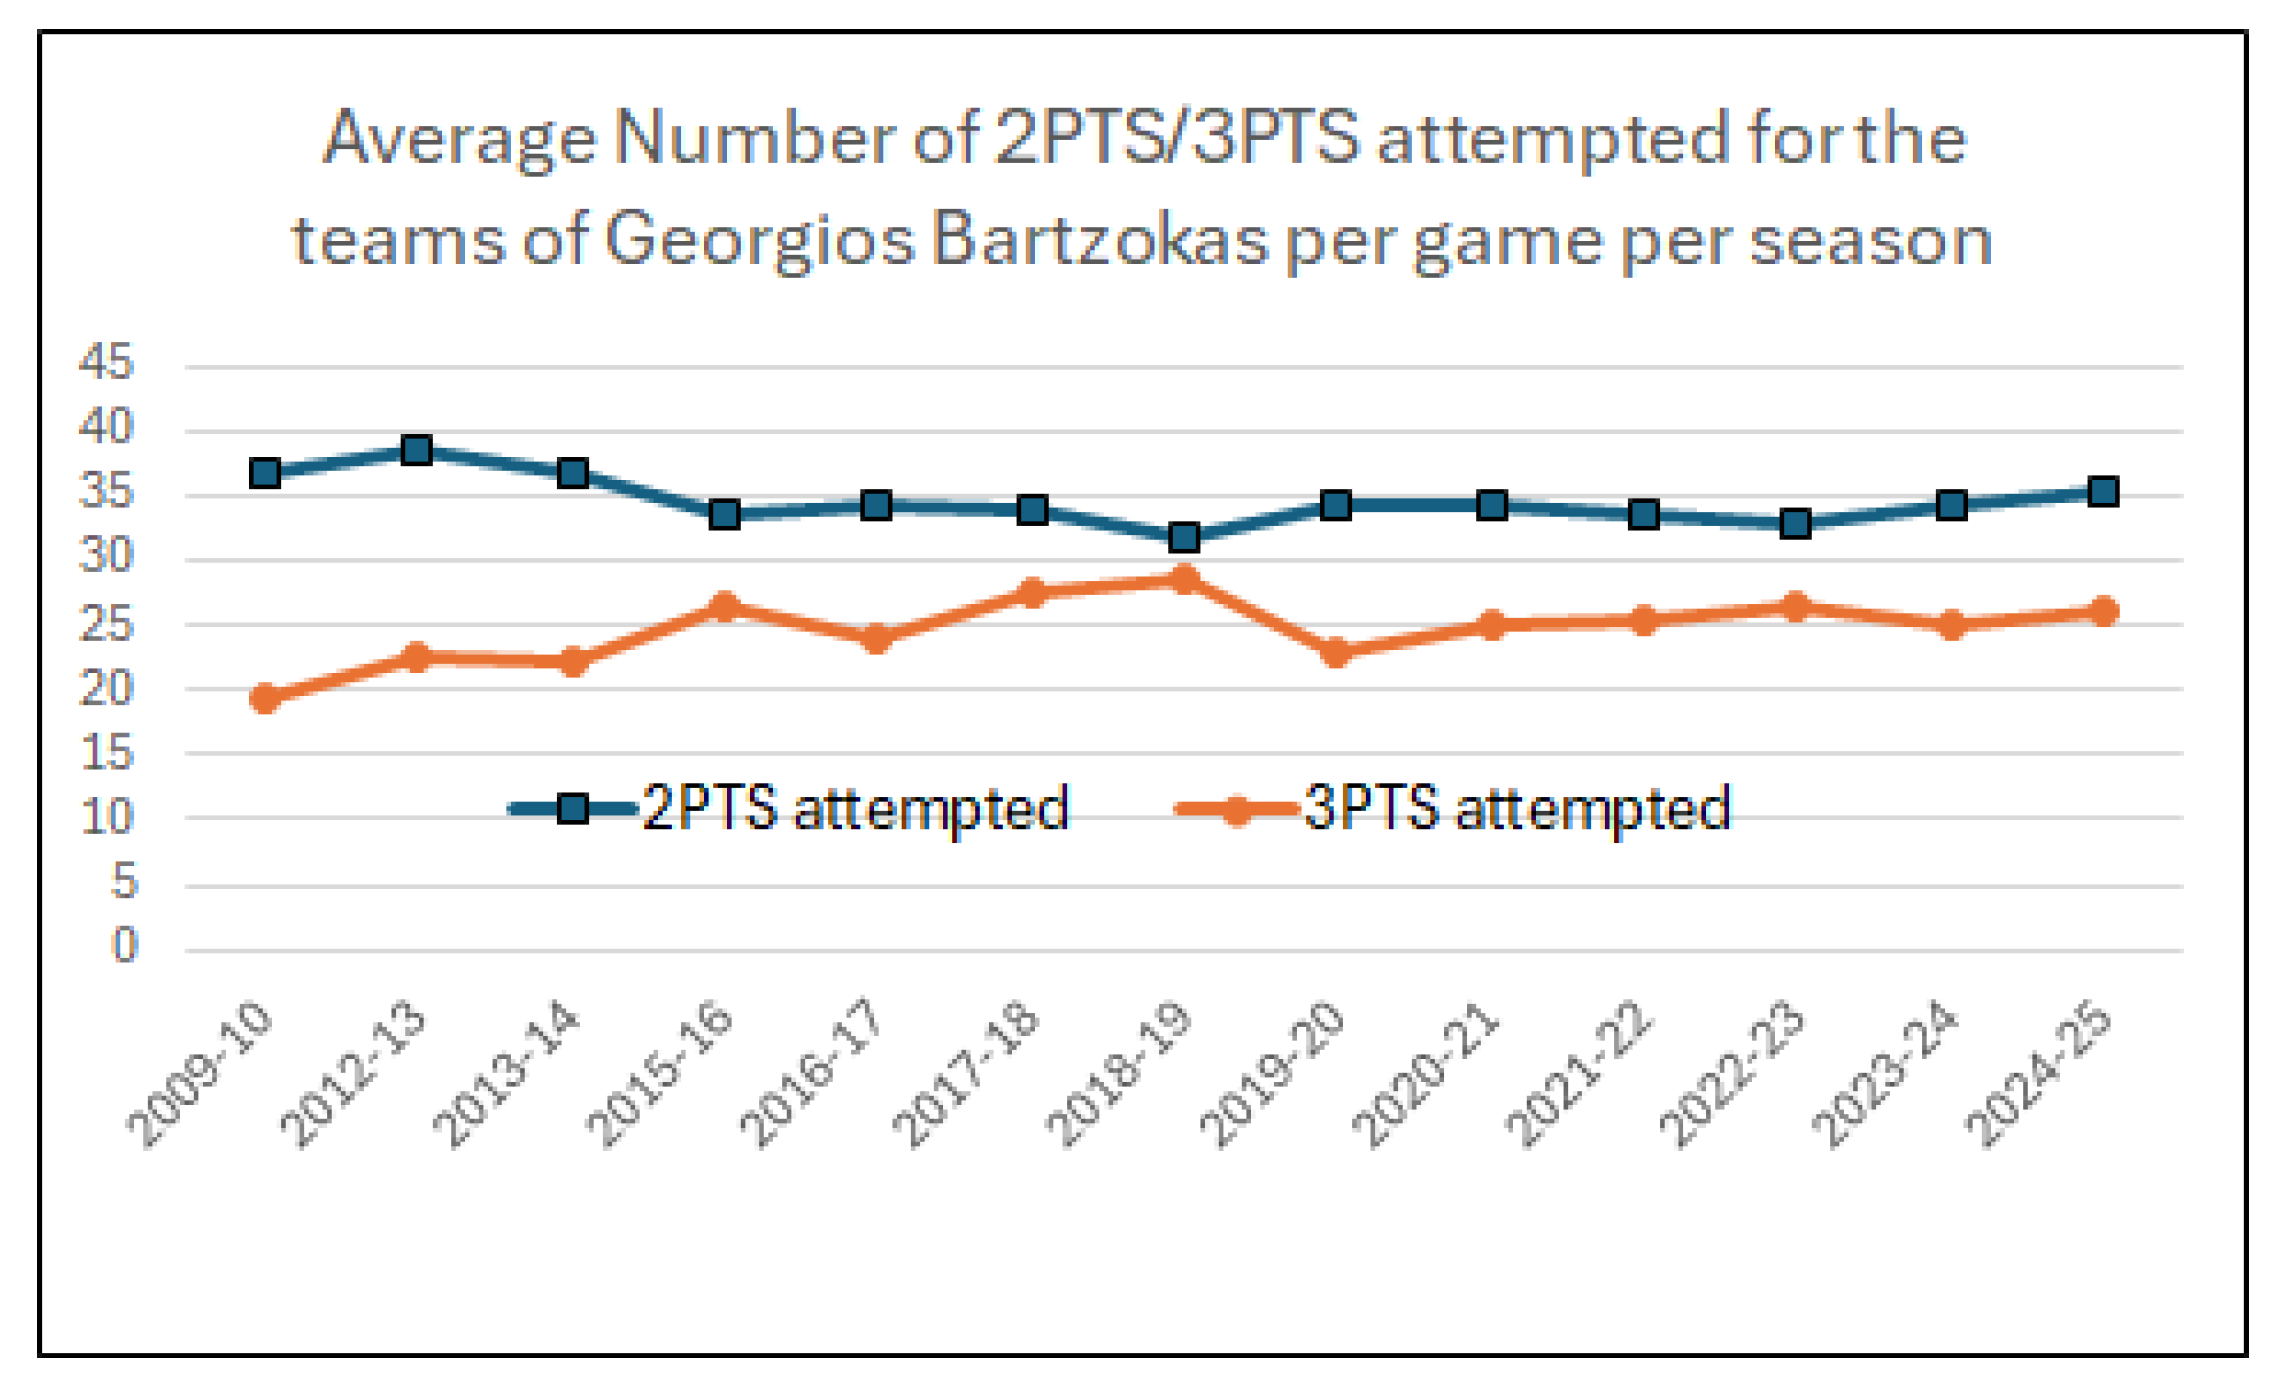
G. Coach Evolution for Two/three-point shots attempted. Here, we show the evolution of coaches for the attempted two- and three-point shots for Zeljko Obradovic and Georgios Bartzokas. In the first case (see Figure 24), Zeljko Obradovic has adjusted his game by adding more three-point shots. On the other hand, the teams of Bartzokas (see Figure 25) tend to shoot more three-point shots than Obradovic’s teams. Indicatively, in a past season, Bartzokas’s team attempted 35.2 two-point shots versus 26 three-point shots per game, and Obradovic’s team attempted 38.1 two-point shots for 24 three-point shots per game.
Figure 24.
Average number of attempted 2PTS/3PTs for Zeljko Obradovic’s teams per game per season.
Figure 25.
Average number of attempted 2PTS/3PTs for Georgios Bartzokas’s teams per game per season.
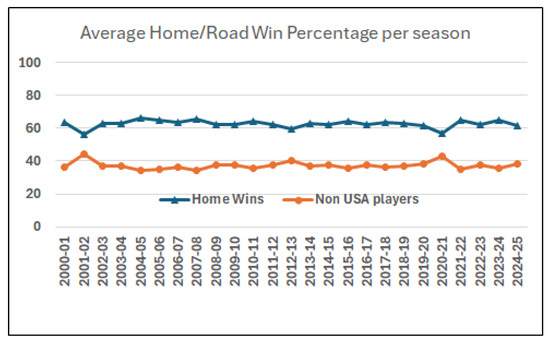
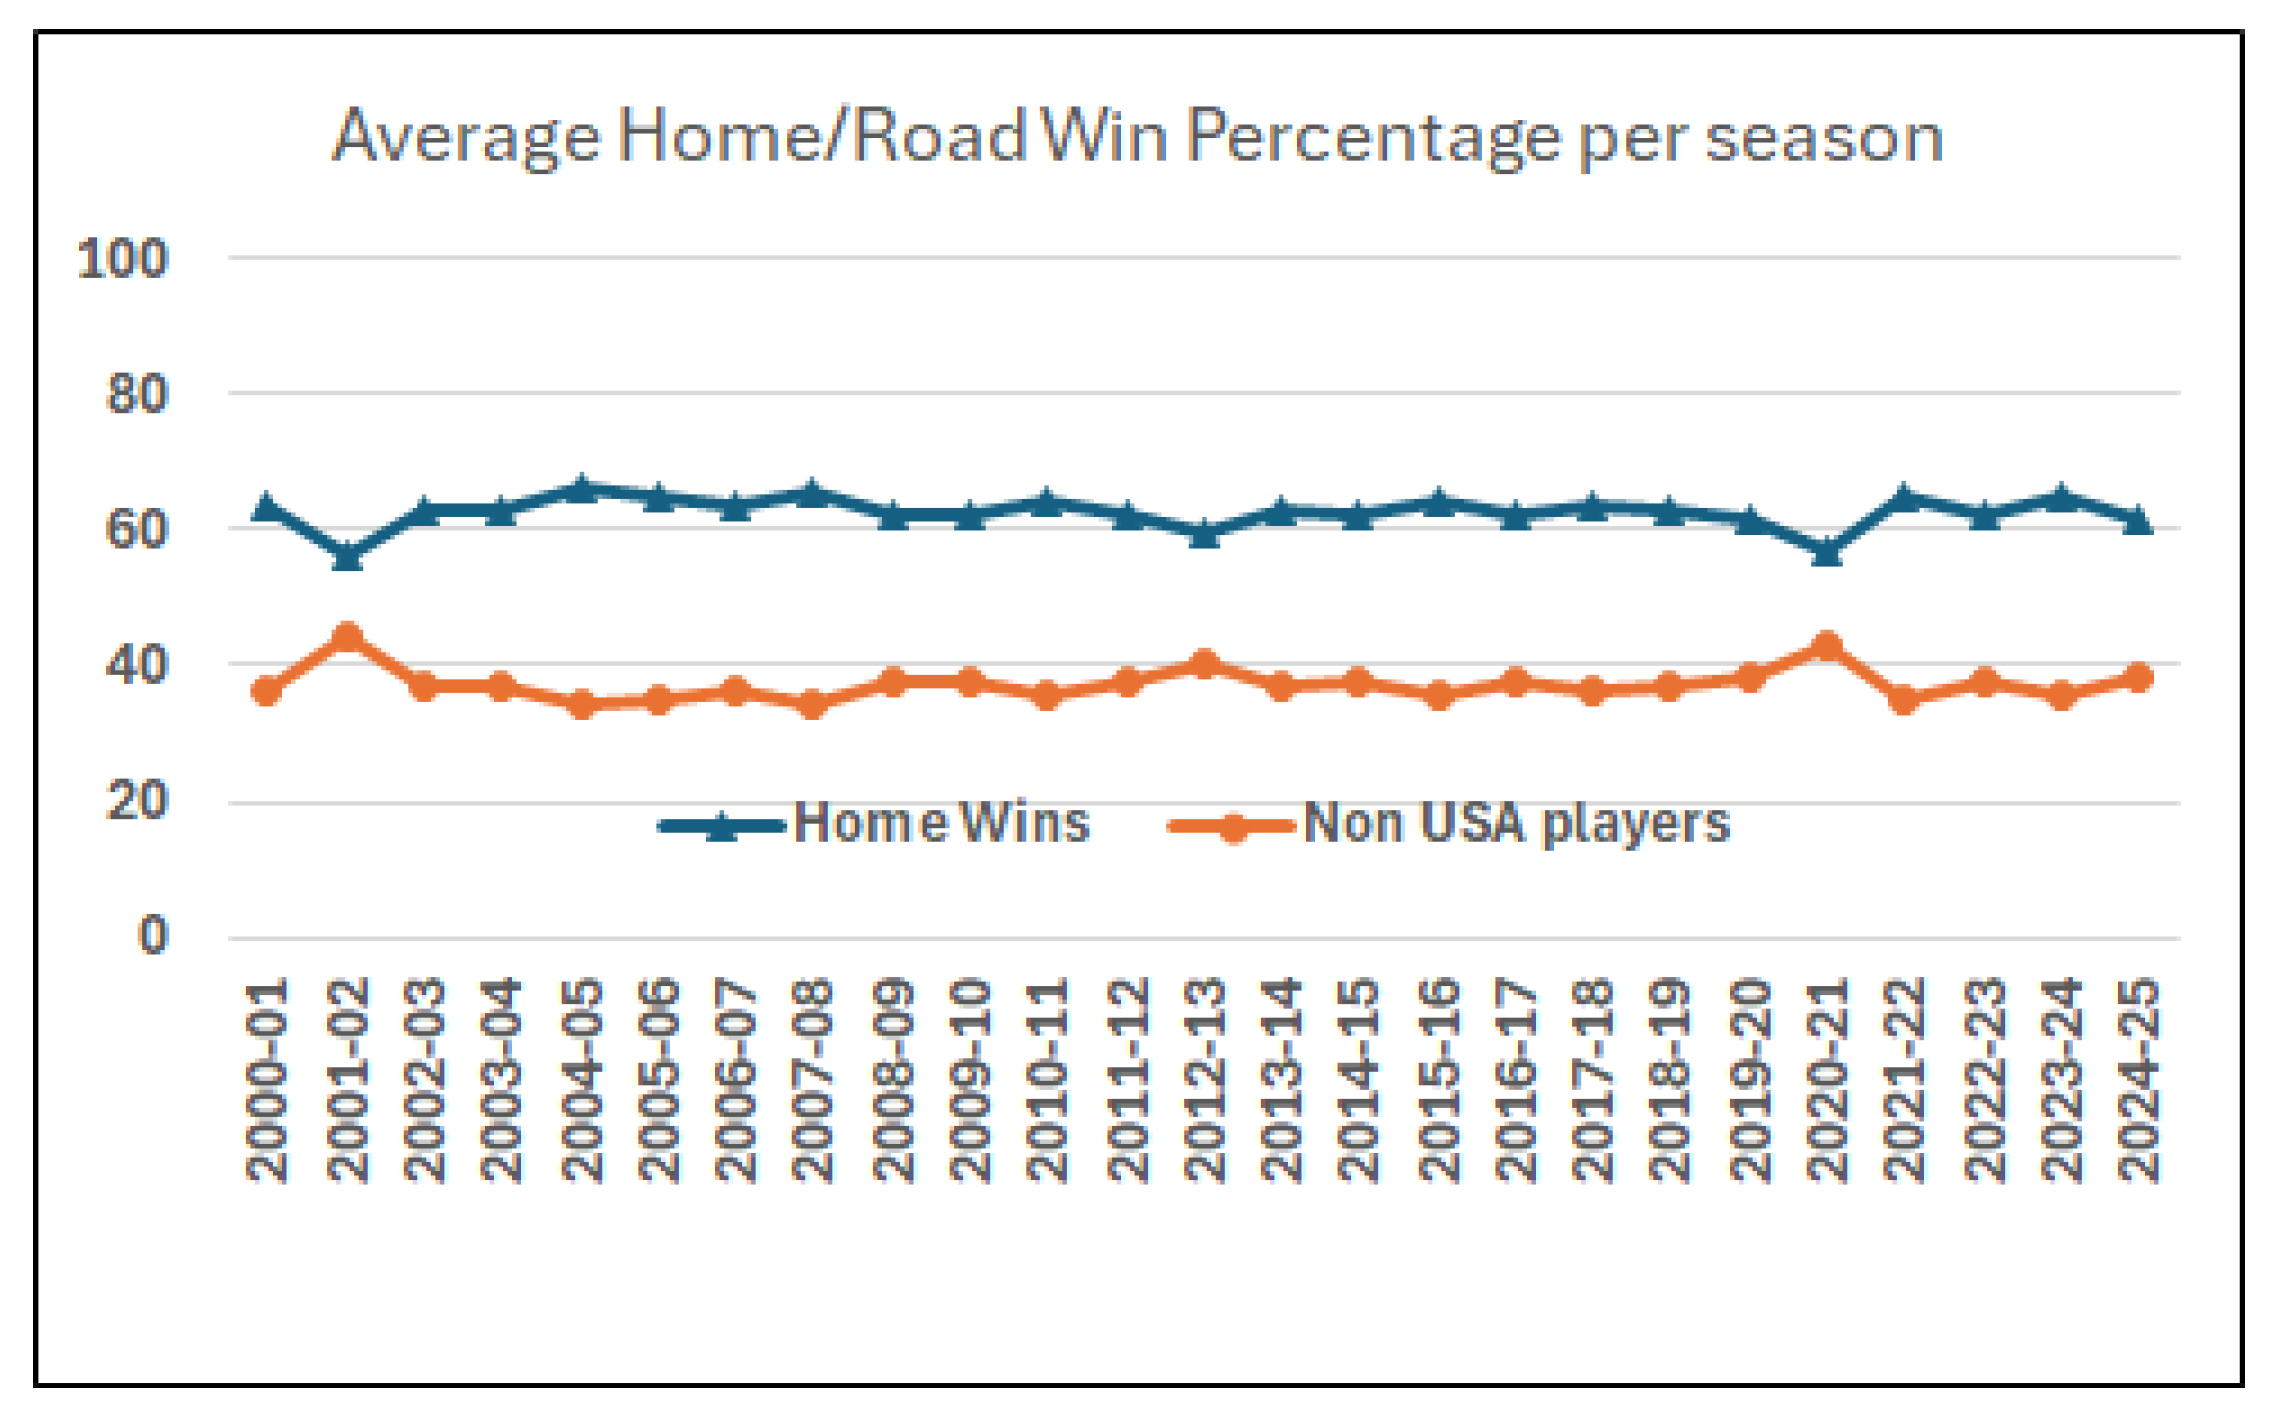
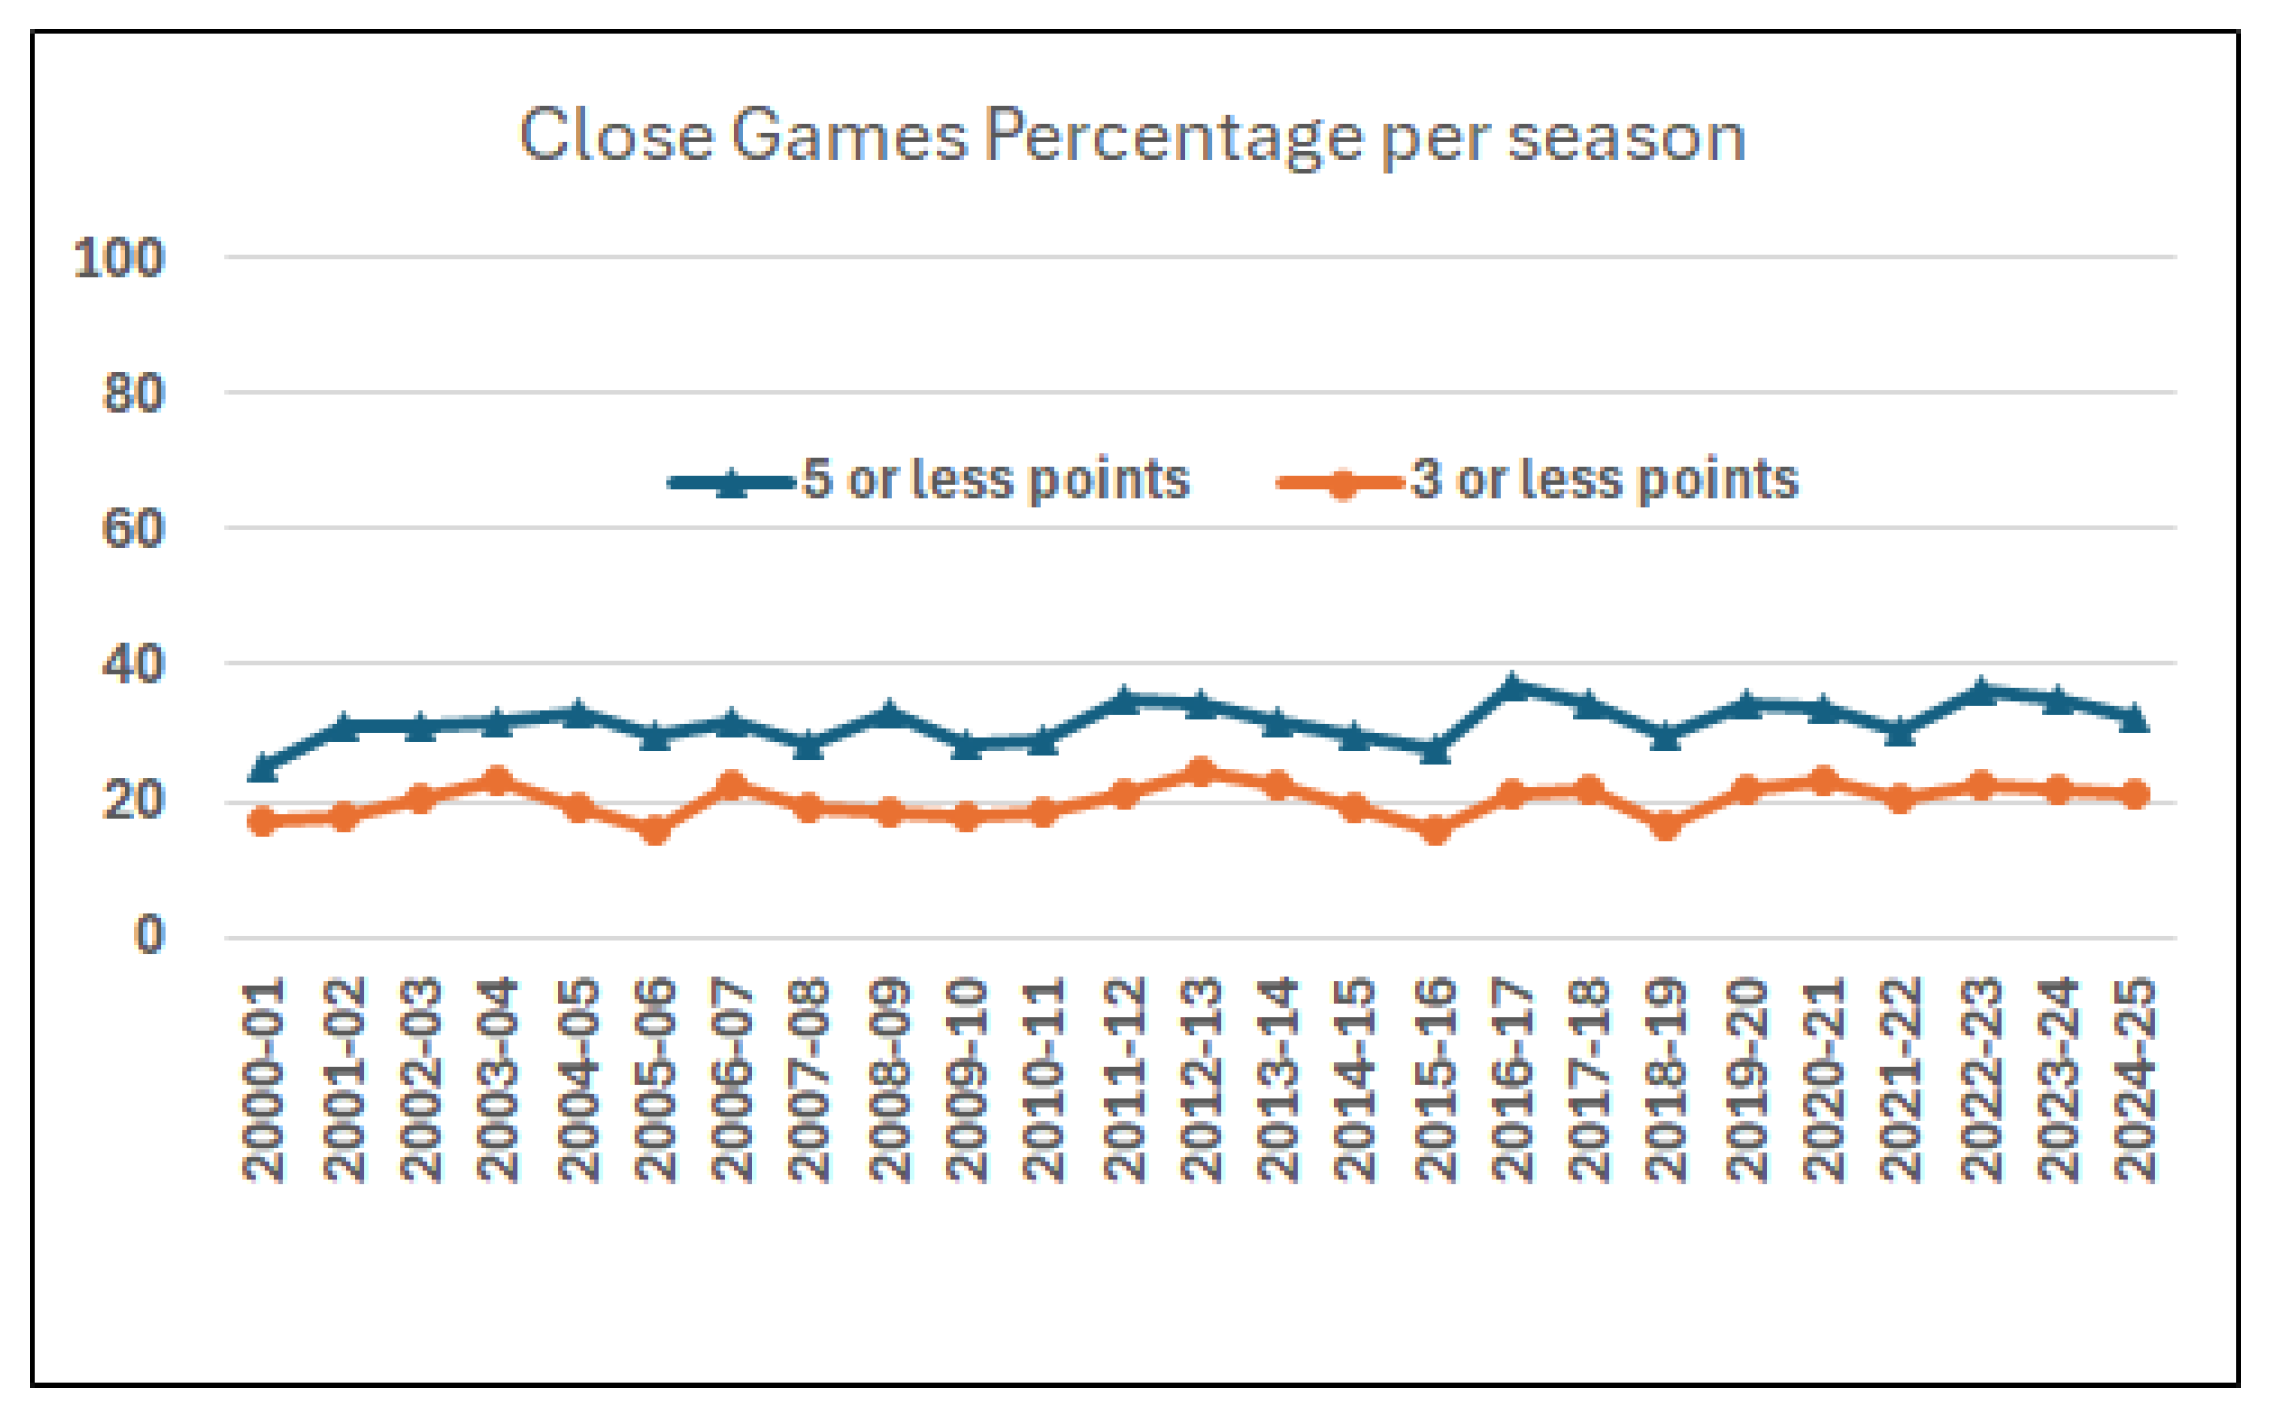
H. Home/Road Wins and Close Game Evolution. Figure 26 shows the percentage of home/road wins over the years. We can see the effect of the COVID era, where road wins increased. Figure 27 shows the percentage of close games (difference points) and very close games (difference points). Indicatively, in the most recent season (2024–25), we had 106 games (32.1%) with a difference points and 70 games (21.2%) with a difference ≤ 3 points.
Figure 26.
Home/road win percentages per game per season.
Figure 27.
Close game percentages per season.
Discussion. From the above statistics, we can see that there is a trend towards shooting more three-point shots, even by centers and forwards. The number of assists and points has increased and there has been a proliferation in the number of points scored by players from the United States of America. On the other hand, there is a clear decrease in the number of steals and turnovers. Also, in previous decades, we observed more cases of players playing at least 30 min per game. Also, we have seen that popular coaches have adjusted their game, and their teams tend to shoot more three-point shots.
Statistical Validation of Observed Trends
Here, we perform a statistical validation of some observed trends specifically related to the changes in the assist rule, the attempted three-point shot percentage, and the correlation between attendance and home win percentage.
Assist Rule Change. A comparison of average assists per game before and after the 2012 rule modification reveals a substantial increase. The pre-rule period (2000–01 to 2011–12) exhibited a mean of 25.50 assists per game (standard deviation equals 1.81), whereas the post-rule period (2012–13 to 2024–25) showed a mean of 34.17 assists (standard deviation equals 1.85). We performed Welch’s two-sample t-test. It showed that this difference is highly statistically significant (). The corresponding effect size is extremely large (Cohen’s ).
Attempted Three-Point Shots. A linear regression analysis was conducted to examine the effect of season year (X) on 3-point attempts per season (Y). There is a very strong positive linear relationship between season year and 3-point attempts. The correlation coefficient () confirms that as the season year increases, 3-point attempts tend to increase. The coefficient of determination () shows that 90% of the variance in 3-point attempts is explained by season year. For every 1-year increase, the number of 3-point attempts changes by approximately 0.6 units.
We also performed a similar study for the attempted three-points shot from centers. The corresponding values were and , which shows that 81.9% of the variance in the dependent variable is explained by season year. For every 1-year increase, we observed a change of approximately 0.147 units. Therefore, in both cases we can see a clear and statistically significant upward trend in 3-point attempts over the past 25 years.
Attendance and Home Win Percentage. We examined whether the average season attendance affects home win percentage using Pearson correlation analysis. When all seasons are included, the correlation between average attendance and home win percentage is positive but weak () and only marginally insignificant at the 5% level (). However, once the major COVID-19 season (2020–21) is excluded, the relationship weakens substantially () and becomes clearly statistically insignificant (). Overall, the results suggest that normal variations in attendance do not meaningfully influence home advantage. However, the high reduction in crowd presence during the COVID-19 period appears to have temporarily weakened the home advantage.
6. Concluding Remarks
In this paper, we presented a pipeline that demonstrates how graph-structured data infrastructures can support domain-specific analytics platforms (in our case basketball) by combining semantic modeling, Knowledge Graphs, and natural language interfaces for data exploration. In particular, we showed the process and decisions for modeling the BBall ontology and the construction of an RDF Knowledge Graph (KG) with 5 million triples for EuroLeague box scores. We showcased the functionality of three prototypes that exploit data from the constructed KG and are based on semantic filters and text-to-SPARQL methods using LLMs. Also, we analyzed their advantages compared to classical SPARQL query editors.
Regarding the experimental evaluation, we presented statistics of the KG, which includes over 6 thousand games and 3 thousand players, and we showed the SPARQL queries to answer a set of complex competency questions. Moreover, we provided effectiveness and efficiency results for a benchmark with 100 questions. Specifically, we achieved an accuracy of 0.79 for the text-to-SPARQL method by using GPT-4. Regarding efficiency, 1.8 s is needed on average for the text-to-SPARQL method and 0.3 s for retrieving the SPARQL results from the SPARQL endpoint. Finally, we presented a historical analysis of the past 25 years of EuroLeague, which showed evolution in many parts of the game, such as the increase in the number of attempted three-point shots and in the number of assists per game.
Concerning limitations and future work, the presented KG and applications primarily rely on box score data. Although the KG is updated quickly after each round, real-time decision support would require play-by-play ontology extensions and continuous real-time ingestion, transformation, and integration of data into the KG, which constitutes one of our future research directions. Moreover, the experimental evaluation focuses on query-generation accuracy (using a benchmark of 100 questions) and statistical analysis. On the other hand, a limitation is that we have not performed a task-based user evaluation or large-scale performance benchmarking. In particular, the user evaluation would indeed provide additional insights regarding usability and interaction; however, it requires a dedicated experimental design and a sufficiently large user group (with sports analysts, journalists, etc.), which falls beyond the scope of the current work (however, it is an important direction for future work). Finally, our future plans include applying the same methodology to other team sports with complex analytics requirements, such as football and volleyball.
Author Contributions
Conceptualization, M.M.; methodology, M.M., C.D. and N.M.; software, C.D., N.M. and D.P.; validation, M.M. and D.P.; formal analysis, M.M.; investigation, M.M.; resources, M.M., D.P., C.D. and N.M.; data curation, M.M.; writing—original draft preparation, M.M.; writing—review and editing, C.D., N.M. and D.P.; visualization, M.M., C.D. and N.M.; supervision, M.M. All authors have read and agreed to the published version of the manuscript.
Funding
This research received no external funding.
Institutional Review Board Statement
Not applicable.
Informed Consent Statement
Not applicable.
Data Availability Statement
All the experimental results, the ontology, the SPARQL queries, the benchmark and results are available at https://github.com/mountanton/BBallApplications (accessed on 18 March 2026).
Conflicts of Interest
The authors declare no conflicts of interest.
Appendix A. SPARQL and SQL Query Comparison
Here, we provide the SPARQL query for question Q11, i.e., “I want all the EuroLeague games where a Greek Player of height less than 2.00 scored at least 15 points in a home game against a Russian team” and the equivalent SQL query. Below, we first show the SPARQL and then the SQL query. One can observe the high number of joins that would be required.
Notes
| 1 | https://sportschema.org/ontologies/basketball (accessed on 18 March 2026). |
| 2 | https://users.ics.forth.gr/~mountant/bball.html (accessed on 18 March 2026). |
| 3 | https://api-live.EuroLeague.net/swagger/ (accessed on 18 March 2026). |
| 4 | https://github.com/mountanton/BasketballQA (accessed on 18 March 2026). |
References
- Hogan, A.; Blomqvist, E.; Cochez, M.; d’Amato, C.; De Melo, G.; Gutierrez, C.; Kirrane, S.; Gayo, J.E.L.; Navigli, R.; Neumaier, S.; et al. Knowledge Graphs. ACM Comput. Surv. 2021, 54, 1–37. [Google Scholar] [CrossRef] [Scilit]
- Mountantonakis, M.; Tzitzikas, Y. Large-Scale Semantic Integration of Linked Data: A Survey. ACM Comput. Surv. 2019, 52, 1–40. [Google Scholar] [CrossRef] [Scilit]
- Michel, F.; Gandon, F.; Ah-Kane, V.; Bobasheva, A.; Cabrio, E.; Corby, O.; Gazzotti, R.; Giboin, A.; Marro, S.; Mayer, T.; et al. Covid-on-the-Web: Knowledge Graph and Services to Advance COVID-19 Research. In Proceedings of the International Semantic Web Conference; Springer: Cham, Switzerland, 2020; pp. 294–310. [Google Scholar]
- Marketakis, Y.; Tzitzikas, Y.; Gentile, A.; Ellenbroek, A.; Taconet, M. Building a Global Aquatic Resource Knowledge Base for Fisheries. Proceedings 2025, 117, 4. [Google Scholar] [CrossRef] [Scilit]
- Liu, Y.; Ding, J.; Fu, Y.; Li, Y. UrbanKG: An Urban Knowledge Graph System. ACM Trans. Intell. Syst. Technol. 2023, 14, 1–25. [Google Scholar] [CrossRef] [Scilit]
- Singh, N. Sport Analytics: A Review. Int. Technol. Manag. Rev. 2020, 9, 64–69. [Google Scholar] [CrossRef] [Scilit]
- Ghosh, I.; Ramamurthy, S.R.; Chakma, A.; Roy, N. Sports Analytics Review: Artificial Intelligence Applications, Emerging Technologies, and Algorithmic Perspective. WIREs Data Min. Knowl. Discov. 2023, 13, e1496. [Google Scholar] [CrossRef] [Scilit]
- Weikum, G. Knowledge Graphs 2021: A Data Odyssey. Proc. VLDB Endow. 2021, 14, 3233–3238. [Google Scholar] [CrossRef] [Scilit]
- DuCharme, B. Learning SPARQL: Querying and Updating with SPARQL 1.1; O’Reilly Media, Inc.: Sebastopol, CA, USA, 2013. [Google Scholar]
- Mandić, R.; Jakovljević, S.; Erčulj, F.; Štrumbelj, E. Trends in NBA and EuroLeague Basketball: Analysis and Comparison of Statistical Data from 2000 to 2017. PLoS ONE 2019, 14, e0223524. [Google Scholar] [CrossRef] [Scilit] [PubMed]
- Foteinakis, P.F.; Pavlidou, S.P. A Decade of Evolution: Comparative Analysis of Shooting Trends and Offensive Efficiency in the NBA and EuroLeague. Monten. J. Sports Sci. Med. 2025, 14, 13–19. [Google Scholar] [CrossRef] [Scilit]
- Lampis, T.; Ntzoufras, I.; Vassalos, V.; Dimitriou, S. Predictions of European Basketball Match Results with Machine Learning Algorithms. J. Sport. Anal. 2023, 9, 171–190. [Google Scholar] [CrossRef] [Scilit]
- Thabtah, F.; Zhang, L.; Abdelhamid, N. NBA Game Result Prediction Using Feature Analysis and Machine Learning. Ann. Data Sci. 2019, 6, 103–116. [Google Scholar] [CrossRef] [Scilit]
- Katris, C. Exploring EuroLeague History Using Basic Statistics. arXiv 2023, arXiv:2301.02443. [Google Scholar] [CrossRef] [Scilit]
- Kamitsis, A.; Politis, K. Performance Indicators for Qualification to the Playoffs and the Final Four in EuroLeague 2000–2022. J. Sport. Anal. 2025, 11, 22150218251365222. [Google Scholar] [CrossRef] [Scilit]
- Hu, Y.; Song, K.; Cho, S.; Wang, X.; Foroosh, H.; Yu, D.; Liu, F. SportsMetrics: Blending Text and Numerical Data to Understand Information Fusion in LLMs. arXiv 2024, arXiv:2402.10979. [Google Scholar] [CrossRef] [Scilit]
- Sarlis, V.; Papageorgiou, G.; Tjortjis, C. Leveraging Sports Analytics and Association Rule Mining to Uncover Recovery and Economic Impacts in NBA Basketball. Data 2024, 9, 83. [Google Scholar] [CrossRef] [Scilit]
- Mountantonakis, M. Efficient Statistical Computation for K-Player Basketball Lineups Using Semilattice Structures. Electronics 2025, 14, 2104. [Google Scholar] [CrossRef] [Scilit]
- Vázquez-Estévez, C.; Prieto-Lage, I.; Reguera-López-de-la-Osa, X.; Gutiérrez-Santiago, J.A.; Toledo-González, M.; Gutiérrez-Santiago, A. Offensive Patterns and Performance Analysis in One-Possession Scenarios During the Last Minute and Overtime in the EuroLeague. Appl. Sci. 2025, 15, 1928. [Google Scholar] [CrossRef] [Scilit]
- Li, A.; Li, X.; Zhu, B.; Li, G. Knowledge-Graph-Driven Question-Answer System for Basketball. In Proceedings of the 5th International RICAI Conference; IEEE: Piscataway, NJ, USA, 2023; pp. 757–761. [Google Scholar]
- Li, Y.; Cao, J.; Wang, Y. Implementation of Intelligent Question Answering System Based on Basketball Knowledge Graph. In Proceedings of the 4th IAEAC; IEEE: Piscataway, NJ, USA, 2019; pp. 2601–2604. [Google Scholar]
- Xi, Z.; Shi, G.; Li, X.; Yan, J.; Li, Z.; Wu, L.; Liu, Z.; Wang, L. A Simple yet Effective Knowledge-Guided Method for Entity-Aware Video Captioning on a Basketball Benchmark. Neurocomputing 2025, 619, 129177. [Google Scholar] [CrossRef] [Scilit]
- Onofre, E.B.; Moraes, L.M.P.; Aguiar, C.D. AskSport: Web Application for Sports Question-Answering. arXiv 2025, arXiv:2503.21067. [Google Scholar] [CrossRef] [Scilit]
- Xia, H.; Yang, Z.; Wang, Y.; Tracy, R.; Zhao, Y.; Huang, D.; Chen, Z.; Zhu, Y.; Wang, Y.; Shen, W. SportQA: A Benchmark for Sports Understanding in Large Language Models. arXiv 2024, arXiv:2402.15862. [Google Scholar] [CrossRef] [Scilit]
- Ferré, S. Sparklis: An Expressive Query Builder for SPARQL Endpoints with Guidance in Natural Language. Semant. Web 2016, 8, 405–418. [Google Scholar] [CrossRef] [Scilit]
- Vargas, H.; Buil-Aranda, C.; Hogan, A.; López, C. RDF Explorer: A Visual SPARQL Query Builder. In Proceedings of the International Semantic Web Conference; Springer: Cham, Switzerland, 2019; pp. 647–663. [Google Scholar]
- Mountantonakis, M.; Tzitzikas, Y. Generating SPARQL Queries over CIDOC-CRM Using a Two-Stage Ontology Path Patterns Method in LLM Prompts. ACM J. Comput. Cult. Herit. 2025, 18, 1–20. [Google Scholar] [CrossRef] [Scilit]
- Pan, X.; de Boer, V.; van Ossenbruggen, J. FIRESPARQL: A LLM-Based Framework for SPARQL Query Generation over Scholarly Knowledge Graphs. arXiv 2025, arXiv:2508.10467. [Google Scholar] [CrossRef] [Scilit]
- Doulaverakis, C.; Vassiliou, G.; Batsakis, S.; Papadakis, N.; Trouli, G.E.; Antoniou, G. SPARQL Query Generation Using LLMs for Medical Information Retrieval. In Proceedings of the European Semantic Web Conference; Springer: Cham, Switzerland, 2025; pp. 40–44. [Google Scholar]
- Poveda-Villalón, M.; Gómez-Pérez, A.; Suárez-Figueroa, M.C. OOPS! (OntOlogy Pitfall Scanner!): An On-Line Tool for Ontology Evaluation. Int. J. Semant. Web Inf. Syst. 2014, 10, 7–34. [Google Scholar] [CrossRef] [Scilit]
- Garijo, D. WIDOCO: A Wizard for Documenting Ontologies. In ISWC Proceedings, Part II 16; Springer: Cham, Switzerland, 2017; pp. 94–102. [Google Scholar]
- Lohmann, S.; Link, V.; Marbach, E.; Negru, S. WebVOWL: Web-Based Visualization of Ontologies. In Proceedings of the International Conference on Knowledge Engineering and Knowledge Management; Springer: Cham, Switzerland, 2014; pp. 154–158. [Google Scholar]
- Mountantonakis, M.; Papadopoulos, D.; Tzitzikas, Y. Basketball Question Answering Using Knowledge Graphs and Large Language Models. In Proceedings of the IJCKG 2025, Heraklion, Crete, Greece, 15–17 October 2025. [Google Scholar]

Disclaimer/Publisher’s Note: The statements, opinions and data contained in all publications are solely those of the individual author(s) and contributor(s) and not of MDPI and/or the editor(s). MDPI and/or the editor(s) disclaim responsibility for any injury to people or property resulting from any ideas, methods, instructions or products referred to in the content. |
© 2026 by the authors. Licensee MDPI, Basel, Switzerland. This article is an open access article distributed under the terms and conditions of the Creative Commons Attribution (CC BY) license.