


Abstract
This study evaluates the potential of UV–Vis absorption and fluorescence detection (FLD), combined with chemometrics for the characterization of red wines and the preliminary screening of their Protected Designation of Origin (PDO) and grape variety. More than 100 samples were analyzed under both acidic and basic conditions using flow injection analysis (FIA), as it offers advantages in terms of automation, speed, and online coupling multichannel UV–Vis and FLD detectors, enabling the acquisition of complementary datasets. Spectral data generated were analyzed using exploratory and supervised chemometric methods. Results showed comparable performance across different data types. Although the discriminant information was limited, data exploration by Principal Component Analysis (PCA) revealed meaningful differences related to PDO and grape variety. Partial Least Squares Discriminant Analysis (PLS-DA) and Soft Independent Modeling of Class Analogies (SIMCA) provided remarkable classification results, with good overall performance, supporting the potential of this approach as a fast-screening tool for wine authentication and quality control, particularly in high-throughput analytical settings.
1. Introduction
Food authentication in general, and wine in particular, is increasingly demanded at regulatory, industrial, and social levels. Authorities, consumers, and producers show growing interest in wine control and authentication to ensure quality standards. Numerous strategies exist in this regard, but those based on analytical instrumental methods have greater practical relevance [1,2,3,4] compared to approaches relying on expert opinions of oenologists and panelists since they are impractical for the authentication and quality control of large numbers of wine samples; in contrast, expert-driven approaches are particularly useful for investigating selected wines for addressing more specific characterizations or unusual features. Some recent examples include investigations on the aroma and sensory profiles of wines produced from grapes subjected to nitrogen fertilization [5], comparison of the sensory properties of organic and conventional wines [6], the characterization of blends made from different grape varieties [7] and of monovarietal wine aromas [8], and the establishment of relationships between wine-tasting results and the emotions that wines may evoke in consumers [9].
The instrumental methodologies apply spectroscopic and spectrometric techniques in modalities such as Near Infared (NIR) [10,11,12], Mid Infrared (MIR) [10,13,14], Raman [15], UV-Vis [16,17], fluorescence (including excitation-emission matrix (EEM) fluorescence) [18,19,20], Nuclear Magnetic Resonance (NMR) [21,22,23,24], or Mass Spectrometry (MS) [25,26], generally under an untargeted approach, where the generated spectra constitute the source of analytical information. Chromatographic methods with various detectors (e.g., UV-Vis, FLD, or MS) are also used, suitable for both profiling and fingerprinting [27,28,29,30,31,32,33,34,35,36,37]. It should be noted that spectral measurements can be performed relatively quickly, typically within a few seconds to a few minutes, although the manual sample introduction may slow down the overall process. In contrast, chromatographic analyses generally require longer analysis times, ranging from several minutes to more than one hour in the least favorable cases.
Under these strategies, the authentication involves analyzing large sets of known samples to extract behavioral patterns associated with the desired wine classes or categories. Given the volume of samples and data generated, chemometric methods are essential to extract relevant information. Among the most common attributes for authentication are geographical origin (protected designations of origin, PDOs), grape variety, and aging.
Unfortunately, some of the aforementioned analytical techniques are slow, costly, and complex, making it desirable to have simple and rapid alternatives to enable automated sample analysis within reduced timeframes. In this regard, flow injection analysis (FIA) is a highly efficient methodology for fast and automated wine analysis that, additionally, consumes very low sample volumes (ca. 10 μL or less). Moreover, it is compatible with multiple detectors, ranging from high end and technically demanding systems—such as mass spectrometry, which require substantial expertise—to more straightforward and widely available detectors, including UV–Vis or FLD detectors. Overall, FIA can serve as an excellent starting point for preliminary screening of samples, enabling the identification or rejection of wines that clearly meet or fail to meet certain specifications, such as PDOs or varieties, while leaving doubtful cases for more exhaustive studies using more expensive approaches. FIA is increasingly being introduced as a rapid methodology for the classification and authentication of food samples, including the detection of adulteration in olive oil [38,39], coffee [40], Black Cohosh [41], and dietary ingredients [42]. In all these applications, the approach relies on mass spectrometry (MS) to generate rich chemical profiles or fingerprints containing numerous descriptors, which are subsequently interpreted and exploited using chemometric methods.
In wine authentication, FIA has so far been scarcely used, but its capabilities are highly promising. For example, Mir-Cerdà et al. developed a FIA coupled to high resolution mass spectrometry (FIA-HRMS) screening method to assess the quality of sparkling wines based on biogenic amine (BA) levels, highlighting the role of compounds such as putrescine, ethanolamine, histamine, and tyramine as quality descriptors [43]. BA content was found to depend on vinification practices, with malolactic fermentation being a key step in BA formation. In another example, Campmajó and colleagues applied FIA–HRMS in both positive and negative ionization modes to determine the geographical origin of three Spanish PDO red wines [44]. Through untargeted profiling, peak areas of molecules commonly present in wine were recorded, including several organic acids, amino acids, phenolics, and monosaccharides, enabling discrimination among Ribera de Duero, Rioja, and Penedès PDOs.
The previous examples rely on HRMS, making them very powerful approaches, but also particularly costly and strongly dependent on specialized instrumentation and expertise. However, the potential of simpler detectors should not be overlooked, as they can be highly attractive for initial screening purposes, enabling the use of more affordable instrumentation without the need for highly specialized technical expertise. In this regard, this paper introduced a rapid FIA methodology with UV-Vis and FLD and chemometric data analysis and critically evaluated its ability to classify red wines according to their PDO and grape variety. In addition, given the marked influence of pH on the absorption and fluorescence spectra of the wine’s phenolic fraction, particularly anthocyanins as the responsible for color, the study established the experimental conditions providing the best performance for wine discrimination and classification. An unsupervised exploration by Principal Component Analysis (PCA) was conducted to identify trends and natural groupings related to both origin and grape variety based on spectral data. Additionally, classification methods were assessed under different modeling settings using Partial Least Squares Discriminant Analysis (PLS-DA) and Soft Independent Modeling of Class Analogies (SIMCA).
2. Materials and Methods
2.1. Reagents
The carrier solutions were prepared using Milli-Q water (Elix 3 system coupled to Milli-Q, Bedford, MA, USA; 0.22 μm nylon membrane filter), acetonitrile (99.9%, PanReac-AppliChem, Barcelona, Spain), formic acid (≥95%, Sigma-Aldrich, Steinheim, Germany), and ammonia solution (25%, MERCK, Darmstadt, Germany). Two aqueous solvent phases were considered: 0.1% formic acid for acidic conditions and 0.1% ammonia for basic conditions, providing acidic and basic media with pH values of ca. 2.7 and 11, respectively.
2.2. Wine Samples
A total of 198 red wine samples was analyzed in this study. Detailed information on all samples is provided in the Supplementary Section (see Table S1). The wines were sourced from various regions, either purchased from supermarkets or provided by collaborators, encompassing a wide range of PDOs, grape varieties, aging processes, price ranges, and other characteristics. Specifically, 38 PDO categories were represented, with the most prominent groups being Rioja (39 samples), Ribera del Duero (27), Somontano (26), and Montsant (14). In terms of varietal composition, 79 different typologies, including some blends, with the most represented classes as follows: Tempranillo (53 samples), Garnacha (20), and Syrah (9). Prior to measurement, each sample was filtered into a 2-mL vial using a nylon syringe filter (13 mm diameter; 0.22 μm pore size).
A Quality Control (QC) sample was prepared by mixing 50 µL of each filtered wine and was repeatedly measured throughout the process to check analytical robustness.
2.3. FIA-UV-Vis-FLD Method
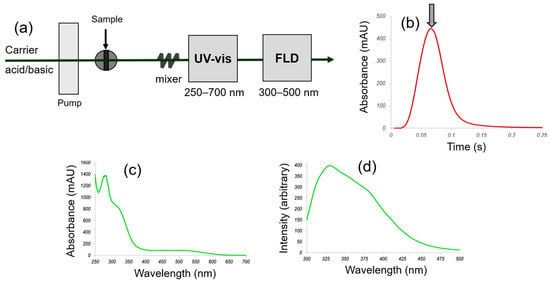
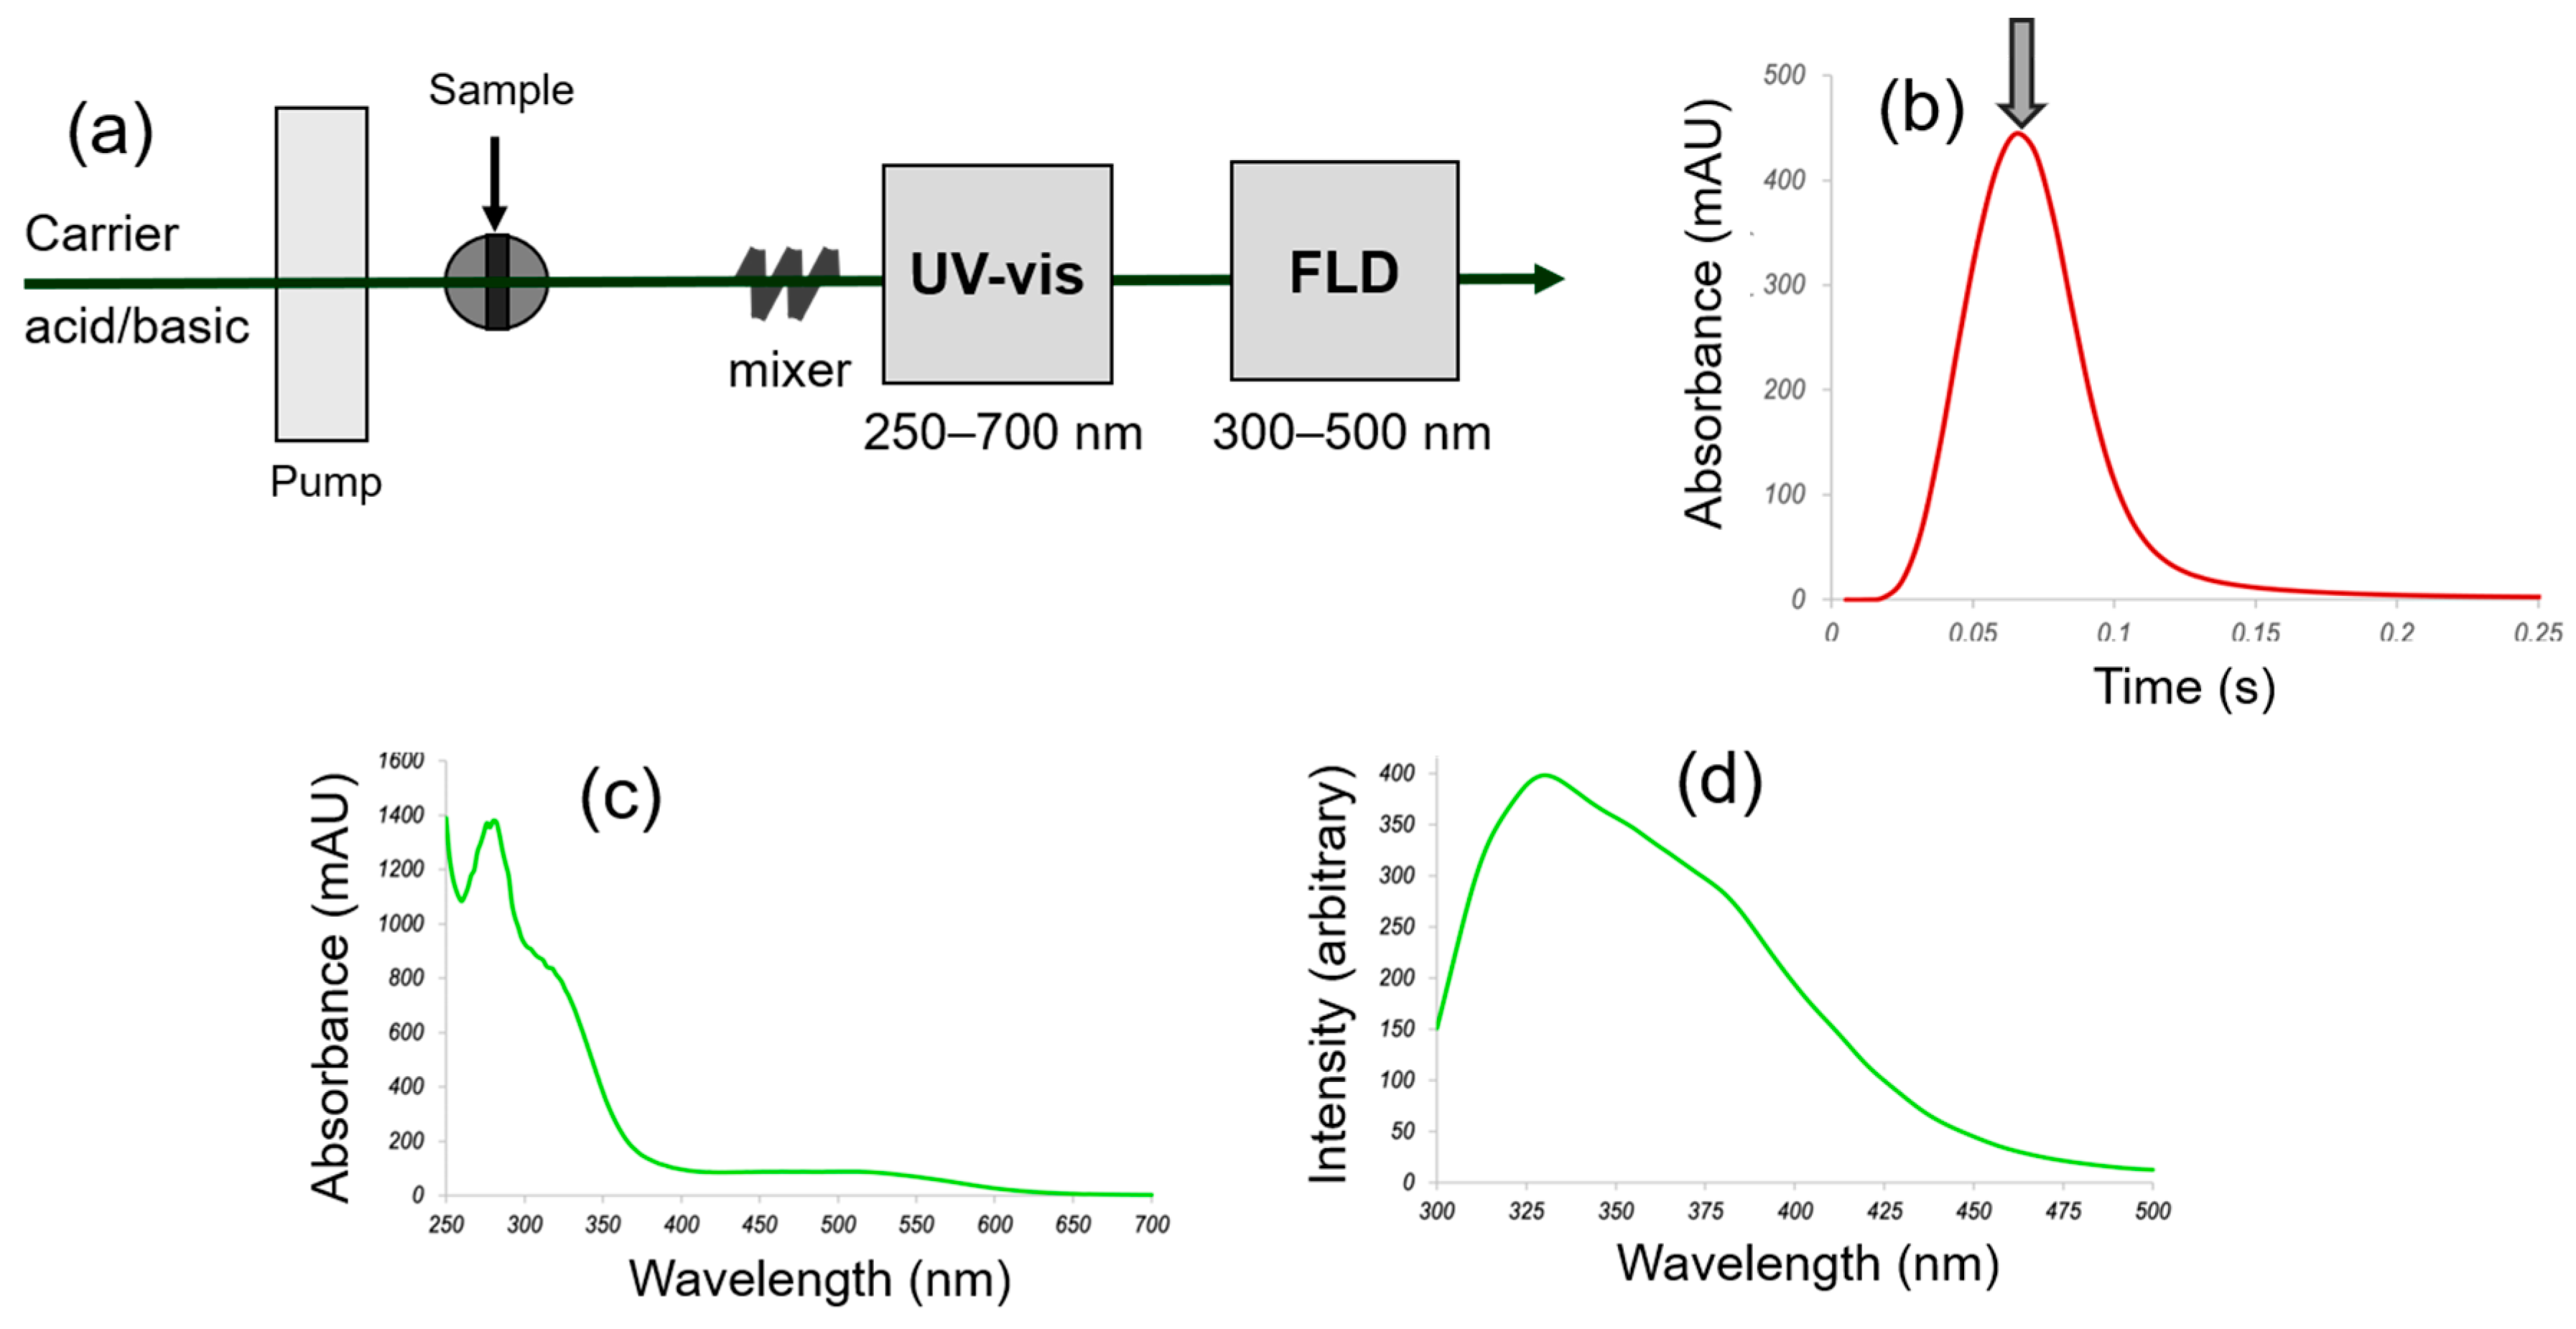
The FIA system was implemented using components from Agilent Technologies (Santa Clara, CA, USA): InfinityLab Assist Hub (1260 Infinity III, G7180A), Quaternary Pump VL (1260 Infinity III, G711A 1260), Autosampler WPALS 8 (1100 Series, G1367A), UV-Vis diode-array detector (DAD, 1100 Series, G1315B), and fluorescence detector (FLD, 1100 Series, G1321A). The FIA scheme is shown in Figure 1, with the DAD and FLD detectors connected in series. Samples were injected into either the acidic or basic carrier phase, delivering them directly to the detectors through polyether ether-ketone (PEEK) tubing (1 long and 0.117 mm inner diameter, corresponding to death volume of ca. 25 µL), acting as a mixing coil between the injector and detectors. The flow rate was set at 1.0 mL·min−1 and the injection volume at 2 µL.
Figure 1.
Scheme of the experimental setup and of the time-dependent and spectral signals generated. (a) System composed of a pumping unit, an autosampler, a diode-array UV–Vis detector, and a diode-array fluorescence detector; (b) illustrative FIAgram recorded at 280 nm for the injection of a wine sample under acid carrier conditions; (c) UV–Vis spectrum corresponding to the peak maximum, used as the analytical signal to construct the UV–Vis data matrix; (d) fluorescence spectrum at an excitation wavelength of 280 nm corresponding to the peak maximum, used as the analytical signal to construct the FLD data matrix. In all cases, spectra were recorded alternately using an acidic carrier (0.1% formic acid) and a basic carrier (0.1% ammonia).
For the DAD, full spectra were recorded from 250 to 700 nm across the FIA peak, and FIAgrams were monitored at 280 nm (see Figure 1b). For FLD, excitation was at 280 nm (appropriate for exciting the flavanol fraction, see comments on Section 4) and emission spectra were collected from 300 to 500 nm. The QC was injected at the beginning of the sequence in quintuplicate and subsequently in triplicate after every 15 analyzed samples. Each wine sample was injected in triplicate following a randomized sequence, resulting in a total of 643 injections (198 × 3 wines + 49 QCs).
For both working conditions (acid and basic media), data used for subsequent chemometric analysis corresponded to DAD or FLD spectra recorded at the maximum of the FIA peak (see Figure 1c and Figure 1d, respectively). OpenLab CDS (version 2.8) from Agilent Technologies (Santa Clara, CA, USA) was the software used to extract spectral data.
2.4. Data Analysis
X-data matrices were constructed containing the UV spectra (226 variables, ranging from 250 to 700 nm at 2 nm intervals) or the fluorescence spectra (201 variables, from 300 to 500 nm at 1 nm intervals) of each sample, analyzed in triplicate, according to the protocol detailed in 2.3. Consequently, the final datasets comprised matrices of 643 × 226 and 643 × 201 for UV and fluorescence measurements, respectively. Prior to data analysis, autoscaling preprocessing was applied.
Data treatment was performed using SOLO 9.1 chemometric software (Eigenvector Research, Inc., Manson, WA, USA; https://eigenvector.com/). An unsupervised exploratory analysis was first carried out by Principal Component Analysis (PCA) using the X-data matrix, comprising the spectral fingerprints of all samples together with the Quality Control (QC) samples, in order to investigate the natural distribution of wines according to origin and grape variety and to assess data consistency and potential instrumental drifts.
Subsequently, classification models were developed using Partial Least Squares Discriminant Analysis (PLS-DA) and Soft Independent Modeling of Class Analogies (SIMCA) following different modeling strategies, namely multiclass, binary (class vs. others), and single-class approaches. In SIMCA, calibration models were built exclusively using samples belonging to the target class, allowing the definition of class-specific patterns independently of the remaining categories. For PLS-DA, the same X-data matrix and a Y-data matrix defining the sample classes were used. The number of latent variables for PLS-DA models was selected based on the first relevant minimum of the cross-validation error using a Venetian blind approach, whereas the optimal number of principal components for SIMCA models was determined by minimizing the classification error through randomized block cross-validation (using 15 independent repetitions to ensure the robustness of the selection procedure). A combined classification rule was applied, considering both Q and T2 according to the equation (Q2+(T2)2)1/2.
Model performance was evaluated in terms of sensitivity, specificity, and overall classification error. In all cases, independent validation was carried out using samples not included in model building, based on a random division of the dataset into calibration and prediction subsets. All replicates belonging to a given sample were assigned to the same calibration or prediction set, ensuring that no sample was represented in both sets simultaneously.
3. Results
3.1. FIA Optimization
The objective of that part was to generate FIA peaks with appropriate characteristics, namely: (i) the onset of the peak should be clearly observed after a stable baseline (automatically adjusted to zero), (ii) the peak maximum should be reached within a few seconds, and (iii) the signal should rapidly return to the baseline. These conditions allow the analysis time to be minimized while maintaining controlled and robust operating conditions.
In parallel, the optimization process also aimed to ensure FIAgrams with sensitivity, while simultaneously enhancing spectral discrimination among wines of different typologies. Accordingly, the factors evaluated included carrier flow rate, injection volume and composition (aimed at acquiring UV–Vis and FLD spectra under both acidic and basic conditions) as well as the operational settings for spectral recording.
The flow rate represents a critical variable for achieving high sampling throughput. Its effect was evaluated within the range of 0.2 to 2 mL/min, revealing that low flow rates lead to excessive delays in analysis, with peak widths of 0.5 to 1 min. Conversely, at 2 mL/min the sample reaches the detectors so quickly that the peak becomes truncated. Therefore, a flow rate of 1 mL/min offers an optimal compromise, allowing the complete peak, both ascent and descent, to be recorded in less than 10 s; this flow rate was thus selected as the optimal condition for further studies.
Regarding injection, high volumes lead to spectral saturation, causing the bands ca. at 280 and 330 nm to exceed desirable absorbance/fluorescence values. Results showed that injection volumes of 20 or 10 μL were excessive. A volume of 5 μL provides adequate intensities for several bands, although at 280 nm the spectra of some wines still appear saturated. A volume of 2 μL represents a good compromise between sensitivity and spectral quality for all samples, whereas volumes of 1 μL or below yielded low intensities in the visible region, compromising the information on the anthocyanin pigments of wines.
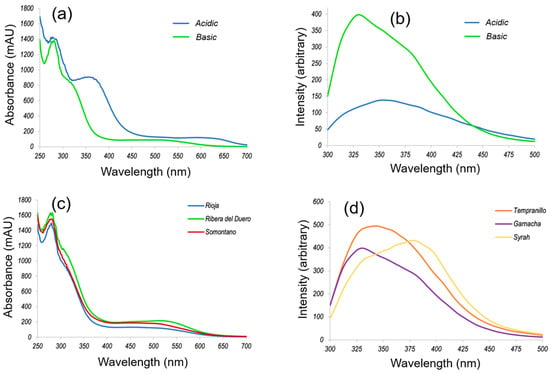
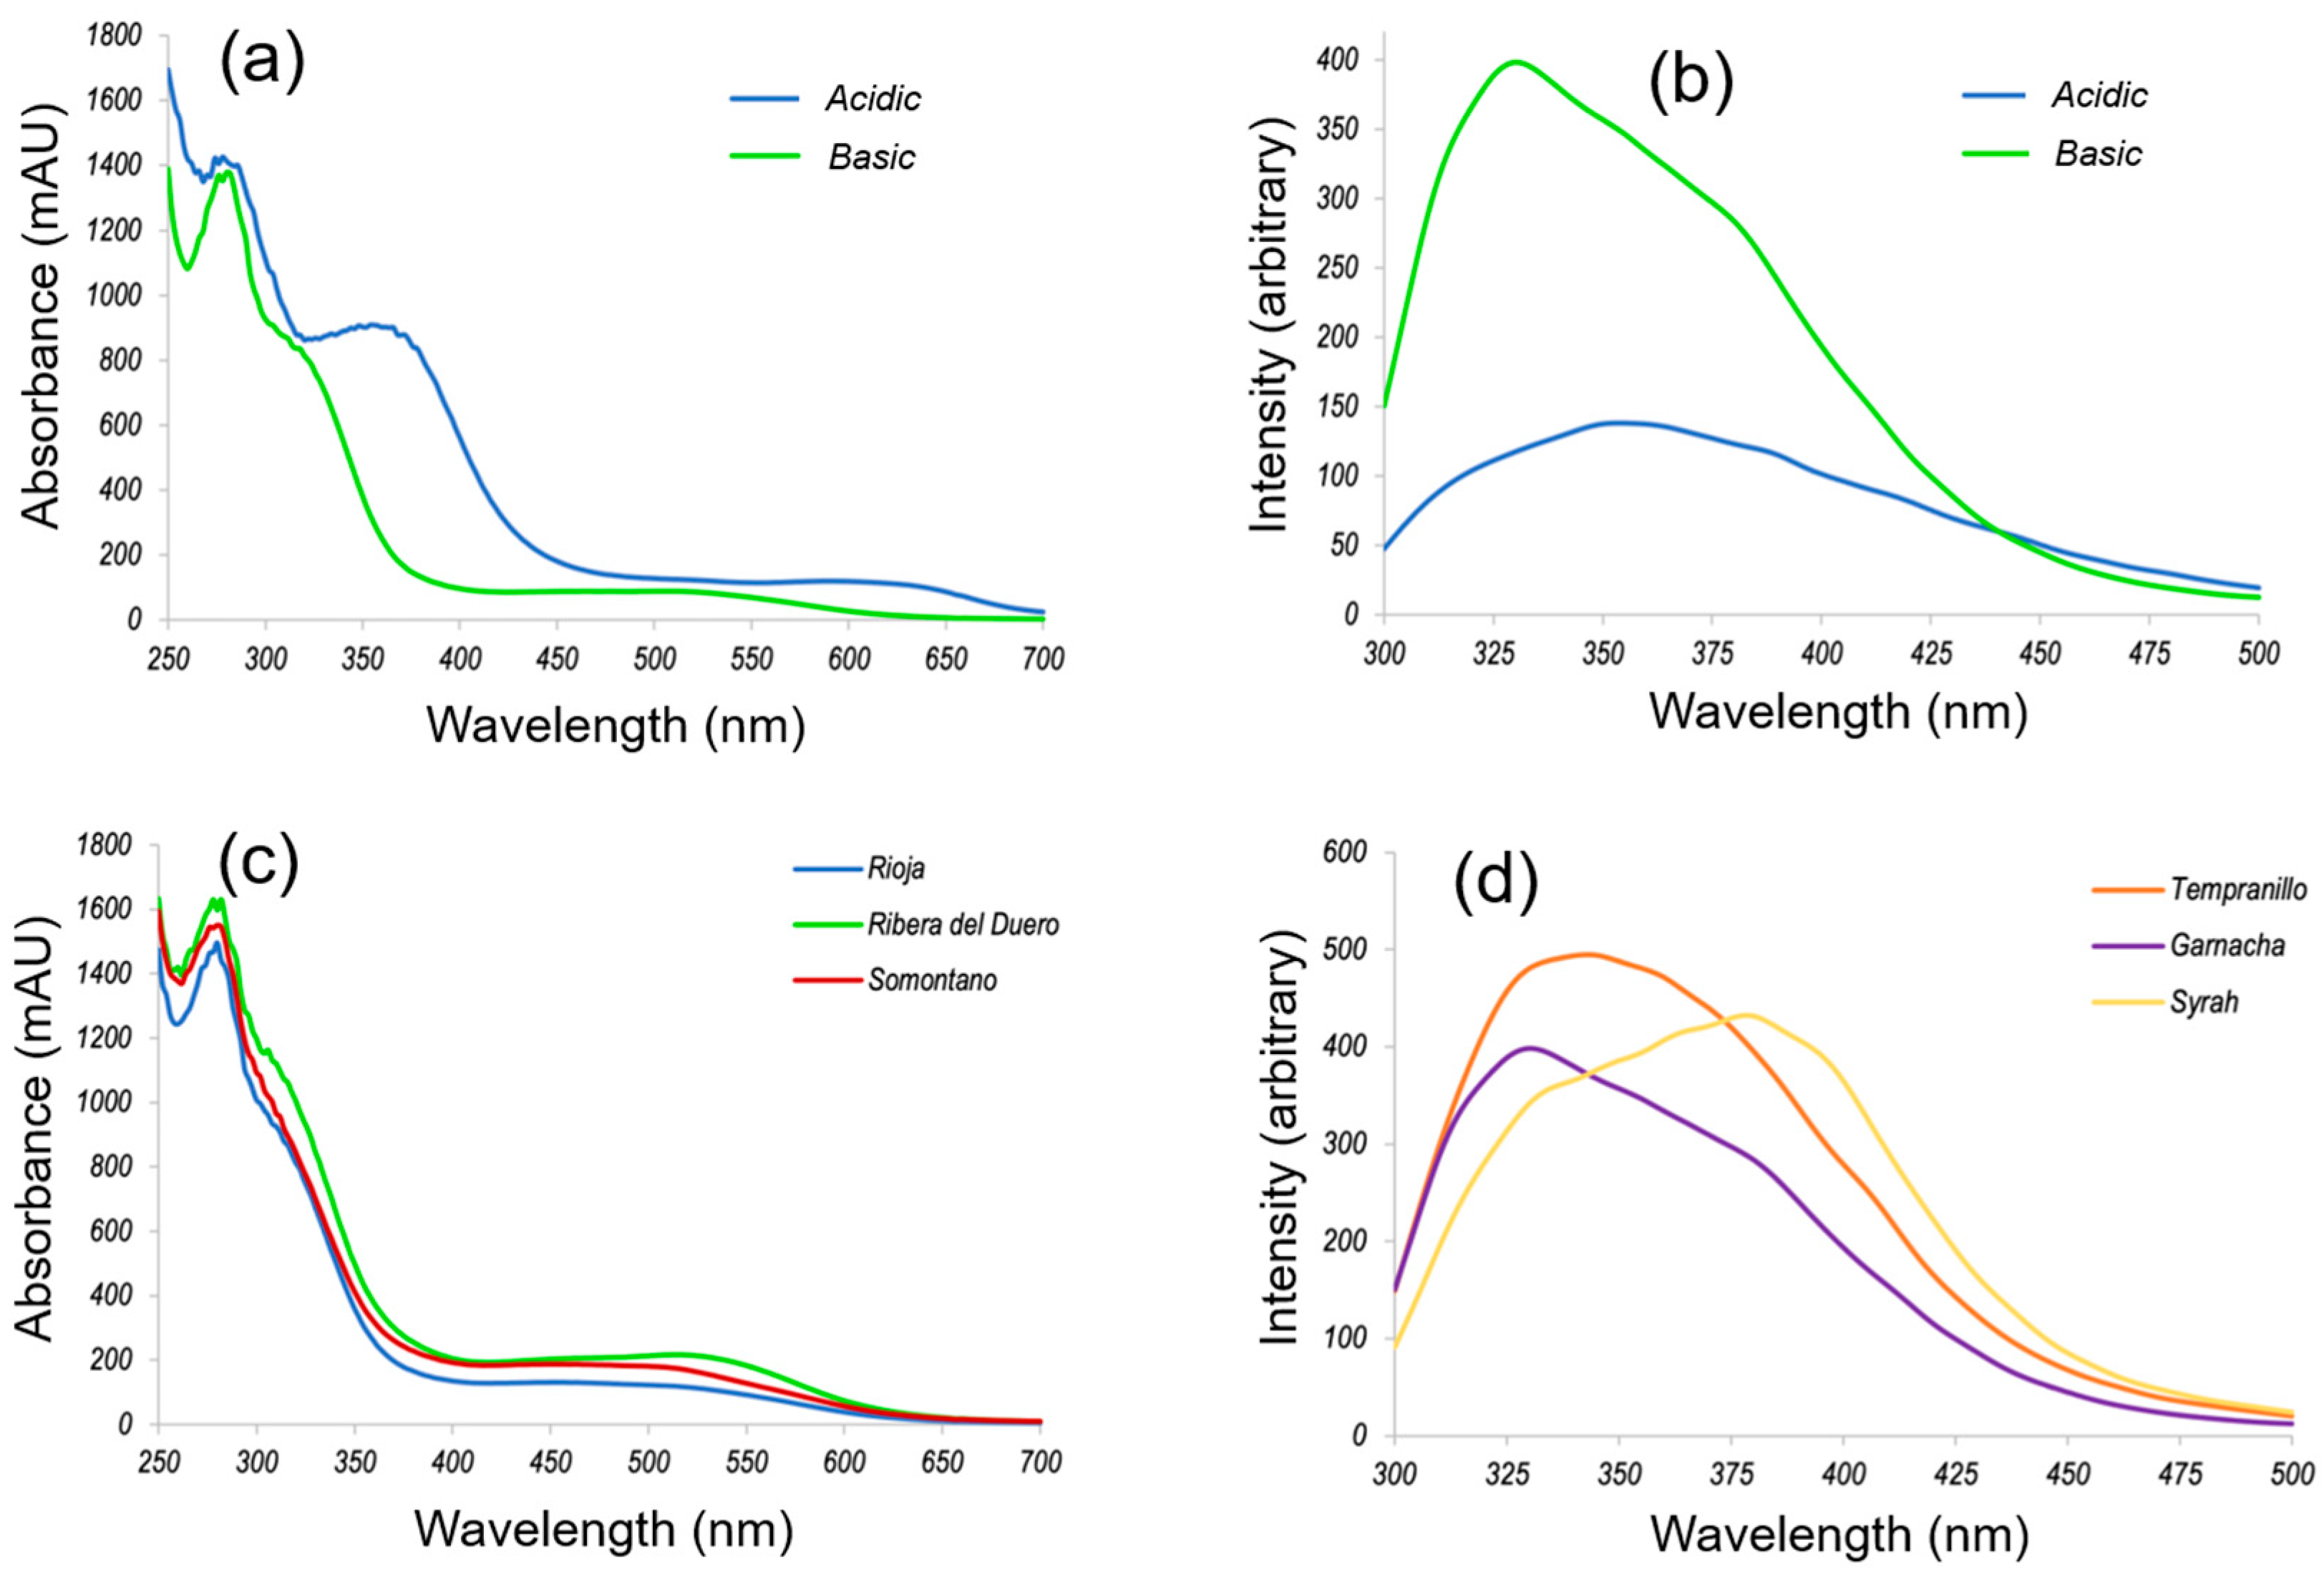
Figure 2 shows the UV–Vis and FLD spectra recorded at the FIA peak maximum for a representative wine under acidic and basic conditions, using 0.1% formic acid and 0.1% ammonia as carriers, respectively. Under these conditions, the fully protonated forms of the phenolic species predominate in the acidic medium, whereas the basic carrier promotes the deprotonation of carboxylic and phenolic groups. For illustrative purposes, subplots 2c and 2d represent comparative spectra in acidic medium for wines from three PDOs (UV–Vis) and three varieties (FLD). The subtle differences observed in band shapes, shifts, and intensities form the basis for the subsequent characterization and classification studies (see also Figure S1 in Supplementary Material). In the discussion section, the effects of the equilibria associated with acid–base reactions and related processes on the spectral features and color of the different species are commented in greater detail.
Figure 2.
Illustrative spectra of several wines under different conditions. (a) UV–Vis spectra of a representative Rioja wine under acidic and basic conditions; (b) FLD spectra (excitation at 280 nm) of a representative Rioja wine under acidic and basic conditions; (c) UV–Vis spectra of representative wines from the Rioja, Ribera del Duero, and Somontano PDOs under acidic and basic conditions; (d) FLD spectra of representative wines from the Tempranillo, Garnacha, and Syrah varieties under acidic conditions.
3.2. Exploratory Studies by PCA
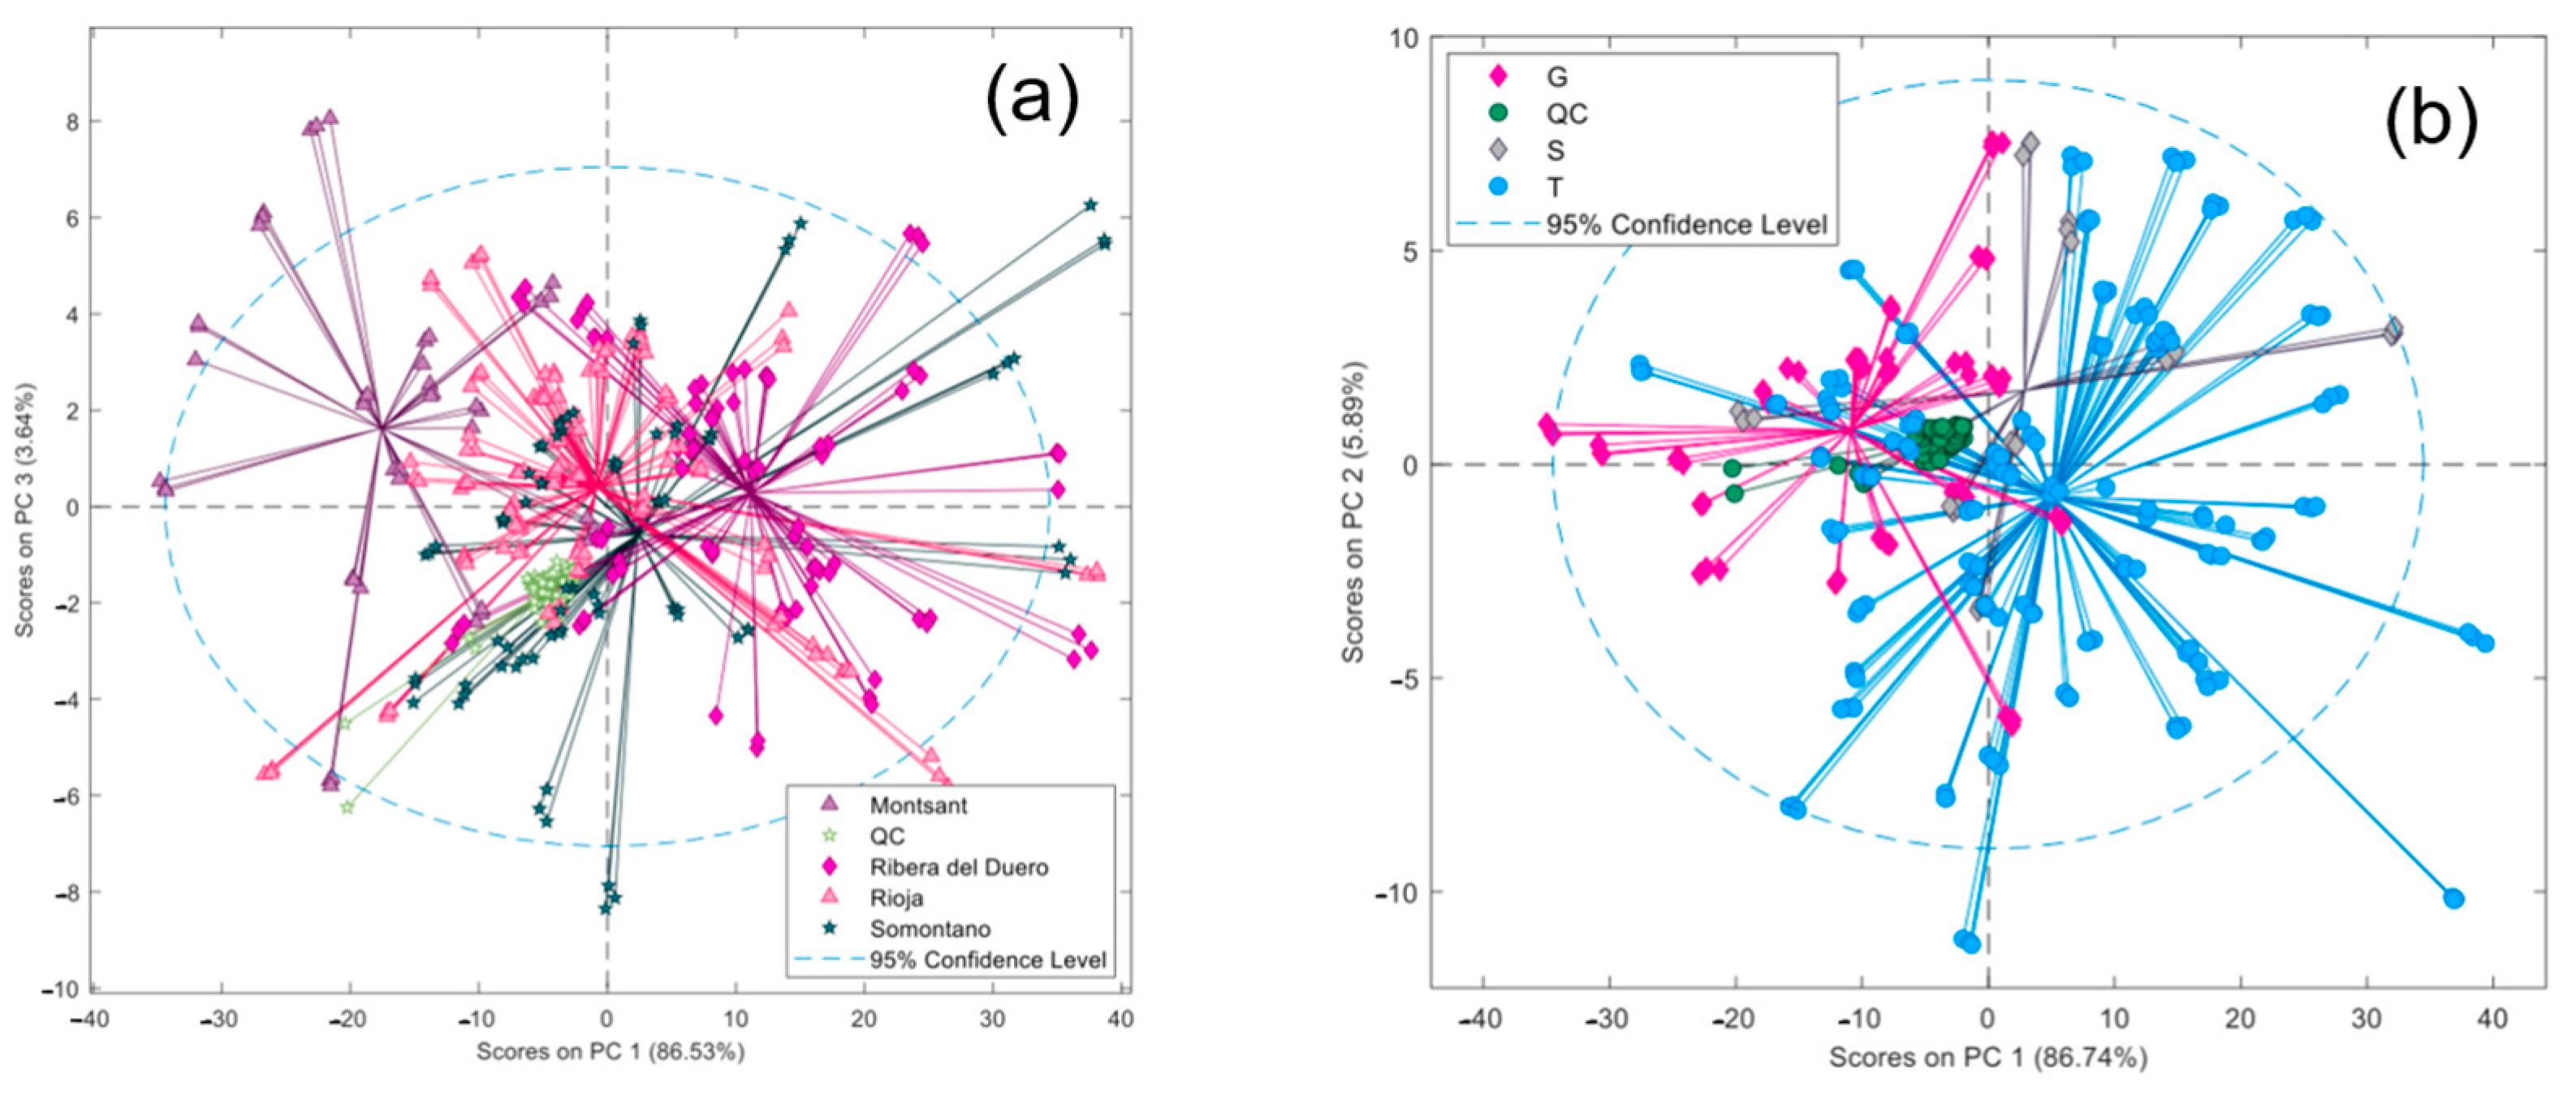
As previously indicated, unsupervised exploratory models were developed using PCA for the different scenarios considered, including UV–Vis and FLD spectra in both acidic and basic media. Figure S1 illustrates several comparative examples of these combinations. As an example, Figure 3 shows the score plots corresponding to UV–Vis spectra acquired in acidic medium, with samples labelled according to PDOs or grape varieties. The representations correspond to a subset of wines from the main classes, with the remaining samples removed for clarity. It should also be noted that the scatter plot corresponds to PC projections selected as those where class trends are most clearly observed.
Figure 3.
PCA results depicting the wine distribution using UV–Vis spectra under acidic carrier conditions. (a) score plot with samples labelled according to PDO; (b) score plot with samples labelled according to grape variety.
The score plot obtained after labelling the samples according to their PDO shows a marked overlap among the different categories, although some trends can still be discerned. Montsant wines are mainly concentrated in the left-hand region of the plot, whereas the remaining PDOs exhibit a greater degree of overlap. The QC samples appear as a highly compact cluster, highlighting the excellent reproducibility of the analytical measurements throughout the study.
When samples are colored according to grape variety, a comparable situation is observed. Although substantial overlaps exist among varietal groups, Garnacha samples tend to cluster towards the left-hand side of the plot, whereas Tempranillo samples are more frequently located on the right-hand side. These trends suggest the existence of variety-related spectral differences partially masked by the intrinsic sample variability. Similar studies were carried out using the other data typologies, namely UV–Vis in basic medium and FLD in both acidic and basic media. The results are compiled in Figure S2 of the Supplementary Material, where the axes selected in each case were considered most appropriate for the visualization of clustering patterns and the separation between sample classes. It can be observed that the UV-Vis spectra acquired under basic conditions provide results that are largely equivalent to those shown in Figure 3, suggesting that the discriminatory power of these fingerprints is highly comparable. FLD results appear to exhibit a greater degree of overlap (either for PDOs or varieties), despite the fact that the correlation analyses initially suggested otherwise. Furthermore, as inferred from the QCs, instrumental drift throughout the analytical sequence was more pronounced for FLD than for UV-Vis, and the QC clustering was somewhat less compact in the former case (see Figure S2).
3.3. Classification Studies
Wine classification for the purpose of authenticating attributes such as PDO or grape variety is here addressed as a proof of concept using different approaches and chemometric methods. To simulate a more realistic scenario, the sample set was randomly divided into two independent subsets for calibration and prediction, comprising 70% and 30% of the samples, respectively. Predictive performance was explored for all spectral data possibilities (UV-Vis and FLD in acidic and basic media).
Multiclass and binary PLS-DA models were developed considering the main classes with reasonable representativeness as targets, both for PDO and grape varieties. Binary models, on the other hand, aimed to differentiate each class from the rest (class-vs-others), allowing a more specialized modeling approach to retain the characteristics of the class of interest while accounting the remaining categories together. In the multiclass approach, models were defined to simultaneously classify all categories, including an “others” class grouping wines not belonging to the main categories.
In all cases, the number of latent variables (LVs) was estimated from the minimum prediction error using cross-validation (SEPCV) based on the Venetian Blind approach [45].
For PDOs, the models focused on the classes Ribera del Duero, Rioja, Somontano, and Montsant. Wines from each of these PDOs form a distinct class, regardless of other attributes such as grape variety or aging. Clearly, in the binary models, each typology is modelled against all remaining samples. In contrast, in the multiclass model, in addition to the four main typologies, an additional “others” category was defined, serving as a catch-all for multiple PDOs and origins outside those mentioned (e.g., Navarra, Costers del Segre, Conca de Barberà, Priorat, Penedès, Campo de Borja, Cariñena, etc.). The presence of numerous wines from areas bordering the indicated PDOs (including wines from the target regions but without PDO certification) introduces additional challenges to discrimination and classification.
The comparison between the multiclass and binary PLS-DA strategies yielded very similar results (see Table 1). Although the binary models appeared to provide better performance metrics for some classes, the opposite trend was observed for others. Overall, for the specific cases considered in this study, no statistically significant differences were found between the performance of the multiclass and binary PLS-DA approaches.
Table 1.
Results of the PLS-DA binary and multiclass models for PDO classification using UV–Vis spectra under acidic carrier conditions.
Regarding grape varieties, three main classes were considered: Tempranillo, Garnacha, and Syrah, although the representativeness of the latter is limited. The “others” category includes monovarietal wines from varieties such as Pinot Noir or Cabernet Sauvignon, as well as numerous blends combining the main classes among themselves or with other grapes. In some cases, certain varieties are highly predominant within these blends, making it very challenging to distinguish them from pure monovarietal counterparts. Furthermore, wines grouped within the same class may differ in origin and other attributes, which can increase the complexity of the modeling process.
Table 2 summarizes the varietal classification results under the same conditions as for PDOs. Overall, the metrics show average values around 0.85, which can be considered reasonably successful as a fast and cost-effective screening strategy for wine authentication.
Table 2.
Results of the PLS-DA binary and multiclass models for grape variety classification using UV–Vis spectra under acidic carrier conditions.
It should be noted that the high variability inherent to the “Others” class may make its modelling more challenging, since the behavioral patterns from a group that is intrinsically heterogeneous are considerably more difficult. As a result, the increased within-class variance may adversely affect classification performance and associated metrics. However, the inclusion of a diverse non-target class may also enhance the model’s ability to capture the specific characteristics of the target class, thereby partially offsetting this limitation. This shortcoming is well known in discrimination approaches that do not employ a one-class modelling strategy. In this regard, classification studies were performed using SIMCA, a methodology that relies exclusively on the target class to establish the membership criterion. Therefore, the variability inherent to a heterogeneous multiclass category such as “others” does not affect model construction. The results obtained for the classification of samples according to each PDO or variety are presented in Table S3 (see Supplementary Material). Using the selection criterion described in Section 2.4 and a confidence level of 95%, sensitivities close to 1 were obtained, demonstrating a high ability to correctly recognize samples belonging to the target classes. Specificities were less satisfactory and several false positives were observed.
4. Discussion
Given the characteristics of the available wine samples, the set is suitable for assessing PDO-related attributes in appellations such as Ribera del Duero, Rioja, and Somontano, which are adequately represented. For this reason, both supervised and unsupervised analyses were initially focused on PDO classification. Nevertheless, the spectral features are also influenced by varietal characteristics, and we therefore considered it worthwhile to explore this complementary objective as well, despite being aware that the representation of certain grape varieties, such as Syrah, is limited and may constrain the robustness of the results.
Regarding FLD, this technique has also been used in several wine studies. However, beyond conventional excitation or emission spectra, some authors propose recording three-dimensional excitation–emission spectra, generating matrix-type data (excitation–emission matrix, EEM) with higher content in information, although at the expense of longer analysis times.
In our case, using the FIA methodology, we aim to automate measurements and reduce sample and reagent consumption, in line with the principles of green chemistry, while also relying on instrumentation commonly available in laboratories. Our primary goal is to shorten analysis time to just a few seconds and reduce sample consumption to microliter volumes, without compromising spectral quality. The FIA system is responsible for adequately diluting the sample to generate spectra without band saturation in the UV region, where absorbance is highest, while maintaining sufficient sensitivity in the visible region, where absorption decays. Furthermore, the serial coupling of DAD and FLD detectors enables the simultaneous acquisition of absorption and fluorescence spectra within the same injection. Unfortunately, EEM fluorescence is not compatible with FIA, as the full 3D spectrum cannot be reliably recorded during a transient FIA signal lasting only a few seconds; therefore, emission spectra must be measured at a fixed excitation wavelength.
On the other hand, although strategies based on molecular spectral information from DAD and FLD are untargeted, we do know that the main compounds responsible for both detections are phenolics. Therefore, the spectral characteristics of the wine will rely on the chromophore and fluorophore moieties of phenolic acids, flavanols, flavonols, and anthocyanins. In this regard, the solvent medium—particularly its pH—has a critical influence on the shape and intensity of the recorded spectra, since the different families of phenolics contain acidic groups in their molecules (phenolic or carboxylic acid groups). Hence, protonation/deprotonation processes on optically active moieties will be responsible for major changes; thus, wine spectra in acidic or basic media differ markedly and can provide complementary discriminant information.
Regarding some of the major phenolic wine constituents, such as hydroxycinnamic and hydroxybenzoic acids, deprotonation of the carboxylic groups leads to species exhibiting relatively similar spectra, whereas the further deprotonation of the phenolic hydroxyl groups results in absorption maxima shifted to longer wavelengths. Similar considerations apply to flavanols. Concerning wine color, which is mainly related to absorption bands in the visible region, it is largely determined by anthocyanins. These compounds, among which malvidin-3-O-glucoside is predominant, undergo pH-dependent structural transformations involving the flavylium cation, quinonoidal base, hemiketal, and chalcone forms. At strongly acidic pH (here, with the 0.1% formic acid carrier), the flavylium cation predominates and is responsible for the characteristic red coloration. As the pH increases, the equilibrium progressively shifts toward quinonoidal base species, which exhibit distinct absorption properties. Hence, under mildly basic conditions (e.g., 0.1% ammonia), the anionic quinonoidal forms become important, producing further bathochromic shifts and giving rise to bluish color tones, with absorption maxima extending to approximately 630 nm.
4.1. Spectroscopic Features
As previously mentioned, complementary spectral information corresponding to the protonated or deprotonated forms of phenolic compounds was obtained with carriers of acidic and basic nature. The carrier solution consisting of 0.1% formic acid maintains the species present at pH ca. 2.7 (see comments above), with phenolic and carboxylic groups protonated. In this medium, red wine retains its natural red coloration associated with the flavylium-based anthocyanin glycosides.
Spectra under basic conditions were generated with a carrier solution containing 0.1% ammonia. The resulting pH is sufficiently high to deprotonate most phenolic groups in hydroxybenzoic and hydroxycinnamic acids, as well as flavonoids. Figure 2a shows the UV–Vis spectra under both conditions for an example wine, where noticeable band shifts toward less energetic wavelengths can be observed. In particular, hydroxycinnamic compounds (shoulder at 330 nm in acidic medium) appear much more defined in basic medium, with a clear maximum at 370 nm; likewise, anthocyanins at 570 nm in acidic medium are transformed into greenish-blue pigments (maximum around 630 nm) under basic condition. The absorption band in the visible region exhibits absorbance values of approximately 0.2 AU. It should be noted that the intensity of this band could have been enhanced to make it more visually evident by increasing, for instance, the injected sample volume. However, this would have caused the UV absorption bands to exceed the measurable range, resulting in the loss of information associated with benzoic acids, hydroxycinnamic acids, flavonols, and flavanols. Nevertheless, even when absorption bands in the visible range are not particularly prominent from this visual perspective, the underlying information is intact in the data, especially since spectra are autoscaled prior to chemometric analysis; hence, the information associated with anthocyanins contributes to the same extent to the sample discrimination as the other phenolics.
Regarding FLD, the instrumental characteristics of the equipment used only allow irradiation at a preselected wavelength to generate the corresponding emission spectra. Flavanols yielded the strongest fluorescence signals, with better spectral quality, and lower noise levels than the other phenolic families occurring in red wines. In contrast, hydroxycinnamic acids, despite being more abundant, showed significantly lower fluorescence efficiency. Other flavonoid subclasses, such as flavonols, also contain quite active fluorophore moieties, but are generally present at much lower concentrations in red wines and therefore contribute only marginally to the overall fluorescence signal. These phenolic families display well-differentiated excitation maxima (280, 370, and 320 nm for flavanols, flavonols, and hydroxycinnamic acids, respectively). As a result, the relatively high abundance of flavanols, together with their comparatively high fluorescence efficiency, makes excitation at 280 nm and emission spectra recorded between 300 and 600 nm the optimal conditions for FLD. Figure 2b shows the spectra in acidic and basic media for a representative wine analyzed under the described conditions. It can be observed that fluorescence intensity decreases markedly at basic pH, accompanied by a shift in the maximum toward longer wavelengths.
UV–Vis and FLD spectra were compared in acidic and basic media for representative wines from the main classes under study, either by PDO or by grape variety. Figure 3 shows two illustrative examples. In the subplot 3a, the UV–Vis spectra in acidic medium for wines from Rioja, Ribera del Duero, and Somontano appear largely overlapped, with slight differences mainly in the visible region. Likewise, in the subplot 3b, the FLD spectra in acidic medium for three monovarietal wines from Tempranillo, Garnacha, and Syrah seem to exhibit differences in fluorescence maxima, with variations approximately between 325 and 400 nm; variations in intensity are also observed.
The potential for differentiating between PDOs or grape varieties based on the experimental combinations investigated was assessed quantitatively with the Pearson correlation coefficient between spectral pairs, which provides an estimate of the degree of similarity in their spectral shapes. The results for representative wines are summarized in Table S2 of the Supplementary Material. For UV-Vis acidic spectra comparing PDOs or varieties, correlation coefficients exceed 0.99 in both cases, indicating strong similarity and suggesting that wine discrimination based on these data may be challenging. The spectral behavior in basic medium is analogous, with high correlations across all cases. For fluorescence spectra, correlation values range from 0.91 to 0.98 in acidic medium and from 0.94 to 0.99 in basic medium. Overall, emission spectra recorded in acidic carrier show greater differences when comparing PDOs or varieties, making this option a good choice for dealing with more detailed characterization and classification studies. Nevertheless, at this preliminary stage, we did not exclude the other combinations and therefore proceed with the chemometric analysis of all cases.
4.2. Wine Exploration by PCA
For the score plot labelled according to the PDOs, in which the main geographical origins (Ribera del Duero, Rioja, Somontano, and Montsant) are highlighted along with QC samples, (Figure 3a), the group centroids are distributed along PC1, with Mediterranean wines on the left (Montsant) and inland wines positioned further to the right, with the most western PDO (Ribera del Duero) occupying the most extreme positions. This geographically organized pattern has been observed previously [46]. As indicated in Section 3.2, the observed groupings are diffuse and, beyond these general trends, there is a substantial degree of overlap that reflects the complexity of the dataset. Indeed, several wines from different classes are located within regions predominantly associated with other classes, highlighting the challenges involved in achieving a clear separation among groups. Regarding the natural groupings of samples by geographic origin, some PDOs (e.g., Ribera del Duero and Rioja) form relatively compact clusters, reflecting similarities in their characteristics. Others, particularly Somontano wines, appear more dispersed, likely because, beyond origin, they differ in grape varieties and blends, additional factors that also influence the spectra. In this regard, it is important to note that commercial wines may exhibit this multifactorial spectral dependence from origin, variety, vinification, vintage, and aging, all contributing to configurate their composition and, consequently, the signals recorded. This multifactorial nature inevitably leads to greater complexity in characterization and lower performance metrics in classification models.
Similar circumstances apply when the wines are labelled according to grape variety. Hence, although some overlaps between typologies in the displayed projection exist, there is a higher sample density in specific areas of the score plots. Figure 3b shows that the Tempranillo class cluster on the right side of the plot, while the Garnacha counterpart is concentrated on the left. Monovarietal Syrah wines are located in the central region. Nevertheless, as observed for the PDO categories, a substantial overlap was also evident among varietal classes, with many wines from a given class appearing within regions more typically associated with other classes. Despite the apparently superior discrimination associated with FLD spectra (Section 3.1), score plot distributions showed no substantial improvement, likely due to the complexity arising from the multiple concurring factors that influence the recorded spectra. This finding was corroborated in the classification studies in Section 3.3. As a possible explanation, it should be noted that the concomitant influence of PDO, grape variety, winemaking practices, vintage, and ageing on the spectral shapes cannot readily be disentangled. As a result, for instance, the spectral differences associated with grape variety are conditioned by the contribution of the remaining factors. Thus, wines from different varieties can be compared meaningfully when all other factors are constant; however, once PDO, vintage, ageing, and other attributes vary simultaneously, anticipating their overall impact on the spectral profiles becomes considerably more challenging. Consequently, UV-Vis spectra in acidic medium represents a practical choice for routine sample analysis, as this detector is widely available in analytical laboratories and preserves the wine’s natural pH.
4.3. Wine Classification
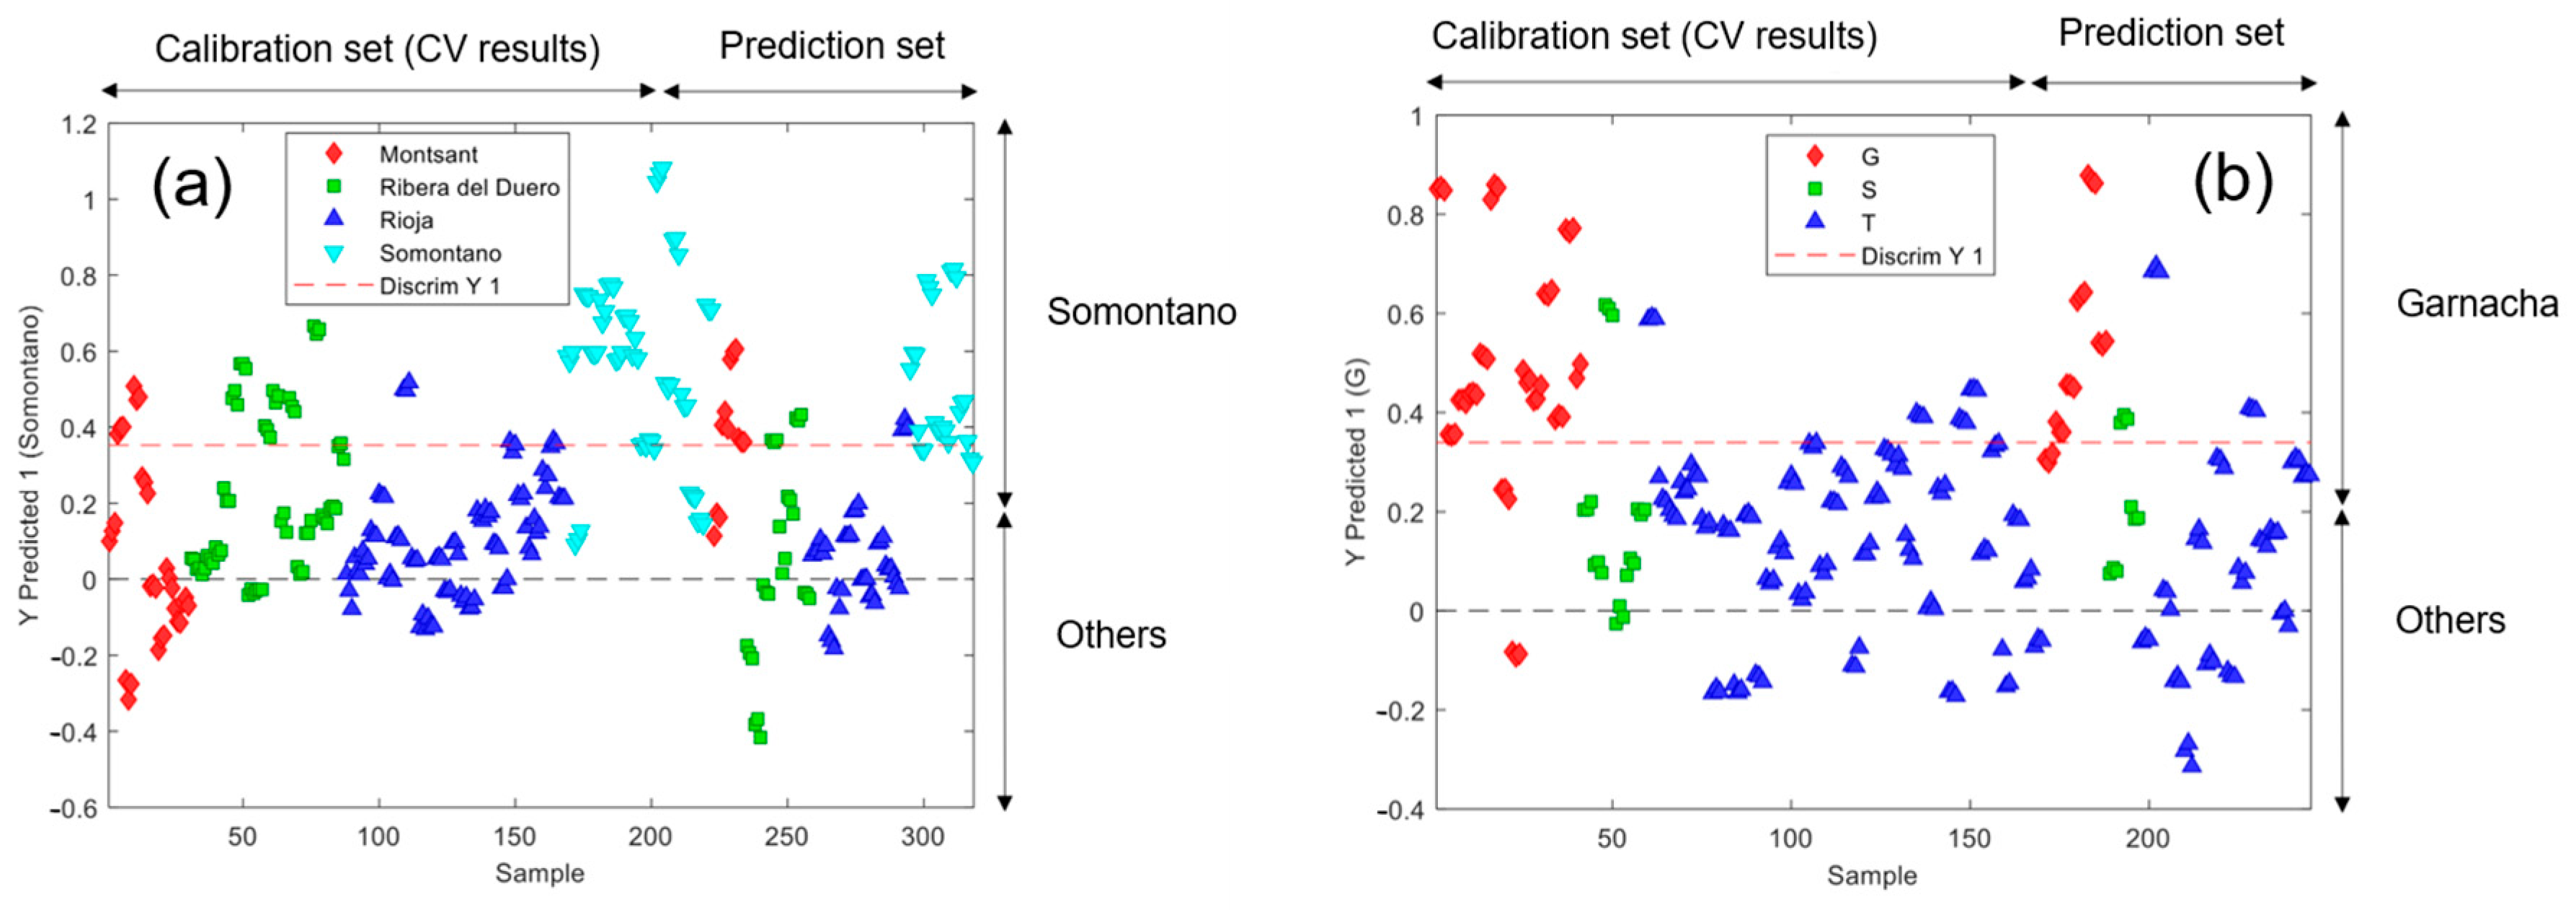
Classification results summarized in Table 1 and Table 2 are the basis of some complementary plots that deserve our attention. For instance, Figure 4 provides illustrative examples corresponding to the classification of Somontano vs. others and Garnacha vs. others. In both cases, the calibration results correspond to cross-validation predictions. For the Somontano class, confusions with Rioja are minimal, as the latter mainly consists of Tempranillo monovarietals, making their mutual differential recognition relatively easier. Confusions with Montsant are attributed to the fact that both PDOs produce many wines with similar varieties, where Garnacha is a key component. Confusions with Ribera del Duero are mainly due to blended wines with a predominance of Tempranillo. Regarding grape varieties, the example for Garnacha is quite satisfactory, showing good discrimination capability against Tempranillo and Syrah.
Figure 4.
Examples of one-vs-others binary classification models obtained by PLS-DA using UV–Vis spectra recorded under acidic carrier conditions, including cross-validation and prediction steps. (a) Assignment score plot for Somontano PDO vs. others; (b) assignment score plot for Garnacha variety vs. others. The red line indicates the threshold for class separation.
From the perspective of authentication philosophy, one-class modeling is considered highly relevant, as it focuses exclusively on the class of interest, regardless of any other sample typologies that may exist. In this approach, behavioral patterns are extracted solely from the data belonging to the target class, and unknown samples are projected onto this model to determine whether they fall inside or outside the category. In other words, wines that exhibit similarities to the target class are assigned accordingly, while those that deviate significantly from the general pattern are recognized as non-members.
The one-class models were developed using SIMCA. The results in Table S3 (Supplementary Material) show that they are highly conservative in terms of sensitivity, with values close to 1 in many cases, but they provide poorer specificity. In this case, the high dispersion of wines within a given class, given the multifactorial influences, makes the confidence region for class acceptance very broad, potentially leading to the erroneous inclusion of some samples that do not belong to the class. Conversely, all excluded samples are highly likely to be non-members of the class.
Beyond the informative and discriminative content that spectra can provide, the greatest challenge of these studies lies in multifactorial interactions, as wines within a given class are not completely homogeneous and differ in other attributes that introduce variability into the data. As previously mentioned, for example, within a specific PDO there are wines of different grape varieties or blends, young or aged, and so forth. All these factors contribute to class variability and make it more difficult to identify highly distinctive and stable patterns. Similar circumstances occur for varietal classification, since pure monovarietal wines were elaborated in different regions, meaning that the geographical factor also exerts a secondary influence embedded within the models.
As a concluding remark, depending on the problem approach, threshold parameters or classification rules can be adjusted to underscore either sensitivity or specificity. Thus, this rapid preliminary evaluation of wines may allow us to prioritize the detection of samples that do not belong to the class by conveniently tightening specificity limits. This can be particularly relevant for small PDOs producing highly recognized wines, in order to prevent external wines from being fraudulently labeled as such. Conversely, an emphasis on sensitivity ensures a high likelihood that excluded wines fall outside the target category. In any case, classification rules can also be adjusted to give greater weight to certain outcomes, generating highly reliable sets of wines assigned to or excluded from the class, while leaving a group of unassigned wines as doubtful for further studies using, for example, other instrumental approaches that can provide richer information in terms of discriminative descriptors. Furthermore, the models can be applied to confidently identify samples that clearly belong to, or fall outside, a given class, while those exhibiting more ambiguous behavior can be subjected to further confirmatory studies using more comprehensive analytical approaches.
The above considerations regarding model performance and possible avenues for improvement are primarily based on our understanding of the information content provided by spectral fingerprints. However, it should be noted that the chemical interpretation of the models is necessarily limited by the nature of the data employed. The UV–Vis and fluorescence signals consist of broad and highly overlapped spectral bands arising from multiple groups of compounds that absorb or emit simultaneously within the same spectral regions. Consequently, the contribution of individual chemical species cannot be unambiguously resolved, and the proposed explanations should be regarded as general trends rather than mechanistic conclusions supported by specific spectral markers. Therefore, beyond purely mathematical improvements to the classification models, complementing the spectral fingerprints with more chemically specific descriptors could not only enhance classification performance but also provide a stronger basis for interpreting the factors responsible for the observed discrimination among wine classes.
5. Limitations
Although sample analysis and data generation are very fast, efficient, and sustainable, the informative content of UV–Vis and FLD spectra is limited, and the differences observed when comparing spectra from different PDOs or grape varieties are not very pronounced. In fact, as previously mentioned, the correlation coefficients between the corresponding spectra are, at best, above 0.9 and typically fall within the range of 0.97–0.98. These values correspond to highly overlapping spectra, with only slight differences in intensities or in the maximum of absorption or fluorescence bands, and without any specific region or feature providing clear selectivity. However, it is important to remark that correlation values should not be interpreted solely from a numerical perspective and that there is not necessarily a direct relationship between these values and the classification errors since, for example, wines belonging to the same grape variety may still differ in terms of PDO, vintage, and aging conditions, all of which can substantially influence their spectral profiles. Consequently, relatively low correlation values do not necessarily imply good classification performance.
Nevertheless, although these experimental spectra are inherently constrained, the chemometric methods applied yield reasonably good results. This finding highlights the ability of chemometrics to extract subtle discriminatory information that is not readily apparent through direct visual inspection of the spectra.
Another aspect that hinders the achievement of better metrics is the concomitance of multiple factors influencing wine composition and, consequently, their spectral profiles. Grape variety has a significant effect on the spectral data, while geographical origin and aging processes further modulate this composition. Therefore, the combination of varieties, geographical origins, or vintages complicate characterization and authentication processes. In addition, regarding grape varieties, a large proportion of the wines in the dataset are blends, sometimes containing similar proportions of multiple varieties and, in other cases, dominated by one. Although this aspect cannot be fully addressed in this work due to the confidentiality of many blending compositions, wines with a high content of a given variety may reasonably be confused with the monovarietal counterparts.
Finally, the representativeness of each class also affects the results. In other words, having a larger number of samples per class would allow the establishment of more robust classification models, which would likely improve classification metrics. In this study, this limitation is particularly evident in classes with a small number of samples, where a single misclassified sample has a much greater impact on sensitivity and specificity values. Therefore, the classification performance is influenced not only by the spectral resemblance between classes but also by the composition and representativeness of the datasets used for model development.
6. Conclusions
This study demonstrates the feasibility of integrating Flow Injection Analysis (FIA) with multichannel UV-Vis and fluorescence (FLD) detection for the rapid characterization of red wines and preliminary authentication of attributes such as Protected Designation of Origin (PDO) and grape variety. The use of FIA significantly reduced analysis time and sample consumption, aligning with green chemistry principles, without compromising spectral quality. Exploratory studies using PCA revealed coherent geographical patterns and excellent reproducibility, despite the multifactorial complexity associated with origin, variety, and winemaking processes. Regarding classification, PLS-DA models showed moderate yet promising performance, with average sensitivity and specificity values around 0.85, which can be considered acceptable for a fast and cost-effective wine authentication strategy. One-class SIMCA models proved highly conservative, achieving near-perfect sensitivity but lower specificity due to the broad confidence regions required to accommodate class variability. This highlights the challenge posed by multifactorial influences—such as blends, aging, and regional differences—that hinder the identification of distinctive and stable patterns. Depending on the application, classification thresholds can be adjusted to prioritize either sensitivity or specificity, enabling tailored strategies for fraud prevention or inclusive screening. Although limitations arise from spectral overlap and low representativeness of some classes, the results are highly promising. Overall, the combination of FIA with spectroscopic techniques has proven to be an efficient and scalable alternative for industrial environments with high sample throughput. In any case, this method is not intended to replace confirmatory analytical methods. Rather, it may serve as an efficient first-stage screening tool for identifying samples that clearly belong to, or clearly fall outside, a particular class. Consequently, it enables the rapid assessment of large numbers of samples and facilitates the identification of those requiring further investigation using more comprehensive analytical methodologies.
Supplementary Materials
The following supporting information can be downloaded at: https://www.mdpi.com/article/10.3390/beverages12080086/s1, Table S1. Set of wine samples under study, including name, PDO and grape variety information. Figure S1. UV-Vis spectra (a–d) and fluorescence (FLD) spectra (e–h) of representative wines from the different PDOs (a, c, e, g) and grape varieties (b, d, f, h), acquired under acidic (a, b, e, f) and basic (c, d, g, h) conditions, respectively. PDO colour coding: dark blue, Montsant; green, Somontano; orange, Rioja; light blue, Ribera del Duero. Variety colour coding: dark blue, Tempranillo; green, Syrah; orange, Garnacha. Figure S2. PCA results depicting the wine distribution using UV–Vis or FLD spectra under acidic or basic carrier conditions. (a) score plot of samples labelled according to PDO using UV–Vis spectra under basic carrier; (b) score plot of samples labelled according to grape variety using FLD spectra under acid carrier; (c) score plot of samples labelled according to PDO using FLD spectra under acid carrier; (d) score plot of samples labelled according to grape variety using FLD spectra under acid carrier; (e) score plot of samples labelled according to PDO using FLD spectra under basic carrier; (f) score plot of samples labelled according to grape variety using FLD spectra under basic carrier. Table S2. Correlation table of spectra for wines of different PDOs and varieties on basic conditions. Table S3. Results of the one-class SIMCA models using UV–Vis spectra under acidic carrier conditions.
Author Contributions
Conceptualization, S.S. and J.S.; methodology, G.L. and D.A.A.F.; software, D.A.A.F.; formal analysis, G.L.; investigation, G.L.; resources, S.S. and J.S.; data curation, G.L.; writing—original draft preparation, G.L., S.S. and J.S.; writing—review and editing, S.S. and J.S.; supervision, S.S. and J.S.; funding acquisition, S.S. and J.S. All authors have read and agreed to the published version of the manuscript.
Funding
This research was funded by Agencia Estatal de Investigación del Ministerio de Ciencia, Innovación y Universidades MICIU/AEI/10.13039/501100011033 (ref. PID2023-147160OB-C22) and the INSA-UB María de Maeztu Unit of Excellence (Grant CEX2021-001234-M) funded by MICIU/AEI and ERDF EU.
Institutional Review Board Statement
Not applicable.
Informed Consent Statement
Not applicable.
Data Availability Statement
The raw data supporting the conclusions of this article will be made available by the authors on request.
Acknowledgments
We gratefully acknowledge our colleagues from the Department of Chemical Engineering and Analytical Chemistry at the University of Barcelona (M. Granados, A. de Juan, J.M. Díaz-Cruz, among others), as well as our friends, for their assistance in collecting wine samples from diverse origins.
Conflicts of Interest
The authors declare no conflicts of interest.
References
- Morales, L.V.; Ahumada, F.D.A.; Deben, A.; Sentellas, S.; Saurina, J. Revisiting Wine Authentication in a Changing Landscape: Trends, Challenges, and Future Directions. TrAC Trends Anal. Chem. 2026, 202, 118917. [Google Scholar] [CrossRef] [Scilit]
- Mafata, M.; Brand, J.; Medvedovici, A.; Buica, A. Chemometric and Sensometric Techniques in Enological Data Analysis. Crit. Rev. Food Sci. Nutr. 2022, 63, 10995–11009. [Google Scholar] [CrossRef] [Scilit] [PubMed]
- Koljančić, N.; Furdíková, K.; de Araújo Gomes, A.; Špánik, I. Wine Authentication: Current Progress and State of the Art. Trends Food Sci. Technol. 2024, 150, 104598. [Google Scholar] [CrossRef] [Scilit]
- Ranaweera, R.K.R.; Capone, D.L.; Bastian, S.E.P.; Cozzolino, D.; Jeffery, D.W. A Review of Wine Authentication Using Spectroscopic Approaches in Combination with Chemometrics. Molecules 2021, 26, 4334. [Google Scholar] [CrossRef] [Scilit] [PubMed]
- Miliordos, D.E.; Kanapitsas, A.; Lola, D.; Goulioti, E.; Kontoudakis, N.; Leventis, G.; Tsiknia, M.; Kotseridis, Y. Effect of Nitrogen Fertilization on Savvatiano (Vitis vinifera L.) Grape and Wine Composition. Beverages 2022, 8, 29. [Google Scholar] [CrossRef] [Scilit]
- Bunea, C.I.; Banita, S.I.; Bora, F.D.; Calugar, A.; Gál, E.; Bunea, A.; Mocan, A.; Nicolescu, A. Influence of Ecological Versus Conventional Viticulture on Physicochemical, Antioxidant, and Sensory Properties of Wines from Three Grapevine Varieties. Horticulturae 2026, 12, 628. [Google Scholar] [CrossRef] [Scilit]
- Stoffel, E.S.; Lesniauskas, R.O.; Anderson, S.R.; Krystoff, C.T.; Casassa, L.F. Temporal Evaluation of Retronasal and Mouthfeel Sensations in Cofermented and Blended Red Wines from California. Am. J. Enol. Vitic. 2023, 74, 0740017. [Google Scholar] [CrossRef] [Scilit]
- Piombino, P.; Pittari, E.; Di Fede, R.S.; Lisanti, M.T.; Carlin, S.; Curioni, A.; Luzzini, G.; Marangon, C.M.; Marangon, M.; Mattivi, F. Definition of a sensory lexicon and development of sensory wheels of eighteen monovarietal Italian white wines. J. Sci. Food Agric. 2026, 106, 3745–3759. [Google Scholar] [CrossRef] [Scilit] [PubMed]
- Tonacci, A.; Scalzini, G.; Díaz-Guerrero, P.; Sanmartin, C.; Taglieri, I.; Ferroni, G.; Flamini, G.; Odello, L.; Billeci, L.; Venturi, F. Chemosensory analysis of emotional wines: Merging of explicit and implicit methods to measure emotions aroused by red wines. Food Res. Int. 2024, 190, 114611. [Google Scholar] [CrossRef] [Scilit] [PubMed]
- Ríos-Reina, R.; Segura-Borrego, M.P.; Camiña, J.M.; Callejón, R.M.; Azcarate, S.M. Multiplatform Spectralprint Strategies for the Authentication of Spanish PDO Fortified Wines Using AHIMBU, an Automatic Hierarchical Classification Tool. Chemom. Intell. Lab. Syst. 2025, 257, 105311. [Google Scholar] [CrossRef] [Scilit]
- Hencz, A.; Nguyen, L.L.P.; Baranyai, L.; Albanese, D. Assessment of Wine Adulteration Using Near Infrared Spectroscopy and Laser Backscattering Imaging. Processes 2022, 10, 95. [Google Scholar] [CrossRef] [Scilit]
- Ta, N.; Wei, H.; Hu, Z.; Cao, X.; Xiao, M. Wine Component Tracing Method Based on near Infrared Spectrum Fusion Machine Learning. Front. Sustain. Food Syst. 2023, 7, 1197508. [Google Scholar] [CrossRef] [Scilit]
- Budziak-Wieczorek, I.; Mašán, V.; Rząd, K.; Gładyszewska, B.; Karcz, D.; Burg, P.; Čížková, A.; Gagoś, M.; Matwijczuk, A. Evaluation of the Quality of Selected White and Red Wines Produced from Moravia Region of Czech Republic Using Physicochemical Analysis, FTIR Infrared Spectroscopy and Chemometric Techniques. Molecules 2023, 28, 6326. [Google Scholar] [CrossRef] [Scilit] [PubMed]
- Machyňáková, A.; Schneider, M.P.; Khvalbota, L.; Vyviurska, O.; Špánik, I.; Gomes, A.A. A Fast and Inexpensive Approach to Characterize Slovak Tokaj Selection Wines Using Infrared Spectroscopy and Chemometrics. Food Chem. 2021, 357, 129715. [Google Scholar] [CrossRef] [Scilit] [PubMed]
- Lu, B.; Tian, F.; Chen, C.; Wu, W.; Tian, X.; Chen, C.; Lv, X. Identification of Chinese Red Wine Origins Based on Raman Spectroscopy and Deep Learning. Spectrochim. Acta A Mol. Biomol. Spectrosc. 2023, 291, 122355. [Google Scholar] [CrossRef] [Scilit] [PubMed]
- Gu, H.W.; Zhou, H.H.; Lv, Y.; Wu, Q.; Pan, Y.; Peng, Z.X.; Zhang, X.H.; Yin, X.L. Geographical Origin Identification of Chinese Red Wines Using Ultraviolet-Visible Spectroscopy Coupled with Machine Learning Techniques. J. Food Compos. Anal. 2023, 119, 105265. [Google Scholar] [CrossRef] [Scilit]
- Gomes, A.A.; Khvalbota, L.; Machyňáková, A.; Furdíková, K.; Zini, C.A.; Špánik, I. Slovak Tokaj Wines Classification with Respect to Geographical Origin by Means of One Class Approaches. Spectrochim. Acta A Mol. Biomol. Spectrosc. 2021, 257, 119770. [Google Scholar] [CrossRef] [Scilit] [PubMed]
- Ranaweera, R.K.R.; Bastian, S.E.P.; Gilmore, A.M.; Capone, D.L.; Jeffery, D.W. Absorbance-Transmission and Fluorescence Excitation-Emission Matrix (A-TEEM) with Multi-Block Data Analysis and Machine Learning for Accurate Intraregional Classification of Barossa Shiraz Wine. Food Control 2023, 144, 109335. [Google Scholar] [CrossRef] [Scilit]
- Ríos-Reina, R.; Pérez-Bernal, J.L.; Azcarate, S.M.; Callejón, R.M. Usefulness of Excitation-Emission Fluorescence Spectralprint Combined with Chemometrics for Authentication of PDO Fortified Wines. Microchem. J. 2024, 199, 110067. [Google Scholar] [CrossRef] [Scilit]
- Lenardon Vinciguerra, L.; Carla Böck, F.; Pires Schneider, M.; Alejandra Pisoni Canedo Reis, N.; Flores Silva, L.; Christina Mendes de Souza, K.; Crivellaro Guerra, C.; de Araújo Gomes, A.; Maria Bergold, A.; Flôres Ferrão, M. Geographical Origin Authentication of Southern Brazilian Red Wines by Means of EEM-PH Four-Way Data Modelling Coupled with One Class Classification Approach. Food Chem. 2021, 362, 130087. [Google Scholar] [CrossRef] [Scilit] [PubMed]
- Gerginova, D.; Simova, S. Chemical Profiling of Wines Produced in Bulgaria and Distinction from International Grape Varieties. ACS Omega 2023, 8, 18702–18713. [Google Scholar] [CrossRef] [Scilit] [PubMed]
- Le Mao, I.; Da Costa, G.; Bautista, C.; de Revel, G.; Richard, T. Application of 1H NMR Metabolomics to French Sparkling Wines. Food Control 2023, 145, 109423. [Google Scholar] [CrossRef] [Scilit]
- Miricioiu, M.G.; Ionete, R.E.; Costinel, D.; Simova, S.; Gerginova, D.; Botoran, O.R. Metabolic Profiling and Stable Isotope Analysis of Wines: Pilot Study for Cross-Border Authentication. Foods 2024, 13, 3372. [Google Scholar] [CrossRef] [Scilit] [PubMed]
- Bambina, P.; Spinella, A.; Lo Papa, G.; Chillura Martino, D.F.; Lo Meo, P.; Cinquanta, L.; Conte, P. 1H-NMR Spectroscopy Coupled with Chemometrics to Classify Wines According to Different Grape Varieties and Different Terroirs. Agriculture 2024, 14, 749. [Google Scholar] [CrossRef] [Scilit]
- Guo, T.; Li, Y.; Yong, W.; Fang, P.; Qin, Z.; Yan, A.; Dong, Y. Non-Target Geographic Region Discrimination of Cabernet Sauvignon Wine by Direct Analysis in Real Time Mass Spectrometry with Chemometrics Methods. Int. J. Mass Spectrom. 2021, 464, 116577. [Google Scholar] [CrossRef] [Scilit]
- Lin, X.; Wu, H.; Huang, G.; Wu, Q.; Yao, Z.P. Rapid Authentication of Red Wine by MALDI-MS Combined with DART-MS. Anal. Chim. Acta 2023, 1283, 341966. [Google Scholar] [CrossRef] [Scilit] [PubMed]
- Karadimou, C.; Kalogiouri, N.P.; Chatzidimitriou, E.; Ouroumi, N.A.; Gkrimpizis, T.; Theocharis, S.; Menkissoglu-Spiroudi, U.; Koundouras, S. Non-Targeted Analysis Using Gas Chromatography Mass Spectrometry to Assess the Free and Bound Aroma Fingerprints of the Emblematic Greek White Winegrape Varieties and Guarantee Varietal Authenticity Using Multivariate Chemometrics. Food Chem. 2025, 472, 142968. [Google Scholar] [CrossRef] [Scilit] [PubMed]
- Duley, G.; Ferretti, C.G.; Morozova, K.; Longo, E.; Imperiale, S.; Ding, Y.; Poggesi, S.; Scampicchio, M.; Boselli, E. How Distinctive Are ‘Gewürztraminer’ Vineyard Terroirs in South Tyrol for Wine Production? A Metabolomics-Based Approach. J. Agric. Food Res. 2024, 18, 101298. [Google Scholar] [CrossRef] [Scilit]
- Kalogiouri, N.P.; Manousi, N.; Ferracane, A.; Zachariadis, G.A.; Koundouras, S.; Samanidou, V.F.; Tranchida, P.Q.; Mondello, L.; Rosenberg, E. A Novel Headspace Solid-Phase Microextraction Arrow Method Employing Comprehensive Two-Dimensional Gas Chromatography–Mass Spectrometry Combined with Chemometric Tools for the Investigation of Wine Aging. Anal. Chim. Acta 2024, 1304, 342555. [Google Scholar] [CrossRef] [Scilit] [PubMed]
- Yin, X.L.; Peng, Z.X.; Pan, Y.; Lv, Y.; Long, W.; Gu, H.W.; Fu, H.; She, Y. UHPLC-QTOF-MS-Based Untargeted Metabolomic Authentication of Chinese Red Wines According to Their Grape Varieties. Food Res. Int. 2024, 178, 113923. [Google Scholar] [CrossRef] [Scilit] [PubMed]
- Oliva, E.; Mir-Cerdà, A.; Sergi, M.; Sentellas, S.; Saurina, J. Characterization of Sparkling Wine Based on Polyphenolic Profiling by Liquid Chromatography Coupled to Mass Spectrometry. Fermentation 2023, 9, 223. [Google Scholar] [CrossRef] [Scilit]
- Ubeda, C.; Cortejosa, D.; Morales, M.L.; Callejón, R.M.; Ríos-Reina, R. Determination of Volatile Compounds for the Differentiation of PDO Fortified Wines with Different Ageing Methods as a Tool for Controlling Their Authenticity. Food Res. Int. 2023, 173, 113320. [Google Scholar] [CrossRef] [Scilit] [PubMed]
- Vyviurska, O.; Khvalbota, L.; Koljančić, N.; Špánik, I.; Gomes, A.A. Wine Age Prediction Using Digital Images and Multivariate Calibration. Microchem. J. 2023, 190, 108738. [Google Scholar] [CrossRef] [Scilit]
- Dantas, D.L.L.; Pereira, G.E.; de Souza, A.L.; dos Santos Lima, M. Chemometric Analysis for Authentication of ‘Syrah’ and ‘Tempranillo’ Red Wines of San Francisco Valley-Brazil Compared to Wines from Other World Regions by the Molecular Profile in HPLC. J. Food Sci. Technol. 2023, 60, 2050–2062. [Google Scholar] [CrossRef] [Scilit] [PubMed]
- Navarro-Abril, A.; Saurina, J.; Sentellas, S. Simultaneous Determination of Amino Acids and Biogenic Amines by Liquid Chromatography Coupled to Mass Spectrometry for Assessing Wine Quality. Beverages 2022, 8, 69. [Google Scholar] [CrossRef] [Scilit]
- Izquierdo-Llopart, A.; Saurina, J. Characterization of Sparkling Wines According to Polyphenolic Profiles Obtained by HPLC-UV/Vis and Principal Component Analysis. Foods 2019, 8, 22. [Google Scholar] [CrossRef] [Scilit] [PubMed]
- Stój, A.; Wojnowski, W.; Płotka-Wasylka, J.; Czernecki, T.; Kapusta, I.T. The Use of Ultra-Fast Gas Chromatography for Fingerprinting-Based Classification of Zweigelt and Rondo Wines with Regard to Grape Variety and Type of Malolactic Fermentation Combined with Greenness and Practicality Assessment. Molecules 2024, 29, 4667. [Google Scholar] [CrossRef] [Scilit] [PubMed]
- Torres-Cobos, B.; Quintanilla-Casas, B.; Vicario, G.; Guardiola, F.; Tres, A.; Vichi, S. Revealing adulterated olive oils by triacylglycerol screening methods: Beyond the official method. Food Chem. 2022, 408, 135256. [Google Scholar] [CrossRef] [Scilit] [PubMed]
- Quintanilla-Casas, B.; Strocchi, G.; Bustamante, J.; Torres-Cobos, B.; Guardiola, F.; Moreda, W.; Martínez-Rivas, J.M.; Valli, E.; Bendini, A.; Toschi, T.G. Large-scale evaluation of shotgun triacylglycerol profiling for the fast detection of olive oil adulteration. Food Control 2020, 123, 107851. [Google Scholar] [CrossRef] [Scilit]
- Nerez, N.; Saurina, J.; Núñez, O. An FIA-MS Method for Rapid Coffee Adulteration Detection: A Comparative Study with a Non-Targeted LC-MS Approach. Foods 2025, 14, 2931. [Google Scholar] [CrossRef] [Scilit] [PubMed]
- Harnly, J.; Chen, P.; Sun, J.H.; Huang, H.L.; Colson, K.L.; Yuk, J.; McCoy, J.A.H.; Reynaud, D.T.H.; Harrington, P.B.; Fletcher, E.J. Comparison of Flow Injection MS, NMR, and DNA Sequencing: Methods for Identification and Authentication of Black Cohosh (Actaea racemosa). Planta Medica 2016, 82, 250–262. [Google Scholar] [CrossRef] [Scilit] [PubMed]
- Harnly, J.; Lu, Y.J.; Sun, J.H.; Chen, P. Botanical supplements: Detecting the transition from ingredient to product. J. Food Comp. Anal. 2017, 64, 85–92. [Google Scholar] [CrossRef] [Scilit]
- Mir-Cerdà, A.; Saurina, J.; Sentellas, S. Bioactive Amines in Wines. The Assessment of Quality Descriptors by Flow Injection Analysis with Tandem Mass Spectrometry. Molecules 2022, 27, 8690. [Google Scholar] [CrossRef] [Scilit] [PubMed]
- Campmajó, G.; Saurina, J.; Núñez, O. FIA–HRMS Fingerprinting Subjected to Chemometrics as a Valuable Tool to Address Food Classification and Authentication: Application to Red Wine, Paprika, and Vegetable Oil Samples. Food Chem. 2022, 373, 131491. [Google Scholar] [CrossRef] [Scilit] [PubMed]
- Westerhuis, J.A.; Hoefsloot, H.C.J.; Smit, S.; Vis, D.J.; Smilde, A.K.; van Velzen, E.J.J.; van Duijnhoven, J.P.M.; van Dorsten, F.A. Assessment of PLSDA cross validation. Metabolomics 2008, 4, 81–89. [Google Scholar] [CrossRef] [Scilit]
- Díaz, R.; Gallart-Ayala, H.; Sancho, J.V.; Nuñez, O.; Zamora, T.; Martins, C.P.B.; Hernández, F.; Hernández-Cassou, S.; Saurina, J.; Checa, A. Told through the Wine: A Liquid Chromatography-Mass Spectrometry Interplatform Comparison Reveals the Influence of the Global Approach on the Final Annotated Metabolites in Non-Targeted Metabolomics. J. Chromatogr. A 2016, 1433, 90–97. [Google Scholar] [CrossRef] [Scilit] [PubMed]

Disclaimer/Publisher’s Note: The statements, opinions and data contained in all publications are solely those of the individual author(s) and contributor(s) and not of MDPI and/or the editor(s). MDPI and/or the editor(s) disclaim responsibility for any injury to people or property resulting from any ideas, methods, instructions or products referred to in the content. |
© 2026 by the authors. Licensee MDPI, Basel, Switzerland. This article is an open access article distributed under the terms and conditions of the Creative Commons Attribution (CC BY) license.