


Abstract
Aronia (Aronia melanocarpa, black chokeberry) is characterized by a very high content of polyphenolic compounds and relatively low concentrations of fermentable sugars, which limits its direct consumption and fermentation. However, the high levels of proanthocyanidins and anthocyanins present in aronia make this fruit attractive for the development of functional foods. One potential application is the production of grape must-based fermented beverages through the enrichment of white grape must with crushed aronia fruit. In this study, three experimental fermented beverages were produced by adding crushed aronia fruit at levels of 20%, 40% and 60% (w/w) to white grape must obtained from the Fetească regală variety. The objective of the study was to assess the sensory acceptability of these aronia-enriched fermented beverages. Sensory evaluation was performed using a quantitative profile method developed in our laboratory, complemented by the OIV score sheet commonly applied in wine competitions. Analysis of variance (ANOVA), principal component analysis (PCA) and cluster analysis were applied to the sensory data, and the results were visualized using radar plots and heatmaps. The results indicated that, although none of the samples achieved scores corresponding to high-quality wines, the fermented beverages containing 40–60% aronia fruit exhibited the highest overall acceptability, regardless of the yeast strain used. However, to avoid completely masking the grape aroma, the use of 40% aronia fruit is recommended. These findings suggest that high proportions of aronia fruit can be sensorially acceptable when incorporated into white grape must-based fermented beverages, supporting their potential for further development.
1. Introduction
Aronia melanocarpa (black chokeberry) is native to eastern North America [1] but is now cultivated commercially primarily in Poland and other Eastern European countries, as well as in Germany, Finland, Sweden, and Norway [2]. Aronia is among the fruits richest in phenolic compounds, which strongly influence its sensory properties. These compounds are associated with several reported health benefits [1,3,4,5,6,7,8,9], but they also contribute to the pronounced astringency and bitterness of the fruit, which limits its direct consumption. This sensory profile is the basis for the common name “chokeberry.”
Variations in general composition depend very much on the variety and region. Šnebergrová et al. [10] reported the following composition for aronia fruits: soluble solids 19.9 °Brix, glucose 47.1 g/kg, fructose 37.8 g/kg, sorbitol 66.1 g/kg, malic acid 9.6 g/kg, citric acid 1.0 g/kg, quinic acid 5.0 g/kg, and isocitric acid 0.02 g/kg. Mineral contents included phosphorus 0.34 g/kg, potassium 2.90 g/kg, calcium 0.27 g/kg, and magnesium 0.16 g/kg.
Aronia fruits are characterized by exceptionally high polyphenol concentrations, with total phenolic contents reported in the scientific literature as high as 3000–8000 mg gallic acid equivalents (GAE)/kg fresh weight [9], but more commonly ranging between 600 and 2500 mg GAE/100 g fresh weight, depending on cultivar, analytical method, and raw material [11,12,13]. Anthocyanin concentrations are typically reported between 200 and 1800 mg/100 g fresh weight and are mainly represented by cyanidin derivatives, particularly cyanidin-3-galactoside and cyanidin-3-arabinoside, which are responsible for the characteristic deep purple-black colour of the fruit. Proanthocyanidins (condensed tannins) constitute a major fraction of the phenolic content, accounting for up to 60–70% of total phenolics in some samples [9], and their high degree of polymerization contributes to the pronounced bitterness and astringency of aronia [14], grapes [15] or other fruits [15,16]. Flavonols, mainly quercetin derivatives, are present in smaller amounts and contribute less to colour formation [9]. These compositional characteristics are responsible for the intense colour, bitterness, astringency, and high antioxidant capacity of aronia, as well as for its strong sensory influence when blended into grape must.
Because aronia is rarely consumed fresh, it is commonly processed into juices and fermented products through lactic, alcoholic or acetic fermentation [14]. Aronia juice and its physicochemical and antioxidant properties have been extensively studied [11,12,17,18,19,20,21]. Blended products, particularly with apple juice, are also frequently produced [22]. In addition, aronia fruits, juices, and pomace have been incorporated into fermented dairy products such as fruit yogurts [23].
Wine-based beverages obtained by blending white grape must with various fruit juices, such as apple and orange, have recently attracted increasing interest [24]. However, aronia has not been extensively investigated in such formulations, which motivated the present study in which we have used Fetească regală grape must.
For fermented beverage production, sugar composition is an important technological parameter. Compared with grapes, aronia has a moderate to low fermentable sugar content and is therefore suitable for blending with grape must, thus requiring only limited sugar correction. Aronia contains glucose and fructose as the principal fermentable sugars, typically reaching 60–100 g/kg fresh fruit. Sorbitol is also present in high quantities ranging from 60 to 130 g/kg fresh fruit [25,26], together with relatively high levels of pectic substances of 6–7 g/kg [27,28], which can contribute to viscosity and haze formation in beverages. In mixed fermentations with grape must, ethanol production is therefore derived predominantly from grape sugars.
Aronia also introduces several technological constraints during fermentation. Its high organic acid content can significantly increase the acidity of grape-based mixtures, while the elevated proanthocyanidin concentration promotes interactions with grape proteins and polysaccharides during fermentation. Unlike grapes, where tartaric acid predominates, aronia acidity is mainly associated with malic acid. Total titratable acidity ranges from 10 to 20 g/kg fresh weight (expressed as malic acid equivalents), while citric and quinic acids are also present in 1 g/kg and 5 g/kg fresh weight, respectively [10]. Reported pH values generally range from 3.0 to 3.5. Aronia must typically exhibits acidity values of approximately 8–12 g/L (expressed as malic acid), higher than those commonly observed in white grape must, and may therefore increase both total and perceived acidity in fermented beverages.
From a sensory perspective, aronia contributes pronounced acidity and astringency to blended beverages. Even small additions may disproportionately increase perceived acidity because the acid profile shifts toward a higher malic-to-tartaric acid ratio, with malic acid generally perceived as sharper than tartaric acid. The volatile profile of aronia also differs substantially from that of grapes. Key volatile compounds identified in aronia include hexanal, ethyl acetate, methyl acetate, benzaldehyde, 1-butanol, linalool, hexane, and 2-nonanol [29]. In contrast, wine aroma profiles are considerably more complex. For example, Manolache et al. [30] identified 23 key volatile compounds in Romanian Fetească regală, VIVC No. 4121 [31] wines, including ethyl acetate, ethyl esters of butanoic, hexanoic, octanoic, and decanoic acids, higher alcohols, glycerol, phenylethyl alcohol, ionone, and furfural.
The present study focuses primarily on the sensory properties of fermented beverages produced from white grape must enriched with crushed aronia fruit, with the aim of characterizing their sensory profiles based on perceived attribute intensity of individual attributes. In addition, the study presents a sensory analysis methodology that can be applied for characterization and profiling of wines and other experimental beverages in comparative studies.
2. Materials and Methods
2.1. Materials and Beverage Production Method
Must from the grape variety Fetească regală and aronia fruits from Nero variety, harvested in the plantation of the University of Agronomic Sciences and Veterinary Medicine of Bucharest, were used for the preparation of the experimental samples.
At harvest (10 September 2025), the grape must contained 240 g/L fermentable sugars (glucose + fructose) and a total acidity of 5 g/L expressed as tartaric acid. The must of Fetească regală was obtained by classical technology, using an open destemmer/crusher and a hydraulic bladder wine press, both from Enoveneta, Padova, Italy. The must was sulphited with 30 mg/L SO2 and left at 10 °C for 24 h to decant and clarify. The clarified must was then used for the experiments.
Aronia mash was prepared by direct crushing of the fruits with a manual fruit crusher (Enoitalia Group, Verona, Italy), resulting in an extraction yield of approximately 250 mL/kg fresh fruit. The mash contained 40 g/L fermentable sugars (glucose + fructose).
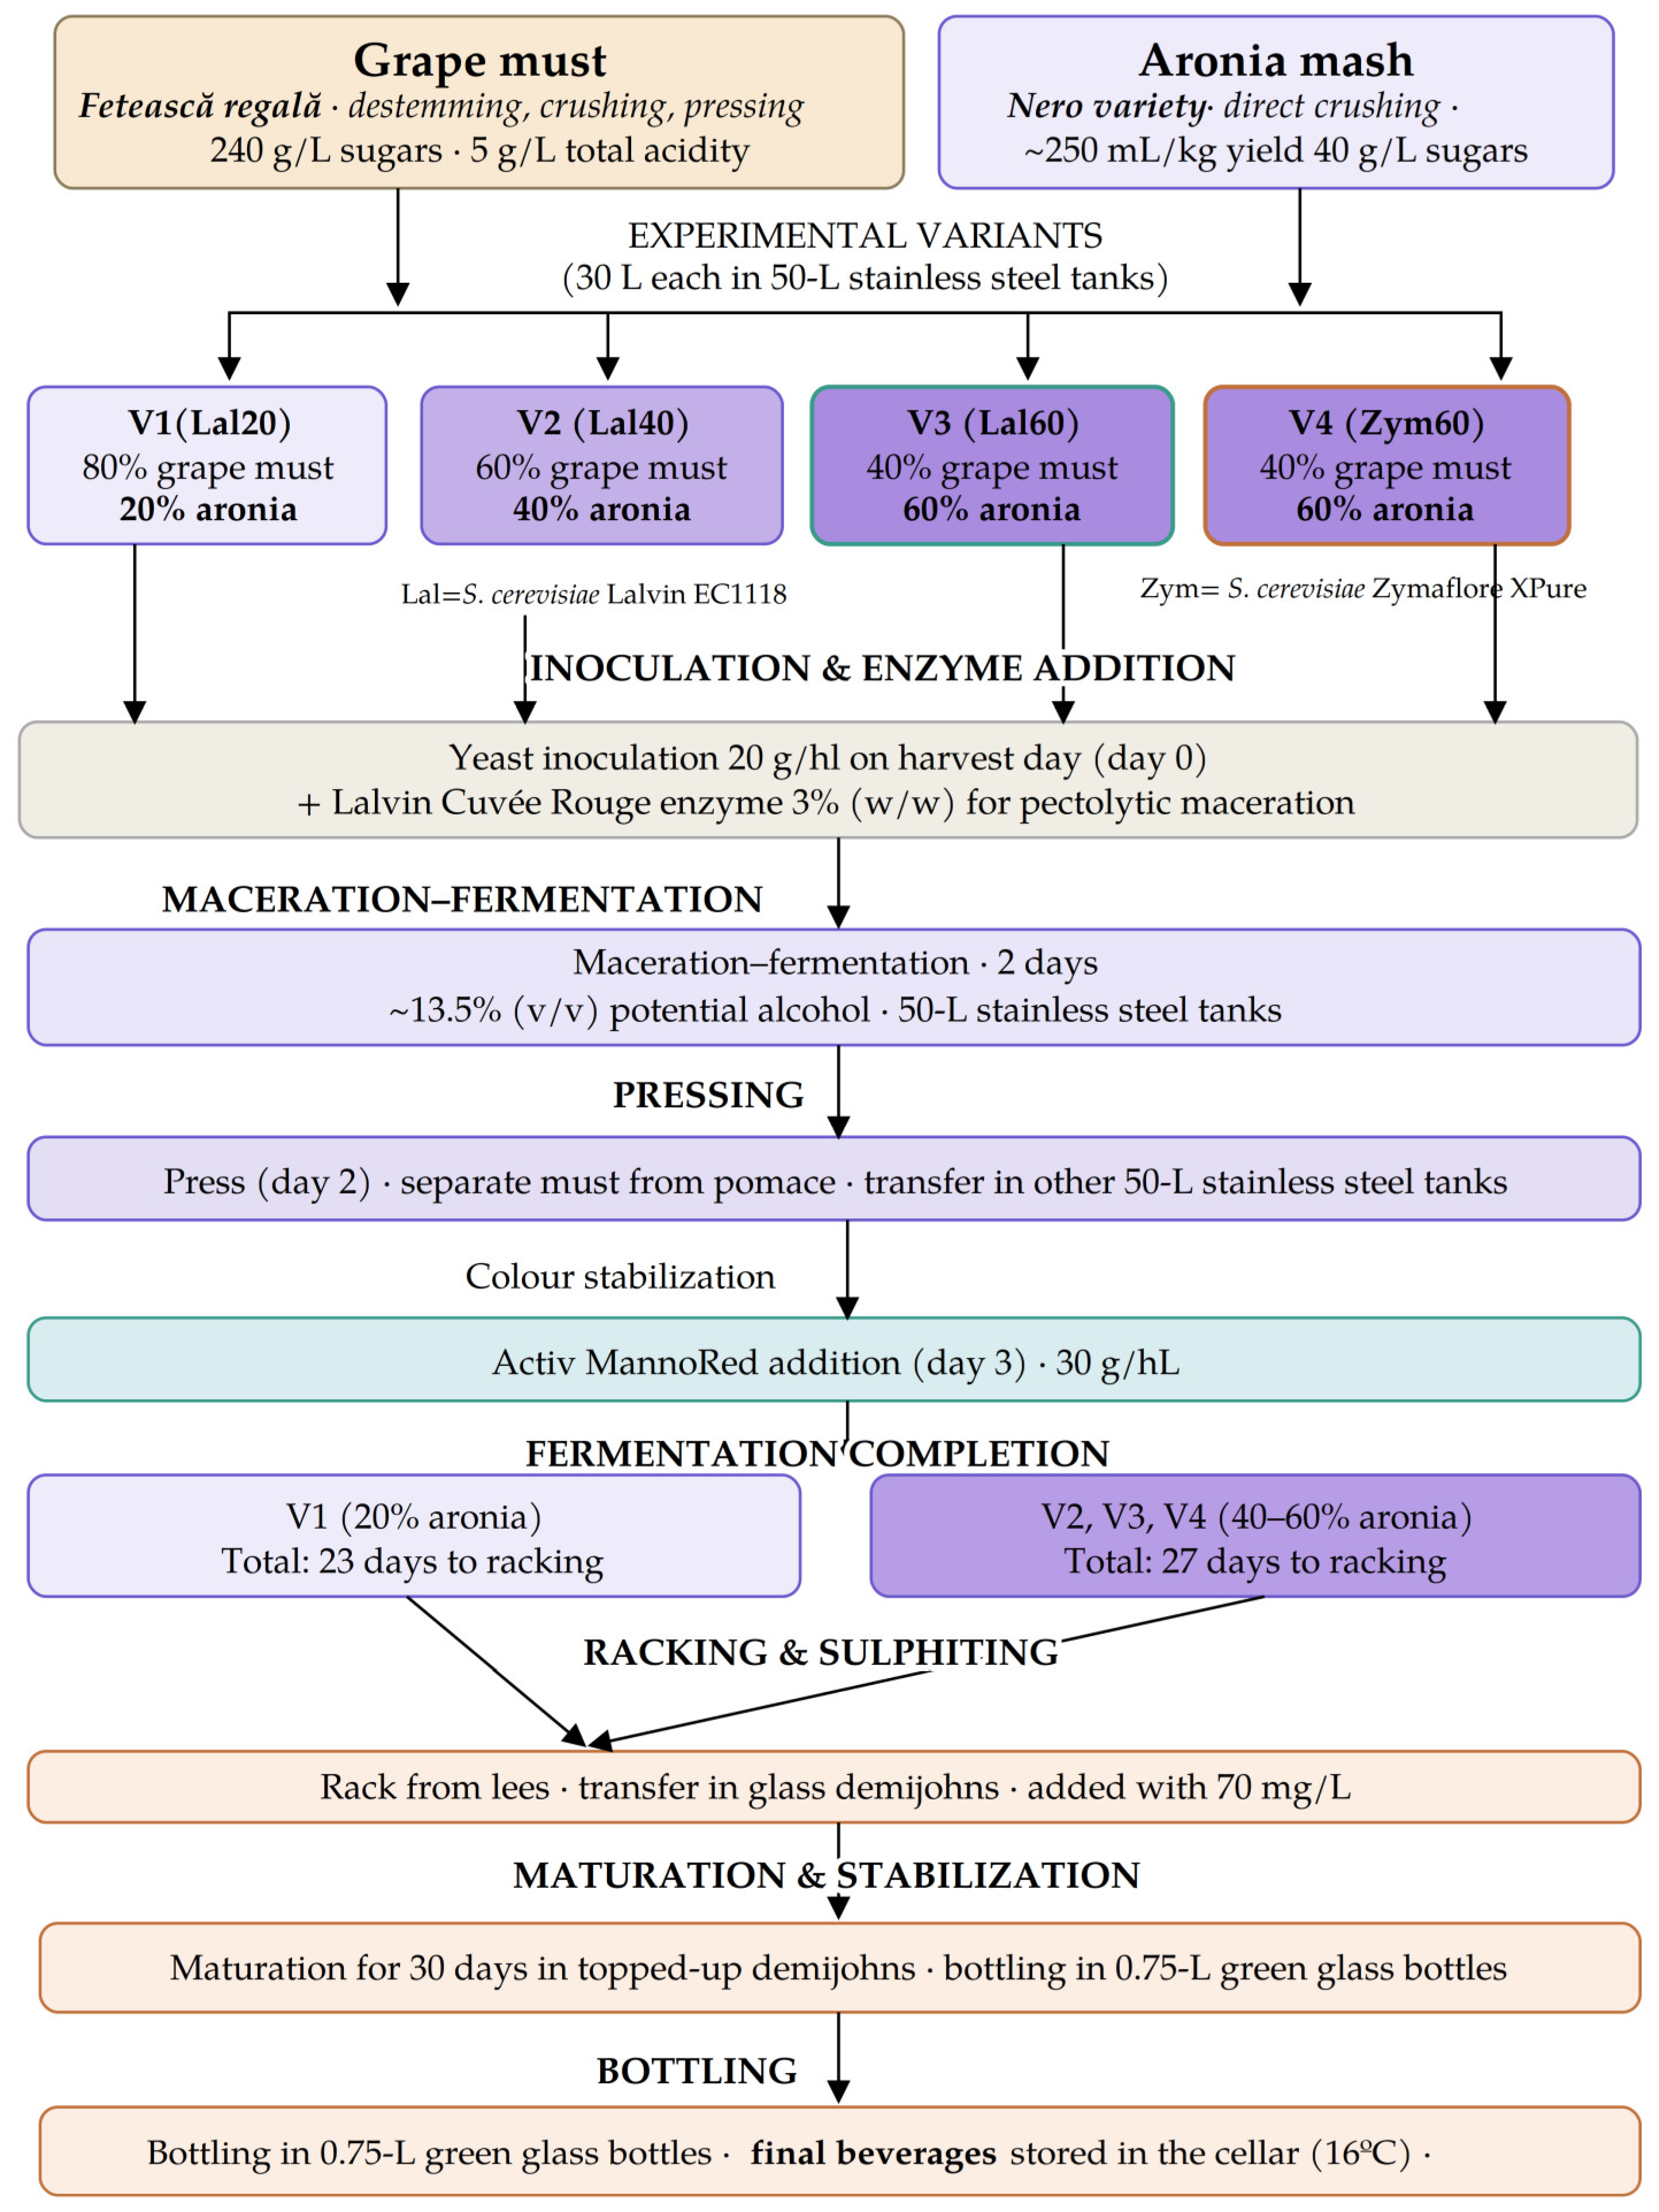
Experimental variants consisting of 30 L mixtures of grape must and aronia mash were prepared in triplicate in glass demijohns according to Table 1. The variants were coded V1–V4 or Lal20, Lal40, Lal60, and Zym60, where the letters indicate the Saccharomyces cerevisiae yeast strain used for inoculation (Lalvin or Zymaflore) and the numbers represent the proportion of aronia mash in the mixture.
Table 1.
Preparation of experimental variants of grape and aronia fermented beverages.
No control containing grape must without aronia mash was included, as its fermentation would have resulted in a conventional white wine produced exclusively from Fetească regală grapes, whereas all aronia–grape beverages were red.
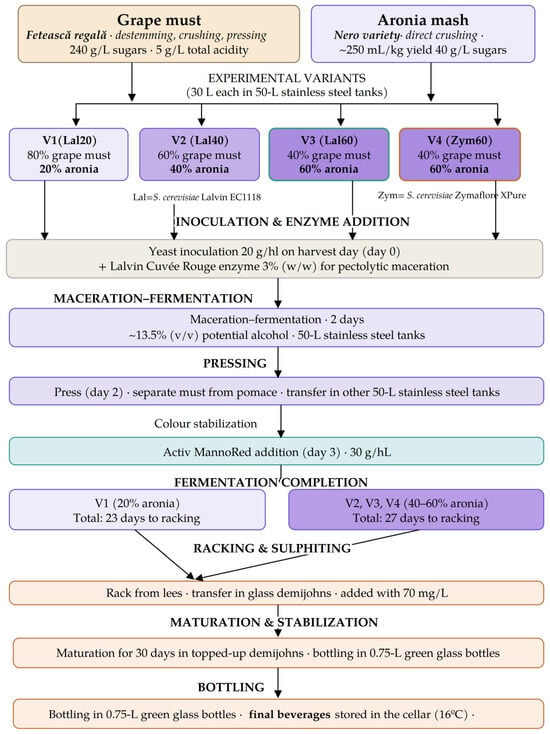
Figure 1 presents the technological workflow from the initial processing stages up to bottling.
Figure 1.
Technological scheme for the production of aronia-based beverages.
Following preparation of the grape must–aronia mixtures, fermentable sugar concentrations were 227.6, 209.8, and 181.5 g/L for the variants containing 20%, 40%, and 60% aronia mash, respectively. To standardize the sugar concentration among the variants, samples with lower sugar levels were corrected using a 30% sucrose solution, resulting in additions of 18 g/L sucrose for the 40% aronia variant and 46.1 g/L sucrose for the 60% aronia variants. The corrected sugar concentration corresponded to a potential alcoholic strength of approximately 13.5% (v/v). No acidity correction was performed.
Yeast inoculation was performed on the same day of harvest using Lalvin EC1118 (Lallemand, Canada) for variants V1–V3 and Zymaflore XPure (Laffort, Floirac, France) for variant V4, at a dose of 20 g/hL. Lalvin Cuvée Rouge enzyme preparation (Lallemand, Toronto, ON, Canada) was added at 3% (w/v), and maceration–fermentation was allowed to proceed for 2 days before pressing. The separated musts were subsequently fermented until completion. One day after pressing, ActiveManno Red (Lafood, Fasano, Italy) was added at a dose of 30 g/hL for mainly to help colour stabilization, but also for reduction in astringency and bitterness, colloidal and tartrate stabilization.
Maceration and fermentation were carried out in 50 L stainless-steel tanks equipped with floating lids for volume adjustment. The beverages were macerated on the aronia skins for 2 days, after which the fermenting must was separated from the solid particles. The total fermentation time, from inoculation to racking off the lees, was 23 days for V1 (20% aronia) and 27 days for the variants containing 40% and 60% aronia. After racking, the beverages were transferred to glass demijohns, sulphited with 70 mg/L SO2 and kept topped up for about 30 days for maturation and stabilization. They were then bottled in 0.75 L green glass bottles closed with natural cork stoppers.
2.2. Analysis of Beverages
The main physicochemical parameters were determined according to standard methods for wine analysis from the International Organisation of Vine and Wine compendium, OIV 2022 [32] and Romanian standard methods for the wine industry from the Romanian National Standardization Body-ASRO, which are fully harmonized with the European Commission Regulations (EC) No 1293/2005 [33] and (EC) No 606/2009 [34]. The parameters determined were as follows: alcoholic strength (% v/v) through the simple distillation method (STAS 6182/6–70), reducing sugars (glucose + fructose, g/L) were determined using the Scholl iodometric method (SR 6182-18:2009), titratable acidity (g/L) through volumetric titrimetry with bromthiomol blue as indicator (STAS 6182-1:2008), volatile acidity (g/L acetic acid) by using the titrimetric method with phenolphthalein as indicator (SR 6182-2:2008), pH, free SO2 (mg/L) and total SO2 (mg/L) by the direct dosage iodometric method (SR 6182-13:2009), total dry extract (g/L) (STAS 6182/9-80), density (g/L) (STAS 6182/8-71).
Sensory analysis was performed by a panel of 12 volunteers recruited from among the students enrolled in the Master’s programme in viticulture and wine technologies at the University of Agronomic Sciences and Veterinary Medicine of Bucharest. The panel was led by the first author. Prior to the sensory sessions, informed consent was obtained. The participants received detailed instructions regarding the experimental protocol, the characteristics of the samples and the evaluation sheets used for sensory assessment.
The panelists were instructed to evaluate the samples independently according to the methodology developed in our laboratory. As is standard practice for sensory evaluation of alcoholic beverages, participants were instructed not to swallow the samples after oral assessment. To minimize potential bias associated with preconceived expectations regarding conventional wines, the participants were informed about the technological aspects of sample production and were asked to assess the products exclusively on the basis of their sensory characteristics, rather than against the sensory profile of conventional wines.
All sensory sessions were conducted under controlled conditions in accordance with ISO 8589:2007 [35] and ISO 6658:2017 [36]. Prior to the formal evaluation, panellists underwent training sessions for the wine sensory analysis to standardize the recognition and use of sensory descriptors, particularly for appearance, aroma, taste, and mouthfeel. Reference samples and guided discussions were used to establish a common understanding of the sensory attributes and scoring procedure. Panel performance was monitored during the training and evaluation sessions to assess consistency and the ability to discriminate among samples.
To ensure confidentiality, no personally identifiable information was retained after completion of the sensory analysis, and all results were processed and reported anonymously.
For sensory analysis, although each beverage variant was prepared in triplicate, a composite sample was presented to the panel. Following preliminary sensory screening by the panel leader, which confirmed no relevant sensory differences among the replicates, equal proportions of the three replicates were pooled for each variant to minimize panelist fatigue.
The assessment was conducted using wine-tasting glasses conforming to ISO 3591:1977 [37], with standardized score sheets provided to each participant.
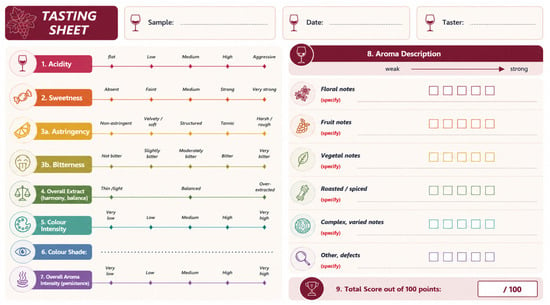
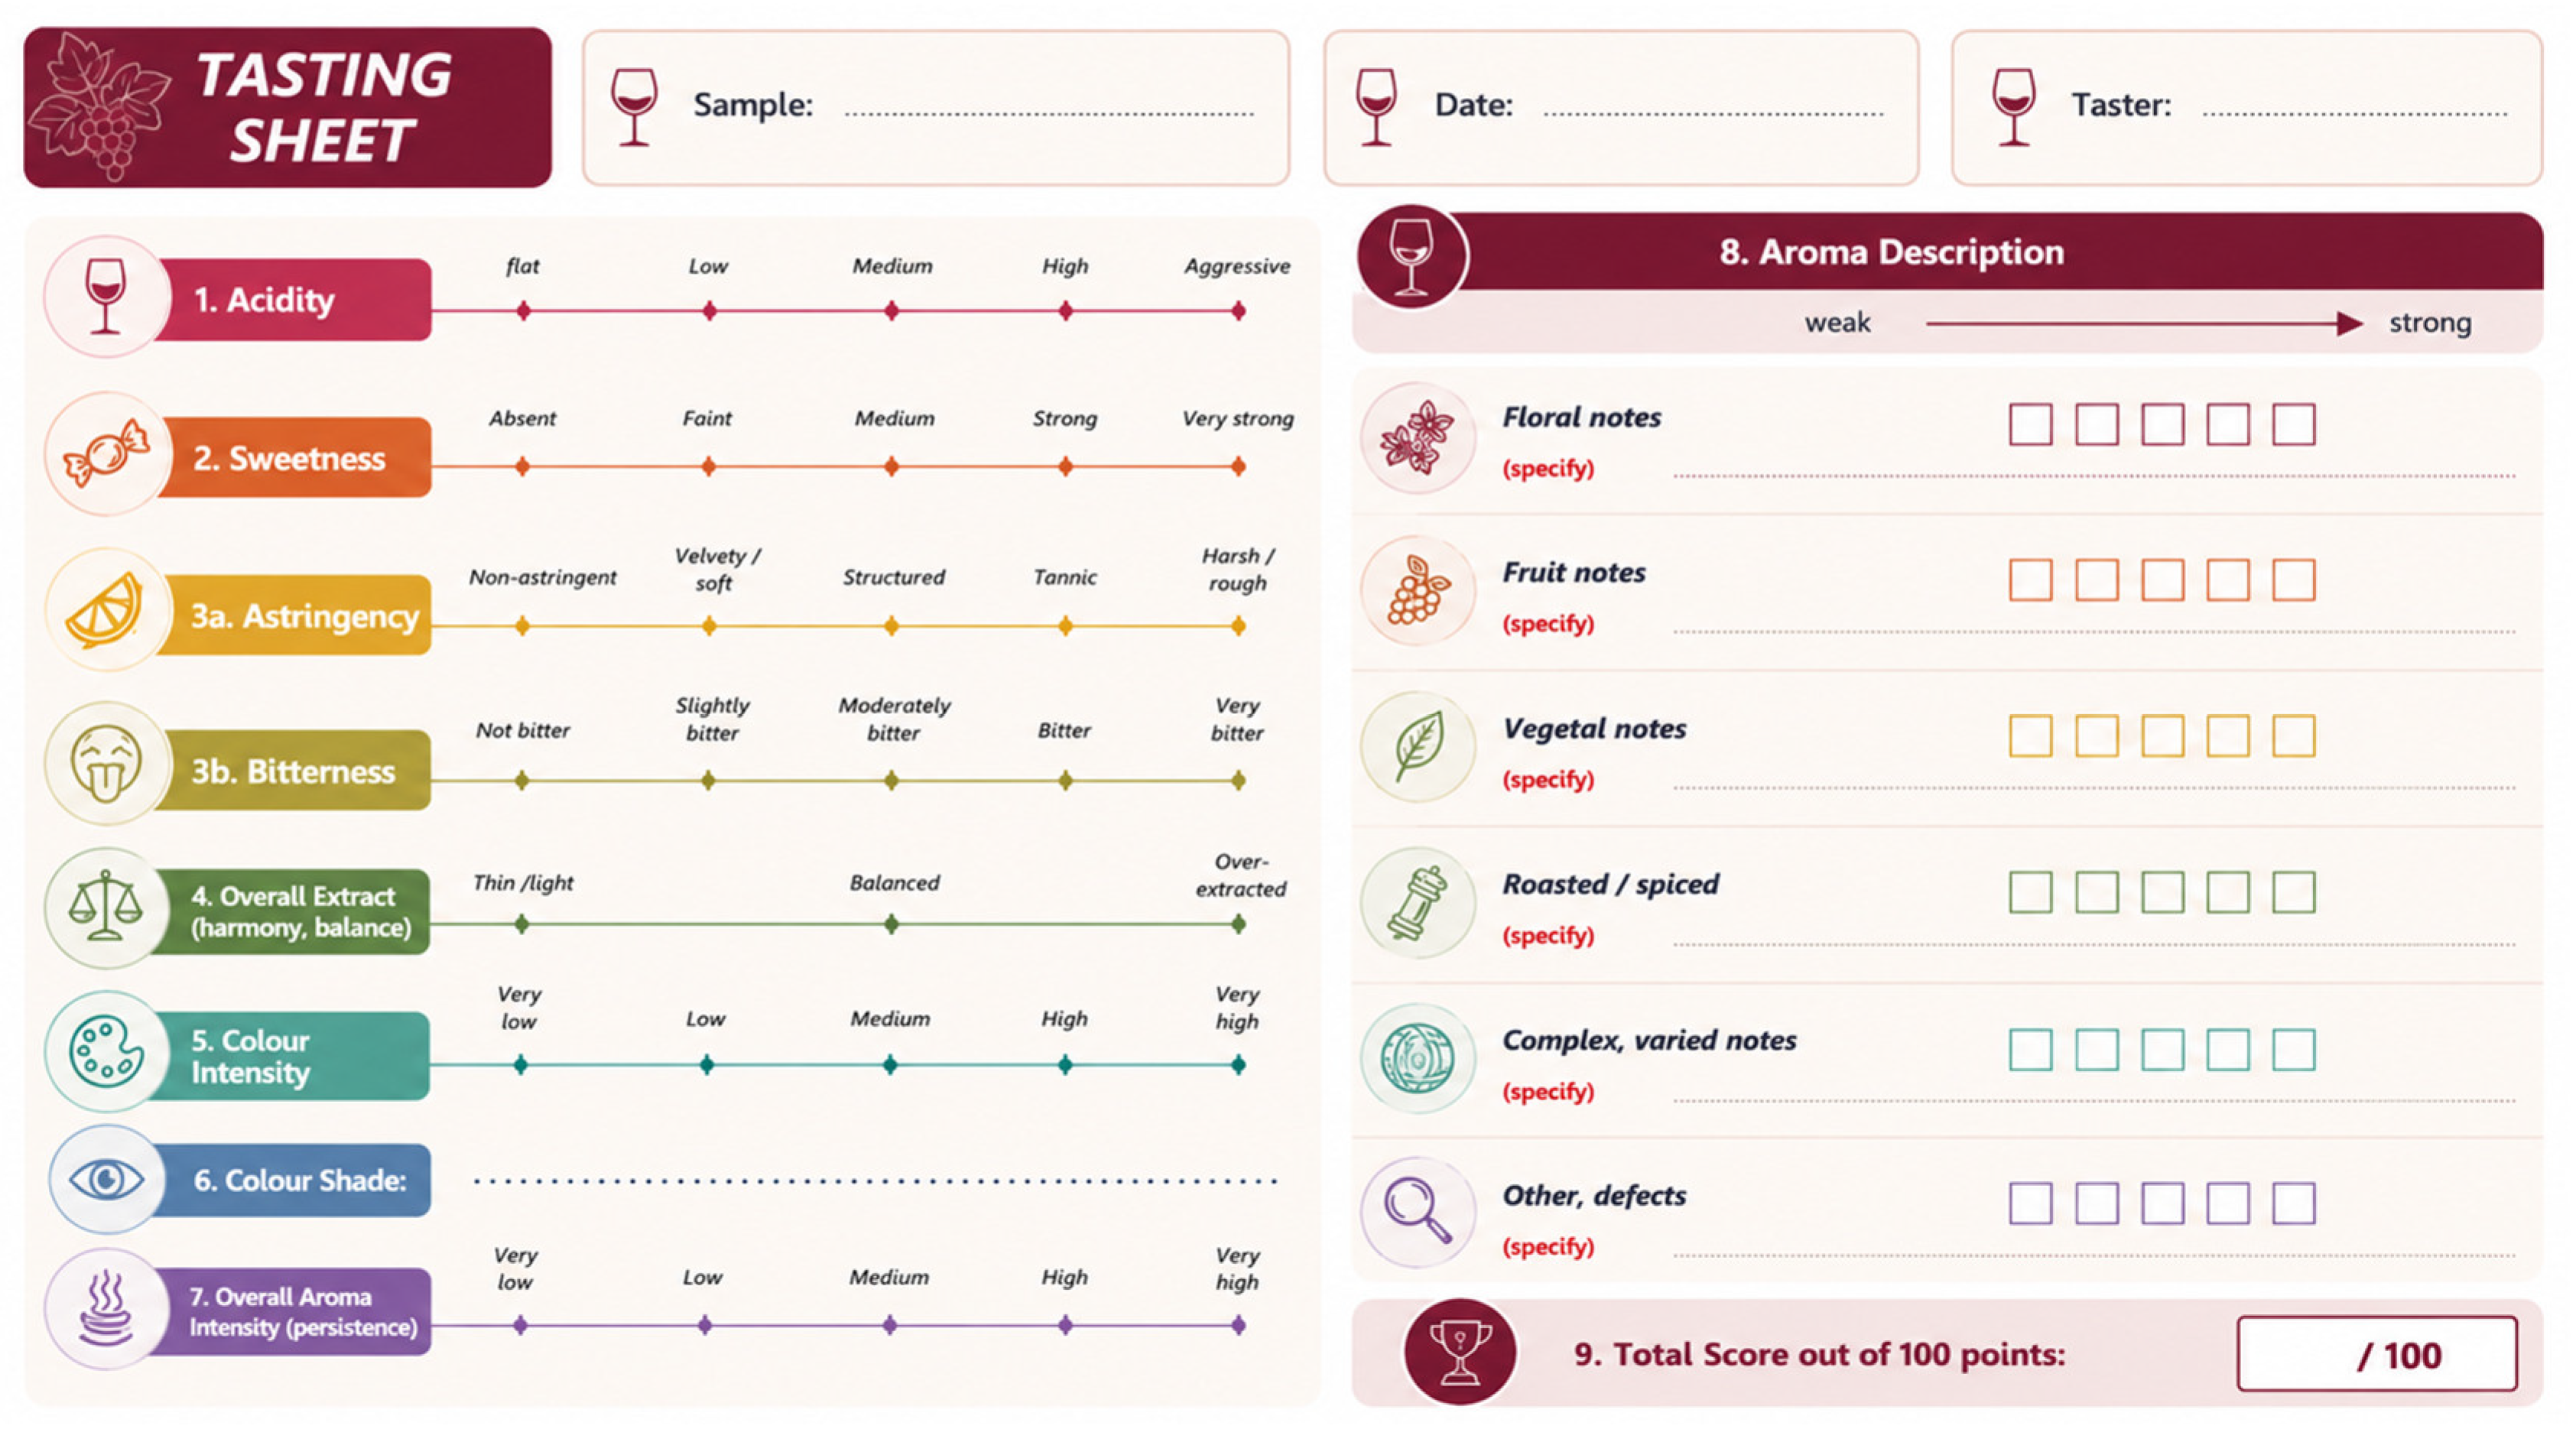
The evaluation sheet used for sensory assessment was developed in our laboratory for wine profiling [38]. The sheet (Figure 2) included 10-point intensity scales for acidity, sweetness, astringency, bitterness, overall extract, colour intensity and overall aroma intensity. The score sheets were provided in paper format, with 10 cm linear scales on which tasters marked the perceived intensity of each characteristic. The marked values were subsequently converted to scores ranging from 0 to 10 by direct measurement with a ruler.
Figure 2.
Tasting sheet used for wine profile sensory evaluation (adapted by Antoce from ©Antoce and Nămoloşanu, 2007 [38]).
Aroma profiling was performed using discontinuous intensity scales (Figure 2) for the following aroma categories: floral notes, fruity, vegetal, spicy/roasted, complexity and defects/other aromas. The discontinuous scales comprised five intensity levels, ranging from 1 (least intense) to 5 (most intense), and were subsequently multiplied by two to obtain values on a 10-point scale. In addition, each taster was asked to freely describe the specific aromas identified on the score sheet. Aroma descriptors with the highest citation frequency among the tasters were retained for further characterization of the beverages.
The resulting sensory profiles were represented as radar charts generated using Microsoft Excel Professional Plus 2019 (Microsoft Corporation, Redmond, WA, USA).
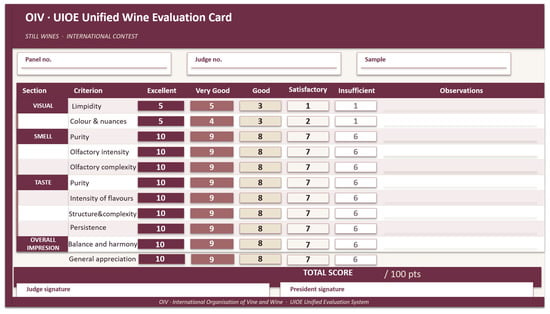
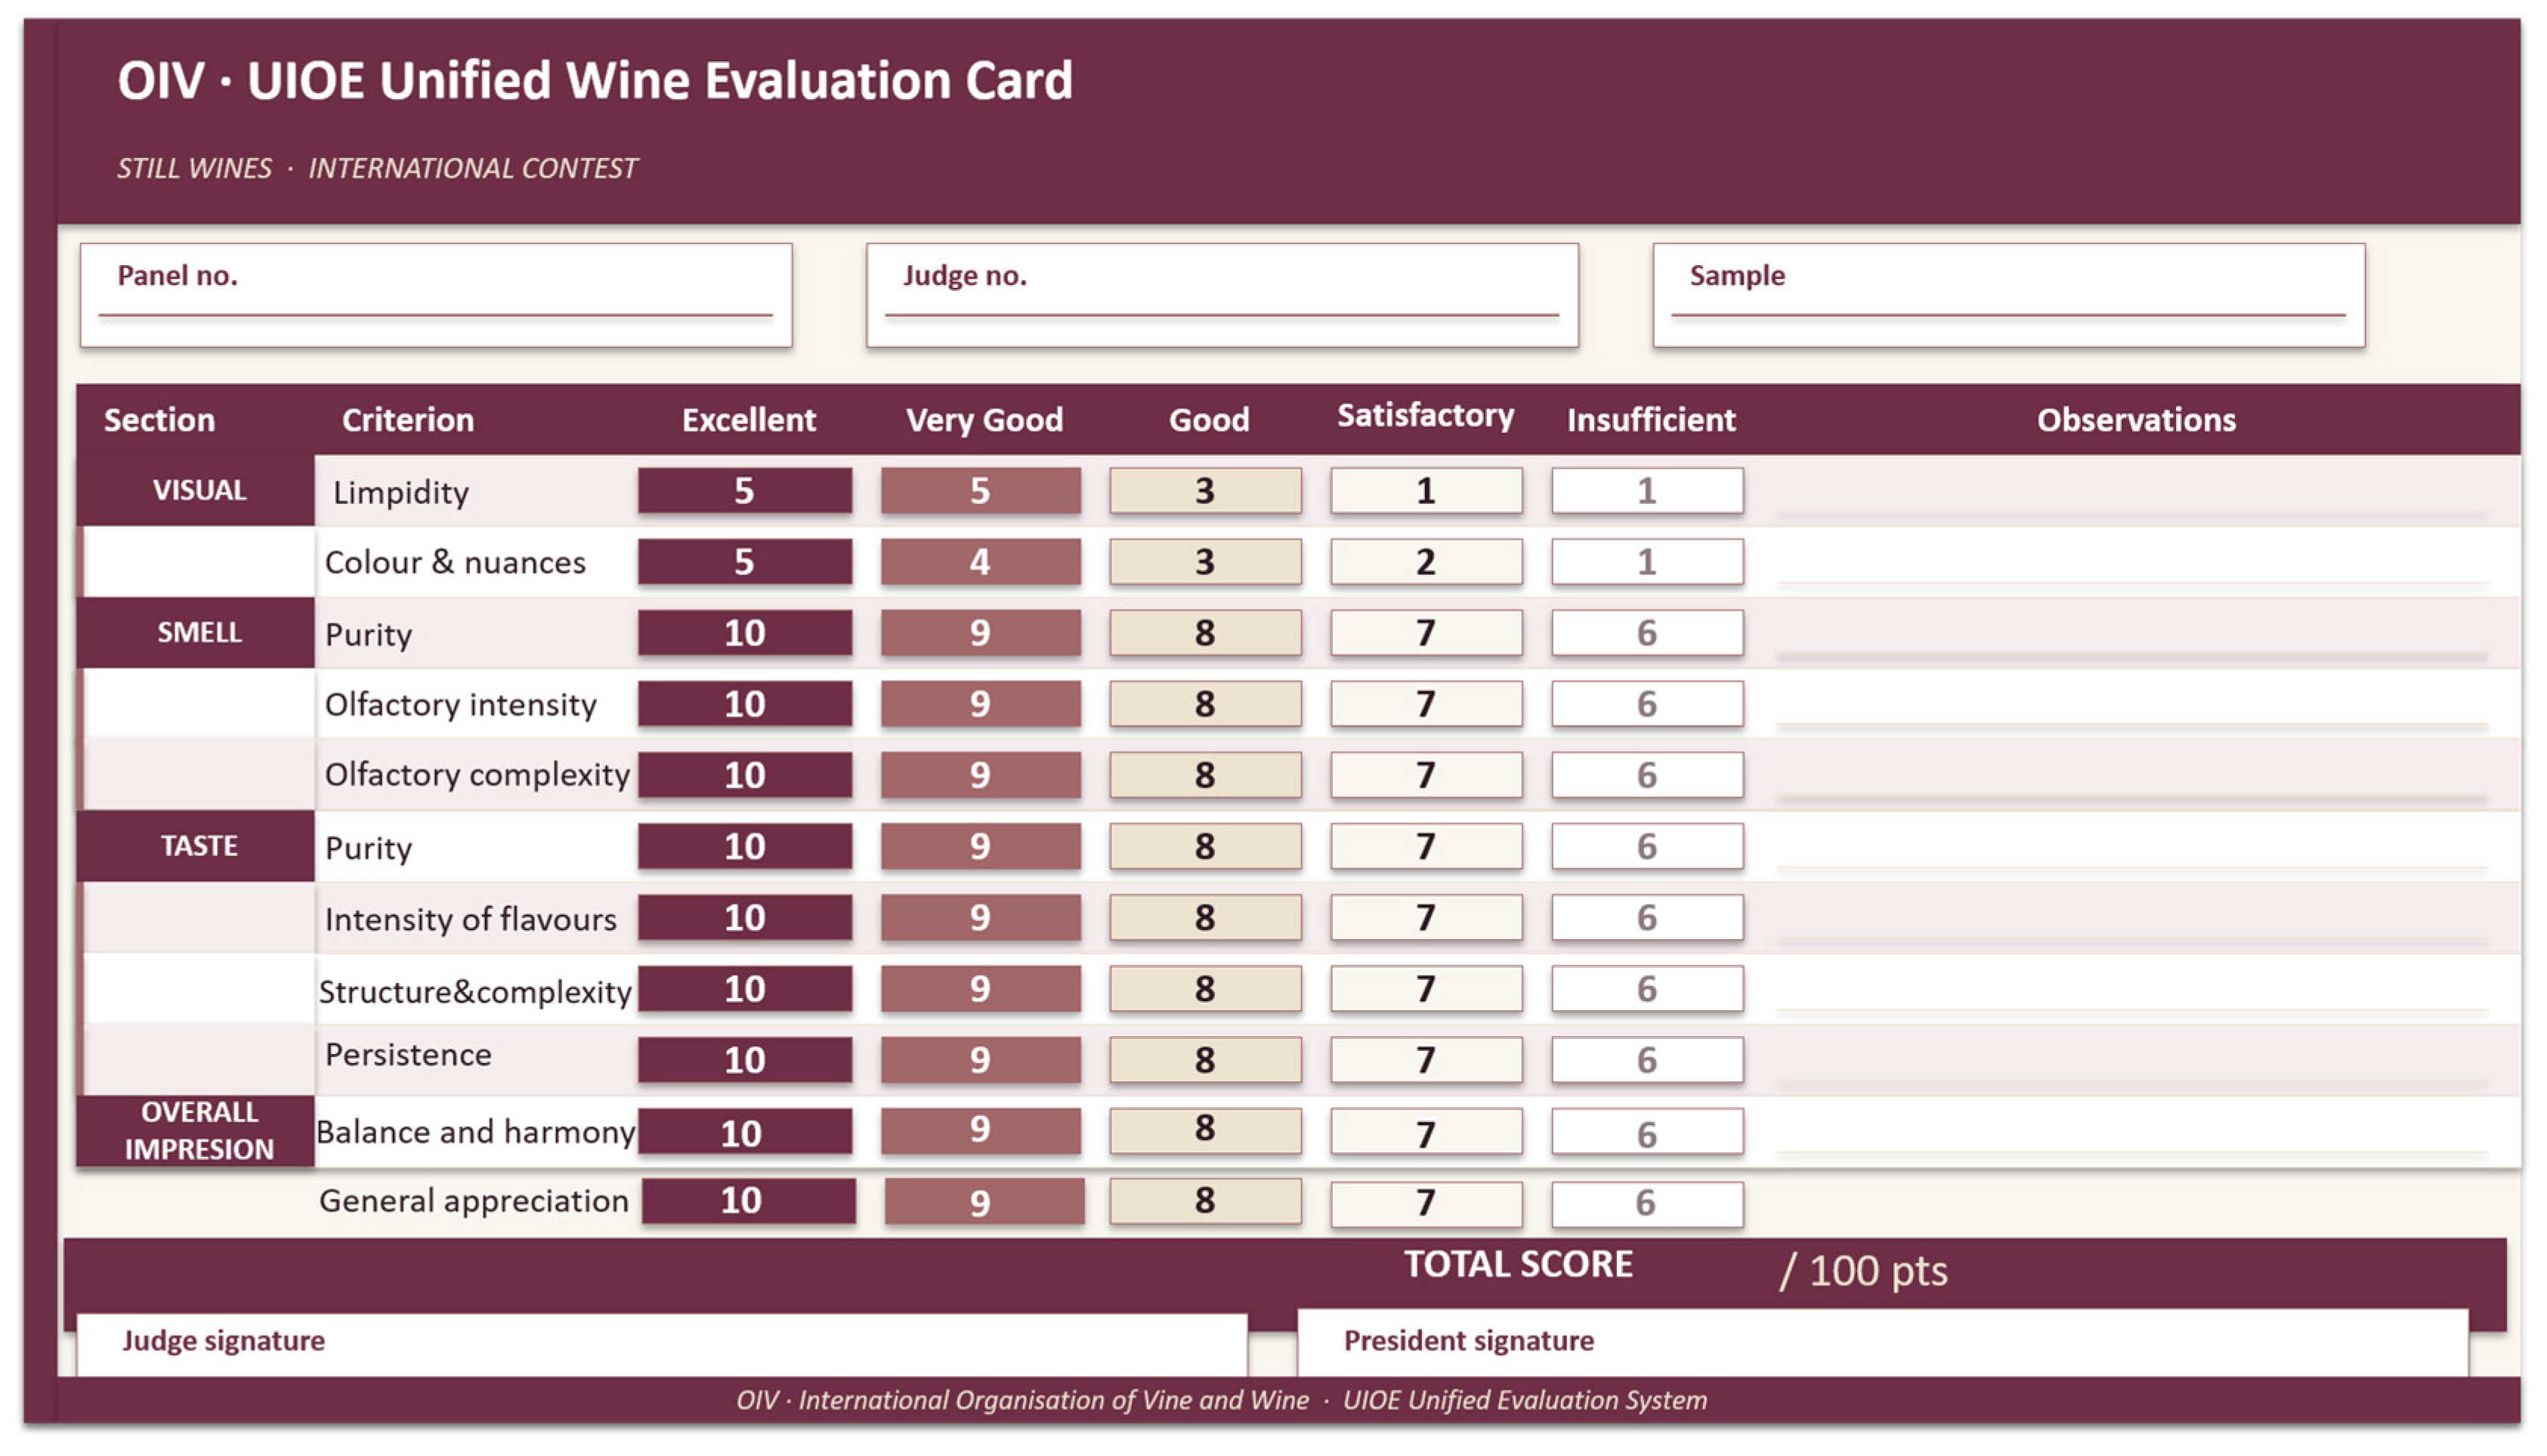
The wines were also evaluated using the 100-point scoring system of the OIV–UIOE unified wine evaluation card (Figure 3) [39]. This standardized sensory assessment sheet for still wines evaluates four main attributes: visual, smell, taste and overall impression. The assessment includes predefined criteria such as limpidity and appearance for visual characteristics; purity, intensity and quality for smell; purity, intensity, structure and complexity, and persistence for taste; and overall evaluation for balance, harmony and the general appreciation. Each criterion is rated according to five quality levels, ranging from Excellent to Insufficient, with weighted scores contributing to a maximum total of 100 points. The sheet also provides fields for panel and judge identification, sample information, observations and signatures. The final scores were also added on the same tasting sheets used for the sensory profiling presented in Figure 2.
Figure 3.
100-Point wine evaluation scoresheet (Adapted from Resolution OIV-OENO 671A-2025, ©OIV, 2025 [39]).
Statistical analyses were performed using Origin 2024 (OriginLab, Northampton, MA, USA). Depending on the characteristics of the dataset, different statistical methods were applied. Principal component analysis (PCA) was performed on the sensory data to reduce data dimensionality and identify the main aroma descriptors associated with the aromatic profiles of the studied varieties. Differences among the experimental samples were assessed using one-way analysis of variance (ANOVA) for normally distributed data or the non-parametric one-way ANOVA on ranks when the assumption of normality was not met, as determined by the Shapiro–Wilk normality test. For datasets analyzed by ANOVA, Tukey’s post hoc test was used for multiple comparisons. Differences were considered statistically significant at p < 0.05 and are indicated by different letters. Hierarchical cluster analysis (HCA) and heat map visualization were also performed to further explore similarities and differences among the samples.
3. Results and Discussion
3.1. Main Physicochemical Analysis of Beverages
The beverages obtained by fermenting the grape must–aronia fruit mixtures were analysed approximately two months after harvest and initiation of the production process, following fermentation and about 30 days of maturation and stabilization, and after separation of the solid fractions. The main physicochemical parameters of the resulting fermented beverages are presented in Table 2.
Table 2.
Physico-chemical analyses of the fermented beverages produced from white grape must enriched with crushed aronia fruits determined two months after harvest.
Because the initial sugar concentration was standardized among all variants, major differences in alcoholic strength were not expected. Nevertheless, the yeast strain influenced fermentation performance. The variant fermented with Zymaflore XPure showed a slightly lower alcoholic strength (11.8% v/v) compared with the similar variant fermented with Lalvin EC-1118 (12.0% v/v), consistent with the known high fermentation capacity and ethanol tolerance of the latter strain. Nevertheless, the proportion of aronia mash appeared to have a greater influence on the final alcoholic strength than the yeast strain, with beverages containing lower proportions of aronia generally exhibiting higher alcohol levels. This trend may be related, at least in part, to the inhibitory effect of the higher polyphenolic content [40,41] associated with increasing proportions of aronia mash, although the present study did not directly assess the effects of polyphenols on yeast fermentation performance.
Conversely, residual glucose and fructose concentrations increased with the proportion of aronia fruit in the fermenting mash, suggesting a partial inhibitory effect of the elevated polyphenol content on yeast fermentation activity. Correspondingly, total dry extract values also increased with increasing aronia addition.
Although pH and volatile acidity were not significantly affected by the formulation, total acidity of the samples increased progressively with increasing proportions of aronia fruit in the mash (Table 1). This finding is consistent with the naturally higher acidity of aronia fruit, in which malic acid is a major organic acid, compared with grape must, where tartaric acid generally predominates. The same trend was observed in the fermented beverages (Table 2). The relatively higher contribution of malic acid in the aronia-containing beverages may have contributed to the persistence of their higher total acidity, as malic acid is not typically removed through the precipitation of tartrate salts during wine stabilization to the same extent as tartaric acid.
However, a subsequent decrease in total acidity was observed after six months of storage. Compared with the values recorded two months after fermentation (Table 2), total acidity decreased by approximately 1.0 g/L in V1 and by approximately 1.5 g/L in the beverages containing higher proportions of aronia, reaching 4.8, 5.5, 6.8, and 6.7 g/L, expressed as tartaric acid equivalents, for V1, V2, V3, and V4, respectively. This decrease may be associated with the progressive precipitation of tartaric acid salts and other stabilization-related processes occurring during storage, potentially including malolactic fermentation.
The analytical characterization of the experimental beverages was limited to routine parameters commonly included in analytical reports for commercialization and quality control. Accordingly, colour parameters and total polyphenol content were not determined, as these analyses were beyond the scope of the present study.
3.2. Sensory Analysis of Beverages
3.2.1. Sensory Perception of the Main Parameters
Sensory analysis of the main evaluated parameters (Table 3) indicated that perceived sweetness and acidity did not differ significantly among the beverages, irrespective of aronia proportion. This finding contrasts with the differences observed in the corresponding instrumental measurements, suggesting that the physicochemical variations in these parameters were not sufficiently pronounced to result in significant differences in their sensory perception.
Table 3.
Sensory perception of the main parameters (mean ± standard deviation).
In contrast, clear differences were observed for astringency, bitterness, mouthfeel, and colour intensity. The highest intensities for these attributes were recorded in the beverages containing 60% aronia, regardless of the yeast strain used. Intermediate values were observed for the 40% aronia variants, while the lowest values were associated with the 20% aronia samples, confirming the strong influence of aronia polyphenols on these sensory characteristics.
Aroma intensity was also perceived as highest in the beverages containing 60% aronia (V3 and V4). Fermentation with Zymaflore XPure (V4) resulted in a slightly higher aroma intensity compared with Lalvin EC-1118 (V3), although the difference was not statistically significant. The lowest aroma intensity was recorded in the variants with the lowest proportion of aronia addition.
3.2.2. Sensory Perception of the Aroma Parameters
Aroma intensity does not necessarily indicate that higher proportions of aronia lead to a superior beverage but rather reflects its overall influence on the aromatic profile. The extent to which aronia addition has a positive or negative impact on aroma quality was evaluated by considering the individual aroma attributes and their sensory perception (Table 4).
Table 4.
Perception of sensory aroma parameters (mean values ± standard deviations) and overall score evaluated using the OIV evaluation sheet.
Among the main aroma categories, floral notes, spiciness, complexity, and vegetal aromas did not differ significantly at p = 0.05. Fruity aroma, however, showed a tendency to increase with aronia addition, with the lowest intensity perceived in the samples containing 20% aronia. Beyond 40% aronia addition, this effect appeared to plateau, as no statistically significant difference was observed between the 40% and 60% variants.
A similar trend was observed for the overall sensory scores based on the OIV 100-point scale. Acceptability of the aronia-beverage samples in this study is assessed based on the overall sensory evaluation obtained using the standardized OIV scoring sheet and does not imply a comparative preference assessment against conventional wine. The OIV evaluation sheet provides a structured scoring framework in which the individual sensory characteristics are scored separately. When the maximum scores corresponding to the individual characteristics are summed vertically within the “good” category, a total score of 72 is obtained, whereas the corresponding sum for the “very good” category is 86 (Figure 3). These values were therefore used as reference points for interpreting the overall sensory quality scores of the experimental beverages. The lowest score was recorded for the 20% aronia samples (73.7 points), whereas the 40% (79.6 points) and 60% (82.2 and 83.5 points) variants did not differ significantly from each other. These results suggest that increasing aronia content improves overall sensory acceptance up to a threshold, after which additional increases do not produce significant further improvement. Yeast strain did not exert a significant effect on overall sensory scores.
3.2.3. Sensory Profiles and Multivariate Data Analysis
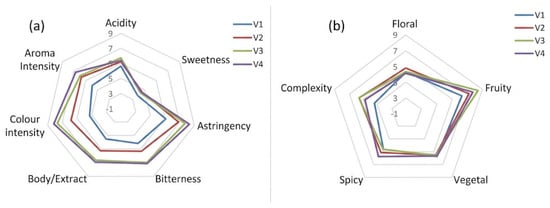
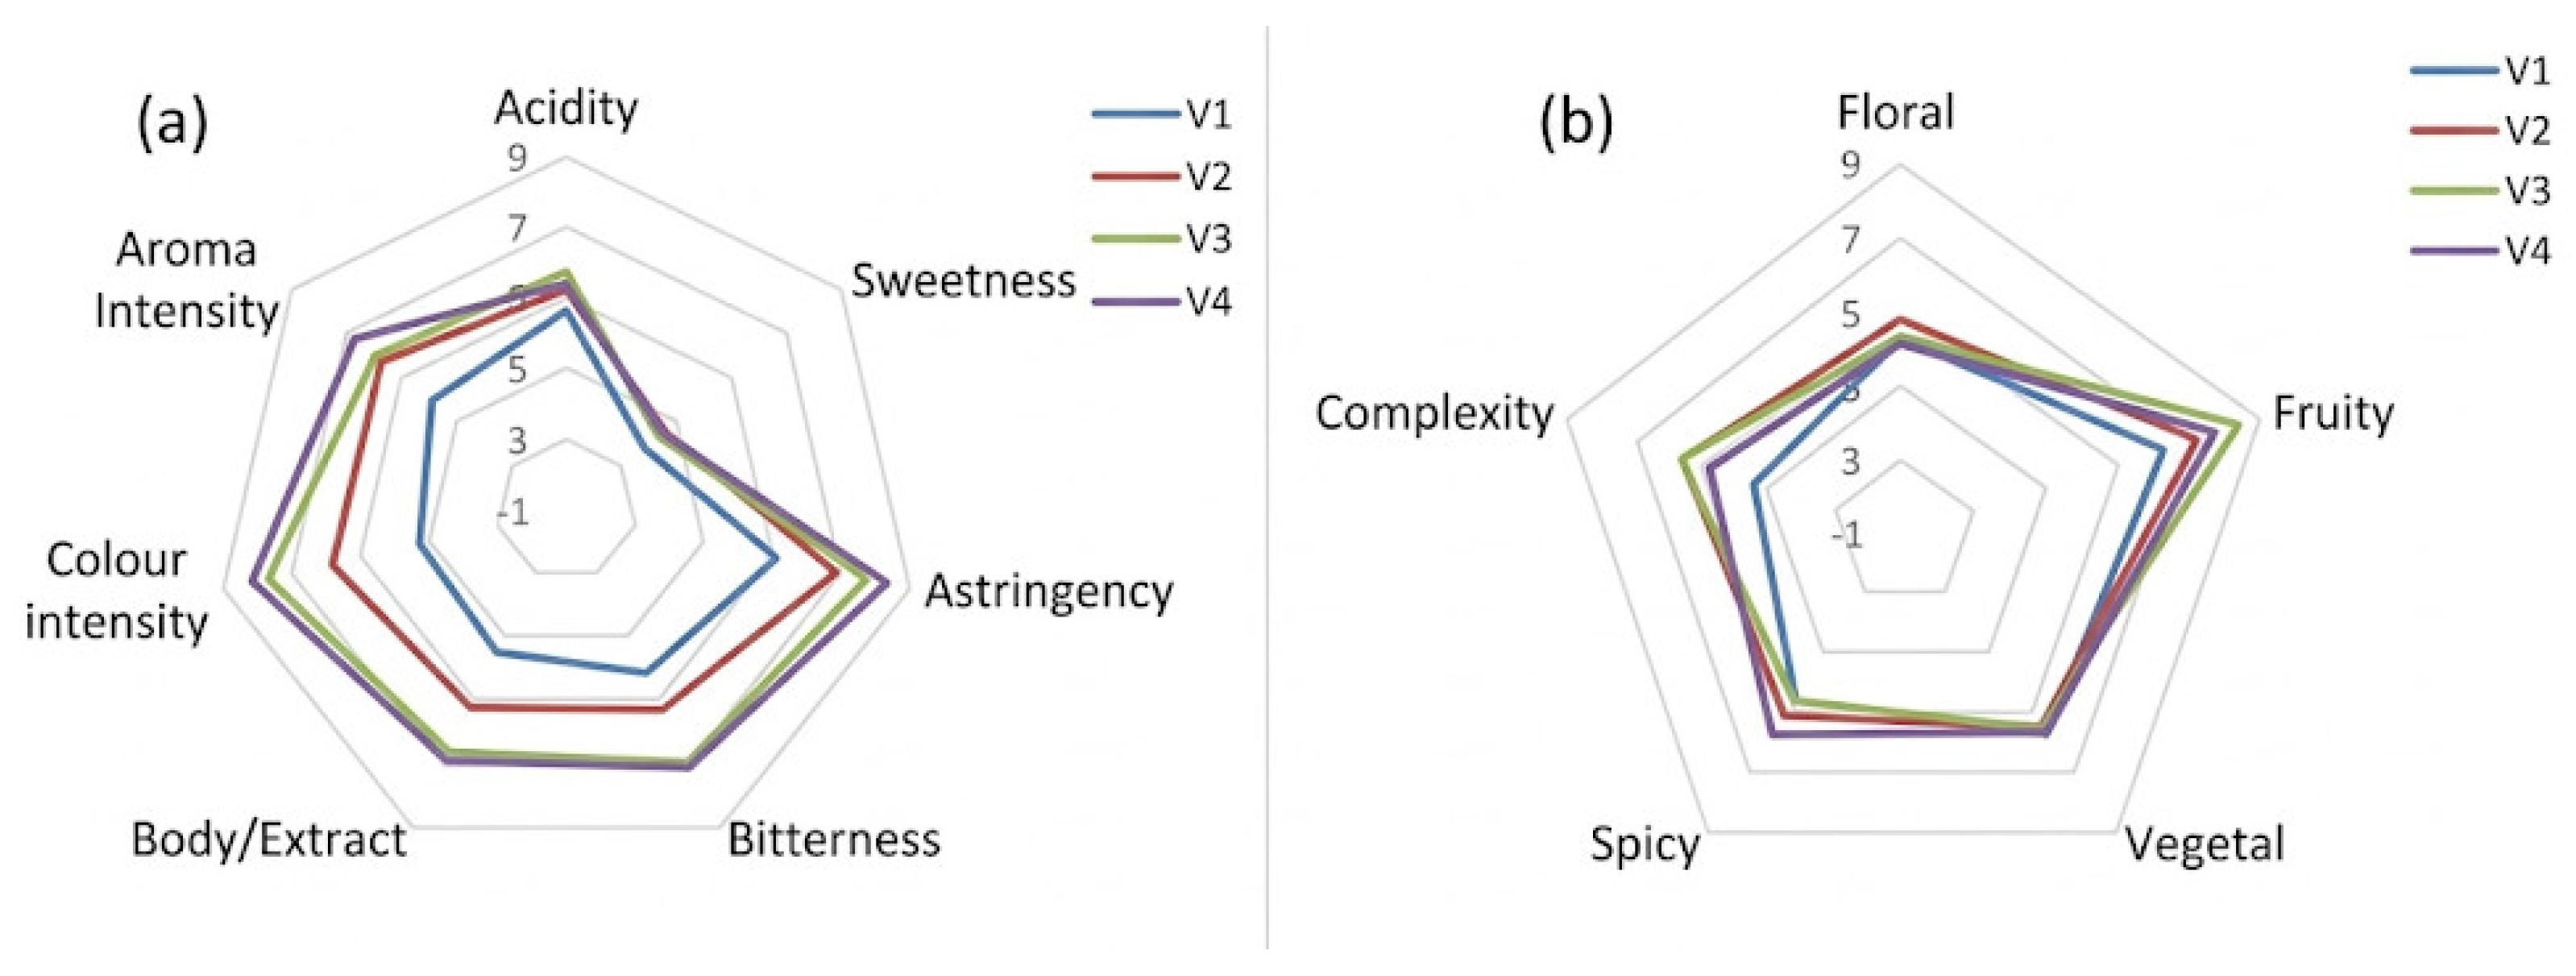
The main sensory parameters and aroma profiles of all four samples are presented in Figure 4a,b, providing a clearer overview of the effects induced by the addition of aronia mash to grape must.
Figure 4.
Mean sensory profiles: (a) Perception of main sensory parameters; (b) perception of aroma parameters for the experimental wines. V1—20% aronia with Lalvin yeast; V2—40% aronia with Lalvin yeast; V3—60% aronia with Lalvin yeast; V4—60% aronia with Zymaflore yeast.
Figure 4a,b show that variant V1 exhibited the lowest perceived intensities for many of the sensory parameters previously discussed, whereas the V3–V4 group presented the highest values, irrespective of the yeast strain used for fermentation.
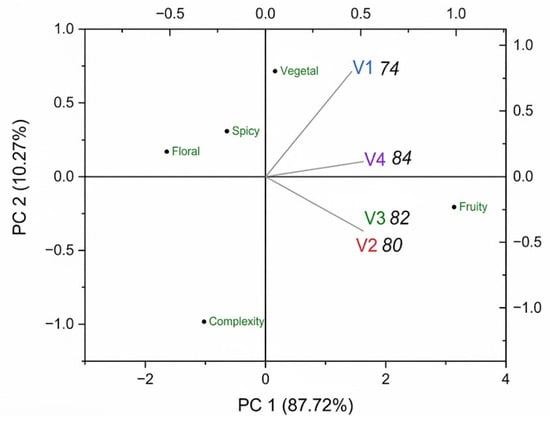
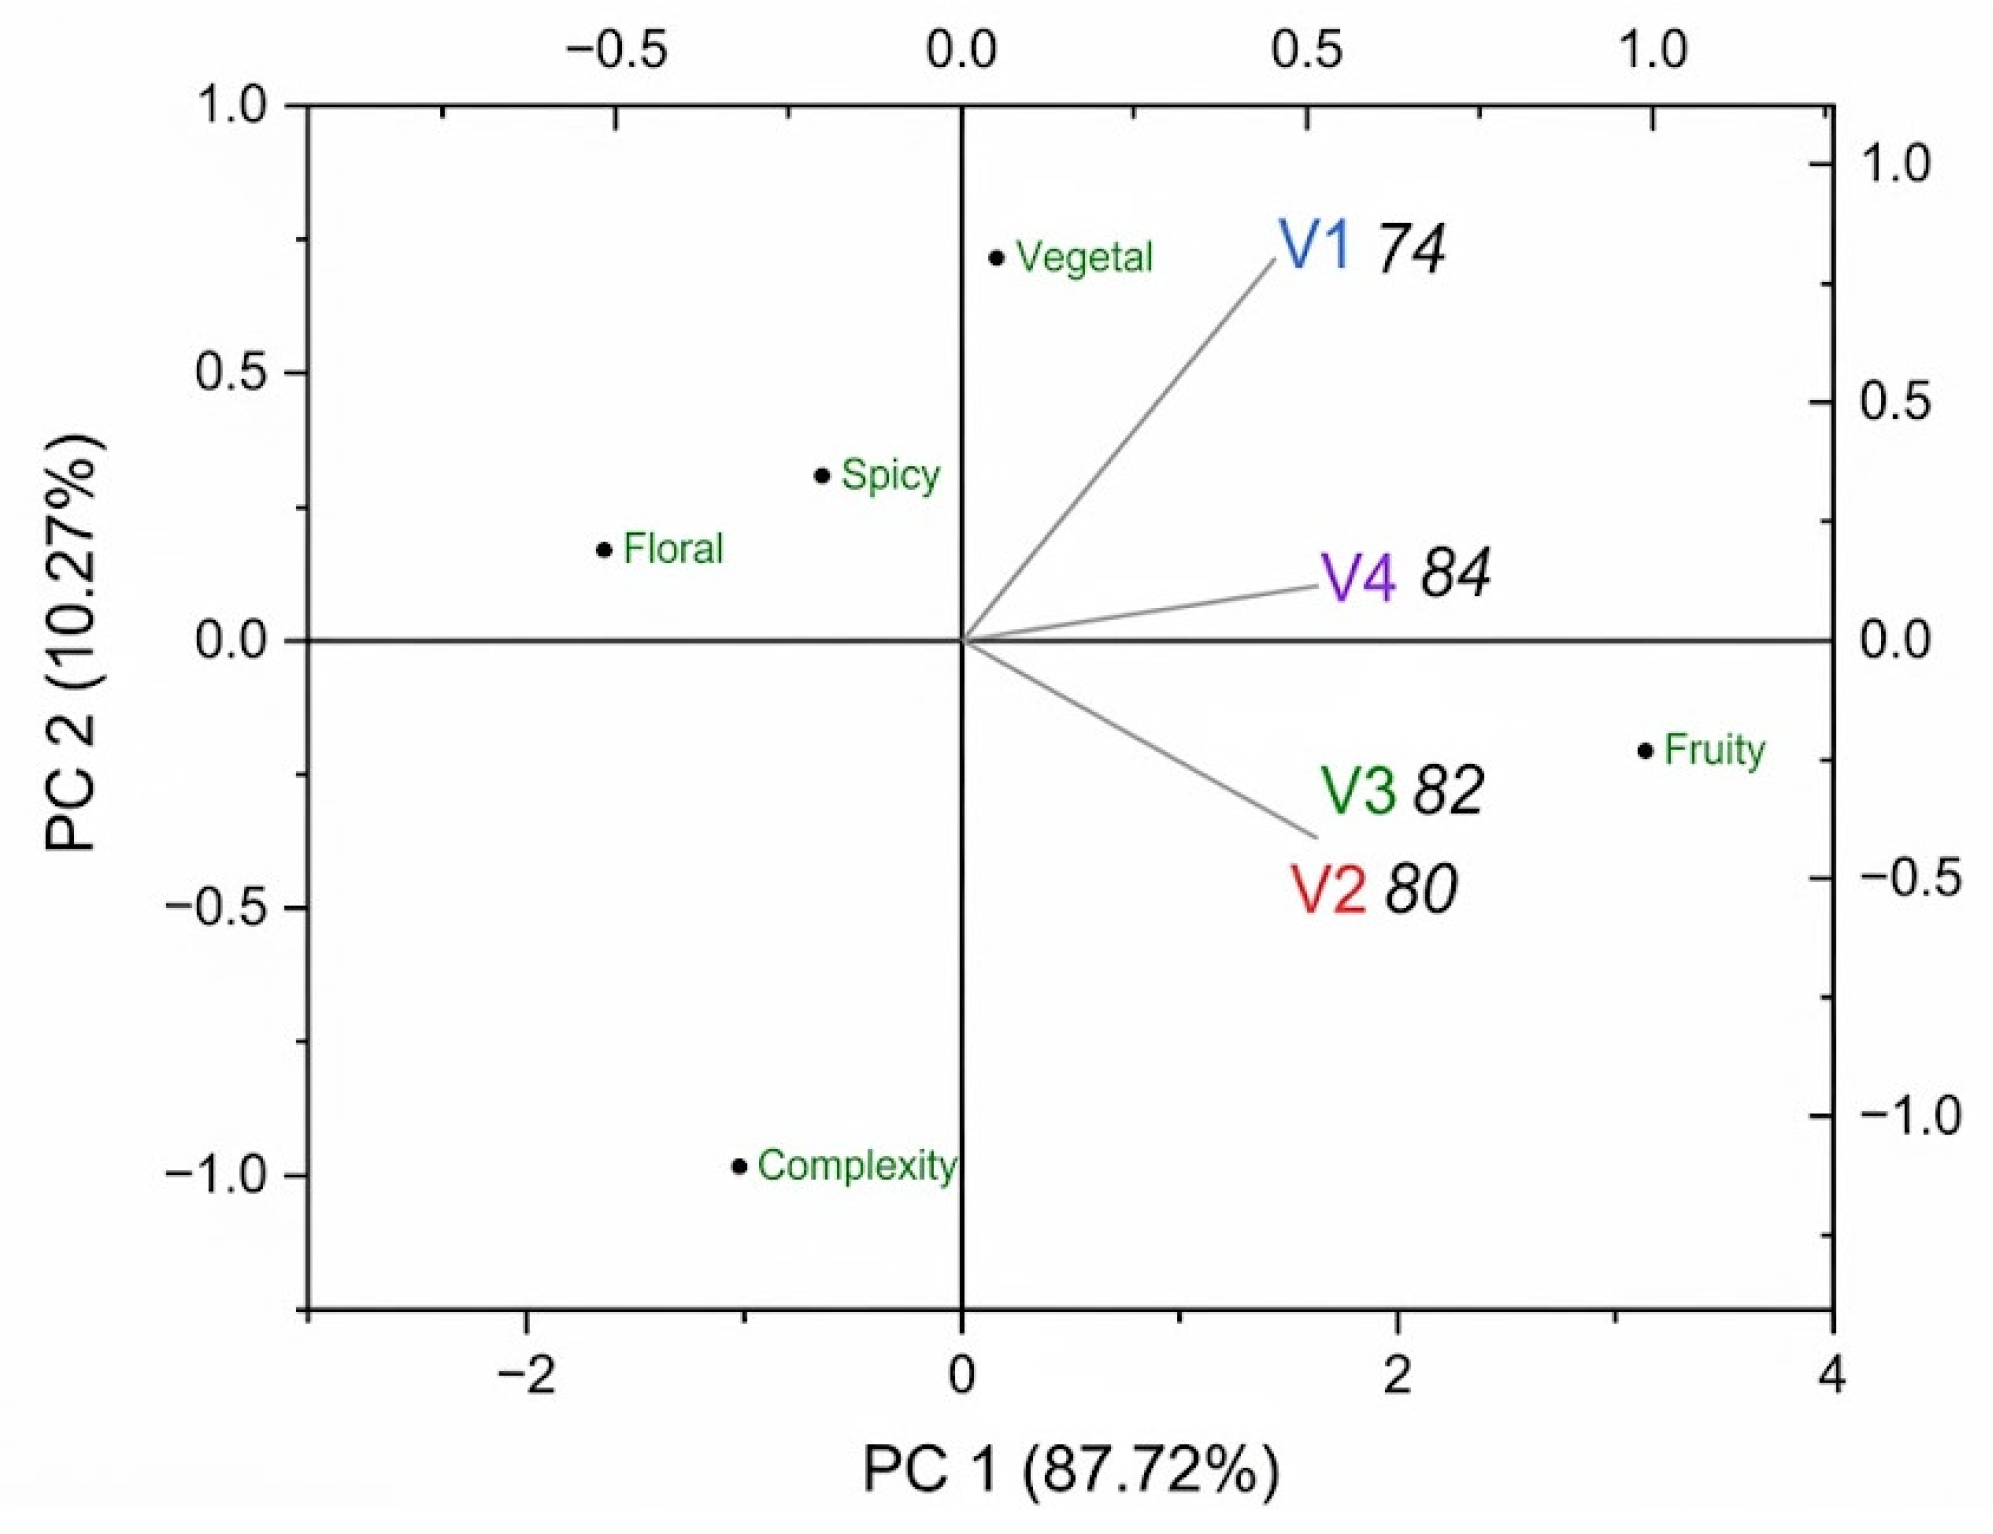
For the aromatic profile, Principal Component Analysis (PCA) indicated that fruity aroma represented the dominant sensory attribute when the perceived intensity of the different aroma classes was considered (Figure 5). All experimental variants were grouped within the right quadrants associated with fruity aromas, although a slight influence of vegetal aromas was observed in the case of variant V1, which contained the lowest proportion of aronia fruit.
Figure 5.
Principal Component Analysis (PCA) based on the perceived intensity of the main aroma groups in the experimental wines (V1—20% aronia with Lalvin yeast; V2—40% aronia with Lalvin yeast; V3—60% aronia with Lalvin yeast; V4—60% aronia with Zymaflore yeast). OIV sheet scores are shown next to the samples in italicised black font.
In the PCA based on the perceived intensity of the main aroma groups (Table 4), the global score was not included as either an active variable or a supplementary quantitative variable, as this overall sensory evaluation was obtained using a separate structured scoring framework (Figure 2) and is conceptually distinct from the individual aroma attributes, thus not representing a specific component of the aroma profile. However, the global scores were displayed next to the corresponding sample variants in the PCA plot, allowing the relationship between the sensory profile and the overall sensory quality of each variant to be examined, while keeping the two sensory assessment approaches conceptually distinct.
Further investigation of the relationships between the global scores and other variables determined for the fermented beverages, such as by PLS regression, was not pursued, as the primary objective of the sensory analysis was to characterize and differentiate the fermented beverages according to their sensory profiles rather than to develop a predictive model for the global sensory score. The global score was therefore used as a complementary overall evaluation and was not defined as a response variable to be predicted from the individual physico-chemical and/or sensory descriptors.
The PC1 axis was mainly associated with fruity and floral aromas, with the two aroma classes showing opposite trends: increasing fruit aroma intensity corresponded to a decrease in floral perception. The PC2 axis was associated with vegetal and spicy aromas; stronger expression of these attributes was associated with a lower perceived complexity of the wine.
Table 5 presents the vector values corresponding to the two principal axes, illustrating the tendency toward lower perception of aroma classes associated with negative vector values.
Table 5.
Vectors determining the differentiation of experimental samples according to the perceived intensity of aroma attributes.
Table 5 and Figure 5 show that 87.72% of the total variance was explained by the principal components PC1 and PC2, with PC1 accounting for most of the variance (77.45%) and PC2 explaining an additional 10.27%. The positive values associated with fruity aromas within PC1 clearly indicate that this axis is correlated with the varietal expression contributed by aronia fruits.
To further highlight the detailed influence of aronia fruit addition on specific aroma types, the frequency with which particular aroma descriptors were cited by the sensory panel was determined. These frequencies are presented in Table 6. As aroma descriptors were generated using free-choice terminology, descriptors with similar or closely related meanings were grouped together. For each group, the most representative term was retained as the descriptor, while the citation frequencies of synonymous or closely related terms were pooled to obtain an overall citation frequency.
Table 6.
Frequency of citation of specific aromas identified in the experimental samples.
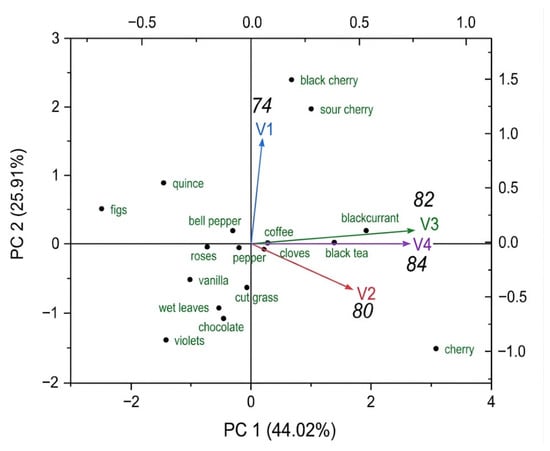
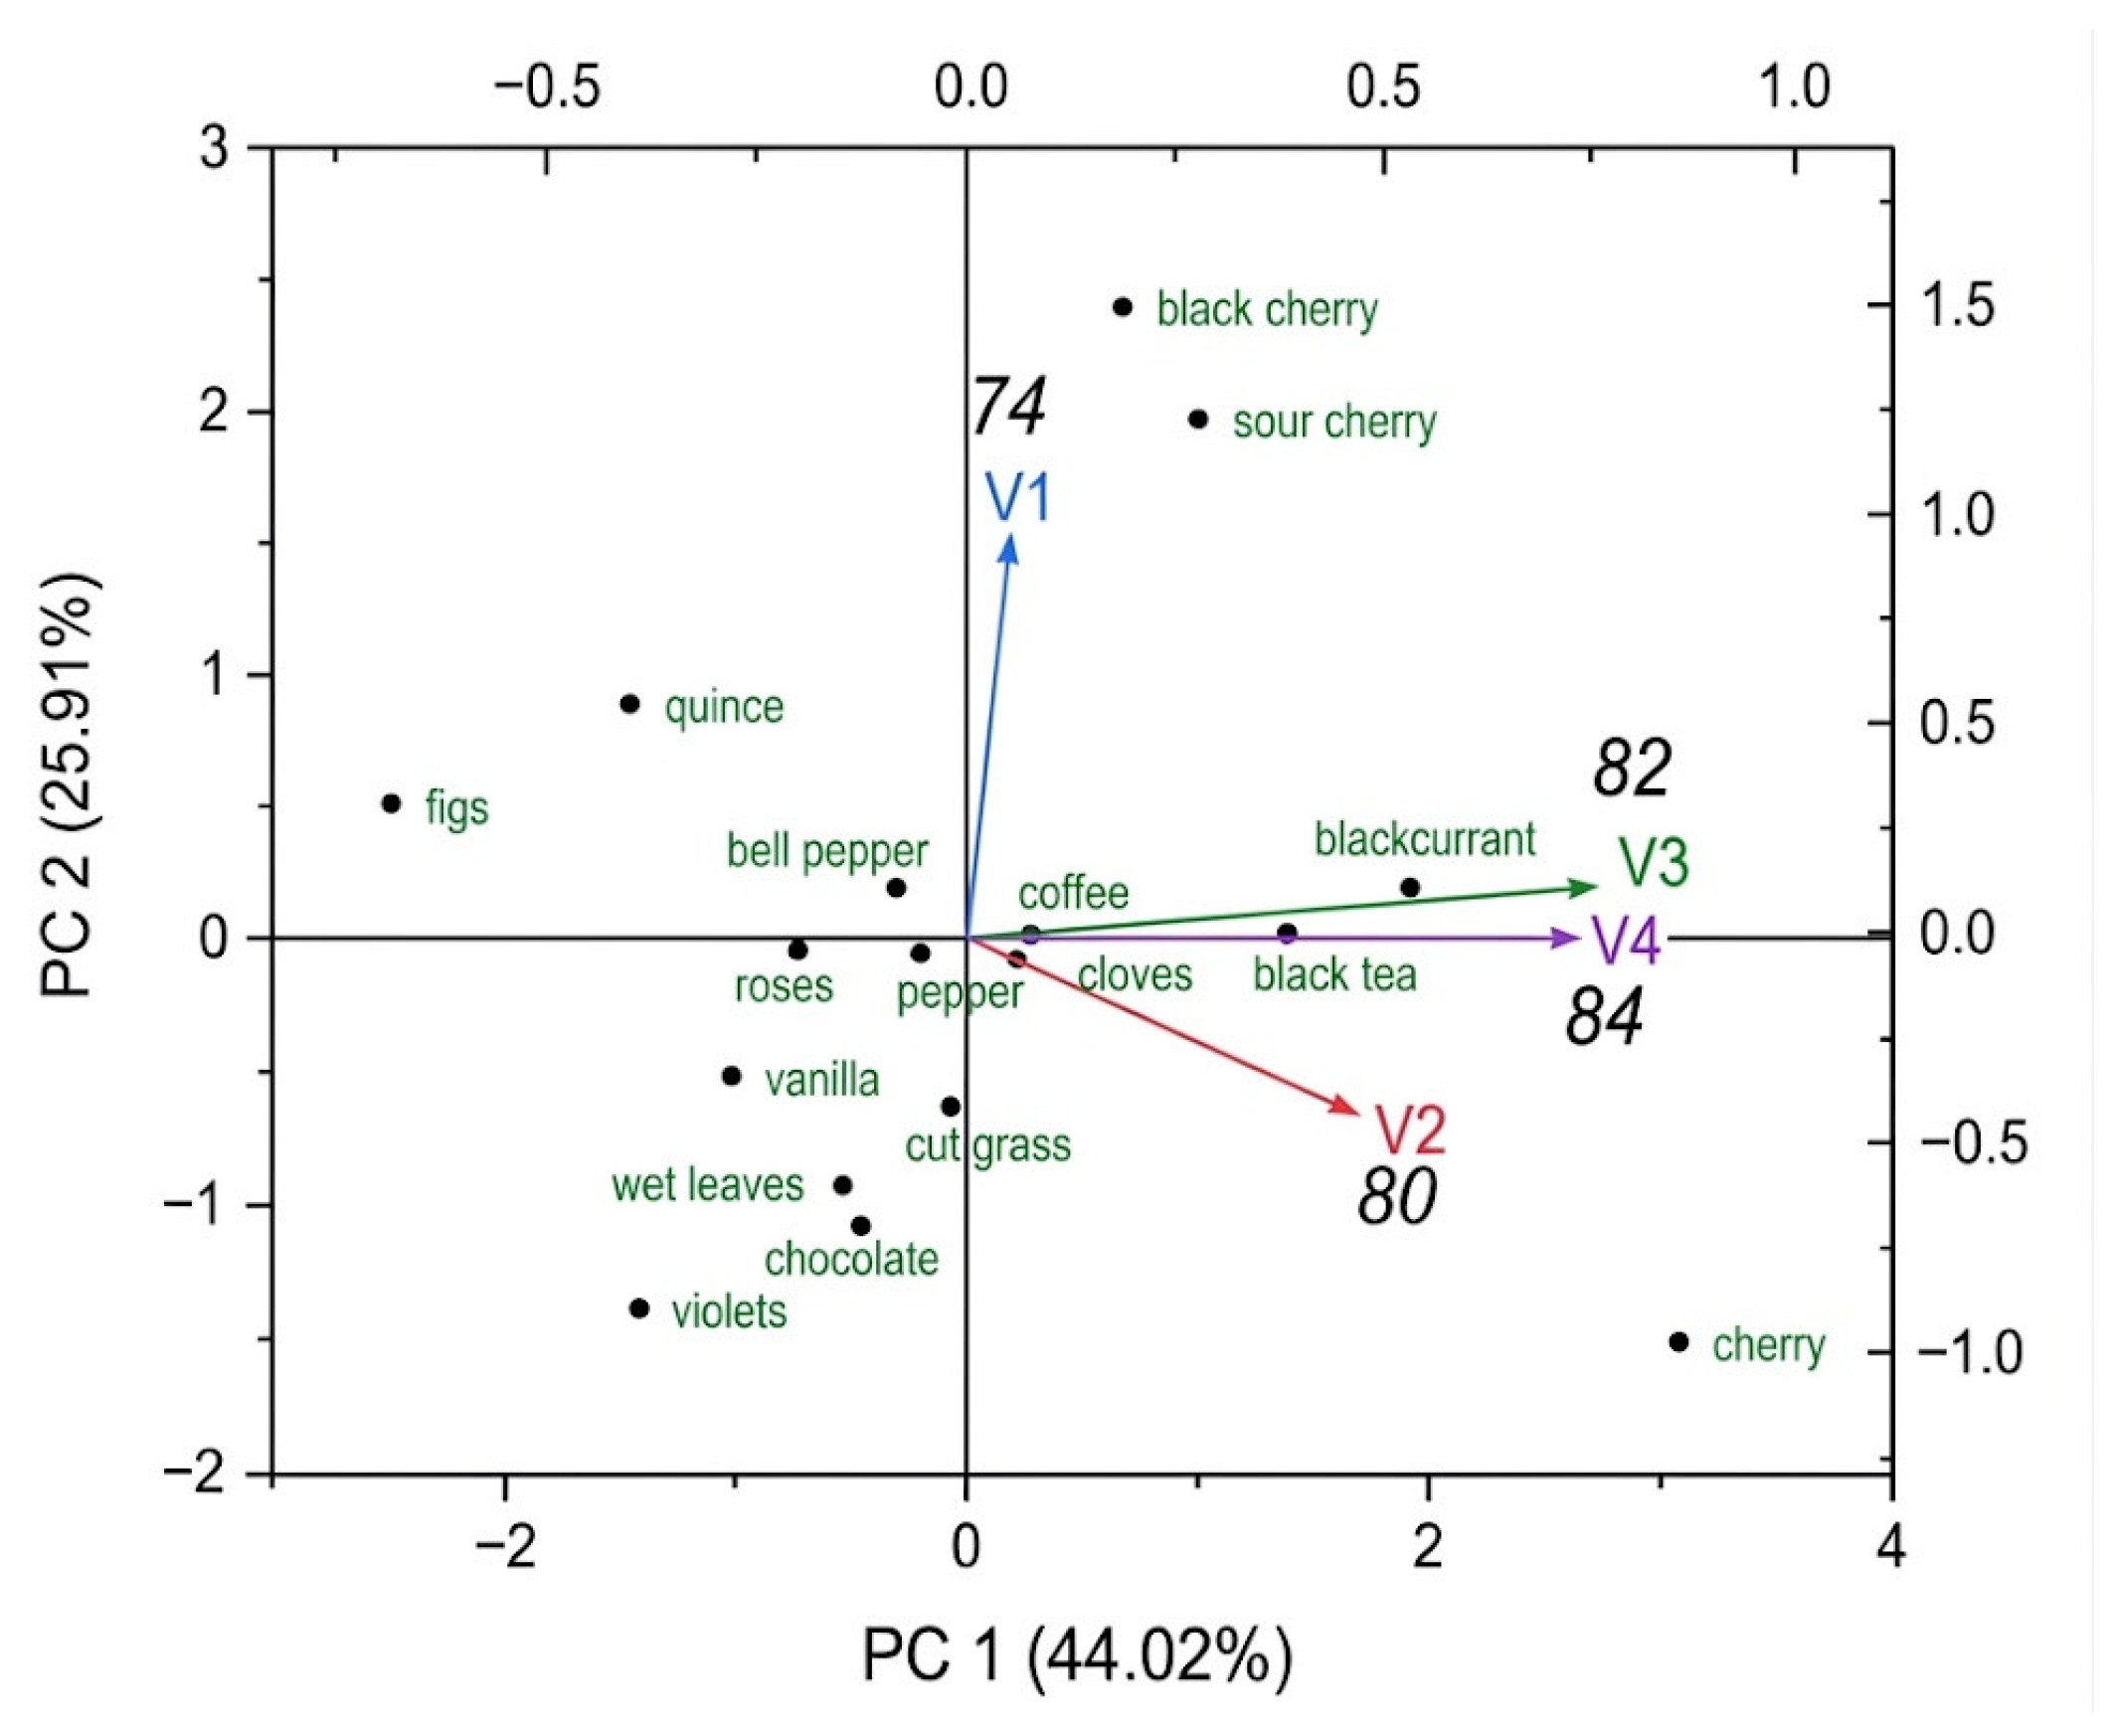
Based on the aroma frequencies reported in Table 6, a new principal component analysis (PCA) was conducted, which more clearly differentiates samples with aronia-related aromas or fermented using different yeast strains (Figure 6). However, it also further shows that the addition of only 20% aronia influences the sensory profile differently compared with the presence of 40% or 60% aronia.
Figure 6.
Principal component analysis (PCA) based on the frequency of citation of aroma descriptors in the experimental wines (V1—20% aronia and Lalvin yeast; V2—40% aronia and Lalvin yeast; V3—60% aronia and Lalvin yeast; V4—60% aronia and Zymaflore yeast). OIV sheet scores are shown next to the samples in italicised black font.
The total variance of the data collected for the PCA shown in Figure 6 indicates that the first two principal components (PC1 = 44.02% and PC2 = 25.91%) account for a satisfactory 69.93% of the total variance.
Table 7 presents the vector values corresponding to the two principal axes, indicating a lower perception of aroma descriptors associated with negative vector values.
Table 7.
Vectors determining the differentiation of the experimental samples according to the frequency of citation of aroma descriptors.
By analysing the distribution of aroma descriptors identified across the two components (Table 7), PC1 can be defined as an axis associated with cherry, blackcurrant and, to a lesser extent, sour cherry notes, whereas PC2 represents an axis characterised by more complex aromas, dominated by bitter cherry and sour cherry, as well as oxidative ageing notes of quince and figs, and vegetal bell pepper notes.
The beverage with 20% aronia (V1) is the simplest in terms of both taste and aroma, with a pronounced dominance of black (bitter) cherry and sour cherry notes. V2, containing 40% aronia, is the most complex, presenting a mixture of blackcurrant and cherry aromas, complemented by secondary notes of black tea, cut grass, and clove.
The samples with 60% aronia (V3 and V4) are not differentiated by the fermentation-derived aromas induced by the two yeast strains used, as the dominant character is that of aronia fruit, which overshadows any subtle fermentation-related nuances. In both V3 and V4, blackcurrant, cherry and black tea notes are present; however, the aromatic profile is simpler than in V2, although the aromas are perceived with greater intensity.
In terms of OIV sensory scores, samples V2, V3, and V4 achieved very similar values (80, 82, 84, respectively), with no statistically significant differences between them, but were clearly and significantly higher than V1 (score 74), which was least preferred by the panellists. From this perspective, to avoid completely masking the grape aroma, the use of only 40% aronia is recommended.
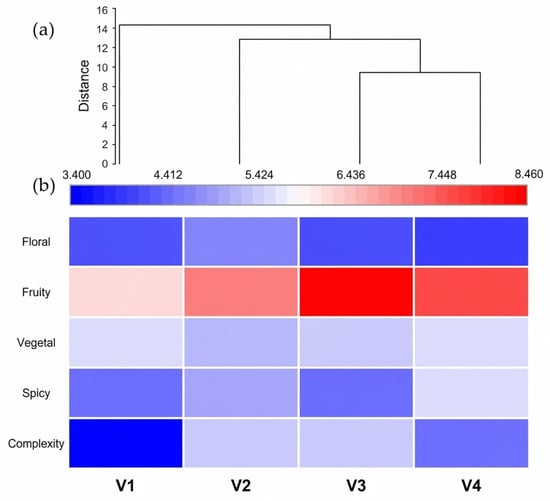
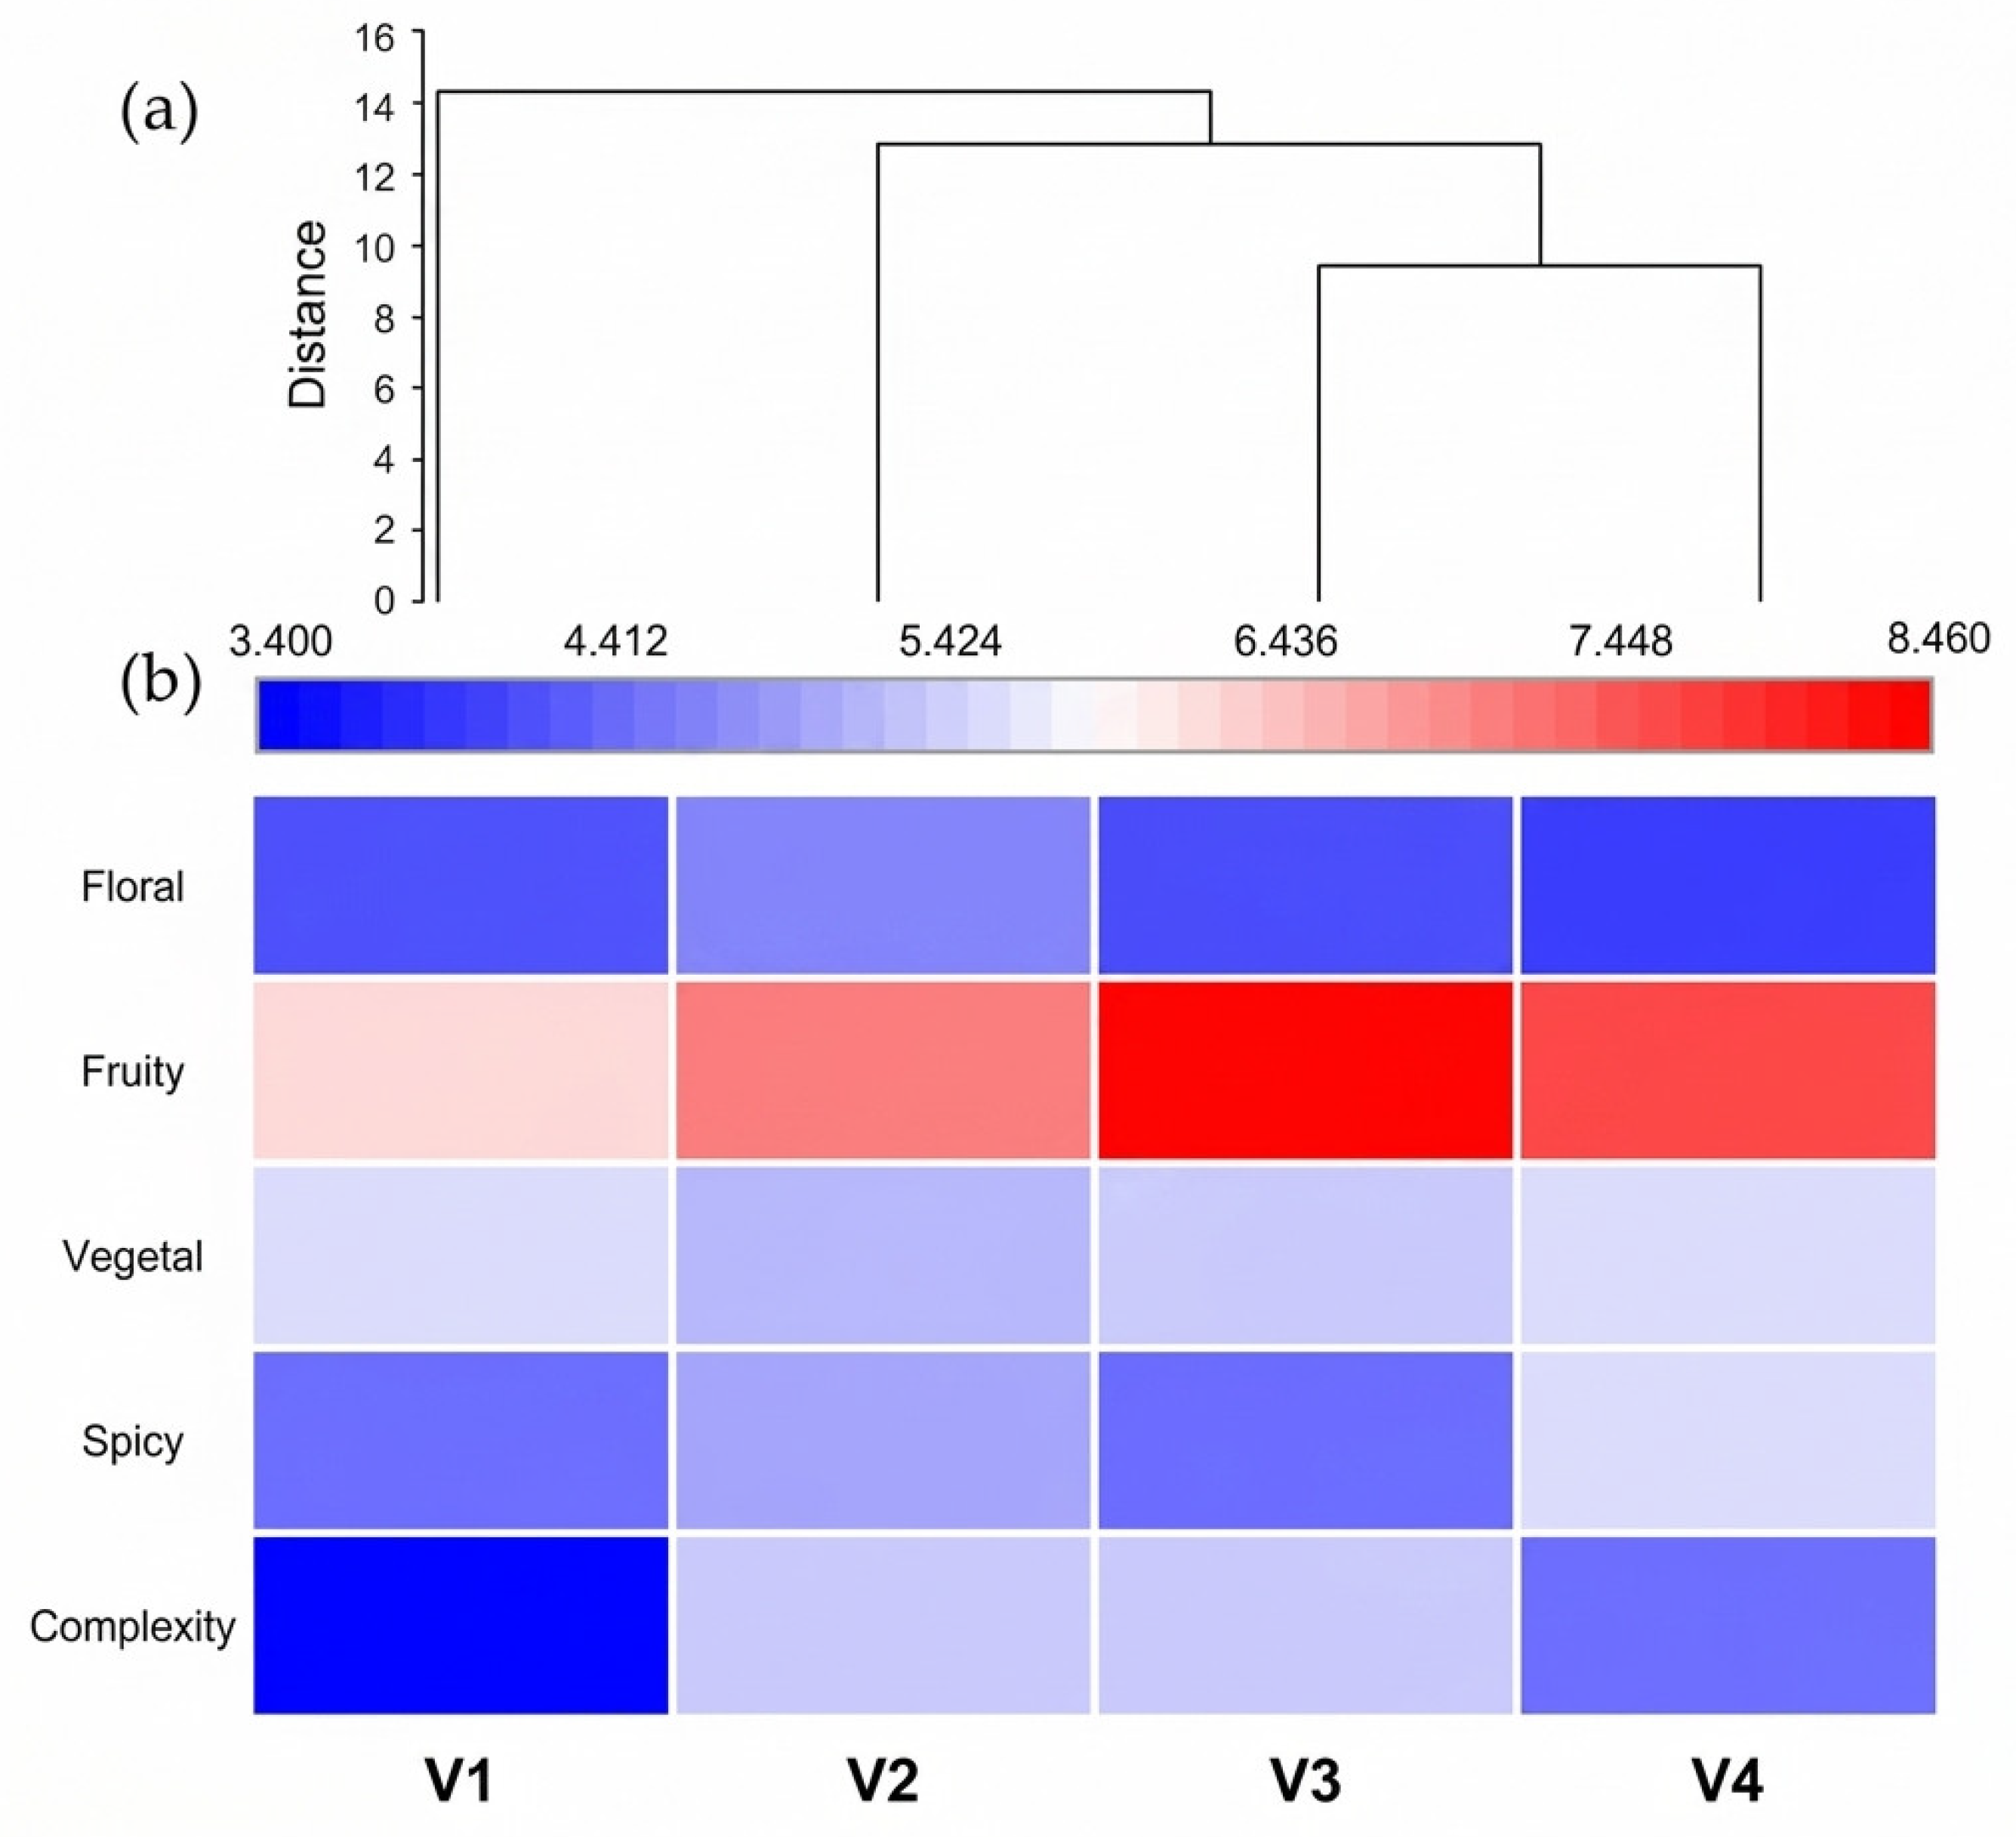
The fact that three groups with distinct sensory qualities can be identified (group V1, the intermediate group V2, and the group comprising samples V3 and V4) is most clearly illustrated in Figure 7, which includes a multivariate cluster analysis (dendrogram).
Figure 7.
(a) Multivariate cluster analysis (dendrogram) and (b) Heatmap representation of the sensory perception of different aroma groups present in the experimental wines (V1—20% aronia and Lalvin yeast; V2—40% aronia and Lalvin yeast; V3—60% aronia and Lalvin yeast; V4—60% aronia and Zymaflore yeast).
This shows the distances between the experimental variants (Figure 7a), as well as a heatmap representation (Figure 7b), in which the perceived sensory intensity of different aroma groups is displayed using varying colour intensities, with blue indicating lower values and red indicating higher values.
This diagram suggests that the 40% aronia variant provided a more balanced integration of the two fruit sources, with a moderate intensity of the fruity character associated with aronia, in contrast to the more pronounced fruity character observed in the 60% aronia variant.
Although there is a tendency, not statistically confirmed, for the 60% aronia beverages to achieve the highest overall sensory scores, these samples contain an excessive proportion of aronia fruit, resulting in a final product in which the grape component no longer contributes any aromatic complexity, serving only as a source of sugars for alcoholic fermentation.
Therefore, in order to maintain sensory complexity, the intermediate variant V2 is recommended for production.
4. Limitations
The present study evaluated the aronia-based beverages primarily from a sensory perspective, with the main objective of assessing acceptability and perceived sensory characteristics. Accordingly, the chemical characterization was limited to basic physicochemical analyses relevant to assessing the beverages’ technological and commercial potential. A comprehensive characterization of the phenolic composition, including the identification and quantification of individual phenolic compounds, was not performed, as such analyses were beyond the scope of this sensory-focused study.
A limitation of the study is that the sensory evaluation did not include a 100% grape-must control, which would have resulted in a conventional Fetească regală white wine. This control was not included because it would have represented a distinct and highly familiar sensory category compared with the red-coloured aronia–grape beverages, potentially introducing category, contrast, order and visual effects during sensory evaluation. A 100% grape-based beverage represents a distinct category characterized by a substantially more complex sensory matrix, including varietal, fermentation-derived and, depending on the product, maturation-related aroma and flavor attributes. Its inclusion could therefore have introduced a strong category-related effect and potentially confounded the interpretation of the sensory results, particularly given the sensory complexity and established panel members’ familiarity associated with conventional wine. Consequently, the present study allows comparison of sensory quality among the different aronia-containing formulations, but does not permit direct conclusions regarding their sensory quality or preference relative to conventional Fetească regală wine.
Another limitation of the present study is the relatively small sensory panel, which consisted of 12 student assessors. Although this panel size is within the range commonly used for sensory evaluations and can provide useful exploratory information, the participation of a relatively small and specific group of assessors may limit the generalizability of the findings to a broader consumer or trained-sensory population. Therefore, the results should be interpreted in the context of the exploratory nature of the study.
5. Conclusions
The main contribution of this research is the development and application of a specific multidimensional sensory evaluation approach for the integrated characterization, differentiation and classification of fermented beverages. The approach combines quantitative sensory profiling, evaluation of aroma and other key sensory attributes, scoring on an OIV evaluation sheet commonly used in wine competitions and multivariate statistical techniques, including analysis of variance (ANOVA), principal component analysis (PCA) and cluster analysis. Together, these tools provide a comprehensive framework for identifying sensory differences among experimental beverages, associating samples with specific sensory attributes and objectively selecting the most promising variants for further development.
The analysis clearly differentiated the experimental beverages and showed that the variants containing 40% and 60% aronia had the highest overall acceptability among the samples evaluated, irrespective of the yeast strain used.
This study demonstrates that aronia fruit, which is difficult to valorise for direct consumption due to its high tannin content, can be effectively used in the production of fermented alcoholic beverages when combined with grape must. The presence of grape must adds complexity to the otherwise simple sensory profile of aronia fruit, while also providing fermentable sugars that contribute to the production of a balanced beverage. Although additional sugar may still be required for adjustment, the amount needed is lower than in a conventional aronia wine.
The resulting beverages retain the sensory character of aronia to a greater extent than that of grapes, with the aronia character intensifying as the proportion of aronia fruit increases. Although the samples containing 40% and 60% showed similar overall scores, considering their aroma profiles and the need to avoid the complete dominance of one component in the final product, the intermediate proportion of 40% was preferred.
Although the specific application concerns aronia-enriched fermented beverages, the methodological framework is not limited to this product category and could be adapted to the sensory evaluation of other fruit-fermented beverages and novel beverage formulations. This complex sensory evaluation strategy can support product selection and development when conventional single-score sensory assessment may not provide sufficient information. The aronia-based beverages serve as a relevant case study through which the discriminatory and classificatory potential of the methodology was demonstrated.
Author Contributions
Conceptualization O.A.A. for the sensory analysis and G.A.C. for fermentation technology; methodology, O.A.A. original methodology for sensory evaluation in panel and analysis; formal analysis, O.A.A.; supervision, O.A.A.; validation, O.A.A.; writing—original draft preparation, O.A.A.; writing—review and editing, O.A.A. All authors have read and agreed to the published version of the manuscript.
Funding
This research received no external funding.
Institutional Review Board Statement
The sensory evaluation protocol used in this study received favourable approval from the Ethics Commission of the University of Agronomic Sciences and Veterinary Medicine of Bucharest (USAMV Bucharest), no. 4171/2026. The approved protocol involved sensory analyses conducted using standardized evaluation sheets completed by informed volunteer participants. All participants were informed about the study procedures and participated voluntarily. The study was conducted in accordance with the approved protocol, with appropriate measures taken to ensure confidentiality and the protection of participants’ personal data.
Informed Consent Statement
Informed consent was obtained from all participants for their voluntary participation in the sensory evaluation activities conducted. The consent form explicitly covers voluntary participation, the use of anonymized data for research purposes, the evaluation of alcoholic beverages and instructions not to ingest them, and the right to withdraw from the activity at any time.
Data Availability Statement
Dataset available on request from the authors.
Acknowledgments
Aronia fruits were kindly provided by Prof. Adrian Constantin Asănică from the University of Agronomic Sciences and Veterinary Medicine of Bucharest. Beverage samples were prepared with the help of Cristina Ribac, a master’s student at the University of Agronomic Sciences and Veterinary Medicine of Bucharest. Sensory evaluation was performed on a voluntary basis by a panel of master’s students who were informed about the beverages offered for tasting. The methodology used was developed by the master’s course coordinator and was part of the master’s students’ training; their voluntary participation was anonymous, and no data were collected that could be linked to the respondents. During the preparation of this manuscript, the first author used ChatGPT-5.6 Luna to assist with language refinement and to enhance the resolution of selected figures. The use of AI did not involve the generation or modification of the original scientific ideas, data, or graphical content produced using Origin software. The authors have reviewed and edited the output and take full responsibility for the content of this publication.
Conflicts of Interest
The authors declare no conflicts of interest. The provider of the materials or the students involved in sample preparations or sensory analysis had no role in the design of the study; in the collection, analyses, or interpretation of data; in the writing of the manuscript; or in the decision to publish the results.
References
- Jurikova, T.; Mlcek, J.; Skrovankova, S.; Sumczynski, D.; Sochor, J.; Hlavacova, I.; Snopek, L.; Orsavová, J. Fruits of black chokeberry Aronia melanocarpa in the prevention of chronic diseases. Molecules 2017, 22, 944. [Google Scholar] [CrossRef] [Scilit] [PubMed]
- Janick, J.; Paull, R.E. Encyclopedia of Fruit and Nuts, 1st ed.; CABI: Wallingford, UK, 2008; pp. 622–624. [Google Scholar]
- Borowska, S.; Brzóska, M.M. Chokeberries (Aronia melanocarpa) and their products as a possible means for the prevention and treatment of noncommunicable diseases and unfavorable health effects due to exposure to xenobiotics. Compr. Rev. Food Sci. Food Saf. 2016, 15, 982–1017. [Google Scholar] [CrossRef] [Scilit] [PubMed]
- Banjari, I.; Misir, A.; Šavikin, K.; Jokić, S.; Molnar, M.; De Zoysa, H.K.S.; Waisundara, V.Y. Antidiabetic Effects of Aronia melanocarpa and Its Other Therapeutic Properties. Front. Nutr. 2017, 4, 53. [Google Scholar] [CrossRef] [Scilit] [PubMed]
- Buda, V.; Andor, M.; Diana, A.; Ardelean, F.; Pavel, I.Z.; Dehelean, C.; Soica, C.; Folescu, R.; Andrei, F.; Danciu, C. Cardioprotective effects of cultivated black chokeberries (Aronia spp.): Traditional uses, phytochemistry and therapeutic effects. In Natural Products—From Bioactive Molecules to Human Health; IntechOpen: London, UK, 2020. [Google Scholar] [CrossRef] [Scilit]
- Ćujić, N.; Kardum, N.; Šavikin, K.; Zdunić, G.; Janković, T.; Menković, N. Potential of chokeberry (Aronia melanocarpa L.) as a therapeutic food. In Handbook of Food Bioengineering; Holban, A.M., Grumezescu, A.M., Eds.; Andre Gerhard Wolff: London, UK, 2018; Volume 8, pp. 209–237. [Google Scholar] [CrossRef] [Scilit]
- Kokotkiewicz, A.; Jaremicz, Z.; Luczkiewicz, M. Aronia plants: A review of traditional use, biological activities, and perspectives for modern medicine. J. Med. Food 2010, 13, 255–269. [Google Scholar] [CrossRef] [Scilit] [PubMed]
- Lim, S.M.; Lee, H.S.; Jung, J.I.; Kim, S.M.; Kim, N.Y.; Seo, T.S.; Bae, J.S.; Kim, E.J. Cyanidin-3-O-galactoside-enriched Aronia melanocarpa extract attenuates weight gain and adipogenic pathways in high-fat diet-induced obese C57BL/6 mice. Nutrients 2019, 11, 1190. [Google Scholar] [CrossRef] [Scilit] [PubMed]
- Kaloudi, T.; Tsimogiannis, D.; Oreopoulou, V. Aronia melanocarpa: Identification and exploitation of its phenolic components. Molecules 2022, 27, 4375. [Google Scholar] [CrossRef] [Scilit] [PubMed]
- Šnebergrová, J.; Čížková, H.; Neradová, E.; Kapci, B.; Rajchl, A.; Voldřich, M. Variability of characteristic components of aronia. Czech J. Food Sci. 2014, 32, 25–30. [Google Scholar] [CrossRef] [Scilit]
- Oszmiański, J.; Wojdyło, A. Aronia melanocarpa phenolics and their antioxidant activity. Eur. Food Res. Technol. 2005, 221, 809–813. [Google Scholar] [CrossRef] [Scilit]
- Tolić, M.T.; Jurčević, I.L.; Krbavčić, I.P.; Marković, K.; Vahčić, N. Phenolic content, antioxidant capacity and quality of chokeberry (Aronia melanocarpa) products. Food Technol. Biotechnol. 2015, 53, 171–179. [Google Scholar] [CrossRef] [PubMed]
- Szopa, A.; Kokotkiewicz, A.; Kubica, P.; Banaszczak, P.; Wojtanowska-Krośniak, A.; Krośniak, M.; Marzec-Wróblewska, U.; Badura, A.; Zagrodzki, P.; Bucinski, A. Comparative analysis of different groups of phenolic compounds in fruit and leaf extracts of Aronia sp.: A. melanocarpa, A. arbutifolia, and A. ×prunifolia and their antioxidant activities. Eur. Food Res. Technol. 2017, 243, 1645–1657. [Google Scholar] [CrossRef] [Scilit]
- Huang, R.; Fang, W.; Xie, X.; Liu, Y.; Xu, C. Identification of Key Astringent Compounds in Aronia Berry Juice. Food Chem. 2022, 393, 133431. [Google Scholar] [CrossRef] [Scilit] [PubMed]
- Vidal, S.; Francis, L.; Guyot, S.; Marnet, N.; Kwiatkowski, M.; Gawel, R.; Cheynier, V.; Waters, E.J. The Mouth-Feel Properties of Grape and Apple Proanthocyanidins in a Wine-Like Medium. J. Sci. Food Agric. 2003, 83, 564–573. [Google Scholar] [CrossRef] [Scilit]
- Symoneaux, R.; Chollet, S.; Bauduin, R.; Le Quéré, J.M.; Baron, A. Impact of Apple Procyanidins on Sensory Perception in Model Cider (Part 2): Degree of Polymerization and Interactions with the Matrix Components. LWT-Food Sci. Technol. 2014, 57, 28–34. [Google Scholar] [CrossRef] [Scilit]
- Frumuzachi, O.; Rohn, S.; Mocan, A. Fermented Black Chokeberry (Aronia melanocarpa (Michx.) Elliott) Products—A Systematic Review on the Composition and Current Scientific Evidence of Possible Health Benefits. Food Res. Int. 2024, 196, 115094. [Google Scholar] [CrossRef] [Scilit] [PubMed]
- Rodríguez-Werner, M.; Winterhalter, P.; Esatbeyoglu, T. Phenolic composition, radical scavenging activity and an approach for authentication of Aronia melanocarpa berries, juice, and pomace. J. Food Sci. 2019, 84, 1791–1798. [Google Scholar] [CrossRef] [Scilit] [PubMed]
- Tasinov, O.; Dincheva, I.; Badjakov, I.; Grupcheva, C.; Galunska, B. Comparative phytochemical analysis of Aronia melanocarpa L. fruit juices on the Bulgarian market. Plants 2022, 11, 1655. [Google Scholar] [CrossRef] [Scilit] [PubMed]
- Oziembłowski, M.; Trenka, M.; Czaplicka, M.; Maksimowski, D.; Nawirska-Olszańska, A. Selected properties of juices from black chokeberry (Aronia melanocarpa L.) fruits preserved using the PEF method. Appl. Sci. 2022, 12, 7008. [Google Scholar] [CrossRef] [Scilit]
- Halici Demir, F.; Acik, G.; Sahin Gul, D. The bioactive potential of fruit juice of black chokeberry (Aronia melanocarpa) produced in Edirne Province–Türkiye: Phenolic profile, elemental composition, and in vitro antioxidant and antibacterial activities. Food Sci. Nutr. 2025, 13, e70784. [Google Scholar] [CrossRef] [Scilit] [PubMed]
- Nour, V. Quality characteristics, anthocyanin stability and antioxidant activity of apple (Malus domestica) and black chokeberry (Aronia melanocarpa) juice blends. Plants 2022, 11, 2027. [Google Scholar] [CrossRef] [Scilit] [PubMed]
- Pădureţ, S.; Ghinea, C.; Prisacaru, A.E.; Leahu, A. Physicochemical, textural, and antioxidant attributes of yogurts supplemented with black chokeberry: Fruit, juice, and pomace. Foods 2024, 13, 3231. [Google Scholar] [CrossRef] [Scilit] [PubMed]
- Parra-Cadenas, S.; Molero-Gutiérrez, V.; Romero-Bercebal, E.; García-Romero, E.; Pérez-Coello, M.S.; Díaz-Maroto, M.C. Aroma profile of wine-based beverages produced by co-fermentation of white grape must, apple and orange juices. Food Humanit. 2026, 6, 101058. [Google Scholar] [CrossRef] [Scilit]
- Denev, P.; Kratchanova, M.; Petrova, I.; Klisurova, D.; Georgiev, Y.; Ognyanov, M.; Yanakieva, I. Black Chokeberry (Aronia melanocarpa (Michx.) Elliot) Fruits and Functional Drinks Differ Significantly in Their Chemical Composition and Antioxidant Activity. J. Chem. 2018, 2018, 9574587. [Google Scholar] [CrossRef] [Scilit]
- Ayuso-Yuste, M.C.; Cruz Calero, F.J.; Ramos García, M.; Nicolás Barroso, N.; Ramos Alguijo, M.B.; Rodríguez Gómez, M.J.; Calvo Magro, P. Characterization and Classification of Berry (Aronia, Haskap, and Goji) Fruits with High Bioactive Value Grown in Spain. Foods 2024, 13, 4122. [Google Scholar] [CrossRef] [Scilit] [PubMed]
- Valcheva-Kuzmanova, S.; Kuzmanov, K.; Tancheva, S.; Belcheva, A. Hypoglycemic and hypolipidemic effects of Aronia melanocarpa fruit juice in streptozotocin-induced diabetic rats. Methods Find. Exp. Clin. Pharmacol. 2007, 29, 101–105. [Google Scholar] [CrossRef] [Scilit] [PubMed]
- Kulling, S.E.; Rawel, H. Chokeberry (Aronia melanocarpa)—A review on the characteristic components and potential health effects. Planta Med. 2008, 74, 1625–1634. [Google Scholar] [CrossRef] [Scilit] [PubMed]
- Kaya, Ç. Heatmap and PCA-based evaluation of bioactive compounds and volatile profiles in aronia fruits under different drying methods. Czech J. Food Sci. 2025, 43, 428–437. [Google Scholar] [CrossRef] [Scilit]
- Manolache, F.-A.; Duță, D.-E.; Criveanu-Stamatie, G.D.; Iordache, T.-A.; Todașcă, M.-C. Decoding the volatile profile of white Romanian Fetească wines. Separations 2024, 11, 141. [Google Scholar] [CrossRef] [Scilit]
- Vitis International Variety Catalogue (VIVC). Feteasca Regala. VIVC No. 4121. Julius Kühn-Institut, Institute for Grapevine Breeding Geilweilerhof, Siebeldingen, Germany. Available online: https://www.vivc.de/index.php?r=passport/view&id=4121 (accessed on 13 September 2026).
- OIV–International Organisation of Vine and Wine. Compendium of International Methods of Wine and Must Analysis; OIV: Dijon, France, 2022; Volumes 1–2. [Google Scholar]
- The Commission of the European Communities. Commission Regulation (EC) No 1293/2005 of 5 August 2005 Amending Regulation (EEC) No 2676/90 Determining Community Methods for the Analysis of Wines. Off. J. Eur. Union 2005, L 205, 12–15. [Google Scholar]
- The Commission of the European Communities. Commission Regulation (EC) No 606/2009 of 10 July 2009 laying down certain detailed rules for implementing Council Regulation (EC) No 479/2008 as regards the categories of grapevine products, oenological practices and the applicable restrictions. Off. J. Eur. Union 2009, L 193, 1–59. [Google Scholar]
- ISO 8589:2007; Sensory Analysis—General Guidance for the Design of Test Rooms. International Organization for Standardization: Geneva, Switzerland, 2007.
- ISO 6658:2017; Sensory Analysis—Methodology—General Guidance. International Organization for Standardization: Geneva, Switzerland, 2017.
- ISO 3591:1977; Sensory Analysis—Apparatus—Wine-Tasting Glass. International Organization for Standardization: Geneva, Switzerland, 1977.
- Antoce, A.O.; Nămoloșanu, I. Method for Constructing the Sensory Profile Used to Evaluate Wine Typicality. Romanian Patent No. RO123129, 30 November 2010. [Google Scholar]
- OIV-OENO 671A-2025; Revision of the OIV Standard for International Wine and Spirituous Beverages of Vitivinicultural Origin Competitions. OIV: Dijon, France, 2025. Available online: https://www.oiv.int/node/4087 (accessed on 13 August 2026).
- Mekoue Nguela, J.; Vernhet, A.; Julien-Ortiz, A.; Sieczkowski, N.; Mouret, J.-R. Effect of Grape Must Polyphenols on Yeast Metabolism during Alcoholic Fermentation. Food Res. Int. 2019, 121, 161–175. [Google Scholar] [CrossRef] [Scilit] [PubMed]
- Li, J.-Y.; Du, G.; Yang, X.; Huang, W.-D. Effect of Proanthocyanidins on Yeast Metabolism, H+–ATPase Activity, and Wine Fermentation. Am. J. Enol. Vitic. 2011, 62, 478–483. [Google Scholar] [CrossRef] [Scilit]

Disclaimer/Publisher’s Note: The statements, opinions and data contained in all publications are solely those of the individual author(s) and contributor(s) and not of MDPI and/or the editor(s). MDPI and/or the editor(s) disclaim responsibility for any injury to people or property resulting from any ideas, methods, instructions or products referred to in the content. |
© 2026 by the authors. Licensee MDPI, Basel, Switzerland. This article is an open access article distributed under the terms and conditions of the Creative Commons Attribution (CC BY) license.