


Highlights
What are the main findings?
- Evapotranspiration emerged as the dominant component of the watershed water balance under both current and future climate conditions.
- Future climate scenarios substantially reduce lateral flow, groundwater recharge, and soil-water storage, indicating increasing hydrological stress in the watershed.
- Irrigation altered hydrological flow partitioning by increasing consumptive water use; however, it cannot fully compensate for climate-induced water deficits under future warming scenarios.
- Crop responses varied significantly across management systems, with maize (Zea mays L.) and wheat (Triticum aestivum L.) showing moderate resilience, while Teff (Eragrostis tef) exhibited persistent yield declines under most future scenarios.
What are the implications of the main findings?
- Sustainable adaptation should emphasize water-efficient agronomic practices, soil-moisture conservation, and integrated watershed management rather than large-scale irrigation expansion alone.
- Teff (Trotter crop) appears highly vulnerable to future warming and rainfall variability, requiring targeted climate adaptation and breeding strategies.
- Future watershed planning should prioritize groundwater recharge enhancement, efficient irrigation technologies, and management approaches that address increasing evaporative demand and declining subsurface water availability.
Abstract
Climate change and irrigation expansion are expected to substantially alter hydrological processes and agricultural productivity in the semi-arid watersheds of northern Ethiopia; however, their combined impacts remain insufficiently quantified. This study evaluated the effects of future climate change and irrigation management on watershed hydrology and crop yield in the Geba watershed using the Soil and Water Assessment Tool Plus (SWAT+). The model was calibrated and validated using observed daily streamflow data for the 2006–2020 period and driven by an ensemble of five bias-corrected CORDEX Africa regional climate models (RCMs) under the RCP 4.5 and RCP 8.5 scenarios for the mid-century (2046–2060) and late-century (2086–2100) periods. Two agricultural management systems, namely rainfed and irrigation-rainfed integrated management, were evaluated. Model performance was satisfactory for streamflow simulation, with NSE values of 0.56 and 0.50 and KGE values of 0.64 and 0.54 during calibration and validation, respectively. The results indicate a progressive shift toward an evapotranspiration-dominated hydrological regime under future climate conditions. Under rainfed management, surface runoff and evapotranspiration increased by up to 60% and 30%, respectively, whereas groundwater recharge and lateral flow declined substantially. Irrigation scenarios intensified hydrological stress by reducing percolation, lateral flow, and water yield by up to 80%, 60%, and 55%, respectively. Statistical analyses revealed that climate forcing, management type, and their interactions significantly affected hydrological responses (p < 0.001), with emission pathways representing the dominant driver of variability. Crop responses varied considerably among management systems and crop types. Rainfed maize and wheat exhibited moderate yield increases under mid-century conditions, whereas teff consistently showed negative responses under most climate scenarios, indicating high vulnerability to warming and moisture stress. Under irrigation management, most crops experienced substantial yield reductions during late-century periods, although tomatoes showed localized gains under high-emission scenarios. Overall, the findings demonstrate that irrigation expansion alone may not provide sustainable adaptation under increasing climate stress because it intensifies evapotranspiration and reduces groundwater recharge. Integrated watershed management, climate-resilient crop selection, efficient irrigation practices, and soil-moisture conservation strategies are therefore essential for sustaining agricultural productivity and water availability in semi-arid Ethiopian watersheds.
1. Introduction
In Ethiopia, agriculture contributes approximately one-third of gross domestic product and supports the livelihoods of 70–80% of the population while generating the majority of export earnings [1]. Historical climate data reveal that Ethiopia has experienced rising temperatures of 0.3–0.66 °C over the last three decades (1990–2020), with future projections indicating further increases that threaten cereal production and water availability [2,3]. Climate change fundamentally alters hydrological processes through modifications in precipitation patterns, temperature regimes, and evapotranspiration rates, consequently affecting streamflow, drought frequency, and irrigation water availability [4,5,6].
A growing body of research in Ethiopia has examined the impacts of climate change and land-use dynamics on watershed hydrology, particularly using models such as SWAT [7,8] and SWAT+ [9,10,11,12,13]. Studies in northern Ethiopia, including the Geba watershed and other basins, have demonstrated that climate variability and land-use/cover changes significantly influence runoff, sediment yield, and evapotranspiration [14,15,16]. Similarly, basin-scale assessments in the Upper Blue Nile and Tekeze systems have highlighted that future climate scenarios can alter streamflow regimes and increase hydrological uncertainty [17,18,19]. Despite these advances, most presented studies have primarily focused on hydrological responses in isolation, often neglecting the linkage between hydrological processes and agricultural productivity. For instance, while studies such as [19,20,21,22] quantified changes in runoff, evapotranspiration, and water yield under climate scenarios, they did not extend their analyses to evaluate how these hydrological changes translate into crop yield responses, particularly under different management systems. Conversely, agro-climatic studies in Ethiopia have assessed the impacts of climate change on crop productivity, especially under rainfed conditions [23,24]. These studies highlighted the vulnerability of crops to rainfall variability and rising temperatures but largely excluded hydrological process-based modeling, thereby limiting their ability to explain the underlying water balance mechanisms driving yield changes.
While irrigation is widely recognized as a critical adaptation strategy in semi-arid regions such as the Tigray region [25,26], most studies either assume static management conditions or evaluate irrigation benefits without assessing its feedback on watershed hydrology. Emerging research has shown that irrigation can significantly alter evapotranspiration, reduce groundwater recharge, and modify flow pathways [27,28], yet these feedback mechanisms remain poorly quantified at watershed scale in Ethiopia.
Moreover, existing studies generally adopt single-factor or additive approaches, examining climate change, land-use change, or management practices independently. Very few studies have explored the interaction effects between emission scenarios, temporal scales, and management options, despite growing evidence that hydrological and agricultural responses are inherently non-linear and interaction-driven [29,30]. As a result, the combined and potentially compounding impacts of climate change and irrigation expansion on water availability and crop productivity remain inadequately understood. Therefore, this research investigates the impact of climate change and extensive irrigation on the hydrologic system and crop yield in the Geba watershed, addressing specific objectives such as (i) quantifying the hydrological future under climate change; (ii) comparing crop-yield responses under rainfed and irrigated management; and (iii) identifying the extent to which scenario, period, and management interactions shape water availability and agricultural outcomes.
2. Materials and Methods
2.1. Study Area
The Geba watershed is located in the Tigray region of northern Ethiopia and forms part of the Tekeze-Atbara basin. The catchment covers about 2440 km2 and ranges from approximately 930 to 3300 m a.s.l., located on the geographically boundary coordinates of 13°32′24″ to 14°15′00″ north and longitudes 39°18′18″ to 39°47′45″ east. The main tributaries are Suluh, Genfel, and Agulae, to form the main Geba River (near Geba Lake, west of Mekelle), which flows towards the Tekeze River in a predominantly dendritic drainage pattern influenced by major geological structures [31,32]. Suluh, Genfel and Agulae have river flow gauging stations near Hawzien, Wukro and Agulae towns respectively. The basin has rugged topography, steep average slopes, and a semi-arid-to-dry sub-humid climate with marked seasonality. Most rainfall occurs during the Kiremt season (June–September), while a smaller and less reliable Belg season may occur from March to May. Annual rainfall varies strongly across elevation zones, and long-term potential evapotranspiration exceeds rainfall, making the basin hydrologically water limited. Runoff is seasonal, and groundwater recharge is comparatively small, which increases the sensitivity of both rainfed and irrigated agriculture to climatic change. The main crops of the region are the Ethiopian native cereal called teff (Eragrostis tef, Zucc.), maize, and wheat. Its geographical location is described in Figure 1.
Figure 1.
Map description of the study area. Ethiopian regions (top left), Tigray region (bottom left), Geba watershed with the position of gauging stations at outlets (right).
2.2. Data Collection and Missing Data Treatment
Historical daily precipitation and maximum and minimum temperature records were obtained primarily from the Ethiopian Meteorological Institute (EMI), with supplementary rainfall observations from nearby stations where necessary, while daily streamflow data at the Geba River outlet near Mekelle were acquired from the Ethiopian Ministry of Water and Energy (MoWE). Prior to hydrological modelling, all hydro-meteorological datasets underwent comprehensive quality control, including consistency checks, outlier detection, and identification of missing observations. A hierarchical gap-filling strategy was implemented according to the duration and location of missing records to preserve the temporal characteristics of the climate series. Missing observations occurring at the beginning or end of the observation period were excluded (censored), as reliable estimation of endpoint gaps is generally not feasible without adjacent observations and may introduce substantial uncertainty into subsequent analyses. This approach is widely recommended in hydro-meteorological time-series preprocessing to avoid bias associated with extrapolation of incomplete records [33,34].
Internal missing records were filled using methods appropriate to the length of the data gap. Short gaps of seven consecutive days or less were reconstructed using linear interpolation, which effectively preserves the statistical characteristics of daily meteorological series when missing intervals are brief [34,35]. Longer missing periods, including gaps extending over several months or approximately one year, were reconstructed using the random forest (RF) machine-learning algorithm [36]. Random forest is a non-parametric ensemble approach capable of capturing complex nonlinear relationships among meteorological variables without assuming a predefined data distribution. In this study, observations from neighboring stations together with temporal predictors were used to estimate the missing daily values. Previous studies have demonstrated that random forest provides a more accurate and robust reconstruction of missing hydro-meteorological observations than conventional interpolation and regression methods, particularly for extended missing periods [36,37,38].
Spatial inputs (Figure 2c) included the World Cover 2021 land-cover dataset (10 m resolution) [32,39] provided by the European Space Agency, https://esa-worldcover.org/en (accessed on 21 January 2025), soil information was derived from the FAO Digital Soil Map of the World accessed from https://www.fao.org/soils-portal/data-hub/soil-maps-and-databases/faounesco-soil-map-of-the-world/en/, accessed on 21 January 2025 [40] (Figure 2a) and digital elevation data were obtained from the Shuttle Radar Topography Mission (SRTM) (Figure 2b, https://www.earthdata.nasa.gov/sensors/srtm, accessed on 21 January 2025 [41]. All spatial layers were reprojected, clipped to the watershed, and harmonized at 90 m spatial resolution before model setup. Slope classes (%) were limited to 4 classes (>5, 5–10, 10–20, >20) following [42,43]. Soil attributes were translated into SWAT-compatible hydraulic parameters using pedotransfer functions [44,45,46,47] and custom soil entries where necessary. Land, crop, and water-management information was compiled from field surveys, local crop calendars, and irrigation practice observations. To quantify irrigated crop productivity, structured field surveys were conducted on dominant crops such as onion (Allium cepa L.), tomato (Solanum lycopersicum L.), and maize, across representative farmer plots, following protocols similar to those used in recent agricultural water management studies [20,48].
Figure 2.
SWAT+ input layers (a) FAO soil unit code; (b) Slope classes from SRTM; (c) ESA land use/land cover.
2.3. Description of Hydrological Modeling
The Soil and Water Assessment Tool Plus (SWAT+3.0.5) is a semi-distributed, process-based eco-hydrological model developed to simulate the impacts of land management practices, climate variability, and environmental change on water, sediment, and agricultural production at watershed scale. It represents hydrological processes through the delineation of sub-basins and hydrological response units (HRUs), enabling the simulation of key components such as surface runoff, evapotranspiration, infiltration, lateral flow, groundwater recharge, and channel routing, while also integrating crop growth and management operations within a unified framework [7,49,50]. SWAT+ is an advanced evolution of the original SWAT model, developed to address structural limitations of earlier versions by introducing a more flexible spatial representation, improved water routing through landscape units, and enhanced modularity that allows better representation of complex watershed processes and management interventions [7,9]. Unlike the traditional SWAT model, SWAT+ separates landscape elements such as uplands, floodplains, and channels, thereby improving the realism of flow pathways and enabling more accurate assessment of land-use change, irrigation practices, and conservation measures. The model operates on a continuous time step and incorporates weather inputs (precipitation, temperature, solar radiation, wind speed, and humidity) to drive hydrological and plant growth processes, making it particularly suitable for evaluating climate change impacts on water resources and agricultural productivity in data-scarce regions [7,47,51]. Due to its robust physical basis, adaptability, and proven applicability across diverse environments, SWAT+ has become a widely used tool for integrated watershed management, climate change impact assessment, and sustainable agricultural planning worldwide
SWAT+ is calibrating the following hydrological balance equation on every location of the catchment
where
- SWt = final soil water content at time t (mm);
- SW0 = initial soil water content (mm);
- Rday = precipitation on day i (mm);
- Qsurf = surface runoff (mm);
- Ea = actual evapotranspiration (mm);
- Wseep = percolation from the soil profile to the vadose zone (mm);
- Qgw = return flow (baseflow/groundwater flow) (mm);
- t = time (days).
2.4. SWAT+ Model Setup
Following the preparation and harmonization of all spatial and climatic datasets, the SWAT+ model was configured and executed using a structured workflow aligned with established hydrological modeling protocols [8,9,10,12,42]. The model setup procedure comprised watershed delineation and hydrological response unit (HRU) definition, as described in Figure 3.
Figure 3.
Hierarchical framework diagram for simulating climate change impact on hydrological components and yields of major crops in the Geba watershed.
Watershed delineation was based on the processed digital elevation model (DEM) and a predefined flow-accumulation threshold, and hydrological response units (HRUs) were created from land use, soil, and slope classes using 10% thresholds to remove negligible landscape combinations. Observed weather inputs were linked to sub-basins, and a weather-generator file was prepared to provide missing climatic variables needed by the model (Figure 4).
Figure 4.
Watershed delineation: (a) Geba watershed sub-basins; (b) hydrological response units (HRUs).
The simulation period was 2006–2020, with a three-year warm-up period. Temporal splitting of observed records into independent calibration and validation phases is essential to test model transferability and predictive robustness under different hydroclimatic conditions [49,52].
Model sensitivity analysis was performed in the SWAT+ Toolbox2.4 using a Sobol variance-based approach [53,54]. It was employed to execute 100 model realizations (seed = 100) to ensure reproducibility of parameter sampling. The number of Monte Carlo samples was set to 500, balancing computational efficiency with statistical reliability of sensitivity indices, as adequate sampling size is essential to stabilize Sobol indices and ensure convergence of variance decomposition results in complex watershed models [53].
Unlike the sequential uncertainty fitting version 2 (SUFI-2) algorithm, which primarily estimates parameter and prediction uncertainty through the 95% prediction uncertainty (95PPU) together with the P-factor and R-factor during model calibration, the Sobol method is specifically designed to identify the relative contribution of individual parameters and higher-order parameter interactions to the overall variance of model predictions, thereby providing a comprehensive assessment of global parameter sensitivity [53,55].
Calibration and validation were then carried out against daily streamflow using standard metrics, including the Nash–Sutcliffe efficiency (NSE), Kling–Gupta efficiency (KGE), percent bias (PBIAS), mean square error (MSE), and root mean square error (RMSE). These metrics provide complementary assessments of model accuracy, bias, and variability representation and are widely adopted in watershed modeling studies [9,49].
Kling–Gupta efficiency (KGE)
Mean squared error (MSE)
Nash–Sutcliffe efficiency (NSE)
Root mean squared error (RMSE)
Percent bias (PBIAS)
where Y_sim = simulated streamflow (m3/s)
KGE = 1 − ((r − 1)2 + (β − 1)2 + (γ − 1)2)1/2
MSE = (∑ (Y_sim − Y_obs)2)/n
NSE = 1 − (∑(Y_sim−Y_obs)2)/(∑(Y_obs − Ŷ_obs))
RMSE = ((∑ (Y_sim − Y_obs)2)/n)1/2
PBIAS = (∑(Y_sim − Y_obs)) ∗ 100/(∑(Y_obs))
Y_obs = observed streamflow (m3/s)
Ŷ_obs = mean of observed streamflow (m3/s)
2.5. Climate Model Selection, Bias Correction, and Multi-Model Ensemble Development
2.5.1. Climate Model Selection, Bias Correction
Future and historical climate projections were derived from the CORDEX-Africa regional climate downscaling initiative using five regional climate models (RCMs), namely CCLM4-8-17, CanRCM4, REMO2009, RCA4, and CRCM5, driven by their corresponding global climate models (GCMs). These RCMs were selected because previous evaluations have consistently demonstrated their relatively superior ability to reproduce the climatology and seasonal rainfall characteristics of Ethiopia and East Africa, particularly within the Ethiopian Highlands and Upper Nile basin [56,57,58,59,60,61]. Daily precipitation (pr), maximum air temperature (tasmax), and minimum air temperature (tasmin) for the historical (1990–2005), mid-century (2046–2060), and late-century (2086–2100) periods under RCP 4.5 and RCP 8.5 emission scenarios were downloaded in NetCDF format. Station-scale climate series were extracted from the CORDEX grid cells using a reproducible workflow developed in Python 3.11 (packages: xarray, netCDF4, pandas, NumPy, GeoPandas, and SciPy) [54] with the complementary Climate Model Data for Hydrologic Modeling (CMhyd) tool [62].
The historical performance of each RCM was evaluated against observed station records for 1990–2005 before bias correction. Model skill was assessed using six complementary performance statistics—the KGE, NSE, RMSE, PBIAS, mean absolute error (MAE), and Pearson correlation coefficient (to collectively quantify systematic bias, absolute prediction error, temporal agreement, variability, and hydrological performance)— that are widely recommended for evaluating climate simulations used in hydrological modelling [63,64,65,66]). Systematic biases in daily precipitation, maximum temperature, and minimum temperature were subsequently corrected using quantile mapping (QM) and distribution mapping (DM), both of which adjust the complete probability distribution rather than only the mean climate. Quantile mapping showed relatively better performance for correcting precipitation distributions, rainfall extremes, and seasonal variability in our study and other studies across Ethiopia, the Upper Blue Nile basin, and East Africa [61,67,68,69,70], while distribution mapping has shown comparable performance for temperature variables and in regions with relatively stable climatic distributions [65,71]. Consequently, quantile mapping was applied because of its better overall performance according to RMSE, MAE, PBIAS, r, KGE, and NSE for the final corrected climate datasets.
where
Pcorr = Fobs−1 (Fmod (Praw))
- Praw = raw RCM precipitation;
- Fmod = model CDF;
- Fobs−1 = inverse observed CDF;
- Pcorr = corrected precipitation.
2.5.2. Multi-Model Ensemble Development
To reduce the uncertainty associated with each of 5 regional climate models (RCMs), this study employed a performance-based weighted multi-model ensemble (MME) approach. Rather than assigning equal importance to all climate models, individual model weights were determined according to their ability to reproduce the observed historical climate (1990–2005) using the above specified performance metrics, including NSE, KGE, r, RMSE, MAE, and PBIAS. Climate models demonstrating superior agreement with observed precipitation and temperature records were assigned larger weights in the ensemble, whereas models with relatively poorer performance contributed proportionally less. The weighted ensemble was subsequently used to generate future daily precipitation, maximum temperature, and minimum temperature under the RCP 4.5 and RCP 8.5 scenarios for the periods 2046–2060 and 2086–2100. Compared with single-model projections or simple arithmetic averaging, performance-based weighting generally produces more reliable climate projections by reducing systematic model biases and better representing regional climatic conditions, thereby providing a more robust basis for subsequent SWAT+ simulations of watershed hydrology and crop yields [63,72,73,74,75].
Accordingly, we employed the entropy weight method of model ensemble following [76].
- XMME = weighted ensemble daily precipitation (mm day−1), or daily maximum temperature, or daily minimum temperature;
- Xi = daily precipitation or daily maximum, or daily minimum temperature simulated by the ith CORDEX-Africa model;
- wi = normalized weight assigned to the ith model;
- n = number of selected climate models.
This was subject to the following constraint:
The weight of the RCMs models was assigned based on the following:
where
- wj = weight assigned to model j;
- Scorei = weighted ranking score;
- m = number of climate models.
We have utilized the weight for each metric based on the following:
Normalizing using the following:
2.6. Climate Scenarios and Management Scenarios Setup
Locally representative crop yield values are described in Table 1. Detailed representative crop management data for onion, tomato and maize, the dominant irrigated crops (Table 2), and wheat, maize, and teff, the dominant cereal rainfed crops (Table 3) in the watershed, were used in the SWAT+ simulation for the Geba watershed.
The study adopted a multiple-evidence approach to establish representative calibration targets for rainfed maize, teff, and wheat, and for irrigated onion, tomato and maize. Rather than relying on a single source of information, crop yield data were synthesized from two complementary sources: (i) crop yield assessment conducted through structured interviews with experienced farmers, development agents, and agricultural experts within the study watershed and (ii) published peer-reviewed literature. Nevertheless, uncertainties associated with future climate variability, changing crop management practices, technological advancement, and socioeconomic development remain unavoidable and should therefore be considered when interpreting future crop yield projections under the RCP 4.5 and RCP 8.5 climate scenarios ([55,77,78,79]. The selected crop yield values were used for editing plant growth parameters manually hence fitting those crop yields with their SWAT+ default crop growth parameters like harvest index (HI).
Table 1.
Representative baseline crop yields (grain or marketable) based on watershed assessment in the watershed and literature in and around the watershed areas.
Table 2.
Major crops included in the irrigated agriculture for SWAT+ land use management input of the Geba watershed (Geba Watershed Survey, 2025, unpublished).
Table 3.
Major crops included in the rainfed agriculture for the SWAT+ land use management input of the Geba watershed (Geba Watershed Survey, 2025, unpublished).
For each climate pathway, two management settings were examined: (i) rainfed agriculture representing baseline practice and (ii) irrigated agriculture representing strategic irrigation expansion including the existing rainfed practice. This scenario design made it possible to isolate and compare the effects of climate forcing, management, and their interactions (Table 4).
Table 4.
Scenario setup for climate period and agricultural management types.
Crop management inputs were applied under both the irrigation expansion scenario and the existing rainfed management scenario. The importance of management inputs in improving model reliability for simulating hydrological and agricultural responses under changing climate conditions in northern Ethiopia has been highlighted in [87,88].
Table 3 lists the SWAT+ input data for the study watershed, these data are parameterized using locally representative management practices for wheat, maize, and teff cultivated during the summer rainy season [89]. Meanwhile Table 2 shows the crops grown under irrigation. The curve number classification, contour farming, and fertilizer application rates were incorporated to reflect dominant soil and water conservation and nutrient management practices in the study watershed based on field survey. The use of those locally calibrated agricultural inputs improves the reliability of SWAT+ hydrological simulations under semi-arid conditions [8,90,91].
The scenario codes (Table 4) were systematically developed by integrating three key simulation components: climate period, emission pathway (RCP type), and agricultural management options. Each code begins with an abbreviation representing the temporal period, where “BASE” denotes the historical baseline period (2006–2020), “MID” represents the mid-century projection period (2046–2060), and “LATE” indicates the late-century projection period (2086–2100). The second component of the code corresponds to the climate forcing scenario, where “45” and “85” represent the RCP 4.5 and RCP 8.5 emission pathways, respectively, while the baseline scenarios were linked to historical climate conditions. The final component identifies the management practice, with “RAIN” indicating rain-fed agriculture and “IRR” representing irrigation management. For example, the scenario code “MID_45_IRR” refers to the mid-century period under the RCP 4.5 climate scenario with irrigation management, whereas “LATE_85_RAIN” represents late-century conditions under RCP 8.5 with rain-fed agriculture for the systematic comparison of hydrological and agricultural responses across climate and management conditions.
2.7. Statistical Analysis
SWAT+ model outputs were evaluated using relative change analysis, paired sample t-tests, and one-way analysis of variance (ANOVA) to quantify and statistically assess the impacts of future climate change on watershed hydrological processes and crop productivity. To determine whether the projected changes were statistically significant rather than arising from natural climate variability or model uncertainty, paired sample t-tests were performed to compare the simulated outputs between the baseline and each future climate scenario for corresponding time periods. Because the same watershed and simulation framework were used under different climate conditions, while the paired t-test was used for assessing whether the mean differences between paired simulations are statistically significant. The statistical analyses were conducted separately for each crop to evaluate whether simulated yields differed among climate scenarios, management practices, and projection periods.
Relative change analysis was employed to determine the magnitude and direction of changes in simulated hydrological components and crop yields under the RCP 4.5 and RCP 8.5 climate scenarios for the mid-century (2046–2060) and late-century (2086–2100) periods relative to the baseline period (2006–2020). This approach provides a straightforward measure of the percentage increase or decrease in model outputs, thereby facilitating the interpretation of climate change impacts across different scenarios and time horizons. The analysis was applied to key hydrological variables, including precipitation, evapotranspiration, surface runoff, lateral flow, groundwater recharge (percolation), and water yield, as well as to the simulated yields of rainfed maize, teff, and wheat, and irrigated wheat, tomato, and onion. In addition, the relative changes in crop yields under the RCP 8.5 scenario were directly compared with those under the RCP 4.5 scenario to evaluate the influence of increasing greenhouse gas concentrations on agricultural productivity.
Before hypothesis testing, the assumptions underlying parametric analyses were evaluated. Normality was assessed using the Shapiro–Wilk test, homogeneity of variances using Levene’s test, and independence was justified by the study design, whereby each annual crop yield represented an independent SWAT+ simulation under a unique combination of climate scenario, management practice, and simulation year. Collectively, these statistical analyses were aimed to provide both quantitative and inferential evidence for evaluating climate change impacts, thereby improving the robustness and reliability of the study’s conclusions regarding future watershed hydrology and agricultural productivity [8,55,92].
3. Results
3.1. Sensitivity Analysis
As shown in Table 5, sensitivity analysis reflected that the curve number (CN2) was the most influential parameter for daily streamflow, followed by saturated hydraulic conductivity and soil-available water capacity. This ranking indicates that runoff generation and soil-water storage are the dominant controls on simulated hydrological response in the watershed. This result aligns with recent SWAT applications in Ethiopian catchments, where CN2 consistently emerges as a dominant parameter due to the region’s pronounced rainfall seasonality and heterogeneous land cover patterns [93,94,95]. The saturated hydraulic conductivity (k) and soil-available water capacity (SOL_AWC) demonstrate moderate sensitivity (0.162 and 0.101, respectively), These findings corroborate recent studies emphasizing the significance of soil hydraulic properties for accurate hydrological simulation in data-limited regions [96,97]. This pattern is consistent with sensitivity analyses from other semi-arid environments where surface runoff parameters often show variable influence depending on catchment characteristics and temporal resolution [98,99,100].
Table 5.
Sensitivity analysis results for the Geba watershed under baseline condition (rain-fed agricultural land use management).
3.2. Model Performance
The calibrated SWAT+ model reproduced the observed daily streamflow with satisfactory performance for the data-scarce semi-arid watershed (Table 6). During calibration, the model achieved an NSE of 0.56, KGE of 0.64, and PBIAS of −0.74%, indicating good agreement between simulated and observed streamflow and an excellent representation of the watershed water balance. Model performance remained satisfactory during validation (NSE = 0.50; KGE = 0.54), although the positive PBIAS (23.29%) indicates a tendency to overestimate streamflow during the independent validation period. According to Moriasi et al. [49,101], daily streamflow simulations with NSE values ≥ 0.50 and |PBIAS| ≤ 25% are considered satisfactory for watershed-scale hydrological applications. Similarly, KGE values greater than 0.50 indicate acceptable predictive skill because the Kling–Gupta efficiency simultaneously evaluates correlation, variability, and bias, thereby providing a more comprehensive assessment of model performance than NSE alone [64,66].
Table 6.
Calibration and validation performance metrics values.
The relatively lower validation performance and increased positive bias are expected in data-scarce semi-arid watersheds, where hydrological modelling is challenged by highly variable rainfall, infiltration-excess runoff, ephemeral streamflow, and strong spatial heterogeneity. In addition, uncertainties associated with sparse hydro-meteorological observations, precipitation inputs, soil properties, land-use representation, and parameter equifinality can reduce model accuracy, particularly during validation [8,102,103]. Consequently, moderate NSE and KGE values are commonly regarded as acceptable in poorly monitored basins and have been widely reported in SWAT applications across data-limited environments. Therefore, despite a tendency to overestimate streamflow during validation, the calibrated SWAT+ model is considered sufficiently reliable for simulating watershed hydrological processes and evaluating the impacts of future climate and management scenarios, while recognizing the inherent uncertainty associated with predictions in data-scarce regions [8,104].
The SWAT+ calibration curve (Figure 5) and validation curve (Figure 6) demonstrate satisfactory agreement between observed and simulated streamflows, indicating that the model reasonably captured the temporal variability and seasonal hydrological dynamics of the Geba watershed. Although some peak flow events were slightly underestimated or overestimated, the model successfully reproduced overall flow patterns, confirming its suitability for evaluating climate change and irrigation impacts in this semi-arid watershed.
Figure 5.
Calibration curves of streamflow in Geba watershed.
Figure 6.
Validation curves of streamflow in Geba watershed.
3.3. Projected Changes in Hydrological Components
The rainfed management scenario presents a more complex but notably less extreme response (Figure 7a,b). When comparing the different scenarios, different responses are contextualized where it shows a mixed signal for surface runoff components. For instance, surface runoff generation (surq_gen_mm) shows a decreasing trend by mid-century of the rainfed RCP 4.5 scenario but an increasing trend by the late century of the rainfed RCP 8.5 scenario. It decreases by −18% to −12% in mid-century before shifting to positive values (+30% to +60%) by late-century under the RCP 8.5 scenario. Actual evapotranspiration (et_mm) rises consistently by approximately 20–30% across all scenarios, and soil evaporation (esoil_mm) also increases by approximately 25–45% across all scenarios. In contrast, percolation (perc_mm) declines strongly (−40 to −50%) across all scenarios, except where it increases by 50% with the late RCP 8.5 scenario, and lateral flow (latq_mm) decreases moderately across all scenarios. Total water yield (wateryd_mm) declines substantially (−30 to −50%), contrary to an increasing trend (+55) for late-century of RCP 8.5 scenario.
Figure 7.
Projected relative change (%) of hydrological components under the RCP 4.5 and RCP 8.5 scenarios for rainfed (a,b) and irrigated (c,d) management conditions for mid- and late-century periods compared with the historical periods.
Under the irrigated scenario (Figure 7c,d), the hydrological components exhibit a pattern of progressive intensification under RCP 8.5 by mid-to-late century, characterized by significant increases in surface runoff (surq_gen_mm) of +60% under RCP 8.5 and by decreases (−10% to −25%) by the mid-century of the RCP 4.5 and RCP 8.5 scenarios. The lateral flow (latq_mm) drops sharply by approximately −20 to −60% under all periods and RCPs. Total water yield (wateryd_mm) also declines substantially (−20 to −55%) in all scenarios except where there is an increase of +60% across late-century RCP 8.5. Percolation experiences the largest reductions (−25 to −80%), while potential evapotranspiration shows a narrow variation response that increases by 12% under late-century RCP 4.5 but increased (+7% to +9%) under other scenarios. The actual evapotranspiration (et_mm) has an increasing trend across all scenarios, with an increase of up to (+25%) under late-century RCP 8.5. Soil moisture indicators (sw_final_mm, sw_ave_mm) all decrease. This pattern is consistent with RCP-based climate projections for the Geba by [19]. These same studies project mean annual streamflow decreasing by 0.93–1.67% for RCP 4.5 and 1.3–1.76% for RCP 8.5, confirming the declining water availability trajectory depicted in Figure 7 [105,106]. This drier future, a reasonable result of the use of irrigation, with chronic water scarcity is strongly supported by research in the Geba basin, where analysis of long-term hydrological and [105] meteorological data reveals that the climate is changing, with streamflow showing declining trends [107,108,109]. Both sets of results, however, agree on a general tendency for reduced groundwater recharge (perc_mm) and altered seasonal water partitioning, which is consistent with studies examining climate controls on ecohydrological responses in the highlands of northern Ethiopia [72]. The projected reductions in baseflow and groundwater recharge are particularly concerning given that groundwater already represents only 6–8% of the water balance in the Geba basin [110,111]. This demands the strengthening of the ongoing implementation of water harvesting structures that already significantly alter hydrological responses at catchment scales [112,113].
The stark contrast between scenarios reveals a critical finding: irrigation may inadvertently amplify hydrological vulnerability by creating artificial water demands that cannot be sustained under intensified climate forcing. Studies in the Tekeze sub-catchment confirm decreasing trends in annual rainfall (−20% under RCP scenarios) coupled with increasing temperatures and evapotranspiration [5,93,114,115,116,117], leading to projected reductions in groundwater recharge (−1.3% to −3.4%) and base flow (−0.55% to −1.5%) [118].
For the Geba watershed specifically, research indicates that approximately 61% of precipitation is lost to evapotranspiration under baseline conditions, with only 18% becoming surface runoff and 8% recharging deep aquifers, highlighting the precarious water balance that climate change will further stress [119]. In this watershed, promoting rainfed agriculture with integrated soil and water conservation may prove more climate-resilient than expanding irrigation infrastructure, particularly given projections of decreasing rainfall (−2% to −3%), increasing evapotranspiration (+2.6% to +4.3%), and declining streamflow (−0.93% to −1.76%) in the region [19,21].
Nature-based solutions that enhance natural infiltration and groundwater recharge, rather than engineered irrigation systems that exacerbate runoff and evapotranspiration losses, appear better suited to the semi-arid conditions of northern Ethiopia. Furthermore, measures such as integrated watershed management practices improved infiltration, enhanced groundwater recharge, and reduced direct runoff despite increasing climate variability [115,120,121,122].
3.4. Effects of Scenario Interactions
The ANOVA results, as explained in Table 7, demonstrate that all explanatory variables significantly influenced the total water yield (wateryld_mm) responses of the watershed system, as indicated by the very high F-values and highly significant p-values (p < 0.001). Among the tested factors, the RCP type exhibited the strongest influence (F = 181.2), suggesting that differences in greenhouse gas emission trajectories substantially alter watershed hydrology. This finding is aligned with studies conducted in Ethiopian watersheds, where future climate scenarios under higher emission pathways produced considerable changes in runoff, evapotranspiration, groundwater recharge, and water yield due to increased temperature and altered rainfall regimes. Similar observations were reported in the Upper Blue Nile basin, Lake Tana sub-basin, and Andasa watershed, where intensified climate forcing under future RCP scenarios significantly modified hydrological processes and seasonal streamflow behavior [123,124]. Furthermore, the significant effect of climate period (F = 116.4) indicates that hydrological responses vary considerably between future time horizons, implying that the impacts of climate change are progressive and intensify over time. This agrees with hydroclimatic studies in Ethiopia showing increasing variability in rainfall and temperature across future periods, leading to shifts in watershed water balance components and hydrological extremes [105,125].
Table 7.
ANOVA of changes in water yield (wateryld_mm) as affected by climate change and irrigation management scenarios.
The analysis (Table 7) also revealed that management type significantly affected watershed hydrology (F = 148.3), emphasizing the importance of irrigation and rainfed management practices in regulating hydrological processes. The relatively high F-value suggests that land and water management interventions strongly mediate climate change impacts on watershed behavior. This finding supports the results of previous studies in Ethiopia that demonstrate that irrigation practices, land-use dynamics, and watershed management interventions substantially influence surface runoff, infiltration, evapotranspiration, and groundwater recharge. In semi-arid Ethiopian watersheds, irrigated systems often increase evapotranspiration and soil moisture storage while reducing direct runoff variability when compared with rainfed systems, thereby modifying watershed resilience under climate stress [108,126]. In addition, the significant effect of the “Code” factor (F = 4.72) indicates that individual hydrological variables responded differently to climate and management interactions, reflecting the complex and heterogeneous nature of watershed hydrological processes. This amplifies the importance of local watershed characteristics in modulating hydrological responses to climate forcing, consistent with ensemble modeling studies emphasizing that structural uncertainty from hydrological models and spatial heterogeneity often exceeds scenario uncertainty in water resource projections [72]. Such variability among hydrological components has also been reported in Ethiopian and East African watersheds where climate change and land management produced differentiated responses in surface runoff, lateral flow, percolation, and water yield depending on watershed characteristics and ecosystem conditions [127].
These complex interactions reflect the non-linear responses characteristic of hydrological systems to combined climate forcing, supporting findings that future water availability projections must account for multiplicative effects between changing precipitation regimes, temperature-driven evapotranspiration increases, and the inherent non-stationarity of watershed responses [30].
The ANOVA results (Table 8) for channel surface runoff (surq_cha_mm) indicate that climate-related factors exerted a highly significant influence on runoff generation within the watershed system. Among the tested variables, the climate period showed the greatest effect (F = 65.8, p < 0.001), followed closely by RCP type (F = 56.9, p < 0.001), demonstrating that temporal climate evolution and greenhouse gas emission pathways strongly control channel runoff responses. This finding aligns with global climate impact research demonstrating that radiative forcing trajectories are the dominant source of divergence in hydrological projections, with higher emission pathways consistently amplifying both the magnitude and uncertainty of surface runoff estimates across diverse climatic regimes [128].These findings suggest that projected future changes in precipitation intensity, rainfall variability, and temperature regimes substantially alter runoff generation processes and streamflow dynamics. Similar studies in Ethiopian watersheds have reported that future climate scenarios under RCP 4.5 and RCP 8.5 significantly modify surface runoff and channel flow due to shifts in rainfall distribution and increased hydrological extremes. For example, studies in the Andasa, Hangar, and Gilgel Abbay watersheds revealed substantial increases in wet-season runoff and hydrological variability under future climate scenarios, particularly during far-future periods and higher-emission pathways [110,123,129]. Moreover, research in northern Ethiopia showed that climate-induced changes in rainfall characteristics directly intensified surface runoff generation and watershed hydrological sensitivity, especially in semi-arid environments where runoff processes are highly responsive to precipitation fluctuations [111,112].
Table 8.
ANOVA of changes in channel surface runoff (surq_cha_mm) as affected by future climate change and irrigation management scenarios.
The management type (Table 8) also had a statistically significant effect on channel surface runoff (F = 7.48, p = 0.007), although its influence was comparatively smaller than climate-related drivers. This result indicates that irrigation and rainfed management systems differently regulate runoff partitioning and channel flow behavior through their impact on infiltration, soil moisture retention, evapotranspiration, and overland flow generation. In Ethiopian watersheds, land and water management practices have been widely recognized as critical modifiers of runoff responses under climate change conditions. Improved watershed management and irrigation practices can reduce peak runoff and enhance infiltration, whereas poorly managed rainfed systems often increase direct runoff and channel discharge during intense rainfall events. The highly significant effect of the “Code” factor (F = 12.46, p < 0.001) further suggests that hydrological variables responded heterogeneously to climate and management interactions, reflecting the complexity of watershed hydrological processes. Comparable findings have been reported in the Central Rift Valley basin, Genale watershed, and other Upper Blue Nile sub-basins, where hydrological components such as surface runoff, lateral flow, and water yield exhibited variable sensitivities to climate forcing and watershed management interventions [112,113]. Overall, the ANOVA results confirm that future channel surface runoff dynamics in Ethiopian watersheds are primarily governed by climate scenario evolution and temporal climate change progression, while watershed management practices play an important moderating role in runoff regulation and hydrological resilience.
The ANOVA results for actual evapotranspiration (et_mm) in (Table 9) indicate that all explanatory variables significantly influenced evapotranspiration dynamics within the watershed, with management type exerting the strongest effect (F = 229.4, p < 0.001). This exceptionally high F-value demonstrates that irrigation and rainfed management systems substantially modify evapotranspiration processes through their impacts on soil moisture availability, vegetation growth, crop water use, and land-atmosphere interactions. In irrigated systems, increased soil water availability generally enhances plant transpiration and evaporation losses, leading to higher actual evapotranspiration compared with rainfed conditions. Similar findings have been reported in Ethiopian watersheds where irrigation expansion and agricultural water management significantly altered evapotranspiration patterns and watershed water balance components under changing climatic conditions [130,131,132]. Studies in the Bilate River basin and Awash River basin further revealed that evapotranspiration is highly sensitive to land and water management interventions because vegetation cover, soil moisture retention, and agricultural practices directly regulate atmospheric water demand and energy exchange processes [132,133,134]. Moreover, the significant influence of the “Code” factor (F = 10.87, p < 0.001) indicates that hydrological variables responded heterogeneously to management and climate interactions, reflecting the complexity of watershed hydrological processes and ecosystem responses under climate stress.
Table 9.
ANOVA of changes in actual evapotranspiration (et_mm) as affected by future climate change and irrigation management scenarios.
Climate-related variables also showed highly significant effects on actual evapotranspiration, with RCP type (F = 45.6, p < 0.001) and climate period (F = 32.8, p < 0.001) (Table 9), demonstrating that future greenhouse gas emission pathways and temporal climate progression strongly influence evapotranspiration behavior [135].
Comparable studies in the Upper Blue Nile basin, Lake Finchaa watershed, and other Ethiopian basins reported substantial increases in evapotranspiration under future RCP 4.5 and RCP 8.5 scenarios due to projected warming and hydroclimatic variability [123,136]. Research conducted in the Blue Nile headwaters also demonstrated that rising temperature and seasonal aridity significantly increase evapotranspiration rates and reduce water availability, especially during far-future climate periods and high-emission scenarios [137]. Therefore, the ANOVA findings confirm that future evapotranspiration dynamics in Ethiopian watersheds are jointly controlled by climate forcing and watershed management practices, with management interventions playing a dominant role in regulating water losses and hydrological resilience under climate change conditions [138].
The T-test analysis (Table 10) revealed substantial differences in hydrological responses between rainfed and irrigated management systems, indicating that water management practices significantly alter watershed hydrology and soil–water dynamics. Variables associated with subsurface water movement and soil-water storage, including lateral flow (latq_mm), percolation (perc_mm), soil water content (sw_final_mm, sw_ave_mm, sw_300_mm), plant transpiration (eplant_mm), and soil evaporation (esoil_mm), showed highly significant differences (p < 0.001). Lateral flow (latq_mm) is significantly higher in rainfed systems (101.8 mm) compared with irrigated systems (66.9 mm; T = 5.42, p <0.001), while percolation to groundwater (perc_mm) shows an even more pronounced difference (T = 6.22, p <0.001), with rainfed systems recharging 3.5 times more groundwater (2.85 mm) than irrigated systems (0.81 mm). In contrast, surface runoff generation (surq_gen_mm), water yield (wateryld_mm), evapotranspiration (et_mm), and channel surface runoff (surq_cha_mm) did not show statistically significant differences between the two management options. The irrigated system exhibited markedly higher plant evapotranspiration and potential evapotranspiration, while the rainfed system maintained significantly greater soil evaporation and soil-water storage. These findings indicate that irrigation substantially reduces subsurface flow generation and groundwater recharge, likely through combined effects of soil moisture depletion by crops and reduced deep percolation during irrigation events, aligning with global assessments showing that intensive irrigation can significantly diminish groundwater recharge and alter baseflow contributions to streams in agricultural catchments [138]. Potential evapotranspiration (pet_mm) is significantly higher under irrigation (1744.6 mm) than rainfed conditions (1692.2 mm; T = −3.39, p < 0.001), suggesting that irrigated areas create localized atmospheric feedbacks through increased moisture availability, consistent with research demonstrating that irrigation can modify regional climate by increasing atmospheric humidity and altering surface energy balance partitioning [139].
Table 10.
t-test analysis of hydrological components as affected by management options.
The highly significant reduction in soil evaporation (esoil_mm) and increase in plant evapotranspiration (eplant_mm) under irrigation further indicate a shift from non-productive evaporation toward productive crop water use (Table 9). This reflects improved vegetation cover and greater canopy development in irrigated systems, which suppress direct soil evaporation while enhancing transpiration-driven water fluxes. The significantly lower soil-water storage variables under irrigation suggest the continuous abstraction of water by crops and increased drainage losses through percolation, consistent with findings from tropical floodplain irrigation studies in Ethiopia, where deep percolation and evapotranspiration were identified as dominant hydrological processes under irrigated agriculture [140]. Moreover, the insignificant difference in total water yield and surface runoff between rainfed and irrigated systems implies that irrigation mainly redistributes internal water balance components rather than substantially changing total watershed outflow. Similar hydrological behavior has been reported in SWAT-based watershed assessments in Ethiopia, where agricultural management practices strongly influenced evapotranspiration, soil moisture, and groundwater recharge while exerting relatively smaller effects on overall streamflow generation [141].
3.5. Projected Crop-Yield Responses
The assumption of homogeneous variance was satisfied for wheat, maize, teff, and onion (Levene’s test, p > 0.05), whereas tomato exhibited heterogeneous variances because one or more treatment groups contained nearly constant simulated values (Table 11). The Shapiro–Wilk test indicated that wheat and tomato satisfied the normality assumption, while maize, teff, and onion deviated from normality. Nevertheless, one-way ANOVA is generally robust to moderate departures from normality, particularly in balanced experimental designs where group variances are homogeneous, making it suitable for evaluating differences among simulated crop responses.
Table 11.
Assumptions (normality, independence, homogeneity of variance).
The inferential analysis (Table 12) demonstrated that irrigation management exerted a stronger influence on crop productivity than the projected climate scenarios. Independent-samples T-tests showed highly significant differences between rainfed and irrigated systems for wheat (T = 8.81, p < 0.001) and teff (T = 19.76, p < 0.001), indicating that supplemental irrigation substantially increased simulated yields under the modelled management conditions. In contrast, maize did not exhibit a statistically significant response to management (T = 0.96, p = 0.341), suggesting that its simulated productivity was comparatively less sensitive to irrigation within the tested scenarios. Similarly, one-way ANOVA indicated no significant differences in crop yields among historical, mid-century, and late-century periods or among the historical, RCP 4.5, and RCP 8.5 climate scenarios for maize, tomato, and onion (p > 0.05). Wheat and teff also showed no significant differences among climate periods or emission scenarios despite their strong response to irrigation. These findings suggest that, within the selected CORDEX climate realization and SWAT+ modelling framework, management interventions produced larger changes in crop productivity than the projected climate forcing alone.
Table 12.
One way ANOVA of crop yield (t ha−1) affected by the variables of period and RCP type.
A 1 °C increase in maximum temperature has been estimated to reduce wheat yields by approximately 4–6%. The strong management effect is particularly noteworthy: under irrigation, wheat shows modest gains at mid-century (+5%) and even a late-century increase under RCP 8.5 (+7.8%), suggesting that irrigation can buffer against late-century warming. This aligns with research indicating that supplementary irrigation is most effective in drought-prone basins and for drought-vulnerable crops.
Figure 8 elucidates the temporal dynamics of crop yield differentials between emission scenarios, revealing that rainfed systems exhibit greater sensitivity to high-emission pathways during mid-century, while both management regimes show convergence toward positive differentials under late-century conditions due to the CO2 fertilization effect (Figure 8). Under rainfed conditions, the difference between RCP 4.5 and RCP 8.5 reaches 0.3 (t ha−1) during the mid-century period, indicating that the more extreme emission pathway causes substantially greater yield reductions when compared with RCP 4.5 during this time frame (Figure 8). This finding aligns with process-based model simulations from the Ethiopian highlands, which project that, under RCP 8.5, growing season temperatures will increase by 1.3–2.1 °C for sorghum and 1.1–1.9 °C for maize during the 2040–2069 period, leading to yield declines of 5–25% for sorghum and 10–40% for maize relative to baseline [137,142].
Figure 8.
Projected yield change (t ha−1) (RCP 4.5–RCP 8.5) on the irrigation (left) and rainfed (right) management conditions.
Wheat yields show a strong statistical response to scenario code (F = 10.715, p < 0.001) and management type (T = 8.805, p < 0.001) as displayed in Table 12; and the projected yield changes +19.6% under mid-century RCP 4.5 and +16.3% under mid-century RCP 8.5 (Figure 9), suggesting that moderate warming may initially benefit wheat in rainfed systems, potentially through CO2 fertilization effects or extended growing seasons at higher altitudes. However, by the late century, RCP 4.5 yields remain only marginally above historical levels (+5.2%), while RCP 8.5 yields turn slightly negative (−1.0%). This trajectory is consistent with findings from recent modelling studies, which project that climate change is likely to reduce wheat grain yield and water use efficiency by 1% and 16.3%, respectively, by 2050 under conventional practices [143]. A 1 °C increase in maximum temperature has been estimated to reduce wheat yields by approximately 4–6% [81]. The significant management effect is particularly noteworthy: under irrigation, wheat shows modest gains at mid-century (+5%) and even a late-century increase under RCP 8.5 (+7.8%), suggesting that irrigation can buffer against late-century warming. This aligns with research indicating that supplementary irrigation is most effective in drought-prone basins and for drought-vulnerable crops.
Figure 9.
SWAT+ simulated relative crop yield change (%) on future periods under RCP 4.5 and RCP 8.5 when compared with historical period under the irrigation expansion scenario (right) and the rainfed condition scenario (left).
Teff exhibits pronounced and statistically robust responses, with scenario code (F = 46.137, p < 0.001) and management type (T = 19.755, p < 0.001) both showing high significance (Table 12). The yield projections relate to where rainfed teff shows only marginal gains under mid-century RCP 4.5 (+3.2%) but declines of 6.9% under mid-century RCP 8.5, and substantial losses of 12–13% under both late-century scenarios (Figure 9). Under irrigation, teff yields decline across all future scenarios, with losses reaching 36% under late-century RCP 4.5. This vulnerability is corroborated by multiple regional studies. Under the SSP2–4.5 scenario, suitable areas for teff are projected to decrease by 25% in the 2080s [144]. Under the worst climate change scenario, teff is projected to have the largest decline in average yields (−12.0%) among major cereals [144]. A 1 °C increase in maximum temperature reduces teff yields by approximately 3–5% [81]. The extreme sensitivity of teff to both climate and management underscores the urgent need for climate-resilient varieties and improved water management strategies for this staple Ethiopian crop [81,144].
Maize yield projections show consistent positive changes across all rainfed scenarios (+13–25%), with relatively modest differences between RCPs and time periods (Figure 9). Nationally, the average impact of climatic trends on maize yields has been estimated as a modest 3.2% decrease [145]. However, this national average masks significant spatial heterogeneity. In some locations, climate change could reduce maize yields by an average of 4–16% by 2030 [146], while other studies project that maize yields in semi-arid areas of Ethiopia could decrease by up to 46% by the 2080s. Maize yields are highly sensitive to seasonal rainfall and temperature fluctuations, particularly during critical phenological stages [147]. The non-significance of management type for maize (T = 0.962, p = 0.341) may reflect the fact that, even under irrigation, maize yields show only modest improvements, suggesting that other factors, such as cultivar choice, planting dates, and soil management, may be more critical determinants of maize productivity than water management alone [148].
For tomato and onion, the statistical tests yield non-significant results for all factors, likely due to limited sample sizes (Table 12). Nevertheless, the yield data reveal important patterns. Tomato shows absolute yields (25–34 t ha−1), Appendix A, Figure A7, but exhibits considerable variability across scenarios, with late-century declines of 20–25% under both RCPs. Onion yields are also highly variable, with projected losses of 22–37% across future scenarios. (Figure 9). The perishability of these crops, combined with their sensitivity to temperature and water stress, make them particularly vulnerable to climate change, necessitating targeted adaptation strategies.
4. Discussion
4.1. Hydrological Implications
The most robust signal emerging from this study is a shift toward a more evaporation-dominated water balance. Rising temperature increases atmospheric demand, and that demand is expressed in higher actual and potential evapotranspiration, with corresponding pressure on soil moisture, lateral flow, and recharge. This finding is consistent with studies in semi-arid regions showing that warming enhances evapotranspiration and reduces effective water availability [4,108,142,149,150]. In a basin where recharge is already limited, these changes imply less buffering capacity during the dry season and greater vulnerability of both ecosystems and agricultural production. Similar reductions in groundwater recharge under warming climates have been reported in both Ethiopian highlands and global dryland systems [28,139,142].
The interaction-dominated statistical results are also important. They indicate that management decisions cannot be evaluated independently of climate pathways and time horizons. This is particularly relevant in watersheds such as that of Geba, where steep terrain, variable rainfall, and a history of land-use change generate highly nonlinear responses. These findings align with global hydrological modeling studies emphasizing that climate change impacts emerge through complex interactions among climatic and land-surface processes rather than isolated drivers [29,30,72,151]. These findings highlight that water managers in the Geba watershed must plan for reduced future water availability, potentially exacerbated by increasing water demand and the ongoing implementation of water harvesting structures that already significantly alter hydrological responses at catchment scales [32,100,152].
4.2. Agricultural Implications
The statistical and relative change analyses reveal a clear hierarchy of climate vulnerability among Ethiopian crops. Teff emerges as the most sensitive, with highly significant responses to both scenario and management, and projected yield declines of 12–36% under late-century scenarios. This is consistent with research showing teff croplands are highly affected by climate change, particularly in lowland areas [144]. Wheat shows moderate sensitivity, with significant scenario and management effects, but with rainfed yields potentially benefiting from moderate warming before declining under the most extreme late-century scenario. Maize appears comparatively resilient, with non-significant statistical effects and consistently positive yield projections, though this masks significant spatial heterogeneity documented in the literature [145]. The significant effect of management type for wheat and teff underscores the critical role of irrigation as a climate adaptation strategy, particularly in drought-prone areas [1].
These findings have important policy implications. The differential vulnerability of crops suggests that adaptation strategies must be crop-specific. For teff, the priority should be developing heat- and drought-tolerant varieties and expanding irrigation infrastructure. For wheat, optimizing planting dates and water management could sustain yields under moderate warming. For maize, maintaining current productivity gains will require continued investment in improved cultivars and agronomic practices, even if climate impacts appear less severe at the aggregate level [145]. The non-significant results for vegetables highlight the need for more comprehensive data collection to better understand climate–vegetable yield relationships.
The irrigated scenarios show that irrigation should not be treated as a universal adaptation strategy. Although irrigation can increase transpiration and improve water supply to crops in the short term, it may also reduce groundwater recharge and intensify pressure on already limited water resources. This trade-off has been widely documented, where irrigation expansion increases consumptive water use and alters hydrological regimes [27,28,153]. The weak late-century performance of several irrigated crops indicates that irrigation efficiency, timing, and source sustainability matter as much as irrigation presence. Similar findings from global irrigation studies demonstrate that without efficient water management, irrigation may exacerbate long-term water scarcity under climate change [154,155].
Overall, the results reinforce the conclusion that locally relevant agricultural policies and targeted investments in adaptation are necessary to build Ethiopia’s food system resilience to climate and hydrological change by the mid-century [1].
4.3. Practical Implications and Study Limitations
The findings underscore the importance of implementing integrated climate adaptation strategies to enhance agricultural resilience under projected climate change. A portfolio of complementary adaptation measures is recommended, including optimized irrigation scheduling based on crop water requirements, conservation agriculture practices that enhance soil moisture retention and reduce evaporation losses, adjustment of planting dates to match shifting rainfall patterns, and the development or adoption of heat- and drought-tolerant crop cultivars, particularly for climate-sensitive crops such as teff. These measures can improve water-use efficiency, stabilize crop production, and reduce the vulnerability of farming systems to increasing climatic variability. The results are consistent with previous global and regional studies demonstrating that integrated soil–water–crop management substantially enhances agricultural resilience and productivity under changing climatic conditions [156,157]. Furthermore, although supplemental irrigation represents an effective adaptation option for improving crop productivity, its implementation should be integrated within watershed-scale water resources planning to ensure equitable and sustainable allocation of increasingly limited water resources. This systems-based approach is supported by recent studies emphasizing that successful climate adaptation requires coordinated agronomic, hydrological, institutional, and policy interventions rather than reliance on individual management practices alone [158,159].
Despite these important findings, several limitations should be acknowledged when interpreting the results. First, the study was constrained by the limited availability, incompleteness, and variable quality of long-term hydro-meteorological and agricultural datasets, necessitating preprocessing procedures such as gap filling, bias correction, and data harmonization that inevitably introduce additional uncertainty. Second, the climate projections were derived from an ensemble of bias-corrected CORDEX regional climate models, which remain subject to uncertainties associated with greenhouse gas emission scenarios, global climate model boundary conditions, regional climate model structures, and bias-correction techniques. Third, the hydrological and crop yield simulations depend on the assumptions and parameterization of the SWAT+ model. Although calibration and validation were undertaken, uncertainties arising from model structure, parameter estimation, equifinality, and input datasets cannot be completely eliminated. Finally, uncertainty propagates throughout the modelling chain, from climate projections to hydrological simulations and crop yield estimation, such that errors introduced at one stage may accumulate and influence subsequent model outputs. Consequently, the projected changes should be interpreted as plausible future scenarios rather than precise predictions. Nevertheless, the use of multiple climate models, weighted ensemble techniques, bias correction, and rigorous model calibration and validation substantially improves the robustness and credibility of the projected impacts.
5. Conclusions
This study assessed the combined impacts of future climate change and irrigation management on hydrological processes and crop productivity in the Geba watershed of northern Ethiopia using the SWAT+ model framework. The results demonstrated that future climate change will substantially modify watershed hydrology by shifting the basin toward a more evapotranspiration-dominated water balance. Increased atmospheric evaporative demand under future warming conditions led to higher actual evapotranspiration and surface runoff, while groundwater recharge, lateral flow, and soil-water storage generally declined across most climate scenarios. These findings indicate increasing hydrological stress and reduced subsurface water replenishment in the watershed under future climatic conditions.
The statistical analyses confirmed that climate forcing, temporal climate progression, and agricultural management significantly influence watershed hydrology. Among these factors, emission pathways exerted the strongest influence on hydrological variability, while significant interaction effects between climate scenarios, periods, and management systems highlighted the non-linear nature of watershed responses. The results further reveal that irrigation substantially alters flow partitioning by increasing plant transpiration and reducing groundwater recharge and soil-water storage. Although irrigation can enhance crop water use in the short term, extensive irrigation expansion under future climate conditions may intensify water scarcity by increasing consumptive water losses and reducing hydrological resilience.
Overall, the study demonstrates that although projected climate change will influence crop productivity in northeastern Ethiopia, crop management practices, particularly irrigation, exert a stronger influence on simulated yields than climate forcing alone. The inferential analyses showed that irrigation significantly increased wheat and teff yields, whereas maize exhibited comparatively limited sensitivity to irrigation, indicating crop-specific responses to water management. While climate scenarios did not produce statistically significant differences in yield for most crops within the selected CORDEX ensemble and SWAT+ simulations, the projected yield trajectories reveal that moderate warming may temporarily benefit wheat and maize under some mid-century scenarios through enhanced CO2 fertilization and favorable thermal conditions, whereas teff, tomato, and onion become increasingly vulnerable toward the late century, particularly under the high-emission (RCP 8.5) pathway. These findings suggest that the adverse effects of future climate change on Ethiopian agriculture are likely to be driven more by increasing temperature extremes and water stress than by changes in average climate alone. Consequently, strengthening climate-smart agricultural practices, including efficient irrigation, improved soil and water conservation, adjustment of planting calendars, and the adoption of heat- and drought-tolerant crop varieties, will be essential for sustaining agricultural productivity and food security. Given that agriculture remains the backbone of Ethiopia’s economy and is predominantly rainfed, integrating these adaptation measures with watershed-scale water resources management and climate-informed agricultural planning will be critical for enhancing resilience and ensuring sustainable agricultural development under future climate change.
Author Contributions
Conceptualization: A.W.M., M.J., M.G.G. and A.L.; methodology: A.W.M. and M.J.; formal analysis: A.W.M.; investigation: A.W.M. and M.G.G.; data curation: A.W.M. and M.G.G.; writing—original draft: A.W.M.; writing—review and editing: A.W.M., A.L., M.J. and M.G.G.; supervision: A.L. All authors have read and agreed to the published version of the manuscript.
Funding
Received a PhD scholarship from the Gerda Henkel Stiftung under the German–Ethiopian Scholarship Initiative, coordinated by Wolbert Smidt (project code: AZ 30/BE/21). The scholarship provided financial support during the doctoral study period. No specific grant number was assigned, and no direct external funding was received for the research activities reported in this study.
Institutional Review Board Statement
Not applicable. This study did not involve human participants or animals requiring ethical approval.
Informed Consent Statement
Not applicable.
Data Availability Statement
The data supporting the findings of this study, including climate, hydrological, land-use, and crop yield data, were obtained from the Ethiopian Meteorological Agency, the Ethiopian Ministry of Water, Irrigation and Electricity, field surveys, and SWAT model outputs. The data are available from the corresponding author upon reasonable request, subject to applicable restrictions.
Acknowledgments
The authors gratefully acknowledge the academic, institutional, and technical support received throughout this study. Adane Weldengus Meresa sincerely thanks Salvatore Di Falco for his exceptional supervision, continuous guidance, and strong academic support throughout the research process. His advice and support were crucial in addressing the various challenges encountered during this study. The author gratefully acknowledges the Gerda Henkel Stiftung for awarding a full scholarship through the German–Ethiopian scholarship program under the guidance of Wolbert Smidt. The Institute for Environmental Sciences (IES) and the Geneva School of Economics and Management (GSEM), University of Geneva, are gratefully acknowledged for providing an enabling academic environment. The Ethiopian Meteorological Institute is also acknowledged for providing the meteorological and hydrological data used in this study. Adane Weldengus Meresa extends his heartfelt gratitude to his family members—Tsige Kahsay, Arsema Adane, Bitanya Adane, Evana Adane, Henok Weldengus, Mebrat Amare, Nardos Woldegwergs, Aida Mesfin, and Haregeweyni Ataklti—for their unwavering encouragement, patience, understanding, and personal support throughout the research process. Their support was invaluable in helping him overcome the personal and practical challenges encountered during the study.
Conflicts of Interest
The authors declare no conflicts of interest.
Abbreviations
The following abbreviations are used in this manuscript:
| ANOVA | Analysis of variance |
| CCLM | COSMO climate limited-area modeling |
| CMIP | Coupled Model Intercomparison Project |
| CN2 | Curve number |
| CO2 | Carbon dioxide |
| CORDEX | Coordinated Regional Climate Downscaling Experiment |
| CRCM5 | Canadian Regional Climate Model version 5 |
| EMI | Ethiopian Meteorological Institute |
| DEM | Digital elevation model |
| ESA | European Space Agency |
| ET | Evapotranspiration |
| FAO | Food and Agriculture Organization of the United Nations |
| GIS | Geographic information system |
| GCM | Global climate model |
| HRU | Hydrologic response unit |
| KGE | Kling–Gupta efficiency |
| LULC | Land use/land cover |
| MAE | Mean absolute error |
| MoWE | Ministry of Water and Energy |
| MME | Multi-model ensemble |
| MPI-ESM-LR | Max Planck Institute Earth System Model–Low Resolution |
| NSE | Nash–Sutcliffe efficiency |
| PBIAS | Percent bias |
| PET | Potential evapotranspiration |
| PMME | Performance-based multi-model ensemble |
| QM | Quantile mapping |
| r | Pearson correlation coefficient |
| RCA4 | Rossby Centre Regional Atmospheric Model version 4 |
| RF | Random forest |
| RCM | Regional climate model |
| REMO2009 | Regional Model 2009 |
| RCP | Representative concentration pathway |
| RMSE | Root mean square error |
| SOL_AWC | Soil-available water capacity |
| SSP | Shared socioeconomic pathway |
| SRTM | Shuttle radar topography mission |
| SUFI-2 | Sequential Uncertainty Fitting version 2 |
| SWAT | Soil and Water Assessment Tool |
| SWAT+ | Soil and Water Assessment Tool Plus |
| T-test | Student’s t-test |
| UQAM | Université du Québec à Montréal |
Appendix A
Table A1.
Soil types and characteristics for the Geba watershed.
Table A2.
Soil types and characteristics description for the Geba watershed.
Table A3.
Land use land cover of the Geba watershed.
Table A4.
FAO soil classes (soil unit codes) of the Geba watershed.
Table A5.
Slope classes of the Geba watershed.
Table A6.
Hydro climatic characteristics of observed streamflow.
Figure A1.
Regression of observed flow (m3/s) and simulated flow (m3/s) for calibration with the SWAT+ model in the Geba watershed.
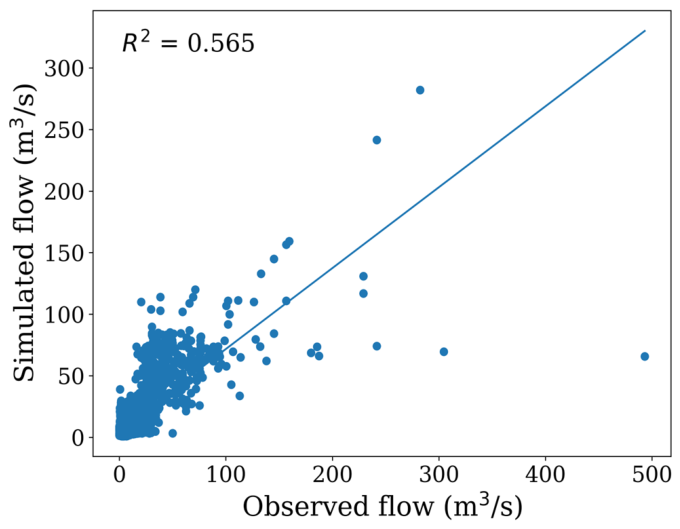
Figure A2.
Regression of observed flow (m3/s) and simulated flow (m3/s) for validation period (2015–2016) with the SWAT+ model in the Geba watershed.
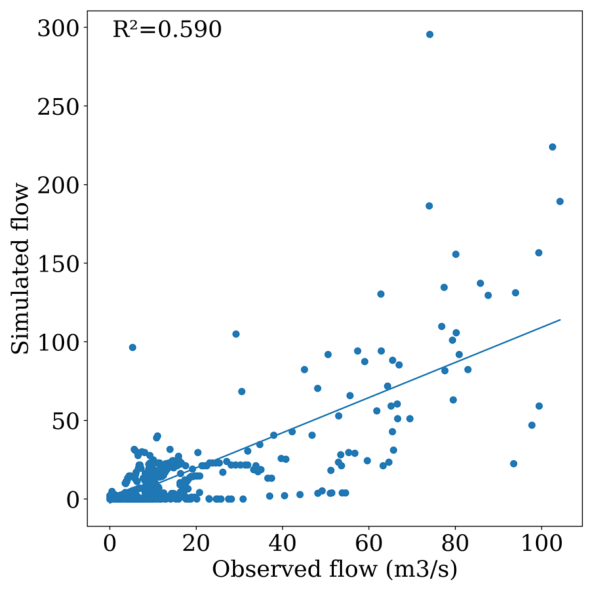
Figure A3.
Geba watershed flow (m3/s) for SWAT+ calibration (2009–2015).
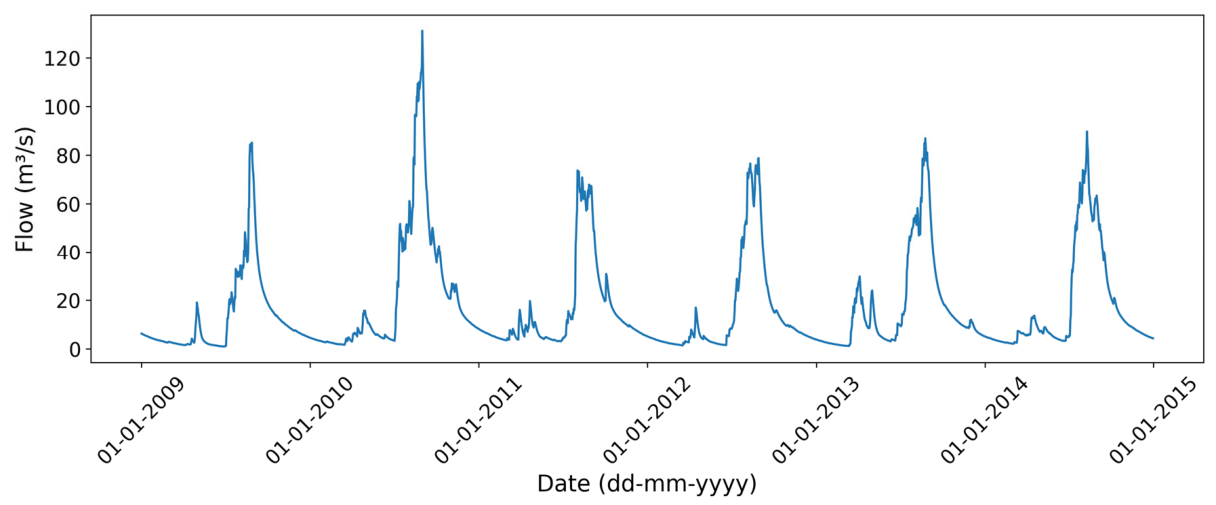
Figure A4.
Geba watershed flow (m3/s) for SWAT+ validation (2015–2016).
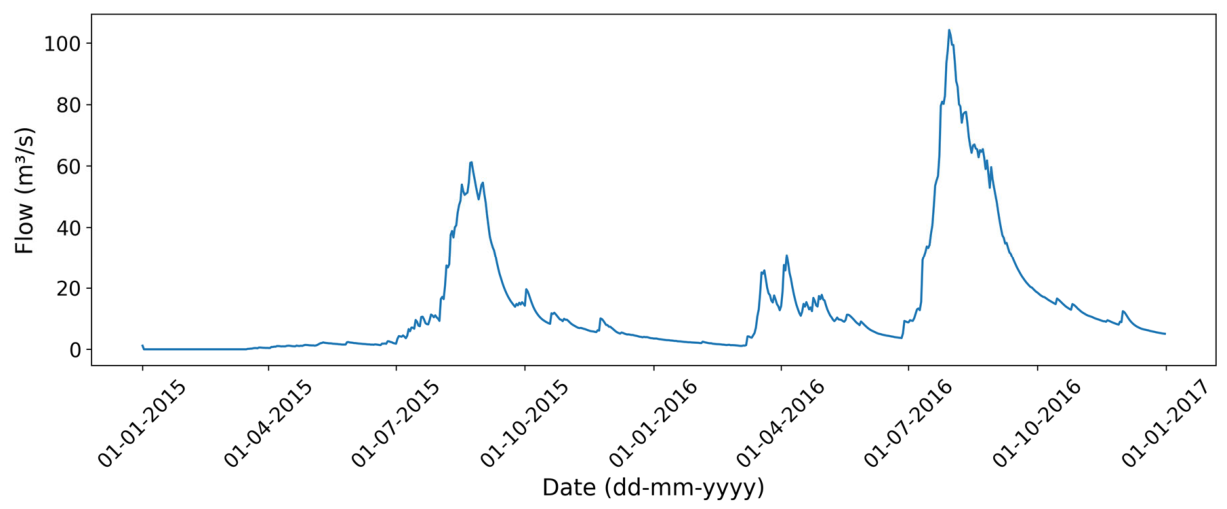
Figure A5.
Comparison of RCMs using bias correction methods (DM and QM) for precipitation dataset (1990–2006) from CORDEX-Africa.
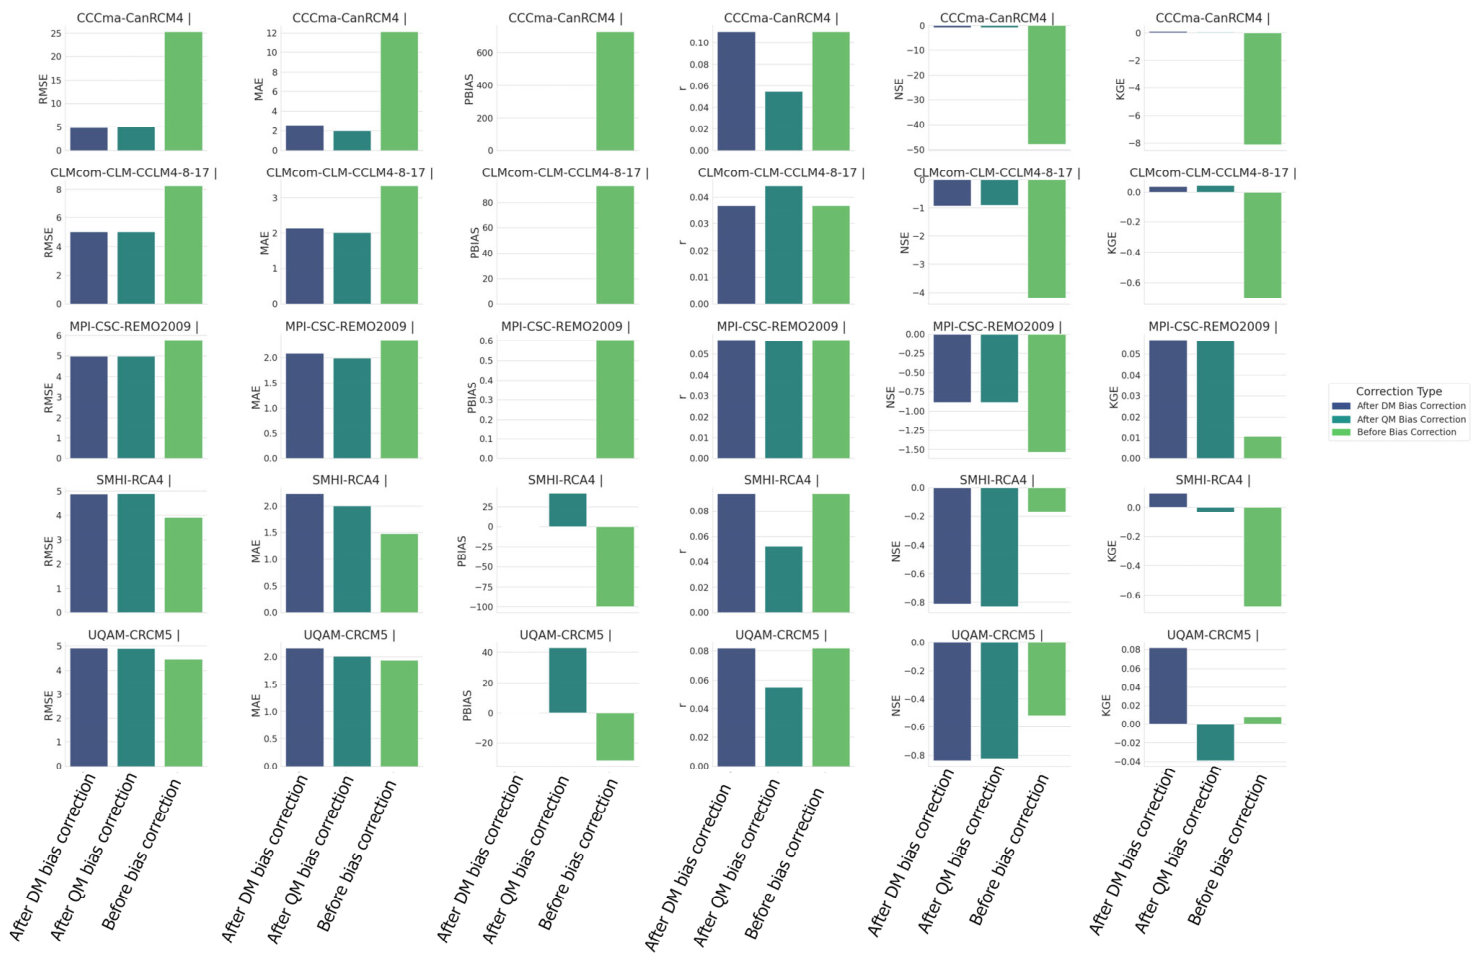
Figure A6.
Average observed crop economic yield of major crops in the Geba watershed (Geba watershed Survey, 2025, unpublished).
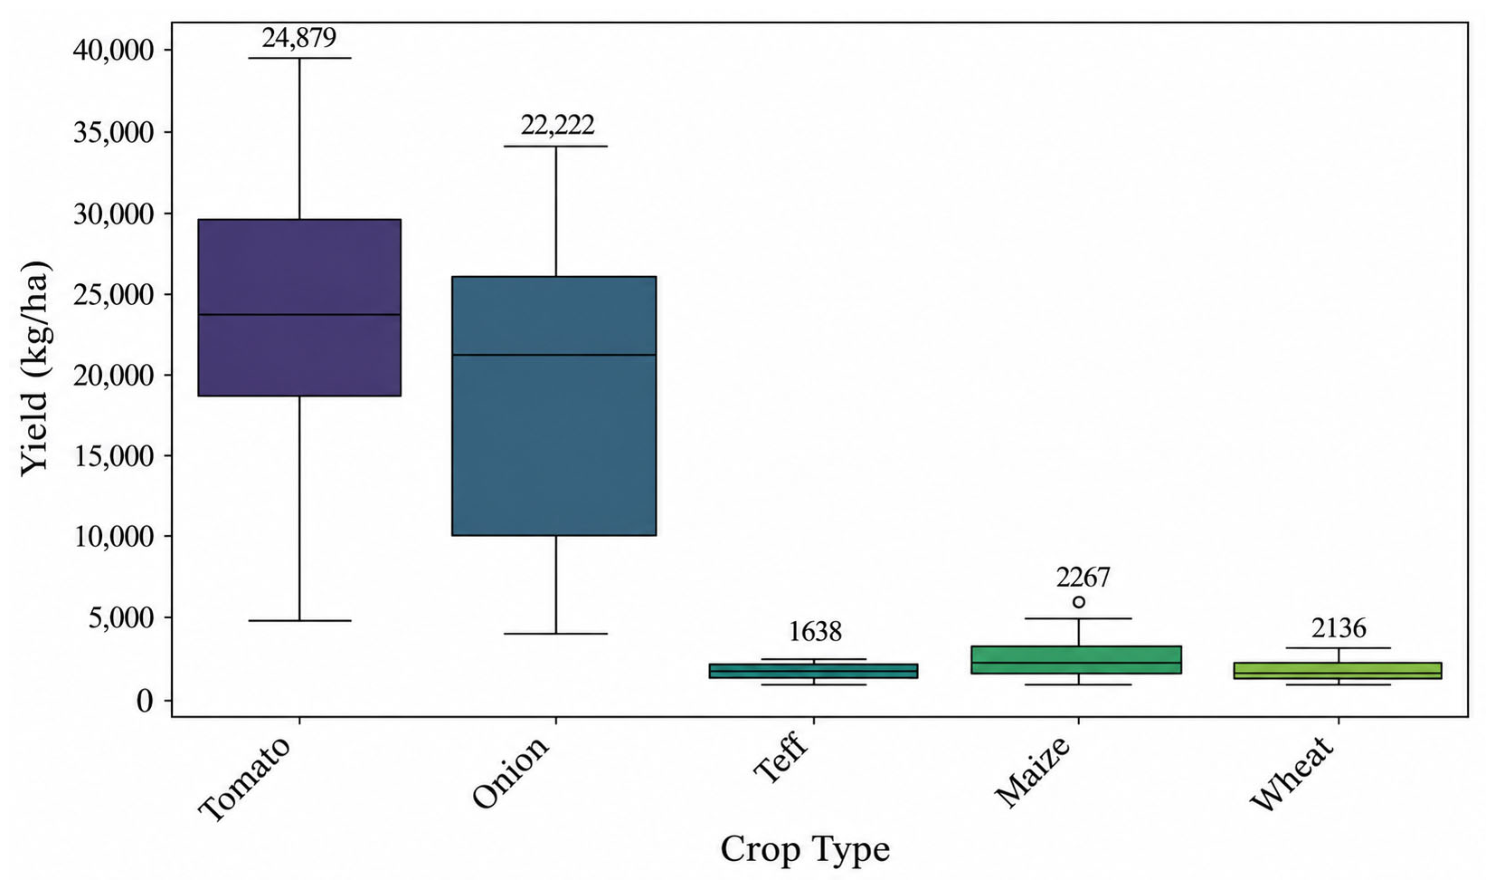
Figure A7.
SWAT+-simulated average crop yields (t ha−1) for historical periods and under future climate change impacts on irrigation expansion scenarios (right) and rainfed condition scenarios (left).
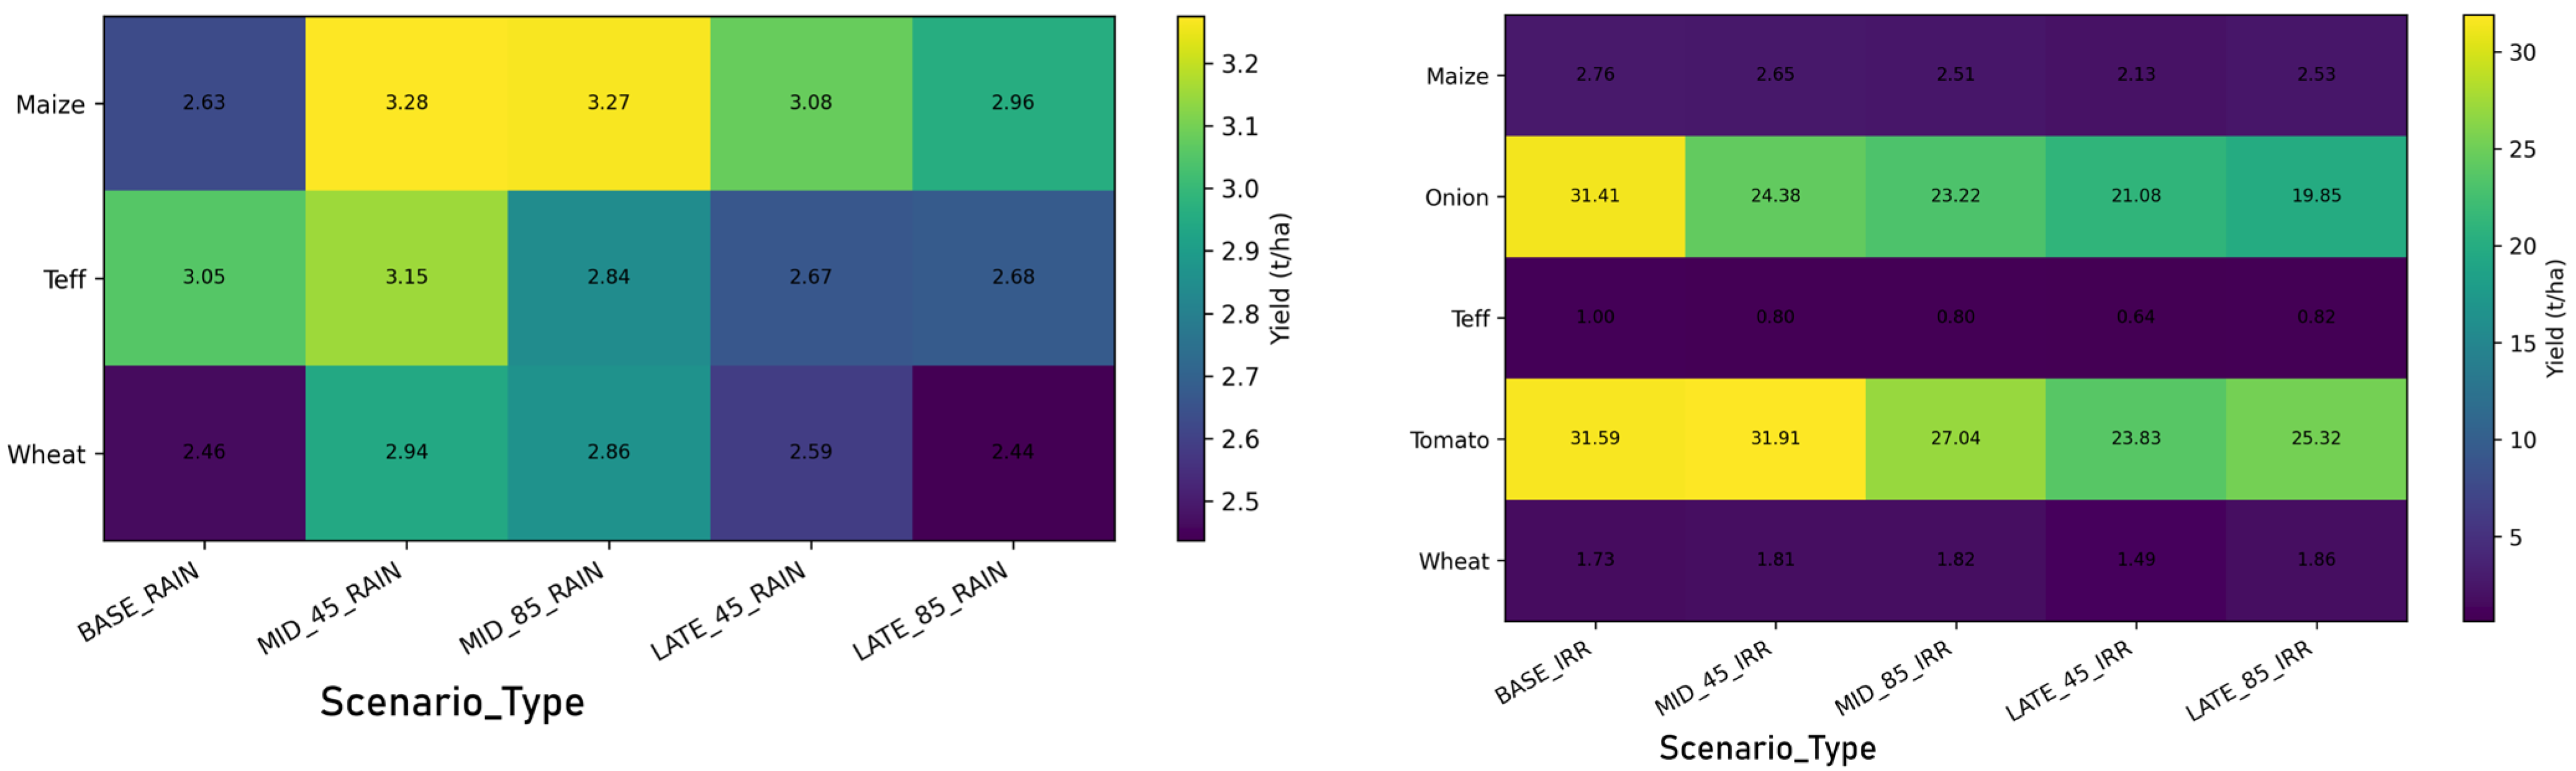
Table A7.
SWAT+ simulated average annual water balance of Geba watershed hydrological components (mm) under climate and management scenarios.
Table A8.
CORDEX regional climate model performance before bias correction across precipitation stations.
Table A9.
CORDEX regional climate model performance metrics after distribution mapping (DM) bias correction across precipitation stations.
Table A10.
CORDEX regional climate model performance metrics after quantile mapping (QM) bias correction across precipitation stations.
Table A11.
RCM model ranking based on performance metrics of quantile modeling precipitation bias correction.
Table A12.
Entropy weight to assign objective weights to each RCM for multi-model ensemble (MME).
References
- Murgatroyd, A.; Thomas, T.; Koo, J.; Strzepek, K.; Hall, J. Building Ethiopia’s Food Security Resilience to Climate and Hydrological Change. Environ. Res. Food Syst. 2025, 2, 015008. [Google Scholar] [CrossRef] [Scilit]
- Tekleab, S.; Uhlenbrook, S.; Mohamed, Y.; Savenije, H.H.G.; Temesgen, M.; Wenninger, J. Water Balance Modeling of Upper Blue Nile Catchments Using a Top-down Approach. Hydrol. Earth Syst. Sci. 2011, 15, 2179–2193. [Google Scholar] [CrossRef] [Scilit]
- Conway, D. The Climate and Hydrology of the Upper Blue Nile River. Geogr. J. 2000, 166, 49–62. [Google Scholar] [CrossRef] [Scilit]
- Setegn, S.G.; Rayner, D.; Melesse, A.M.; Dargahi, B.; Srinivasan, R. Impact of Climate Change on the Hydroclimatology of Lake Tana Basin, Ethiopia. Water Resour. Res. 2011, 47, 2010WR009248. [Google Scholar] [CrossRef] [Scilit]
- Arnell, N. Climate Change and Global Water Resources. Glob. Environ. Change 1999, 9, S31–S49. [Google Scholar] [CrossRef] [Scilit]
- Rosenzweig, C.; Elliott, J.; Deryng, D.; Ruane, A.C.; Müller, C.; Arneth, A.; Boote, K.J.; Folberth, C.; Glotter, M.; Khabarov, N.; et al. Assessing Agricultural Risks of Climate Change in the 21st Century in a Global Gridded Crop Model Intercomparison. Proc. Natl. Acad. Sci. USA 2014, 111, 3268–3273. [Google Scholar] [CrossRef] [Scilit] [PubMed]
- Gassman, P.W.; Reyes, M.R.; Green, C.H.; Arnold, J.G. The Soil and Water Assessment Tool: Historical Development, Applications, and Future Research Directions. Trans. ASABE 2007, 50, 1211–1250. [Google Scholar] [CrossRef] [Scilit]
- Arnold, J.G.; Moriasi, D.N.; Gassman, P.W.; Abbaspour, K.C.; White, M.J.; Srinivasan, R.; Santhi, C.; Harmel, R.D.; Van Griensven, A.; Van Liew, M.W.; et al. SWAT: Model Use, Calibration, and Validation. Trans. ASABE 2012, 55, 1491–1508. [Google Scholar] [CrossRef] [Scilit]
- Bieger, K.; Arnold, J.G.; Rathjens, H.; White, M.J.; Bosch, D.D.; Allen, P.M.; Volk, M.; Srinivasan, R. Introduction to SWAT +, A Completely Restructured Version of the Soil and Water Assessment Tool. J. Am. Water Resour. Assoc. 2017, 53, 115–130. [Google Scholar] [CrossRef] [Scilit]
- Tumsa, B.C.; Kenea, G.; Tola, B. The Application of SWAT+ Model to Quantify the Impacts of Sensitive LULC Changes on Water Balance in Guder Catchment, Oromia, Ethiopia. Heliyon 2022, 8, e12569. [Google Scholar] [CrossRef] [Scilit] [PubMed]
- Plunge, S.; Schürz, C.; Čerkasova, N.; Strauch, M.; Piniewski, M. SWAT+ Model Setup Verification Tool: SWATdoctR. Environ. Model. Softw. 2024, 171, 105878. [Google Scholar] [CrossRef] [Scilit]
- Sánchez-Gómez, A.; Arnold, J.G.; Bieger, K.; Čerkasova, N.; Sammons, N.B.; Martínez-Pérez, S.; Molina-Navarro, E. Modelling Water Management Using SWAT+: Application of Reservoirs Release Tables and the New Water Allocation Module in a Highly Managed River Basin. Water Resour. Manag. 2025, 39, 2357–2399. [Google Scholar] [CrossRef] [Scilit]
- Arnold, J.G.; Bieger, K.; White, M.J.; Srinivasan, R.; Dunbar, J.A.; Allen, P.M. Use of Decision Tables to Simulate Management in SWAT+. Water 2018, 10, 713. [Google Scholar] [CrossRef] [Scilit]
- Gebremicael, T.G.; Mohamed, Y.A.; Van Der Zaag, P. Attributing the Hydrological Impact of Different Land Use Types and Their Long-Term Dynamics through Combining Parsimonious Hydrological Modelling, Alteration Analysis and PLSR Analysis. Sci. Total Environ. 2019, 660, 1155–1167. [Google Scholar] [CrossRef] [Scilit] [PubMed]
- Godif, G.; Manjunatha, B.R. Prioritizing Sub-Watersheds for Soil and Water Conservation via Morphometric Analysis and the Weighted Sum Approach: A Case Study of the Geba River Basin in Tigray, Ethiopia. Heliyon 2022, 8, e12261. [Google Scholar] [CrossRef] [Scilit] [PubMed]
- Khorn, N.; Ismail, M.H.; Nurhidayu, S.; Kamarudin, N.; Sulaiman, M.S. Land Use/Land Cover Changes and Its Impact on Runoff Using SWAT Model in the Upper Prek Thnot Watershed in Cambodia. Environ. Earth Sci. 2022, 81, 466. [Google Scholar] [CrossRef] [Scilit]
- Wedajo, O.A.; Fufa, F.; Ayenew, T.; Nedaw, D. A Review of Hydroclimate Variability and Changes in the Blue Nile Basin, Ethiopia. Heliyon 2024, 10, e25530. [Google Scholar] [CrossRef] [Scilit] [PubMed]
- Zargar, M.; Bronstert, A.; Francke, T.; Zimale, F.A.; Worku, K.B.; Wiegels, R.; Lorenz, C.; Hageltom, Y.; Sawadogo, W.; Kunstmann, H. Comparison and Hydrological Evaluation of Different Precipitation Data for a Large Tropical Region: The Blue Nile Basin in Ethiopia. Front. Water 2025, 7, 1536881. [Google Scholar] [CrossRef] [Scilit]
- Asnake, A.B.; Ayana, M.T.; Awass, A.A.; Goshime, D.W. Transformation of Climate and Its Sway on Hydro-Climatology Using Representative Concentration Pathways (RCP) in Geba Catchment of Ethiopia. Model. Earth Syst. Environ. 2021, 7, 2439–2451. [Google Scholar] [CrossRef] [Scilit]
- Tsegaye, L.; Bharti, R. The Impacts of LULC and Climate Change Scenarios on the Hydrology and Sediment Yield of Rib Watershed, Ethiopia. Environ. Monit. Assess. 2022, 194, 717. [Google Scholar] [CrossRef] [Scilit] [PubMed]
- Tsegaye, T.; Haji, J.; Sileshi, M.; Degefu, S.; Abaynew, H. Small-Scale Irrigation and Its Impact on Technical Efficiency and Household Income among Smallholder Potato Farmers in Ethiopia. Discov. Food 2025, 5, 54. [Google Scholar] [CrossRef] [Scilit]
- Zhou, W.; Guan, K.; Peng, B.; Shi, J.; Jiang, C.; Wardlow, B.; Pan, M.; Kimball, J.S.; Franz, T.E.; Gentine, P.; et al. Connections between the Hydrological Cycle and Crop Yield in the Rainfed U.S. Corn Belt. J. Hydrol. 2020, 590, 125398. [Google Scholar] [CrossRef] [Scilit]
- Abera, W.; Tamene, L.; Tibebe, D.; Adimassu, Z.; Kassa, H.; Hailu, H.; Mekonnen, K.; Desta, G.; Sommer, R.; Verchot, L. Characterizing and Evaluating the Impacts of National Land Restoration Initiatives on Ecosystem Services in Ethiopia. Land Degrad. Dev. 2020, 31, 37–52. [Google Scholar] [CrossRef] [Scilit]
- Ahmed, M.H.; Tesfaye, W.M.; Gassmann, F. Early Growing Season Weather Variation, Expectation Formation and Agricultural Land Allocation Decisions in Ethiopia. J. Agric. Econ. 2023, 74, 255–272. [Google Scholar] [CrossRef] [Scilit]
- Gebru, G.W.; Ichoku, H.E.; Phil-Eze, P.O. Determinants of Smallholder Farmers’ Adoption of Adaptation Strategies to Climate Change in Eastern Tigray National Regional State of Ethiopia. Heliyon 2020, 6, e04356. [Google Scholar] [CrossRef] [Scilit] [PubMed]
- Nyssen, J.; Clymans, W.; Descheemaeker, K.; Poesen, J.; Vandecasteele, I.; Vanmaercke, M.; Zenebe, A.; Van Camp, M.; Haile, M.; Haregeweyn, N.; et al. Impact of Soil and Water Conservation Measures on Catchment Hydrological Response—A Case in North Ethiopia. Hydrol. Processes 2010, 24, 1880–1895. [Google Scholar] [CrossRef] [Scilit]
- Thiery, W.; Visser, A.J.; Fischer, E.M.; Hauser, M.; Hirsch, A.L.; Lawrence, D.M.; Lejeune, Q.; Davin, E.L.; Seneviratne, S.I. Warming of Hot Extremes Alleviated by Expanding Irrigation. Nat. Commun. 2020, 11, 290. [Google Scholar] [CrossRef] [Scilit] [PubMed]
- De Graaf, I.E.M.; Gleeson, T.; (Rens) Van Beek, L.P.H.; Sutanudjaja, E.H.; Bierkens, M.F.P. Environmental Flow Limits to Global Groundwater Pumping. Nature 2019, 574, 90–94. [Google Scholar] [CrossRef] [Scilit] [PubMed]
- Hawkins, E.; Sutton, R. Time of Emergence of Climate Signals. Geophys. Res. Lett. 2012, 39, 2011GL050087. [Google Scholar] [CrossRef] [Scilit]
- Clark, M.P.; Wilby, R.L.; Gutmann, E.D.; Vano, J.A.; Gangopadhyay, S.; Wood, A.W.; Fowler, H.J.; Prudhomme, C.; Arnold, J.R.; Brekke, L.D. Characterizing Uncertainty of the Hydrologic Impacts of Climate Change. Curr. Clim. Change Rep. 2016, 2, 55–64. [Google Scholar] [CrossRef] [Scilit]
- Gebreyohannes, T.; De Smedt, F.; Walraevens, K.; Gebresilassie, S.; Hussien, A.; Hagos, M.; Amare, K.; Deckers, J.; Gebrehiwot, K. Application of a Spatially Distributed Water Balance Model for Assessing Surface Water and Groundwater Resources in the Geba Basin, Tigray, Ethiopia. J. Hydrol. 2013, 499, 110–123. [Google Scholar] [CrossRef] [Scilit]
- Shiferaw, H.; Zenebe, A.; Yazew, E.; Yisak, B.; Girma, A.; Araya, M.; Zenebe, G.; Giannini, A. Characterization of Flood and Drought Hazards on the Gereb-Geba Water Supply Dam in the Semi-Arid Northern Ethiopian Highlands. Geomat. Nat. Hazards Risk 2024, 15, 2290846. [Google Scholar] [CrossRef] [Scilit]
- Little, R.; Rubin, D. Statistical Analysis with Missing Data, Third Edition, 1st ed.; Wiley Series in Probability and Statistics; Wiley: Hoboken, NJ, USA, 2019; ISBN 978-0-470-52679-8. [Google Scholar]
- Wilks, D.S. Statistical Methods in the Atmospheric Sciences, 2nd ed.; International Geophysics Series; Elsevier: Amsterdam, The Netherlands; Paris, France, 2006; ISBN 978-0-12-751966-1. [Google Scholar]
- WMO. Guide to Climatological Practices, 3rd ed.; Secretariat of the World Meteorological Organization: Geneva, Switzerland, 2011; ISBN 978-92-63-10100-6. [Google Scholar]
- Stekhoven, D.J.; Bühlmann, P. MissForest—Non-Parametric Missing Value Imputation for Mixed-Type Data. Bioinformatics 2012, 28, 112–118. [Google Scholar] [CrossRef] [Scilit] [PubMed]
- Tyralis, H.; Papacharalampous, G.; Langousis, A. A Brief Review of Random Forests for Water Scientists and Practitioners and Their Recent History in Water Resources. Water 2019, 11, 910. [Google Scholar] [CrossRef] [Scilit]
- Heras, D.; Matovelle, C. Machine-Learning Methods for Hydrological Imputation Data: Analysis of the Goodness of Fit of the Model in Hydrographic Systems of the Pacific—Ecuador. Rev. Ambiente Água 2021, 16, e2708. [Google Scholar] [CrossRef] [Scilit]
- Zanaga, D.; Van De Kerchove, R.; Daems, D.; De Keersmaecker, W.; Brockmann, C.; Kirches, G.; Wevers, J.; Cartus, O.; Santoro, M.; Fritz, S.; et al. ESA WorldCover 10 m 2021 V200 2022. Available online: https://zenodo.org/records/7254221 (accessed on 21 January 2026).
- Soil Map of the World. Available online: https://www.fao.org/soils-portal/data-hub/soil-maps-and-databases/faounesco-soil-map-of-the-world/en/ (accessed on 21 January 2025).
- NASA. Available online: https://www.earthdata.nasa.gov/sensors/srtm (accessed on 21 January 2025).
- Yesuf, H.M.; Assen, M.; Alamirew, T.; Melesse, A.M. Modeling of Sediment Yield in Maybar Gauged Watershed Using SWAT, Northeast Ethiopia. CATENA 2015, 127, 191–205. [Google Scholar] [CrossRef] [Scilit]
- Dibaba, W.T.; Demissie, T.A.; Miegel, K. Watershed Hydrological Response to Combined Land Use/Land Cover and Climate Change in Highland Ethiopia: Finchaa Catchment. Water 2020, 12, 1801. [Google Scholar] [CrossRef] [Scilit]
- Beniaich, A.; Otten, W.; Shin, H.-C.; Cooper, H.V.; Rickson, J.; Soulaimani, A.; El Gharous, M. Evaluation of Pedotransfer Functions to Estimate Some of Soil Hydraulic Characteristics in North Africa: A Case Study from Morocco. Front. Environ. Sci. 2023, 11, 1090688. [Google Scholar] [CrossRef] [Scilit]
- Sun, W.; Yao, X.; Cao, N.; Xu, Z.; Yu, J. Integration of Soil Hydraulic Characteristics Derived from Pedotransfer Functions into Hydrological Models: Evaluation of Its Effects on Simulation Uncertainty. Hydrol. Res. 2016, 47, 964–978. [Google Scholar] [CrossRef] [Scilit]
- Tombul, M.; Akyürek, Z.; Ünal Sorman, A. Research Note:Determination of Soil Hydraulic Properties Using Pedotransfer Functions in a Semi-Arid Basin, Turkey. Hydrol. Earth Syst. Sci. 2004, 8, 1200–1209. [Google Scholar] [CrossRef] [Scilit]
- Bouslihim, Y.; Ouarani, M.; Taia, S.; El Khalki, E.M.; Hadri, A.; Kharrou, M.H.; Chehbouni, A. The Impact of Soil Data on SWAT Modeling: Effects, Requirements, and Future Directions. Sci. Afr. 2025, 28, e02694. [Google Scholar] [CrossRef] [Scilit]
- Habtu, S. Validation of Farmers’ on-Farm Irrigation Scheduling for Optimal Water Utilization in Tigray Region, Ethiopia. Discov. Agric. 2024, 2, 9. [Google Scholar] [CrossRef] [Scilit]
- Moriasi, D.N.; Arnold, J.G.; Van Liew, M.W.; Bingner, R.L.; Harmel, R.D.; Veith, T.L. Model Evaluation Guidelines for Systematic Quantification of Accuracy in Watershed Simulations. Trans. ASABE 2007, 50, 885–900. [Google Scholar] [CrossRef] [Scilit]
- Akoko, G.; Le, T.H.; Gomi, T.; Kato, T. A Review of SWAT Model Application in Africa. Water 2021, 13, 1313. [Google Scholar] [CrossRef] [Scilit]
- Gassman, P.W.; Sadeghi, A.M.; Srinivasan, R. Applications of the SWAT Model Special Section: Overview and Insights. J. Environ. Qual. 2014, 43, 1–8. [Google Scholar] [CrossRef] [Scilit] [PubMed]
- Zanaga, D.; Van De Kerchove, R.; Daems, D.; De Keersmaecker, W.; Brockmann, C.; Kirches, G.; Wevers, J.; Cartus, O.; Santoro, M.; Fritz, S.; et al. A Recommended Calibration and Validation Strategy for Hydrologic and Water Quality Models. Trans. ASABE 2015, 58, 1705–1719. [Google Scholar] [CrossRef] [Scilit]
- Saltelli, A.; Annoni, P.; Azzini, I.; Campolongo, F.; Ratto, M.; Tarantola, S. Variance Based Sensitivity Analysis of Model Output. Design and Estimator for the Total Sensitivity Index. Comput. Phys. Commun. 2010, 181, 259–270. [Google Scholar] [CrossRef] [Scilit]
- Herman, J.; Usher, W. SALib: An Open-Source Python Library for Sensitivity Analysis. J. Open Source Softw. 2017, 2, 97. [Google Scholar] [CrossRef] [Scilit]
- Abbaspour, K.; Vaghefi, S.; Srinivasan, R. A Guideline for Successful Calibration and Uncertainty Analysis for Soil and Water Assessment: A Review of Papers from the 2016 International SWAT Conference. Water 2017, 10, 6. [Google Scholar] [CrossRef] [Scilit]
- Dosio, A.; Panitz, H.-J. Climate Change Projections for CORDEX-Africa with COSMO-CLM Regional Climate Model and Differences with the Driving Global Climate Models. Clim. Dyn. 2016, 46, 1599–1625. [Google Scholar] [CrossRef] [Scilit]
- Berhanu, D.; Alamirew, T.; O’Donnell, G.; Walsh, C.L.; Haileslassie, A.; Tarkegn, T.G.; Bantider, A.; Gebrehiwot, S.; Zeleke, G. Historical Trend and Future Projection of Extreme Seasonal Precipitation over Ethiopia, East Africa. Climate 2026, 14, 88. [Google Scholar] [CrossRef] [Scilit]
- Tareke, K.A. Evaluating the Performance of Regional Climate Models to Simulate Seasonal Variability of Precipitation in Abbay and Awash River Basins, Ethiopia. Discov. Water 2025, 5, 58. [Google Scholar] [CrossRef] [Scilit]
- Mathewos, Y.; Abate, B.; Dadi, M. Characterization of the Skill of the CORDEX-Africa Regional Climate Models to Simulate Regional Climate Setting in the East African Transboundary Omo Gibe River Basin, Ethiopia. Heliyon 2023, 9, e20379. [Google Scholar] [CrossRef] [Scilit] [PubMed]
- Kassahun, M.; Ture, K.; Nedaw, D. Evaluation of CORDEX Africa Regional Climate Models Performance in Simulating Climatology of Zarima Sub-Basin Northwestern Ethiopia. Environ. Syst. Res. 2023, 12, 41. [Google Scholar] [CrossRef] [Scilit]
- Ayugi, B.; Shilenje, Z.W.; Babaousmail, H.; Lim Kam Sian, K.T.C.; Mumo, R.; Dike, V.N.; Iyakaremye, V.; Chehbouni, A.; Ongoma, V. Projected Changes in Meteorological Drought over East Africa Inferred from Bias-Adjusted CMIP6 Models. Nat. Hazards 2022, 113, 1151–1176. [Google Scholar] [CrossRef] [Scilit] [PubMed]
- Brighenti, T.M.; Gassman, P.W.; Gutowski, W.J.; Thompson, J.R. Assessing the Influence of a Bias Correction Method on Future Climate Scenarios Using SWAT as an Impact Model Indicator. Water 2023, 15, 750. [Google Scholar] [CrossRef] [Scilit]
- Tebaldi, C.; Knutti, R. The Use of the Multi-Model Ensemble in Probabilistic Climate Projections. Phil. Trans. R. Soc. A. 2007, 365, 2053–2075. [Google Scholar] [CrossRef] [Scilit] [PubMed]
- Gupta, H.V.; Kling, H.; Yilmaz, K.K.; Martinez, G.F. Decomposition of the Mean Squared Error and NSE Performance Criteria: Implications for Improving Hydrological Modelling. J. Hydrol. 2009, 377, 80–91. [Google Scholar] [CrossRef] [Scilit]
- Maraun, D. Bias Correcting Climate Change Simulations—A Critical Review. Curr. Clim. Change Rep. 2016, 2, 211–220. [Google Scholar] [CrossRef] [Scilit]
- Knoben, W.J.M.; Freer, J.E.; Woods, R.A. Technical Note: Inherent Benchmark or Not? Comparing Nash–Sutcliffe and Kling–Gupta Efficiency Scores. Hydrol. Earth Syst. Sci. 2019, 23, 4323–4331. [Google Scholar] [CrossRef] [Scilit]
- Teutschbein, C.; Seibert, J. Bias Correction of Regional Climate Model Simulations for Hydrological Climate-Change Impact Studies: Review and Evaluation of Different Methods. J. Hydrol. 2012, 456–457, 12–29. [Google Scholar] [CrossRef] [Scilit]
- Chinasho, A. Performance Evaluation of Bias Correction Methods for CMIP6 Precipitation Datasets in the Drylands of the Wolaita Zone, Southern Ethiopia. Int. J. Clim. Change Strateg. Manag. 2025, 17, 1119–1139. [Google Scholar] [CrossRef] [Scilit]
- Worqlul, A.W.; Dile, Y.T.; Schmitter, P.; Jeong, J.; Meki, M.N.; Gerik, T.J.; Srinivasan, R.; Lefore, N.; Clarke, N. Water Resource Assessment, Gaps, and Constraints of Vegetable Production in Robit and Dangishta Watersheds, Upper Blue Nile Basin, Ethiopia. Agric. Water Manag. 2019, 226, 105767. [Google Scholar] [CrossRef] [Scilit]
- Worku, G.; Teferi, E.; Bantider, A.; Dile, Y.T. Statistical Bias Correction of Regional Climate Model Simulations for Climate Change Projection in the Jemma Sub-Basin, Upper Blue Nile Basin of Ethiopia. Theor. Appl. Climatol. 2020, 139, 1569–1588. [Google Scholar] [CrossRef] [Scilit]
- Gudmundsson, L.; Bremnes, J.B.; Haugen, J.E.; Engen-Skaugen, T. Technical Note: Downscaling RCM Precipitation to the Station Scale Using Statistical Transformations—A Comparison of Methods. Hydrol. Earth Syst. Sci. 2012, 16, 3383–3390. [Google Scholar] [CrossRef] [Scilit]
- Knutti, R.; Sedláček, J. Robustness and Uncertainties in the New CMIP5 Climate Model Projections. Nat. Clim. Change 2013, 3, 369–373. [Google Scholar] [CrossRef] [Scilit]
- Sanderson, B.M.; Knutti, R.; Caldwell, P. A Representative Democracy to Reduce Interdependency in a Multimodel Ensemble. J. Clim. 2015, 28, 5171–5194. [Google Scholar] [CrossRef] [Scilit]
- Eyring, V.; Cox, P.M.; Flato, G.M.; Gleckler, P.J.; Abramowitz, G.; Caldwell, P.; Collins, W.D.; Gier, B.K.; Hall, A.D.; Hoffman, F.M.; et al. Taking Climate Model Evaluation to the next Level. Nat. Clim. Change 2019, 9, 102–110. [Google Scholar] [CrossRef] [Scilit]
- Herger, N.; Sanderson, B.M.; Knutti, R. Improved Pattern Scaling Approaches for the Use in Climate Impact Studies. Geophys. Res. Lett. 2015, 42, 3486–3494. [Google Scholar] [CrossRef] [Scilit]
- Castaneda-Gonzalez, M.; Poulin, A.; Romero-Lopez, R.; Turcotte, R. Weighting Climate Models for Hydrological Projections: Effects on Contrasting Hydroclimatic Regions. Clim. Change 2023, 176, 170. [Google Scholar] [CrossRef] [Scilit]
- Musyoka, F.K.; Strauss, P.; Zhao, G.; Srinivasan, R.; Klik, A. Multi-Step Calibration Approach for SWAT Model Using Soil Moisture and Crop Yields in a Small Agricultural Catchment. Water 2021, 13, 2238. [Google Scholar] [CrossRef] [Scilit]
- Filippi, P.; Han, S.Y.; Bishop, T.F.A. On Crop Yield Modelling, Predicting, and Forecasting and Addressing the Common Issues in Published Studies. Precis. Agric. 2025, 26, 8. [Google Scholar] [CrossRef] [Scilit]
- Singh, P.; Pathak, P.; Wani, S.P.; Sahrawat, K.L. Integrated Watershed Management for Increasing Productivity and Water-Use Efficiency in Semi-Arid Tropical India. J. Crop Improv. 2009, 23, 402–429. [Google Scholar] [CrossRef] [Scilit]
- Gebru, A.A.; Araya, T.; Wolde-Georgis, T.; Nyssen, J.; Baudron, F.; Verhulst, N.; Speratti, A.B.; Govaerts, B. Implementation of Permanent Raised Beds Contributes to Increased Crop yield and Profitability in the Northeastern Tigray Region, Ethiopia. Exp. Agric. 2019, 55, 807–817. [Google Scholar] [CrossRef] [Scilit]
- Gebretsadik, T.; Kayombo, A. Climate Change, Spatial Spillovers, and Sustainable Productivity of Teff, Maize, and Wheat across Ethiopian Districts Using Integrated Climate and Agricultural Data from 2000 to 2024. Discov. Environ. 2026, 4, 107. [Google Scholar] [CrossRef] [Scilit]
- Mulugeta, T.; Alemayhu, G.; Ademe, D.; Mohamed, A.; Tadele, A.; Kassaye, T. Spatiotemporal Variability and Trends in Rainfall and Temperature and Their Implications for Rain-Fed Crop Production in Wollo and the Oromia Special Zone, Northeastern Ethiopian Highlands. Theor. Appl. Climatol. 2026, 157, 220. [Google Scholar] [CrossRef] [Scilit]
- Mihiretu, A.; Asresu, M. Inclusive Technology Performance Evaluation in the Production of Teff (Eragrostis tef (Zucc.) Trotter). Adv. Agric. 2022, 2022, 9031999. [Google Scholar] [CrossRef] [Scilit]
- Fisseha, G.; Fissaha, S.; Mesele, H.; Yisfa, T. Application of Wetting Front Detector on Water Saving and Productivity, Yield and Yield Components of Onion (Allium cepa L.) in a Semi-Arid Climate, Northern Ethiopia. Water Conserv. Sci. Eng. 2026, 11, 37. [Google Scholar] [CrossRef] [Scilit]
- Gedamu, S.A.; Sisay, K.; Teshome, H.; Fenta, T. Multi-nutrient Omission Trials for Yield Optimization: Diagnosing Yield-limiting Nutrients for Onion (Allium cepa L.) and Tomato (Solanum lycopersicum L.) under Irrigation Conditions in Raya Kobo District, Eastern Ethiopia. Agrosyst. Geosci. Env. 2026, 9, e70277. [Google Scholar] [CrossRef] [Scilit]
- Massrie, K.D.; Zewdie, B.M. Response of Tomato (Lycopersicon esculentum Mill.) Varieties to Different Trellising Methods in Northeastern Ethiopia. Vegetos 2025, 1–8. [Google Scholar] [CrossRef] [Scilit]
- Setegn, S.G.; Srinivasan, R.; Melesse, A.M.; Dargahi, B. SWAT Model Application and Prediction Uncertainty Analysis in the Lake Tana Basin, Ethiopia. Hydrol. Processes 2010, 24, 357–367. [Google Scholar] [CrossRef] [Scilit]
- Dile, Y.T.; Daggupati, P.; George, C.; Srinivasan, R.; Arnold, J. Introducing a New Open-Source GIS User Interface for the SWAT Model. Environ. Model. Softw. 2016, 85, 129–138. [Google Scholar] [CrossRef] [Scilit]
- Segele, Z.T.; Lamb, P.J. Characterization and Variability of Kiremt Rainy Season over Ethiopia. Meteorol. Atmos. Phys. 2005, 89, 153–180. [Google Scholar] [CrossRef] [Scilit]
- Betrie, G.D.; Mohamed, Y.A.; Van Griensven, A.; Srinivasan, R. Sediment Management Modelling in the Blue Nile Basin Using SWAT Model. Hydrol. Earth Syst. Sci. 2011, 15, 807–818. [Google Scholar] [CrossRef] [Scilit]
- Escamilla-Rivera, V.; Cortina-Villar, S.; Vaca, R.A.; Golicher, D.; Arellano-Monterrosas, J.; Honey-Rosés, J. Effects of Finer Scale Soil Survey and Land-Use Classification on SWAT Hydrological Modelling Accuracy in Data-Poor Study Areas. J. Water Resour. Prot. 2022, 14, 100–125. [Google Scholar] [CrossRef]
- Montgomery, D.C. Design and Analysis of Experiments, 10th ed.; EMEA Edition; Wiley: Hoboken, NJ, USA, 2020; ISBN 978-1-119-49244-3. [Google Scholar]
- Temesgen Ayalew, A. Rainfall—Runoff Modeling: A Comparative Analyses: Semi Distributed HBV Light and SWAT Models in Geba Catchment, Upper Tekeze Basin, Ethiopia. Am. J. Sci. Eng. Technol. 2019, 4, 34. [Google Scholar] [CrossRef] [Scilit]
- Orke, Y.A.; Shanka, A.S. Analyzing the Impact of Climate Change on Crop Water Demand in the Semi-Arid Bilate Watershed, Ethiopia. Adv. Meteorol. 2025, 2025, 9466355. [Google Scholar] [CrossRef] [Scilit]
- Acero Triana, J.S.; Ajami, H.; Razavi, S. The Dilemma of Objective Function Selection for Sensitivity and Uncertainty Analyses of Semi-Distributed Hydrologic Models across Spatial and Temporal Scales. J. Hydrol. 2025, 650, 132482. [Google Scholar] [CrossRef] [Scilit]
- Abbas, S.A.; Bailey, R.T.; Arnold, J.G.; White, M.J.; Mirchi, A. Modeling Agro-Hydrological Surface-Subsurface Processes in a Semi-Arid, Intensively Irrigated River Basin. J. Hydrol. Reg. Stud. 2025, 57, 102188. [Google Scholar] [CrossRef] [Scilit]
- Gehlot, L.K.; Patel, P.L.; Timbadiya, P.V. Trivariate Risk Assessment to Unlock Priorities in Agriculture-Dominated Semi-Arid Region. Sci. Total Environ. 2025, 959, 178166. [Google Scholar] [CrossRef] [Scilit] [PubMed]
- Khosravi, M.; Zolfaghari, A.A.; Kaboli, S.H.; Raeesi, M.; Abbaspour, K.; Ghafari, H. Enhanced Identification of Hydrologically Sensitive Areas via Digital Soil Mapping and Hydrological Modeling in Semi-Arid Regions. Earth Sci. Inform. 2025, 18, 285. [Google Scholar] [CrossRef] [Scilit]
- Silva, M.E.R.D.; Santos Neto, S.M.D.; Peronico, R.L.; Alcântara, L.R.P.D.; Costa, I.R.D.A.; Antonino, A.C.D.; Coutinho, A.P. Sobol Method for Sensitivity Analysis of the Hydrus Model in the Simulation of Water Infiltration in Alluvial Deposit in the Brazilian Semiariid. RBRH 2024, 29, e34. [Google Scholar] [CrossRef] [Scilit]
- Grum, B.; Woldearegay, K.; Hessel, R.; Baartman, J.E.M.; Abdulkadir, M.; Yazew, E.; Kessler, A.; Ritsema, C.J.; Geissen, V. Assessing the Effect of Water Harvesting Techniques on Event-Based Hydrological Responses and Sediment Yield at a Catchment Scale in Northern Ethiopia Using the Limburg Soil Erosion Model (LISEM). CATENA 2017, 159, 20–34. [Google Scholar] [CrossRef] [Scilit]
- Moriasi, D.N.; Gitau, M.W.; Pai, N.; Daggupati, P. Hydrologic and Water Quality Models: Performance Measures and Evaluation Criteria. Trans. ASABE 2015, 58, 1763–1785. [Google Scholar] [CrossRef] [Scilit]
- Beven, K. A Manifesto for the Equifinality Thesis. J. Hydrol. 2006, 320, 18–36. [Google Scholar] [CrossRef] [Scilit]
- Hrachowitz, M.; Savenije, H.H.G.; Blöschl, G.; McDonnell, J.J.; Sivapalan, M.; Pomeroy, J.W.; Arheimer, B.; Blume, T.; Clark, M.P.; Ehret, U.; et al. A Decade of Predictions in Ungauged Basins (PUB)—A Review. Hydrol. Sci. J. 2013, 58, 1198–1255. [Google Scholar] [CrossRef] [Scilit]
- Abbaspour, K.C.; Rouholahnejad, E.; Vaghefi, S.; Srinivasan, R.; Yang, H.; Kløve, B. A Continental-Scale Hydrology and Water Quality Model for Europe: Calibration and Uncertainty of a High-Resolution Large-Scale SWAT Model. J. Hydrol. 2015, 524, 733–752. [Google Scholar] [CrossRef] [Scilit]
- Gebrie Habte, D.; Belliethathan, S.; Ayenew, T. Analysis of Hydrological Response to Climate and Land Use Land Cover Changes in Jewha Watershed Using SWAT Model, Ethiopia. Air Soil Water Res. 2024, 17, 11786221241306768. [Google Scholar] [CrossRef] [Scilit]
- Olabanji, M.F.; Ndarana, T.; Davis, N.; Archer, E. Climate Change Impact on Water Availability in the Olifants Catchment (South Africa) with Potential Adaptation Strategies. Phys. Chem. Earth Parts A/B/C 2020, 120, 102939. [Google Scholar] [CrossRef] [Scilit]
- Orkodjo, T.P.; Kranjac-Berisavijevic, G.; Abagale, F.K. Impact of Climate Change on Future Availability of Water for Irrigation and Hydropower Generation in the Omo-Gibe Basin of Ethiopia. J. Hydrol. Reg. Stud. 2022, 44, 101254. [Google Scholar] [CrossRef] [Scilit]
- Scheff, J.; Frierson, D.M.W. Scaling Potential Evapotranspiration with Greenhouse Warming. J. Clim. 2014, 27, 1539–1558. [Google Scholar] [CrossRef] [Scilit]
- Taye, M.T.; Ntegeka, V.; Ogiramoi, N.P.; Willems, P. Assessment of Climate Change Impact on Hydrological Extremes in Two Source Regions of the Nile River Basin. Hydrol. Earth Syst. Sci. 2011, 15, 209–222. [Google Scholar] [CrossRef] [Scilit]
- Ayele, H.; Li, M.-H.; Tung, C.-P.; Liu, T.-M. Impact of Climate Change on Runoff in the Gilgel Abbay Watershed, the Upper Blue Nile Basin, Ethiopia. Water 2016, 8, 380. [Google Scholar] [CrossRef] [Scilit]
- Mesfin, S.; Almeida Oliveira, L.A.; Yazew, E.; Bresci, E.; Castelli, G. Spatial Variability of Soil Moisture in Newly Implemented Agricultural Bench Terraces in the Ethiopian Plateau. Water 2019, 11, 2134. [Google Scholar] [CrossRef] [Scilit]
- Truneh, L.A.; Matula, S.; Báťková, K. Hydroclimate Impact Analyses and Water Management in the Central Rift Valley Basin in Ethiopia. Water 2022, 15, 18. [Google Scholar] [CrossRef] [Scilit]
- Yersaw, B.T.; Chane, M.B.; Yitayew, N.A. Performance Evaluation of Varies Climate Models Using Observed and Regional Climate Models for the Katar Watershed, Ethiopia. Environ. Syst. Res. 2024, 13, 14. [Google Scholar] [CrossRef] [Scilit]
- Milly, P.C.D.; Dunne, K.A.; Vecchia, A.V. Global Pattern of Trends in Streamflow and Water Availability in a Changing Climate. Nature 2005, 438, 347–350. [Google Scholar] [CrossRef] [Scilit] [PubMed]
- Gebremeskel, G.; Kebede, A. Estimating the Effect of Climate Change on Water Resources: Integrated Use of Climate and Hydrological Models in the Werii Watershed of the Tekeze River Basin, Northern Ethiopia. Agric. Nat. Resour. 2018, 52, 195–207. [Google Scholar] [CrossRef] [Scilit]
- Yenehun, A.; Walraevens, K.; Batelaan, O. Spatial and Temporal Variability of Groundwater Recharge in Geba Basin, Northern Ethiopia. J. Afr. Earth Sci. 2017, 134, 198–212. [Google Scholar] [CrossRef] [Scilit]
- Kharin, V.V.; Zwiers, F.W.; Zhang, X.; Wehner, M. Changes in Temperature and Precipitation Extremes in the CMIP5 Ensemble. Clim. Change 2013, 119, 345–357. [Google Scholar] [CrossRef] [Scilit]
- Kahsay, K.D.; Pingale, S.M.; Hatiye, S.D. Impact of Climate Change on Groundwater Recharge and Base Flow in the Sub-Catchment of Tekeze Basin, Ethiopia. Groundw. Sustain. Dev. 2018, 6, 121–133. [Google Scholar] [CrossRef] [Scilit]
- Hiben, M.G.; Awoke, A.G.; Ashenafi, A.A. Hydrological Modeling and Evaluation of Water Balance Over the Complex Topography of Nile Basin Headwaters: The Case of Ghba River, Northern Ethiopia. Int. Res. J. Multidiscip. Technovation 2023, 5, 19–42. [Google Scholar] [CrossRef] [Scilit]
- Nyssen, J.; Frankl, A.; Haile, M.; Hurni, H.; Descheemaeker, K.; Crummey, D.; Ritler, A.; Portner, B.; Nievergelt, B.; Moeyersons, J.; et al. Environmental Conditions and Human Drivers for Changes to North Ethiopian Mountain Landscapes over 145 Years. Sci. Total Environ. 2014, 485–486, 164–179. [Google Scholar] [CrossRef] [Scilit] [PubMed]
- Haregeweyn, N.; Tsunekawa, A.; Poesen, J.; Tsubo, M.; Meshesha, D.T.; Fenta, A.A.; Nyssen, J.; Adgo, E. Comprehensive Assessment of Soil Erosion Risk for Better Land Use Planning in River Basins: Case Study of the Upper Blue Nile River. Sci. Total Environ. 2017, 574, 95–108. [Google Scholar] [CrossRef] [Scilit] [PubMed]
- Hishe, S.; Lyimo, J.; Bewket, W. Effects of Soil and Water Conservation on Vegetation Cover: A Remote Sensing Based Study in the Middle Suluh River Basin, Northern Ethiopia. Environ. Syst. Res. 2017, 6, 26. [Google Scholar] [CrossRef] [Scilit]
- Tarekegn, N.; Abate, B.; Muluneh, A.; Dile, Y. Modeling the Impact of Climate Change on the Hydrology of Andasa Watershed. Model. Earth Syst. Environ. 2022, 8, 103–119. [Google Scholar] [CrossRef] [Scilit]
- Shiferaw, H.; Gebremedhin, A.; Gebretsadkan, T.; Zenebe, A. Modelling Hydrological Response under Climate Change Scenarios Using SWAT Model: The Case of Ilala Watershed, Northern Ethiopia. Model. Earth Syst. Environ. 2018, 4, 437–449. [Google Scholar] [CrossRef] [Scilit]
- Orke, Y.A.; Li, M.-H. Impact of Climate Change on Hydrometeorology and Droughts in the Bilate Watershed, Ethiopia. Water 2022, 14, 729. [Google Scholar] [CrossRef] [Scilit]
- Besha, K.Z.; Demissie, T.A.; Feyessa, F.F. Effects of Land Use/Land Cover Change on Hydrological Responses of a Watershed in the Central Rift Valley of Ethiopia. Hydrol. Res. 2024, 55, 83–111. [Google Scholar] [CrossRef] [Scilit]
- Borchers, A.; Pieler, T. Programming Pluripotent Precursor Cells Derived from Xenopus Embryos to Generate Specific Tissues and Organs. Genes 2010, 1, 413–426. [Google Scholar] [CrossRef] [Scilit] [PubMed]
- Hausfather, Z.; Peters, G.P. Emissions—The ‘Business as Usual’ Story Is Misleading. Nature 2020, 577, 618–620. [Google Scholar] [CrossRef] [Scilit] [PubMed]
- Galata, A.W.; Tullu, K.T.; Guder, A.C. Evaluating Watershed Hydrological Responses to Climate Changes at Hangar Watershed, Ethiopia. J. Water Clim. Change 2021, 12, 2271–2287. [Google Scholar] [CrossRef] [Scilit]
- Aredo, M.R.; Dinka, M.O. Spatio-Temporal Actual Evapotranspiration Estimation under Climate Change Scenarios in the Weyib Watershed, Ethiopia. Discov. Environ. 2025, 3, 281. [Google Scholar] [CrossRef] [Scilit]
- Raza, A.; Hu, Y.; Acharki, S.; Buttar, N.A.; Ray, R.L.; Khaliq, A.; Zubair, N.; Zubair, M.; Syed, N.R.; Elbeltagi, A. Evapotranspiration Importance in Water Resources Management Through Cutting-Edge Approaches of Remote Sensing and Machine Learning Algorithms. In Surface and Groundwater Resources Development and Management in Semi-Arid Region; Pande, C.B., Kumar, M., Kushwaha, N.L., Eds.; Springer Hydrogeology; Springer International Publishing: Cham, Switzerland, 2023; pp. 1–20. ISBN 978-3-031-29393-1. [Google Scholar]
- Tadese, M.; Kumar, L.; Koech, R. Long-Term Variability in Potential Evapotranspiration, Water Availability and Drought under Climate Change Scenarios in the Awash River Basin, Ethiopia. Atmosphere 2020, 11, 883. [Google Scholar] [CrossRef] [Scilit]
- Ayalew, A.D.; Wagner, P.D.; Tigabu, T.B.; Sahlu, D.; Fohrer, N. Hydrological Responses to Land Use and Land Cover Change and Climate Dynamics in the Rift Valley Lakes Basin, Ethiopia. J. Water Clim. Change 2023, 14, 2788–2807. [Google Scholar] [CrossRef] [Scilit]
- Berihun, M.L.; Tsunekawa, A.; Haregeweyn, N.; Meshesha, D.T.; Adgo, E.; Tsubo, M.; Masunaga, T.; Fenta, A.A.; Sultan, D.; Yibeltal, M.; et al. Hydrological Responses to Land Use/Land Cover Change and Climate Variability in Contrasting Agro-Ecological Environments of the Upper Blue Nile Basin, Ethiopia. Sci. Total Environ. 2019, 689, 347–365. [Google Scholar] [CrossRef] [Scilit] [PubMed]
- Liu, Q.; Yan, C.; Ju, H.; Garré, S. Impact of Climate Change on Potential Evapotranspiration under a Historical and Future Climate Scenario in the Huang-Huai-Hai Plain, China. Theor. Appl. Climatol. 2018, 132, 387–401. [Google Scholar] [CrossRef] [Scilit]
- Worku, G.; Teferi, E.; Bantider, A.; Dile, Y.T. Modelling Hydrological Processes under Climate Change Scenarios in the Jemma Sub-Basin of Upper Blue Nile Basin, Ethiopia. Clim. Risk Manag. 2021, 31, 100272. [Google Scholar] [CrossRef] [Scilit]
- Mekonnen, Z.; Woldeamanuel, T.; Kassa, H. Socio-Ecological Vulnerability to Climate Change/Variability in Central Rift Valley, Ethiopia. Adv. Clim. Change Res. 2019, 10, 9–20. [Google Scholar] [CrossRef] [Scilit]
- Legass, A.M.; Alamirew, T.; Gebrehiwot, S.G.; Haro-Monteagudo, D.; Tsegaye, L. Climate Change Impacts on Water Security in Ethiopia: A Systematic Review of Hydroclimatic Trends, Resilience Strategies, and Governance in Major River Basins. Prog. Disaster Sci. 2026, 30, 100562. [Google Scholar] [CrossRef] [Scilit]
- Taylor, R.G.; Scanlon, B.; Döll, P.; Rodell, M.; Van Beek, R.; Wada, Y.; Longuevergne, L.; Leblanc, M.; Famiglietti, J.S.; Edmunds, M.; et al. Ground Water and Climate Change. Nat. Clim. Change 2013, 3, 322–329. [Google Scholar] [CrossRef] [Scilit]
- Beyene, A.; Cornelis, W.; Verhoest, N.E.C.; Tilahun, S.; Alamirew, T.; Adgo, E.; De Pue, J.; Nyssen, J. Estimating the Actual Evapotranspiration and Deep Percolation in Irrigated Soils of a Tropical Floodplain, Northwest Ethiopia. Agric. Water Manag. 2018, 202, 42–56. [Google Scholar] [CrossRef] [Scilit]
- Abebe, T.; Gebremariam, B. Modeling Runoff and Sediment Yield of Kesem Dam Watershed, Awash Basin, Ethiopia. SN Appl. Sci. 2019, 1, 446. [Google Scholar] [CrossRef] [Scilit]
- Tesfaye, K.; Zaidi, P.H.; Gbegbelegbe, S.; Boeber, C.; Rahut, D.B.; Getaneh, F.; Seetharam, K.; Erenstein, O.; Stirling, C. Climate Change Impacts and Potential Benefits of Heat-Tolerant Maize in South Asia. Theor. Appl. Climatol. 2017, 130, 959–970. [Google Scholar] [CrossRef] [Scilit]
- Shiferaw, A.; Teka, D.; Berhe, M. Assessing Historical Trend of Climate Change and Variability in a Wheat-Growing Rainfed Agriculture in a Semi-Arid Environment: Endamehoni District, Southern Tigray, Ethiopia. Theor. Appl. Climatol. 2026, 157, 314. [Google Scholar] [CrossRef] [Scilit]
- Wakjira, M.T.; Peleg, N.; Six, J.; Molnar, P. Current and Future Cropland Suitability for Cereal Production across the Rainfed Agricultural Landscapes of Ethiopia. Agric. For. Meteorol. 2024, 358, 110262. [Google Scholar] [CrossRef] [Scilit]
- Abera, K.; Gayler, S.; Piepho, H.; Streck, T. Spatiotemporal Climatic Signals in Cereal Yield Variability and Trends in Ethiopia. Sci. Rep. 2025, 15, 37159. [Google Scholar] [CrossRef] [Scilit] [PubMed]
- Feleke, H.G.; Savage, M.J.; Fantaye, K.T.; Rettie, F.M. The Role of Crop Management Practices and Adaptation Options to Minimize the Impact of Climate Change on Maize (Zea mays L.) Production for Ethiopia. Atmosphere 2023, 14, 497. [Google Scholar] [CrossRef] [Scilit]
- Zeleke, T.T.; Alemayehu, S.; Lule, D.; Gelaw, A.M.; Dejene, S.W.; Tesfaye, L.; Chilambe, P.A.; Girvetz, E. Advancing Spatiotemporal Analysis of Climate Variability: Current Trends, Future Projections, Causes, and Impacts on Maize Production in Southern Ethiopia. Earth Syst. Environ. 2026, 10, 6119–6142. [Google Scholar] [CrossRef] [Scilit]
- Kassie, B.T.; Rötter, R.P.; Hengsdijk, H.; Asseng, S.; Van Ittersum, M.K.; Kahiluoto, H.; Van Keulen, H. Climate Variability and Change in the Central Rift Valley of Ethiopia: Challenges for Rainfed Crop Production. J. Agric. Sci. 2014, 152, 58–74. [Google Scholar] [CrossRef] [Scilit]
- Intergovernmental Panel on Climate Change (IPCC). Climate Change 2021—The Physical Science Basis: Working Group I Contribution to the Sixth Assessment Report of the Intergovernmental Panel on Climate Change, 1st ed.; Cambridge University Press: Cambridge, UK, 2023; ISBN 978-1-009-15789-6. [Google Scholar]
- Allen, R.G. (Ed.) Crop Evapotranspiration: Guidelines for Computing Crop Water Requirements; FAO Irrigation and Drainage Paper; Repr.; Food and Agriculture Organization of the United Nations: Rome, Italy, 2000; ISBN 978-92-5-104219-9. [Google Scholar]
- Prudhomme, C.; Giuntoli, I.; Robinson, E.L.; Clark, D.B.; Arnell, N.W.; Dankers, R.; Fekete, B.M.; Franssen, W.; Gerten, D.; Gosling, S.N.; et al. Hydrological Droughts in the 21st Century, Hotspots and Uncertainties from a Global Multimodel Ensemble Experiment. Proc. Natl. Acad. Sci. USA 2014, 111, 3262–3267. [Google Scholar] [CrossRef] [Scilit] [PubMed]
- Rockström, J.; Karlberg, L.; Wani, S.P.; Barron, J.; Hatibu, N.; Oweis, T.; Bruggeman, A.; Farahani, J.; Qiang, Z. Managing Water in Rainfed Agriculture—The Need for a Paradigm Shift. Agric. Water Manag. 2010, 97, 543–550. [Google Scholar] [CrossRef] [Scilit]
- Rosa, L.; Chiarelli, D.D.; Sangiorgio, M.; Beltran-Peña, A.A.; Rulli, M.C.; D’Odorico, P.; Fung, I. Potential for Sustainable Irrigation Expansion in a 3 °C Warmer Climate. Proc. Natl. Acad. Sci. USA 2020, 117, 29526–29534. [Google Scholar] [CrossRef] [Scilit] [PubMed]
- Sacks, W.J.; Cook, B.I.; Buenning, N.; Levis, S.; Helkowski, J.H. Effects of Global Irrigation on the Near-Surface Climate. Clim. Dyn. 2009, 33, 159–175. [Google Scholar] [CrossRef] [Scilit]
- Jägermeyr, J.; Pastor, A.; Biemans, H.; Gerten, D. Reconciling Irrigated Food Production with Environmental Flows for Sustainable Development Goals Implementation. Nat. Commun. 2017, 8, 15900. [Google Scholar] [CrossRef] [Scilit] [PubMed]
- Kumari, P.; Jaiswal, R.K.; Singh, H.P. Assessing Climate Change Impacts on Irrigation Water Requirements in the Lower Mahanadi Basin: A CMIP6-Based Spatiotemporal Analysis and Future Projections. J. Water Clim. Change 2024, 15, 3328–3345. [Google Scholar] [CrossRef] [Scilit]
- Pretty, J.; Bharucha, Z.P. Sustainable Intensification in Agricultural Systems. Ann. Bot. 2014, 114, 1571–1596. [Google Scholar] [CrossRef] [Scilit] [PubMed]
- Wakjira, M.T.; Peleg, N.; Six, J.; Molnar, P. Green Water Availability and Water-Limited Crop Yields under a Changing Climate in Ethiopia. Hydrol. Earth Syst. Sci. 2025, 29, 863–886. [Google Scholar] [CrossRef] [Scilit]
- Davis, K.F.; Rulli, M.C.; Garrassino, F.; Chiarelli, D.; Seveso, A.; D’Odorico, P. Water Limits to Closing Yield Gaps. Adv. Water Resour. 2017, 99, 67–75. [Google Scholar] [CrossRef] [Scilit]
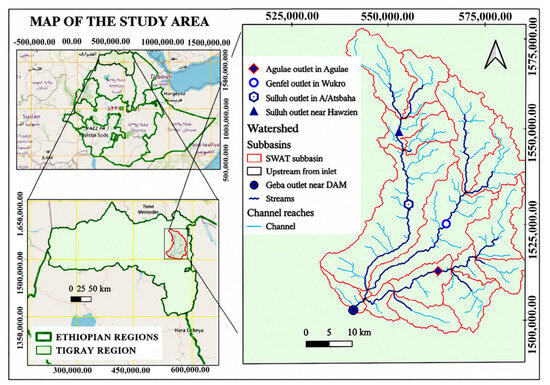
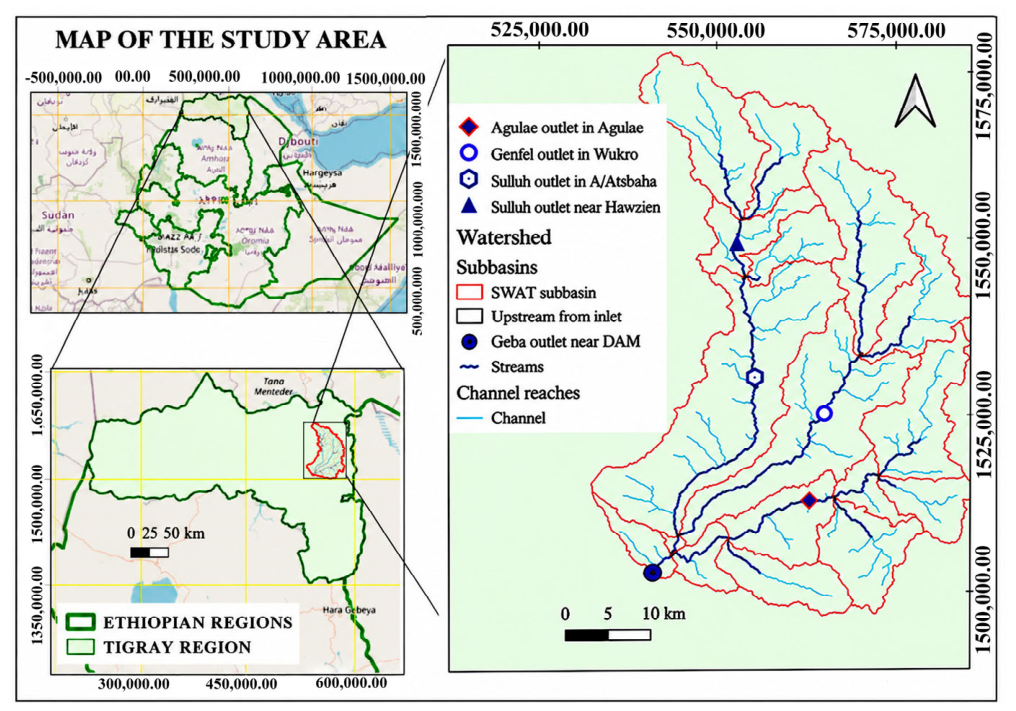
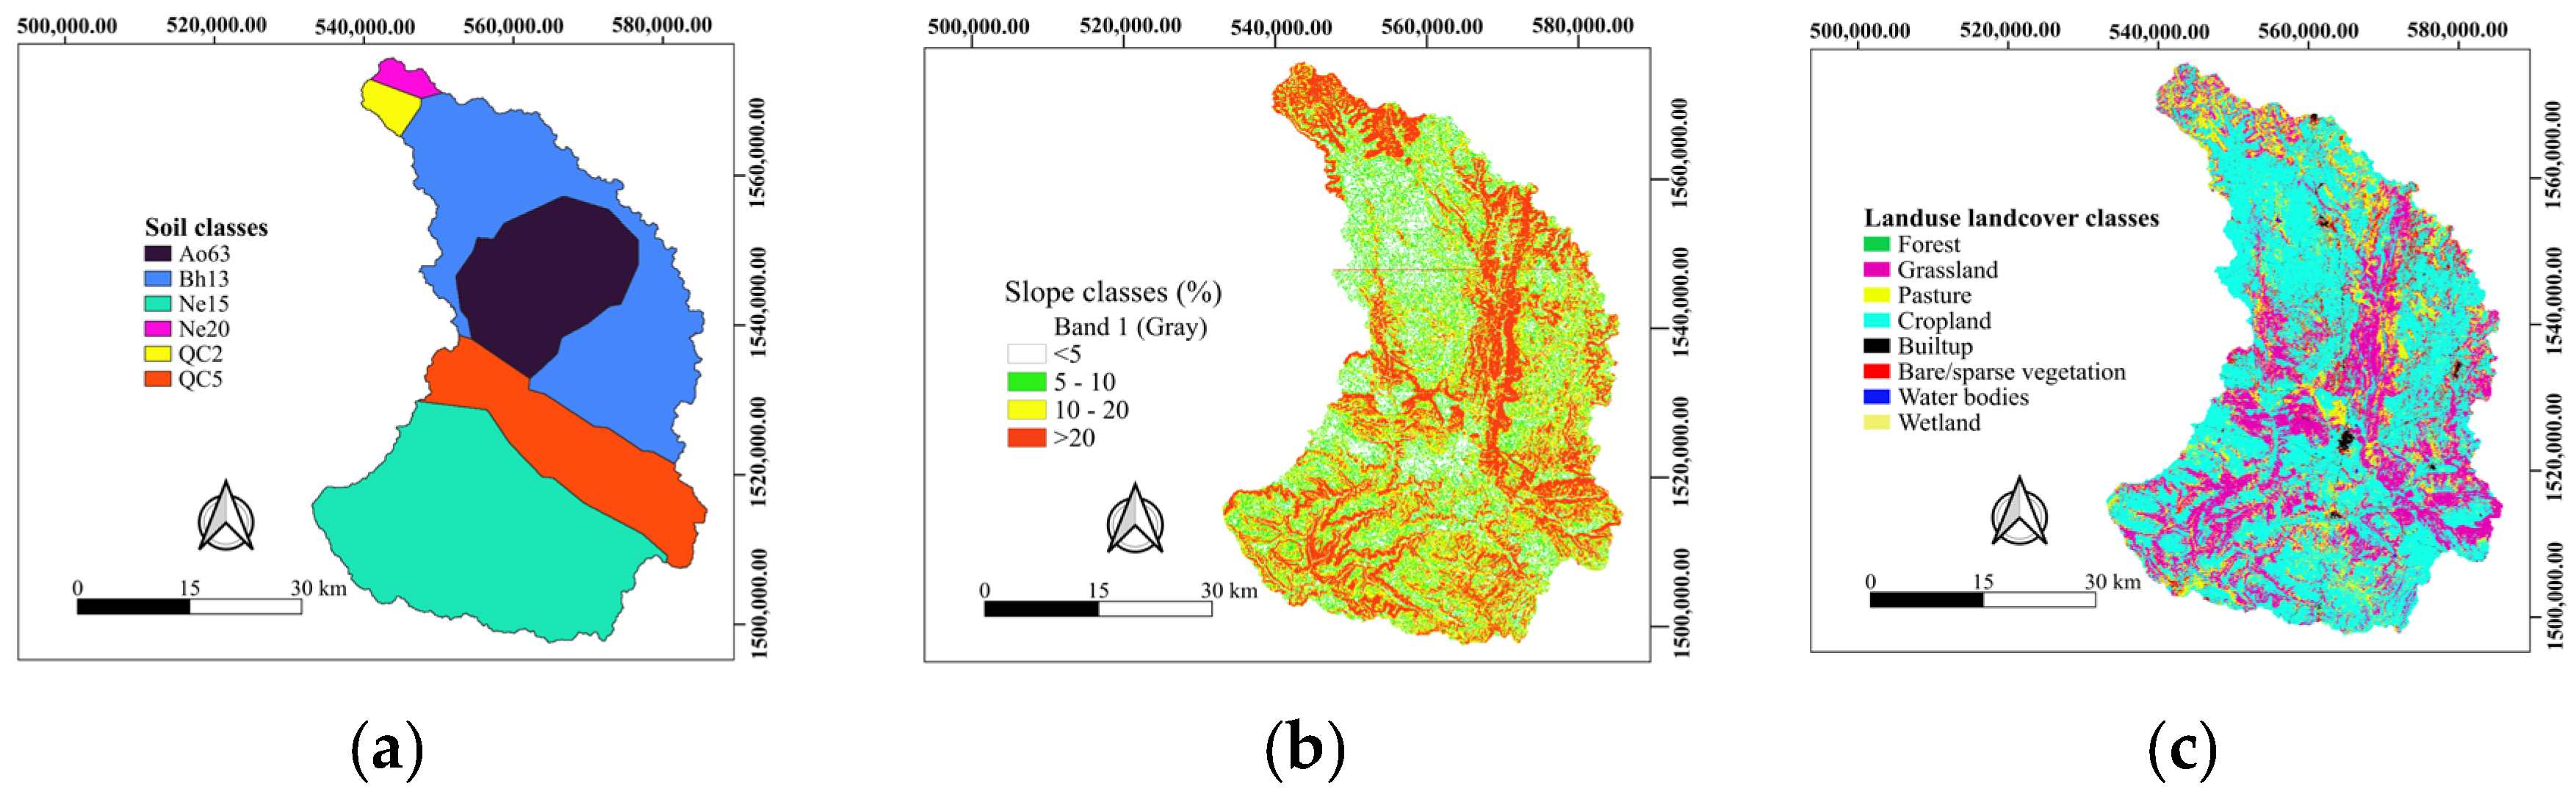
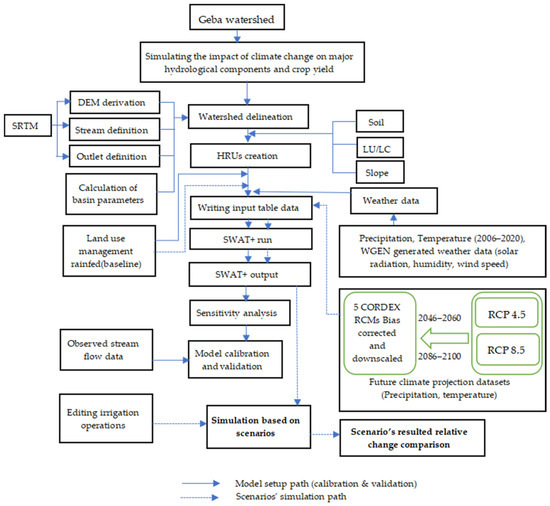
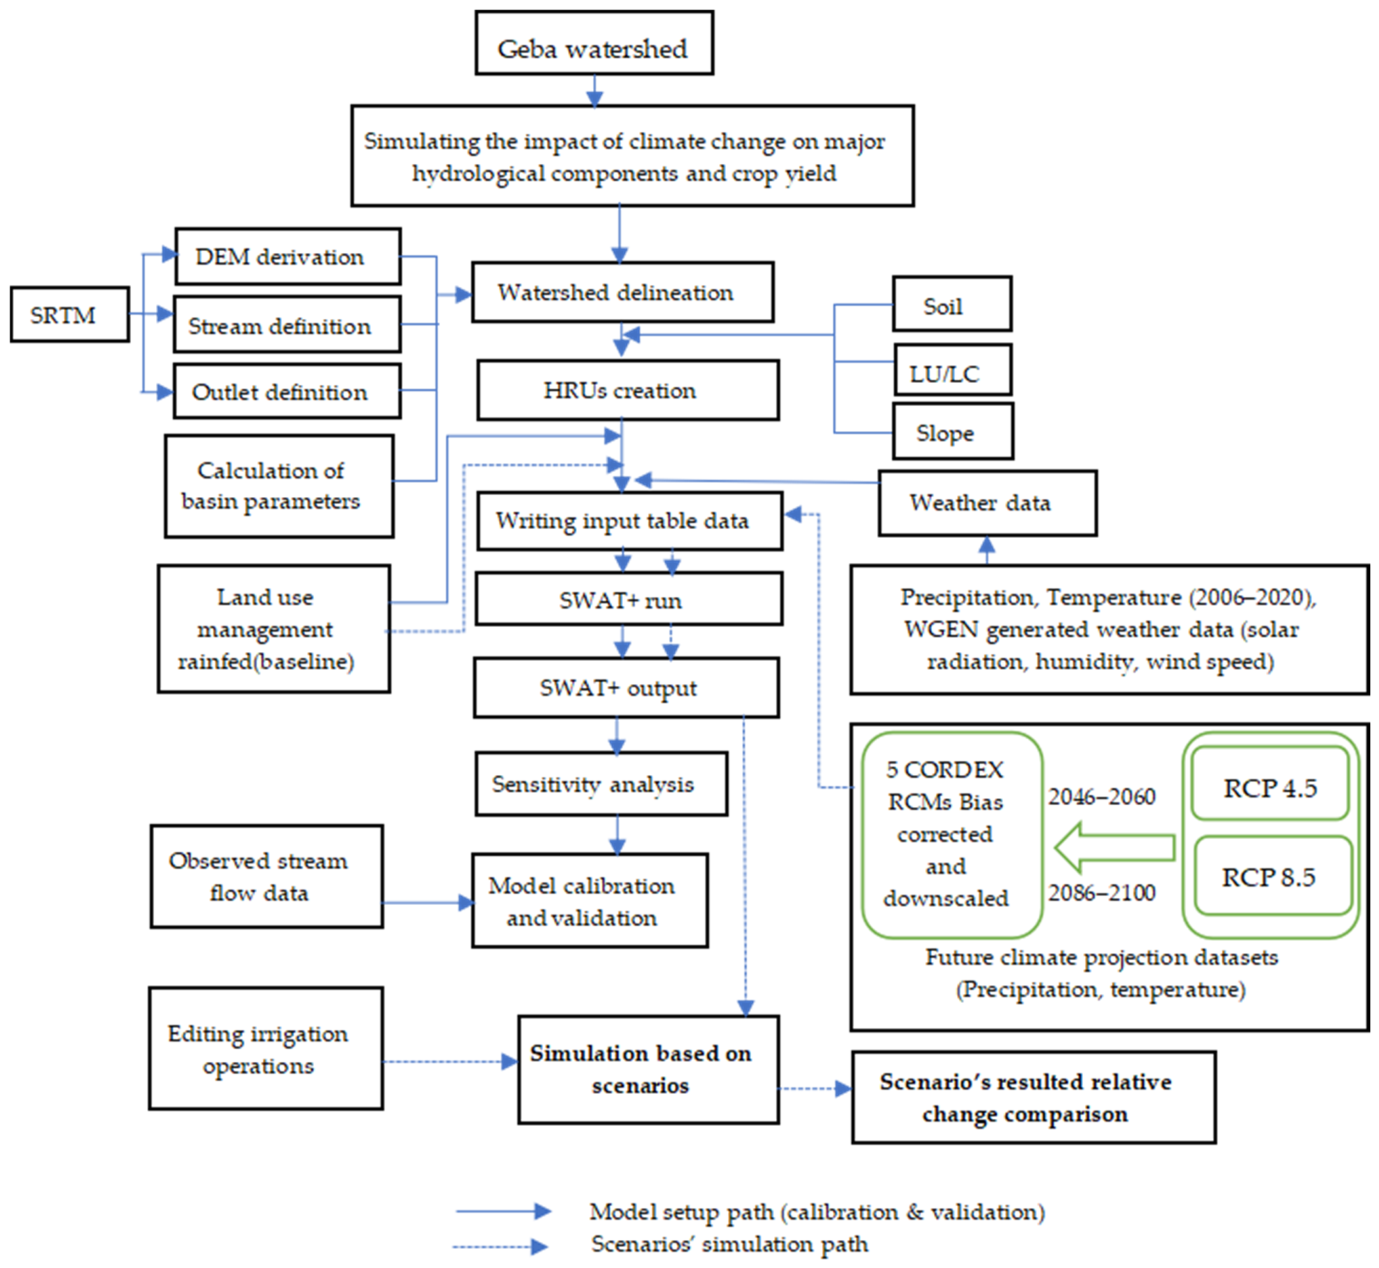
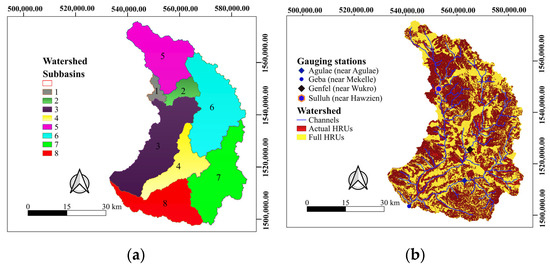
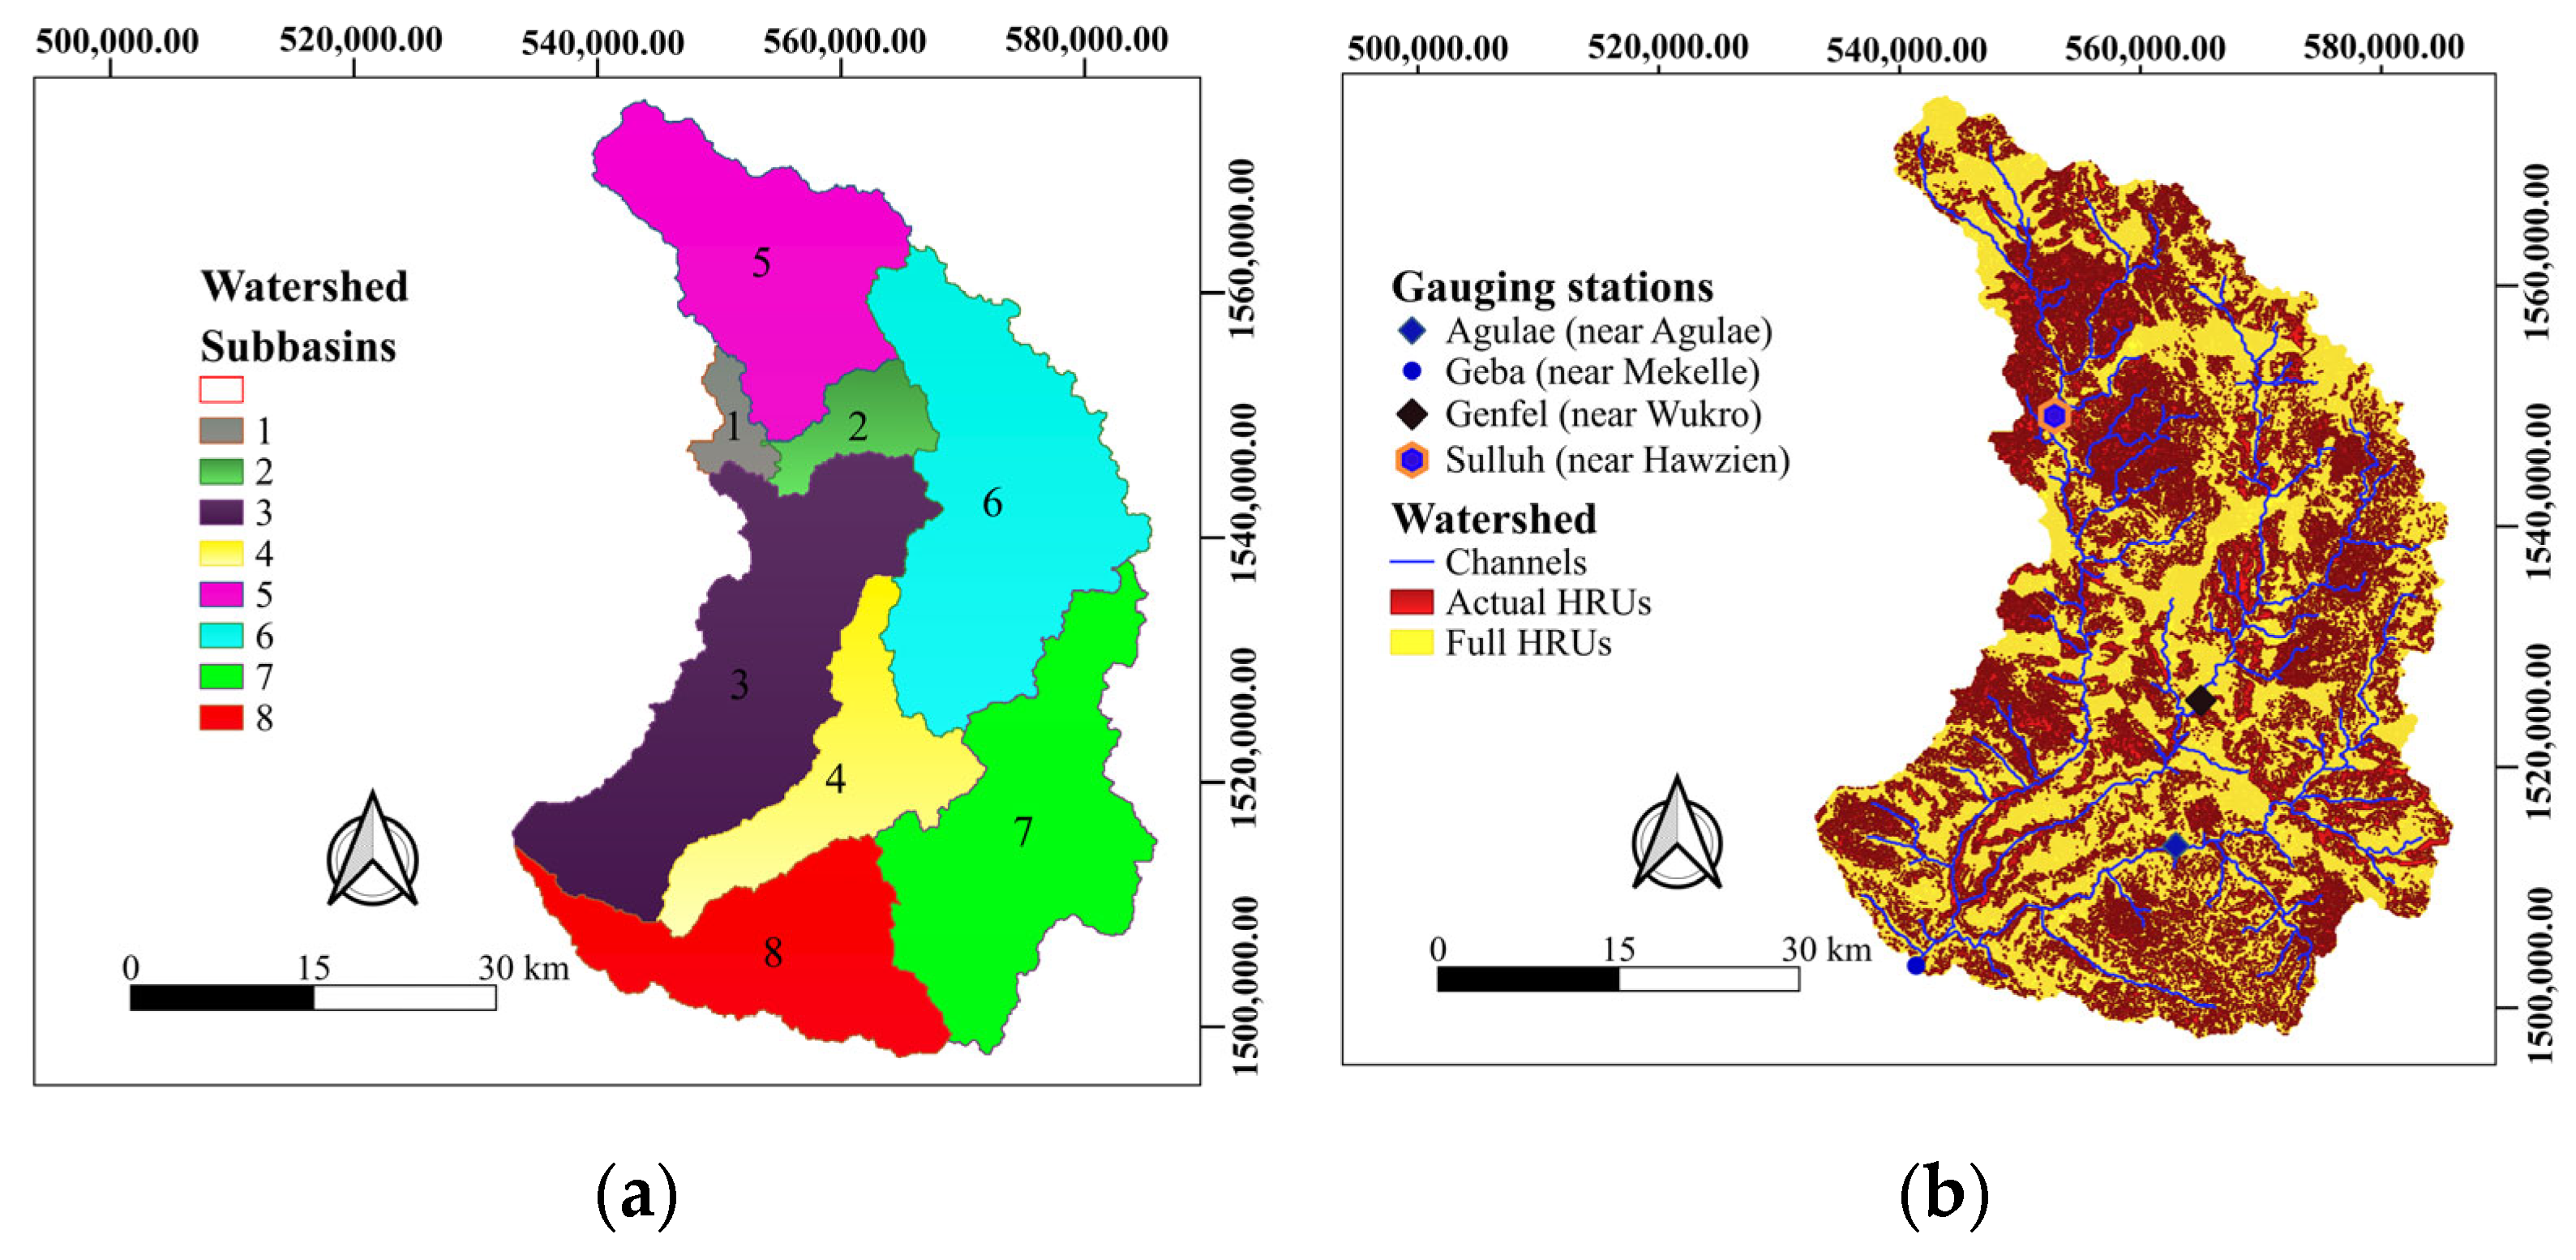
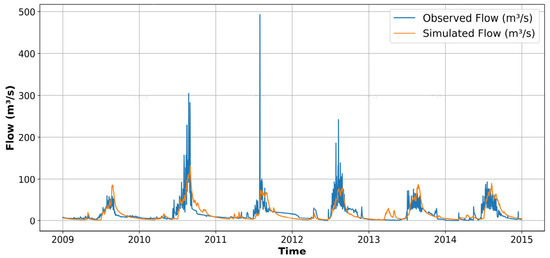
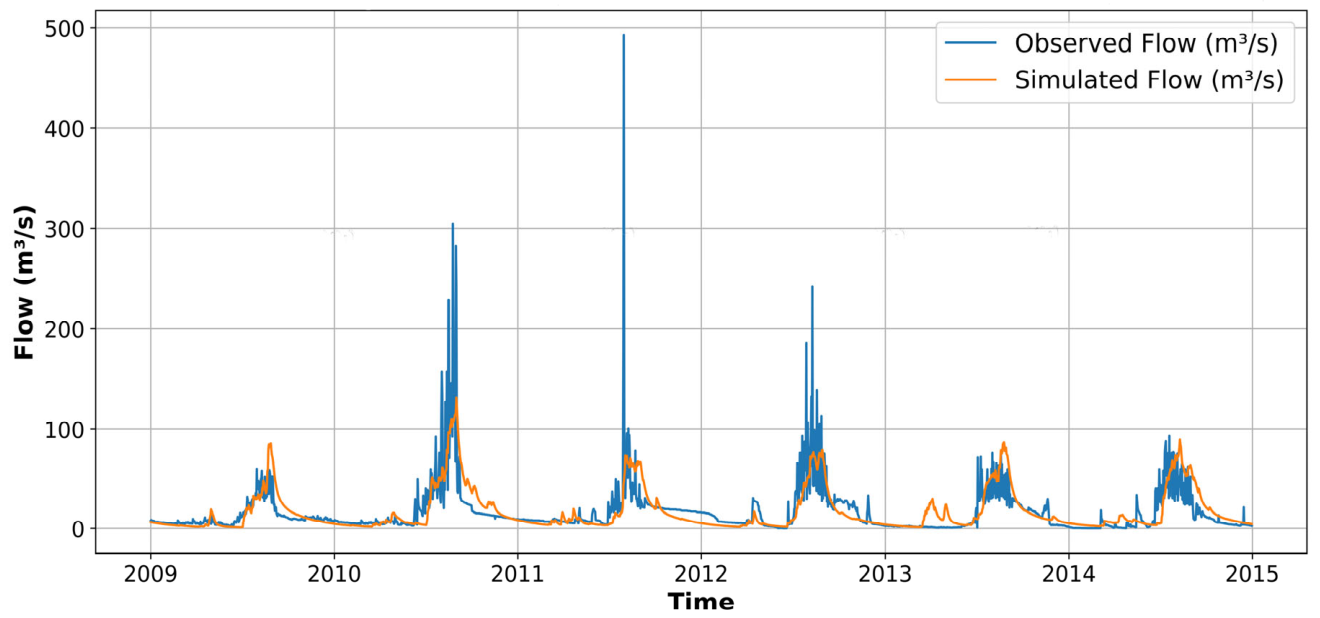
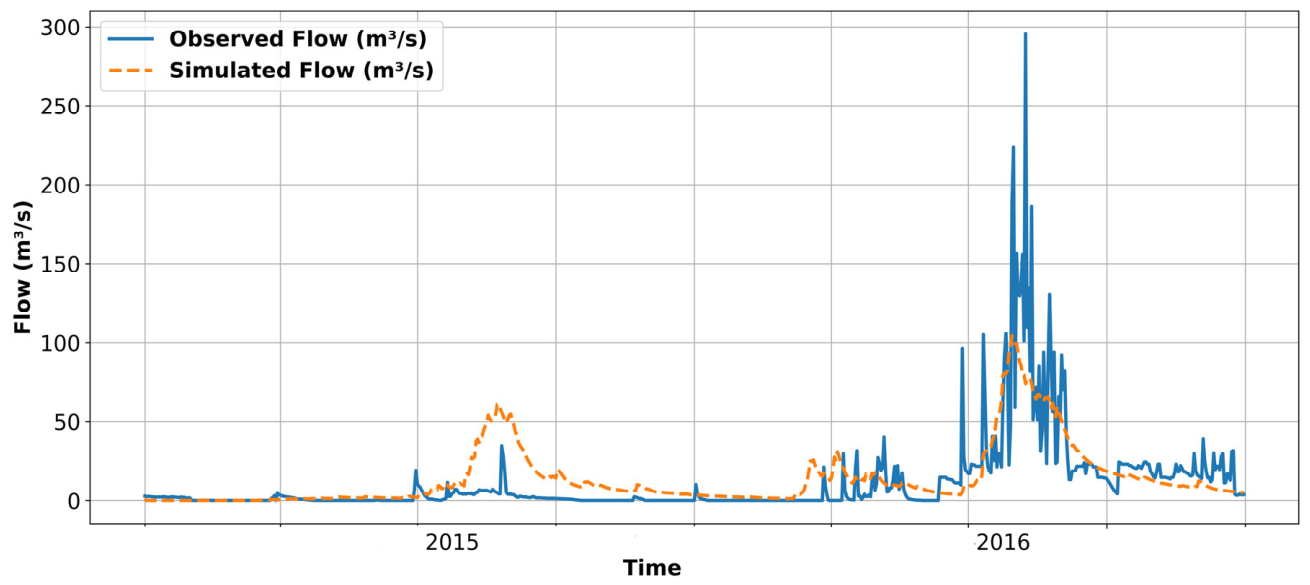
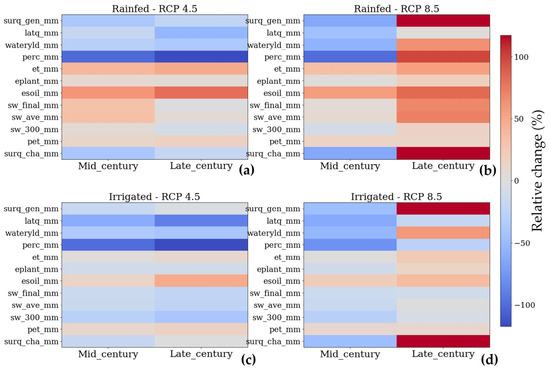
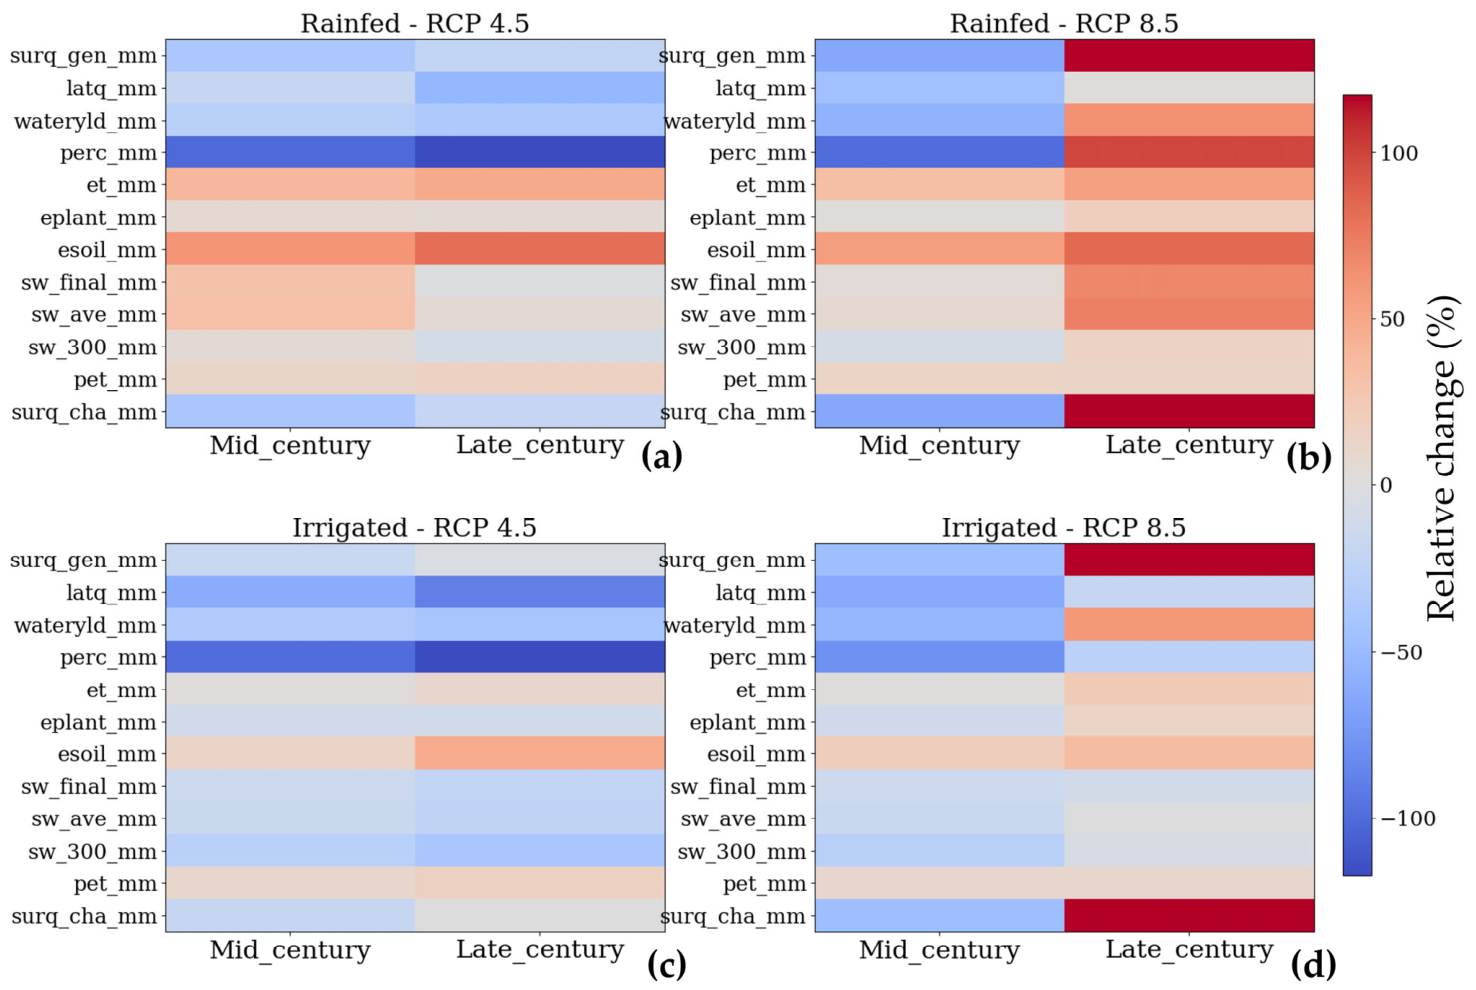
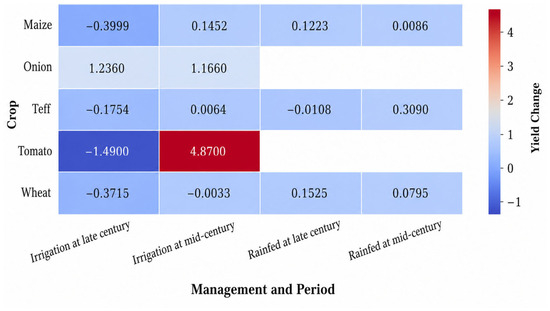
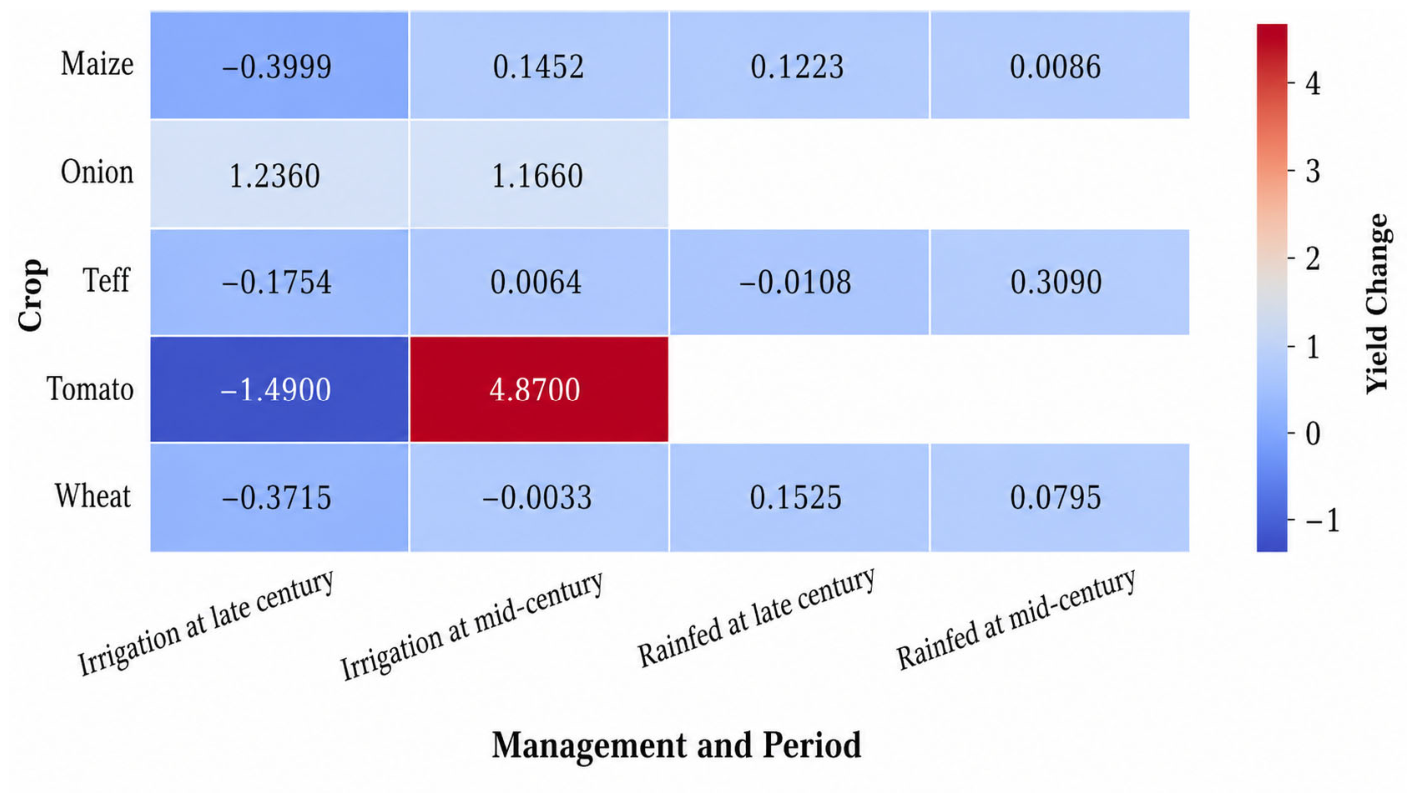
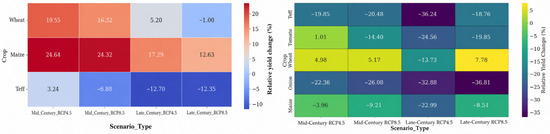
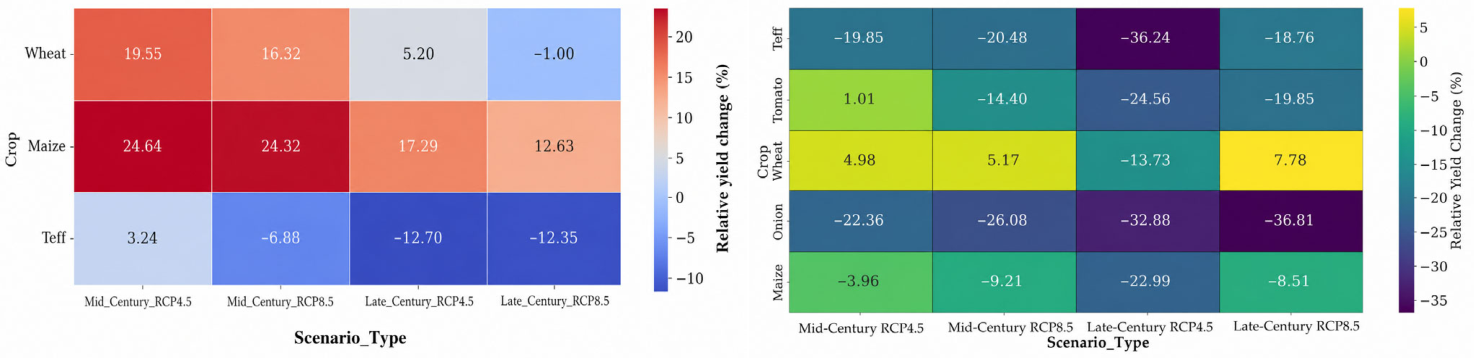

Disclaimer/Publisher’s Note: The statements, opinions and data contained in all publications are solely those of the individual author(s) and contributor(s) and not of MDPI and/or the editor(s). MDPI and/or the editor(s) disclaim responsibility for any injury to people or property resulting from any ideas, methods, instructions or products referred to in the content. |
© 2026 by the authors. Licensee MDPI, Basel, Switzerland. This article is an open access article distributed under the terms and conditions of the Creative Commons Attribution (CC BY) license.