


Abstract
Understanding the interactions between vegetation dynamics and surface water availability is essential for assessing the resilience of tropical floodplain ecosystems under increasing hydroclimatic variability. This study analyzes the spatio-temporal dynamics of vegetation cover, surface water, and land use in Zambrano, a floodplain-dominated sector of the lower Magdalena River basin (Colombian Caribbean), over the period 1990–2025. Multi-temporal Landsat imagery was used to derive the Normalized Difference Vegetation Index (NDVI) and the Normalized Difference Water Index (NDWI), enabling the evaluation of seasonal and interannual ecohydrological variability under contrasting dry and rainy conditions. In addition, land-use classification was performed using a CORINE Land Cover methodology adapted for Colombia (CLC-C) to characterize the spatial organization of the landscape and its influence on vegetation–water interactions. Results show that vegetation dynamics are strongly controlled by hydroclimatic seasonality. Dense vegetation consistently expands during rainy periods, while dry seasons promote the expansion of open and sparse vegetation, reflecting seasonal vegetation stress rather than long-term degradation. NDWI patterns indicate that surface water and soil moisture are highly seasonal and spatially constrained, with open water largely confined to the Magdalena River channel and localized floodplain depressions. Extreme hydroclimatic events associated with the El Niño–Southern Oscillation (ENSO) produce abrupt but temporary changes in vegetation structure and surface moisture distribution. A strong inverse correlation between NDVI and NDWI reflects the contrasting spectral responses of vegetation and water surfaces resulting from the shared near-infrared (NIR) band in both indices. This spectral relationship is consistent with the observed seasonal variations in vegetation greenness and surface moisture across the floodplain. Land-use analysis reveals the progressive consolidation of the landscape, where the agropastoral matrix expanded from ~18,000 ha in 1990 to over 22,000 ha by 2025, driving a systematic reduction in natural and semi-natural forest structures. Forest conservation areas serve as critical ecological buffers, exhibiting lower seasonal variability in vegetation greenness. Overall, the results indicate that the Zambrano floodplain functions as a structurally stable yet highly responsive ecohydrological system, where vegetation dynamics and surface water availability are predominantly governed by interannual hydroclimatic pulses rather than long-term directional degradation. These findings demonstrate that while the structural matrix of the floodplain exhibits strong baseline resilience, its ecological functioning remains critically coupled with, and vulnerable to, the extreme phase shifts in ENSO cycles.
1. Introduction
Monitoring spatio-temporal changes in vegetation cover, land use, and surface water is fundamental for understanding ecosystem functioning and supporting sustainable territorial planning in riverine floodplains [1,2]. Globally, the combined effects of climate variability, land-use change, population growth, and resource exploitation have accelerated landscape transformation, leading to biodiversity loss, hydrological alteration, and increased socio-environmental vulnerability [3,4]. In Colombia, these pressures are particularly evident in large river basins, where agricultural expansion, cattle ranching, and informal settlements have significantly modified natural vegetation and hydrological regimes [4]. National forest monitoring reports indicate a cumulative loss of approximately 3.7 million hectares of natural cover between 2001 and 2018, with profound implications for ecosystem services and water regulation [5].
These transformations are especially critical in the Magdalena River basin, Colombia’s main fluvial system, which supports more than 70% of the national population and concentrates strategic economic activities [6,7]. The Magdalena River floodplain is characterized by a complex mosaic of wetlands, channels, and seasonally inundated plains that function as natural regulators of floods, sediment transport, and nutrient cycling. Hydroclimatic variability, strongly influenced by the El Niño–Southern Oscillation (ENSO), produces marked contrasts between dry and wet periods, amplifying flood and drought risks [6,8]. Extreme events such as the 2010–2011 La Niña floods and the 2015–2016 El Niño drought caused substantial ecological and socioeconomic impacts, including wetland desiccation, vegetation stress, and disruptions to local livelihoods.
Zambrano, a municipality located on the lower Magdalena River floodplain in the department of Bolívar, represents a strategic yet understudied territory within the Momposina Depression wetland complex [8]. The area is characterized by interconnected marshes, fluvial channels, and seasonally flooded landscapes that sustain agriculture, livestock, fisheries, and local settlements. Despite its ecological and socioeconomic importance, Zambrano faces increasing pressures from agricultural expansion, deforestation, and peri-urban growth, which threaten the integrity of wetlands and their hydrological regulation. Previous studies in northern South America have demonstrated strong linkages between land-use change and hydrological responses, particularly in floodplain environments. In the Magdalena River basin, land-cover transformation has been associated with altered runoff patterns, reduced flood buffering capacity, and increased vulnerability to extreme events [9]. Similarly, wetland-focused studies in the Colombian Caribbean have documented wetland loss, vegetation fragmentation, and urban encroachment driven by both climatic variability and human pressure [10,11].
Remote sensing has become an essential tool for monitoring these dynamics due to its synoptic coverage, temporal continuity, and cost-effectiveness [12]. The Normalized Difference Vegetation Index (NDVI) is widely used to assess vegetation greenness, biomass, and stress responses to climatic and anthropogenic drivers [13,14]. Long-term NDVI time series have revealed patterns of vegetation degradation and recovery across tropical floodplains under varying hydroclimatic conditions [15]. Complementarily, the Normalized Difference Water Index (NDWI) enables accurate detection of surface water dynamics, capturing seasonal flooding, wetland connectivity, and hydrological variability [16].
While the individual or combined application of spectral indices like NDVI and NDWI is a well-established standard in remote sensing literature [10,11], a critical gap remains regarding how tropical floodplain ecosystems in northern South America function under shifting macroclimatic drivers. Specifically, there is limited empirical understanding of how the tight ecohydrological coupling between canopy greenness and surface moisture availability undergoes reorganization during extreme ENSO phases, such as the severe 2010 La Niña floods and the 2015 El Niño drought, within the strategic wetland complexes of the Momposina Depression. This study addresses this localized functional gap by evaluating the decadal and seasonal ecohydrological responses of the Zambrano floodplain to hydroclimatic extremes under a prolonged matrix of structural land-use changes. The reliability of NDVI and NDWI for environmental monitoring has been extensively demonstrated in the remote sensing literature. NDVI has been validated as a robust indicator of vegetation greenness, canopy condition, and biomass across a wide range of ecosystems, including tropical forests and wetlands [13,14,15]. Similarly, NDWI has proven effective for delineating surface-water extent, identifying seasonal inundation patterns, and monitoring wetland hydrological dynamics using Landsat imagery [16]. The complementary application of both indices has been successfully employed to characterize vegetation–water interactions, floodplain connectivity, and long-term landscape dynamics in wetland ecosystems [10,11], providing a scientifically sound framework for assessing hydroclimatic responses in floodplain environments such as the Magdalena River wetland system. NDVI values are primarily influenced by vegetation characteristics, including chlorophyll content, canopy density, biomass, and seasonal phenological changes, whereas NDWI mainly responds to surface-water extent, vegetation water content, soil moisture, and seasonal inundation. Because both indices are sensitive to hydroclimatic conditions, their combined application provides complementary information for assessing vegetation–water interactions and floodplain dynamics [10,11,12,13,14,15,16]. Although NDVI and NDWI have been widely applied to monitor vegetation and surface-water dynamics in wetland environments, few studies have evaluated their combined long-term application to characterize the responses of tropical floodplain wetlands to contrasting hydroclimatic conditions in the Magdalena River basin. In particular, the interaction between vegetation dynamics, surface-water availability, and land-use change under repeated ENSO events remains poorly understood in the Momposina Depression. Addressing this knowledge gap is essential for improving floodplain monitoring and supporting ecosystem-based management in one of Colombia’s most important wetland systems.
In this context, the present study aims to analyze the spatio-temporal dynamics of vegetation, surface water, and land use in Zambrano (Colombian Caribbean) between 1990 and 2025 under contrasting hydroclimatic conditions. By integrating NDVI, NDWI, and land-cover classification derived from satellite imagery, this research seeks to (i) characterize long-term vegetation and surface water dynamics, (ii) evaluate land use and its spatial distribution, and (iii) to explore the relationship between vegetation greenness, surface moisture, and hydroclimatic variability through the combined interpretation of spectral indices and independent hydrometeorological observations. The results are intended to provide scientific evidence to support territorial management, wetland conservation, and sustainable planning in the lower Magdalena River floodplain.
2. Study Area
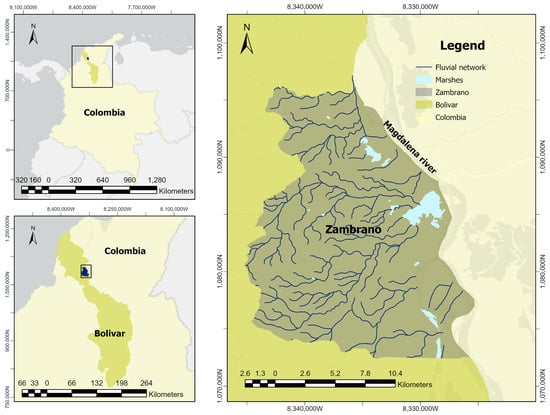
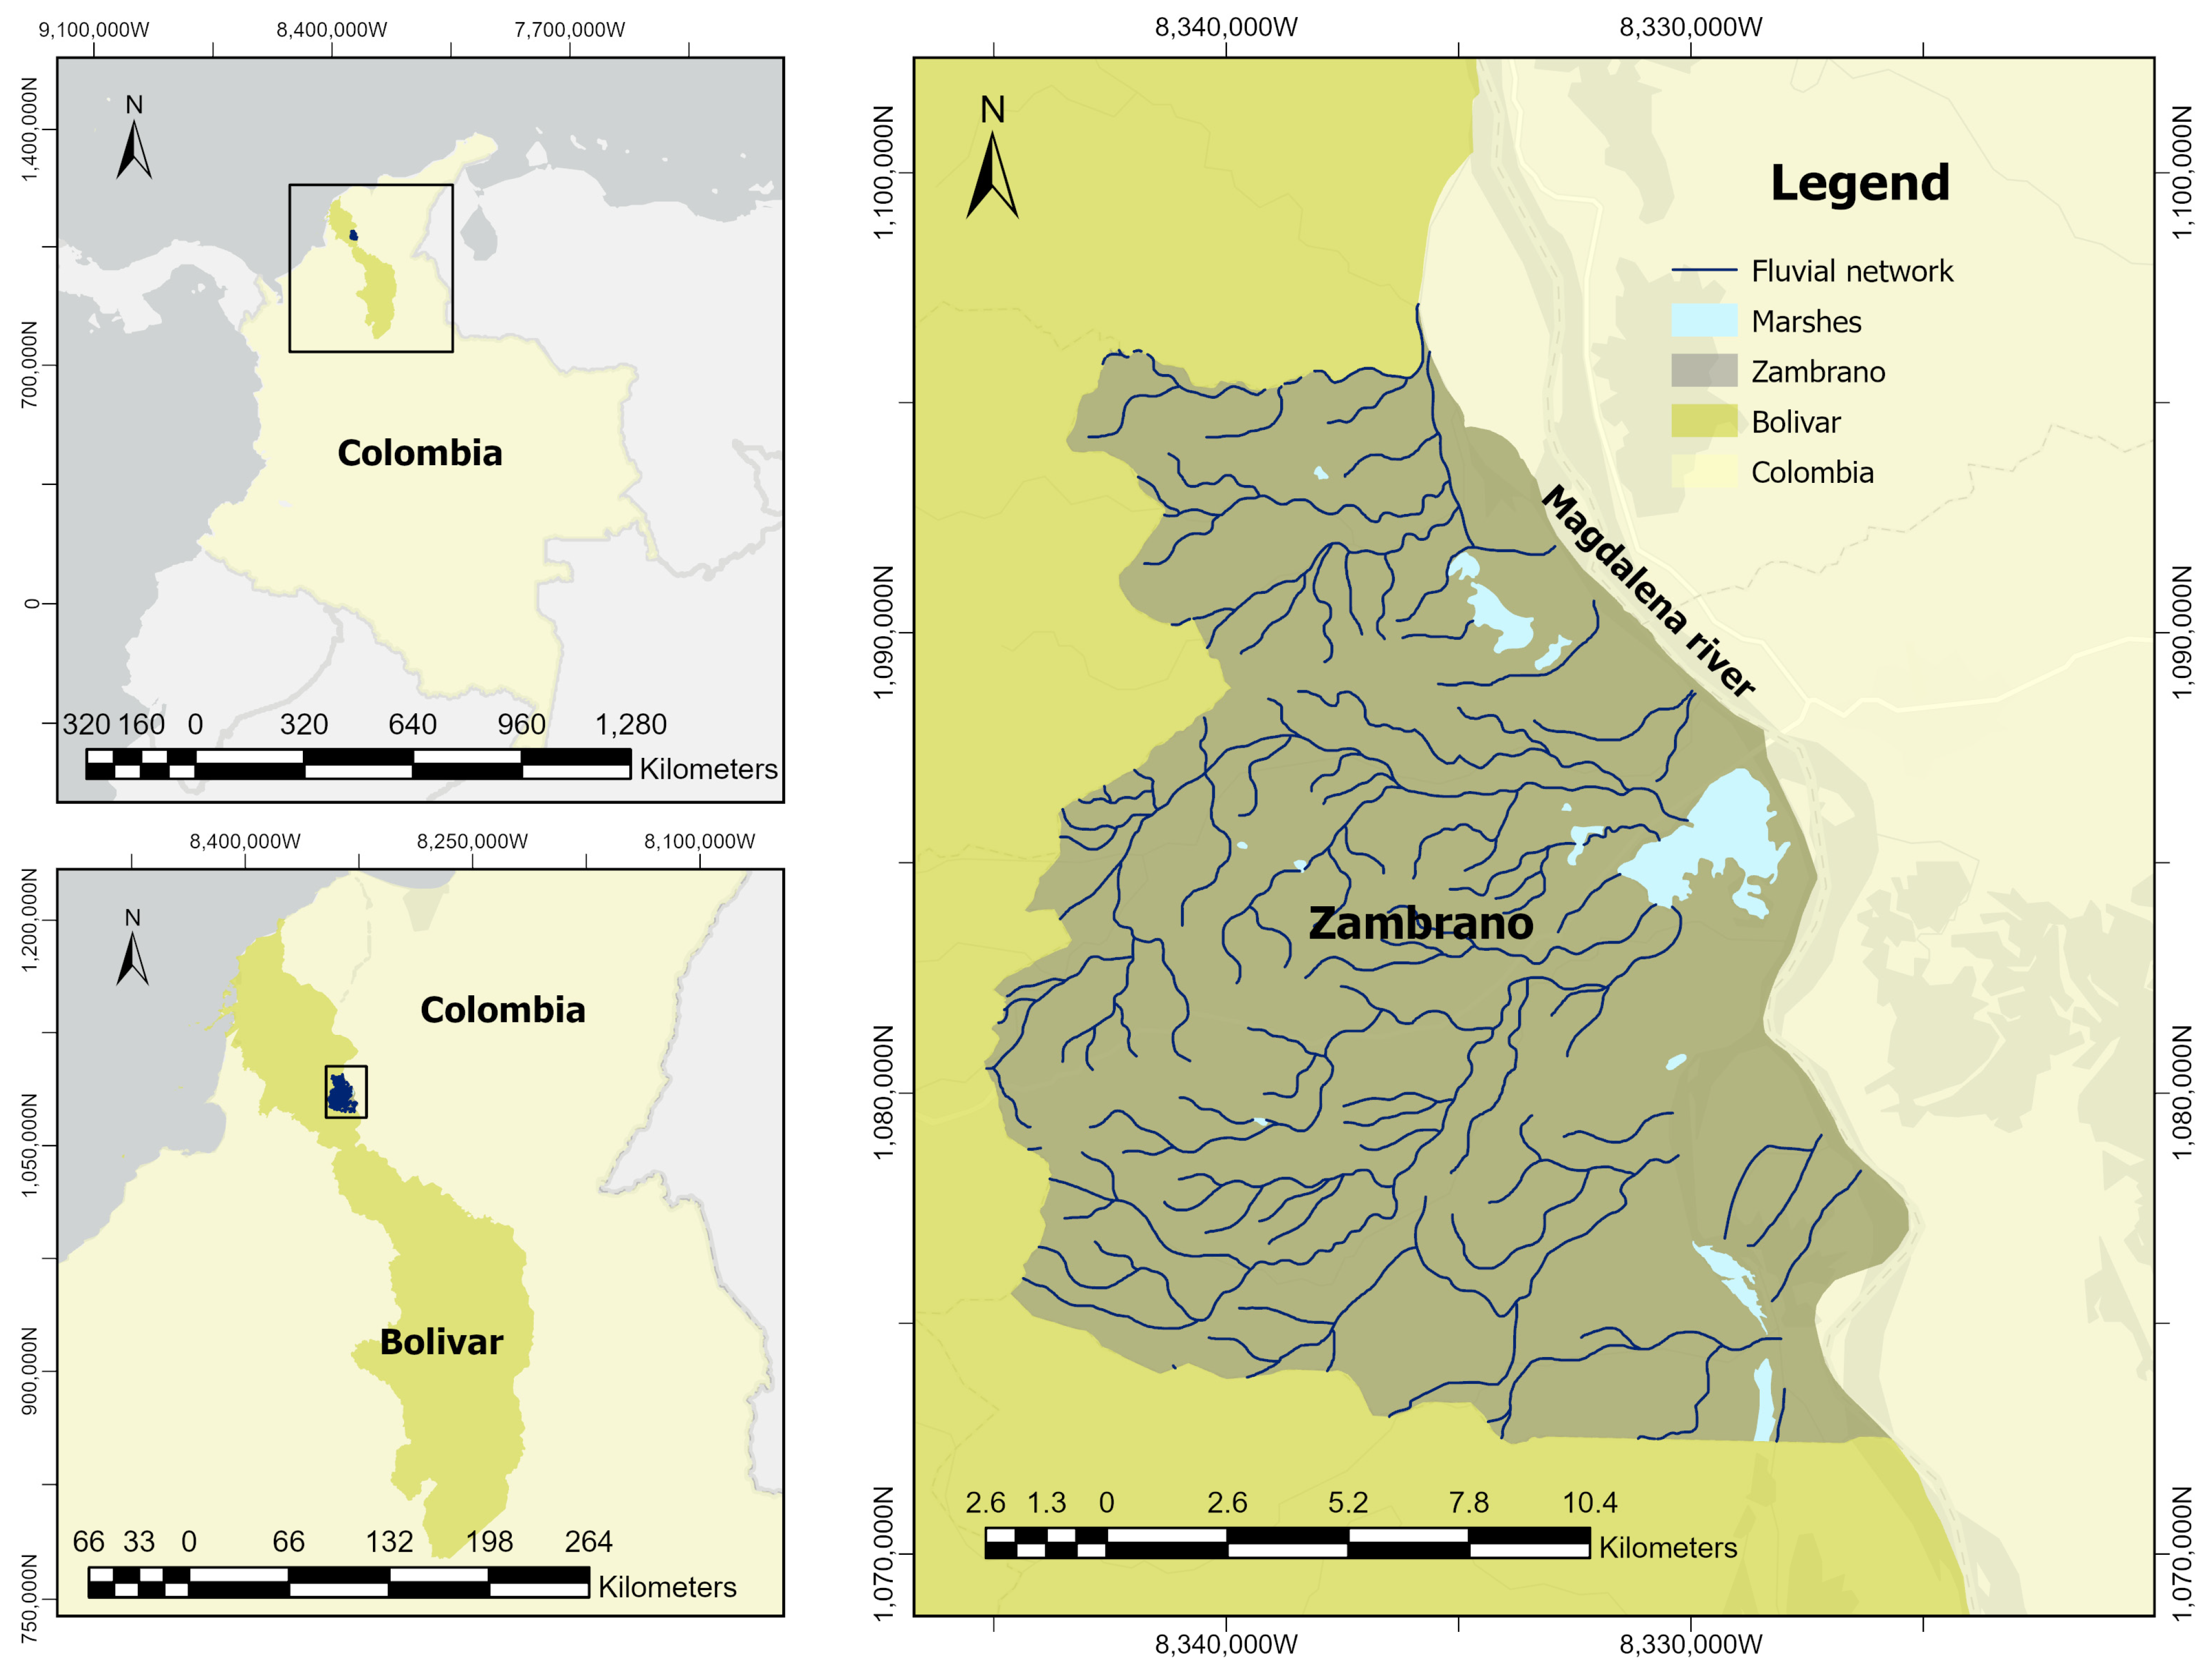
The municipality of Zambrano, located in the department of Bolívar (northern Colombia), covers approximately 302 km2 and lies within the alluvial plain of the lower Magdalena River, forming part of the wetland system of the Momposina Depression [6]. This territory is characterized by an interconnected network of marshes, channels, and fluvial canals, among which six marshland bodies stand out on the eastern margin of the municipality: El Poyal, Zambrano, Salitral, Soledad, Largo, and Playoncito. The Cienaga de Zambrano, the largest and closest to the urban center, plays a key role as a natural regulator of river flows and as habitat for aquatic and riparian species [17,18] (Figure 1).
Figure 1.
Study area.
Hydrological dynamics in this sector of the lower Magdalena River basin are governed by a bimodal discharge regime associated with seasonal precipitation patterns and large-scale climate variability. The river exhibits an average discharge of approximately 7200 m3/s, with minimum flows of 4068 m3/s during the dry season (December–March) and peak discharges reaching 10,287 m3/s in the rainy season (particularly in November), as recorded at the Calamar gauging station (IDEAM Station Code: 29037020, https://www.datos.gov.co, accessed on 8 July 2026), the closest discharge gauging station to the study area and historically utilized to represent the hydrological regime of the lower Magdalena River channel. These dynamics are strongly influenced by ENSO events, with intensified flooding during La Niña phases and reduced water levels during El Niño conditions [5,19,20,21]. This pulsed hydrological regime governs the periodic activation of floodplain environments, regulating surface moisture availability, sediment redistribution, and vegetation dynamics across low-lying areas. Although several minor tributaries originate outside the municipal boundary, their individual runoff contributions were not explicitly modeled. Instead, the remotely sensed indicators analyzed in this study represent the integrated response of the floodplain to all hydrological drivers, including tributary inflows, local precipitation, and the seasonal flood pulse of the Magdalena River.
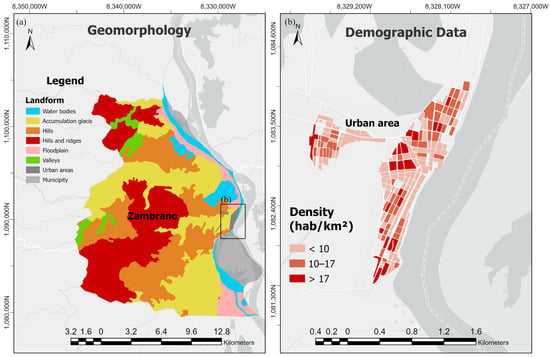
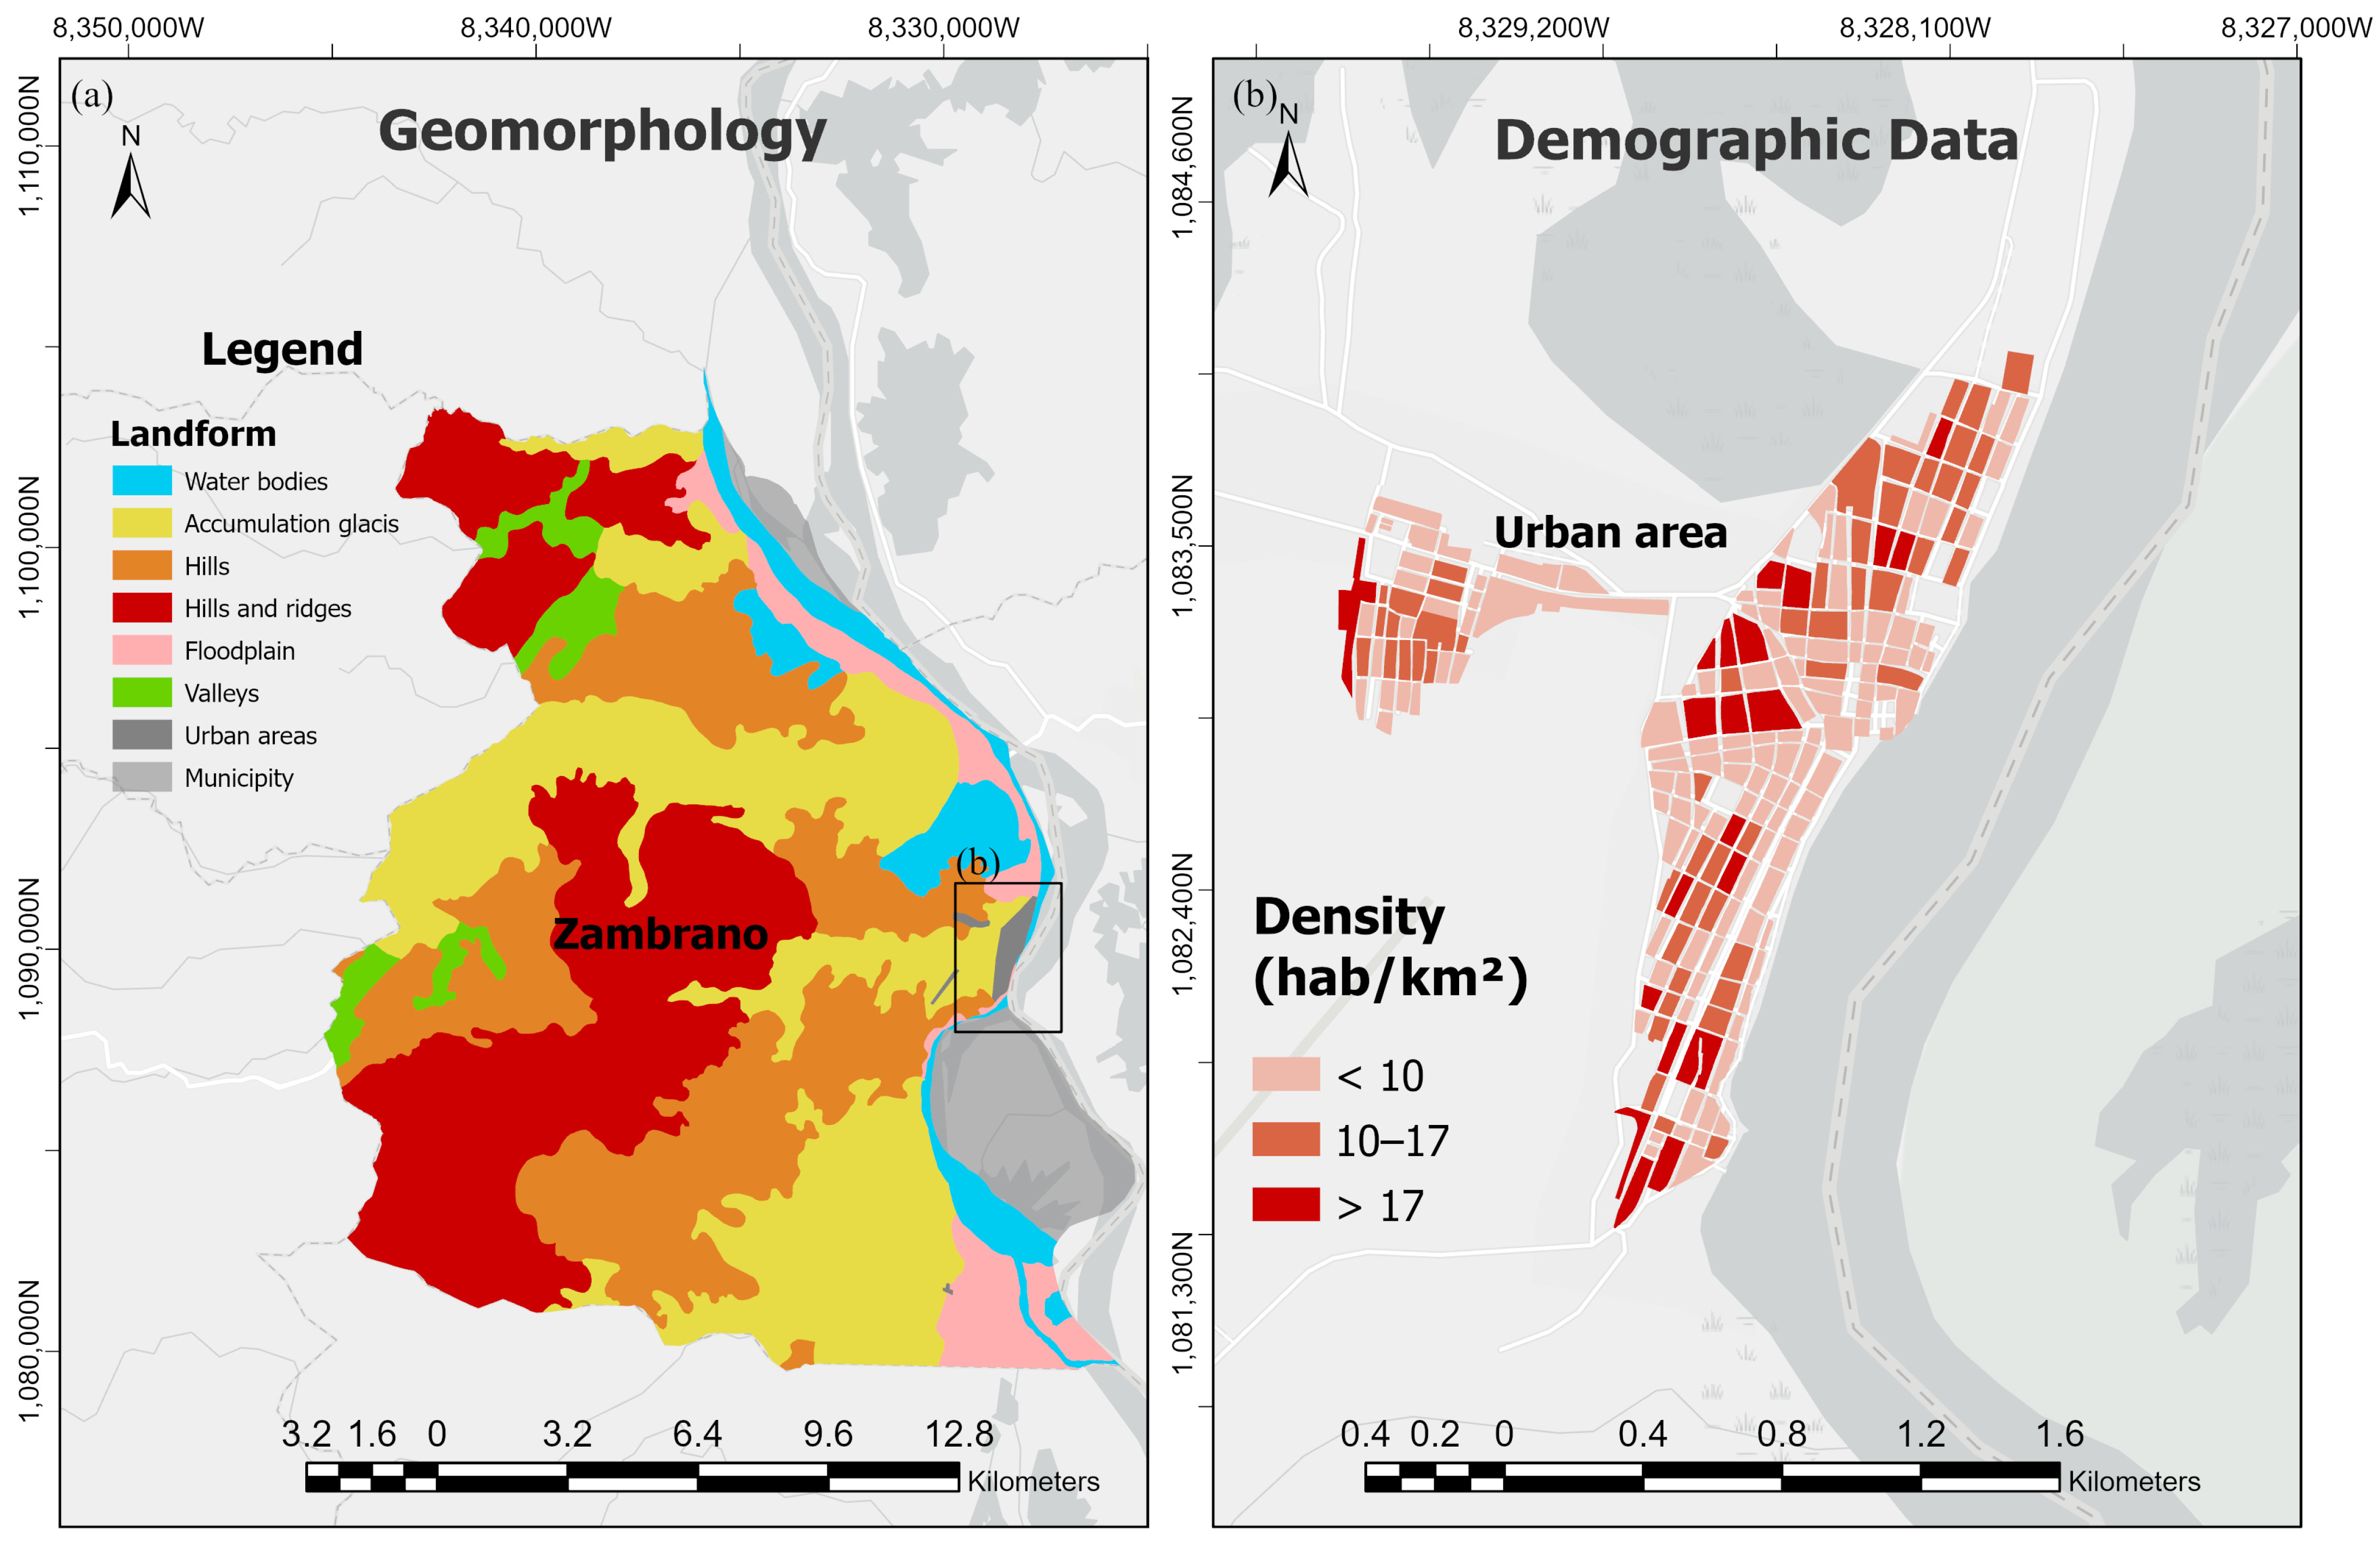
At the local scale, hydrological connectivity is structured by wetlands, channels, and seasonally inundated depressions associated with the main river course. These environments function as temporary storage and exchange zones that regulate lateral water movement between the river channel and surrounding lowlands. During high-water periods, they facilitate short-lived expansions of surface moisture, while in dry periods, connectivity becomes spatially restricted and hydrological exchange is confined to permanent or semi-permanent water bodies [5,8,22,23]. Figure 2 illustrates the physical and demographic context of the study area. The geomorphological setting of the study area is structured into three main landscapes that control hydrological connectivity [22]:
Figure 2.
(a) Geomorphological map of the Zambrano floodplain; (b) Population density within the urban area of Zambrano.
The Active Floodplain: Located at low elevations ranging between 10 and 25 m.a.s.l. This unit experiences direct lateral hydrological connectivity through seasonal overbank flooding and backing effects from the Magdalena River into the permanent marshland complex (Ciénaga de Zambrano) during wet phases.
Accumulation Glacis and Valleys: Transition zones located between 25 and 50 m a.s.l. These features experience episodic, indirect connectivity, mainly acting as preferential pathways for local runoff and temporary storage of surface water during heavy localized precipitation events.
Hills and Ridges (Hills, Hills and ridges): Denudational structures rising from 50 to over 150 m a.s.l. These high-elevation landforms are hydrologically disconnected from the river’s flood pulse and function as shedding surfaces that supply tributary runoff to low-lying active zones.
Population density is concentrated within the urban center of Zambrano, where spatial variability in settlement distribution may affect human–environment interactions, resource use, and pressure on surrounding ecosystems. These interactions have contributed to changes in land cover, particularly through agricultural expansion and deforestation, leading to vegetation fragmentation and reduced ecological connectivity across the floodplain [5,9]. Regional environmental planning instruments emphasize the importance of wetlands in southern Bolívar as key regulators of hydrological processes and biodiversity and identify extensive areas of temporary and permanent flooding within the Magdalena–Cauca wetland complex [24,25,26,27,28].
3. Materials and Methods
Landsat satellite imagery was used to analyze the spatio-temporal dynamics of vegetation and surface water over the period 1990–2025. The selected years were chosen to represent different hydroclimatic conditions and stages within the 1990–2025 study period, allowing the assessment of long-term ecohydrological dynamics under contrasting environmental scenarios. Image selection prioritized scenes with minimal cloud cover (<10%), acquired during the dry (December–March) and rainy (June–October) seasons for the representative years 1990, 1996, 2000, 2005, 2010, 2015, 2020, and 2025. All images were obtained from the Landsat Collection 2 Level 2 Surface Reflectance product via Google Earth Engine (GEE) [29,30], ensuring atmospheric correction and radiometric consistency across sensors (Landsat 5 TM, Landsat 7 ETM+, Landsat 8 OLI, and Landsat 9 OLI-2). For each year and season, the selected imagery was used to generate a representative seasonal composite, minimizing the influence of residual cloud contamination and short-term atmospheric variability. Image mosaicking was applied to cover the full municipal extent, following standardized procedures to ensure spatial and radiometric homogeneity [31,32]. The Landsat Collection 2 Level-2 Surface Reflectance products were accessed through Google Earth Engine, which provides the official USGS archive at its native spatial resolution. All optical bands used for NDVI and NDWI calculations have a spatial resolution of 30 m.
NDVI and NDWI were calculated independently for each of the selected study years (1990, 1996, 2000, 2005, 2010, 2015, 2020, and 2025). For every year, seasonal composites representing the dry (December–March) and rainy (June–October) periods were generated from Landsat Collection 2 Level-2 Surface Reflectance imagery after applying a cloud cover threshold of <10%. The spectral indices were subsequently computed using the corresponding surface reflectance bands in Google Earth Engine. The Normalized Difference Vegetation Index (NDVI) was calculated from the near-infrared (NIR) and red spectral bands [13]: NDVI = (NIR − Red)/(NIR + Red). The Normalized Difference Water Index (NDWI) was computed using the green and NIR bands [16,33]: NDWI = (Green − NIR)/(Green + NIR). Both indices were calculated for each image and classified into discrete categories based on established thresholds (Table 1 and Table 2). While SWIR-based water indices are physically optimized for tracking soil liquid water, the Green–NIR formulation by McFeeters [33] was selected to maximize radiometric consistency across the long-term Landsat 5 to Landsat 9 historical baseline (1990–2025). To account for the spectral limitations of this index over land, the transitional ranges for Class 2 (low moisture) and Class 3 (moderate moisture) were empirically calibrated via visual inspection to represent surface saturation gradients and ecohydrological transition zones rather than absolute soil volumetric moisture. Classification thresholds were adopted from established literature [34] and adjusted through iterative visual inspection of Landsat imagery to ensure consistency with the observed vegetation and surface-water patterns of the Zambrano floodplain.
Table 1.
NDVI classification scheme applied to Landsat imagery.
Table 2.
NDWI classification scheme applied to Landsat imagery.
Land-use maps were derived from the annual land-cover products of MapBiomas Colombia Collection 3.0, generated from Landsat imagery at 30 m spatial resolution [35,36]. Because the MapBiomas classification system differs from the CORINE Land Cover methodology adapted for Colombia (CLC-C), a harmonization procedure was applied to establish equivalences between both legends [37,38]. Subsequently, land-use categories were assigned according to the coverage–land-use relationships defined by the CLC-C framework [39]. This procedure was implemented for 1990, 1996, 2000, 2005, 2010, 2015, 2020, and 2025, enabling analysis of long-term land-use dynamics in the Zambrano floodplain. Spatial and temporal dynamics of vegetation and surface water were quantified by computing the percentage of area in each NDVI and NDWI class for each image [40]. These statistics were stratified by hydrological season (dry/rainy) and year to enable comparison of interannual variability and to detect anomalous periods associated with ENSO events. Reference years for extreme events included 2010 (strong La Niña flood) and 2015 (El Niño drought). In addition, high-resolution land-use and land-cover data from global monitoring platforms [41,42] were used as supplementary reference layers. Temporal analysis of NDWI was complemented by a comparison with satellite-derived global surface water datasets to contextualize observed trends in surface water dynamics [43].
To explore the relationships among hydrological, climatic, environmental, and land-use variables, a Principal Component Analysis (PCA) was performed using the standardized dataset [44]. Prior to the analysis, all variables were centered and scaled to unit variance to eliminate the influence of differing measurement units. PCA was conducted using the rda () function from the vegan package in R (Version 4.6.1, https://cran.r-project.org), and the resulting ordination was used to identify the main gradients of variability and the associations among variables. Variables included NDVI classes, NDWI classes, rainfall, streamflow, and land-use macro-classes. The first principal components were interpreted based on their explained variance and the directions and magnitudes of the variable loadings.
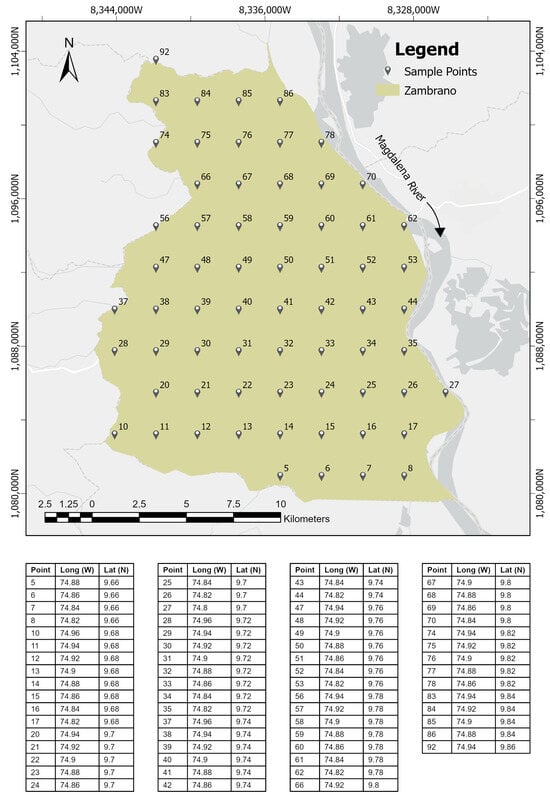
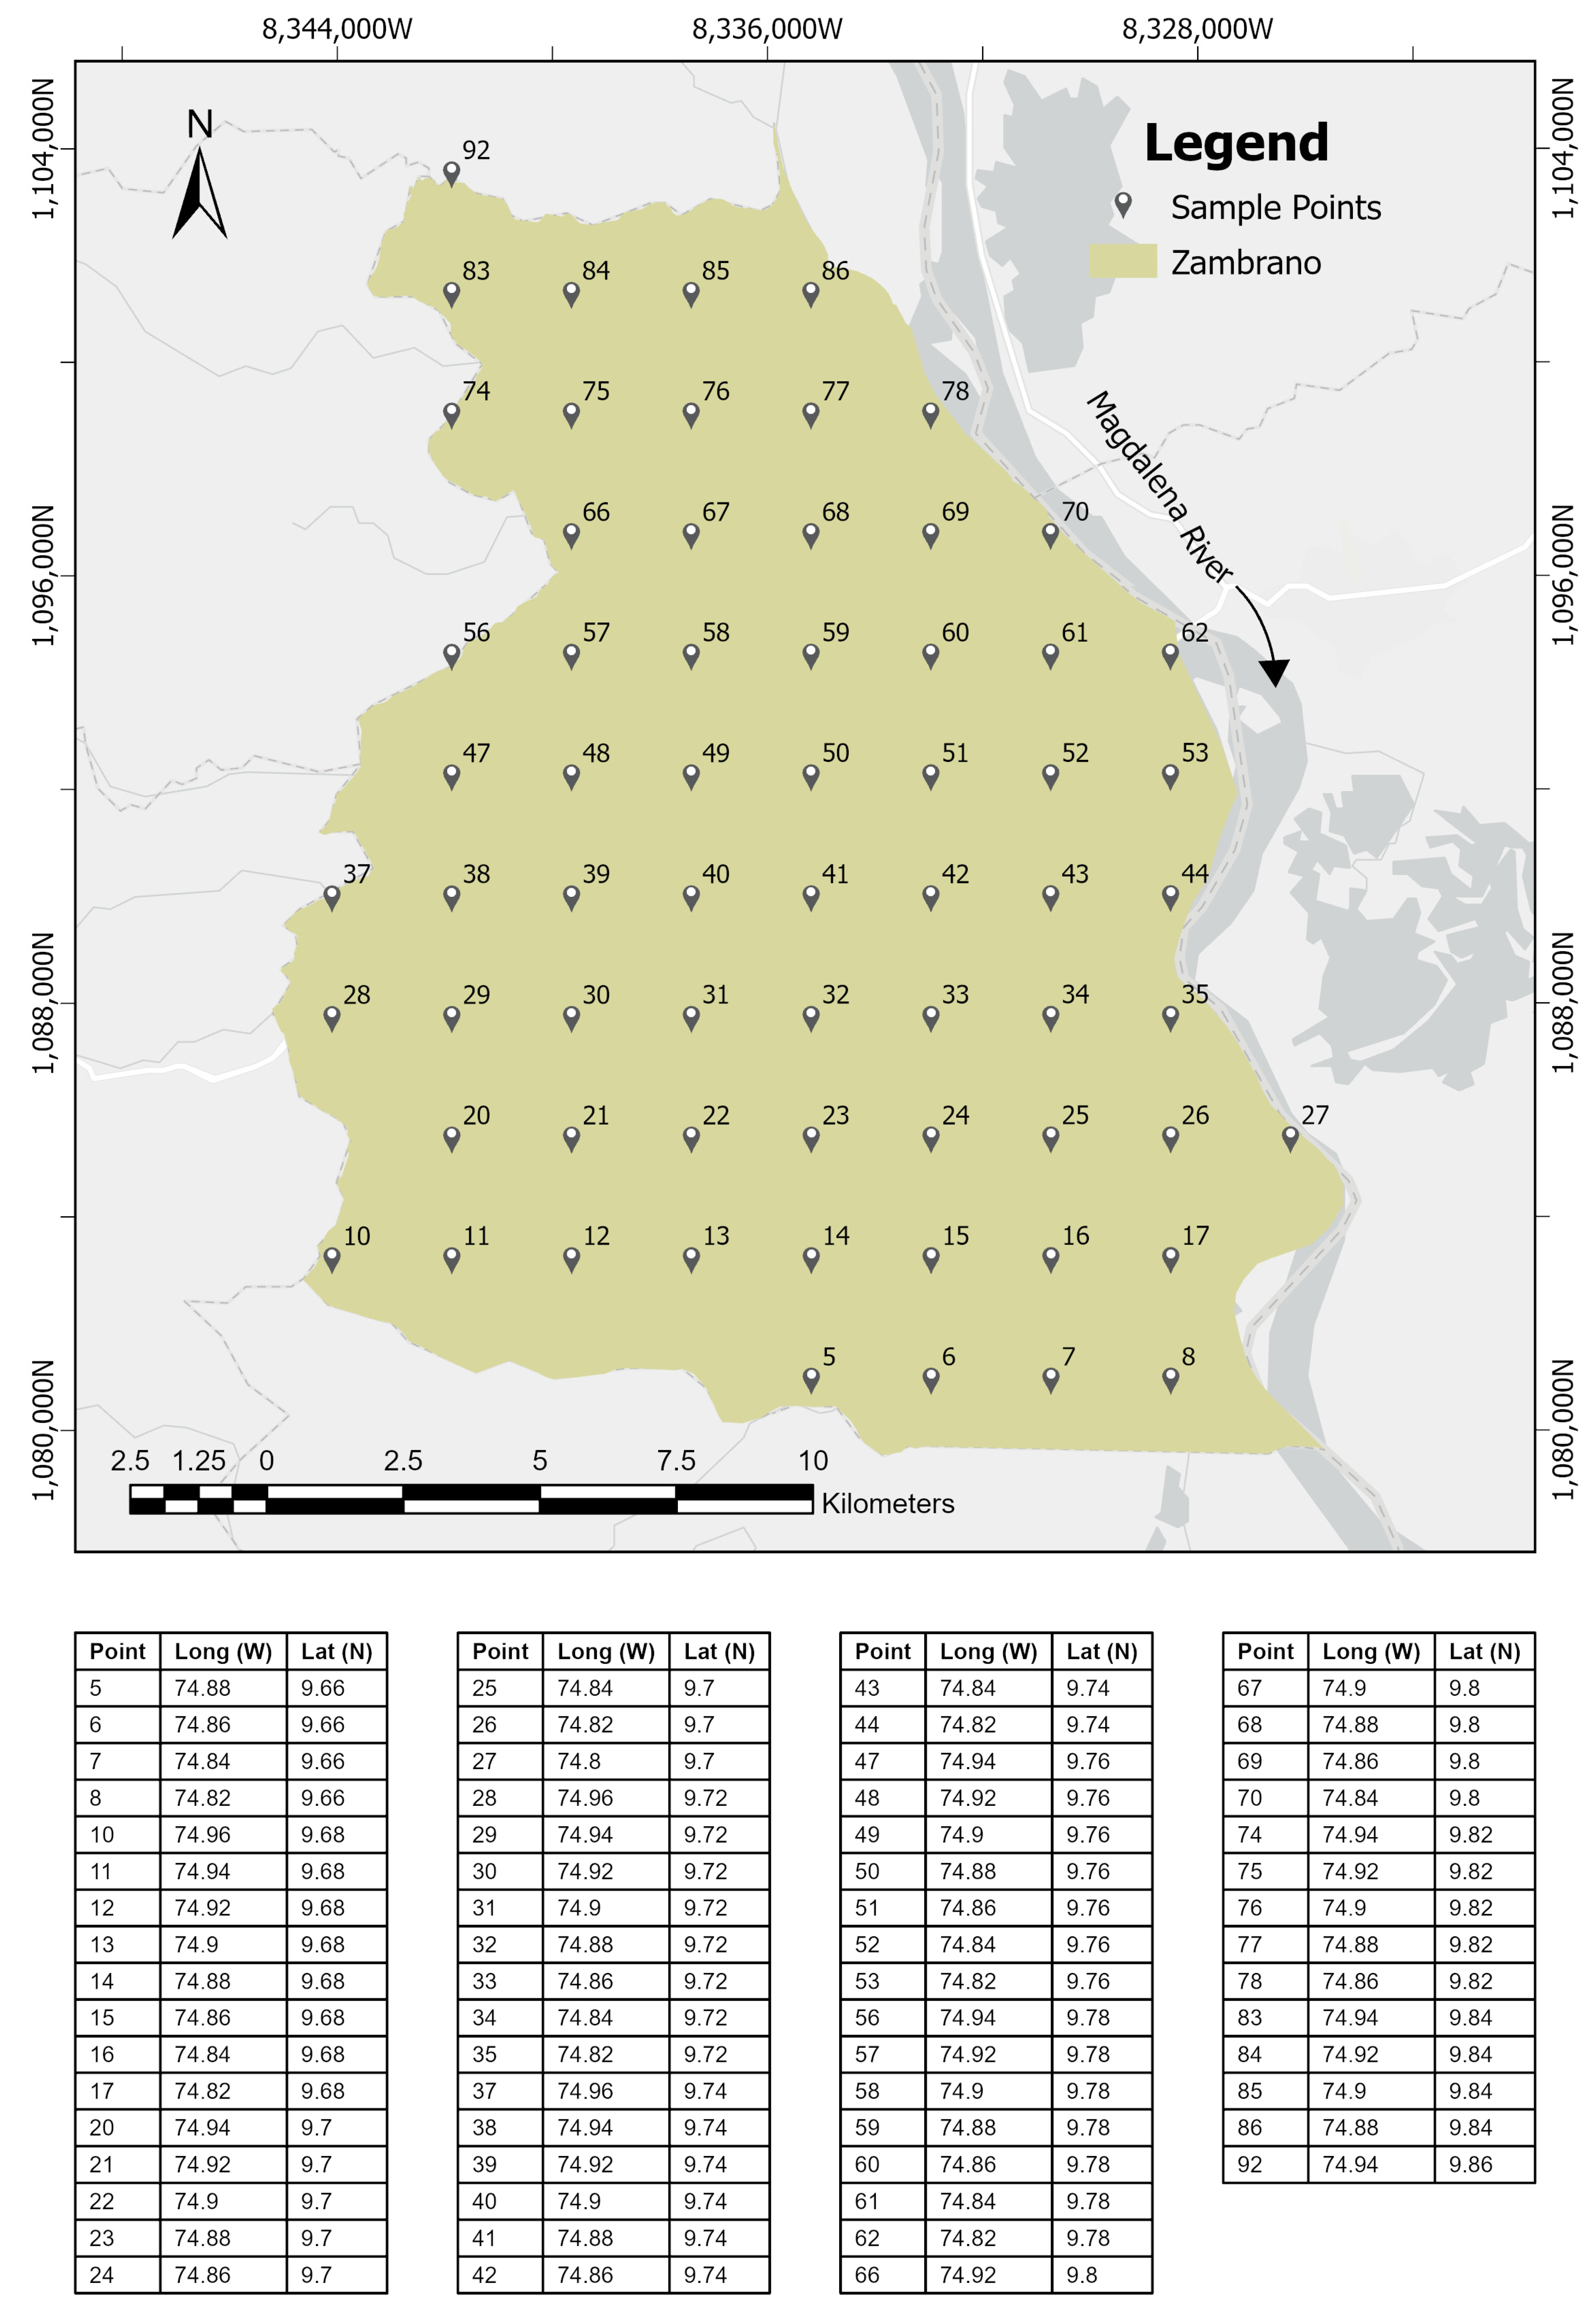
The statistical relationship between NDVI and NDWI was evaluated using Spearman’s rank correlation coefficient because the index values did not satisfy the assumption of normality according to the Shapiro–Wilk test [44]. A total of 65 spatially stratified sampling points were generated and evenly distributed across the study area. For each year–season image (1990, 1996, 2000, 2005, 2010, 2015, 2020, and 2025; dry and rainy seasons), NDVI and NDWI values were extracted at the same 65 sampling points, and an independent Spearman correlation coefficient was calculated using the 65 paired observations. Consequently, the Results section reports 16 correlation coefficients, one for each year–season combination, rather than the individual point observations. Statistical significance was established at p < 0.001. To assess whether the spatial arrangement of the sampling points could influence the independence of the observations, spatial autocorrelation was evaluated using Global Moran’s I statistic [44].
In addition to the point-based NDVI–NDWI analysis, the relationships between remotely sensed indicators and hydrometeorological variables were evaluated using the percentage area occupied by Class 4 of each spectral index. Specifically, the percentage of NDVI Class 4 (dense vegetation) was compared with mean precipitation, whereas the percentage of NDWI Class 4 (open water/high moisture) was compared with mean river discharge [8,16]. These analyses were based on 16 paired observations corresponding to the eight study years and two hydrological seasons and were conducted independently from the spatial correlation analysis described above. To account for temporal dependence within this restricted sample size, the significance of these secondary exploratory relationships was validated by computing their respective 95% confidence intervals (CIs) via asymptotic estimation.
4. Results
4.1. Spatio-Temporal Dynamics of Vegetation Cover (NDVI)
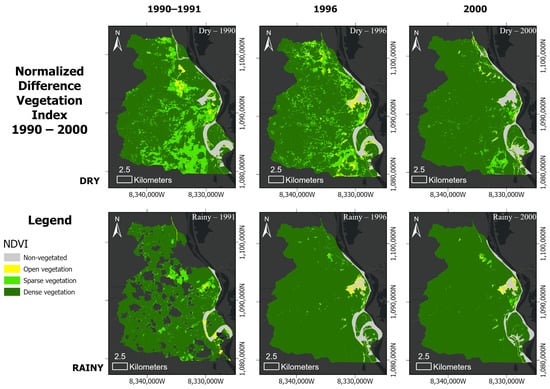
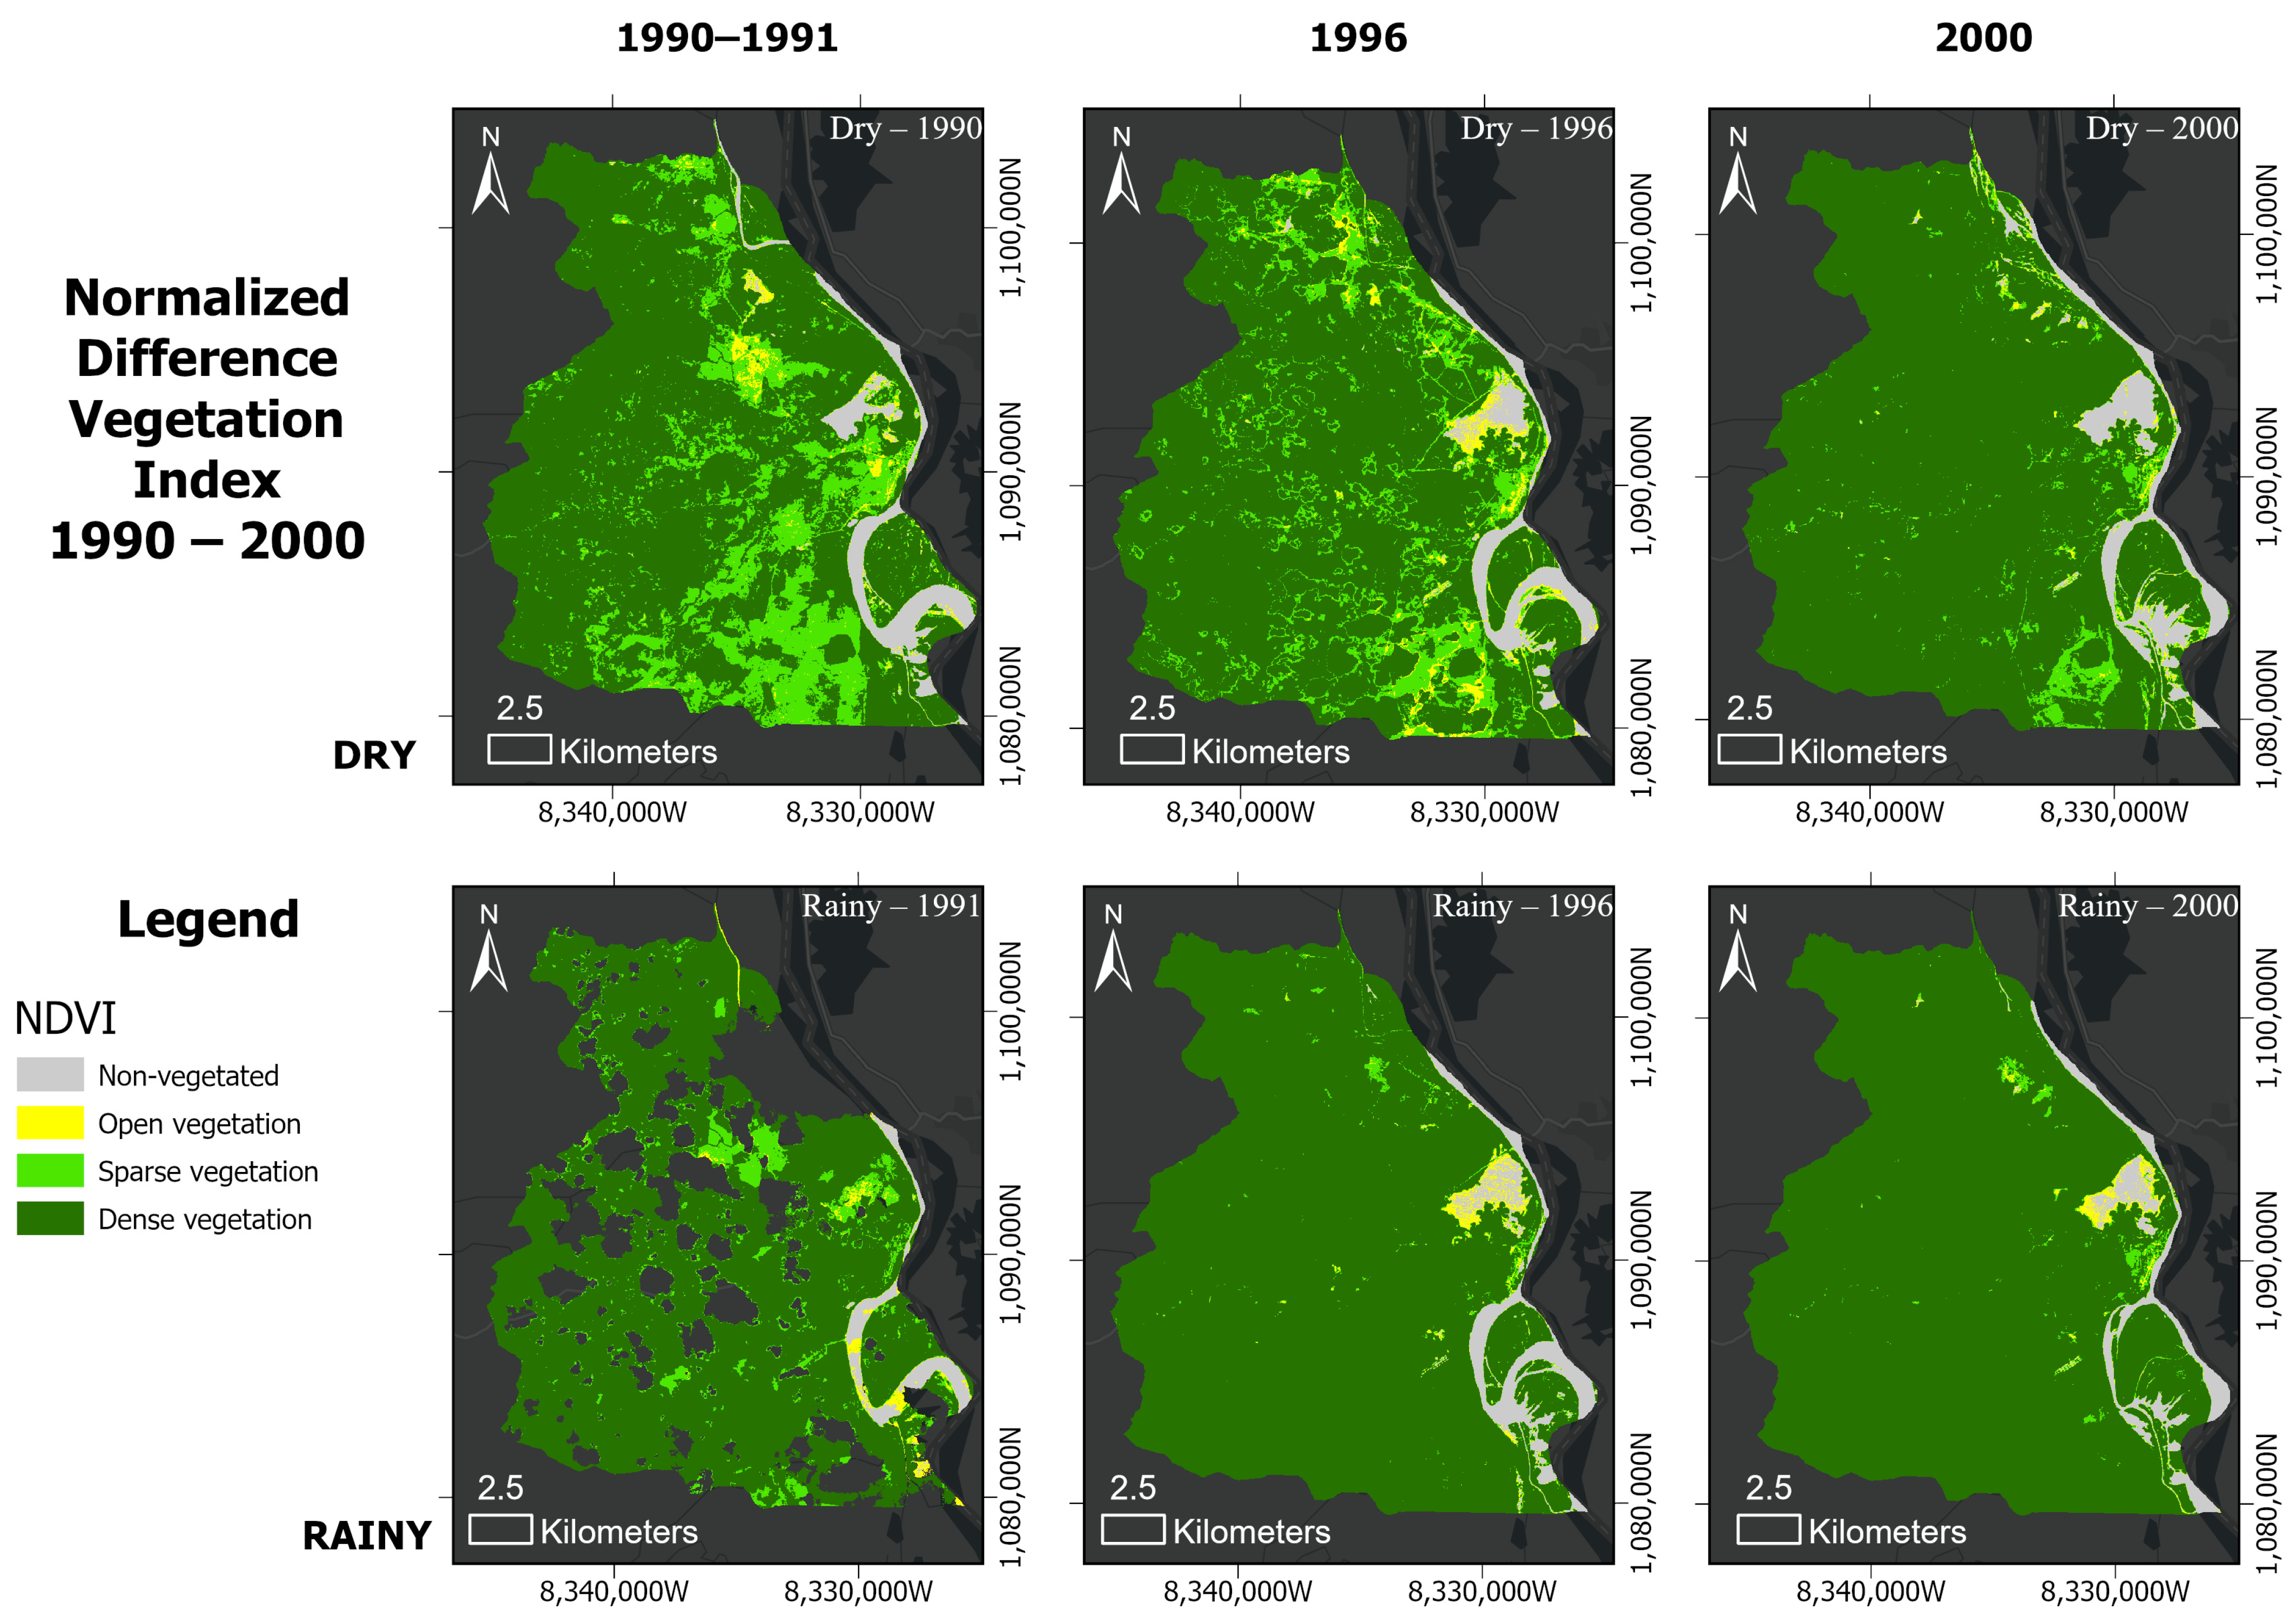
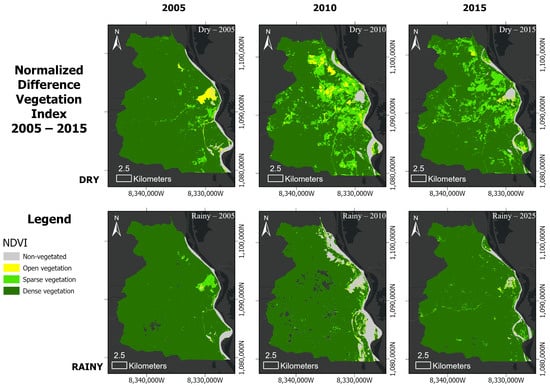
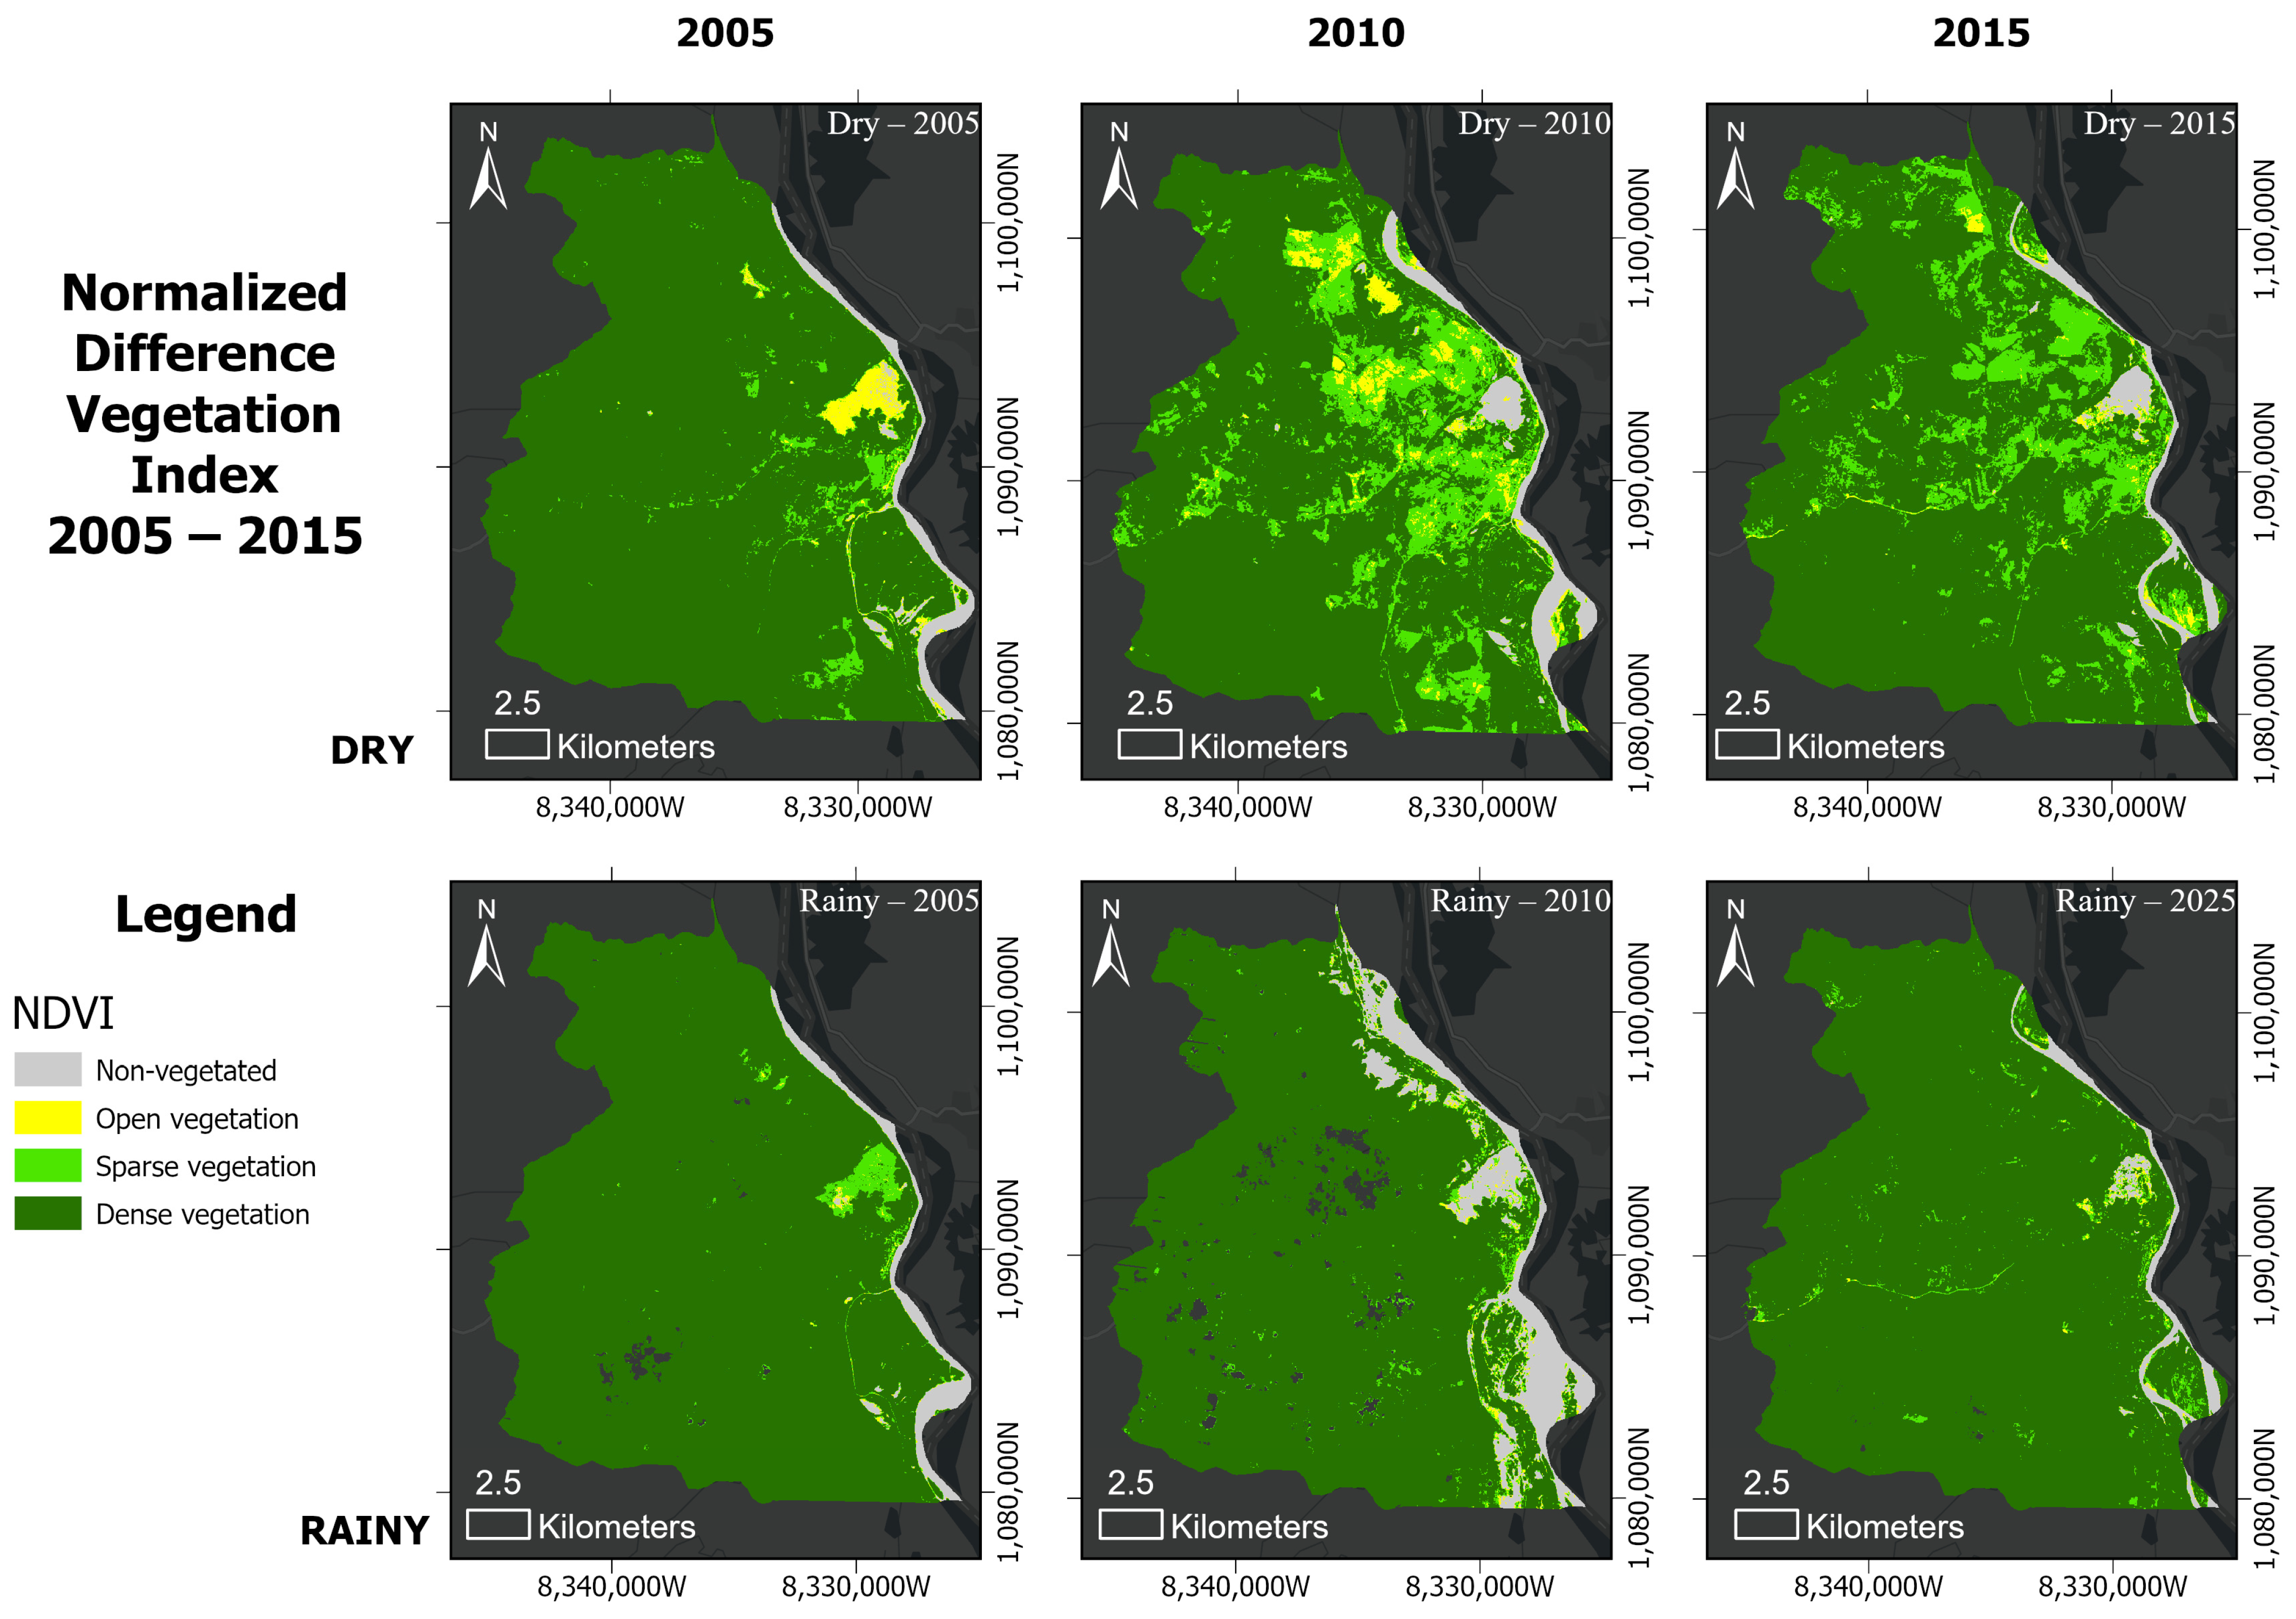
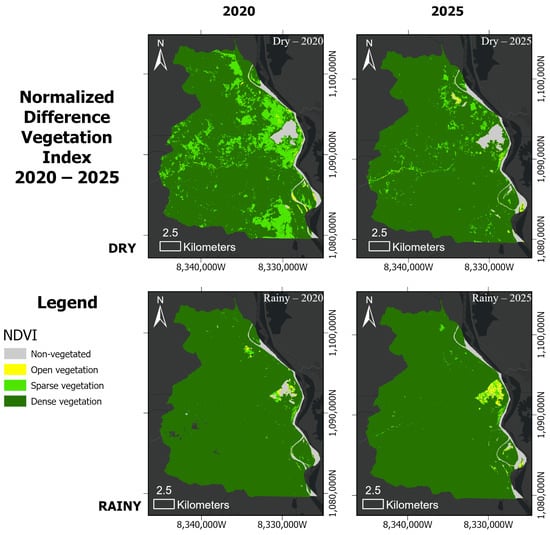
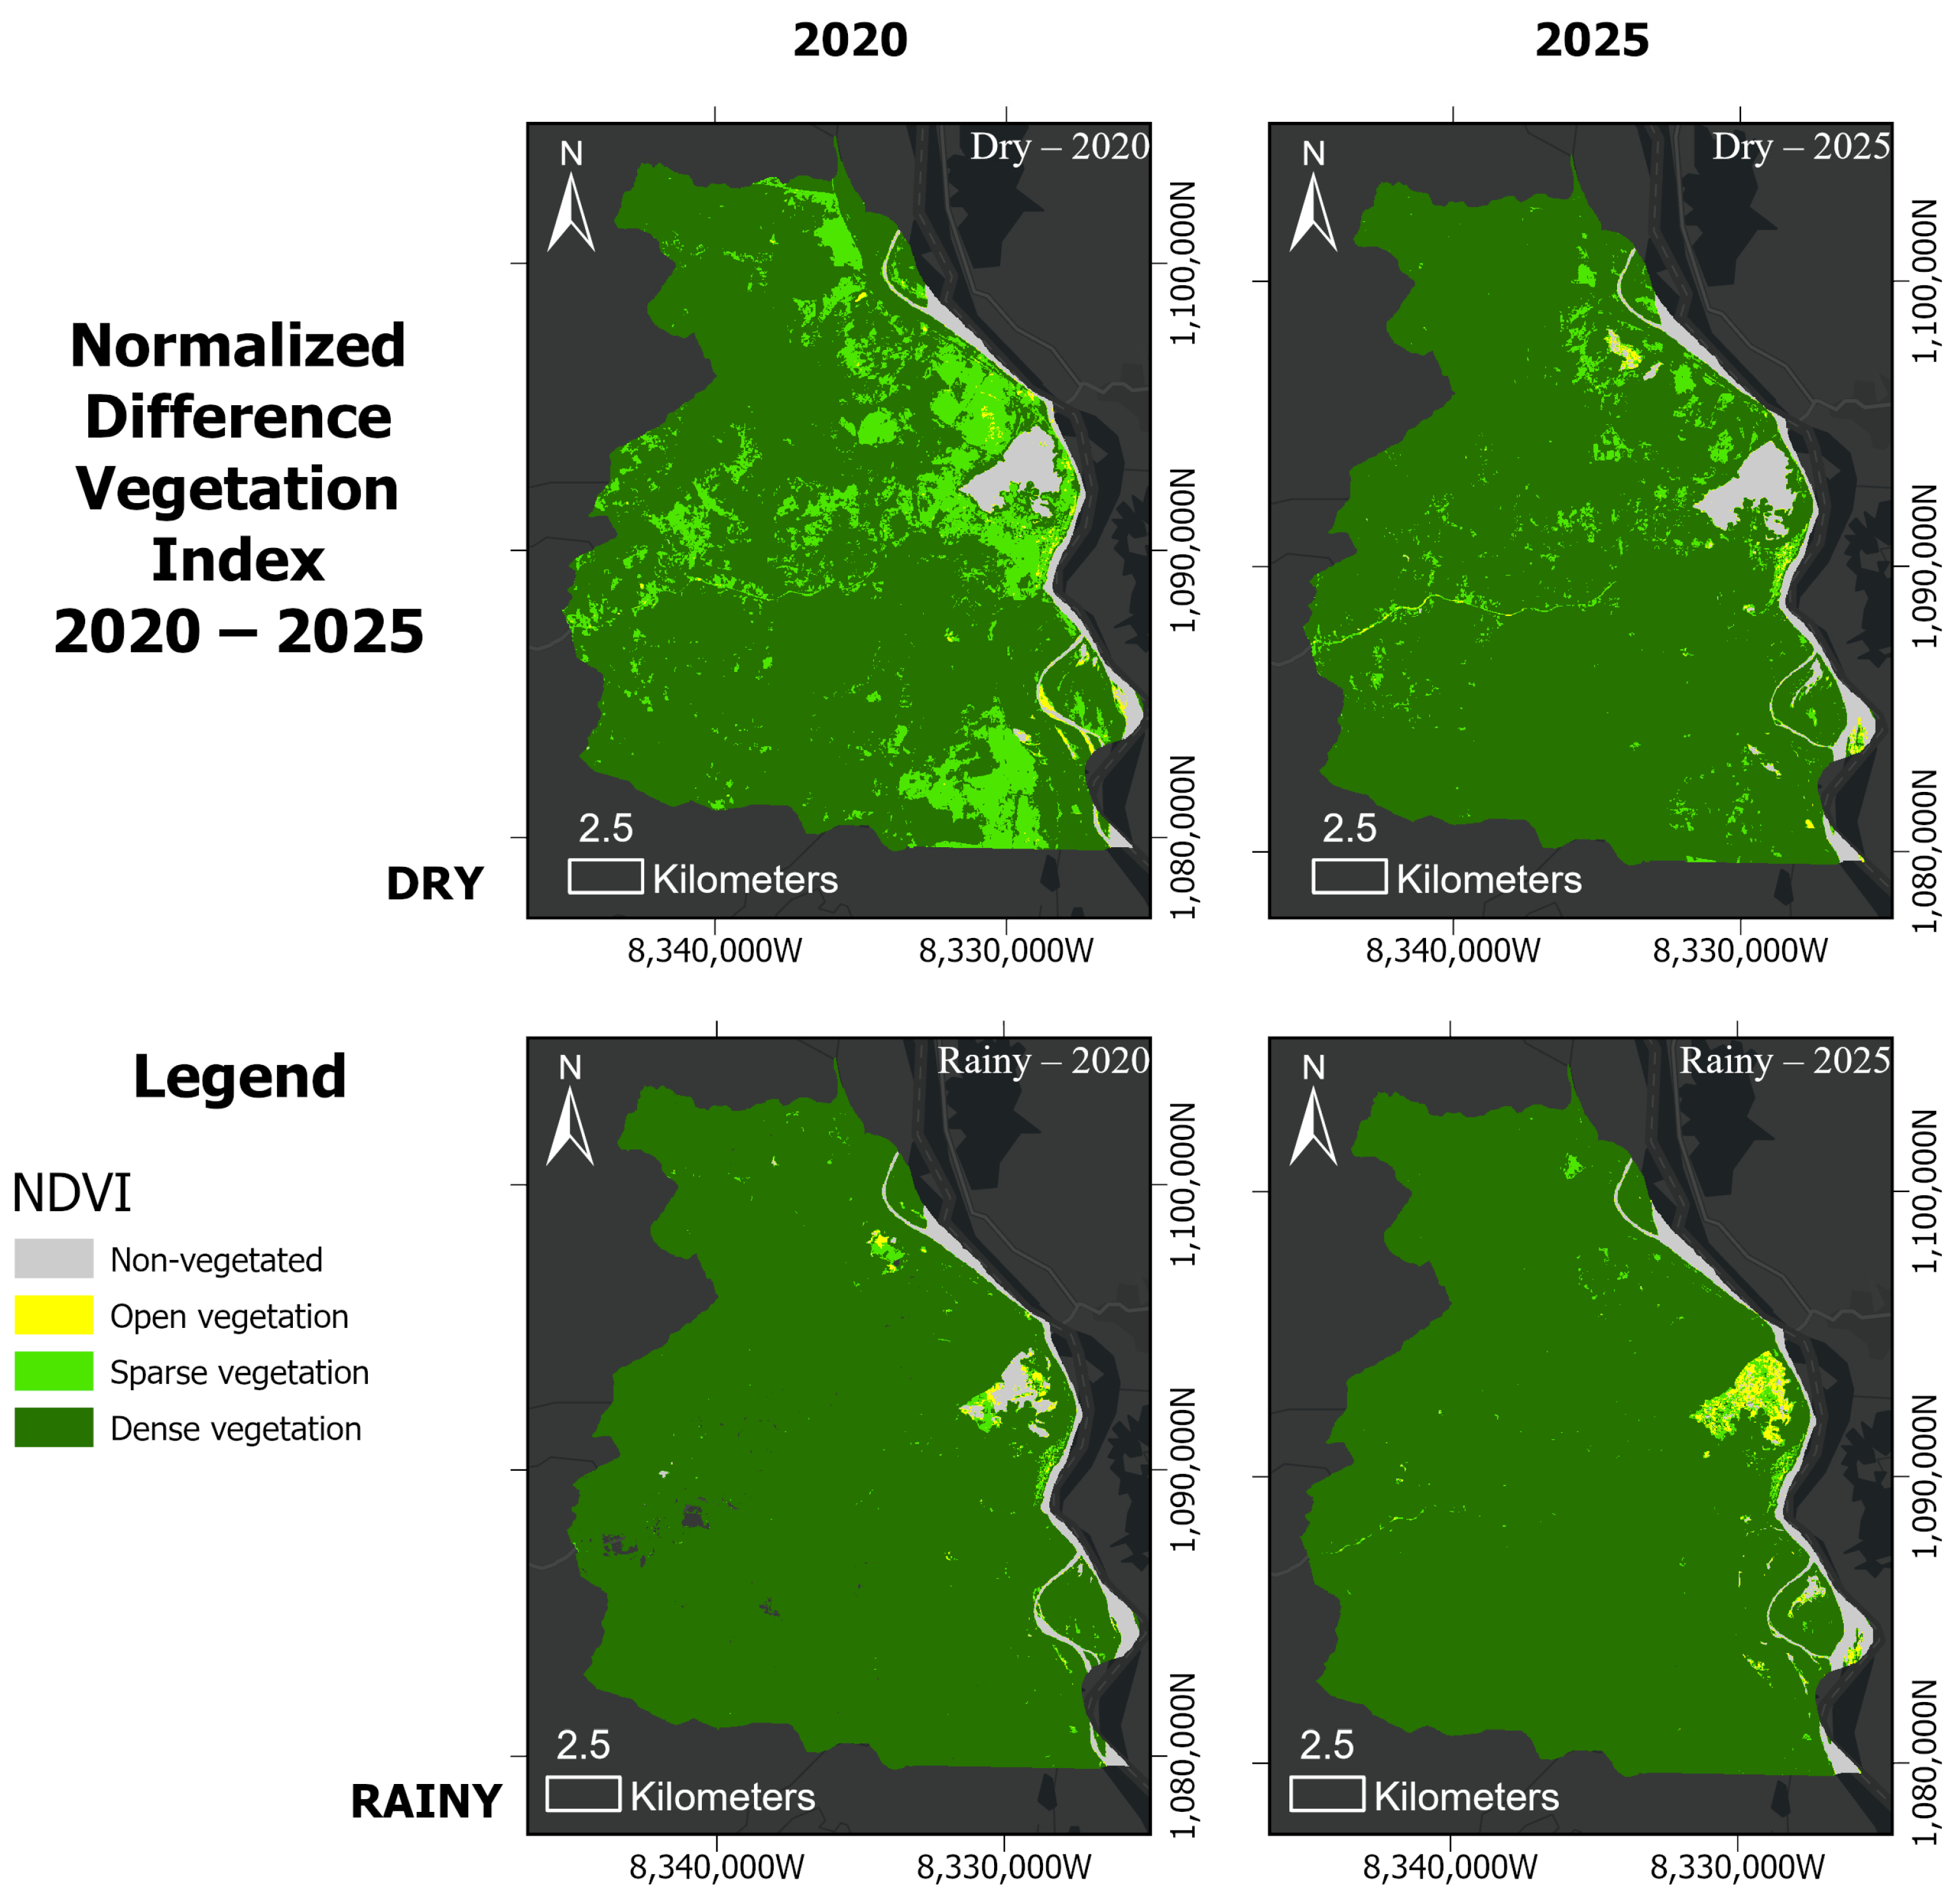
NDVI analysis across the 1990–2025 period reveals that vegetation dynamics in Zambrano are strongly modulated by hydroclimatic seasonality (Figure 3 and Figure 4). Dense vegetation (Class 4, NDVI > 0.40) consistently dominates the landscape during rainy seasons, covering between 73.8% and 95.1% of the municipality depending on the year and hydroclimatic conditions. During dry periods, the proportion of dense vegetation decreases, accompanied by an increase in open (Class 2) and sparse (Class 3) vegetation, indicating seasonal moisture stress rather than irreversible land degradation.
Figure 3.
Spatial distribution of NDVI classes during rainy and dry seasons (1990–2000).
Figure 4.
Spatial distribution of NDVI classes during rainy and dry seasons (2005–2015).
The spatial distribution of NDVI classes shows a predominantly green landscape during rainy seasons, with dense vegetation dominating across all land-use types, including agropastoral zones and areas adjacent to wetland bodies. During dry seasons, open and sparse vegetation classes expand across the central and southern portions of the municipality, particularly in agropastoral areas with limited irrigation infrastructure. Non-vegetated areas (Class 1, NDVI < 0.15) remain consistently low throughout the study period, rarely exceeding 1% of the total area, except during the 2010 La Niña event.
Interannual variability in NDVI is superimposed on the seasonal signal, with notable deviations occurring during extreme hydroclimatic events. The 2010 rainy season registered the highest proportion of non-vegetated surfaces (Class 1:6%), consistent with documented widespread flooding that inundated agricultural and lowland areas, temporarily replacing vegetated cover with standing water. To decouple this spectral class from potential bare soil exposure, this anomaly was cross-referenced with NDWI Class 4 data, which simultaneously reached its historical maximum coverage of 7.1%, confirming that the canopy drop was driven by surface water submergence rather than mechanical soil denudation. In contrast, the 2015 dry season exhibited an expansion of sparse and open vegetation classes, reflecting vegetation stress during the ENSO-associated drought. More recent years (2020–2025) show a recovery trend, with dense vegetation exceeding 91.4% during dry periods and 95% during rainy seasons in 2025 (Table 3 and Table 4 and Figure 5).
Table 3.
Seasonal distribution of NDVI classes and corresponding monthly mean precipitation (P) in Zambrano (1990–2025) during dry and rainy periods.
Table 4.
Spatio-temporal distribution of NDWI classes and corresponding historical monthly mean river discharge (Q) of the Magdalena River (1990–2025) across contrasting hydroclimatic seasons.
Figure 5.
Temporal trends in NDVI class distribution during dry and rainy seasons (2020–2025).
These variations in the NDVI classes correspond with changes in the recorded monthly mean precipitation data (Table 3). During the dry seasons, precipitation remains consistently low, averaging below 42.0 mm, with the lowest values observed in 1990 (30.6 mm), 2015 (32.5 mm), and 2025 (36.3 mm). In contrast, the rainy seasons exhibit increased meteorological inputs, with precipitation exceeding 100.0 mm in most of the analyzed years. The highest precipitation values are concentrated in the rainy seasons of 2000 (152.5 mm), 2010 (167.3 mm), and 2020 (177.4 mm). Conversely, the lowest precipitation recorded during a rainy season occurred in 2015, at 89.6 mm.
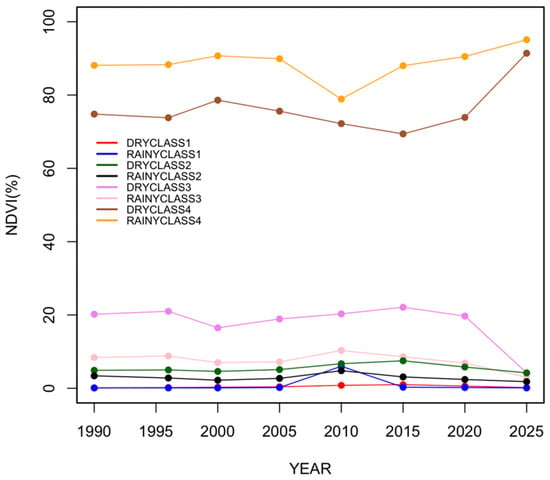
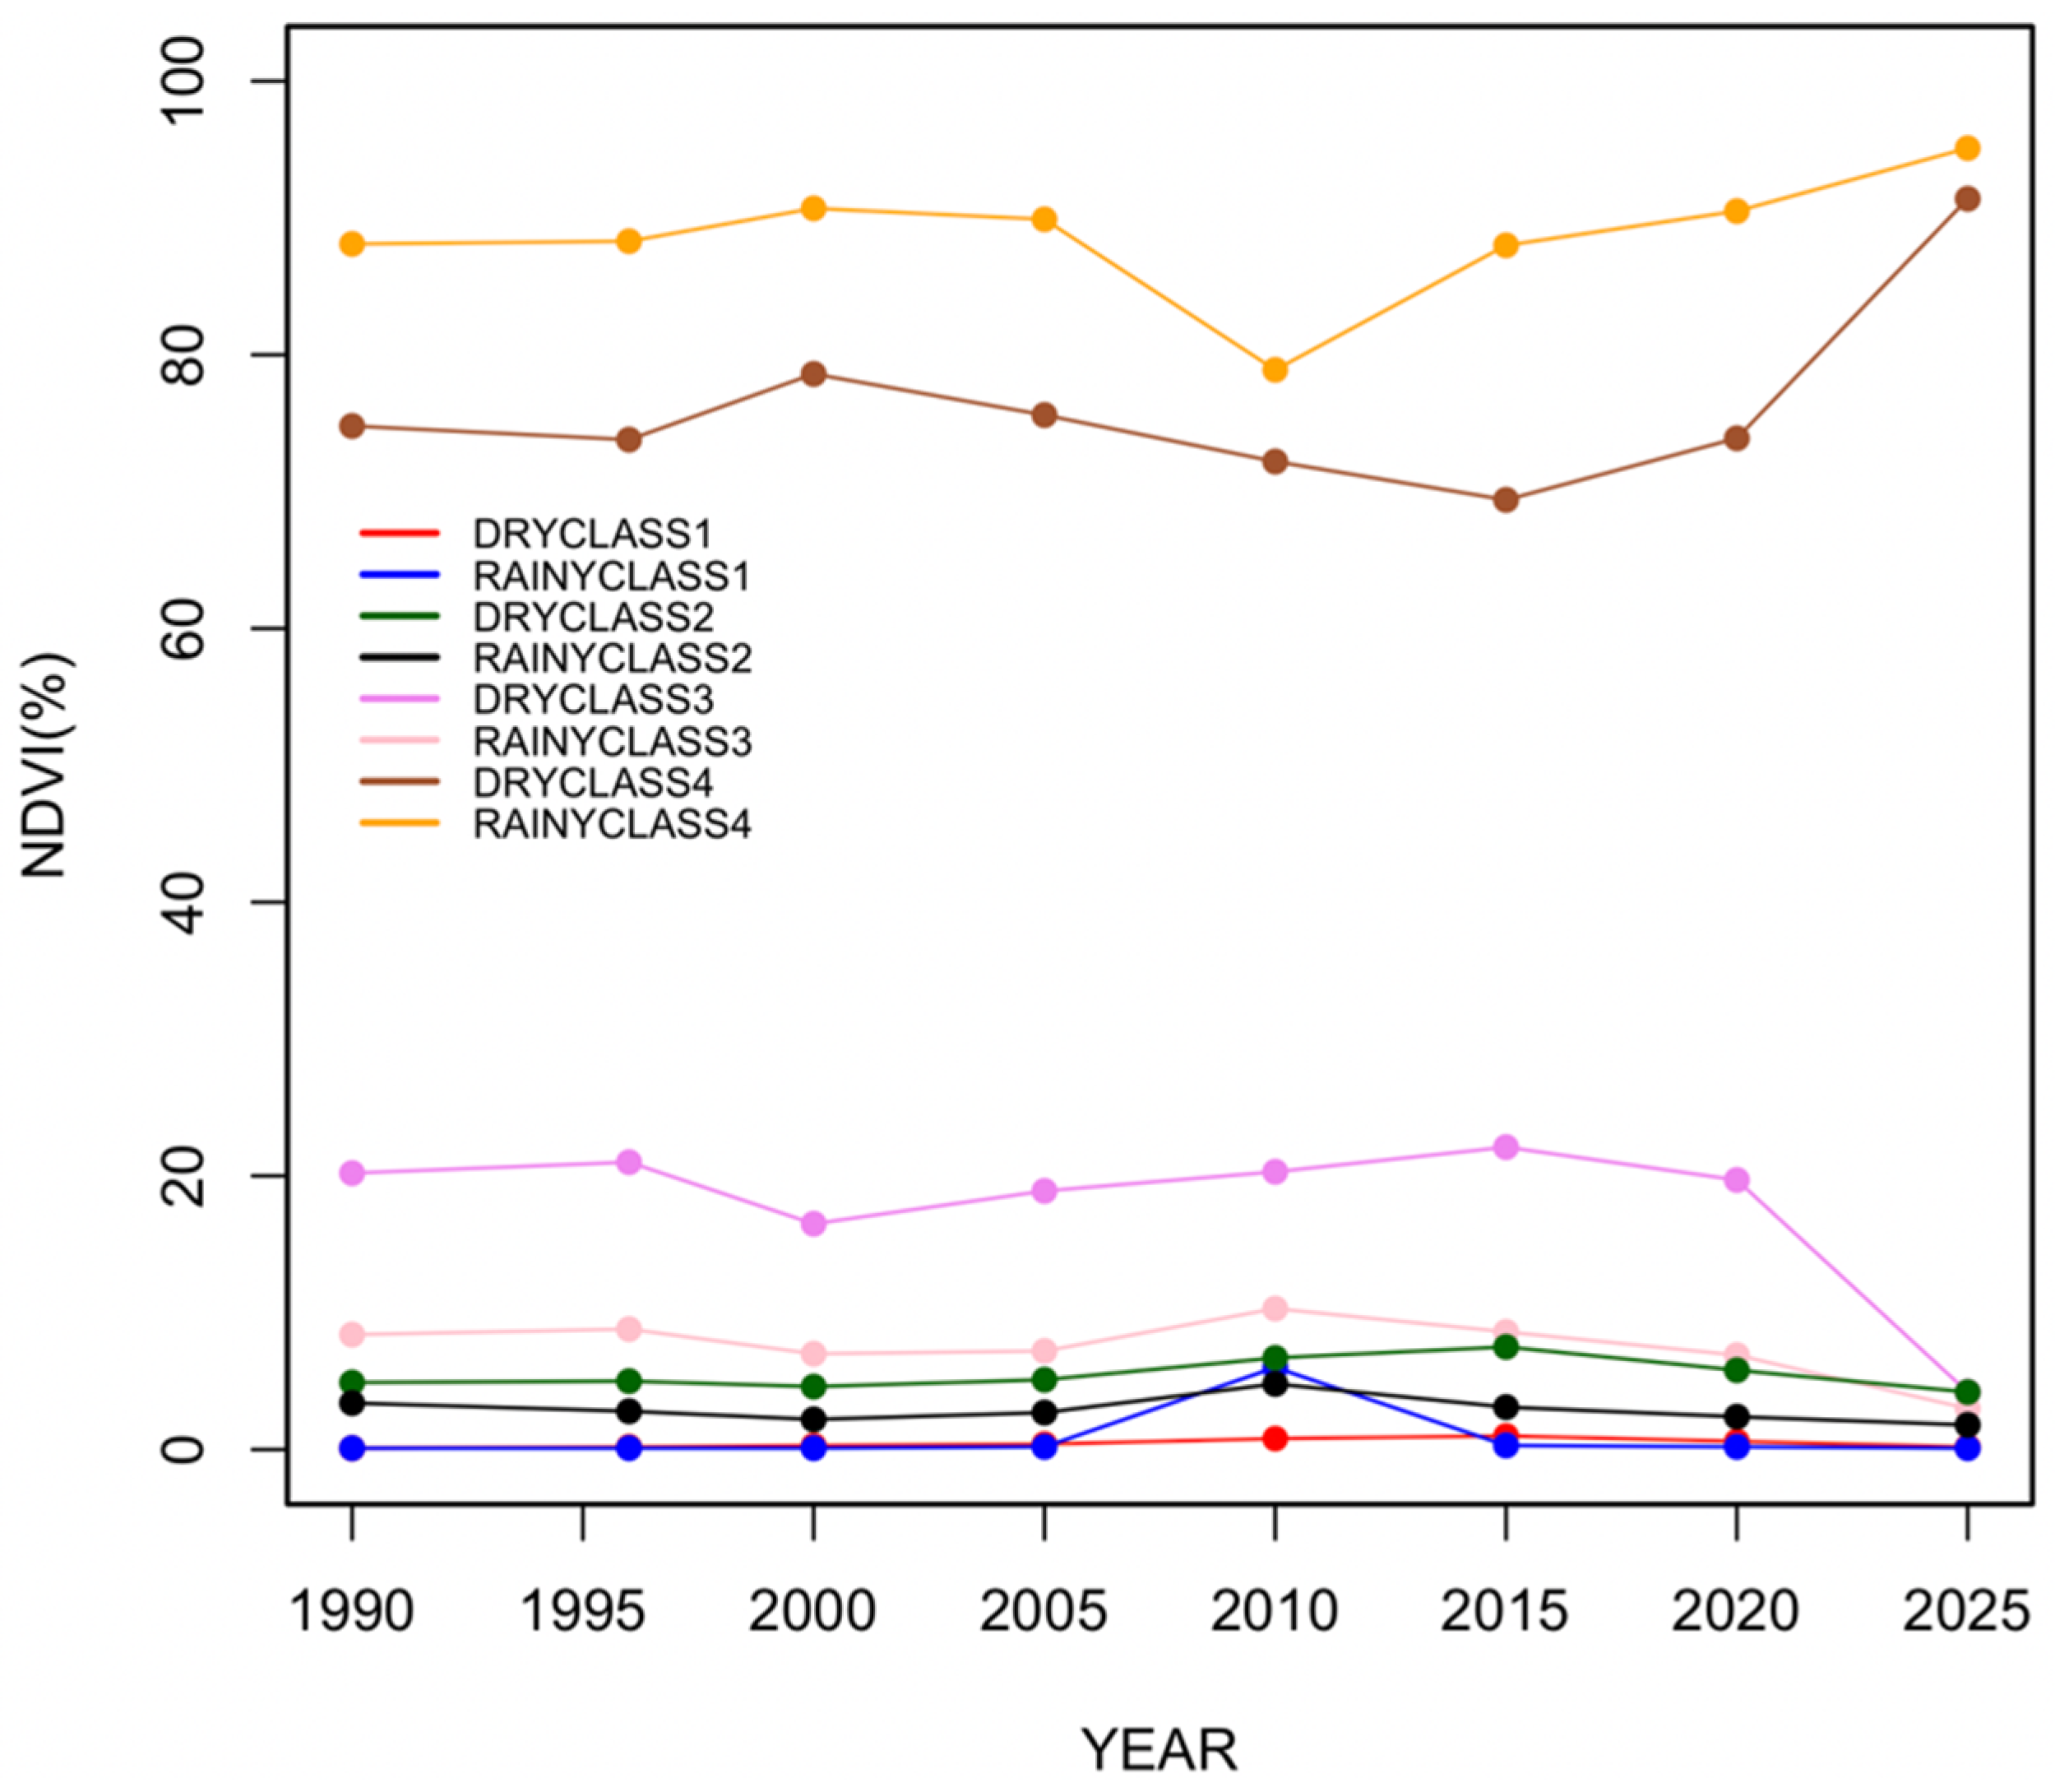
This seasonal and interannual partitioning of vegetation cover is quantitatively summarized in Figure 6, which highlights the historical trajectories of each NDVI class’s percentage. The time-series curves clearly show that Class 4 (dense vegetation) consistently dominates the landscape matrix throughout the 35-year baseline. However, the graph successfully isolates the localized shocks induced by macroclimatic anomalies: a prominent drop in wet-season dense canopy during the 2010 La Niña flood event—complemented by a transient spike in non-vegetated surfaces—and a corresponding decline in dry-season baseline greenness during the 2015 El Niño drought. The clear convergence toward maximum coverage values by 2025 visually establishes the structural stability and recovery capacity of the floodplain ecosystem following multi-decadal climatic cycles.
Figure 6.
Spatio-temporal dynamics of NDVI class area distribution (%) in Zambrano, Colombia, across the 1990–2025 baseline.
4.2. Surface Water Dynamics and Hydrological Variability (NDWI)
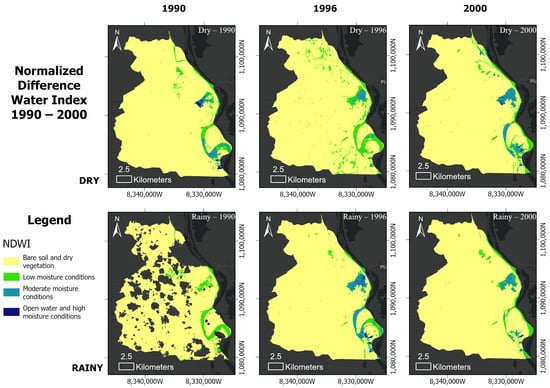
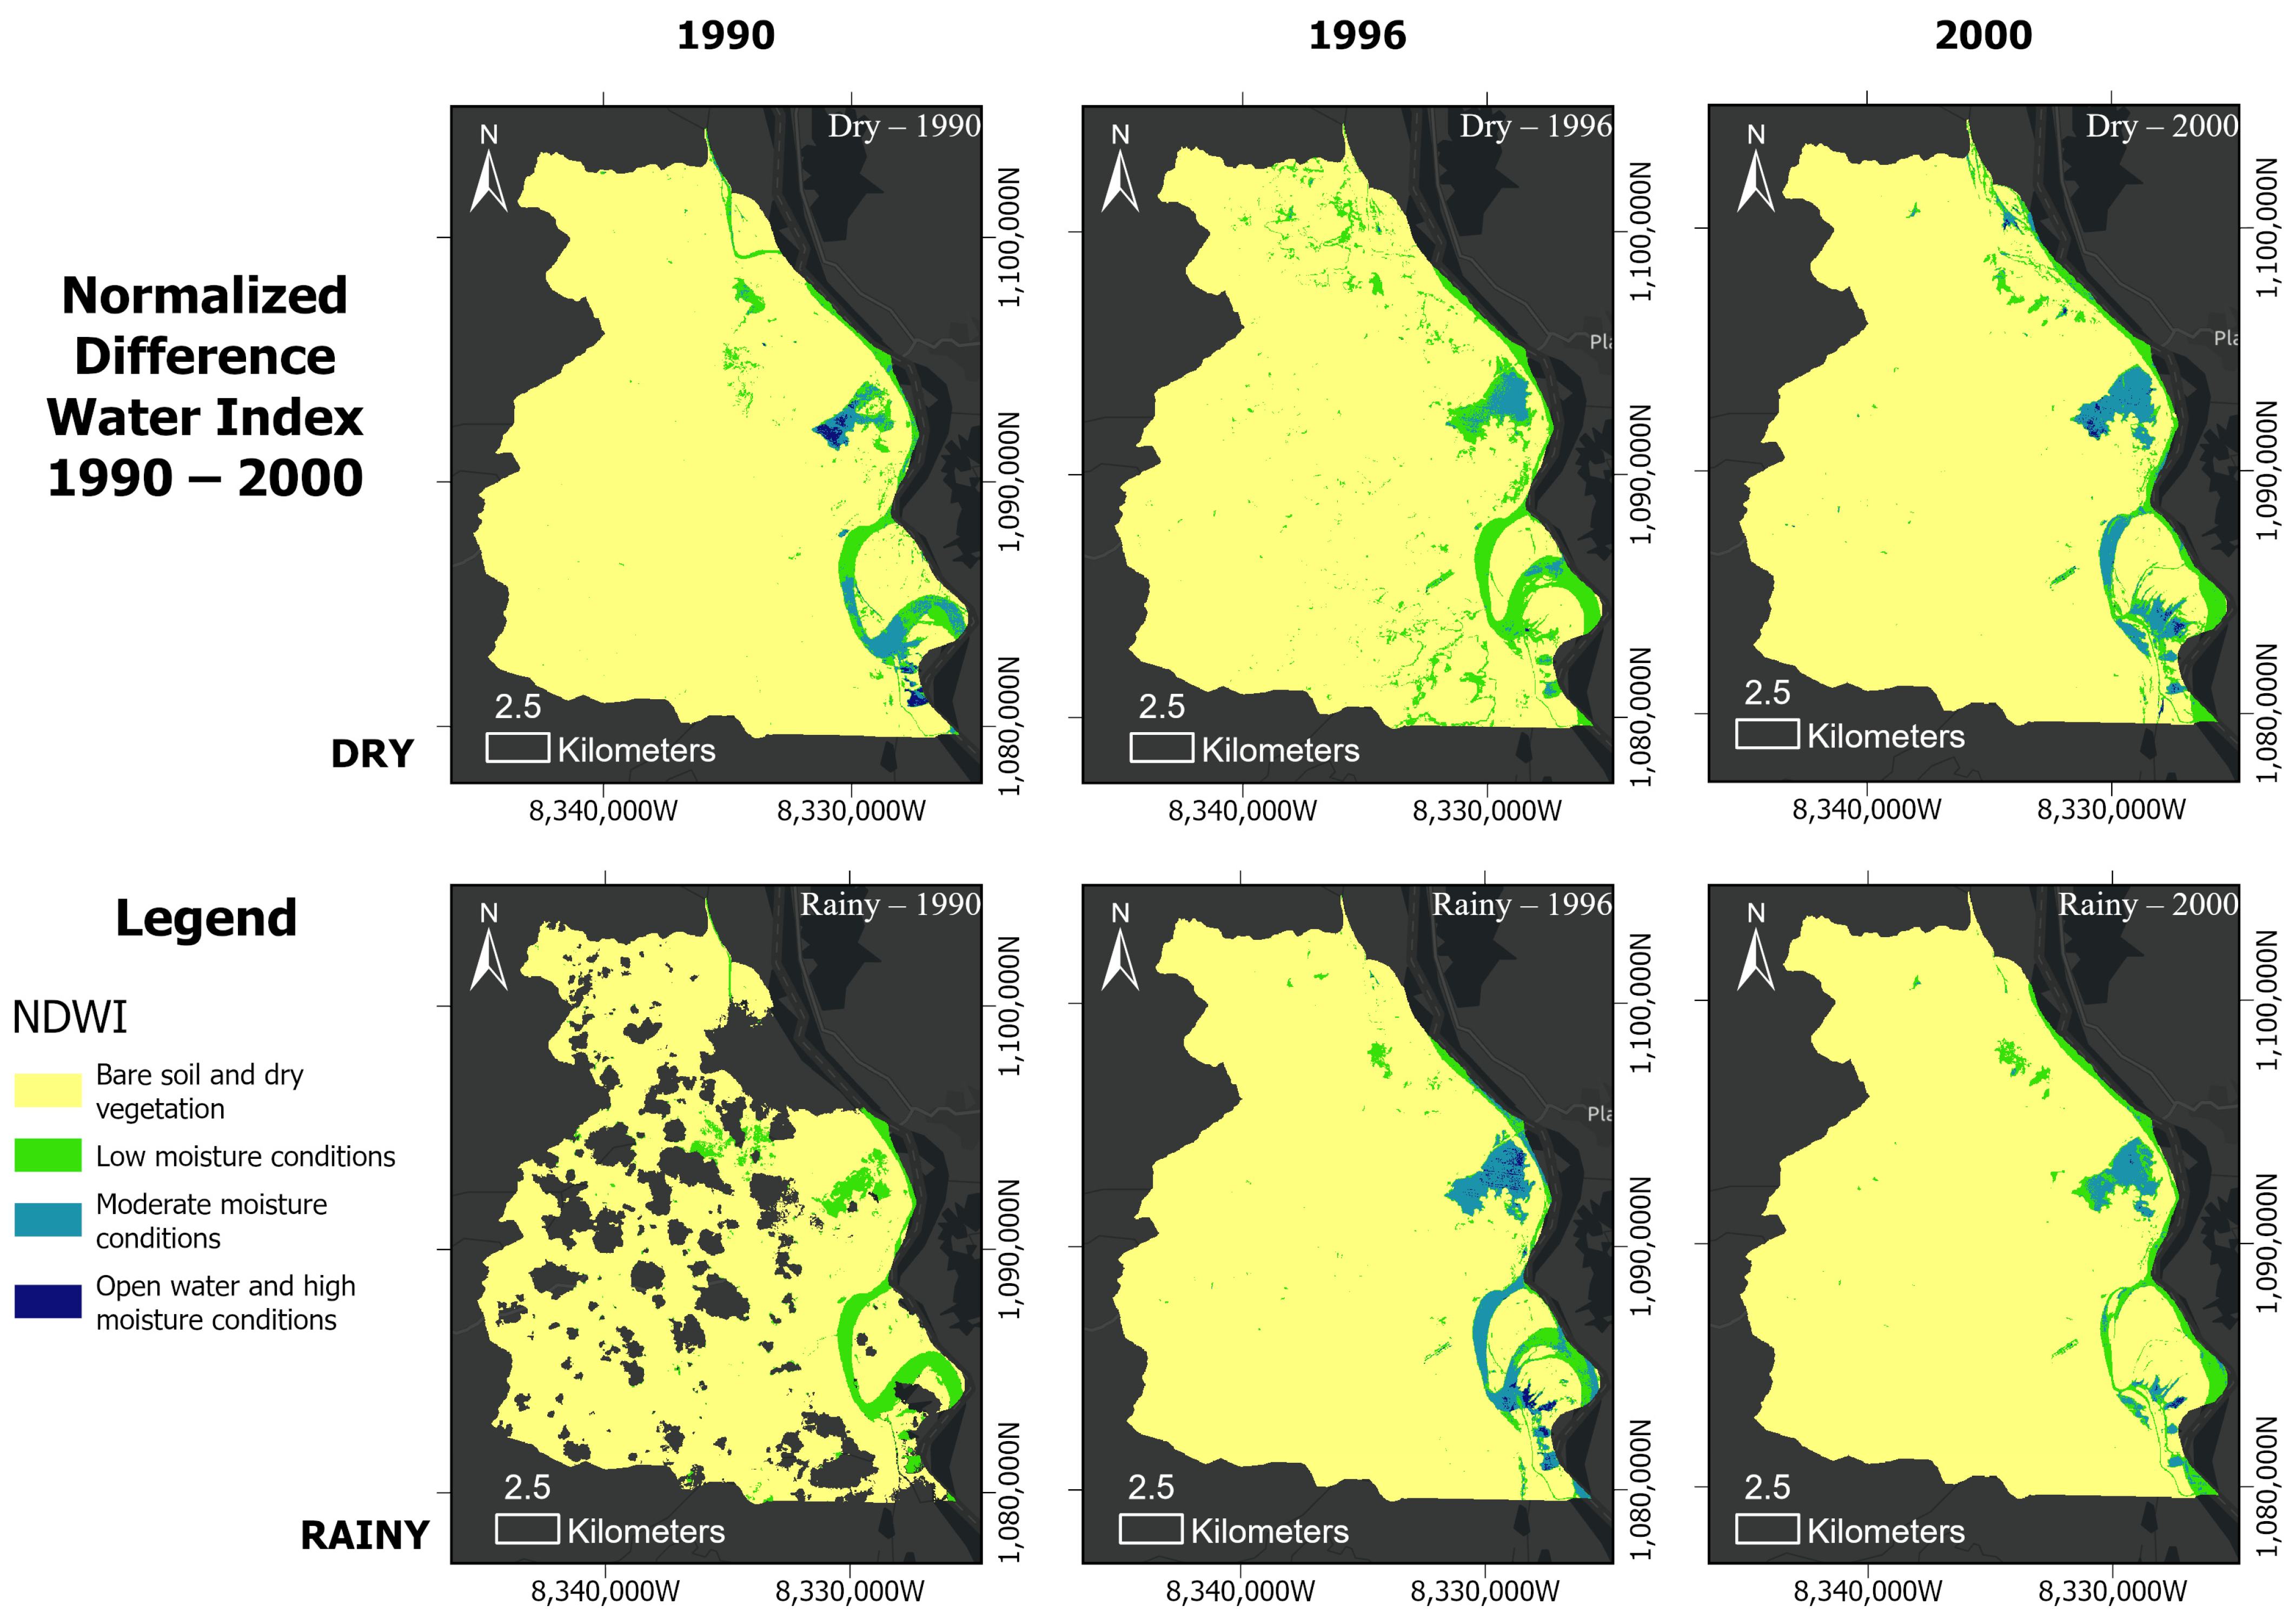
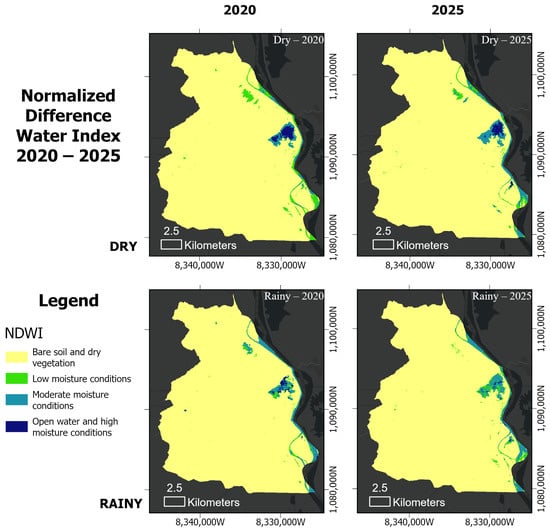
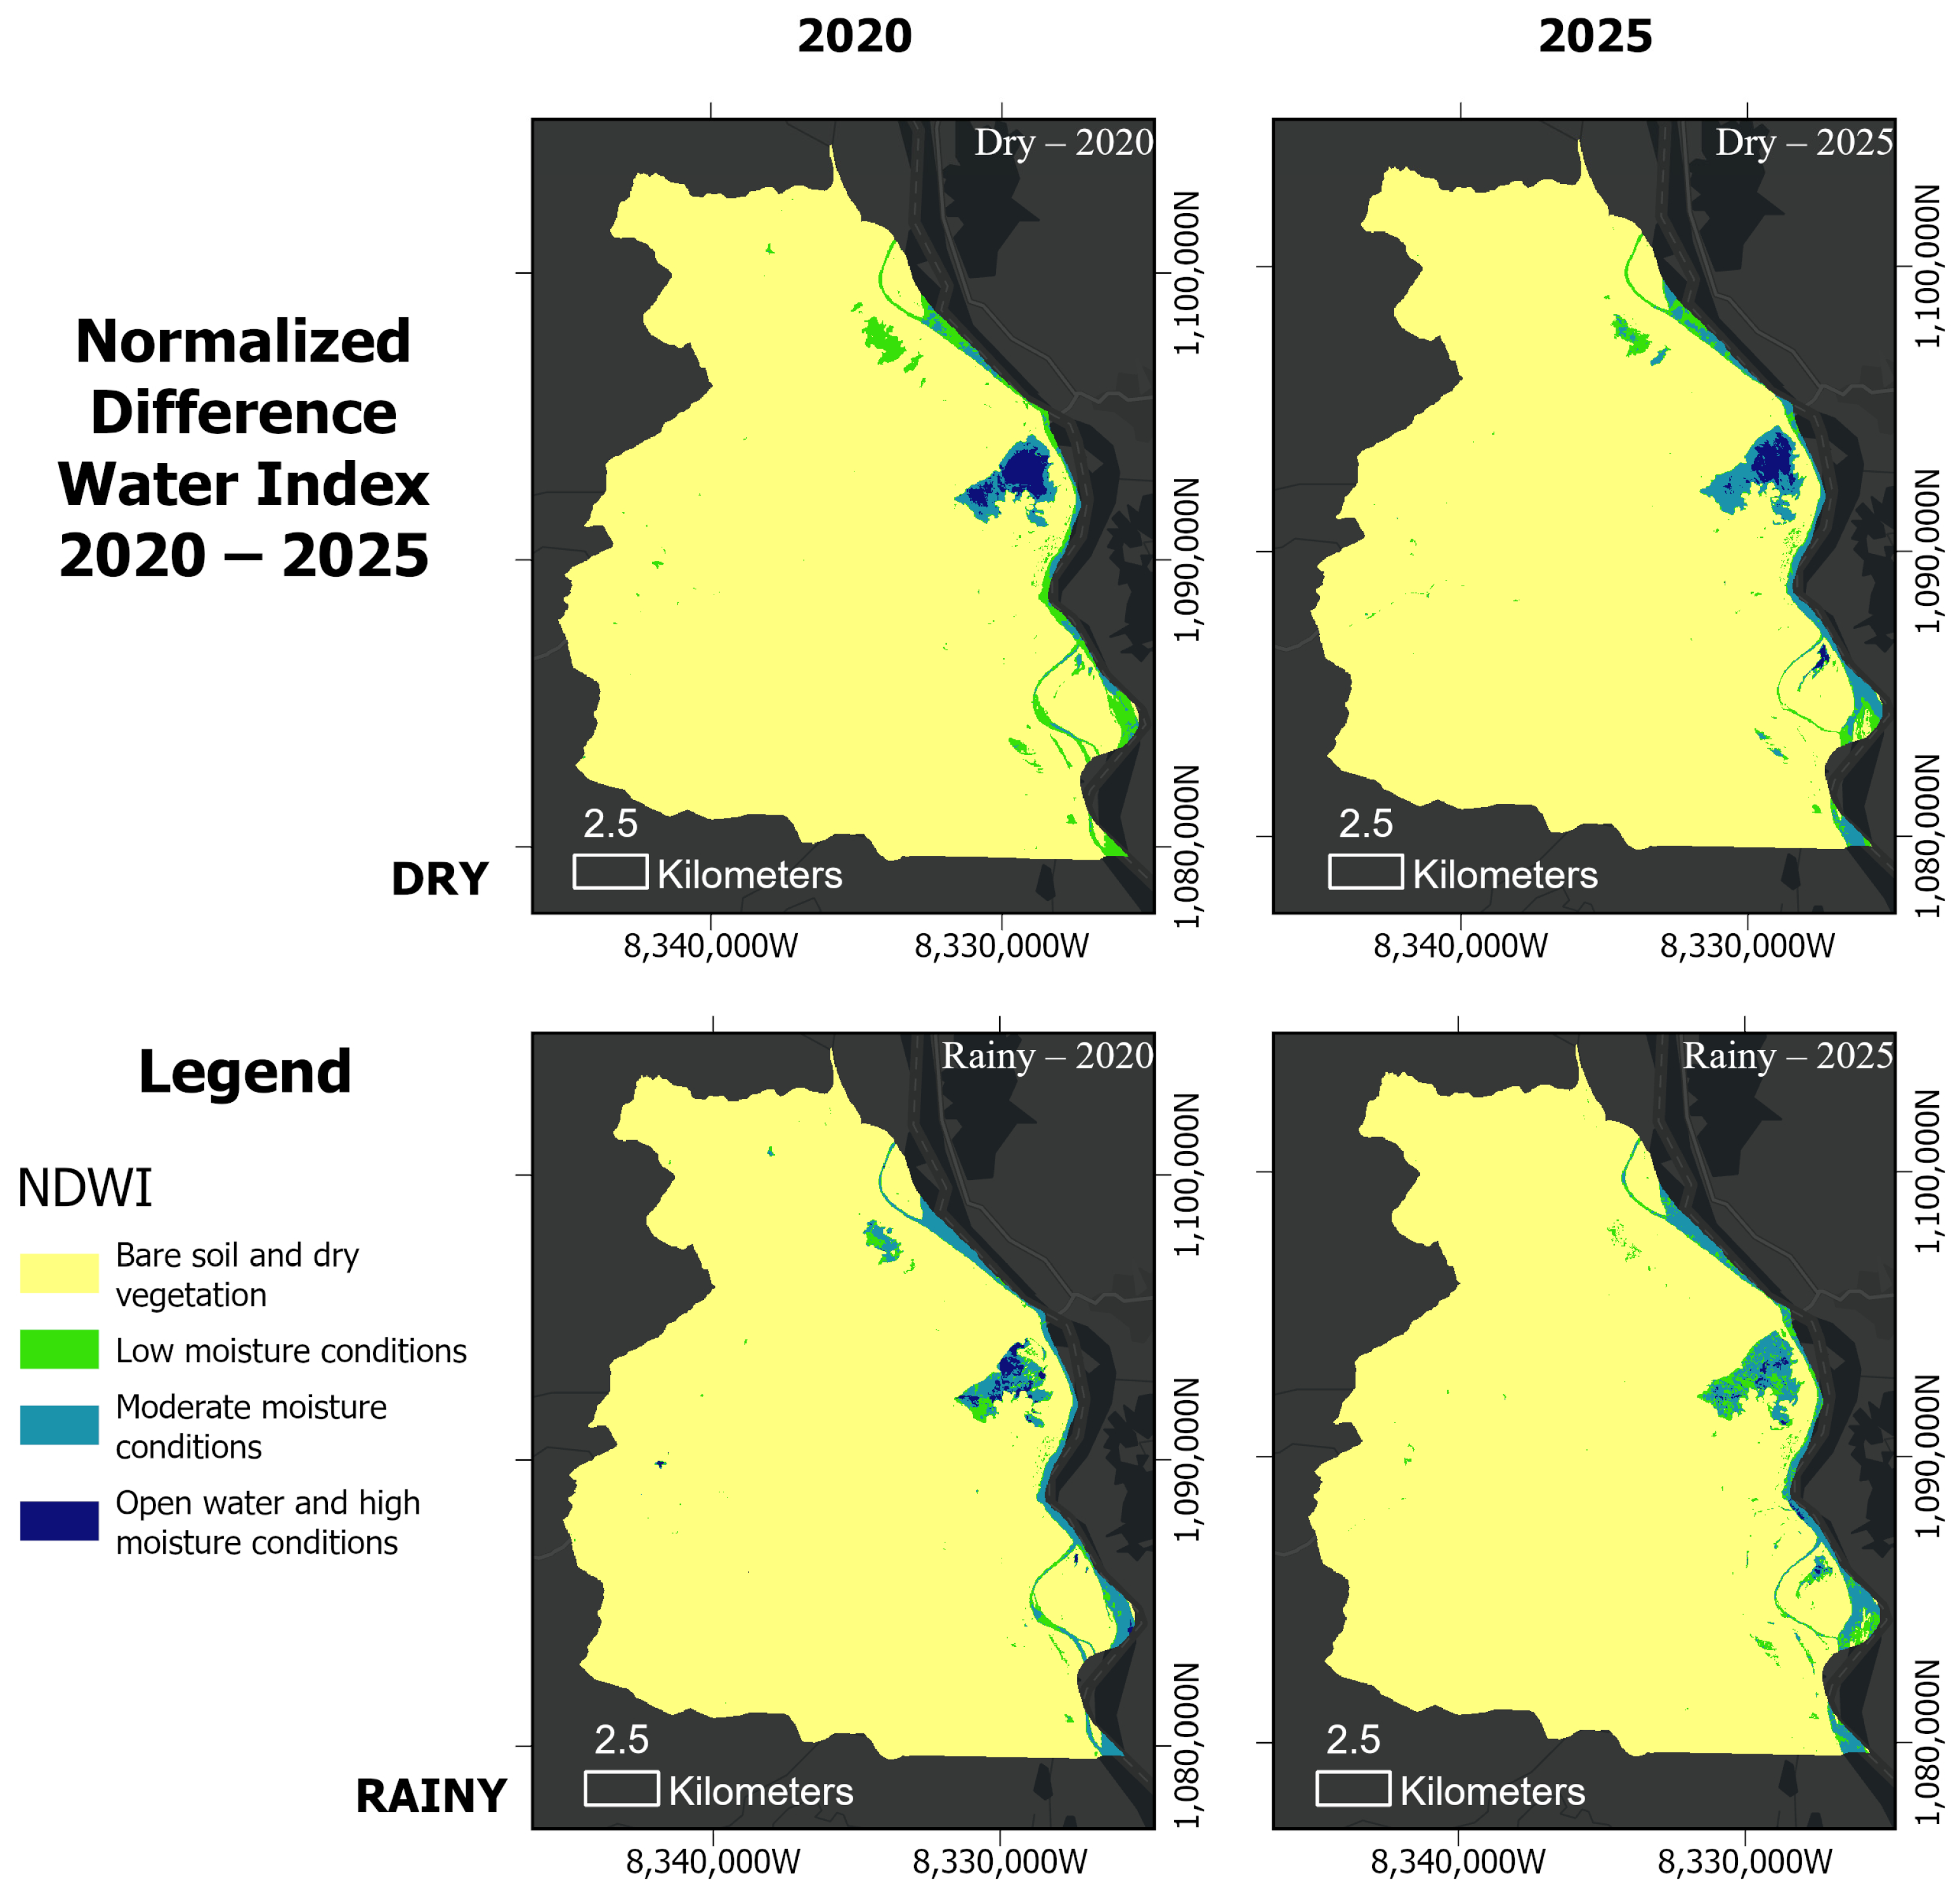
Open water and high-moisture areas (Class 4, NDWI > 0.20) are predominantly confined to the eastern sector of the municipality, where they are associated with the main Magdalena River channel and adjacent marshland (Figure 7). Seasonal activation of these areas is evident during rainy periods, when Class 4 coverage expands slightly in response to river discharge increases and lateral flooding of floodplain depressions.
Figure 7.
Temporal trends in NDWI class distribution during dry and rainy seasons (1990–2000).
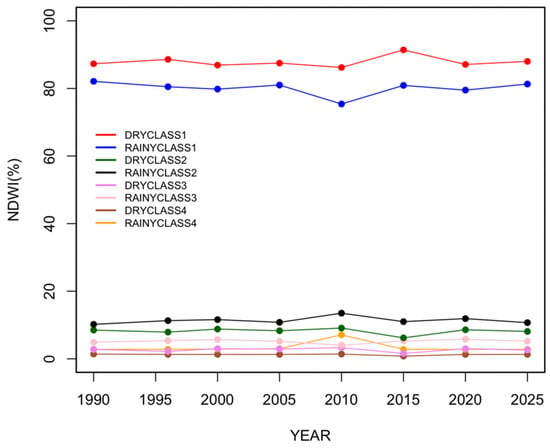
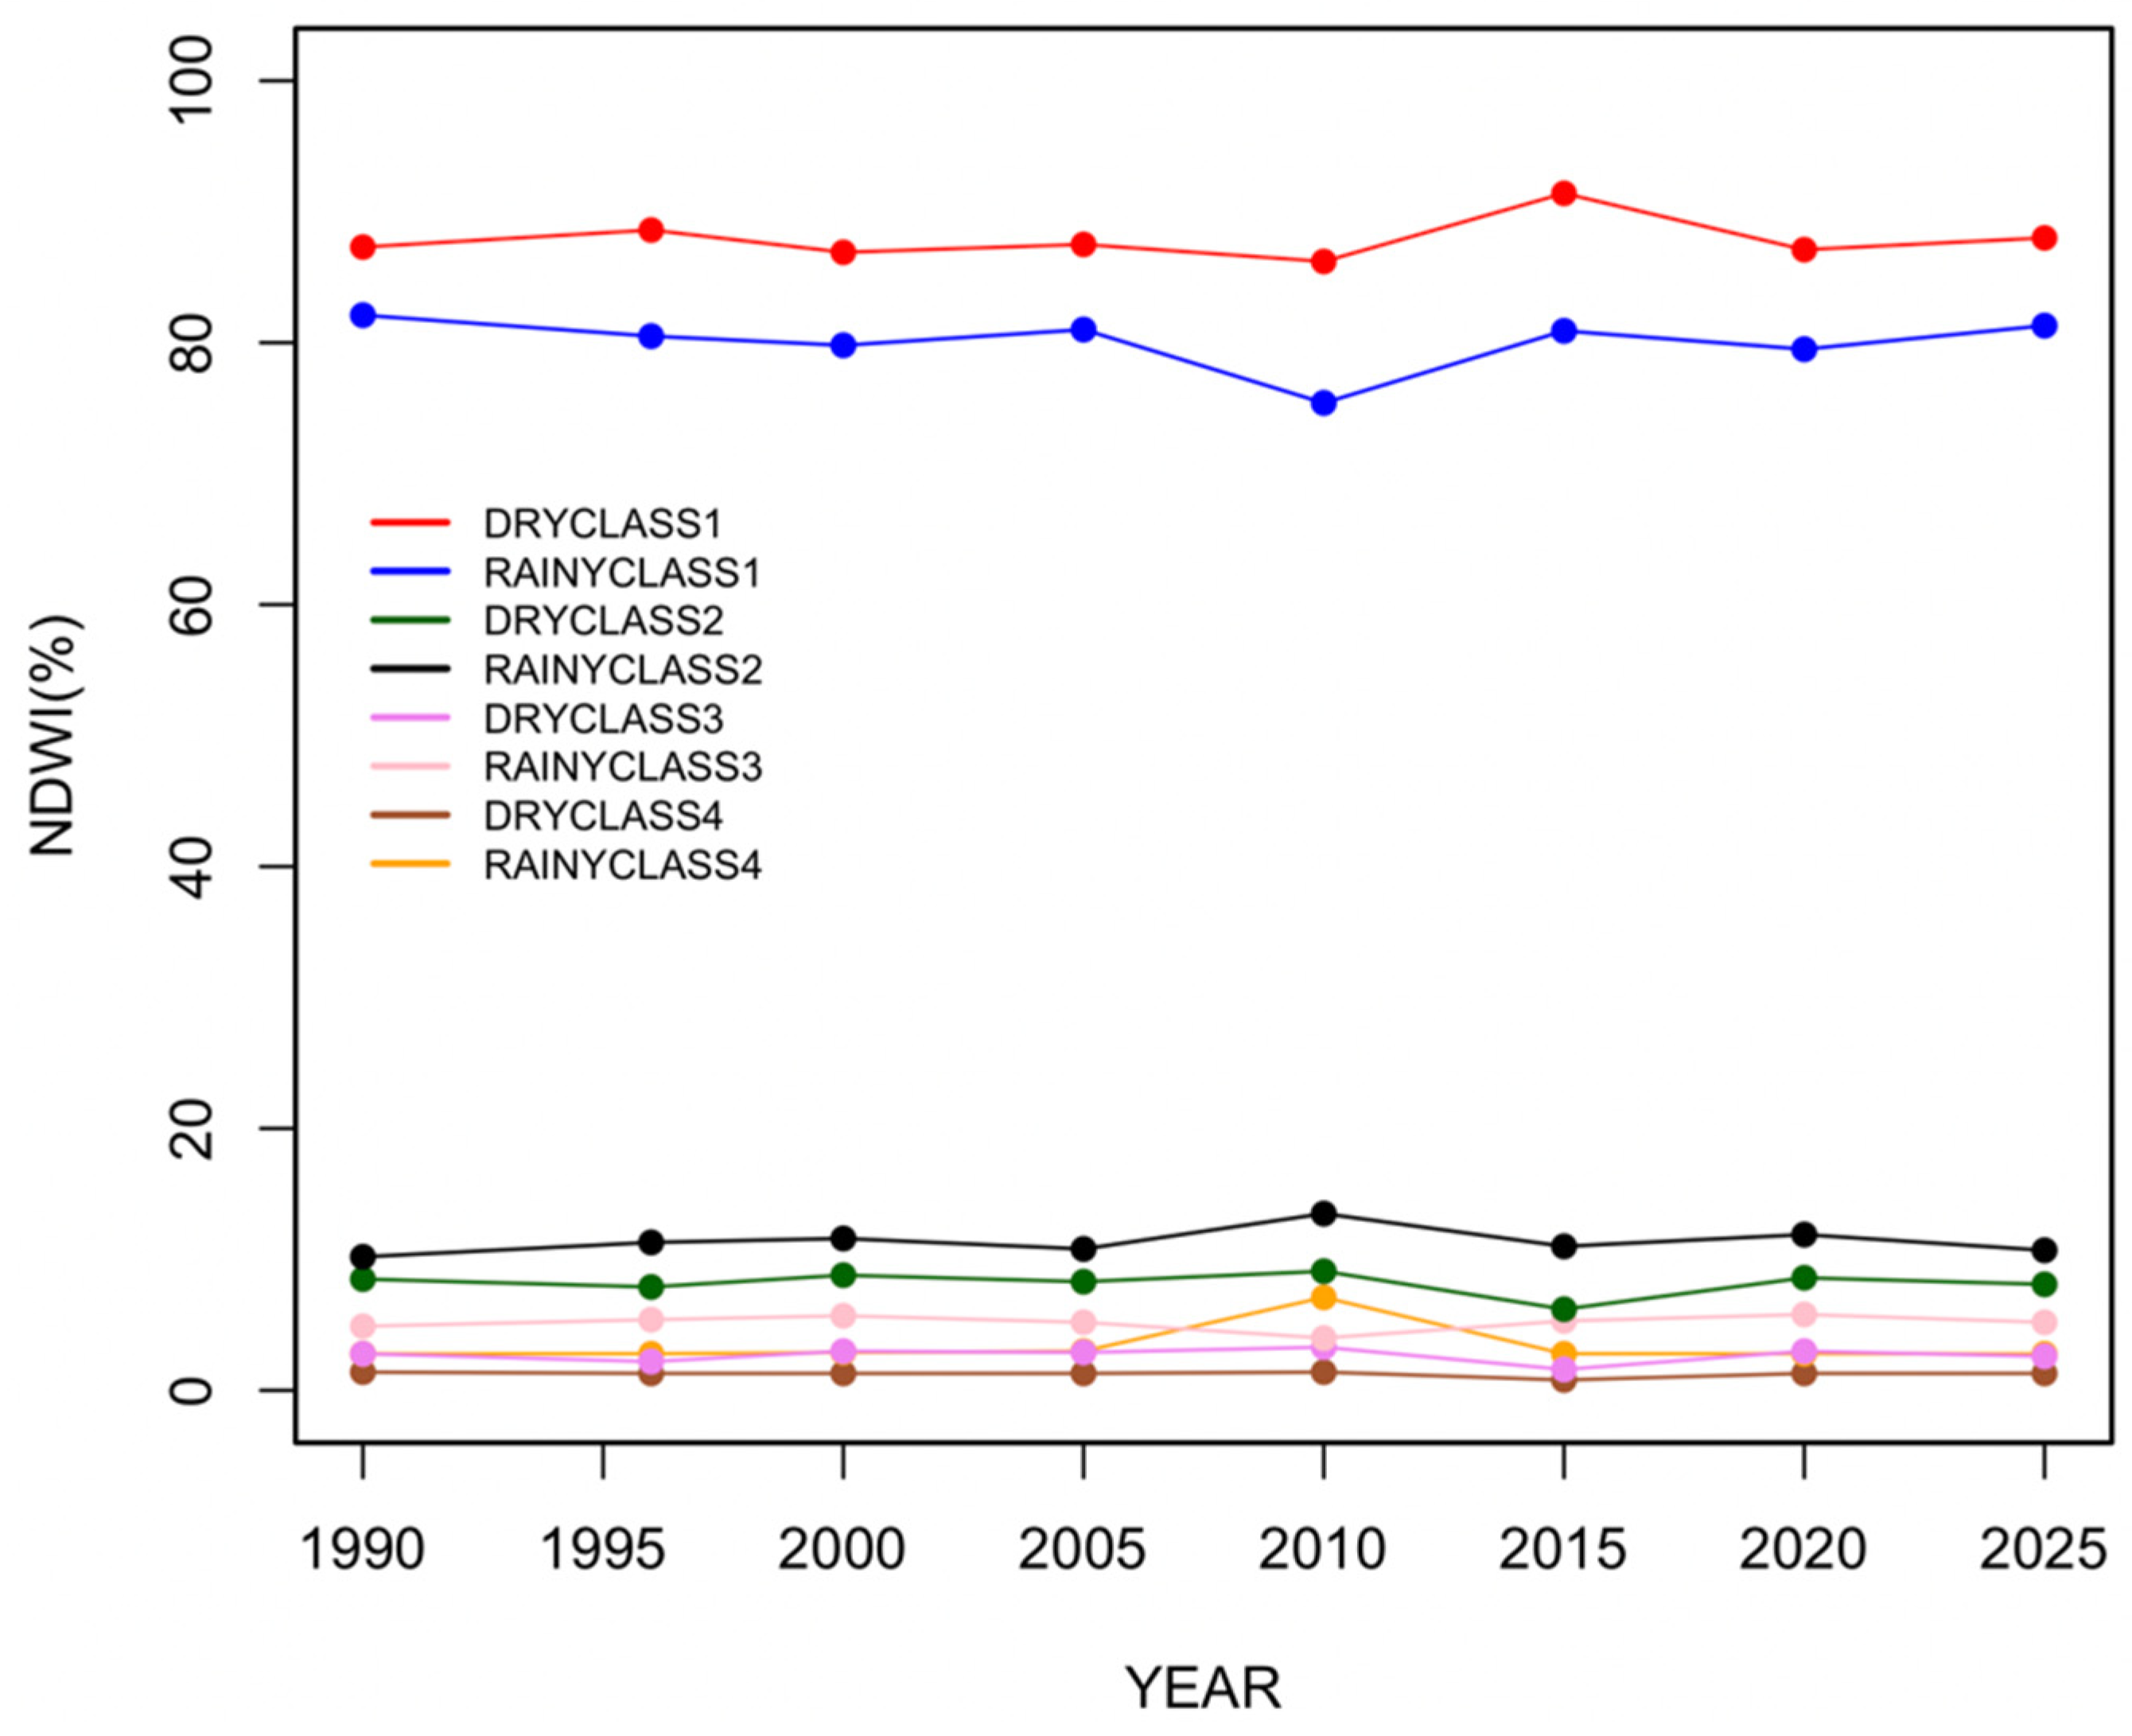
The dominant NDWI class across most of the municipality throughout the study period is Class 1 (dry vegetation and bare soil, NDWI < −0.20), which typically covers over 85% of the total area during dry seasons. This reflects the predominantly terrestrial character of the landscape, where surface water availability is severely limited outside the main water bodies and their immediate riparian zones. Moderate-moisture conditions (Class 3, NDWI 0.00–0.20) occur sporadically across the landscape, particularly in low-lying areas and agricultural zones, where residual soil moisture persists following rainfall events.
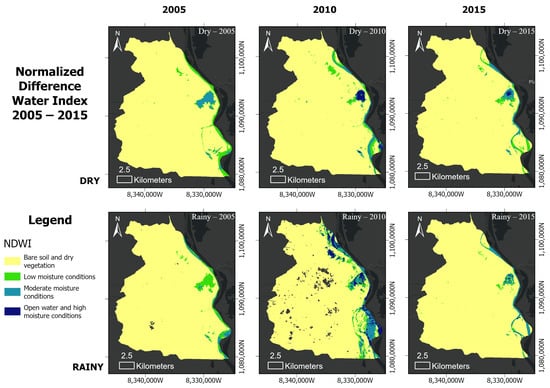
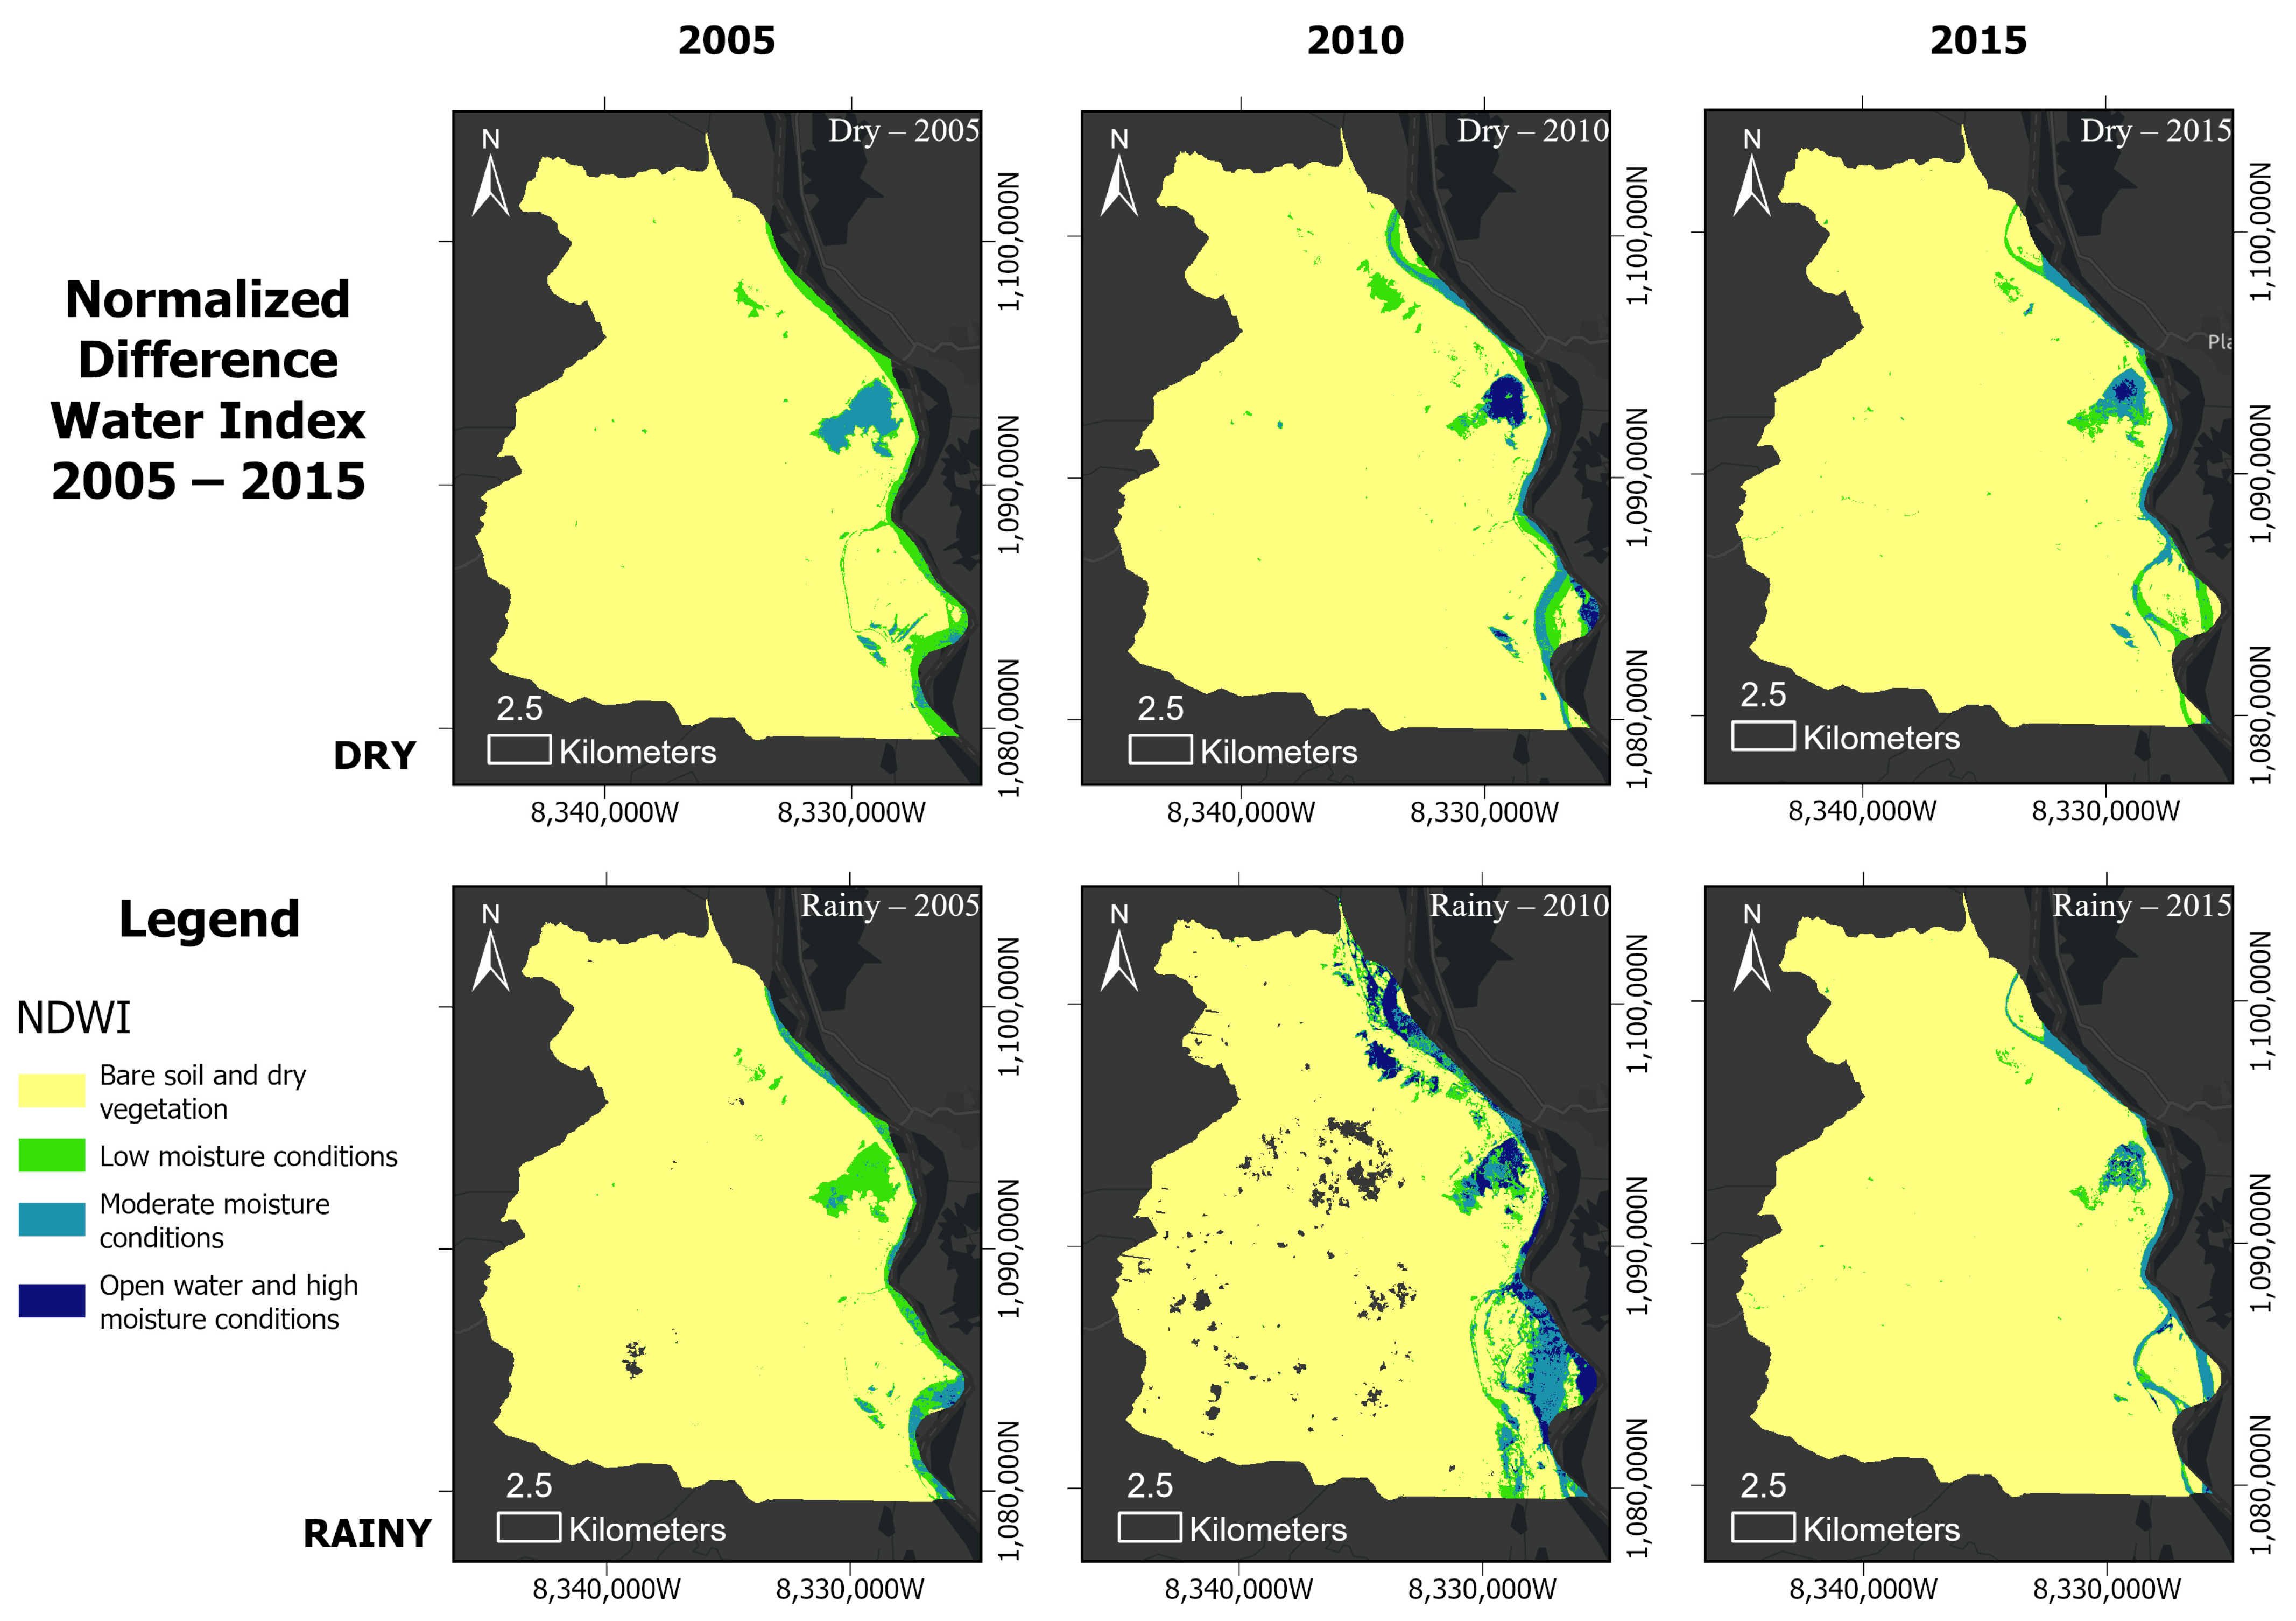
Interannual variability in NDWI is most pronounced during ENSO-related extreme events. The 2010 rainy season had the highest proportion of Class 4 (open water and moderate moisture), exceeding 7.1% of the total area, the highest recorded across the entire study period, consistent with widespread flooding caused by the strong La Niña event (Figure 8). In contrast, the 2015 dry season showed an expanded coverage of Class 1 (dry conditions), reflecting reduced surface water availability during the El Niño drought. These episodic deviations reinforce the dominant role of ENSO forcing in modulating hydrological dynamics within the Zambrano floodplain. The NDWI maps presented in Figure 9 provide insight into the hydrological connectivity of the floodplain, showing how seasonal rainfall modulates the extent of moisture gradients and the influence of wetlands across the study area.
Figure 8.
Spatial distribution of NDWI classes for selected years and seasons (2005–2015).
Figure 9.
Temporal trends in NDWI class distribution during dry and rainy seasons (2020–2025).
The distribution of surface moisture patterns occurs alongside specific variations in the monthly mean river discharge (Q) of the Magdalena River (Table 4). During the dry seasons, river discharge values generally stay below 7500.0 , with intermediate flows recorded in 1990 (5814.2 ) and a marked decrease in 2020, where discharge drops to a baseline minimum of 3387.3 . During the rainy seasons, fluvial volumes show a general increase, consistently exceeding 7900.0 . This is evidenced by discharge values of 7905.5 in 1990, 9489.6 in 1996, and 8295.1 in 2000. The maximum historical discharge value within the dataset is recorded during the 2010 rainy season, reaching a peak of 11,918.6 .
The multi-decadal and seasonal trajectories of these surface moisture changes are quantitatively summarized in Figure 10. The time-series profiles emphasize the overwhelming dominance of Class 1 (dry soil and dry vegetation) at baseline, which systematically anchors the municipality’s terrestrial matrix across both seasons. However, the graphical synthesis successfully contextualizes the exact magnitude of hydroclimatic shocks. The strong La Niña pulse of 2010 is visually marked by a synchronized contraction of Class 1 during the rainy season and a corresponding peak in moisture classes (Classes 2, 3, and 4). Conversely, the severe 2015 El Niño drought is captured by the absolute historical maximum of dry-season Class 1 coverage, illustrating the intense surface water desiccation that characterizes extreme macroclimatic dry phases.
Figure 10.
Multi-temporal trends of NDWI class area distribution (%) in the Zambrano floodplain (1990–2025) across contrasting hydroclimatic seasons.
4.3. Land-Use Structure and Spatial Organization
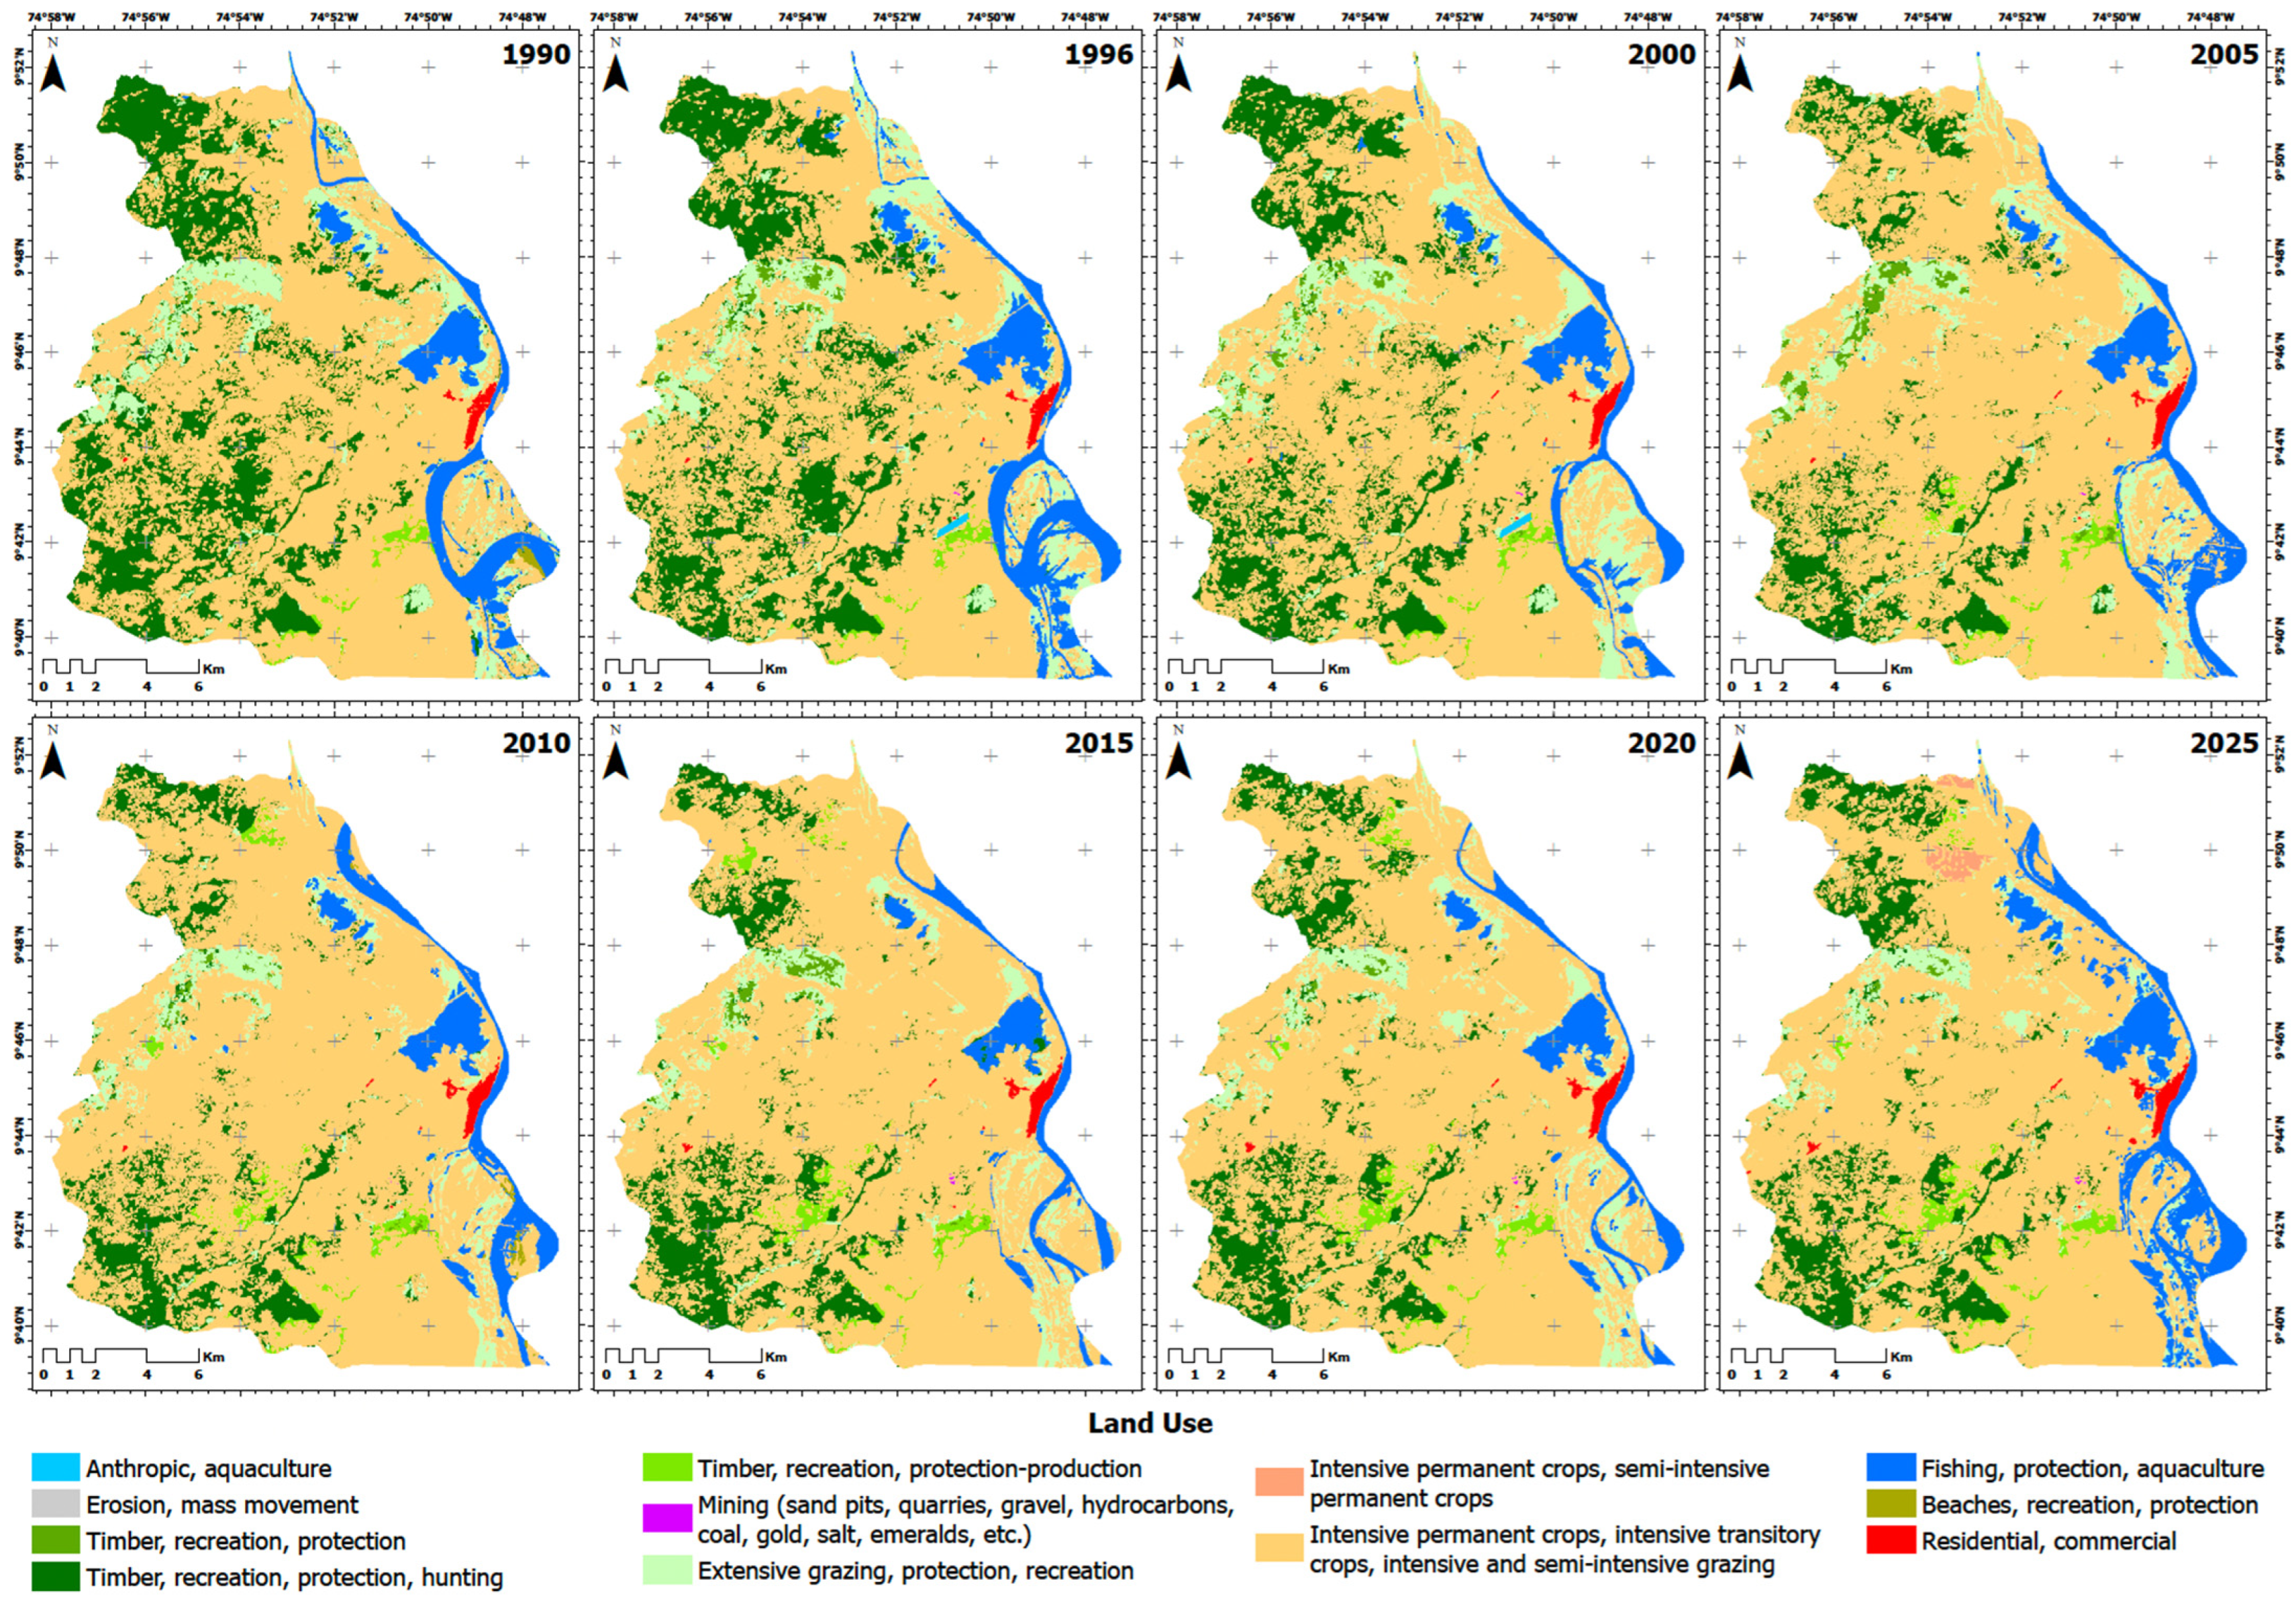
The multi-temporal spatial analysis reveals progressive changes in the landscape matrix across the monitoring years (1990, 1996, 2000, 2005, 2010, 2015, 2020, and 2025) (Figure 11). Throughout the entire 34-year baseline, the single largest operational unit is the macro-class encompassing intensive permanent/transitory crops and intensive/semi-intensive grazing. In 1990, this agricultural and high-intensity grazing matrix occupied an initial area of approximately 18,000 ha. This dominant coverage exhibited continuous horizontal expansion over subsequent decades, overtaking surrounding land cover and consolidating its footprint to reach a maximum historical extent of over 22,000 ha by the 2020 and 2025 observation periods.
Figure 11.
Historical evolution of land-use and land-cover macro-classes in the Zambrano floodplain (1990–2025).
Conversely, natural and semi-natural forest structures experienced a systematic long-term reduction. The primary forest classes dedicated to timber, recreation, and protection displayed a steady decline from their maximum area extensions logged in 1990 and 1996. By 2010, this contraction accelerated, with conservation and protective-production forestry shrinking significantly, reaching their lowest spatial thresholds during the 2020 and 2025 intervals. Concurrently, transitional covers such as extensive grazing areas associated with protection and recreation, alongside low-lying water bodies and aquaculture zones (both anthropic and fishing-regulated), showed high interannual variability. These surface water and moisture-associated classes experienced localized contractions during dry years (such as 1996 and 2015) and temporary spatial expansions during wet years, most notably during the 2010 regional hydrological anomaly. Residential and commercial urban cores maintained a stable, low-magnitude spatial footprint along the margins, showing a minimal net increase towards the end of the timeline.
4.4. Relationships Between NDVI, NDWI, and Land Use
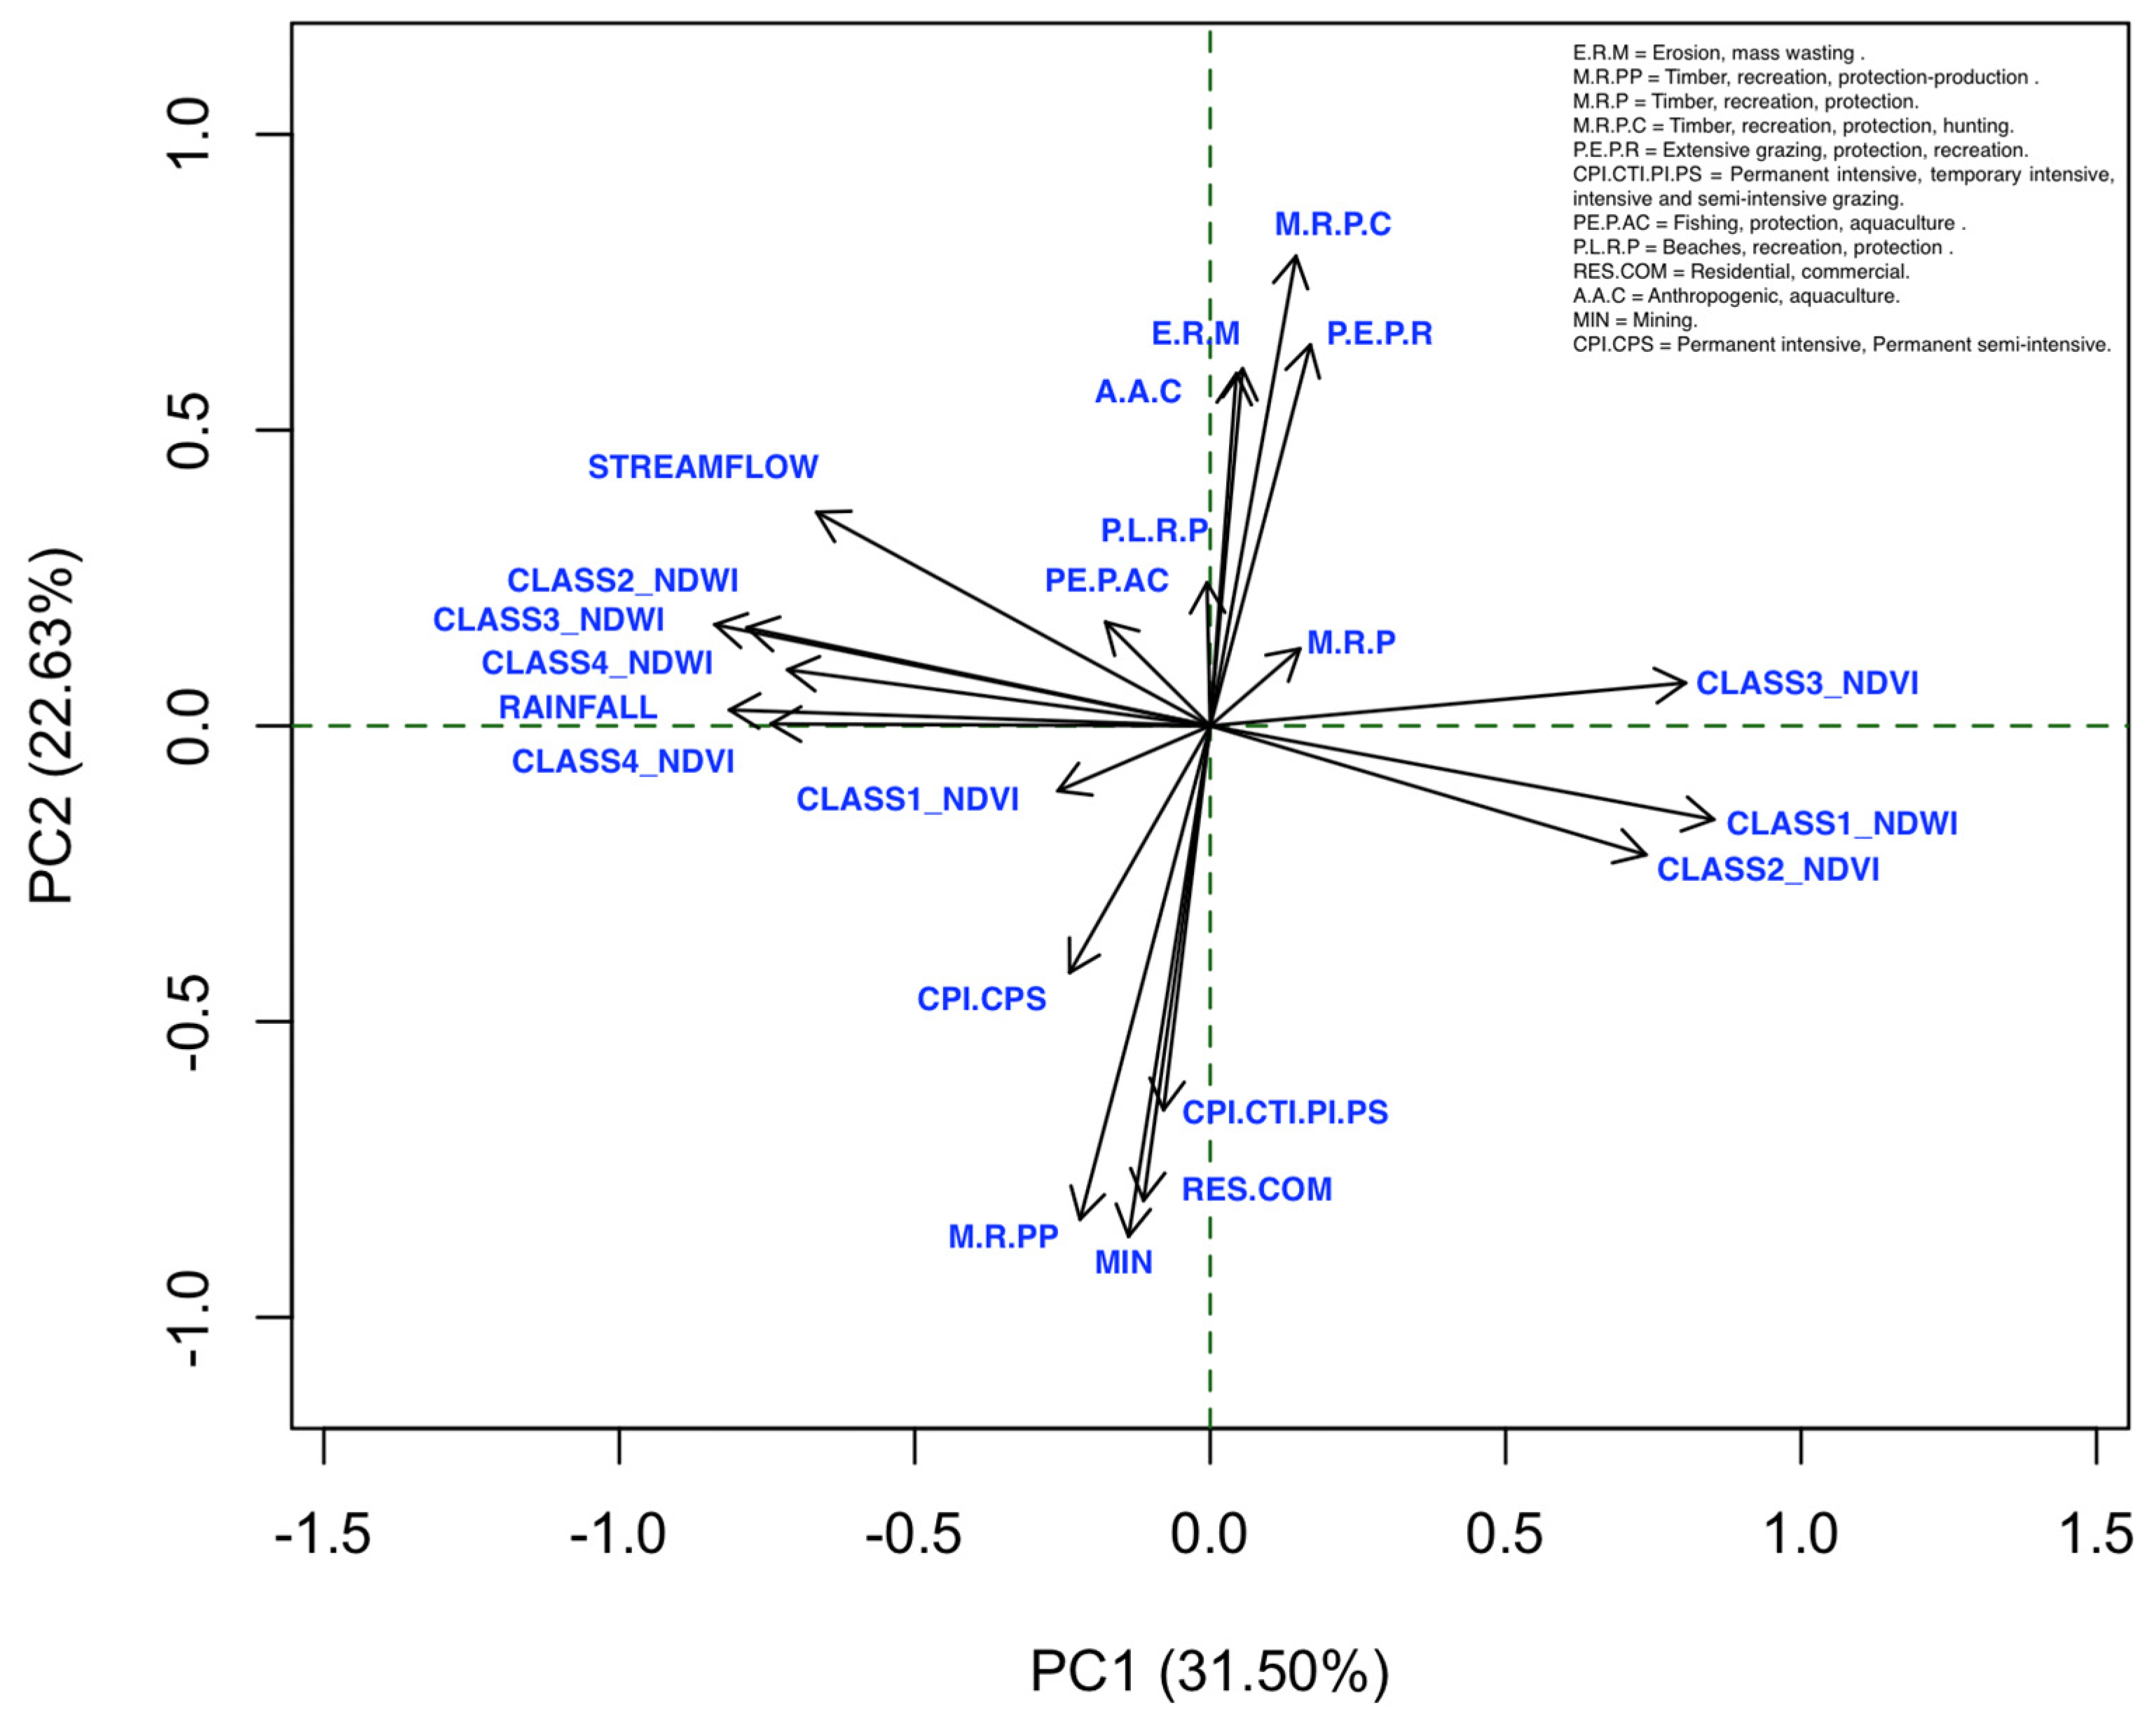
The multivariate relationships among the hydroclimatic parameters, spectral indices, and land-use/land-cover (LULC) macro-classes are synthesized via a Principal Component Analysis (PCA) loadings plot (Figure 12). The first two principal components account for a combined 54.13% of the total variance in the dataset, with Principal Component 1 (PC1) explaining 31.50% along the horizontal axis and Principal Component 2 (PC2) capturing 22.63% along the vertical axis. As shown in Figure 12, PC1 clearly and strongly separates moisture-driven and dry-state conditions along the horizontal axis. The negative quadrant of PC1 contains a tight cluster of overlapping vectors comprising RAINFALL, CLASS4_NDVI (dense vegetation), and multiple water-associated parameters, including STREAMFLOW, CLASS2_NDWI, CLASS3_NDWI, and CLASS4_NDWI. Conversely, the positive quadrant of PC1 isolates the vectors corresponding to dry soil and senescent conditions, specifically CLASS1_NDWI (bare soil/dry surfaces), CLASS2_NDVI, and CLASS3_NDVI. The nearly 180° orthogonal opposition between the cluster of water-availability indices on the left and the dry-state parameters on the right confirms a robust inverse numerical relationship along the first component.
Figure 12.
Principal Component Analysis between Rainfall, Streamflow, NDVI, NDWI, and land use.
Simultaneously, PC2 separates the landscape components along a vertical anthropogenic-intervention gradient independent of the horizontal moisture axis. The positive quadrant of PC2 is heavily loaded by protective and semi-natural forest use covers, characterized by long, vertically oriented vectors for M.R.P.C (forestry protection-production), P.E.P.R (extensive grazing/protection), E.R.M (erosion/mass movement tracking), and A.A.C (aquaculture zones). In contrast, the negative quadrant of PC2 isolates the high-intensity anthropogenic uses and modified surfaces, grouping the long, downward-pointing vectors of CPI.CTI.PI.PS (intensive agriculture/grazing), M.R.PP (timber production matrices), RES.COM (residential/commercial zones), and MIN (mining areas). The strong vertical divergence between the protective-conservation vectors pointing upward and the intensive production vectors pointing downward indicates that PC2 effectively distinguishes natural landscape stability from human-induced surface modifications.
4.5. Correlation Between Vegetation Greenness and Surface Water Availability
The statistical analysis reveals a strong inverse correlation between NDVI and NDWI (p < 0.001) across the years 1990, 1996, 2000, 2005, 2010, 2015, 2020, and 2025 for both climatic seasons. A total of 108 sampling points were processed, evenly distributed across the study area. Following data quality control, sampling points containing missing or invalid NDVI and/or NDWI values (No Data pixels resulting from image masking and edge effects) were excluded from the statistical analysis. Consequently, 65 valid sampling points were retained for the correlation and spatial autocorrelation analyses (Figure 13). After removing points with missing data, the normality of the variables was assessed using the Shapiro–Wilk test, which indicated that the indices were not normally distributed. Therefore, the correlation between NDVI and NDWI was evaluated using Spearman’s method, yielding strongly negative results. Meanwhile, the statistical significance (p-value < 0.001) indicates that chance can be ruled out as an explanation for this correlation (Table 5).
Figure 13.
Spatial distribution of sampling points used for NDVI–NDWI correlation analysis.
Table 5.
Spearman rank correlation evaluating the multi-temporal spectral and physical coupling between NDVI and NDWI by year and season.
It is critical to note that an inherent mathematical coupling accompanies the exceptionally high magnitude of this inverse correlation, as both spectral indices share the Near-Infrared (NIR) band in their respective formulations. Physically, this co-dependence mirrors the contrasting reflectance properties of water and vegetation in the NIR spectrum. The inverse relationship captures the real-world surface dynamics of the Zambrano floodplain, where the horizontal expansion of open water (high NDWI) occurs alongside a reduction or submergence of terrestrial vegetation, corresponding to a drop in canopy greenness (low NDVI). The mathematical formulation amplifies the statistical correlation coefficient, while the dataset records the seasonal alternation between the aquatic and terrestrial phases of the landscape.
In addition to the pixel-level inter-index analysis, secondary Spearman rank correlation assessments were performed to couple the macro-spatial area responses against the physical instrumental datasets recorded across the 1990–2025 baseline (Table 3 and Table 4). First, the quantitative correlation between the temporal distribution of dense vegetation area percentage (NDVI Class 4) and the localized monthly mean precipitation inputs (P) yielded a positive relationship (ρ = 0.61, 95% Confidence Interval [CI] = [0.15, 0.85], p = 0.013). Second, the statistical correlation between the spatial extent of open-water coverage (NDWI Class 4) and the historical monthly mean river discharge (Q) of the adjacent Magdalena River showed a robust positive relationship ( = 0.72, 95% CI = [0.35, 0.90], p = 0.0019). While the uncorrected p-values should be interpreted with caution due to potential temporal autocorrelation inherent to the N = 16 series, the fact that both 95% confidence intervals strictly exclude zero confirms a stable, positive covariation between the macro-spatial area responses and the physical instrumental datasets across the 1990–2025 baseline.
This inverse correlation is evident across much of the study area and throughout the years analyzed. It is most evident during the extreme event recorded in 2010 for the rainy season, which accounts for the increase in non-vegetated areas identified by NDVI Class 1 up to 6.0% (Table 3), alongside the expansion of open water and high moisture detected by NDWI Class 4 reaching 7.1% (Table 4). These observations represent the highest percentages recorded in their respective categories throughout the 1990–2025 monitoring baseline. The synchronization of these structural extremes across both indices provides empirical proof of the landscape’s transient shift towards its aquatic phase under macroclimatic forcing, validation that effectively bypasses the individual spectral limitations of the indices.
Global Moran’s I values ranged from 0.238 to 0.404 across the analyzed year–season combinations (Table 5), indicating moderate and statistically significant positive spatial autocorrelation among the sampled observations. In general, Moran’s I values approaching 1 indicate strong spatial clustering, values close to 0 indicate a random spatial pattern, and negative values indicate spatial dispersion. Therefore, the observed values suggest that neighboring sampling points tended to exhibit similar NDVI and NDWI values, reflecting the spatial continuity expected for remotely sensed environmental variables rather than strong spatial clustering. Although these results confirm that the observations were not completely spatially independent, the degree of spatial autocorrelation was moderate.
5. Discussion
5.1. Vegetation Dynamics Under Hydroclimatic Variability in the Lower Magdalena River Floodplain
The NDVI results indicate that vegetation dynamics in Zambrano are strongly controlled by seasonal hydroclimatic variability, with clear contrasts between dry and rainy periods throughout the 1990–2025 interval. The consistent expansion of dense vegetation during rainy periods and its contraction during dry periods reflect a vegetation system closely coupled to water availability, as has been widely documented in tropical floodplain and lowland environments [8,45]. Rather than indicating widespread vegetation loss, the observed changes in NDVI suggest a recurrent reorganization of vegetation structure, characterized by variations in canopy density and spatial continuity.
Over time, NDVI patterns tend toward greater dominance of dense vegetation classes, resulting in a more homogeneous spectral signal at the landscape scale. However, localized variations persist between dry and rainy seasons, indicating that vegetation greenness remains sensitive to seasonal moisture availability. Similar responses have been reported in tropical regions experiencing increased climatic variability, where vegetation becomes more responsive to short-term moisture deficits and land-use pressures [15,46]. In Zambrano, the persistence of high NDVI values during rainy periods suggests that vegetation retains a strong capacity for seasonal recovery, although spatial coherence is occasionally disrupted during hydroclimatic extremes.
Consequently, the NDVI dynamics suggest that the Zambrano floodplain functions as a relatively resilient ecosystem, where fluctuations in vegetation greenness and spatial continuity primarily reflect adaptive responses to seasonal hydroclimatic variability rather than evidence of persistent long-term degradation. Similar patterns have been documented in tropical floodplain ecosystems, where vegetation structure responds dynamically to hydrological pulses, seasonal flooding, and climatic variability, while maintaining its capacity to recover over time [45,46]. Rather than shifting toward a permanently degraded state, the observed vegetation dynamics indicate recurrent cycles of disturbance and recovery associated with the hydrological regime of the lower Magdalena River and ENSO-related climatic fluctuations [8,15]. This pattern is reflected in the temporal variability of NDVI classes observed across the study period (Table 3). During the early years of the analysis (1990–2000), dense vegetation (NDVI > 0.40) occupied between 73.8% and 88.3% of the area, even during dry periods, indicating relatively stable vegetation conditions and limited seasonal stress. However, in later years, stronger fluctuations are associated with hydroclimatic anomalies. For example, during the 2010 rainy season, the proportion of non-vegetated surfaces (Class 1) increased to 6%, the highest value recorded in the entire series, coinciding with documented flood events in the municipality. By coupling this variation with the synchronous expansion of NDWI Class 4 (7.1%), the analysis demonstrates that these changes reflect a temporary hydroclimatic shock—where low-lying pastures and vegetation matrices were submerged by the historical 11,918.6 m3/s river discharge pulse—rather than a directional trajectory towards soil degradation or permanent deforestation. Similarly, during the 2015 ENSO-related drought, dry-season NDVI patterns showed an expansion of open and sparse vegetation classes, reflecting vegetation stress due to reduced moisture availability.
These episodic deviations from the long-term pattern illustrate how vegetation structure responds to extreme hydroclimatic events rather than following a gradual degradation trajectory. More recent observations suggest partial recovery of dense vegetation, reaching 91.4% during the dry season and over 95% during the rainy season in 2025, although interannual variability remains evident. Fragmentation peaks observed in 2010 and 2020, both associated with ENSO-related hydroclimatic anomalies, further reinforce the role of short-term climatic pulses in temporarily reorganizing vegetation structure and spatial continuity across the floodplain landscape. The biological resilience of this landscape matrix is evidenced by the direct relationship between localized precipitation pulses (P) and the response of the primary forest canopy (NDVI Class 4). In these tropical floodplain environments, this interaction reflects a characteristic ecohydrological lag time and a genuine biological buffering capacity of the vegetative cover against meteorological forcing. Unlike open surface water bodies that expand instantaneously with hydrologic inputs, the deep-rooted woody vegetation characteristic of the tropical dry forest requires cumulative vertical infiltration of soil moisture into the root zone before actively expressing variations in canopy greenness. This phenological buffer prevents immediate structural collapse or widespread canopy desiccation during short-term rainfall deficits, decoupling immediate vegetative condition from instantaneous atmospheric shifts [15,46]. This adaptive phenological buffer explains why dense vegetation maintains long-term baseline stability despite the strong seasonal fluctuations driven by regional pluviometric cycles.
5.2. Surface Water Dynamics and Floodplain Connectivity
The NDWI results for Zambrano indicate a clear spatial confinement of open-water and moderate-moisture areas, predominantly concentrated in the eastern sector and associated with the Magdalena River. Rather than reflecting the loss of a previously extensive and well-connected floodplain water network, the results reveal a system in which surface-water connectivity has historically been limited and is becoming increasingly episodic and seasonally constrained. This behavior is consistent with the flood pulse concept, which emphasizes periodic hydrological activation rather than permanent floodplain inundation as the primary driver of wetland ecological processes in tropical river systems [45]. This hydrologic interaction is reflected in the positive correlation identified between open-water expansion (NDWI Class 4) and the Magdalena River discharge at Calamar ( = 0.72, 95% CI = [0.35, 0.90]). Within the macro-geomorphological framework of the Momposina Depression, this relationship underscores that surface-water routing is bound to main-channel dynamics under multi-decadal hydroclimatic forcing. However, lateral connectivity in this low-gradient floodplain is fundamentally non-linear and governed by complex threshold mechanisms. Lateral overbank flow and the activation of distributary channels do not expand symmetrically; instead, they depend on localized microtopography, natural levees, and internal drainage networks that modulate how volumetric streamflow translates into horizontal inundation extent across low-lying depressions. Because the current analysis utilizes 30 m multispectral imagery without a high-resolution digital elevation model, these fine-scale microtopographic controls and sub-seasonal non-linearities remain unquantified, representing a conservative boundary in the spatial interpretation of the flood pulse.
The 2010 La Niña event stands out as a critical anomaly, with Class 4 (open water and high moisture) expanding to 7.1% of the total area during the rainy season—nearly double the values recorded in other years. This extreme event temporarily reactivated floodplain depressions and lateral hydrological connections, illustrating the system’s capacity to respond rapidly to large-scale hydroclimatic forcing. Conversely, the 2015 El Niño drought produced the most pronounced contraction of surface water availability, with Class 1 (dry conditions) reaching 91.4% during the dry season. These contrasting responses highlight the strong sensitivity of the Zambrano floodplain to ENSO-driven hydroclimatic extremes, with implications for aquatic biodiversity, agricultural water supply, and wetland-dependent communities.
Comparison with global surface water datasets [41,42] confirms that permanent water bodies in Zambrano are spatially restricted to the main Magdalena River channel and the Cienaga de Zambrano complex. The absence of significant long-term trends in Class 4 coverage across most of the study period suggests that the overall extent of permanent surface water has remained relatively stable, consistent with findings from large-scale analyses of tropical river floodplains [47]. However, the highly episodic nature of moderate-moisture conditions (Class 3) primarily reflects the inherent hydrological pulse characteristic of this floodplain system, in which surface moisture retention is directly controlled by interannual climatic shifts. Rather than indicating a permanent loss of environmental buffering capacity, the temporal fluctuations in Class 3 underscore the transient behavior of shallow-water routing across low-lying areas. This dynamic is structurally modulated by severe dry ENSO phases, which temporarily restrict surface water persistence to specialized topographic depressions, with no evidence of a persistent alteration in the long-term hydroclimatic functioning of the floodplain [43].
5.3. Land-Use Dynamics and Their Influence on Ecohydrological Functioning
The multi-temporal land-use analysis reveals the persistent dominance and progressive expansion of agropastoral systems throughout the 1990–2025 period, driving a gradual reduction in forested and semi-natural vegetation. This spatial pattern reflects the long-term consolidation of agricultural and livestock activities across the Zambrano floodplain; a process deeply rooted in the socio-political history of rural Colombia. During the 1990s and early 2000s, the lower Magdalena River basin and the broader Momposina Depression experienced intense structural transformations characterized by the expansion of extensive cattle ranching and agrarian frontiers on highly fertile alluvial soils. This baseline expansion was heavily driven by national agrarian policies favoring livestock commercialization and regional economic dynamics that incentivized production in floodplain matrices, often at the expense of strategic natural buffers [9,39]. Beyond the observed landscape transformation, the increasing predominance of agropastoral land uses has important ecohydrological implications, as these systems generally exhibit lower vegetation structural complexity and greater sensitivity to seasonal hydroclimatic variability than natural or semi-natural vegetation covers. This relationship is evidenced by stronger NDVI fluctuations in areas dominated by agricultural and livestock activities, particularly during drought periods associated with ENSO events. In contrast, forested areas maintained comparatively more stable vegetation conditions throughout the study period.
The temporal trajectory of land-use change, which saw the agropastoral matrix expand from ~18,000 ha to over 22,000 ha, indicates that hydroclimatic variability and socio-economic drivers acted simultaneously in shaping the contemporary landscape. In the latter half of the study baseline (2010–2025), this progressive consolidation was further accelerated by regional development plans and infrastructure projects that enhanced territorial connectivity between the municipality of Zambrano and major Caribbean economic cores, such as Barranquilla. These market integrations reduced transport costs for cattle and agropastoral products, driving further horizontal land conversion. Consequently, while short-term spectral fluctuations reflect macroclimatic ENSO anomalies, the permanent underlying trajectory of the landscape is governed by an expanding anthropogenic footprint, which progressively alters the ecological matrix and reduces the spatial extent of natural protective forests. As natural and semi-natural vegetation areas declined, the landscape became increasingly dominated by productive land uses that are generally more sensitive to water deficits and hydrological disturbances. This interaction highlights the importance of considering both climatic and land-use drivers when evaluating long-term ecohydrological dynamics in tropical floodplain systems [48,49].
Forest and conservation areas serve as relatively stable ecological buffers, maintaining higher NDVI values across seasons and exhibiting lower sensitivity to ENSO-driven hydroclimatic anomalies. Their persistence in the western and riparian zones of the municipality reflects both the protective role of terrain and the buffering effect of denser canopy cover on soil moisture dynamics. These areas are critical for maintaining local ecological connectivity and hydrological regulation within the floodplain landscape [26,50]. From a territorial planning perspective, the persistence of forested and wetland-associated vegetation patches is particularly relevant because these areas help maintain ecological connectivity, regulate hydrological flows, and increase landscape resilience to climatic extremes. Their conservation may therefore represent a key strategy for reducing the vulnerability of floodplain ecosystems exposed to increasing hydroclimatic variability.
The spatial coincidence of agropastoral expansion with areas of seasonally high NDWI variability suggests that land-use practices may be amplifying the hydrological sensitivity of certain landscape sectors. Consequently, the interaction between hydroclimatic variability and long-term land-use transformation appears to be an important factor shaping the contemporary ecohydrological functioning of the Zambrano floodplain figure [47,51]. These dynamics are particularly relevant for floodplain management in the context of increasing hydroclimatic variability under climate change projections for the Colombian Caribbean region.
5.4. Hydroclimatic Responses, Spectral Coupling, and Territorial Planning
The integrated analysis of NDVI, NDWI, and land use provides a comprehensive picture of the ecohydrological functioning of the Zambrano floodplain and its responses to hydroclimatic variability and land-use pressures. The strong inverse NDVI–NDWI correlation characterizes the spectral and physical coupling across the landscape, reflecting the contrasting reflectance properties of canopy and open water in the near-infrared spectrum rather than an independent ecological mechanism [16,44,45]. Instead, the true ecohydrological coupling of the Zambrano floodplain is structurally demonstrated by the secondary correlations against independent instrumental data, where dense vegetation areas (NDVI Class 4) respond to localized precipitation inputs ( = 0.61, 95% CI = [0.15, 0.85]) and open-water extensions (NDWI Class 4) remain tightly coupled with the Magdalena River discharge pulses ( = 0.72, 95% CI = [0.35, 0.90]). The high lower bounds of these confidence intervals effectively validate the physical and biological mechanisms driving landscape dynamics, confirming that surface routing and canopy responses are bounded by hydroclimatic forcing despite the statistical constraints of temporal dependence in small sample sizes. This coupling is most evident during extreme hydroclimatic events, when the differential response time and temporal lags between surface moisture recession and vegetation greenness provide a sensitive indicator of seasonal adaptive adjustments within the ecosystem.
These findings carry important implications for territorial planning and ecosystem-based management in the lower Magdalena River floodplain. The identification of land-use types with contrasting ecohydrological responses, forest conservation areas as stable buffers versus agropastoral zones as hydrologically sensitive sectors, provides a basis for prioritizing areas for conservation, ecological restoration, and adaptive land management. In particular, the protection and restoration of riparian forest corridors and wetland margins could enhance landscape resilience to hydroclimatic extremes while sustaining key ecosystem services, including water regulation, carbon storage, and biodiversity habitat [10,26,49].
The integration of remotely sensed indicators with instrumental hydroclimatic data further strengthens the interpretation of floodplain functioning. The positive relationships identified between dense vegetation cover and precipitation, as well as between open-water extent and river discharge, demonstrate that the spatial patterns detected through NDVI and NDWI are closely linked to physical hydrometeorological processes operating across the lower Magdalena floodplain. These findings reinforce the importance of considering both climatic forcing and land-use dynamics when designing management strategies to reduce ecosystem vulnerability to hydroclimatic extremes. The results also highlight the value of long-term, multi-temporal remote sensing analysis for monitoring ecosystem dynamics in data-scarce floodplain environments. The 35-year NDVI–NDWI time series developed in this study enables the identification of long-term patterns, hydroclimatic anomalies, and recurrent ecohydrological responses that would not be apparent from single-date analyses, providing a robust empirical basis for regional environmental assessments and climate adaptation planning [21].
5.5. Limitations and Future Research Directions
Several limitations should be acknowledged in interpreting the results of this study. First, the temporal resolution of Landsat imagery (16-day revisit interval) limits its ability to capture sub-seasonal hydrological dynamics, particularly during the rapid onset and recession of flood pulses. Second, image availability was constrained by cloud cover during the rainy season, potentially introducing representativeness biases in some annual composites. Third, the land-use classification, while robust at the municipal scale, may not fully resolve sub-pixel land-use heterogeneity in transitional zones between vegetation types.
Another limitation lies in the pluviometric record used to anchor the hydroclimatic interpretation. The IDEAM station of Zambrano, while the only continuous local gauge available for the municipality, provides a point measurement of a rainfall field whose convective structure varies appreciably across short distances in the lower Magdalena basin [8]. A single rain gauge cannot fully characterize the spatial heterogeneity of precipitation across the 302 km2 floodplain, particularly during the rainy-season storms that dominate the NDWI signal. Complementary use of gridded reanalysis products such as CHIRPS or ERA5-Land, alongside neighboring stations at Magangué, Plato, and Tenerife, would help discriminate between local convective forcing and basin-scale atmospheric drivers, and reduce the residual uncertainty that a single point of observation inevitably carries.
Future research should explore integrating higher-resolution multispectral and SAR (Synthetic Aperture Radar) data to improve the temporal and spatial characterization of surface water dynamics and vegetation phenology in the Zambrano floodplain [12]. The incorporation of hydrological and climate models would enable the projection of future ecohydrological trajectories under different ENSO and climate change scenarios [21]. Additionally, field-based validation of NDVI and NDWI patterns, combined with hydrometric measurements and ecological surveys, would strengthen the mechanistic interpretation of remote sensing signals in this complex floodplain environment.
6. Conclusions
This study demonstrates that the spatio-temporal dynamics of vegetation and surface water in the Zambrano floodplain (1990–2025) are predominantly governed by hydroclimatic seasonality and ENSO-driven pulses rather than long-term irreversible degradation. While the structural matrix consolidated through an expansion of the agropastoral footprint from ~18,000 ha in 1990 to over 22,000 ha by 2025 at the expense of protective forest structures, the ecosystem retained strong baseline resilience. Extreme macroclimatic anomalies induced pronounced transient shifts, exemplified by maximum surface-water expansion during the 2010 La Niña flood (NDWI Class 4: 7.1%) and severe desiccation during the 2015 El Niño drought (NDWI Class 1: 91.4%). Dense forest remnants (NDVI Class 4) served as stable ecological buffers, exhibiting phenological lag times against short-term moisture deficits. The cross-validation of spectral indices with independent precipitation (P) and Magdalena River discharge (Q) records confirms that floodplain functioning remains tightly coupled with regional hydrometeorological forcing. From a territorial planning perspective, these findings prioritize three actionable strategies for the lower Magdalena River basin: strictly protecting resilient forest remnants, maintaining lateral flood-pulse connectivity in low-lying depressions, and restricting agricultural expansion within existing transformed borders.
Author Contributions
Conceptualization, A.C.T.-E. and J.C.R.; methodology, A.C.T.-E., R.C.-S. and L.S.C.; software, R.C.-S. and L.S.C.; validation, A.C.T.-E. and D.A.B.-Á.; formal analysis, A.C.T.-E., R.C.-S. and L.S.C.; investigation, A.C.T.-E., J.C.R., R.C.-S., D.A.B.-Á. and L.S.C.; resources, A.C.T.-E. and J.C.R.; data curation, R.C.-S. and L.S.C.; writing—original draft preparation, A.C.T.-E.; writing—review and editing, J.C.R., D.A.B.-Á. and L.S.C.; visualization, R.C.-S. and L.S.C.; supervision, A.C.T.-E. and J.C.R.; project administration, A.C.T.-E.; funding acquisition, A.C.T.-E. and J.C.R. All authors have read and agreed to the published version of the manuscript.
Funding
This research was funded by the Sistema General de Regalías (SGR) through Call 34 of the Ministry of Science, Technology and Innovation (Minciencias), under the project “Estudio del potencial de los humedales como depósitos de carbono para la mitigación del cambio climático, en los departamentos de Sucre, Bolívar, Atlántico, Magdalena, La Guajira y Córdoba” (BPIN 2024000100130-SGR).
Data Availability Statement
The data that support the findings of this study are available from the corresponding author upon reasonable request. Landsat satellite imagery is publicly available through the Google Earth Engine platform (https://earthengine.google.com, 2 February 2026).
Acknowledgments
The authors gratefully acknowledge the financial support provided by the Sistema General de Regalías (SGR), Colombia.
Conflicts of Interest
The authors declare no conflicts of interest.
Abbreviations
The following abbreviations are used in this manuscript:
| NDVI | Normalized Difference Vegetation Index |
| NDWI | Normalized Difference Water Index |
| ENSO | El Niño–Southern Oscillation |
| GEE | Google Earth Engine |
| NIR | Near-Infrared |
| OLI | Operational Land Imager |
| TM | Thematic Mapper |
| ETM+ | Enhanced Thematic Mapper Plus |
| SAR | Synthetic Aperture Radar |
| IGAC | Instituto Geográfico Agustín Codazzi |
| IDEAM | Instituto de Hidrología, Meteorología y Estudios Ambientales de Colombia |
References
- Siddique, A.B.; Rayhan, E.; Sobhan, F.; Das, N.; Fazal, M.A.; Riya, S.C.; Sarker, S. Spatio-temporal analysis of land use and land cover changes in a wetland ecosystem of Bangladesh using a machine-learning approach. Front. Water 2024, 6, 1394863. [Google Scholar] [CrossRef] [Scilit]
- Zhang, J.; Qian, L.; Wang, G.; Wangdwei, M.; Zhu, Q. Resilience planning for urban ecosystems in the Himalayas: Ecosystem service value decline and network vulnerabilities in Lhasa. Ecol. Front. 2026, 46, 227–241. [Google Scholar] [CrossRef] [Scilit]
- Intergovernmental Science-Policy Platform on Biodiversity and Ecosystem Services (IPBES). Global Assessment Report on Biodiversity and Ecosystem Services; IPBES Secretariat: Bonn, Germany, 2019. [Google Scholar]
- Melo, V.F.; de Matos, C.H.L.; Schaefer, C.E.G.; Uchôa, S.C.P.; Montenegro, R.A.; Iuit, C.E.C.; Augusti, M.L. Indigenous lands of Roraima and ecosystem services: Pedology and land use, vegetation cover, total carbon stock, and water resources. J. Nat. Conserv. 2025, 90, 127175. [Google Scholar] [CrossRef] [Scilit]
- Instituto de Hidrología; Meteorología y Estudios Ambientales de Colombia (IDEAM). Estudio Nacional del Agua 2018; IDEAM: Bogotá, Colombia, 2018.
- Angarita, H.; Wickel, A.J.; Sieber, J.; Chavarro, J.; Maldonado-Ocampo, J.A.; Herrera-R., G.A.; Purkey, D. Basin-scale impacts of hydropower development on the Mompós Depression wetlands, Colombia. Hydrol. Earth Syst. Sci. 2018, 22, 2839–2865. [Google Scholar] [CrossRef] [Scilit]
- Wilcox, A.C.; Angarita, H.; Fisher, L.; Restrepo, J.D. Sediment Dynamics in the Magdalena River Basin, Colombia, and Implications for Hydropower Planning. In Proceedings of the AGU Fall Meeting, San Francisco, CA, USA, 11–15 December 2023. [Google Scholar]
- Restrepo, J.D.; Kjerfve, B. Magdalena River: Interannual variability (1975–1995) and revised water discharge and sediment load estimates. J. Hydrol. 2000, 235, 137–149. [Google Scholar] [CrossRef] [Scilit]
- Restrepo, J.D.; Kettner, A.J.; Syvitski, J.P. Recent deforestation has caused a rapid increase in river sediment load in the Colombian Andes. Anthropocene 2015, 10, 13–28. [Google Scholar] [CrossRef] [Scilit]
- Ricaurte, L.F.; Olaya-Rodríguez, M.H.; Cepeda-Valencia, J.; Lara, D.; Arroyave-Suárez, J.; Finlayson, C.M.; Palomo, I. Future impacts of drivers of change on wetland ecosystem services in Colombia. Glob. Environ. Change 2017, 44, 158–169. [Google Scholar] [CrossRef] [Scilit]
- Ocampo-Marulanda, C.; Carvajal-Escobar, Y.; Perafán-Cabrera, A.; Restrepo-Jiménez, L.M. Desiccation of wetlands and their influence on the regional climate. Case Study: Ciénaga de Aguablanca, Cali, Colombia. Trop. Conserv. Sci. 2021, 14, 19400829211007075. [Google Scholar] [CrossRef] [Scilit]
- Adhikari, R.; Bhardwaj, A. Development of a flood detection framework integrating Synthetic Aperture Radar polarimetry and machine learning for semi-urban vegetation systems. J. Environ. Manag. 2026, 397, 128208. [Google Scholar] [CrossRef] [Scilit] [PubMed]
- Rouse, J.W., Jr.; Haas, R.H.; Schell, J.A.; Deering, D.W. Monitoring the Vernal Advancement and Retrogradation (Green Wave Effect) of Natural Vegetation; NASA/GSFC Type III Final Report; NASA: Greenbelt, MD, USA, 1973.
- Wilson, E.H.; Sader, S.A. Detection of forest harvest type using multiple dates of Landsat TM imagery. Remote Sens. Environ. 2002, 80, 385–396. [Google Scholar] [CrossRef] [Scilit]
- Lastovicka, J.; Svec, P.; Paluba, D.; Kobliuk, N.; Svoboda, J.; Hladky, R.; Stych, P. Sentinel-2 data in an evaluation of the impact of the disturbances on forest vegetation. Remote Sens. 2020, 12, 1914. [Google Scholar] [CrossRef] [Scilit]
- Xu, H. Modification of normalized difference water index (NDWI) to enhance open water features in remotely sensed imagery. Int. J. Remote Sens. 2006, 27, 3025–3033. [Google Scholar] [CrossRef] [Scilit]
- Corporación Autónoma Regional del Río Grande de la Magdalena (CORMAGDALENA). Plan de Manejo Ambiental de Los Humedales de la Depresión Momposina; CORMAGDALENA: Bogotá, Colombia, 2009.
- Corporación Autónoma Regional del Río Grande de la Magdalena (CORMAGDALENA). Plan Estratégico para la Recuperación y Conservación de los Humedales Asociados al Río Magdalena; CORMAGDALENA: Bogotá, Colombia, 2012.
- Restrepo, J.D.; Kettner, A.J.; Syvitski, J.P.M. Fluvial geomorphic response to climate variability in the Colombian Caribbean: Magdalena River. In Proceedings of the AGU Fall Meeting, San Francisco, CA, USA, 15–19 December 2014. [Google Scholar]
- Higgins, R.W.; Shi, W.; Yarosh, E.; Joyce, R. Improved United States Precipitation Quality Control System and Analysis; NCEP/Climate Prediction Center Atlas 7; NOAA: Camp Springs, MD, USA, 2016.
- Munar, A.M.; Mendez, N.; Narvaez, G.; Campo Zambrano, F.; Motta-Marques, D.; Lyra Fialho Brêda, J.P.; Angarita, H. Modelling the climate change impacts on river discharge and inundation extent in the Magdalena River basin–Colombia. Hydrol. Sci. J. 2023, 68, 1286–1300. [Google Scholar] [CrossRef] [Scilit]
- Barros Rodríguez, L.M. Procesos de Inundación y Cambios en la Geomorfología Fluvial en el Curso Inferior del R. Magdalena (Plato, Tenerife y Zambrano): Magnitud e Interacción (1986–2015). Master’s Thesis, Universidad del Norte, Barranquilla, Colombia, 2022. [Google Scholar]
- Corporación Autónoma Regional del Sur de Bolívar (CSB). Plan de Acción Cuatrienal 2024–2027; CSB: Bolívar, Colombia, 2024.
- Departamento Administrativo Nacional de Estadística (DANE). Censo Nacional de Población y Vivienda del 2018, Nivel de Manzanas; DANE: Bogotá, Colombia, 2018.
- Instituto Geográfico Agustín Codazzi (IGAC). Mapa Geomorfológico de Colombia. Suelos y Tierras de Colombia 2016, Escala 1:100.000; IGAC: Bogotá, Colombia, 2016.
- Salgado, J.; Jaramillo-Monroy, C.; Link, A.; Lopera-Congote, L.; Velez, M.I.; Gonzalez-Arango, C.; McGowan, S. Riverine connectivity modulates elemental fluxes through a 200-year period of intensive anthropic change in the Magdalena River floodplains, Colombia. Water Res. 2025, 268, 122633. [Google Scholar] [CrossRef] [Scilit] [PubMed]
- Agudelo-Hz, W.J.; Castillo-Barrera, N.C.; Uriel, M.G. Scenarios of land use and land cover change in the Colombian Amazon to evaluate alternative post-conflict pathways. Sci. Rep. 2023, 13, 2152. [Google Scholar] [CrossRef] [Scilit] [PubMed]
- Castro-Padilla, R.A.; Jiménez-Peñaranda, C.E.; Rojas-Martínez, E.E.; Lascarro-Navarro, F.D.; Manco-Jaraba, D.C. Multitemporal analysis and river dynamics of the Branch of Mompox (Magdalena River), Cantera Township, Bolívar, Colombia. Ingeniería 2023, 28, 1–11. [Google Scholar] [CrossRef] [Scilit]
- Vermote, E.; Justice, C.; Claverie, M.; Franch, B. Preliminary analysis of the performance of the Landsat 8/OLI land surface reflectance product. Remote Sens. Environ. 2016, 185, 46–56. [Google Scholar] [CrossRef] [Scilit] [PubMed]
- Foga, S.; Scaramuzza, P.L.; Guo, S.; Zhu, Z.; Dilley, R.D.; Beckmann, T.; Schmidt, G.L.; Dwyer, J.L.; Hughes, M.J.; Laue, B. Cloud detection algorithm comparison and validation for operational Landsat data products. Remote Sens. Environ. 2017, 194, 379–390. [Google Scholar] [CrossRef] [Scilit]
- Instituto Geográfico Agustín Codazzi (IGAC). División Político-Administrativa de Colombia y Cartografía Municipal; IGAC: Bogotá, Colombia, 2023.
- Li, X.; Hui, N.; Shen, H.; Fu, Y.; Zhang, L. A robust mosaicking procedure for high spatial resolution remote sensing images. ISPRS J. Photogramm. Remote Sens. 2015, 109, 108–125. [Google Scholar] [CrossRef] [Scilit]
- McFeeters, S.K. The use of the Normalized Difference Water Index (NDWI) in the delineation of open water features. Int. J. Remote Sens. 1996, 17, 1425–1432. [Google Scholar] [CrossRef] [Scilit]
- Jensen, J.R. Introductory Digital Image Processing: A Remote Sensing Perspective, 3rd ed.; Pearson Education: Upper Saddle River, NJ, USA, 1996. [Google Scholar]
- Souza, C.M., Jr.; Z. Shimbo, J.; Rosa, M.R.; Parente, L.L.; A. Alencar, A.; Rudorff, B.F.T.; Hasenack, H.; Matsumoto, M.; G. Ferreira, L.; Souza-Filho, P.W.M.; et al. Reconstructing three decades of land use and land cover changes in brazilian biomes with landsat archive and earth engine. Remote Sens. 2020, 12, 2735. [Google Scholar] [CrossRef] [Scilit]
- Rosa, M.R.; Brancalion, P.H.; Crouzeilles, R.; Tambosi, L.R.; Piffer, P.R.; Lenti, F.E.; Hirota, M.; Santiami, E.; Metzger, J.P. Hidden destruction of older forests threatens Brazil’s Atlantic Forest and challenges restoration programs. Sci. Adv. 2021, 7, eabc4547. [Google Scholar] [CrossRef] [Scilit] [PubMed]
- Xu, Q.; Yordanov, V.; Bruzzone, L.; Brovelli, M.A. High-resolution global land cover maps and their assessment strategies. ISPRS Int. J. Geo-Inf. 2025, 14, 235. [Google Scholar] [CrossRef] [Scilit]
- Da Terra, C. An algorithm for maximum concordance to harmonize legends of land use and land cover maps. Rev. Bras. Cartogr. 2024, 76, 1–17. [Google Scholar] [CrossRef] [Scilit]
- Yela-Lara, S.D.M.; Baca-Gamboa, A.E. Dinámicas de cambio de las coberturas del suelo y su impacto en el sector suroriental de Pasto, Colombia. Rev. Acad. Colomb. Cienc. Exactas Físicas Nat. 2023, 47, 996–1007. [Google Scholar] [CrossRef] [Scilit]
- Gao, B.C. NDWI—A normalized difference water index for remote sensing of vegetation liquid water from space. Remote Sens. Environ. 1996, 58, 257–266. [Google Scholar] [CrossRef] [Scilit]
- Pekel, J.F.; Cottam, A.; Gorelick, N.; Belward, A.S. High-resolution mapping of global surface water and its long-term changes. Nature 2016, 540, 418–422. [Google Scholar] [CrossRef] [Scilit] [PubMed]
- Donchyts, G.; Baart, F.; Winsemius, H.; Gorelick, N.; Kwadijk, J.; Van De Giesen, N. Changes in Earth’s surface water over the past 30 years. Nat. Clim. Change 2016, 6, 810–813. [Google Scholar] [CrossRef] [Scilit]
- Xiong, Y.; Li, Y.; Xiong, S.; Wu, G.; Deng, O. Multi-scale spatial correlation between vegetation index and terrain attributes in a small watershed of the upper Minjiang River. Ecol. Indic. 2021, 126, 107610. [Google Scholar] [CrossRef] [Scilit]
- Szabo, S.; Gácsi, Z.; Balázs, B. Specific features of NDVI, NDWI and MNDWI as reflected in land cover categories. Landsc. Environ. 2016, 10, 194–202. [Google Scholar] [CrossRef] [Scilit]
- Junk, W.J.; Bayley, P.B.; Sparks, R.E. The flood pulse concept in river–floodplain systems. Can. J. Fish. Aquat. Sci. 1989, 106, 110–127. [Google Scholar]
- Lopera-Congote, L.; Salgado, J.; Vélez, M.I.; Link, A.; González-Arango, C. River connectivity and climate behind the long-term evolution of tropical American floodplain lakes. Ecol. Evol. 2021, 11, 12970–12988. [Google Scholar] [CrossRef] [Scilit] [PubMed]
- Lu, J.; Qin, T.; Lv, X.; Yan, D.; Xu, S.; Yuan, Z.; Gao, H. Vegetation evolution and water sensitivity analysis in the source region of the Yangtze River and the Yellow River under the combined drive of energy-temperature-water. Ecol. Indic. 2025, 181, 114428. [Google Scholar] [CrossRef] [Scilit]
- Estupinan-Suárez, L.M.; Florez-Ayala, C.; Quinones, M.J.; Pacheco, A.M.; Santos, A.C. Detection and characterization of Colombian wetlands using Alos Palsar and MODIS imagery. Int. Arch. Photogramm. Remote Sens. Spat. Inf. Sci. 2015, 40, 375–382. [Google Scholar] [CrossRef] [Scilit]
- Food and Agriculture Organization (FAO). The State of Food and Agriculture 2020. Overcoming Water Challenges in Agriculture; FAO: Rome, Italy, 2020. [Google Scholar]
- Mukherjee, K.; Pal, S. Hydrological and landscape dynamics of floodplain wetlands of the Diara region, Eastern India. Ecol. Indic. 2021, 121, 106961. [Google Scholar] [CrossRef] [Scilit]
- Jothimani, M.; Gunalan, J.; Duraisamy, R.; Abebe, A. Study the relationship between LULC, LST, NDVI, NDWI and NDBI in greater Arba Minch Area, Rift Valley, Ethiopia. In Proceedings of the 3rd International Conference on Integrated Intelligent Computing Communication & Security (ICIIC 2021), Bangalore, India, 6–7 August 2021; Atlantis Press: Amsterdam, The Netherlands, 2021; pp. 183–193. [Google Scholar]

Disclaimer/Publisher’s Note: The statements, opinions and data contained in all publications are solely those of the individual author(s) and contributor(s) and not of MDPI and/or the editor(s). MDPI and/or the editor(s) disclaim responsibility for any injury to people or property resulting from any ideas, methods, instructions or products referred to in the content. |
© 2026 by the authors. Licensee MDPI, Basel, Switzerland. This article is an open access article distributed under the terms and conditions of the Creative Commons Attribution (CC BY) license.