Article

Enhancing Daily Runoff Prediction via Uniform Design and Meta-Learning Integrated Hyperparameter Optimization Embedded in Transformer

1
Faculty of Geographical Science and Engineering, Henan University, Zhengzhou 450001, China
2
College of Geographic Sciences, Henan University, Kaifeng 475001, China
3
Key Research Institute of Yellow River Civilization and Sustainable Development, Henan University, Kaifeng 475001, China
4
Zhengzhou Xinda Institute of Advanced Technology, Zhengzhou 450001, China
5
Beijing Urban Construction Design & Development Group Co., Ltd., Beijing 100037, China
*
Author to whom correspondence should be addressed.
These authors contributed equally to this work.
Hydrology 2026, 13(8), 201; https://doi.org/10.3390/hydrology13080201
Submission received: 10 June 2026 / Revised: 18 July 2026 / Accepted: 22 July 2026 / Published: 25 July 2026

Abstract

Accurate runoff prediction is an essential foundation for water resource management, flood prevention, and drought warning. Despite the superior performance of deep learning models in runoff prediction, the high-dimensional hyperparameter optimization limits their widespread application. To address this challenge, this study proposed a hyperparameter optimization strategy that integrated Uniform Design (UD) and Meta-Learning (ML) within the Transformer framework (UD-ML-Transformer) for daily runoff prediction. Performance of the proposed model was systematically evaluated against five benchmark models, including the UD-Transformer, Particle Swarm Optimization (PSO)-Transformer, and three Receptance Weighted Key Value (RWKV)-based models (PSO-RWKV, UD-RWKV, and UD-ML-RWKV), using hydroclimatic data spanning 1980 to 2014 from the Rio Pueblo de Taos watershed in USA. Results showed that the UD-ML-Transformer model performed the best in both prediction accuracy and peak flow, with the highest Nash-Sutcliffe Efficiency (NSE) of 0.906, and the lowest Mean Squared Error (MSE), Root Mean Squared Error (RMSE), and Mean Absolute Error (MAE) of 0.004, 0.062, and 0.034, respectively. The UD-Transformer ranked second in performance, followed by the PSO-Transformer. The integrated UD-ML hyperparameter optimization strategy also improved the performance of RWKV-based models. Compared with the PSO-RWKV and UD-RWKV models, the UD-ML-RWKV model exhibited an NSE improvement of 0.45–7.65% and an RMSE reduction of 1.47–21.18%, respectively. Moreover, cross-watershed validation conducted in the Ford River watershed, USA, also demonstrated the satisfactory performance of the proposed UD-ML-Transformer model, with the highest NSE of 0.890, and the lowest MSE, RMSE, and MAE of 0.088, 0.296, and 0.141, respectively. These findings highlight the superiority of integrating UD and ML for hyperparameter optimization in runoff forecasting.

1. Introduction

Global climate change has intensified the frequency and severity of extreme hydroclimatic events, posing formidable challenges to conventional hydrological forecasting methods [1]. As a key flux integrating the terrestrial and atmospheric hydrological cycle, runoff serves as a critical link between atmospheric precipitation, soil moisture, and groundwater. It maintains regional ecological balance [2], supplies agricultural irrigation [3], and safeguards urban water security [4]. Thus, accurate runoff prediction is indispensable for ensuring the resilient operation of hydrological systems under a changing climate and for optimizing sustainable utilization of water resources [5].
Over the past few decades, a large number of runoff prediction models have been successfully developed to meet the rising demands for accuracy and applicability. These models can be generally categorized into physical models and data-driven models [6,7]. The conventional physical models can accurately simulate and predict runoff events by leveraging physical laws and hydrological mechanisms governing natural rainfall-runoff processes [8]. Commonly used physical models include the Stanford model [9], Sacramento hydrological model [10], Xin’anjiang model [11], Soil and Water Assessment Tool (SWAT) model [12], Weather Research and Forecasting hydrological modeling system (WRF-Hydro) [13], and ParFlow hydrologic model (ParFlow) [14]. While these hydrological models offer process-based interpretability, their application remains limited by their complex structure, substantial data requirements, and strong dependence on expert knowledge [15,16]. Initially, data-driven models rely on statistical characteristics from historical time series to predict runoff [17], and representative methods include autoregressive integrated moving averages [18], Kalman filter [19], and cyclic regression models [20]. However, these models fail to satisfy their strict assumptions of linearity and stationarity, and often prove inadequate in capturing the highly nonlinear and non-stationary characteristics inherent in natural runoff sequences, leading to unsatisfactory predictive performance.
With the ongoing advancement of artificial intelligence, machine learning has emerged as a primary data-driven method for runoff prediction. Techniques such as the Artificial Neural Networks (ANN), Support Vector Machines (SVM), and Convolutional Neural Networks (CNN), were commonly employed in runoff prediction for their strong nonlinear mapping ability [21]. For example, Nourani [22] achieved reliable runoff forecasting by integrating simulated emotional parameters into backpropagation of ANN. Ren et al. [23] realized monthly runoff forecast by combining the Mann–Kendall test, T-Test, and SVM. Van et al. [24] obtained accurate runoff prediction with proposed 1D CNN model. Subsequently, these techniques have evolved into more sophisticated models such as Recurrent Neural Network (RNN) architectures, most notably Long Short-Term Memory (LSTM) and Gated Recurrent Unit (GRU), which effectively mitigate the long-term dependency limitation in time-series data through their enhanced learning capabilities. For example, Gao et al. [25] found that the superiority of LSTM and GRU over conventional ANN models in runoff prediction of the Shaxi River Basin. Man et al. [26] demonstrated that the enhanced LSTM model outperformed the widely used hydrological models and data-driven models such as ANN, SVR, and GRU in daily runoff forecasting over the upper Huaihe River Basin. Le et al. [27] revealed that the superior performance of four LSTM-based models relative to feedforward neural networks (FFNN) and CNN models in streamflow forecasting across the Red River Basin. However, the advent of the Transformer, first proposed by Vaswani et al. [28], has significantly challenged the predominance of LSTM networks in time-series prediction. Its self-attention mechanism enables efficient capture of long-term dependencies in sequential data via parallel computation, thereby greatly improving training efficiency and reducing inference latency [29,30]. For example, Sun et al. [31] found that the Transformer outperformed both CNN and LSTM in groundwater-level prediction. Wei et al. [32] embedded the self-attention core of Transformer model into the LSTM/GRU models, achieving further performance gains. Yin et al. [33] developed a novel Transformer-based rainfall-runoff model, which surpassed two LSTM-based sequence-to-sequence models. Despite its strong capabilities in handling sequential data, the Transformer is still limited by the heavy computational burden of self-attention mechanism for long sequences and the difficulty of tuning hyperparameters in its large parameter space [34,35,36].
Hyperparameter optimization is a crucial step in deep learning modeling, directly impacting training stability, convergence speed, and final predictive accuracy [37]. Commonly used hyperparameter optimization algorithms include the Grey Wolf Optimizer (GWO), Particle Swarm Optimization (PSO), and Sparrow Search Algorithm (SSA) [38,39,40]. For example, Zhang et al. [41] used PSO to optimize deep learning models for landslide susceptibility assessment. Mabdeh et al. [42] applied GWO in deep learning models to improve flood susceptibility mapping. Zhang et al. [43] employed SSA in deep learning models for monthly runoff forecasting. However, these optimization algorithms are limited by intensive computation, slow convergence, and susceptibility to local optimum [44,45], particularly in high-dimensional search space of Transformer framework.
Uniform Design (UD) offers a cost-effective alternative by selecting representative point sets within high-dimensional factor spaces to minimize uniform distribution deviation, drastically reducing computational costs [46,47]. Its spatial uniformity makes it robust for optimizing complex multi-factor, multi-level systems [48,49]. Nevertheless, the sampling-focused nature limits its cross-task generalization, potentially compromising tuning stability. Meta-Learning (ML), also termed “learning to learn”, compensates for this limitation by leveraging acquired knowledge from existing tasks to rapidly recommend near-optimal hyperparameter for new tasks [50,51]. By exploiting task distribution commonalities, ML significantly reduces cross-task computational costs and improves optimization robustness, even under limited data or computing resources [52,53]. The integration of UD and ML achieved a perfect balance between global parameter space exploration and adaptive local optimal exploitation, addressing the critical research gap in existing hyperparameter optimization. Traditional Bayesian optimization and AutoML tools suffered from extremely high computational costs in large-scale parameter searching; swarm intelligence algorithms were prone to falling into local optima; and UD lacked adaptive local optimization capability and presented low search efficiency [54]. Unlike these conventional methods, our coupled framework combined the global uniform sampling advantage of UD and the adaptive learning optimization capability of ML, which fundamentally mitigated local optimum defects, reduced computational consumption, and achieved a more stable and efficient hyperparameter optimization performance. To date, few studies have combined UD and ML for hydrological model tuning, and none have been reported for Transformer-based runoff prediction models.
Therefore, this study proposed a novel UD-ML-Transformer runoff prediction model by integrating UD and ML into the Transformer architecture (UD-ML-Transformer) to improve the efficiency and robustness of hyperparameter tuning. For rigorous validation, two benchmark Transformer models optimized by PSO and UD were constructed for comparison. Additionally, the Receptance Weighted Key Value (RWKV) framework was also introduced as a supplementary benchmark. This architecture inherits the strengths of recurrent neural networks, supporting parallel training and linear-time inference to achieve efficient modeling [55]. By integrating RWKV with the three aforementioned optimization strategies, three RWKV-based models (PSO-RWKV, UD-RWKV, and UD-ML-RWKV) were constructed for comprehensive comparison. The remainder of this paper was organized as follows. In Section 2, the study area, dataset collection and preprocessing, model methodologies, and experimental design were described, followed by model evaluation metrics. Section 3 and Section 4 presented the modeling results and discussions. Finally, Section 5 summarized the key conclusions.

2. Materials and Methodology

2.1. Study Area

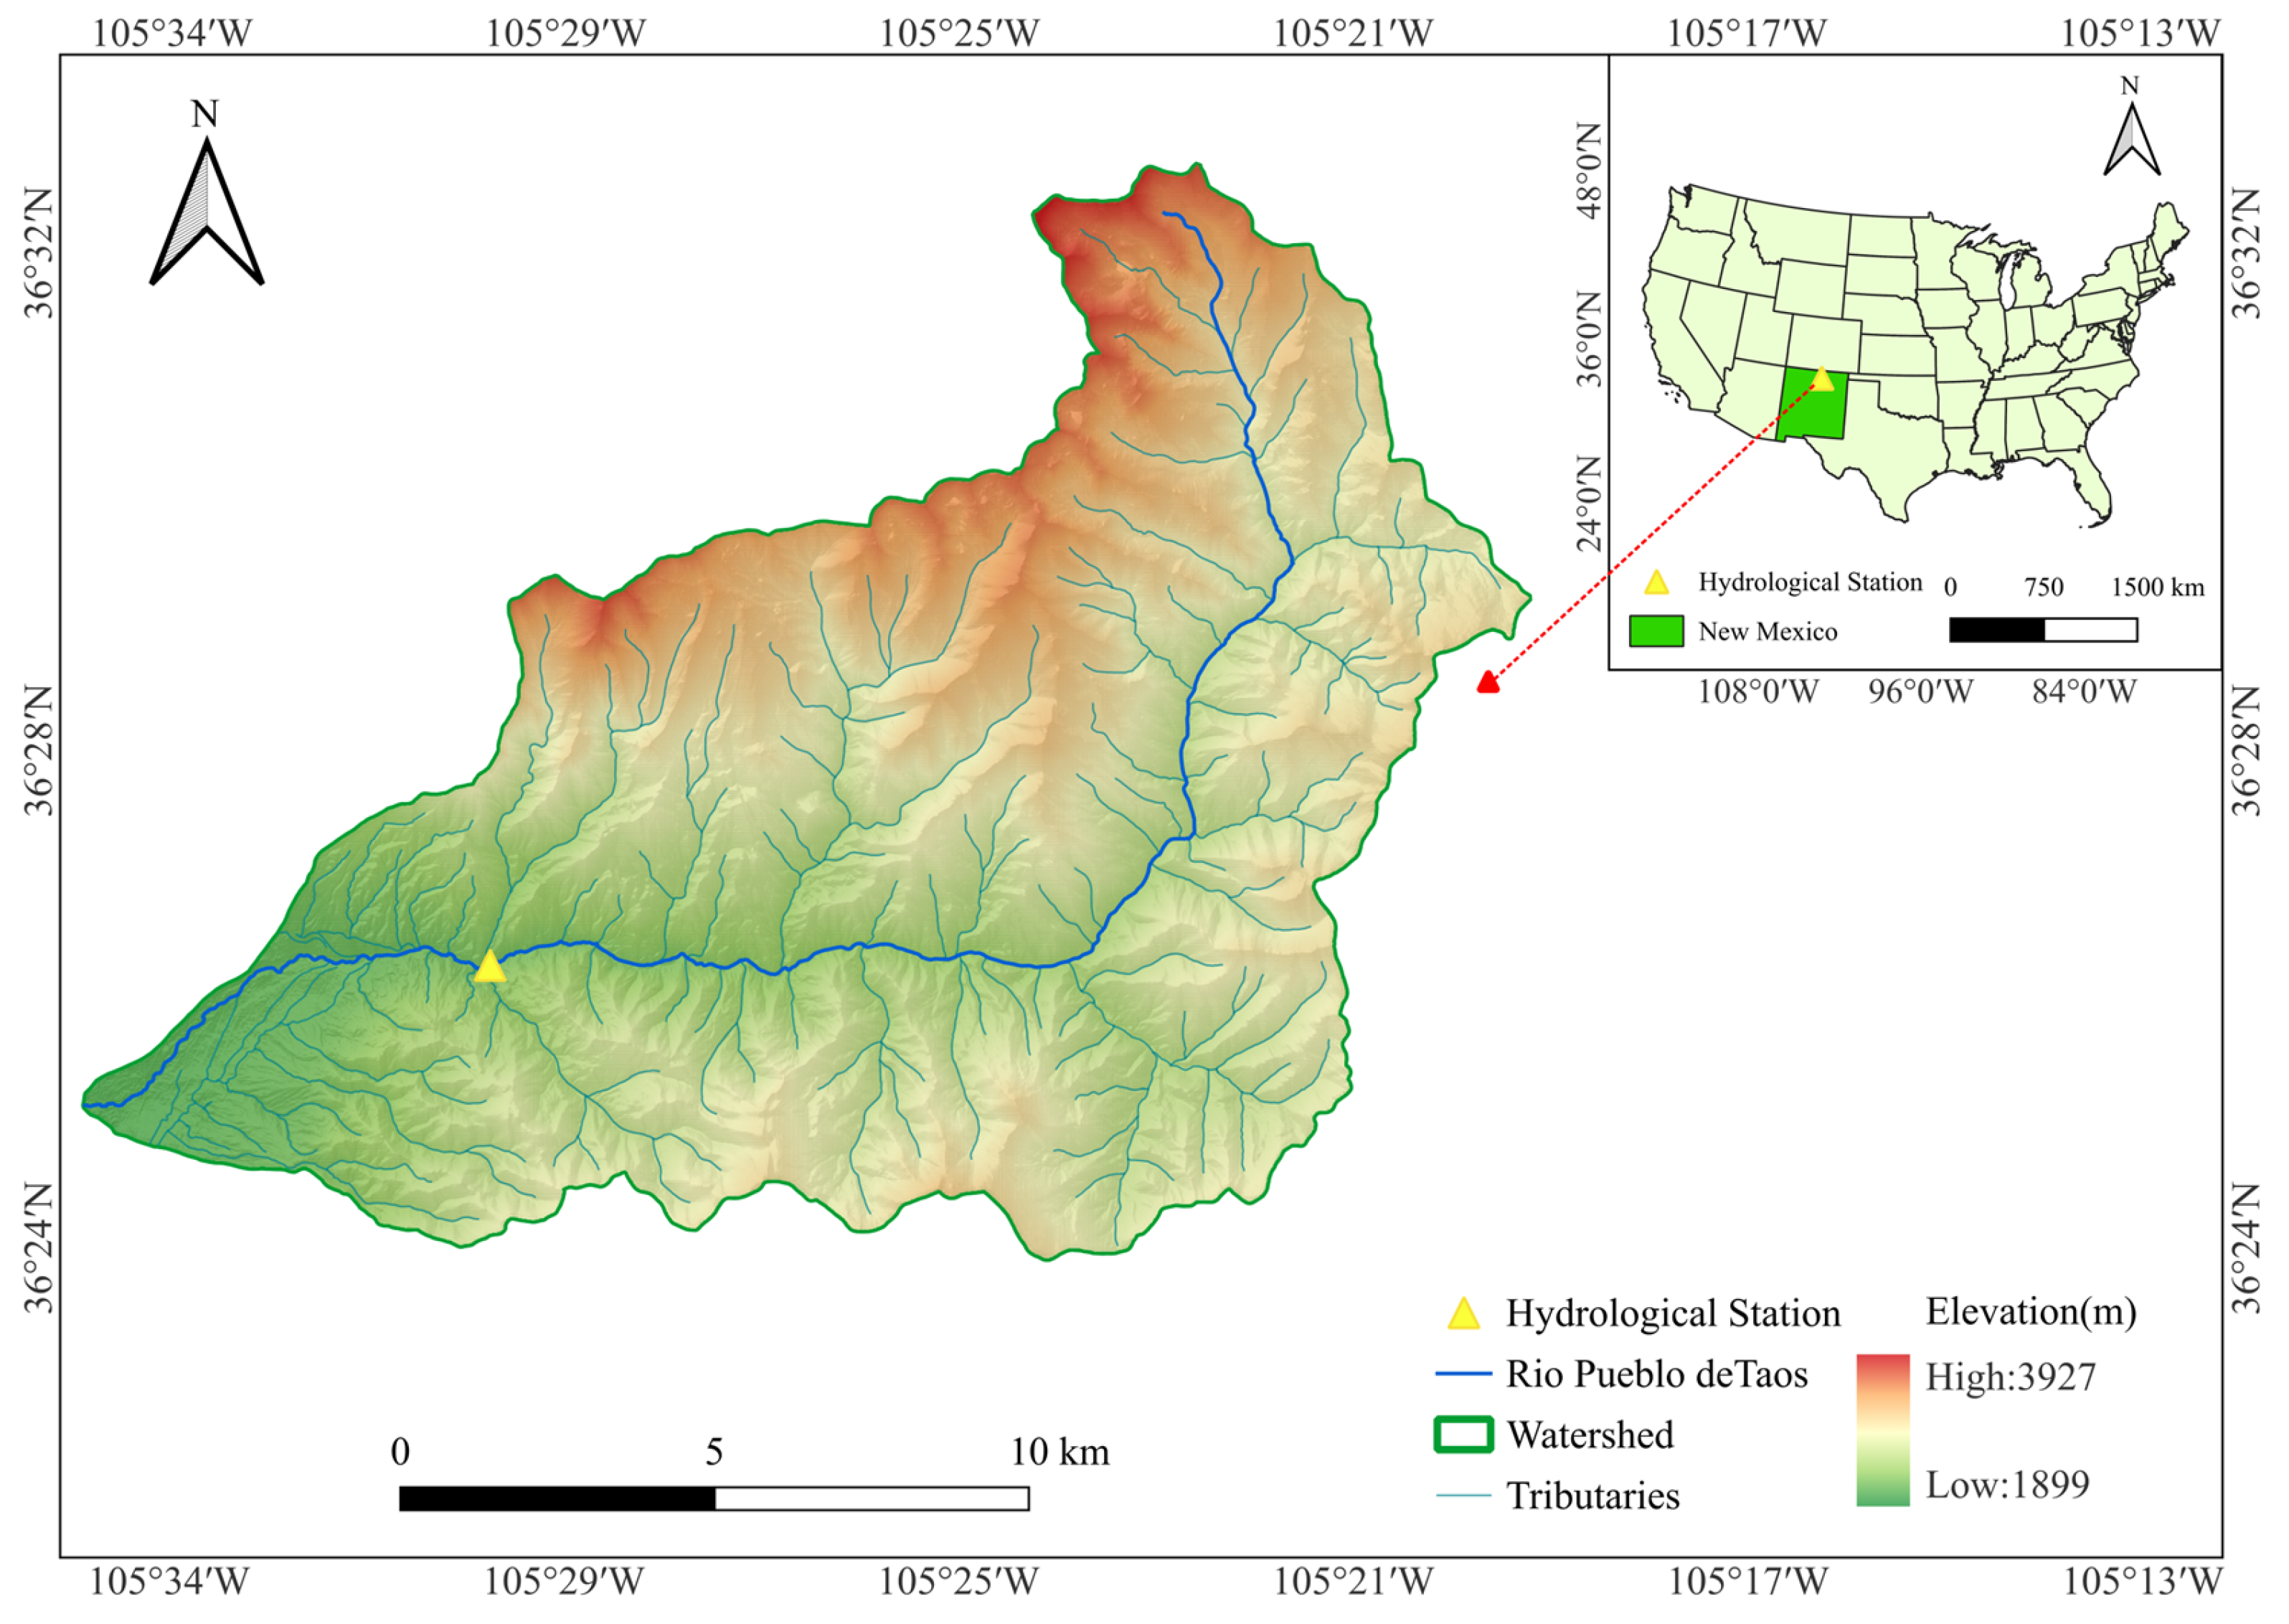
The Rio Pueblo de Taos watershed, situated in the vicinity of Taos, New Mexico, USA, spans latitudes ranging from 36° to 37° N and longitudes from 105° to 106° W, covering a total area of 172.5 km2 (Figure 1). As a typical mountain river, the Rio Pueblo de Taos originates from the Sangre de Cristo Mountains, traverses Taos County from the northeast to the southwest, and ultimately converges with the Rio Grande. Located on a high-altitude inland plateau, the watershed is characterized by a steep terrain with an average elevation of 2600 m. The main river channel extends 48 km, with a vertical drop of 1100 m. The water supply in this basin primarily relies on high-mountain snowmelt, leading to distinct seasonal variations in runoff.

2.2. Data Sources and Preprocessing

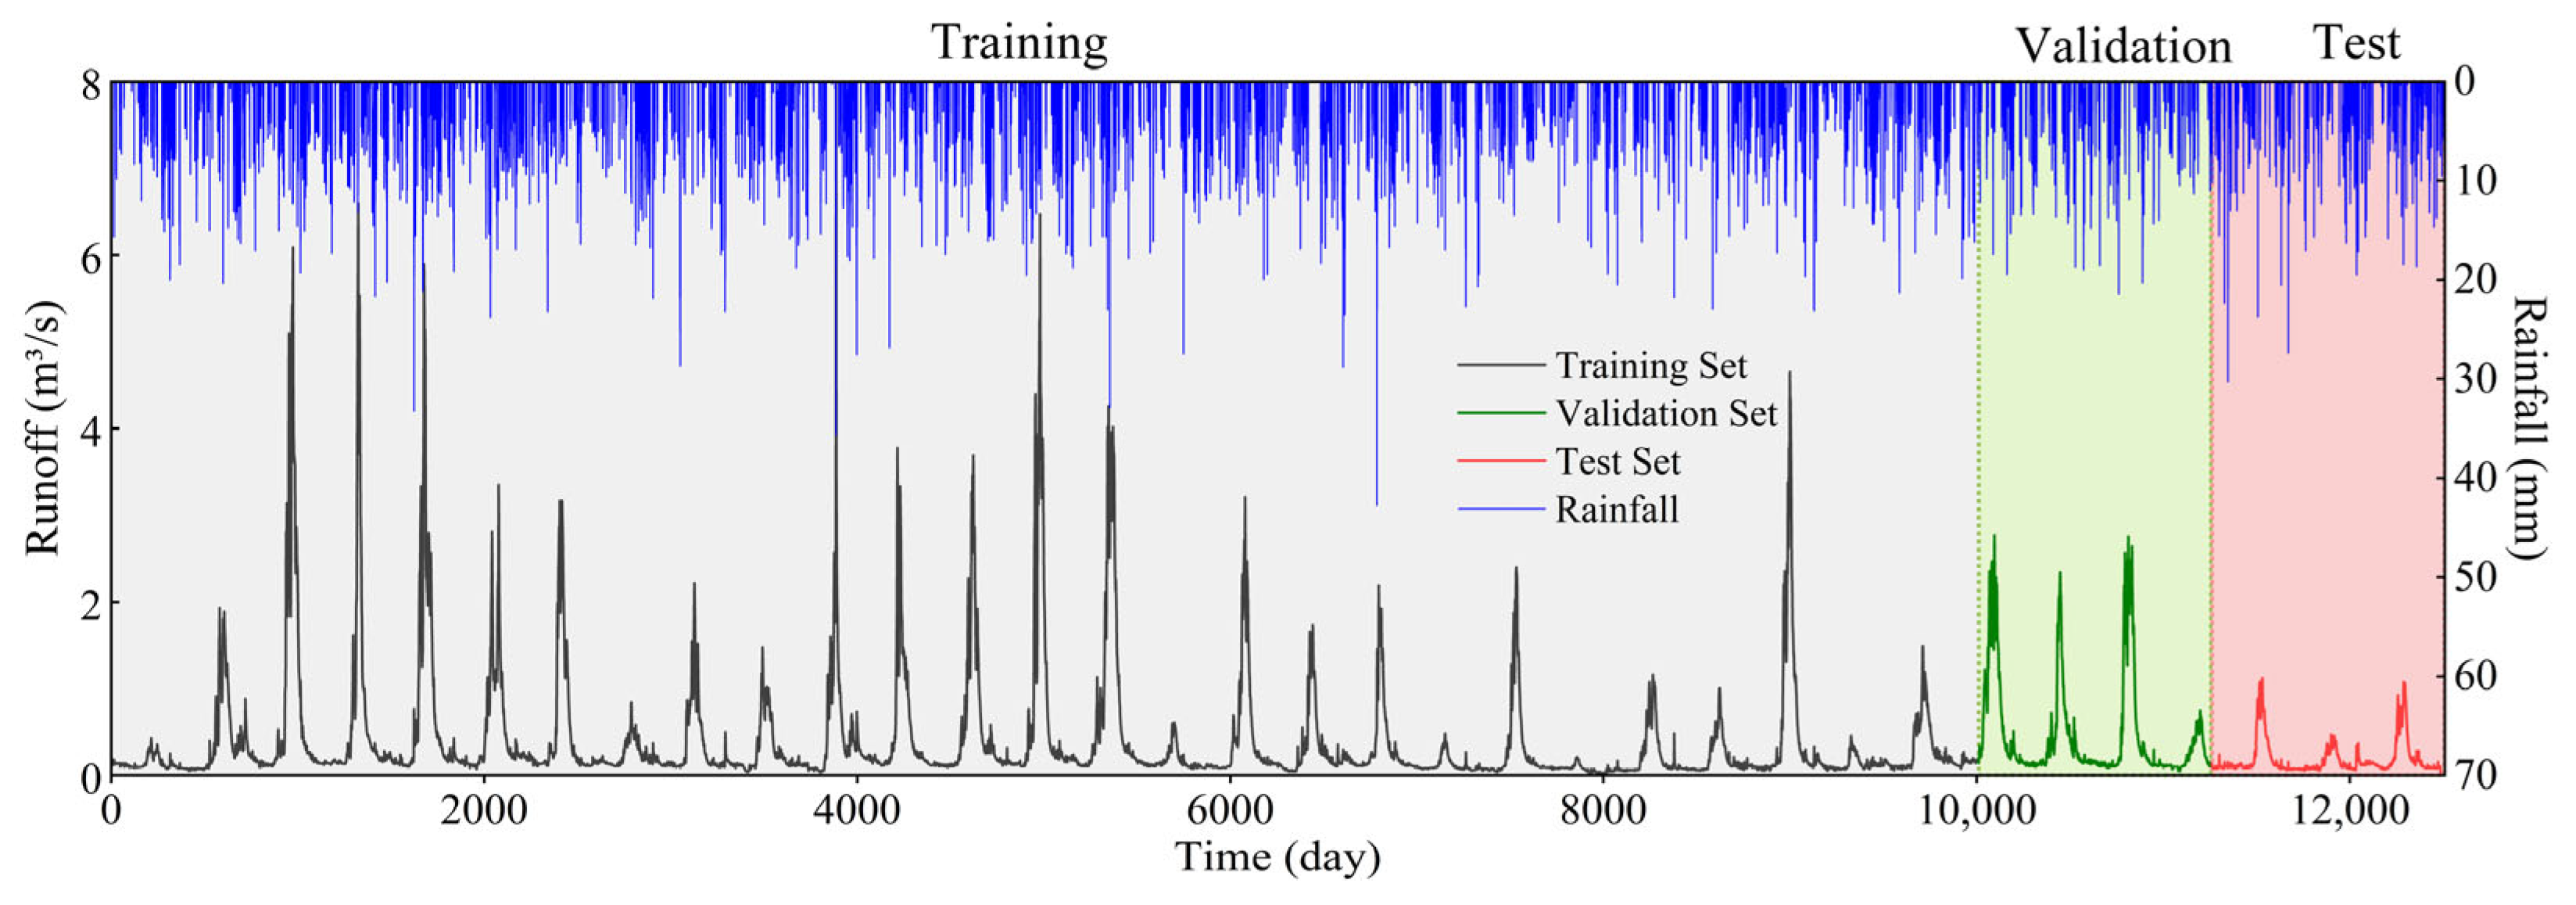
Meteorological and hydrological data used in this study were obtained from the Catchment Attributes and Meteorology for Large-sample Studies (CAMELS) dataset [56]. The daily hydroclimatic records include precipitation (PRE), snow water equivalent (SWE), air temperature (AT), and potential evapotranspiration (PET), spanning from 1 October 1980, to 31 December 2014 (a total of 12,510 days). For time-series runoff forecasting tasks, the dataset was chronologically divided into three subsets, including training set, validation set, and test set (Figure 2). Specifically, the training set accounted for 80% of the total data, covering 1 October 1980 to 24 February 2008 (10,008 days). The validation set occupied 10% of the total data, ranging from 25 February 2008 to 29 July 2011 (1251 days). The remaining 10% formed the test set, extending from 30 July 2011 to 31 December 2014 (1251 days).

2.3. Constructing Runoff Prediction Model

2.3.1. UD-ML Optimization Algorithm

The large number of hyperparameters and their wide value ranges result in an extremely huge search space, which poses a considerable challenge in determining an appropriate number of trials when using UD to found optimal hyperparameter combinations. UD was selected for this task due to its excellent space-filling capability. It achieved uniform coverage of the entire parameter domain with a small number of trials, making it highly suitable for a large-scale hyperparameter search. Specifically, a limited number of trials (≤100) led to sparse sampling in a vast search space, which may fail to identify the global optimum. Conversely, a large number of trials (≥2000) would substantially increase computational costs. To tackle this trade-off between search sufficiency and computational cost, meta-learning was introduced to improve tuning efficiency by reusing historical optimization experience, and a meta-learner trained on historical experience was adopted to produce simulated outcomes for a large number of trials (≥2000), which greatly reduced the required experimental iterations and improved the optimization accuracy. Accordingly, this study proposed a hyperparameter optimization framework integrating UD and ML, aiming to improve the efficiency and robustness of hyperparameter tuning for Transformer-based runoff prediction models.
In the UD-ML optimization algorithm, a Multilayer Perceptron (MLP) was used as the backbone of the meta-learner, consisting of an input layer, hidden layers, and an output layer [57]. Four hyperparameters were selected for optimization in the MLP meta-learner, yielding 300 trial configurations. The 300 candidate configurations were determined via extensive preliminary trials. Pre-tests demonstrated that this hyperparameter search setting achieved stable optimization performance. Increasing the number of configurations only yielded negligible performance improvement but substantially elevated computational consumption. Each configuration was trained for 500 epochs. The search ranges were defined as follows: the number of hidden layer neurons ([10, 1000], [10, 300], [100, 3000]), the number of hidden layers ([2, 10], [2, 6], [4, 10]), learning rate settings {0.00001, 0.0001, 0.001, 0.01}, and optimizer types {SGD, Adam, RMSprop}. Three different hyperparameter search spaces were constructed by adopting distinct boundary configurations for the number of neurons and hidden layers.

2.3.2. Modified Transformer Model

The Transformer is a deep learning architecture based on the self-attention mechanism to overcome the inherent inefficiency and insufficient long-range dependency modeling of traditional Recurrent Neural Networks (RNNs) in sequential data processing. Its multi-head attention mechanism supports parallel computation across multiple independent attention heads to capture diverse local and global dependencies within sequences across distinct subspaces, thus effectively enhancing model expressiveness and generalization capability [58,59]. The conventional Transformer adopts an encoder–decoder architecture, consisting of embedding layers, positional encoding, linear layers, and the Softmax layers. The encoder extracts contextual features from input sequences via stacked multi-head self-attention and feed-forward network modules, whereas the decoder generates target sequences using masked self-attention to preserve causal dependencies.
To adapt to the requirements of runoff prediction, this study adopted a modified Transformer architecture with key adjustments, detailed as follows: (1) Since runoff forecasting inputs are continuous numerical features rather than discrete tokens, a linear-embedding layer replaced the word-embedding layer, projecting raw inputs into vector representations of the required dimension; (2) To ensure model outputs retain the original numerical characteristics of runoff values, a linear output layer suitable for regression replaced the Softmax layer, which is usually used for classification tasks; (3) To preserve the temporal sequence of runoff data and compensate for the lack of position awareness in the self-attention mechanism, trainable positional embeddings were dynamically generated during forward propagation. These positional embeddings were added to the linearly projected input vectors to form composite proxies, which were then fed into the encoder. All other components of the Transformer architecture remained unchanged.

2.3.3. UD-ML-Transformer Model

Leveraging advantages of Transformer in handling long-term sequential data and addressing numerous hyperparameters inherent in deep learning models, this study developed a UD-ML-Transformer model for runoff prediction by integrating the UD-ML hyperparameter optimization method within the modified Transformer as the core training architecture. In this model, the Transformer model contained 10 hyperparameters, generating 100 trial configurations. Each configuration was trained for 100 epochs with identical hyperparameter search ranges, as follows: data preprocessing methods (standardization or normalization), embedding dimension {64, 80, 96}, number of multi-head attention heads {2, 4, 8}, number of encoder–decoder layers [2, 6], number of neurons in fully connected layer [10, 300], batch size {16, 32, 64, 128, 256}, length of input sequence {30, 60, 90}, learning rate {0.00001, 0.0001, 0.001, 0.01}, optimizer type {SGD, Adam, RMSprop}, and dropout rate {0.1, 0.2, 0.3, 0.4, 0.5}.
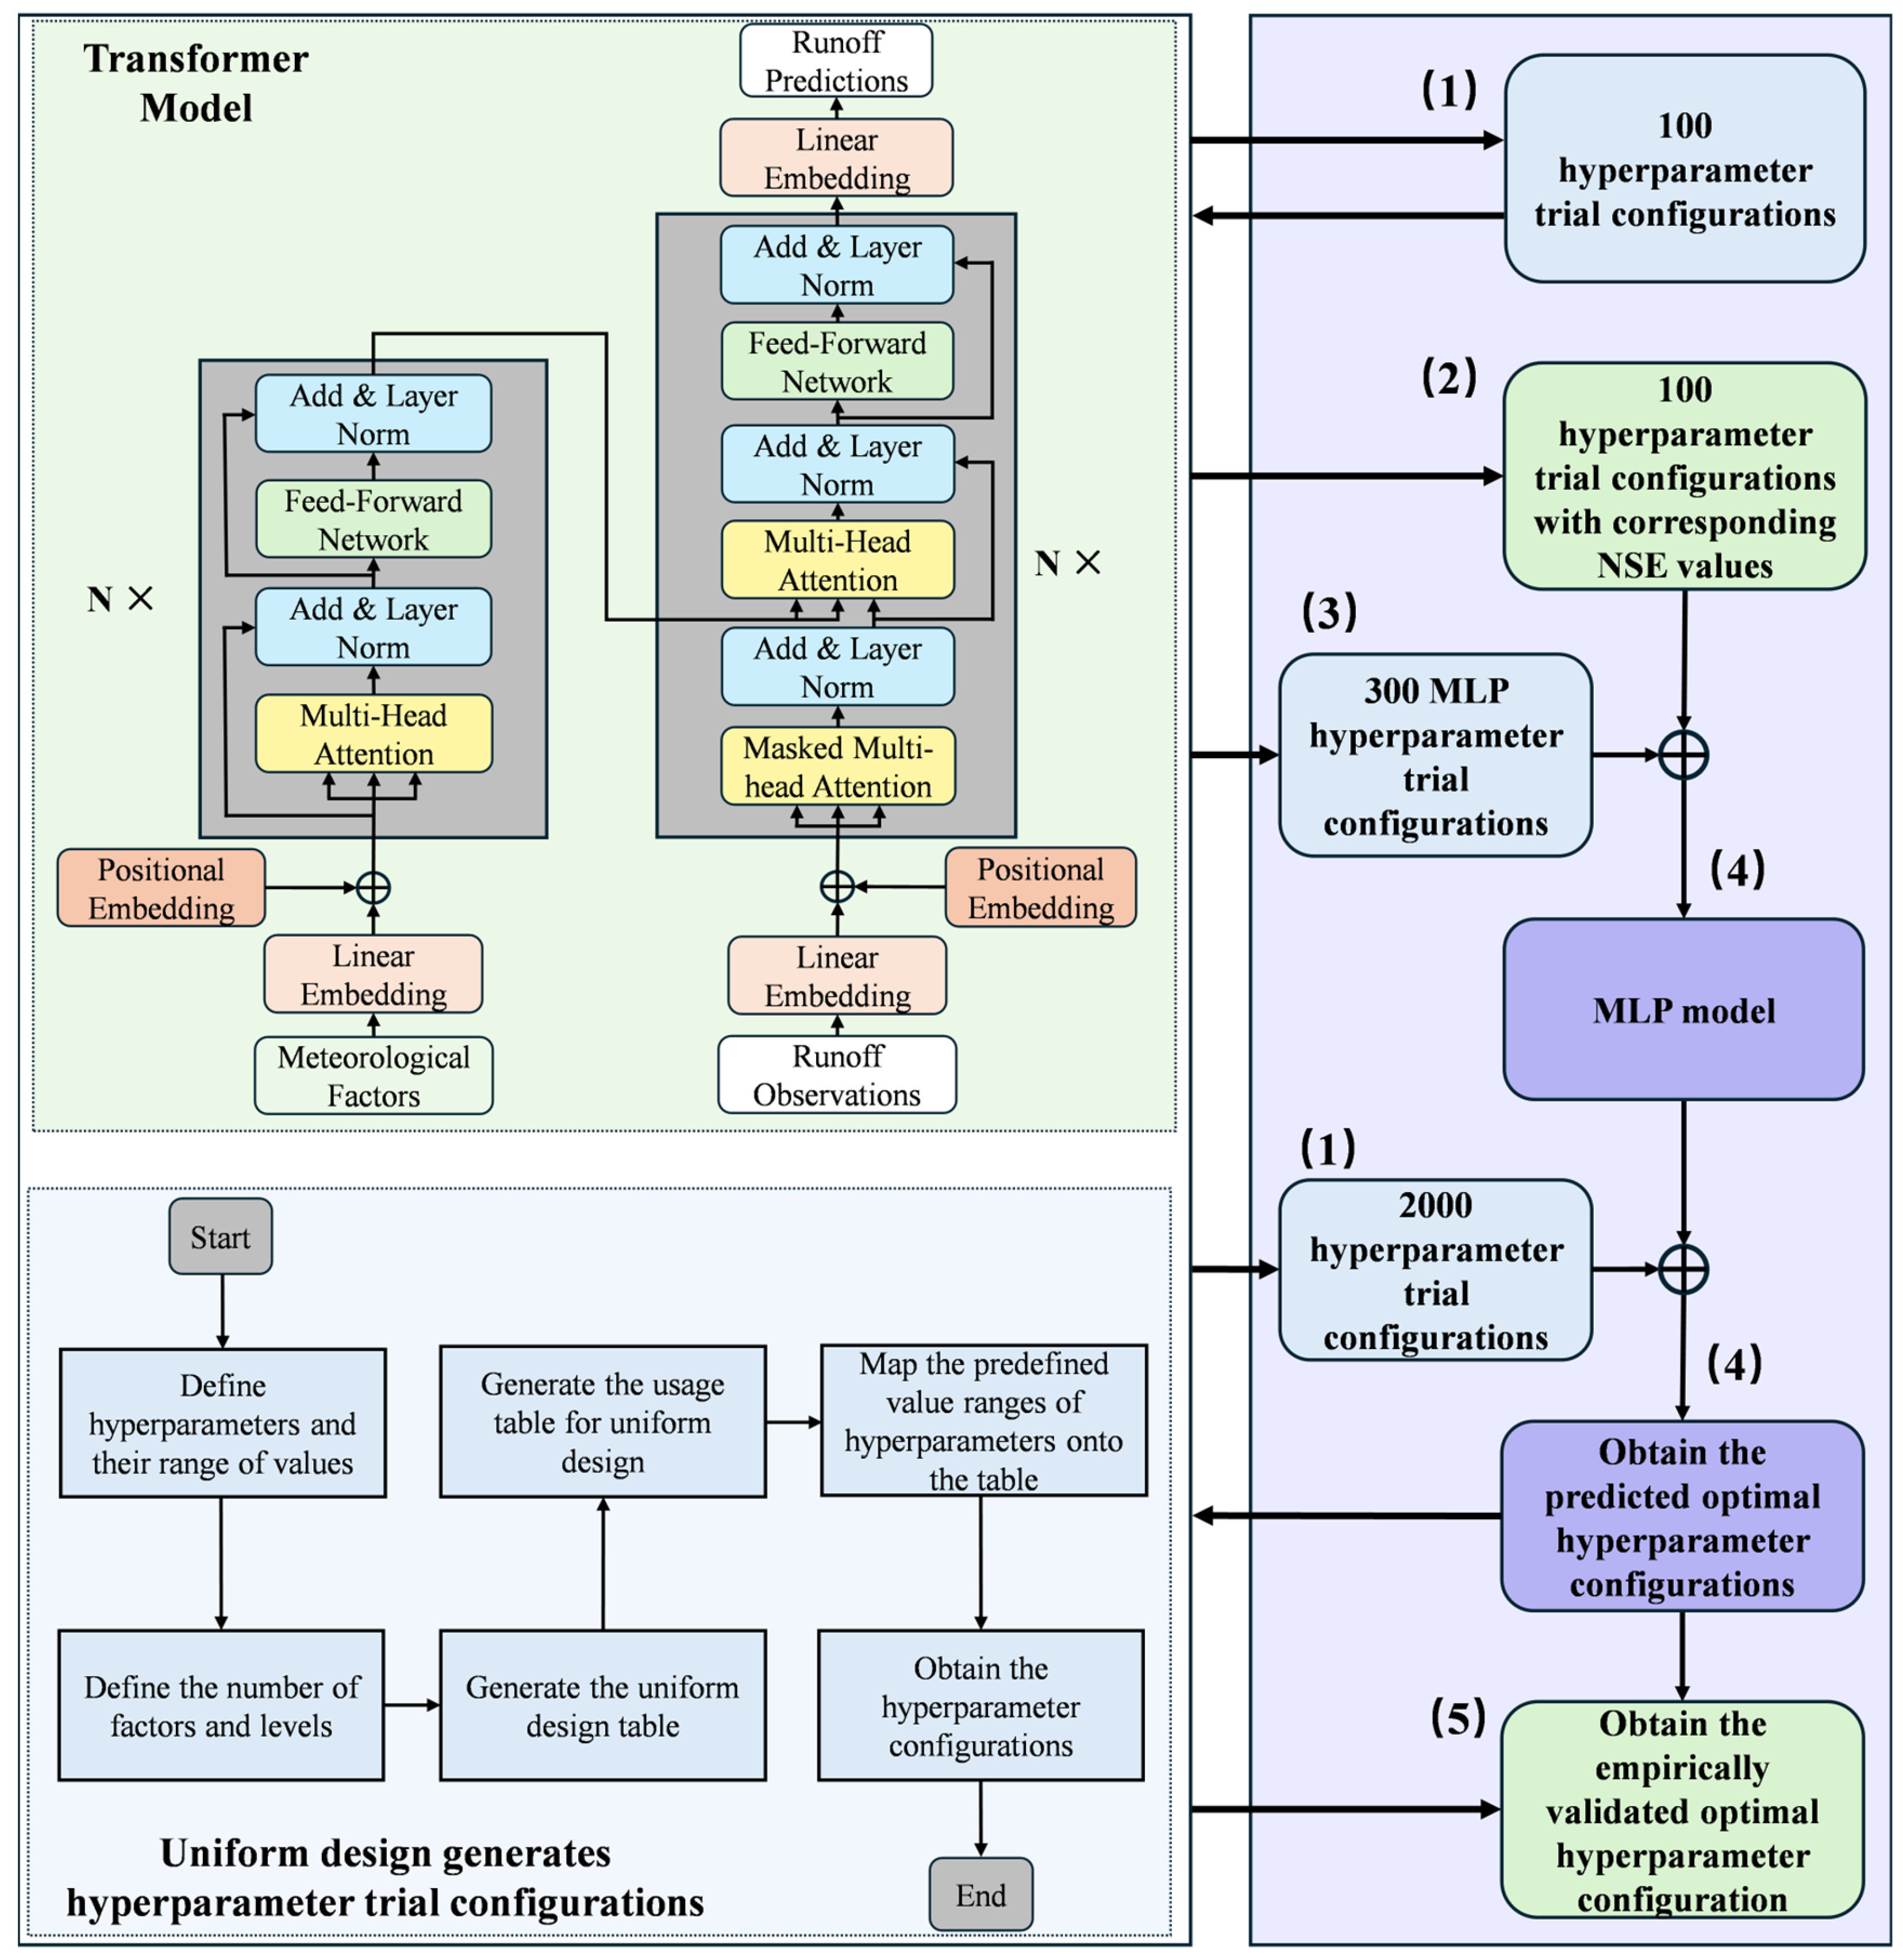
Additionally, a multi-step forecasting framework with a 7-day prediction horizon was adopted for short-term streamflow prediction. This forecast timescale matched the routine operational window of short-term hydrological forecasting, providing practical support for daily water resource scheduling and flood early warning [60]. A 1-day sliding window approach was used for continuous prediction updates. The 1-day sliding step was consistent with the daily sampling frequency of the hydroclimatic dataset adopted in this study, enabling effectively utilizing the latest hydrological information and avoiding redundancy in input sequence [61]. All experiments were implemented in Python 3.12, PyTorch 2.4, and Matlab 2022b, with acceleration on Tesla P100 GPUs via the Kaggle platform. The workflow of the proposed UD-ML-Transformer model was presented in Figure 3, and Algorithm 1 provides the pseudocode of the meta-learner with uniform design-based parameter tuning. The number of optimization trials and training epochs were determined based on pre-experimental convergence tests and mainstream configurations in existing hydrological deep learning studies. These settings guaranteed adequate model fitting, while avoiding excessive computational overhead. The key steps were summarized as follows:
(1)
Based on the 10 selected hyperparameters of the modified Transformer, an initial UD matrix was constructed via the good lattice point method. Taking the minimum centered discrepancy as the optimization objective, the optimal generator vector was identified through column-wise replacement and iterative search, ensuring uniform sampling distribution in the high-dimensional parameter space. Accordingly, two UD tables with 10 factors and 100/2000 levels were established. The discrete level indices were linearly mapped to the actual value ranges of each hyperparameter, finally yielding 100 and 2000 valid hyperparameter configuration sets for model training.
(2)
The modified Transformer model was trained and tested for 100 epochs using the 100 hyperparameter trial configurations, and the corresponding model training results were collected. These hyperparameter trial configurations and their associated performance results were combined to form the training set for the meta-learner.
(3)
Four hyperparameters with significant impacts on the MLP meta-learner performance were selected as optimization targets, namely the number of neurons in the hidden layer, the number of hidden layers, learning rate, and optimizer. A UD table with 4 factors and 100 levels was generated using the UD method, and 300 hyperparameter trial configurations were derived by setting three groups of different value ranges for the selected hyperparameters.
(4)
The meta-learner training set was input into the MLP meta-learner, which was then trained for 500 epochs to obtain a well-trained model. Subsequently, the 2000 hyperparameter trial configurations were fed into this trained meta-learner to generate simulated results. Only the best simulated result and its corresponding hyperparameter configuration were retained. By training the meta-learner with 300 hyperparameter trial configurations, one optimal simulated prediction result and its corresponding configuration were obtained per trial, resulting in a total of 300 optimal configurations.
(5)
Duplicate configurations were removed from the 300 optimal outcomes, and the remaining configurations were used as the parameter tuning schemes for the Transformer model. The Transformer model was trained and tested for 100 epochs using each of these configurations, and the hyperparameter scheme yielding the best test set result was identified as the optimal hyperparameter configuration for the Transformer model.
Algorithm 1. Meta-learner based on uniform design
Input:
Training dataset Dtrain: 100 hyperparameter trial configurations for Transformer and their corresponding training results (NSE)
Hyperparameter candidate table H: 300 hyperparameter trial configurations for meta-learners
Candidate scheme set to be predicted Dpred: 2000 hyperparameter trial configurations for Transformer
Output:
Optimal hyperparameter set Dpred′ and its predicted accuracy a
Best model parameters θ for each evaluated scheme
1:Split Dtrain into training (80%) and validation (20%) sets
2:for each hyperparameter scheme hi in H do
3: Create MLP model with He initialization
4: Set loss function to MAE (L1Loss) and L2 regularization (λ = 0.001)
5:Initialize best_loss ← ∞, best_params ← None
6:Initialize empty lists for training and validation losses
7:Initialize early stopping flag stop ← False
8:for epoch e = 1 to 500 do
9:  Perform one training step (forward, backward, update)
10:  Compute validation loss lval
11:  if lval < best_loss then
12:   best_loss ← lval
13:   Save current model parameters as best_params
14:  end if
15:  if e mod 10 = 0 then
16:   Find minimum validation loss among last 10 epochs, denote as lmin at epoch ek
17:   Store (lmin, ek) in list M
18:   ifM∣ ≥ 3 then
19:    Let (A, eA), (B, eB), (C, eC) be the last three entries
20:    if B < A and B < C and eA < eB <eC then
21:     Stop ← True, stop_epoch ← eB
22:     break
23:    end if
24:   end if
25:  end if
26:end for
27: Load best_params into model
28: Predict accuracies a on Dpred using the trained model
29: Identify index j = argmax a
30:Return Dpred′, a
31:end for
Italics represent variables, and bold type indicates reserved keywords of the pseudocode.

2.4. Shapely Additive Explanations (SHAP)

In this study, the Shapley Additive Explanations (SHAP) was employed to explain the proposed model. The SHAP is an explanatory framework for machine learning that primarily uses game theories to quantitatively decompose the contribution of each input feature to individual prediction [62]. The formula was presented as follows:
y i = y b a s e + ϕ i 1 + ϕ i 2 + + ϕ i j
where ybase is the average model prediction across a background dataset, and ϕij represents the SHAP value for the j-th feature of the i-th sample. A positive SHAP value (ϕij > 0) indicates that the feature positively contributes to the prediction, increasing the predicted value. Conversely, a negative SHAP value (ϕij < 0) suggests the feature exerts a negative influence, decreasing the predicted value.

2.5. Evaluation Metrics

In this study, four widely used evaluation metrics [63], including the Nash-Sutcliffe Efficiency (NSE), Mean Squared Error (MSE), Mean Absolute Error (MAE), and Root Mean Squared Error (RMSE), were adopted to assess prediction performance of the proposed UD-ML-Transformers model against five benchmark models, namely PSO-Transformer, UD-Transformer, PSO-RWKV, UD-RWKV, and UD-ML-RWKV. The formulas were presented as follows:
NSE = 1 i = 1 n ( y i y ^ i ) 2 i = 1 n ( y i y ¯ ) 2
MSE = 1 n i = 1 n ( y i y ^ i ) 2
MAE = 1 n i = 1 n | y i y ^ i |
RMSE = 1 n i = 1 n ( y i y ^ i ) 2
where n denotes the sample size, yi represents the observed runoff value of the i-th sample, ŷi signifies the predicted runoff value of the i-th sample, and ȳ indicates the mean observed runoff value across all samples.

3. Results and Discussion

3.1. Advantages of UD-ML-Transformer Model

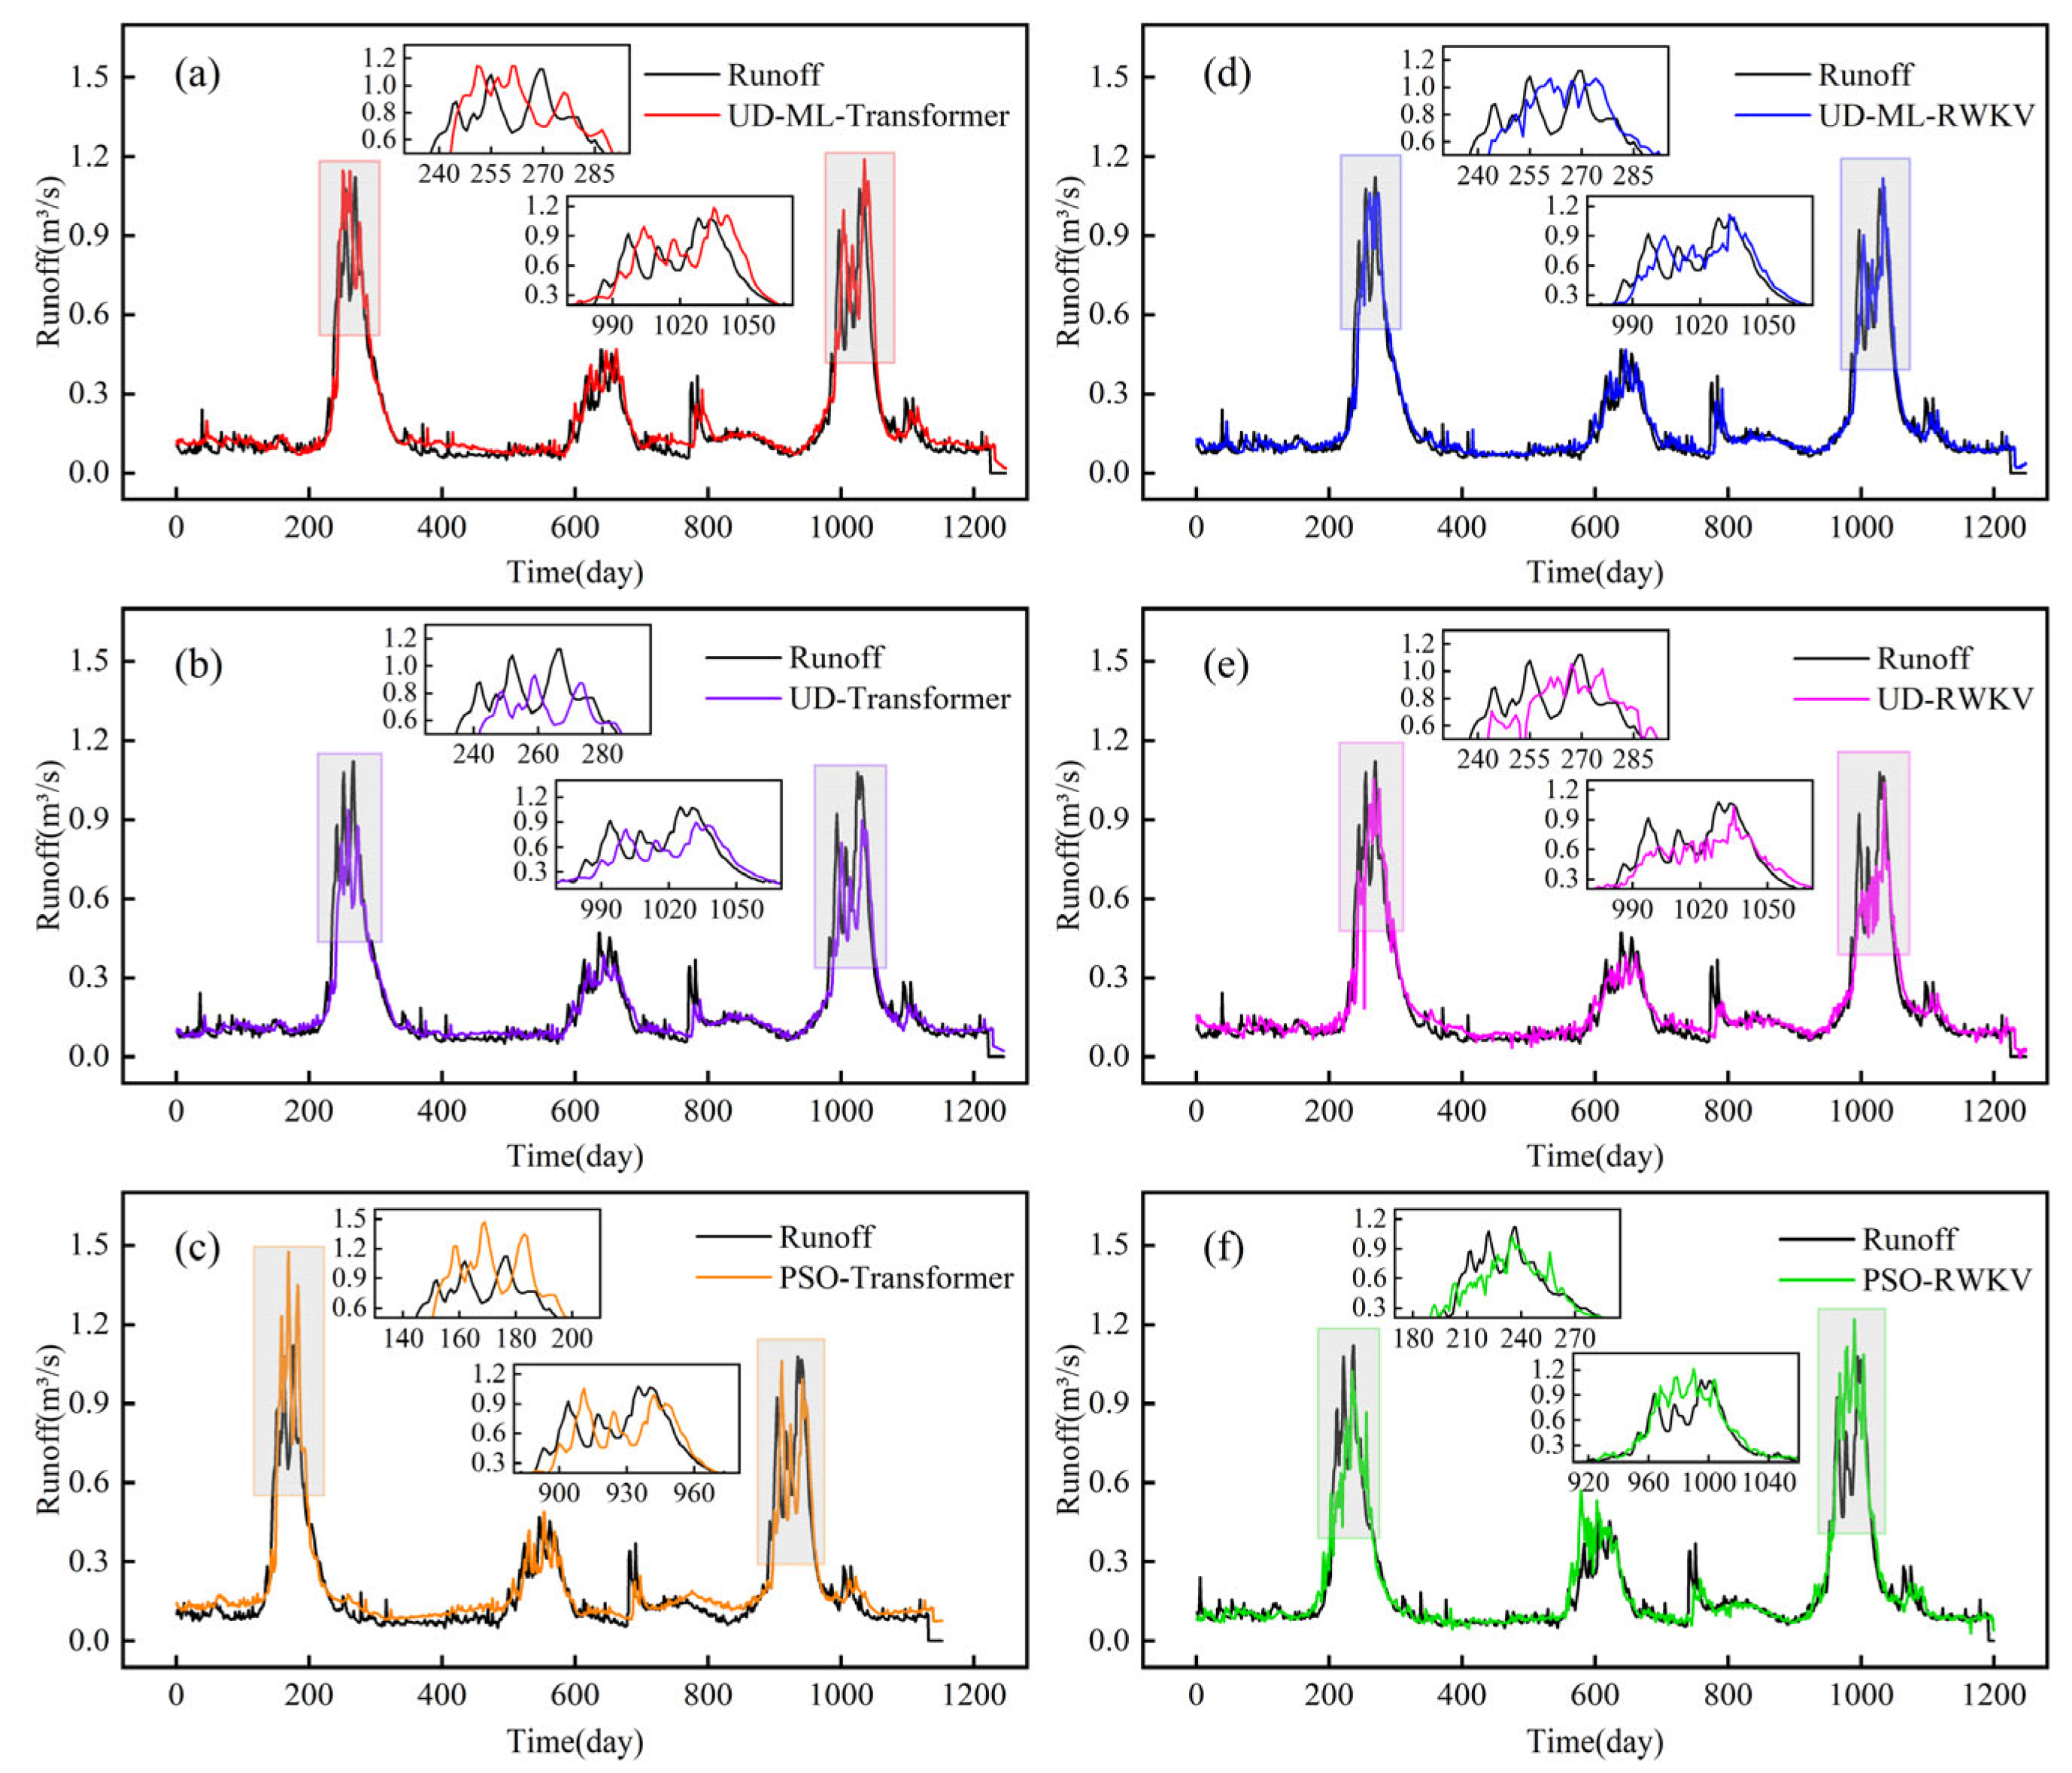
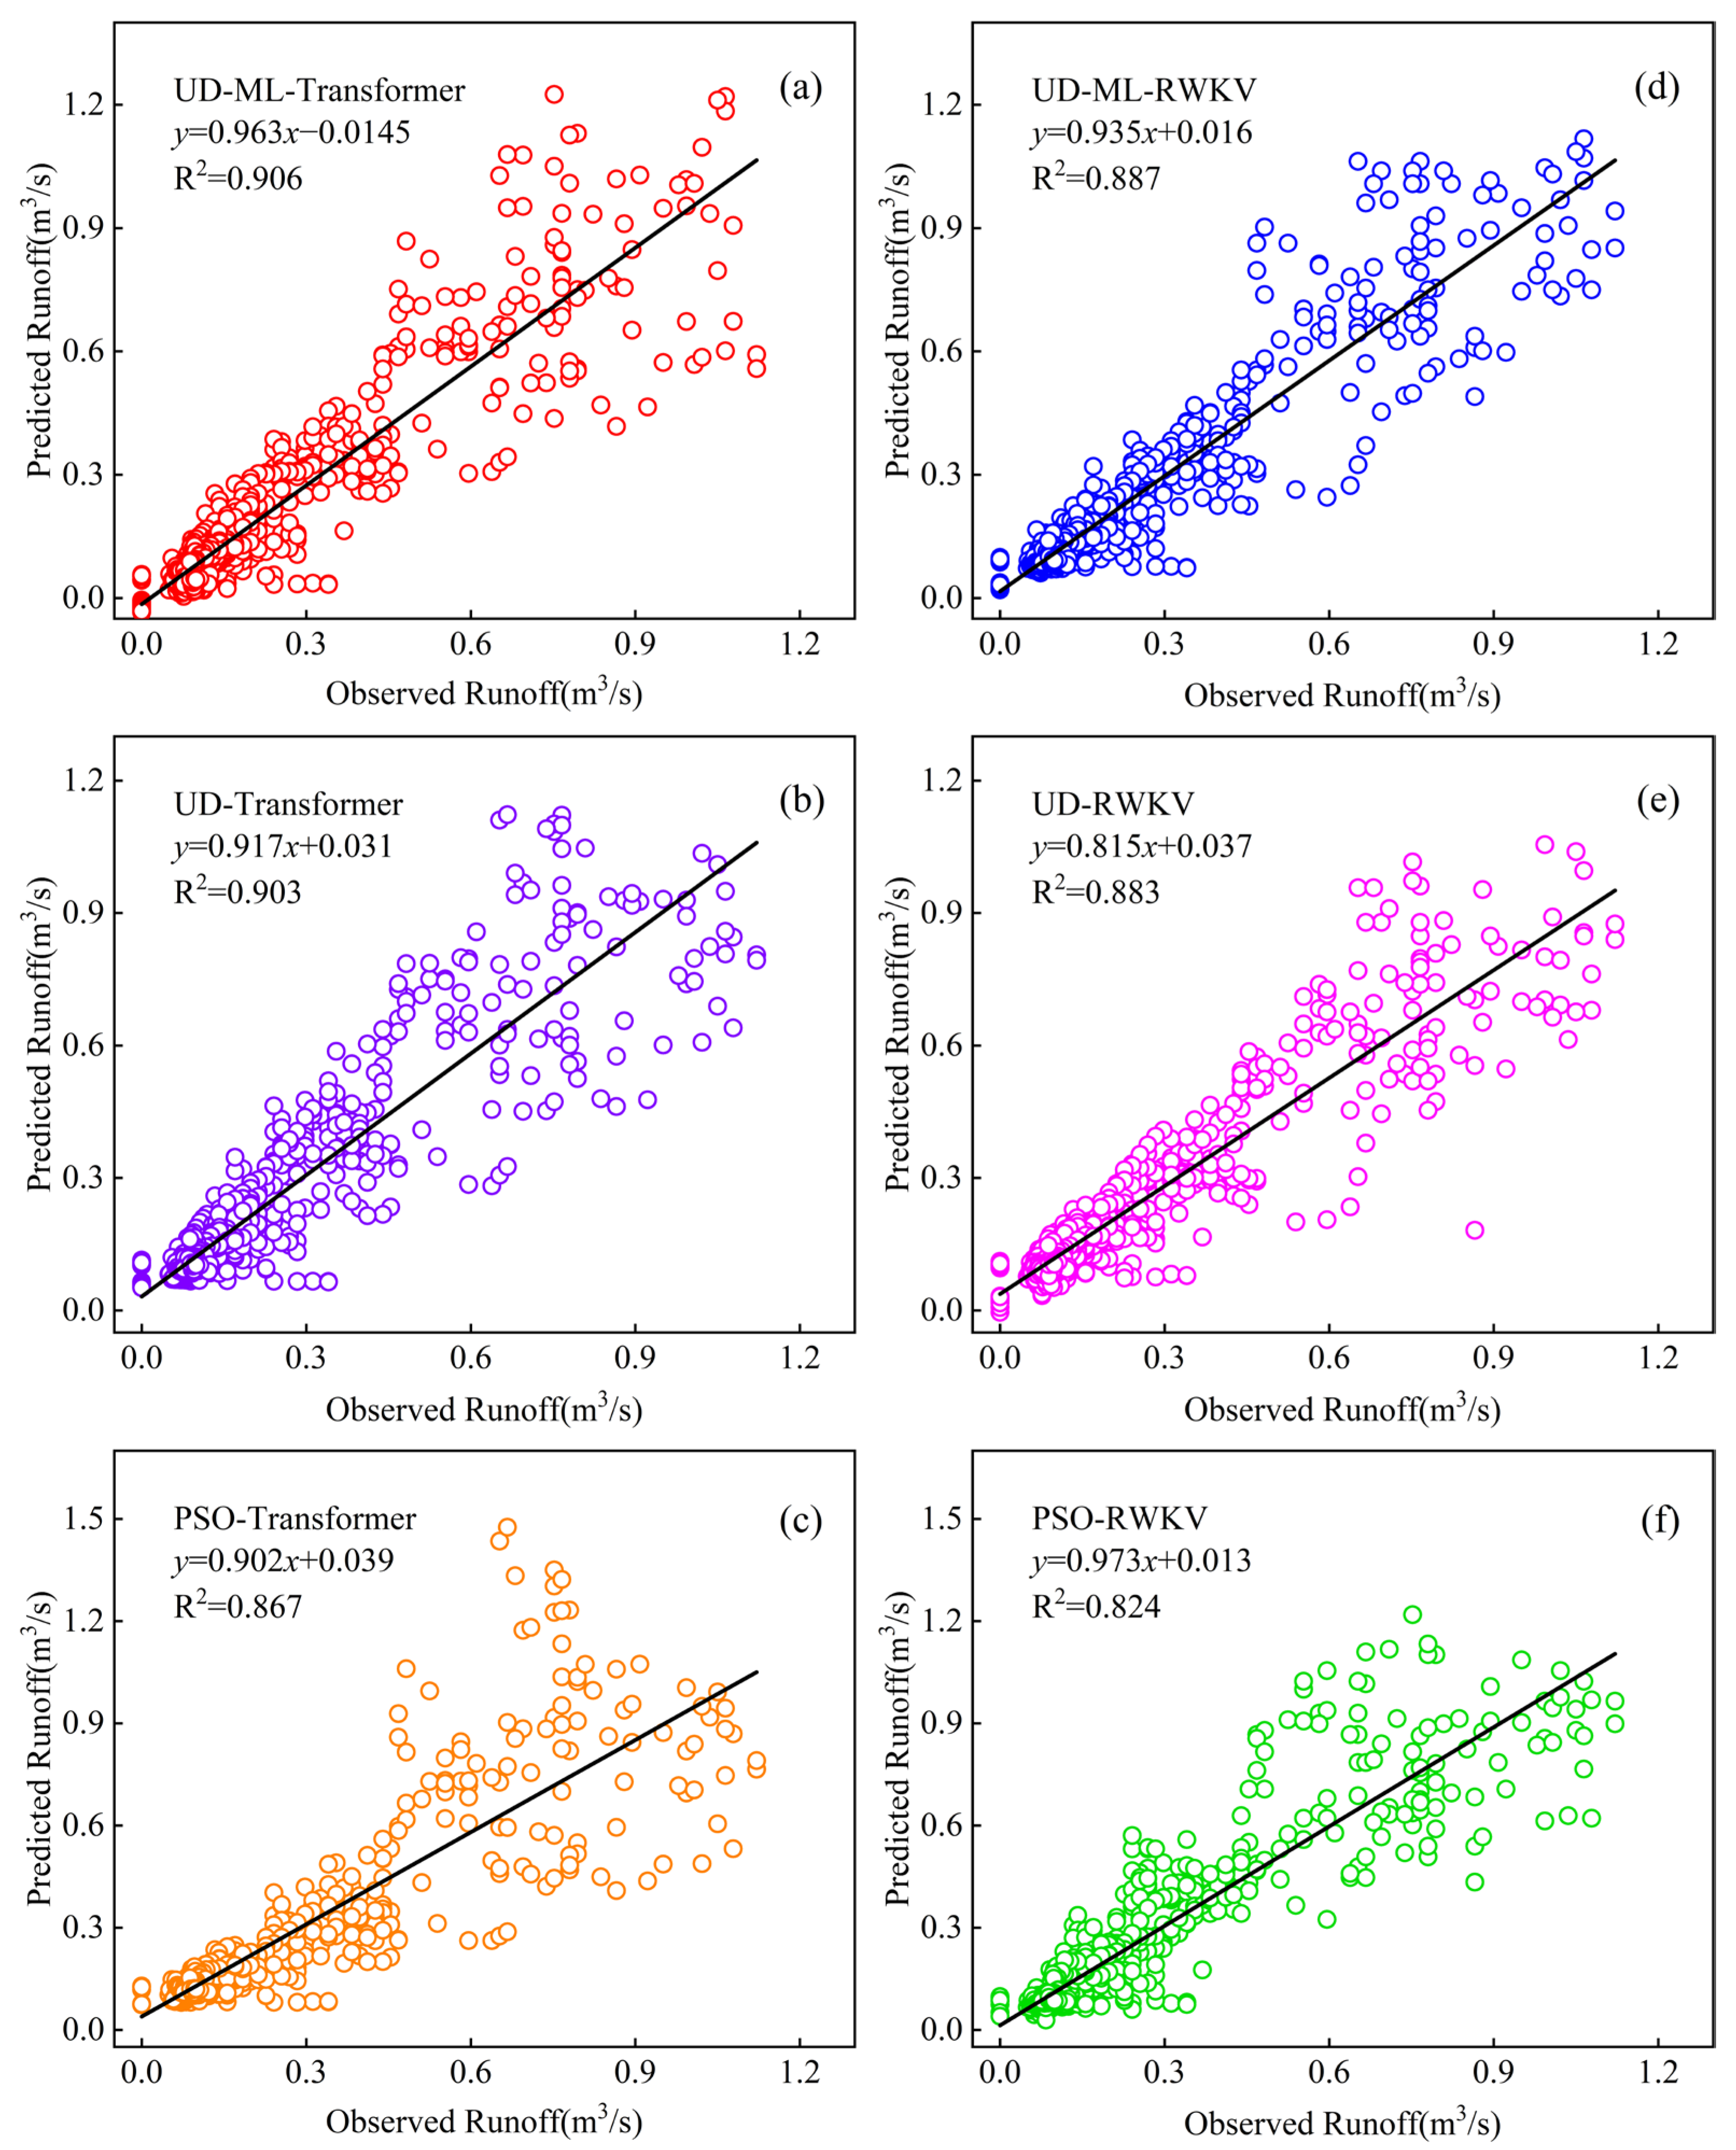
To comprehensively evaluate the performance of the proposed UD-ML-Transformer model, its prediction performance was compared against the five benchmark models, namely PSO-Transformer, UD-Transformer, PSO-RWKV, UD-RWKV, and UD-ML-RWKV models on the Rio Pueblo de Taos test dataset. All models were trained and validated under the same experimental settings and hyperparameter value ranges for fair comparison. Evaluation metrics of each model were listed in Table 1. Simulated hydrographs with peak flows were presented in Figure 4, and linear regression plots were presented in Figure 5.
As expected, the proposed UD-ML-Transformer significantly outperformed all five benchmark models. Specifically, it achieved the highest NSE (0.906), and the lowest MSE (0.004), RMSE (0.062), and MAE (0.034) among all six models, demonstrating a substantial improvement in prediction accuracy. The simulated hydrograph (Figure 4a) further confirmed its superior ability to capture temporal dynamics of runoff, with the highest Goodness of Fit (R2 = 0.906 in Figure 5a), and it also exhibited better prediction for peak flow events (e.g., Days 240–285 and 990–1050). When compared with the two based-Transformer models (PSO-Transformer and UD-Transformer), the UD-ML-Transformer model maintained its superiority. The UD-ML-Transformer model outperformed the PSO-Transformer with NSE increasing by 4.50%, and MSE, RMSE, and MAE decreasing by 33.33%, 17.33%, and 12.82%, respectively. Compared to the UD-Transformer, the UD-ML-Transformer exhibited comparable performance under low-flow conditions but superior peak flow capture, with RMSE and MAE reduced by 0.002 and 0.001, respectively. This demonstrated that integrating UD and ML modules into Transformer framework led to improvements in the runoff simulations of standalone UD module embedding in Transformer model. Significant improvements were also observed in Transformer-based models over the alternative RWKV-based benchmark models (PSO-RWKV, UD-RWKV and UD-ML-RWKV). The UD-ML-Transformer achieved a 2.14% increase in NSE, along with a 7.46% decrease in RMSE and an 8.11% decrease in MAE compared with UD-ML-RWKV. Among the three RWKV-based models, UD-ML-RWKV outperformed UD-RWKV and PSO-RWKV, with NSE increasing by 0.45% and 7.65%, MSE declining by 20% and 42.86%, RMSE declining by 1.47% and 21.18%, and MAE declining by 2.63% and 13.95%, respectively. This result confirms the strong generalization of UD-ML hyperparameter optimization methods, which can be effectively applied to various model architectures.
In summary, Transformer-based models performed better than the RWKV-based models in sequential prediction. Within time series prediction tasks, the self-attention mechanism weighs various segments of the input sequence, enabling flexible information organization and ensuring that the model can focus on historical data most relevant to the current prediction. Additionally, the encoder–decoder structure of the Transformer architecture not only enhances understanding of the relationships between inputs and outputs but also allows for more flexible and efficient handling of different types of time series data [64,65]. Moreover, the proposed UD-ML-Transformer runoff prediction model outperformed the five benchmark models by integrating the predictive capability of Transformer architecture in complex long-sequence data, the efficient exploration capability of UD in high-dimensional parameter spaces, and the experience transfer capability of the ML module. These synergistic advantages enabled the model to deliver excellent performance in multi-step runoff prediction.

3.2. Robustness of Peak Flow Prediction

Accurate peak flow forecasting is critical for flood disaster prevention and mitigation, as it directly contributes to reducing potential casualties and economic losses associated with flood events [66]. To further validate the robustness of the proposed UD-ML-Transformer model in predicting extreme runoff events, the top 10–20% runoff data from the Rio Pueblo de Taos test set were extracted and evaluated. The values of evaluation metrics (MSE, RMSE, and MAE) for each model are listed in Table 2.
The proposed UD-ML-Transformer model maintained its superior performance for peak flow prediction (Figure 4a–f), achieving the lowest MSE (0.013), RMSE (0.117), and MAE (0.063) among all six models. Compared to PSO-Transformer, the UD-ML-Transformer reduced the MSE by 48.00%, the RMSE by 26.42%, and the MAE by 33.68%. Even when compared to the closest UD-Transformer model, the UD-ML-Transformer still achieved marginal improvements in peak prediction (MSE: 0.013 vs. 0.014; RMSE: 0.117 vs. 0.118; MAE: 0.063 vs. 0.074), further confirming the advantage of integrating the ML module for capturing extreme hydrological events. Despite modest improvements in peak flow accuracy, minor refinements in simulating peak timing and magnitude can yield substantial practical benefits for flood early warning and watershed risk management, which effectively reduce the under- or overestimation of extreme runoff events. In addition, UD-ML-Transformer also outperformed all RWKV-based models in peak runoff prediction. This is attributed to the inherent robustness of the Transformer architecture in modeling nonlinear and non-stationary data relationships, as well as the synergistic effects of the UD-ML optimization strategy, which identifies optimal hyperparameters for extreme event modeling. Collectively, these features enable the UD-ML-Transformer to exhibit exceptional robustness and stability in peak flow prediction.
Qualitative analysis revealed distinct patterns across the six models in peak flow simulation. PSO-optimized models (PSO-Transformer and PSO-RWKV) consistently overestimated peak magnitudes, with PSO-RWKV showing the most pronounced overprediction. In contrast, UD-based models (UD-Transformer and UD-RWKV) moderately underestimated peak discharges, while the integrated UD-ML models achieved the optimal agreement with observed peaks, with minimal systematic bias. Additionally, the UD-ML-Transformer model exhibited superior peak timing accuracy with near-perfect temporal synchronization, whereas PSO-based models suffered from obvious phase shifts. Overall, Transformer-based architectures outperformed RWKV-based architectures in both peak magnitude and timing precision for extreme runoff events. The UD-ML optimization strategy effectively mitigated the underestimation of UD methods and the overestimation of PSO approaches, yielding the most reliable extreme flood simulation among all compared models.

3.3. Hyperparameter Optimization for Transformer-Based Models

Given the better performance of Transformer-based models compared to RWKV-based models, the following section only focused on Transformer-based models. The optimal hyperparameter configurations identified by PSO, UD, and UD-ML for the Transformer architecture on the Rio Pueblo de Taos test set were presented in Table 3. Both the UD-ML-Transformer and UD-Transformer employed more fully connected neurons in the hidden layer (197 and 189, respectively) compared to PSO-Transformer (97). This structural difference aligned with the complexity of runoff time series, as the expanded capacity captured long-term dependencies and nonlinear features, ensuring their superior accuracy. These two UD-based models also used larger training batches (64 and 256 vs. 16 for PSO-Transformer), which reduced gradient variance during updates, stabilized training, and enabled convergence to flatter minima, thus improving generalization to unseen data. Additionally, the two UD-based models adopted a higher learning rate (0.001 vs. 0.0001 for PSO-Transformer), accelerating training convergence and aiding in escaping local optima. Furthermore, the UD-ML-Transformer adopted the shortest input sequence (30 days vs. 60 days and 90 days for UD-Transformer and PSO-Transformer, respectively), confirming strong short-term autocorrelation, reducing noise and enhancing the attention mechanism’s focus on relevant time steps.
In summary, each hyperparameter serves a specific functional role during model training. Specifically, the input sequence length determined the range of historical information for runoff prediction, and the dropout was adopted to mitigate overfitting. Despite the black-box characteristics of deep learning framework that excludes explicit hydrological formulas, hyperparameter settings collectively regulated the fitting and generalization abilities of the network.
To evaluate optimization efficiency, the runtime of each model’s complete training cycle (including hyperparameter tuning) was recorded. The PSO-Transformer took 6 h 49 min 22 s to iterate through 100 hyperparameter trial configurations, exhibiting a relatively short runtime but moderate performance with an NSE of 0.867. Under the same hyperparameter search range, UD-Transformer required 12 h 32 min 11 s, yielding improved prediction accuracy with an NSE of 0.903 but at nearly double the runtime. However, to achieve denser sampling in the hyperparameter space (>2000 trials) for higher accuracy, the runtime of UD-Transformer would exceed 251 h, rendering it computationally prohibitive. In contrast, UD-ML-Transformer used a pre-trained meta-learner to simulate 2000 hyperparameter trials in only 24 h 35 min 13 s, while achieving a further improved NSE of 0.906. The meta-learner in UD-ML-Transformer enabled rapid generation of simulated forecasts for a large number of trial configurations. Within the same hyperparameter search space, it achieved denser experimental sampling, reducing the risk of local optima and increasing the likelihood of finding global optimal, thus reconciling optimization efficiency and predictive accuracy.

3.4. Explainability of UD-ML-Transformer Model

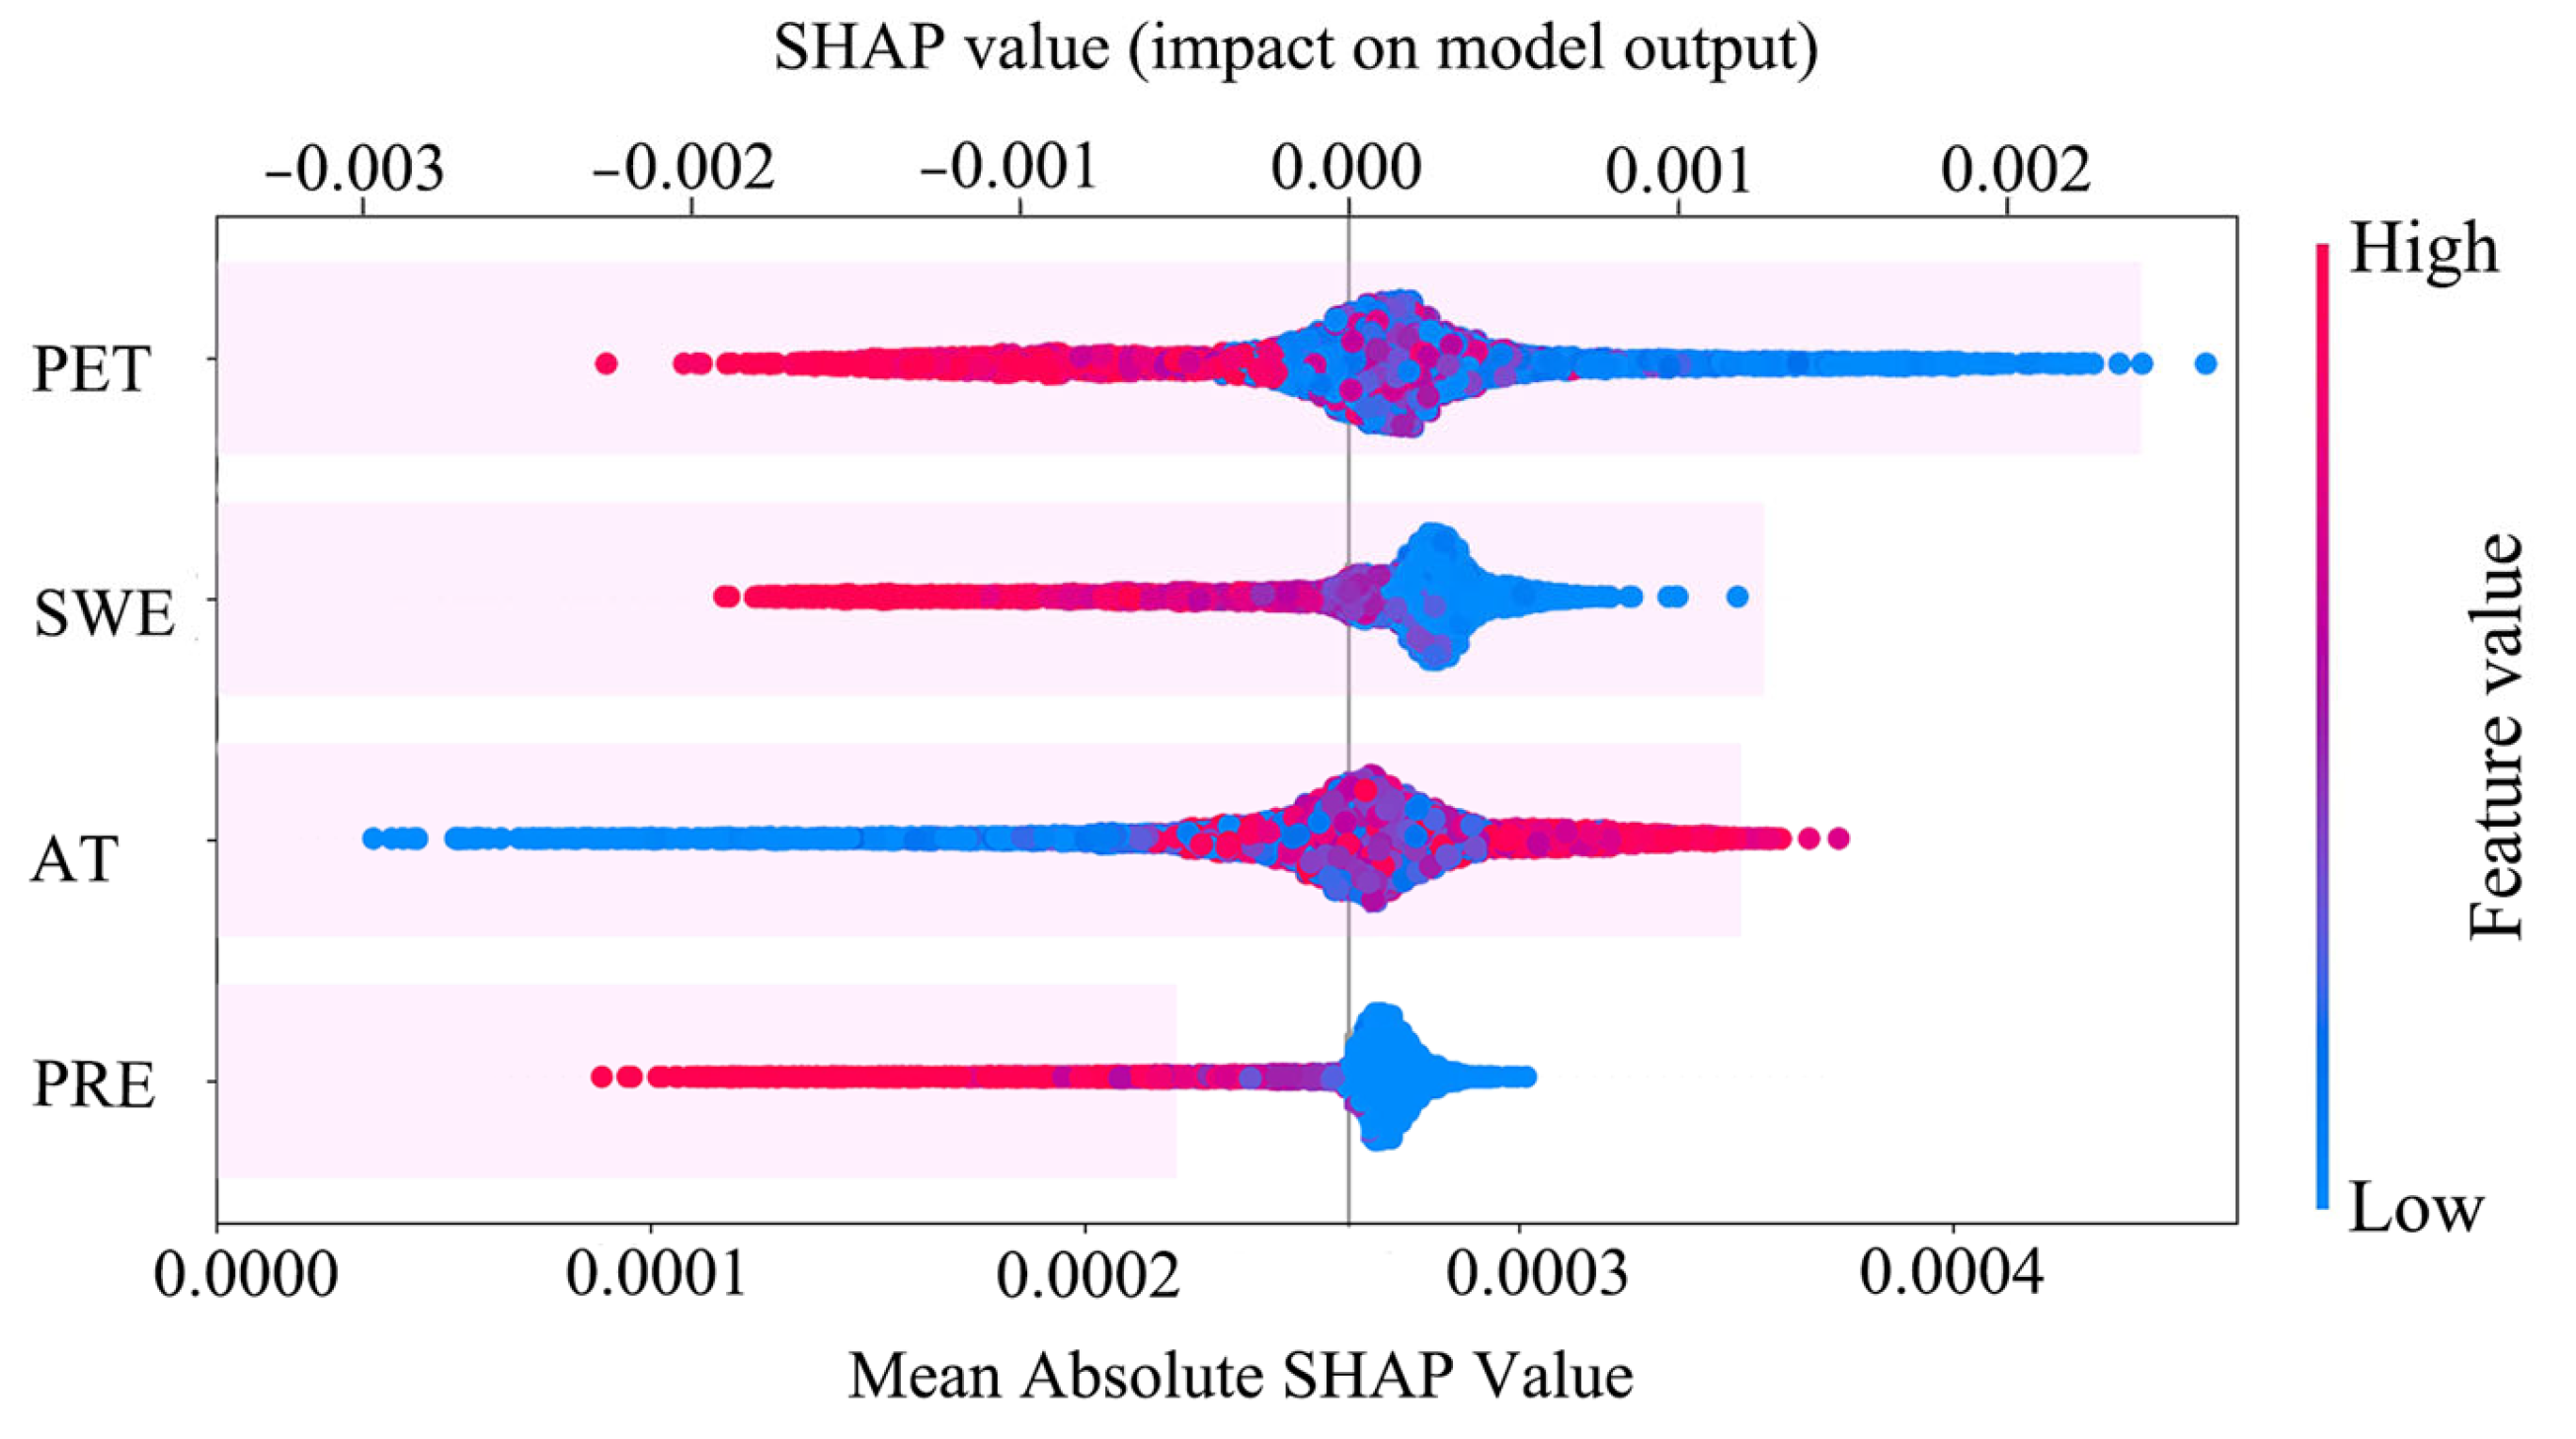
The SHAP values were calculated from the Rio Pueblo de Taos test set and visualized as shown in Figure 6. PET exerted the strongest impact on runoff predictions, with the highest mean absolute SHAP value of 0.00044. Specifically, high PET values corresponded to negative SHAP values, implying that increased PET may suppress runoff generation, while low PET values tended to positively promote runoff yield. SWE ranked the second and negative SHAP values under high SWE, indicating its inhibitory effect on immediate runoff generation, which is consistent with cold-region physical mechanisms. In high-altitude regions, snow accumulation stores water in watersheds and delays surface runoff response, which may explain its indirect but critical regulatory role in alpine runoff processes [67]. AT exhibited a distinct bidirectional effect that higher values were linked to positive SHAP values, while low values produced negative SHAP values. this pattern may be attributed to freeze–thaw dynamics in alpine watersheds. Low-temperature conditions accompanied by frozen soil and continuous snow cover may restrict soil infiltration and surface flow formation, thereby suppressing runoff yield. In contrast, rising temperatures promote snowmelt and soil thawing, activating hydrological fluxes and enhancing runoff generation capacity [68]. Additionally, precipitation exerted the weaker influence on runoff predictions, with a low mean absolute SHAP value of 0.00022, and asynchronous runoff-precipitation responses were also observed in Figure 2. This muted precipitation sensitivity may be associated with typical cold-region hydrological characteristics. In high-altitude watersheds, a considerable portion of precipitation occurs as snowfall and is temporarily stored in the snowpack rather than forming immediate runoff. Meanwhile, seasonally frozen soil acts as a low-impermeability layer that restricts infiltration, converting precipitation into evaporation or surface retention instead of effective runoff. Furthermore, sporadic and low-intensity precipitation in alpine watershed may fail to overcome soil storage thresholds, potentially resulting in delayed and indirect streamflow responses to precipitation inputs [69].

4. Model Applicability and Limitation

4.1. Applicability of UD-ML-Transformer Model

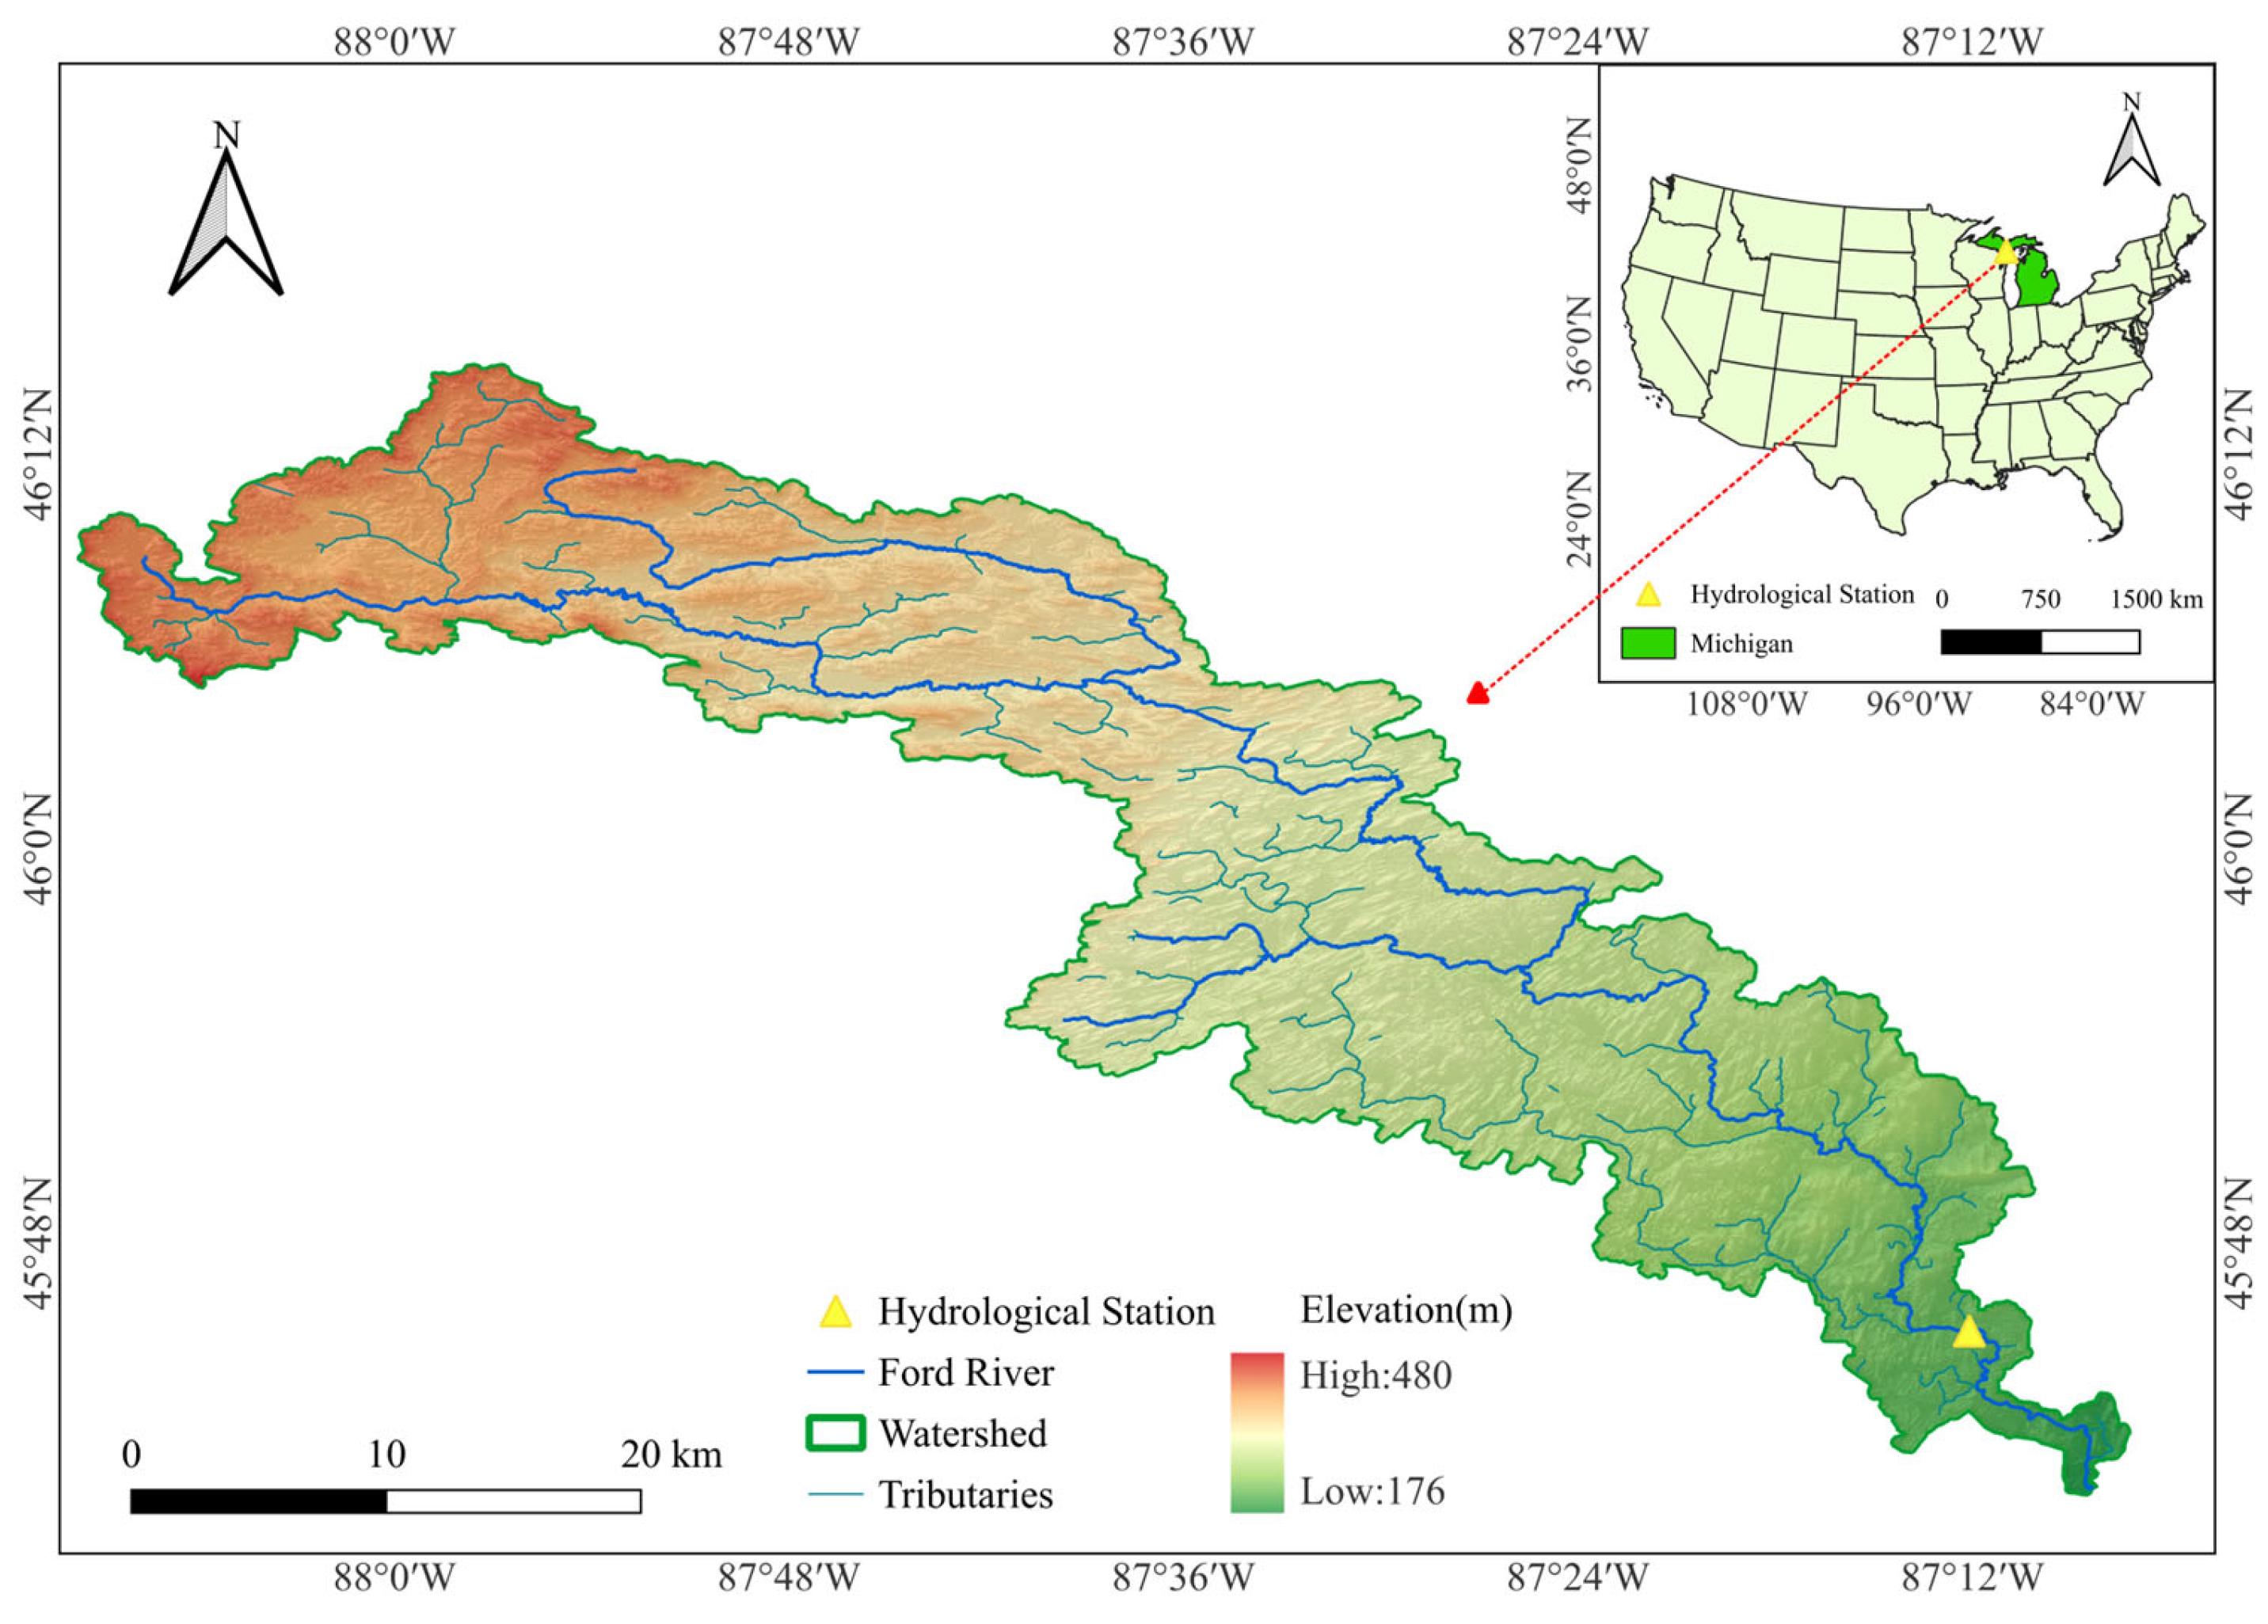
To further verify the applicability and generalization capability of the proposed UD-ML-Transformer model beyond its original validation area (the Rio Pueblo de Taos watershed, a high-altitude plateau mountain basin), cross-watershed validation was carried out on the Ford River watershed, a typical lowland river basin (Figure 7). Located in the southern part of the Upper Peninsula of Michigan, USA, the Ford River watershed spans latitudes of 45–46° N and longitudes of 87–88° W, covering a total drainage area of 1165.5 km2. The watershed exhibits a gently topographic slope from north to south, with a relatively low main-channel gradient. Characterized by a humid continental climate, the watershed experiences cold and snowy winters, and cool and humid summers. Hydrologically, spring snowmelt produces the dominant annual runoff peak, while summer rainfall events may generate secondary flood peaks, resulting in strong seasonal variability in the annual runoff regime.
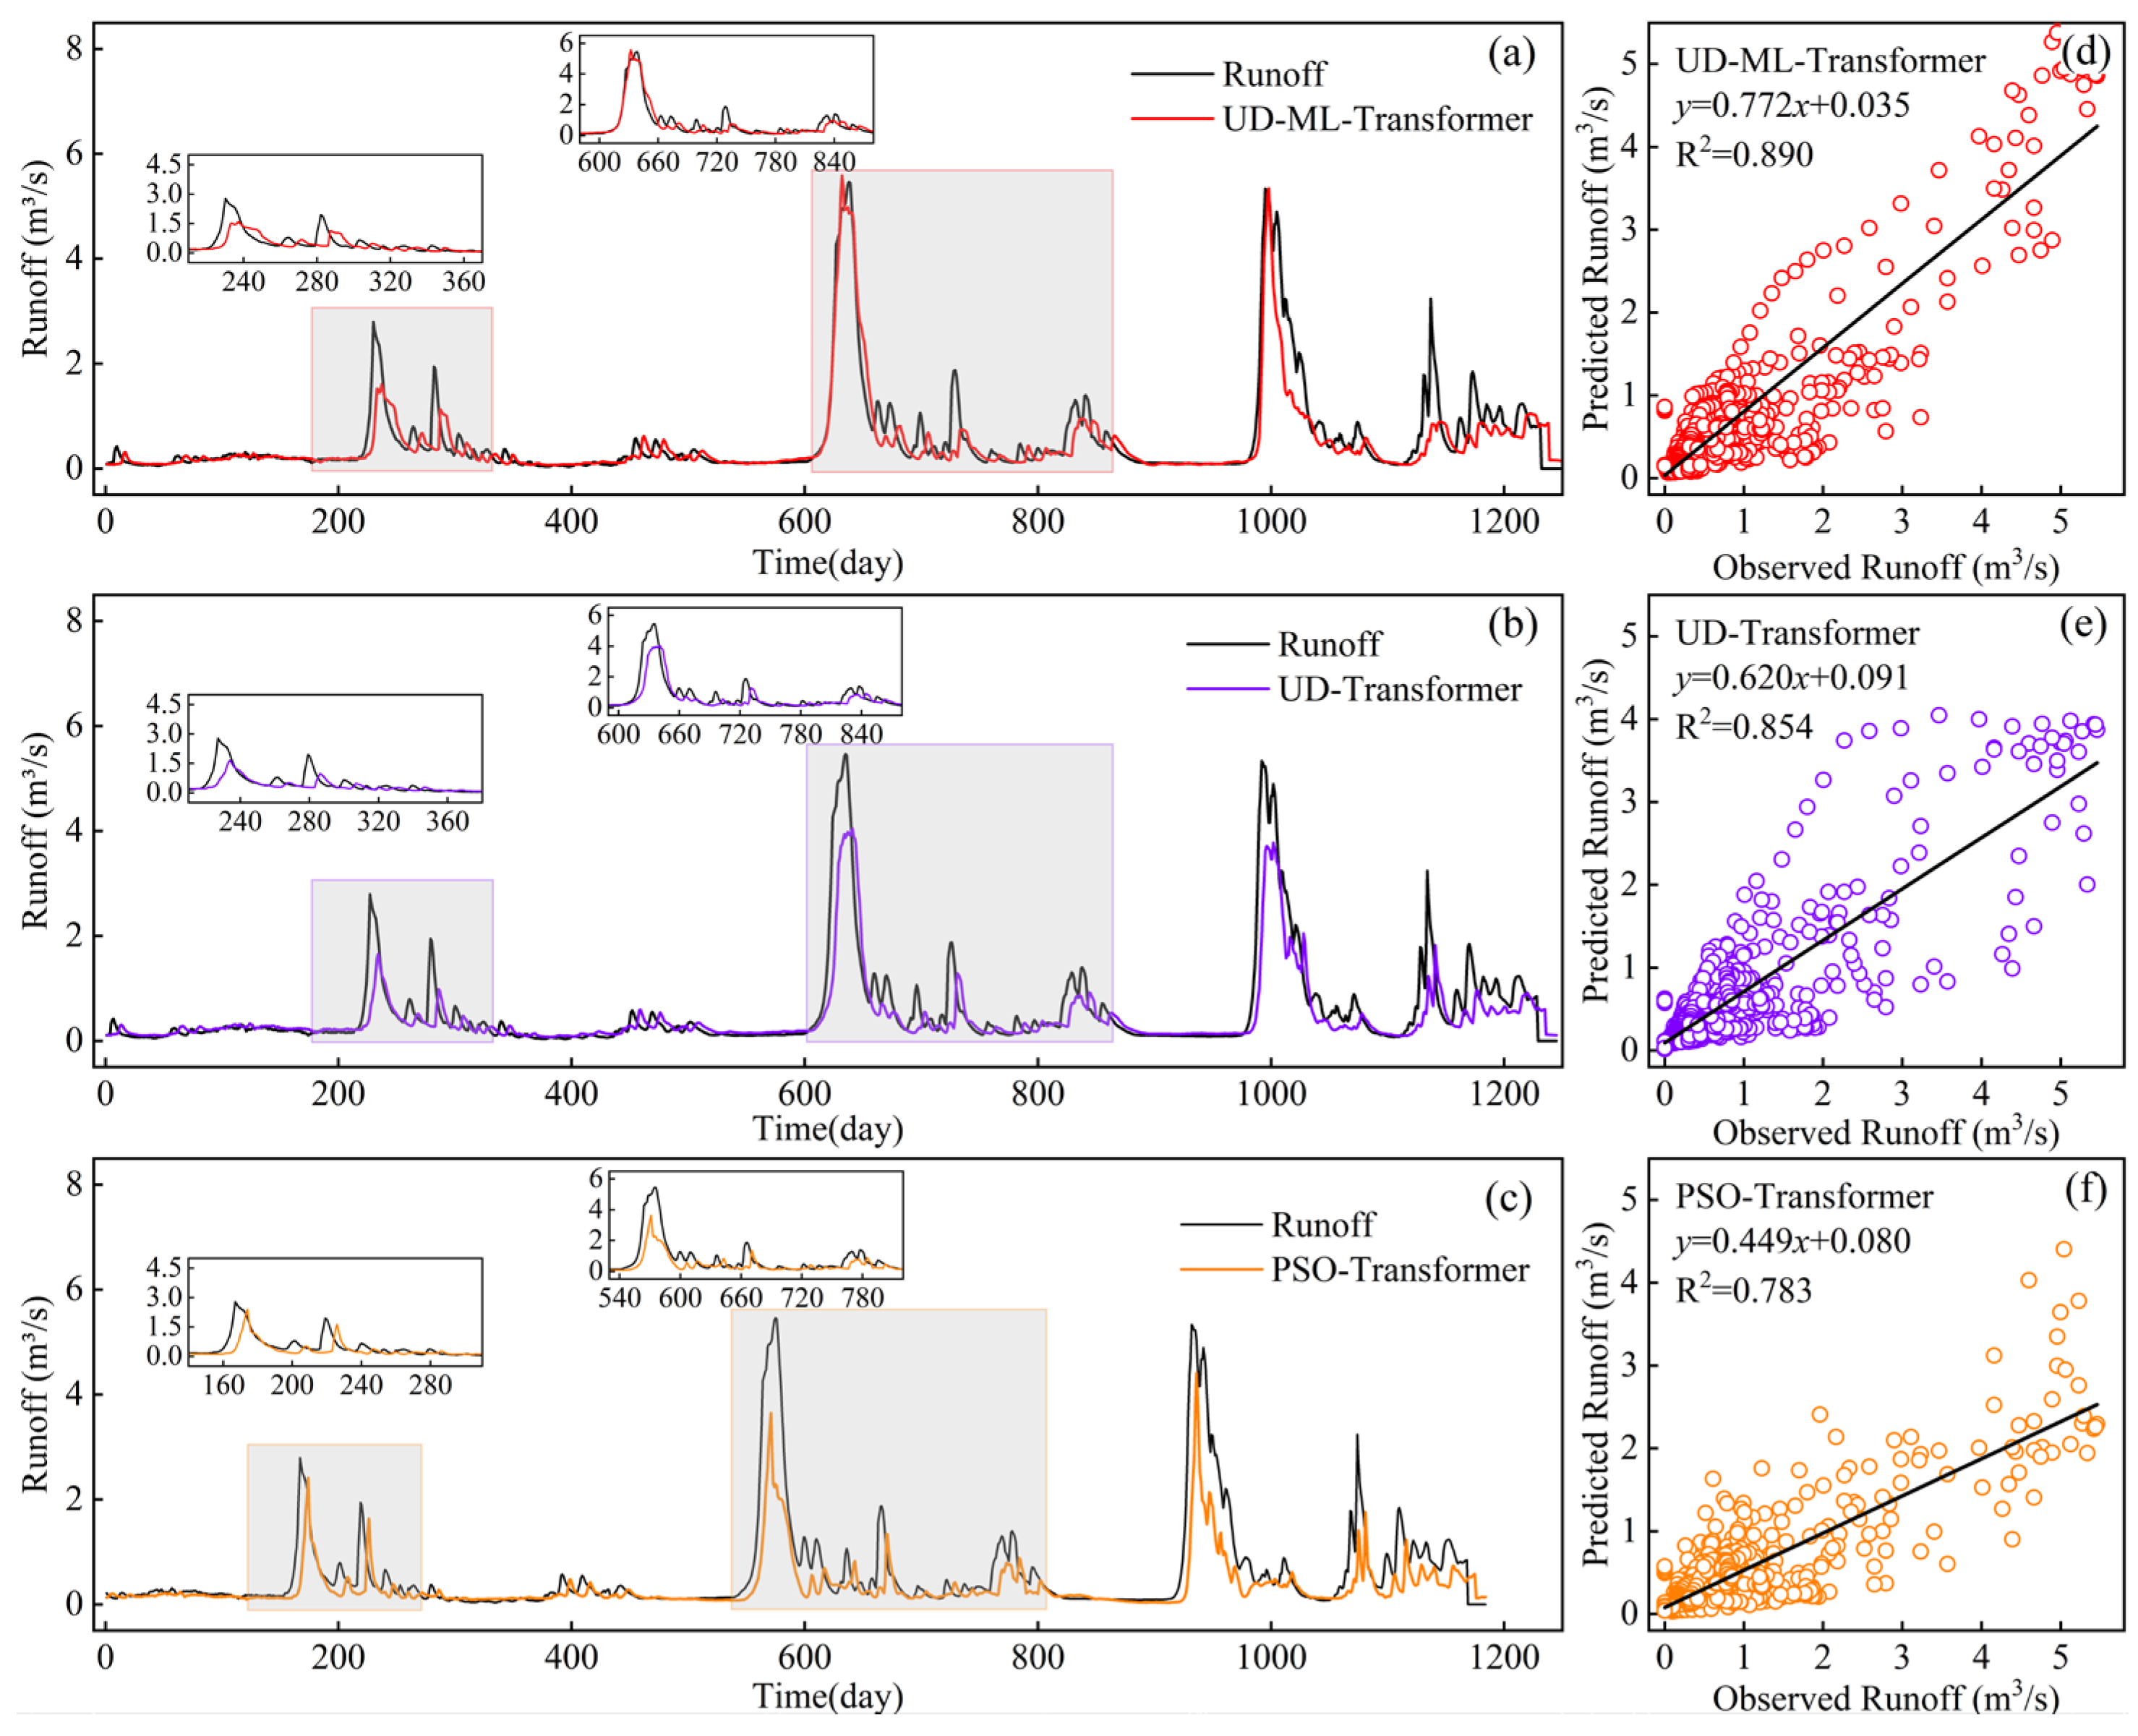
To ensure the fairness and comparability of the cross-watershed validation, all experimental settings were kept consistent with those applied in the Rio Pueblo de Taos watershed, including data sources and data time series, preprocessing procedures, hyperparameter search ranges, and evaluation metrics. Model performance in the Ford River watershed was presented in Table 4, with optimal prediction results and linear regression plots shown in Figure 8. The optimal hyperparameter configurations of the three Transformer-based models (PSO-Transformer, UD-Transformer, UD-ML-Transformer) under their respective optimization methods were summarized in Table 5.
The results consistently demonstrated that the UD-ML-Transformer maintained its superiority over the two benchmark models in the Ford River watershed. Consistent with the single-catchment outcomes in Table 1, the UD-ML optimization strategy maintained stable superiority across study sites, though the magnitude of performance improvement varied between the two basins. This finding further demonstrated the catchment characteristics exerted substantial influence on model optimization effects. Specifically, the UD-ML-Transformer achieved the highest NSE of 0.890, outperforming PSO-Transformer (NSE = 0.783) and UD-Transformer (NSE = 0.854) by 13.67% and 4.22%, respectively. It also yielded the lowest MSE of 0.088, MAE of 0.141, and RMSE of 0.296 among these three models. The consistent superiority of the UD-ML-Transformer model across two distinct watershed types (high-altitude mountain basin vs. lowland river basin) highlighted its strong generalization capability.
In terms of hyperparameters, the UD-ML-Transformer employed more fully connected neurons (208 vs. 89 for UD-Transformer and 95 for PSO-Transformer) in the hidden layer, paired with fewer attention heads (2 vs. 8 for UD-Transformer and 4 for PSO-Transformer) and comparable number of encoder–decoder layers (3 vs. 3 for UD-Transformer and 4 for PSO-Transformer). These formed a narrow-and-deep attention structure that enhanced key feature focus and reduced multi-head attention noise. Unlike the normalization adopted by the PSO-Transformer, the UD-ML-Transformer used standardized preprocessing for a more stable gradient environment, while its higher learning rate (0.001 vs. 0.0001 for PSO-Transformer) accelerated training convergence under the Adam optimizer. Additionally, the shortest input sequence length of the UD-ML-Transformer (30 vs. 60 for both UD-Transformer and PSO-Transformer) mitigated redundant information interference, improving training efficiency and feature focus. Moreover, the lower dropout rate (0.1 vs. 0.3 for both UD-Transformer and PSO-Transformer) of the UD-ML-Transformer matched its larger model capacity, which reduced information loss and enabled fully capture of data patterns. In addition to intra-basin comparison of optimization algorithms, the two watersheds exhibited notable differences in optimized hyperparameters, such as input sequence length and dropout rate. These divergence parameter settings reflected varying demands for historical information retention and regularization under different snowmelt-driven hydrological conditions.
In summary, two watersheds with heterogeneous hydrological features were therefore employed to verify the generalization of the UD-ML optimization strategy. Consistent with the results shown in Figure 4, Figure 5 and Figure 8, the UD-ML framework yielded slightly different performance gains across two catchments due to variations in topography and snowmelt hydrological characteristics. Cross-watershed validation confirmed the outstanding applicability and generalization capability of the UD-ML-Transformer model. Its stable predictive superiority under diverse conditions well addressed the transferability limitation of existing deep learning-based hydrological models, supporting its practical extension to broader runoff forecasting scenarios.

4.2. Limitations and Outlooks

In summary, the proposed UD-ML-Transformer model effectively integrated UD and ML hyperparameter optimization within the Transformer architecture, yielding superior predictive accuracy in runoff forecasting. Nevertheless, this study still has several limitations. First, the modeling framework only includes limited hydroclimatic factors. More critical factors such as vegetation coverage, land surface conditions and human activities will be added in future work to improve predictive performance. Second, only three optimization strategies (PSO, UD, UD-ML) and two deep learning architectures (Transformer, RWKV) were compared. More advanced tuning methods like Bayesian optimization will be explored to enhance model efficiency and performance. Notably, the current model comparison was mainly oriented to advanced deep learning architectures, focusing on verifying the superiority of the proposed UD-ML hyperparameter optimization strategy under unified model settings. However, classic and standard baseline models widely used in hydrological forecasting, including LSTM and GRU, as well as conventional process-based hydrological models and hybrid machine learning models, are not incorporated for cross-comparison. This limits the comprehensive evaluation of the generalization and applicability of the proposed optimization framework across diverse models. Furthermore, all experiments in this study were only conducted on the two snow-dominated watersheds in the USA, which restricted the generalizability of the proposed method. Specifically, the runoff generation mechanism of snow-dominated basins is dominated by snowmelt, which differs significantly from rainfall-dominated, arid or semi-arid hydrological systems with strong evaporation and sparse vegetation. In addition, this study did not consider human interference such as reservoir regulation and land use change. Therefore, the optimization performance of the UD-ML framework under complex hydrological conditions and anthropogenic disturbances remains to be further verified. Future work will introduce multi-type catchments covering arid, semi-arid, rainy, and human-influenced basins to comprehensively validate and improve the universal applicability of the proposed method. Finally, inter-model performance statistical significance tests and prediction uncertainty analysis are not covered in this study. Both will be supplemented in future research to improve the reliability and robustness of the method.

5. Conclusions

Runoff Prediction is critical for effective water resource management and flood risk warning and mitigation. This study proposed a novel UD-ML-Transformer model, which integrated the UD and ML methods for hyperparameter optimization into the Transformer architecture. Systematic evaluations were conducted using hydroclimatic data from two distinct watersheds, via four evaluation metrics including NSE, MAE, MSE, and RMSE. The key findings were summarized as follows:
(1)
The proposed UD-ML-Transformer model outperformed five benchmark models in providing reliable and accurate runoff predictions. The hyperparameter optimization strategy integrating UD and ML consistently enhanced the predictive performance of both Transformer and RWKV architectures. Comprehensive performance comparison further verified the stability and superiority of the proposed UD-ML optimization strategy.
(2)
The proposed UD-ML-Transformer model also exhibited robust and reliable performance in peak runoff prediction. Benefiting from the synergistic optimization of optimization strategies, the model can effectively capture the complex nonlinear characteristics of peak runoff, thereby substantially improving its practical applicability for flood simulation and early warning scenarios.
(3)
The proposed UD-ML-Transformer model demonstrated strong regional generalization capability, as verified by cross-watershed validation in the Ford River Watershed. The model maintained stable performance superiority across watersheds with heterogeneous hydrological and topographic characteristics, demonstrating promising extensibility for practical applications in diverse basins.

Author Contributions

Conceptualization, W.W.; methodology, W.W.; software, W.W.; validation, X.Z.; resources, L.L.; data curation, X.Z. and T.S.; writing—original draft preparation, W.W.; writing—review and editing, L.L.; visualization, W.W. and J.F.; supervision, H.T. and T.S.; project administration, D.S. and H.T.; funding acquisition, D.S. All authors have read and agreed to the published version of the manuscript.

Funding

This research was funded by Henan Provincial Key Research and Development Special Project (241111322800), National Natural Science Foundation of China (42401062), Natural Science Foundation of Henan (242300421642), China Postdoctoral Science Foundation (2024M750768), Postdoctoral Fellowship Program of CPSF (GZC20230675), and Watershed Civilization and Sustainable Development (DLXKKY250302).

Data Availability Statement

The watershed streamflow datasets employed in this study are publicly accessible via CAMELS dataset. The Python code developed for the UD-ML optimization framework has been released on GitHub (https://github.com/sean-sean1005/short-term-runoff-prediction-and-hyperparameter-optimization), accessed on 24 July 2026.

Acknowledgments

The authors would like to express sincere gratitude to the developers and providers of the CAMELS dataset for offering open accessible data supporting the whole study. We are also deeply thankful to the Faculty of Geographical Science and Engineering, Henan University for valuable academic resources, research conditions and consistent support throughout the entire research process.

Conflicts of Interest

Author Xin Zhang was employed by the company Beijing Urban Construction Design & Development Group Co., Limited. The remaining authors declare that the research was conducted in the absence of any commercial or financial relationships that could be construed as a potential conflict of interest.

References

  1. Sivakumar, B. Global climate change and its impacts on water resources planning and management: Assessment and challenges. Stoch. Environ. Res. Risk Assess. 2011, 25, 583–600. [Google Scholar] [CrossRef] [Scilit]
  2. Juutinen, A.; Virk, Z.; Huuki, H.; Ruokamo, E.; Kopsakangas-Savolainen, M.; Torabi Haghighi, A.; Marttila, H. Impact of environmental flow policy on power system balancing costs and river ecosystem service benefits. Water Resour. Econ. 2025, 52, 100269. [Google Scholar] [CrossRef] [Scilit]
  3. Wang, J.; Ji, G.; Hu, Y. Effect of vegetation growth, agricultural irrigation and climatic variability on streamflow in Wujiang, China. Forests 2024, 15, 1928. [Google Scholar] [CrossRef] [Scilit]
  4. Qi, J.; Yan, F.; Tian, Q.; Yang, C.; Tian, Y.; Li, X.; Guo, L.; Ma, Q.; Ma, Y. Analysis of high–low runoff encounters between the water source and receiving areas in the Xinyang urban water supply project. Water 2025, 17, 2618. [Google Scholar] [CrossRef] [Scilit]
  5. Tian, W.; Wang, W.; Wang, Y.; Shi, C.; Ma, Q. Accurate runoff prediction in nonlinear and nonstationary environments using a novel hybrid model. J. Hydrol. 2025, 662, 133949. [Google Scholar] [CrossRef] [Scilit]
  6. Fatichi, S.; Vivoni, E.R.; Ogden, F.L.; Ivanov, V.Y.; Mirus, B.; Gochis, D.; Downer, C.W.; Camporese, M.; Davison, J.H.; Ebel, B.; et al. An overview of current applications, challenges, and future trends in distributed process-based models in hydrology. J. Hydrol. 2016, 537, 45–60. [Google Scholar] [CrossRef] [Scilit]
  7. Singh, V.P. Hydrologic modeling: Progress and future directions. Geosci. Lett. 2018, 5, 15. [Google Scholar] [CrossRef] [Scilit]
  8. Ng, K.W.; Huang, Y.F.; Koo, C.H.; Chong, K.L.; El-Shafie, A.; Najah Ahmed, A. A review of hybrid deep learning applications for streamflow forecasting. J. Hydrol. 2023, 625, 130141. [Google Scholar] [CrossRef] [Scilit]
  9. Crawford, N.H.; Linsley, R.K. Digital Simulation in Hydrology: Stanford Watershed Model IV; Technical Report No. 39; Stanford University: Stanford, CA, USA, 1966. [Google Scholar]
  10. McCuen, R.H. A Guide to Hydrologic Analysis Using SCS Methods; Prentice Hall: Englewood Cliffs, NJ, USA, 1982. [Google Scholar]
  11. Zhao, R.J. Brief description of rainfall-runoff watershed models. People’s Yellow River 1983, 2, 40–43. (In Chinese) [Google Scholar]
  12. Arnold, J.G.; Srinivasan, R.; Muttiah, R.S.; Williams, J.R. Large area hydrologic modeling and assessment part I: Model development. J. Am. Water Resour. Assoc. 1998, 34, 73–89. [Google Scholar] [CrossRef] [Scilit]
  13. Gochis, D.J.; Barlage, M.; Dugger, A.; Cabell, R.; Casali, M.; FitzGerald, K.; McAllister, M.; McCreight, J.; RafieeiNasab, A.; Read, L.; et al. The WRF-Hydro® Modeling System Technical Description (Version 5.1.1); National Center for Atmospheric Research: Boulder, CO, USA, 2021. [Google Scholar] [CrossRef]
  14. Kuffour, B.N.O.; Engdahl, N.B.; Woodward, C.S.; Maxwell, R.M.; Kollet, S.J. Simulating coupled surface–subsurface flows with ParFlow v3.5.0: Capabilities, applications, and ongoing development of an open-source, massively parallel, integrated hydrologic model. Geosci. Model Dev. 2020, 13, 1373–1397. [Google Scholar] [CrossRef] [Scilit]
  15. Wagener, T.; Sivapalan, M.; Troch, P.A.; McGlynn, B.L.; Harman, C.J.; Gupta, H.V.; Kumar, P.; Rao, P.S.C.; Basu, N.B.; Wilson, J.S. The future of hydrology: An evolving science for a changing world. Water Resour. Res. 2010, 46, W05301. [Google Scholar] [CrossRef] [Scilit]
  16. Su, Y.; Ding, Z.; Zhang, R.; Tang, W.; Huang, W.; Wang, Z.; Zhao, K.; Wang, X.; Liu, S.; Li, Y. High-efficiency organic solar cells processed from a halogen-free solvent system. Sci. China Chem. 2023, 66, 2380–2388. [Google Scholar] [CrossRef] [Scilit]
  17. Valipour, M.; Banihabib, M.E.; Behbahani, S.M.R. Comparison of the ARMA, ARIMA, and the autoregressive artificial neural network models in forecasting the monthly inflow of Dez dam reservoir. J. Hydrol. 2013, 476, 433–441. [Google Scholar] [CrossRef] [Scilit]
  18. Zhang, G.P. Time series forecasting using a hybrid ARIMA and neural network model. Neurocomputing 2003, 50, 159–175. [Google Scholar] [CrossRef] [Scilit]
  19. Sabzipour, B.; Arsenault, R.; Troin, M.; Martel, J.-L.; Brissette, F. Sensitivity analysis of the hyperparameters of an ensemble Kalman filter application on a semi-distributed hydrological model for streamflow forecasting. J. Hydrol. 2023, 626, 130251. [Google Scholar] [CrossRef] [Scilit]
  20. Wang, W.; Tian, W.; Xu, D.; Chau, K.; Ma, Q.; Liu, C. Muskingum models’ development and their parameter estimation: A state-of-the-art review. Water Resour. Manag. 2023, 37, 3129–3150. [Google Scholar] [CrossRef] [Scilit]
  21. Jahangir, M.S.; You, J.; Quilty, J. A quantile-based encoder-decoder framework for multi-step ahead runoff forecasting. J. Hydrol. 2023, 619, 129269. [Google Scholar] [CrossRef] [Scilit]
  22. Nourani, V. An emotional ANN (EANN) approach to modeling rainfall-runoff process. J. Hydrol. 2017, 544, 267–277. [Google Scholar] [CrossRef] [Scilit]
  23. Ren, M.; Sun, W.; Chen, S.; Zeng, D.; Xie, Y. Inconsistent monthly runoff prediction models using mutation tests and machine learning. Water Resour. Manag. 2024, 38, 5235–5254. [Google Scholar] [CrossRef] [Scilit]
  24. Van, S.P.; Le, H.M.; Thanh, D.V.; Dang, T.D.; Loc, H.H.; Anh, D.T. Deep learning convolutional neural network in rainfall–runoff modelling. J. Hydroinf. 2020, 22, 541–561. [Google Scholar] [CrossRef] [Scilit]
  25. Gao, S.; Huang, Y.; Zhang, S.; Han, J.; Wang, G.; Zhang, M.; Lin, Q. Short-term runoff prediction with GRU and LSTM networks without requiring time step optimization during sample generation. J. Hydrol. 2020, 589, 125188. [Google Scholar] [CrossRef] [Scilit]
  26. Man, Y.; Yang, Q.; Shao, J.; Wang, G.; Bai, L.; Xue, Y. Enhanced LSTM model for daily runoff prediction in the upper Huai River basin, China. Engineering 2023, 24, 229–238. [Google Scholar] [CrossRef] [Scilit]
  27. Le, X.-H.; Nguyen, D.-H.; Jung, S.; Yeon, M.; Lee, G. Comparison of deep learning techniques for river streamflow forecasting. IEEE Access 2021, 9, 71805–71820. [Google Scholar] [CrossRef] [Scilit]
  28. Vaswani, A.; Shazeer, N.; Parmar, N.; Uszkoreit, J.; Jones, L.; Gomez, A.N.; Kaiser, L.; Polosukhin, I. Attention is all you need. Adv. Neural Inf. Process. Syst. 2017, 30, 5998–6008. [Google Scholar]
  29. Jiang, J.; Xu, H.; Xu, X.; Cui, Y.; Wu, J. Transformer-based fused attention combined with CNNs for image classification. Neural Process. Lett. 2023, 55, 11905–11919. [Google Scholar] [CrossRef] [Scilit]
  30. Wang, J.; Shao, S.; Bai, Y.; Deng, J.; Lin, Y. Multiscale wavelet graph AutoEncoder for multivariate time-series anomaly detection. IEEE Trans. Instrum. Meas. 2023, 72, 1–11. [Google Scholar] [CrossRef] [Scilit]
  31. Sun, W.; Chang, L.-C.; Chang, F.-J. Deep dive into predictive excellence: Transformer’s impact on groundwater level prediction. J. Hydrol. 2024, 636, 131250. [Google Scholar] [CrossRef] [Scilit]
  32. Wei, X.; Wang, G.; Schmalz, B.; Hagan, D.F.T.; Duan, Z. Evaluation of transformer model and self-attention mechanism in the Yangtze River basin runoff prediction. J. Hydrol. Reg. Stud. 2023, 47, 101438. [Google Scholar] [CrossRef] [Scilit]
  33. Yin, H.; Guo, Z.; Zhang, X.; Chen, J.; Zhang, Y. RR-former: Rainfall-runoff modeling based on transformer. J. Hydrol. 2022, 609, 127781. [Google Scholar] [CrossRef] [Scilit]
  34. Wu, H.; Xu, J.; Wang, J.; Long, M. Autoformer: Decomposition transformers with auto-correlation for long-term series forecasting. arXiv 2021, arXiv:2106.13008. [Google Scholar] [CrossRef] [Scilit]
  35. Zhang, Y.; Yan, J. Crossformer: Transformer utilizing cross-dimension dependency for multivariate time series forecasting. In Proceedings of the 11th International Conference on Learning Representations (ICLR 2023), Kigali, Rwanda, 1–5 May 2023. [Google Scholar]
  36. Zhang, X.; Liu, F.; Yin, Q.; Qi, Y.; Sun, S. A runoff prediction method based on hyperparameter optimisation of a kernel extreme learning machine with multi-step decomposition. Sci. Rep. 2023, 13, 19341. [Google Scholar] [CrossRef] [Scilit] [PubMed]
  37. Rong, G.; Li, K.; Su, Y.; Tong, Z.; Liu, X.; Zhang, J.; Zhang, Y.; Li, T. Comparison of tree-structured parzen estimator optimization in three typical neural network models for landslide susceptibility assessment. Remote Sens. 2021, 13, 4694. [Google Scholar] [CrossRef] [Scilit]
  38. Mirjalili, S.; Mirjalili, S.M.; Lewis, A. Grey wolf optimizer. Adv. Eng. Softw. 2014, 69, 46–61. [Google Scholar] [CrossRef] [Scilit]
  39. Kennedy, J.; Eberhart, R. Particle swarm optimization. In Proceedings of the ICNN’95—International Conference on Neural Networks, Perth, Australia, 27 November–1 December 1995; pp. 1942–1948. [Google Scholar] [CrossRef] [Scilit]
  40. Xue, J.; Shen, B. A novel swarm intelligence optimization approach: Sparrow search algorithm. Syst. Sci. Control Eng. 2020, 8, 22–34. [Google Scholar] [CrossRef] [Scilit]
  41. Zhang, L.; Zeng, T.; Wang, L.; Li, L. Advancing seismic landslide susceptibility modeling: A comparative evaluation of deep learning models through particle swarm optimization. Earth Sci. Inf. 2024, 17, 3547–3566. [Google Scholar] [CrossRef] [Scilit]
  42. Mabdeh, A.N.; Ajin, R.S.; Razavi-Termeh, S.V.; Ahmadlou, M.; Al-Fugara, A. Enhancing the performance of machine learning and deep learning-based flood susceptibility models by integrating grey wolf optimizer (GWO) algorithm. Remote Sens. 2024, 16, 2595. [Google Scholar] [CrossRef] [Scilit]
  43. Zhang, X.; Wang, X.; Li, H.; Sun, S.; Liu, F. Monthly runoff prediction based on a coupled VMD-SSA-BiLSTM model. Sci. Rep. 2023, 13, 13149. [Google Scholar] [CrossRef] [Scilit] [PubMed]
  44. Li, B.-J.; Sun, G.-L.; Li, Y.-P.; Zhang, X.-L.; Huang, X.-D. A hybrid variational mode decomposition and sparrow search algorithm-based least square support vector machine model for monthly runoff forecasting. Water Supply 2022, 22, 5698–5715. [Google Scholar] [CrossRef] [Scilit]
  45. Samantaray, S.; Das, S.S.; Sahoo, A.; Satapathy, D.P. Monthly runoff prediction at Baitarani River basin by support vector machine based on salp swarm algorithm. Ain Shams Eng. J. 2022, 13, 101732. [Google Scholar] [CrossRef] [Scilit]
  46. Wang, Y.; Fang, K.T. On uniform distribution and experimental design (number-theoretic method). Chin. Sci. Bull. 1981, 26, 65–70. (In Chinese) [Google Scholar]
  47. Elsawah, A.M. A novel non-heuristic search technique for constructing uniform designs with a mixture of two- and four-level factors: A simple industrial applicable approach. J. Korean Stat. Soc. 2022, 51, 716–757. [Google Scholar] [CrossRef] [Scilit]
  48. Lai, J.; Fang, K.-T.; Peng, X.; Lin, Y. Construction of uniform designs over continuous domain in computer experiments. Commun. Stat. Simul. Comput. 2024, 53, 130–146. [Google Scholar] [CrossRef] [Scilit]
  49. Wang, Y.; Xu, B.; Sun, G.; Yang, S. A two-phase differential evolution for uniform designs in constrained experimental domains. IEEE Trans. Evol. Comput. 2017, 21, 665–680. [Google Scholar] [CrossRef] [Scilit]
  50. Bai, D.; Ma, S.; Yang, X.; Ma, D.; Ma, X.; Ma, H. A recommendation model for optimizing transfer learning hyper-parameter settings in building heat load prediction with limited data samples. Energy Build. 2024, 325, 115021. [Google Scholar] [CrossRef] [Scilit]
  51. Finn, C.; Abbeel, P.; Levine, S. Model-agnostic meta-learning for fast adaptation of deep networks. In Proceedings of the 34th International Conference on Machine Learning (ICML 2017), Sydney, Australia, 6–11 August 2017; pp. 1126–1135. [Google Scholar]
  52. Ye, L.; Wang, W.; Sun, H.; Ye, W.; Hou, Y.; Zhang, Y.; Zhang, Y.; Ren, G.; Gao, Z.; Qu, X. A meta-learning approach for multicenter and small-data single-cell image analysis. Anal. Chem. 2025, 97, 16812–16821. [Google Scholar] [CrossRef] [Scilit] [PubMed]
  53. Yoon, J.; Kim, T.; Dia, O.; Kim, S.; Bengio, Y.; Ahn, S. Bayesian model-agnostic meta-learning. In Proceedings of the 32nd International Conference on Neural Information Processing Systems, Montréal, QC, Canada, 3–8 December 2018. [Google Scholar]
  54. Shahriari, B.; Swersky, K.; Wang, Z.; Adams, R.P.; de Freitas, N. Taking the human out of the loop: A review of Bayesian optimization. Proc. IEEE 2016, 104, 148–175. [Google Scholar] [CrossRef] [Scilit]
  55. Peng, B.; Goldstein, D.; Anthony, Q.; Albalak, A.; Alcaide, E.; Biderman, S.; Cheah, E.; Du, X.; Ferdinan, T.; Hou, H.; et al. Eagle and finch: RWKV with matrix-valued states and dynamic recurrence. arXiv 2024, arXiv:2404.05892. [Google Scholar] [CrossRef] [Scilit]
  56. Addor, N.; Newman, A.J.; Mizukami, N.; Clark, M.P. CAMELS: Catchment Attributes and Meteorology for Large-Sample Studies [Dataset]; UCAR/NCAR: Boulder, CO, USA, 2017. [Google Scholar] [CrossRef]
  57. Plaut, D.C.; Hinton, G.E. Learning sets of filters using back-propagation. Comput. Speech Lang. 1987, 2, 35–61. [Google Scholar] [CrossRef] [Scilit]
  58. Granata, F.; Zhu, S.; Di Nunno, F. Advanced streamflow forecasting for central European rivers: The cutting-edge Kolmogorov-Arnold networks compared to transformers. J. Hydrol. 2024, 645, 132175. [Google Scholar] [CrossRef] [Scilit]
  59. Moosavi, V.; Mostafaei, S.; Berndtsson, R. Temporal cluster-based local deep learning or signal processing-temporal convolutional transformer for daily runoff prediction? Appl. Soft Comput. 2024, 155, 111425. [Google Scholar] [CrossRef] [Scilit]
  60. Granata, F.; Di Nunno, F. Forecasting short- and medium-term streamflow using stacked ensemble models and different meta-learners. Stoch. Environ. Res. Risk Assess. 2024, 38, 3481–3499. [Google Scholar] [CrossRef] [Scilit]
  61. Abdoulhalik, A.; Ahmed, A.A. A comparative analysis of advanced machine learning techniques for river streamflow time-series forecasting. Sustainability 2024, 16, 4005. [Google Scholar] [CrossRef] [Scilit]
  62. Lundberg, S.M.; Lee, S.I. A unified approach to interpreting model predictions. Adv. Neural Inf. Process. Syst. 2017, 30, 4765–4774. [Google Scholar]
  63. Moriasi, D.N.; Arnold, J.G.; Van Liew, M.W.; Bingner, R.L.; Harmel, R.D.; Veith, T.L. Model evaluation guidelines for systematic quantification of accuracy in watershed simulations. Trans. ASABE 2007, 50, 885–900. [Google Scholar] [CrossRef] [Scilit]
  64. Botterill, T.E.; McMillan, H.K. Using machine learning to identify hydrologic signatures with an encoder–decoder framework. Water Resour. Res. 2023, 59, e2022WR033091. [Google Scholar] [CrossRef] [Scilit]
  65. Ji, Y.; Zhang, H.; Zhang, Z.; Liu, M. CNN-based encoder-decoder networks for salient object detection: A comprehensive review and recent advances. Inf. Sci. 2021, 546, 835–857. [Google Scholar] [CrossRef] [Scilit]
  66. Zhao, Y.; Wu, X.; Zhang, W.; Lan, P.; Qin, G.; Li, X.; Li, H. A deep learning-based probabilistic approach to flash flood warnings in mountainous catchments. J. Hydrol. 2025, 652, 132677. [Google Scholar] [CrossRef] [Scilit]
  67. Han, J.; Liu, Z.; Woods, R.; McVicar, T.R.; Yang, D.; Wang, T.; Hou, Y.; Guo, Y.; Li, C.; Yang, Y. Streamflow seasonality in a snow-dwindling world. Nature 2024, 629, 1075–1081. [Google Scholar] [CrossRef] [Scilit] [PubMed]
  68. Yang, L.; Wang, J.; Lu, T.; He, W.; Zou, X.; Xia, H.; Albano, R.; Ozga-Zielinski, B.; Adamowski, J.; Feng, Q. Impact of the soil freeze-thaw process on runoff generation and water balance in an alpine region of the northeast Qinghai-Tibet Plateau. Agric. Water Manag. 2026, 325, 110191. [Google Scholar] [CrossRef] [Scilit]
  69. Xie, S.; Xie, Y.; Zhang, Y.; Li, J.; Wang, G.; Zeng, C. Connecting effects of precipitation, soil hydrological processes, and groundwater dynamics in a continuous permafrost catchment on runoff of northeastern Qinghai-Tibet Plateau. Glob. Planet. Change 2026, 260, 105396. [Google Scholar] [CrossRef] [Scilit]
Figure 1. Geographical location of the Rio Pueblo de Taos watershed.
Hydrology 13 00201 g001
Figure 2. Time series of training, validation, and testing for daily runoff over the Rio Pueblo de Taos watershed.
Hydrology 13 00201 g002
Figure 3. Schematic diagram of the UD-ML-Transformer algorithm.
Hydrology 13 00201 g003
Figure 4. Comparison between the observations and simulated runoffs from the proposed UD-ML-Transformer model and five benchmark models in the Rio Pueblo de Taos watershed: (af) Time series of simulated runoffs from six hydrological prediction models.
Hydrology 13 00201 g004
Figure 5. Comparison between the observations and simulated runoffs from the proposed UD-ML-Transformer model and five benchmark models in the Rio Pueblo de Taos watershed: (af) Linear fitting between the observations and simulated runoffs from six hydrological prediction models.
Hydrology 13 00201 g005
Figure 6. Feature importance ranking of features according to the SHAP values. PET: potential evapotranspiration; SWE: snow water equivalent; AT: air temperature; PRE: precipitation.
Hydrology 13 00201 g006
Figure 7. Geographical location of the Ford River watershed.
Hydrology 13 00201 g007
Figure 8. Comparison between the observations and simulated runoff from the proposed UD-ML-Transformer model and two Transformer-based models in the Ford River watershed: (ac) Time series of simulated runoff from Transformer-based models; (df) Linear fitting between the observations and simulated runoff from Transformer-based models.
Hydrology 13 00201 g008
Table 1. The optimal runoff prediction performance of the UD-ML-Transformer model and five benchmark models in the Rio Pueblo de Taos watershed.
ModelsNSEMSERMSEMAE
PSO-Transformer0.8670.0060.0750.039
UD-Transformer0.9030.0040.0640.035
UD-ML-Transformer0.9060.0040.0620.034
PSO-RWKV0.8240.0070.0850.043
UD-RWKV0.8830.0050.0680.038
UD-ML-RWKV0.8870.0040.0670.037
Table 2. Performance of peak flow prediction across six models in the Rio Pueblo de Taos watershed.
ModelsMSERMSEMAE
PSO-Transformer0.0250.1590.095
UD-Transformer0.0140.1180.074
UD-ML-Transformer0.0130.1170.063
PSO-RWKV0.0160.1280.078
UD-REKV0.0150.1200.073
UD-ML-REKV0.0140.1180.066
Table 3. Optimal hyperparameter configurations for the Transformer-based model with three optimization methods (including PSO, UD, and UD-ML) over the Rio Pueblo de Taos watershed.
HyperparametersPSO-TransformerUD-TransformerUD-ML-Transformer
Data preprocessing methodNormalizationNormalizationStandardization
Embedding dimension806480
Number of multi-head attention heads442
Encoder–decoder layer count342
Fully connected layer neuron count97189197
Batch size1625664
Input sequence length906030
Learning rate0.00010.0010.001
Optimizer typeAdamAdamAdam
Dropout rate0.20.10.1
Table 4. The optimal runoff prediction performance of three Transformer-based models with three optimization methods (including PSO, UD, and UD-ML) in the Ford River watershed.
ModelsNSEMSERMSEMAE
PSO-Transformer0.7830.1790.4220.187
UD-Transformer0.8540.1160.3400.154
UD-ML-Transformer0.8900.0880.2960.141
Table 5. Optimal hyperparameter configurations for the Transformer-based models with three optimization methods (including PSO, UD, and UD-ML) in the Ford River watershed.
HyperparametersPSO-TransformerUD-TransformerUD-ML-Transformer
Data preprocessing methodNormalizationStandardizationStandardization
Embedding dimension649680
Number of multi-head attention heads482
Encoder–decoder layer count433
Fully connected layer neuron count9589208
Batch size326464
Input sequence length606030
Learning rate0.00010.0010.001
Optimizer typeAdamAdamAdam
Dropout rate0.30.30.1
Disclaimer/Publisher’s Note: The statements, opinions and data contained in all publications are solely those of the individual author(s) and contributor(s) and not of MDPI and/or the editor(s). MDPI and/or the editor(s) disclaim responsibility for any injury to people or property resulting from any ideas, methods, instructions or products referred to in the content.