Model Predictive Control-Based Hydrodynamic Regulation Framework for the Lower Ganjiang River

Abstract
1. Introduction
2. Materials and Methods
2.1. Study Area
2.1.1. Nanchang Water Control Project
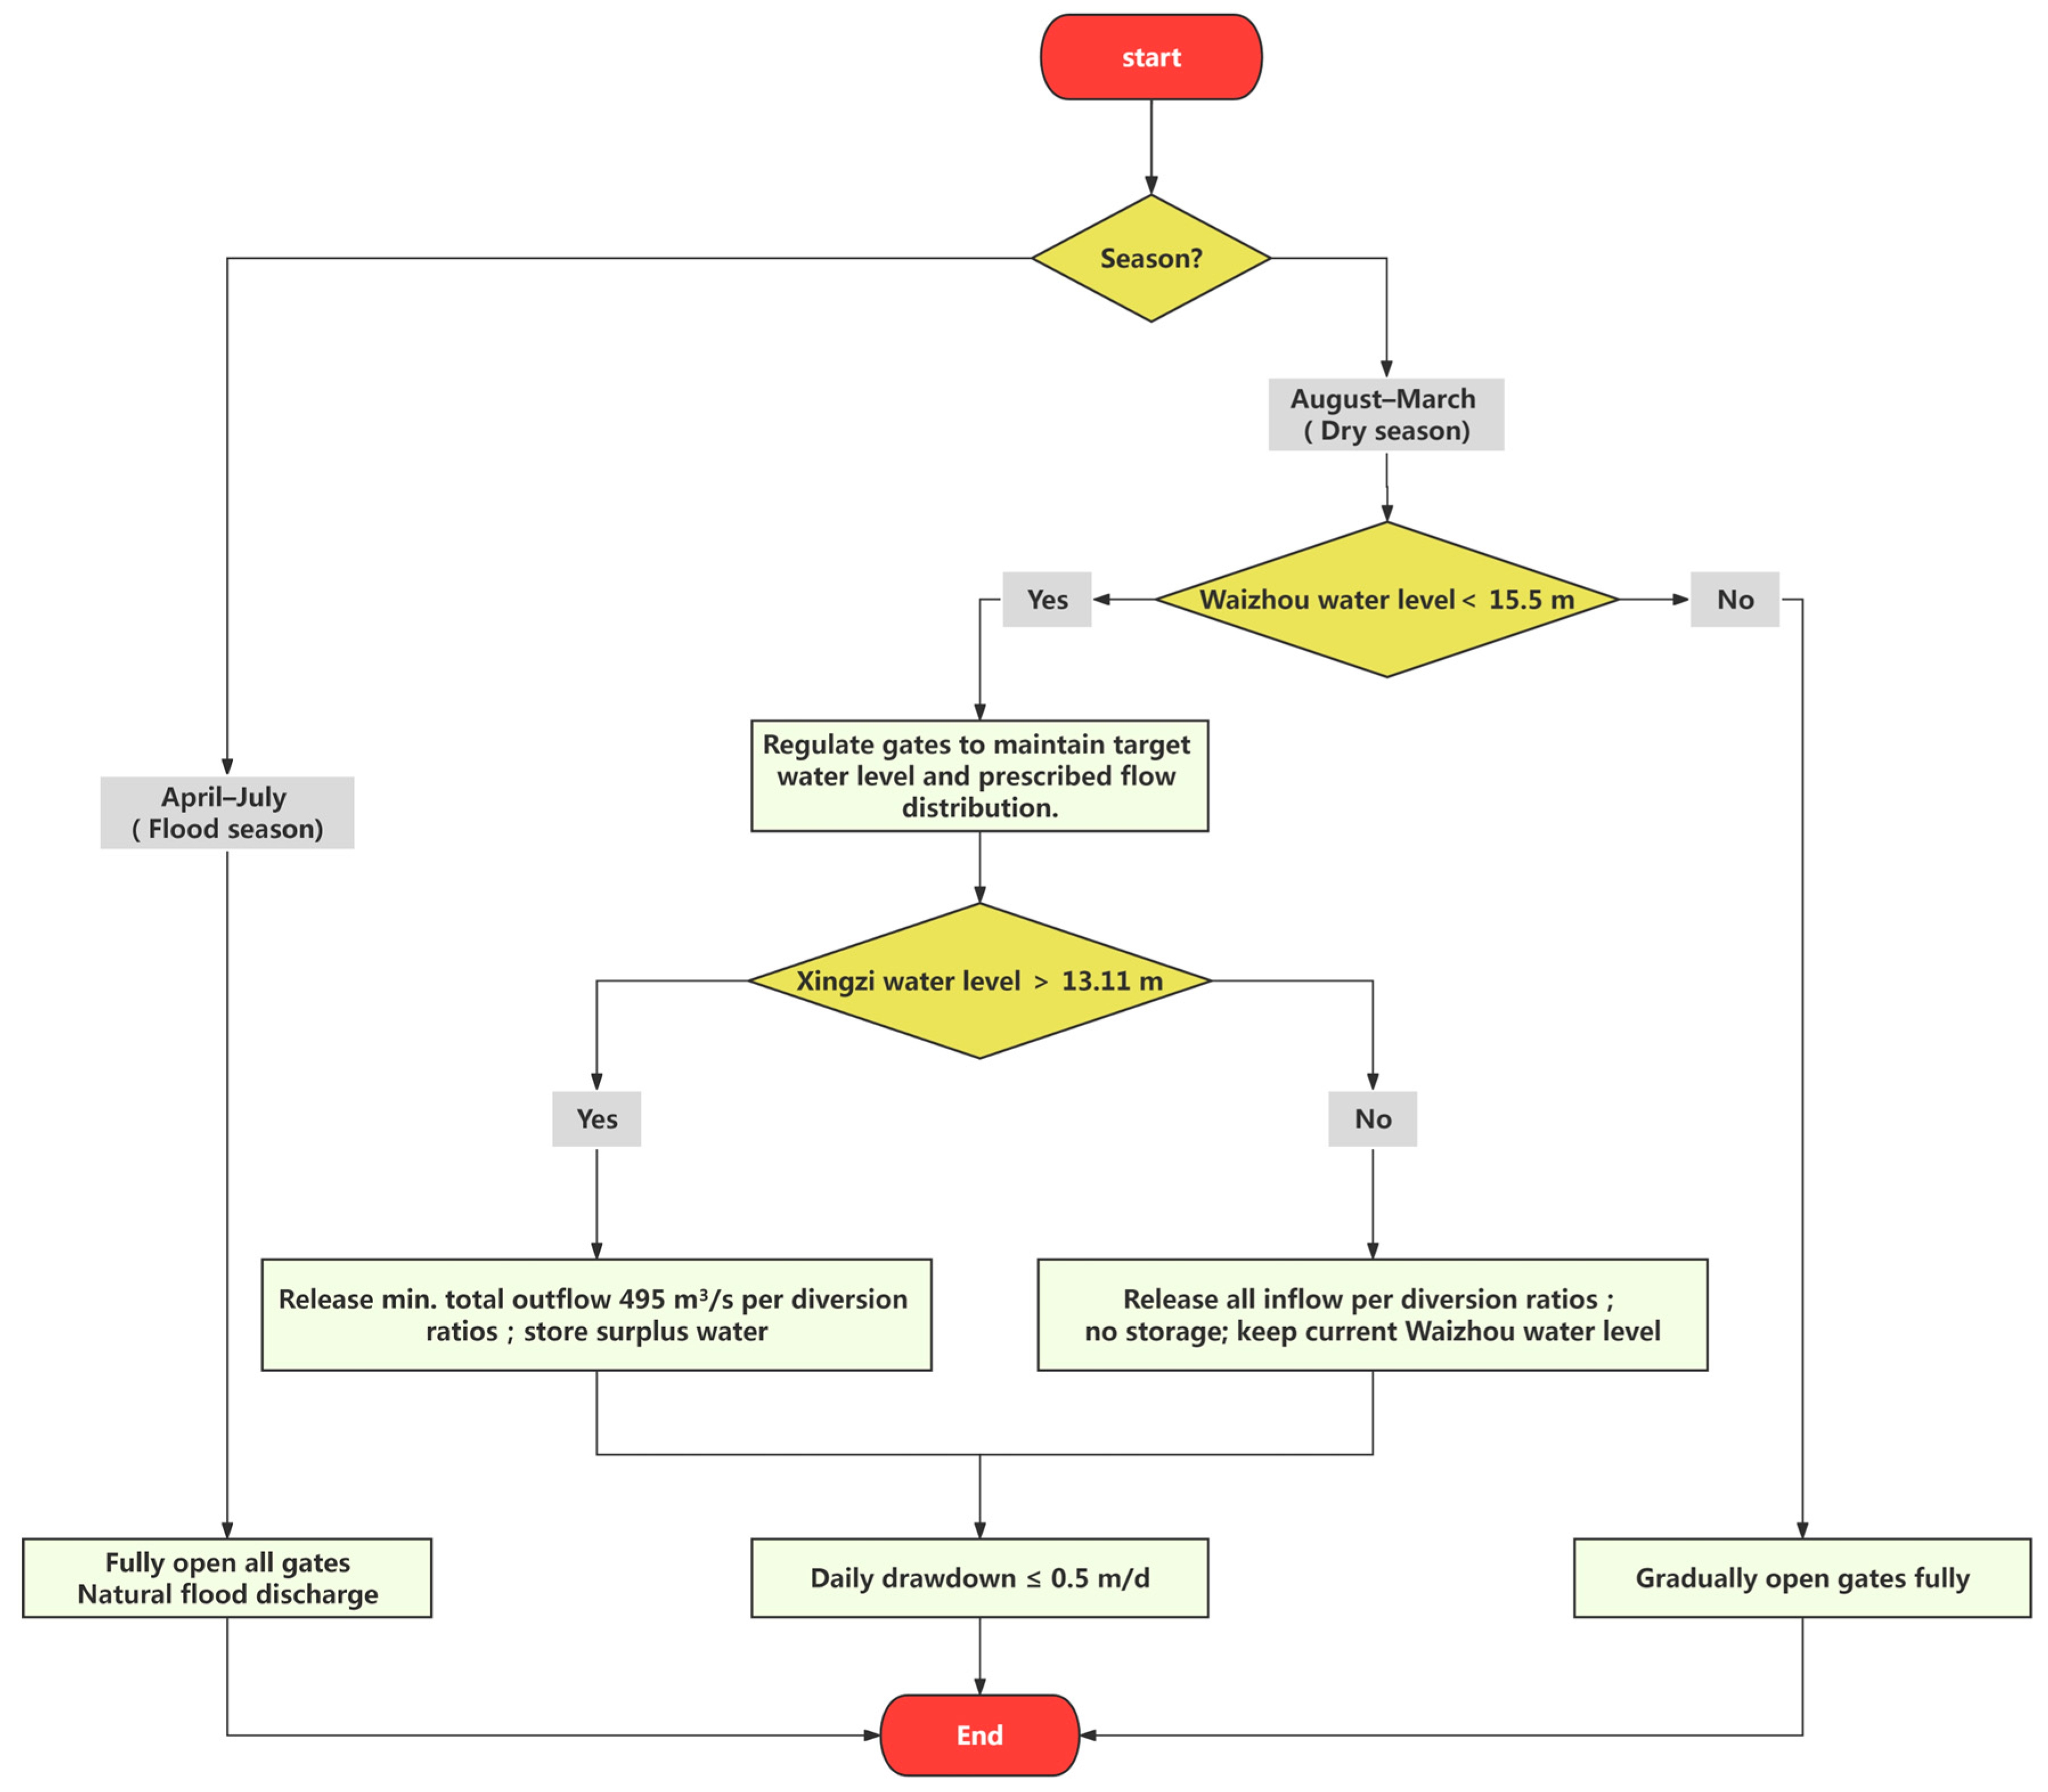
2.1.2. Current Operation Strategy and Limitations
- (1)
- Time lag and overshoot. Thresholds trigger actions only after the water level crosses 15.5 m. Due to flow propagation delays (2–4 h from Waizhou to downstream branches), gate responses lag behind actual water-level changes, causing overshoot (sharp rise and then sudden drop) and oscillations, which endanger bank slopes.
- (2)
- Reactive rather than predictive. The strategy cannot anticipate rapid inflow increases. When a flood wave approaches, the gates do not act until the water level exceeds 15.5 m, forcing a rapid rise and potentially exceeding safe limits.
- (3)
- Poor multi-objective coordination. Water level is the only feedback variable. The strategy does not systematically optimise diversion ratios or minimise gate movements, leading to frequent adjustments and accelerated equipment wear.
2.2. Data Sources and Processing
- (1)
- Subset 1—Model calibration (2018 hourly data). The full year of 2018 (hourly records) was used to calibrate the integral time-delay model and to estimate the storage–water level relationship. From this subset, the flood wave propagation time from Waizhou station to each downstream branch was calculated using the peak time difference method based on hourly water level data. Table 3 presents the resulting propagation times for each month of 2018.
- (2)
- Subset 2—Validation scenarios (historical flood events). Three historical flood events from 2016 to 2018 (after the commissioning of the Xiajiang Hydropower Station) were selected as independent validation cases to test the predictive performance of the calibrated MPC framework. These events span a wide range of flow fluctuation amplitudes, as summarised in Table 4.
- (3)
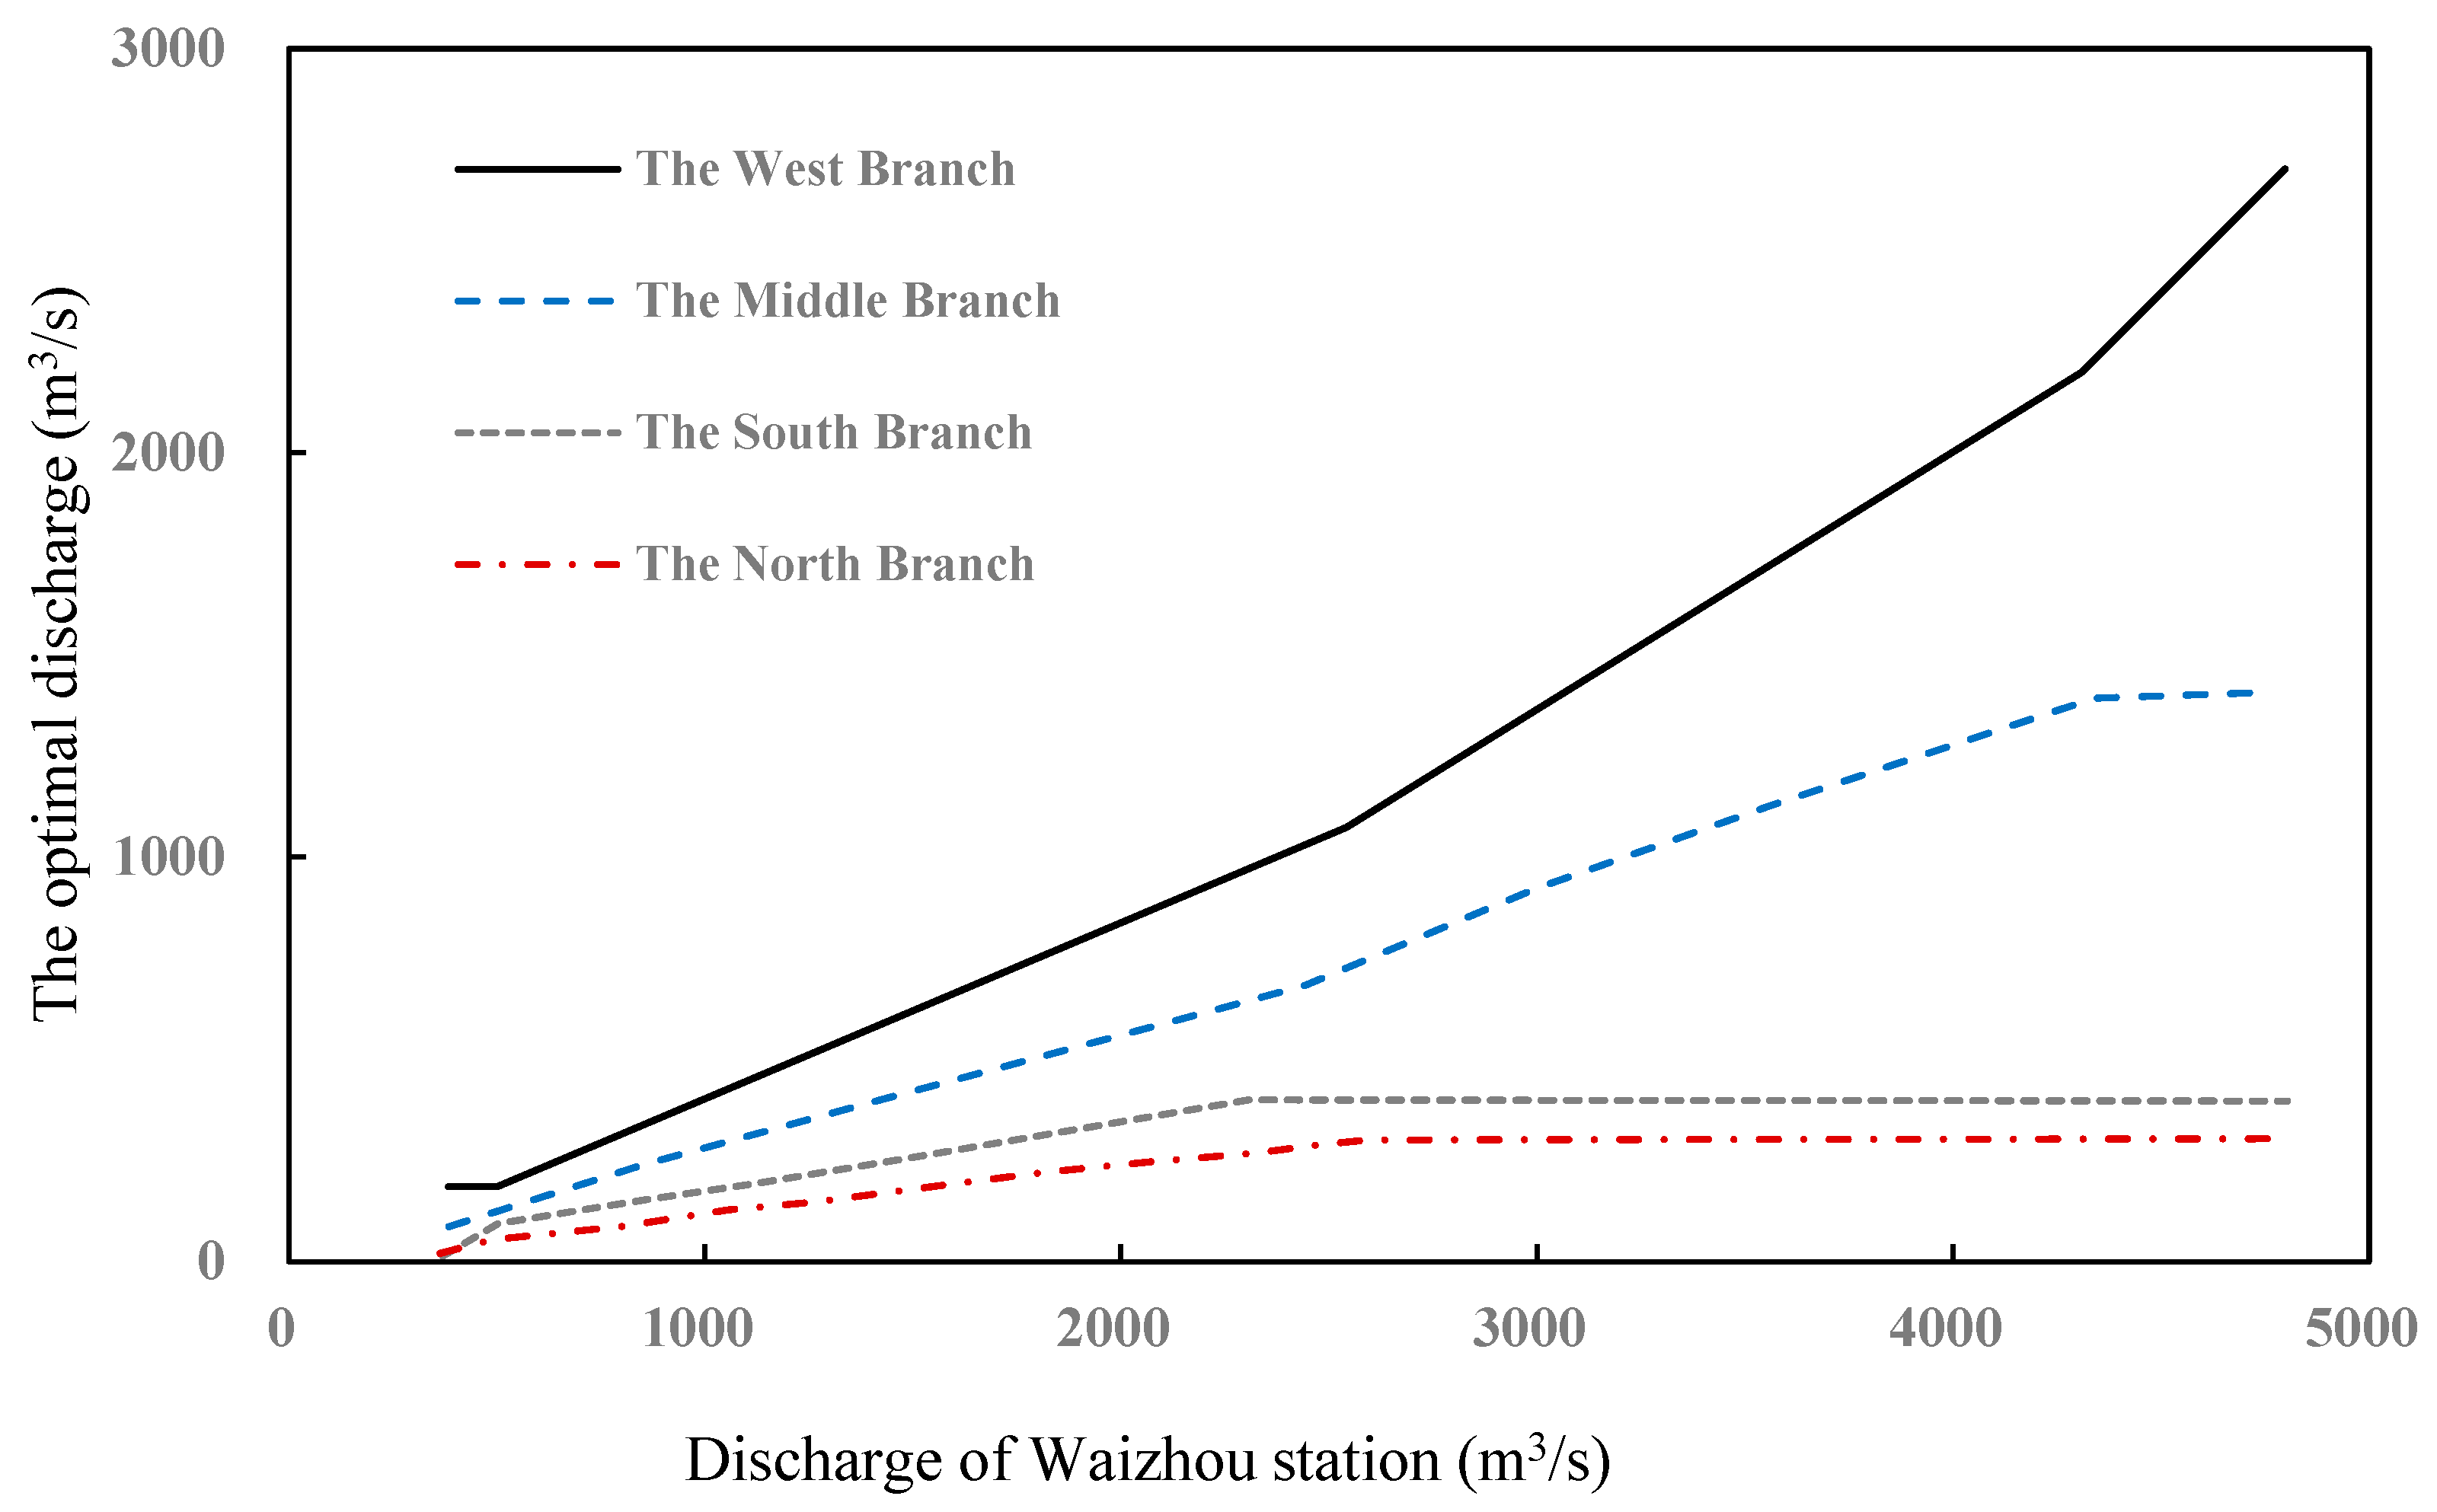
- Subset 3—Determination of optimal diversion ratios (long-term data). The optimal relationship between the Waizhou discharge and the branch discharges (shown in Figure 3) was adopted from Zhang et al. (2025) [6]. In that study, a two-dimensional hydrodynamic model (MIKE21) was calibrated and validated against observed water levels and velocities in the Lower Ganjiang River. Using this model, the authors simulated flow velocities under different inflow rates and historical diversion ratios. They found that when the Nanchang Water Control Project impounds to the target water level of 15.5 m at Waizhou, the branch flow velocity is approximately linear with the branch discharge. Based on this linear relationship, a linear programming problem was formulated to maximise the minimum flow velocity among the four branches (max–min criterion), subject to the maximum discharge capacity and minimum ecological/navigation flow constraints of each branch (see Section 2.1.2, Table 2 for these numerical values). The resulting optimal branch discharges (Figure 3) are therefore model outputs from the validated MIKE21 simulations processed through linear programming, i.e., a calibrated optimal control relationship, not raw observations.
2.3. Model and Algorithm
2.3.1. Improved Integral Delay Prediction Model
2.3.2. State-Space Equation for Predictive Control
2.3.3. Objective Function
- (1)
- Water-level tracking errorwhere h(k) is the predicted water level at time step k and Q is a diagonal positive-definite weighting matrix that adjusts the tracking accuracy. This term drives the system to stabilise the water level at the target value.
- (2)
- Control input increment penalty
- (3)
- Discharge deviation from optimal distribution
2.3.4. Constraints
- (1)
- Branch discharge limits
- (2)
- Total discharge balance
- (3)
- Water-level change rate
2.4. Model Solution and Sensitivity Analysis
2.4.1. Computational Environment and Problem Size
2.4.2. Solver Settings and Initialization
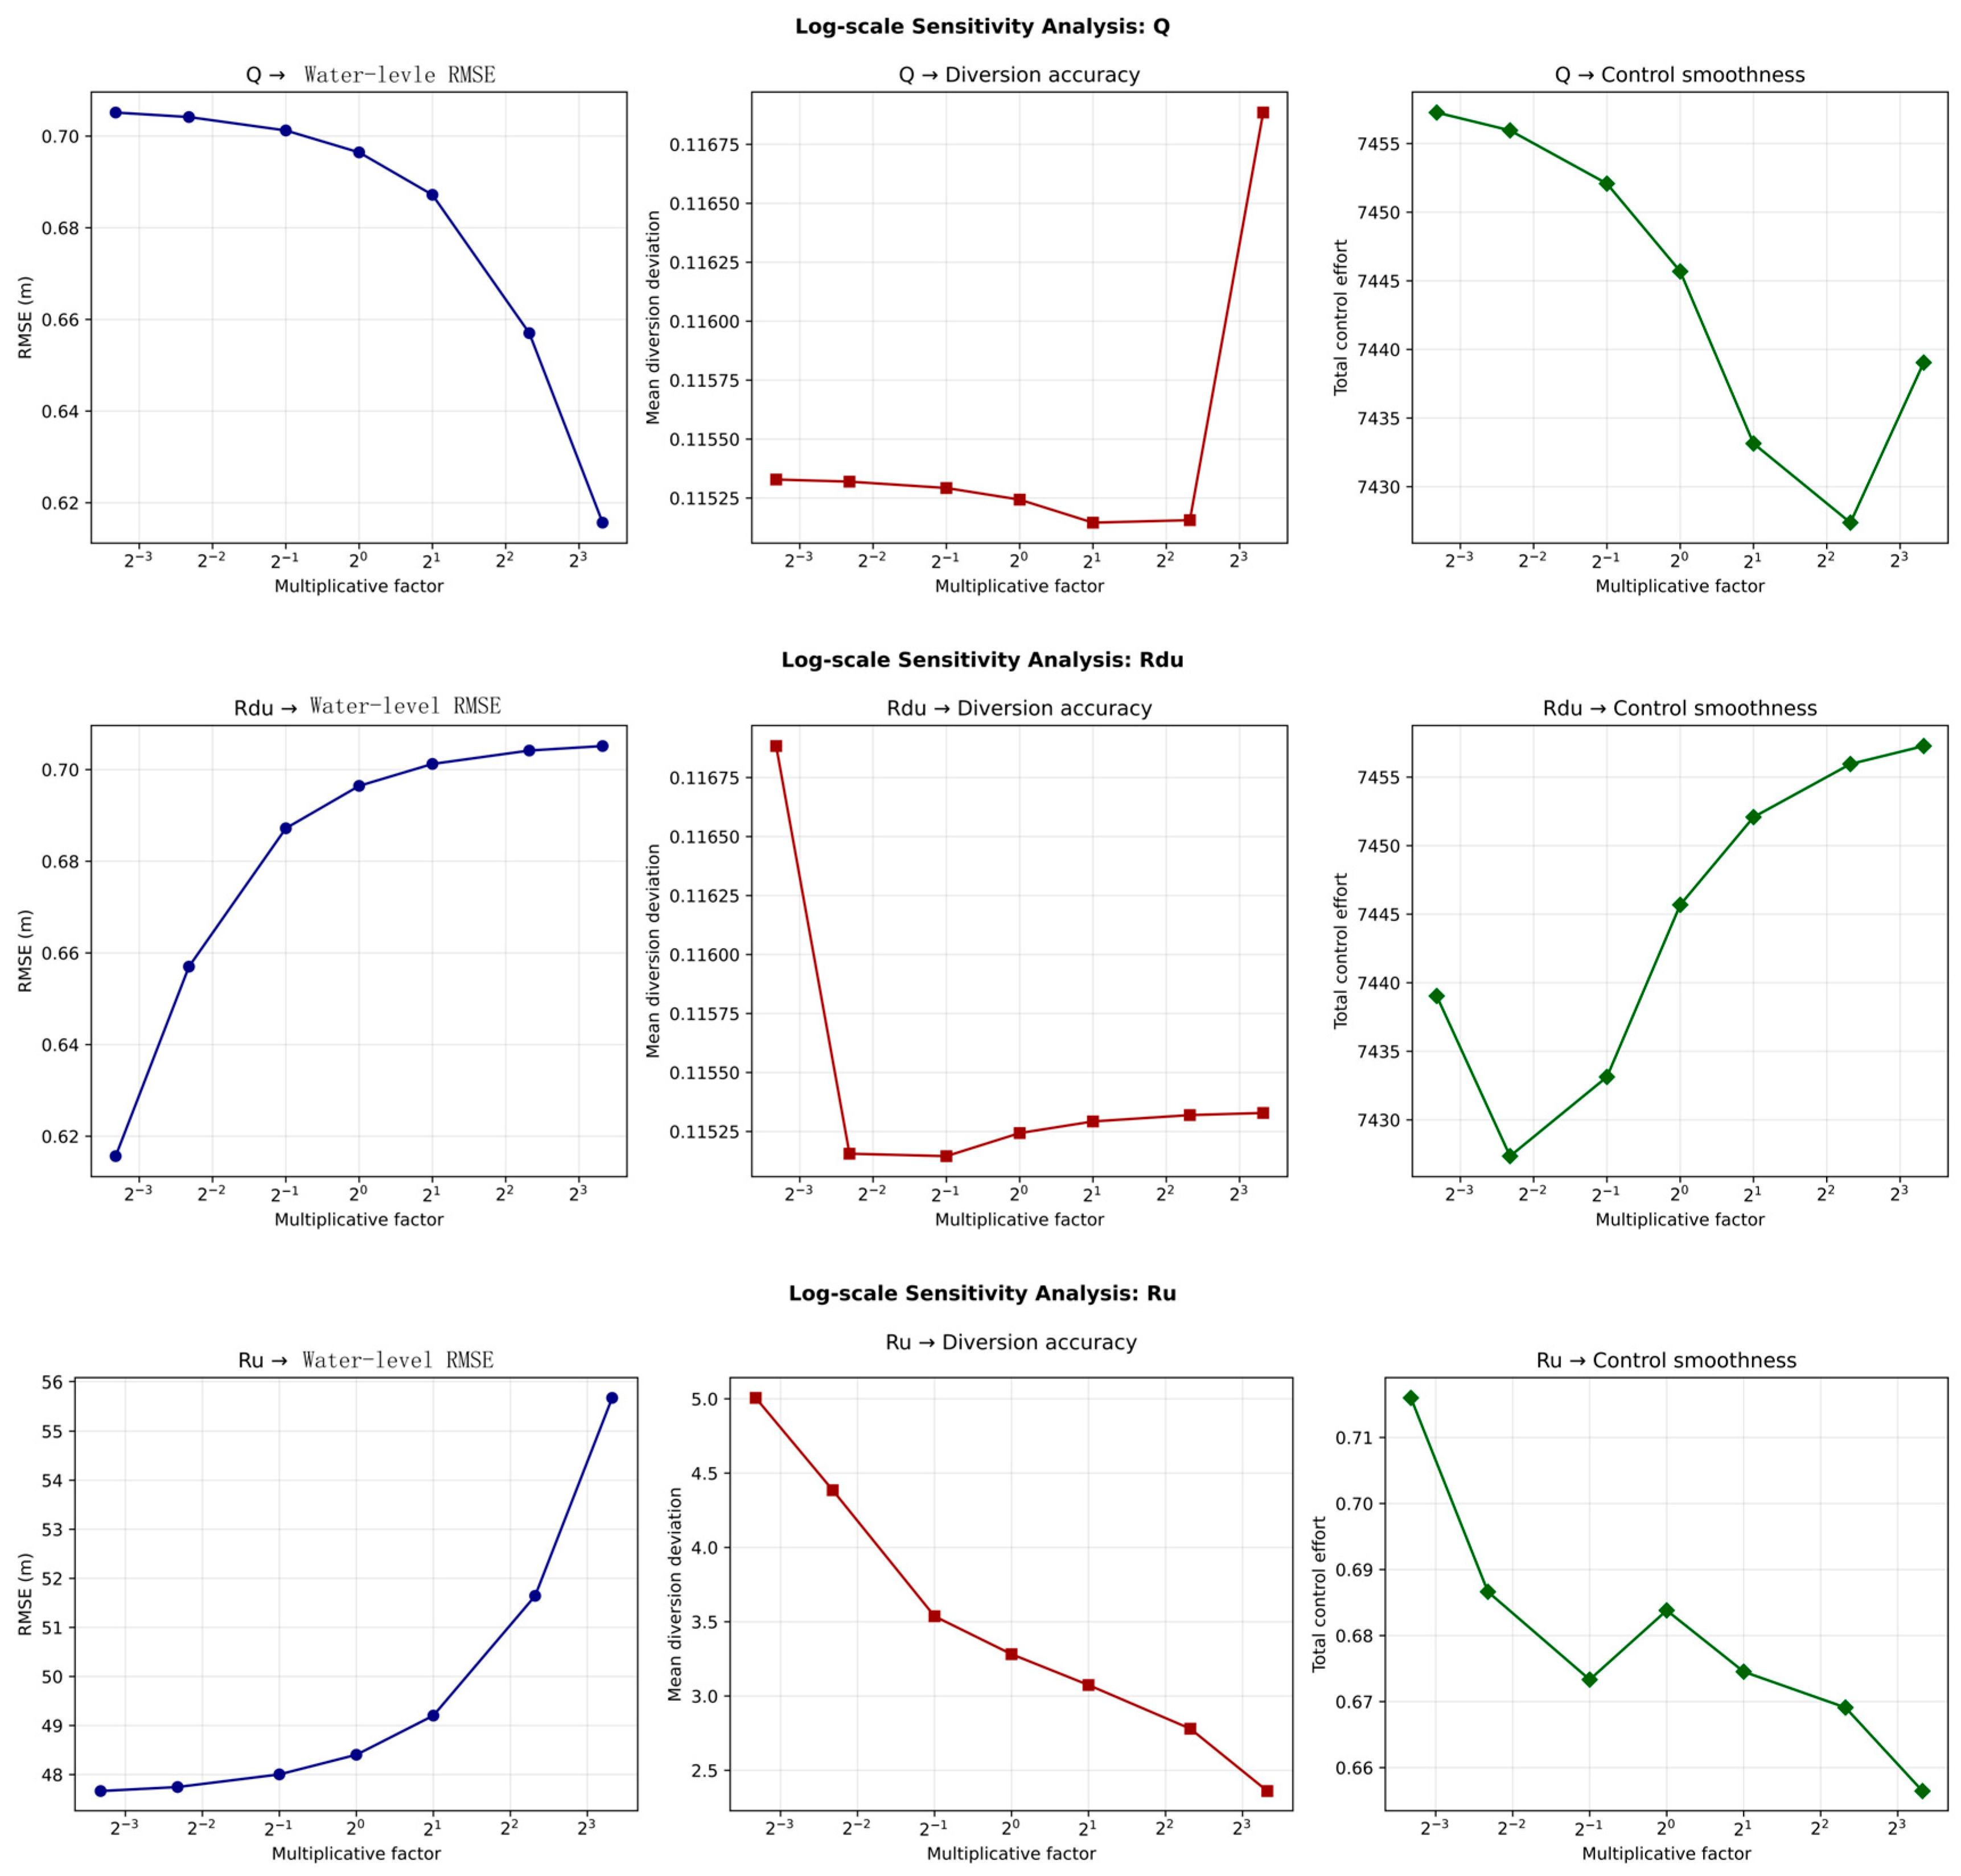
2.4.3. Weight Determination and Sensitivity Analysis
2.5. Model Validation
3. Results
3.1. Performance Under Water Storage Scenario
3.2. Performance Under Steady Water-Level Scenario
3.3. Performance Under Flood Discharge Scenario
4. Discussion
4.1. Advantages of the Proposed MPC Framework
- (1)
- Water-level stabilisation within 15.5 ± 0.2 m under all three scenarios;
- (2)
- Compliance with the daily drawdown limit (≤0.5 m/d) and diversion ratio deviation (≤5%);
- (3)
- A 21.3% reduction in water-level fluctuation (peak-to-peak) during the storage scenario compared to the natural state.
4.2. Comparison with Alternative Control Strategies
- (1)
- Current hysteretic rule-based control (Section 2.1.2): reacts only when the Waizhou water level crosses 15.5 m. It suffers from time lags, overshoot, and oscillations. No multi-objective coordination is included, and gate movements are frequent and not optimised.
- (2)
- PID control: A proportional–integral–derivative controller could continuously adjust gate openings to reduce water-level error. However, the long and variable time delay (≈2 h) causes integral windup and oscillations. Moreover, a single PID loop cannot simultaneously enforce diversion ratio constraints or branch discharge limits.
- (3)
- Static optimisation (e.g., solving optimal diversion ratios offline and applying them as fixed rules): this approach can balance flow distribution under average conditions, but it cannot adapt to inflow variations or respect daily water-level change limits. The MPC framework, by contrast, recomputes the control sequence every 12 h based on updated inflow forecasts, providing adaptability.
4.3. Practical Limitations and Their Implications
4.4. Future Work
5. Conclusions
- (1)
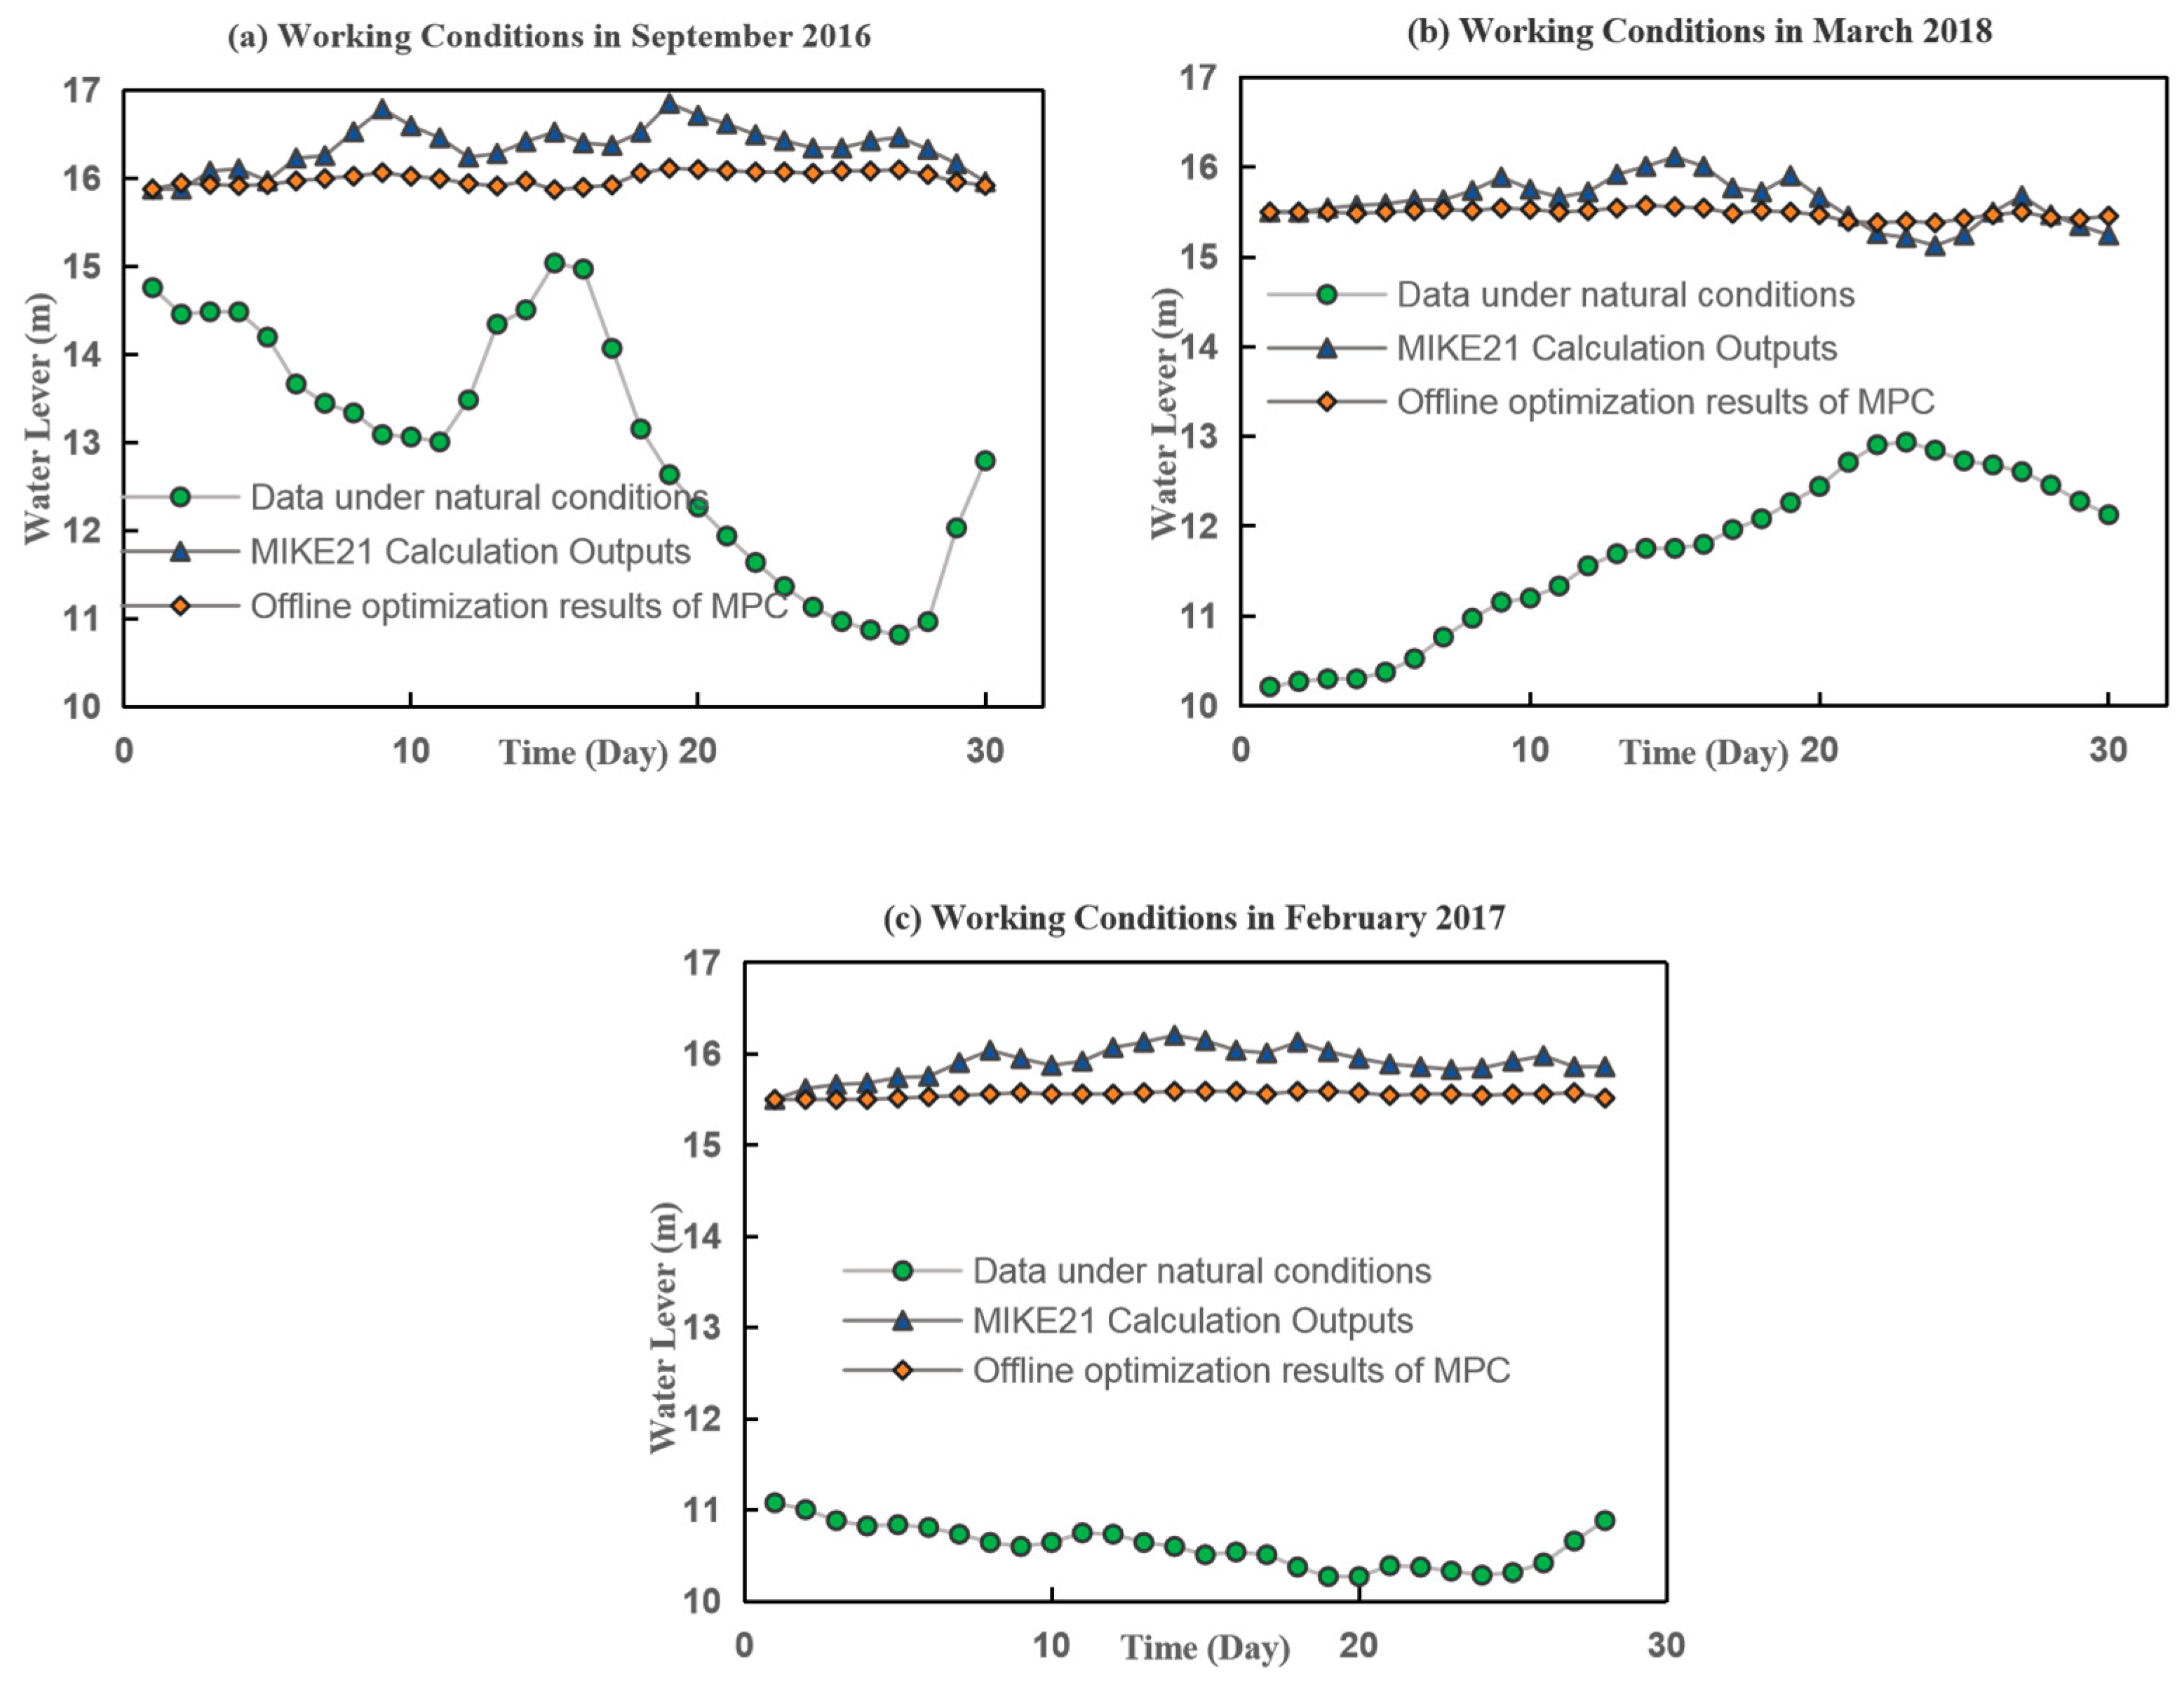
- Control sequence reconstruction experiments based on historical flood processes show that when MPC offline optimisation results are input into the MIKE21 hydrodynamic model, the simulated water level and the optimised sequence exhibit highly consistent fluctuation trends, confirming that the ID model accurately characterises the dynamic response of complex river network systems.
- (2)
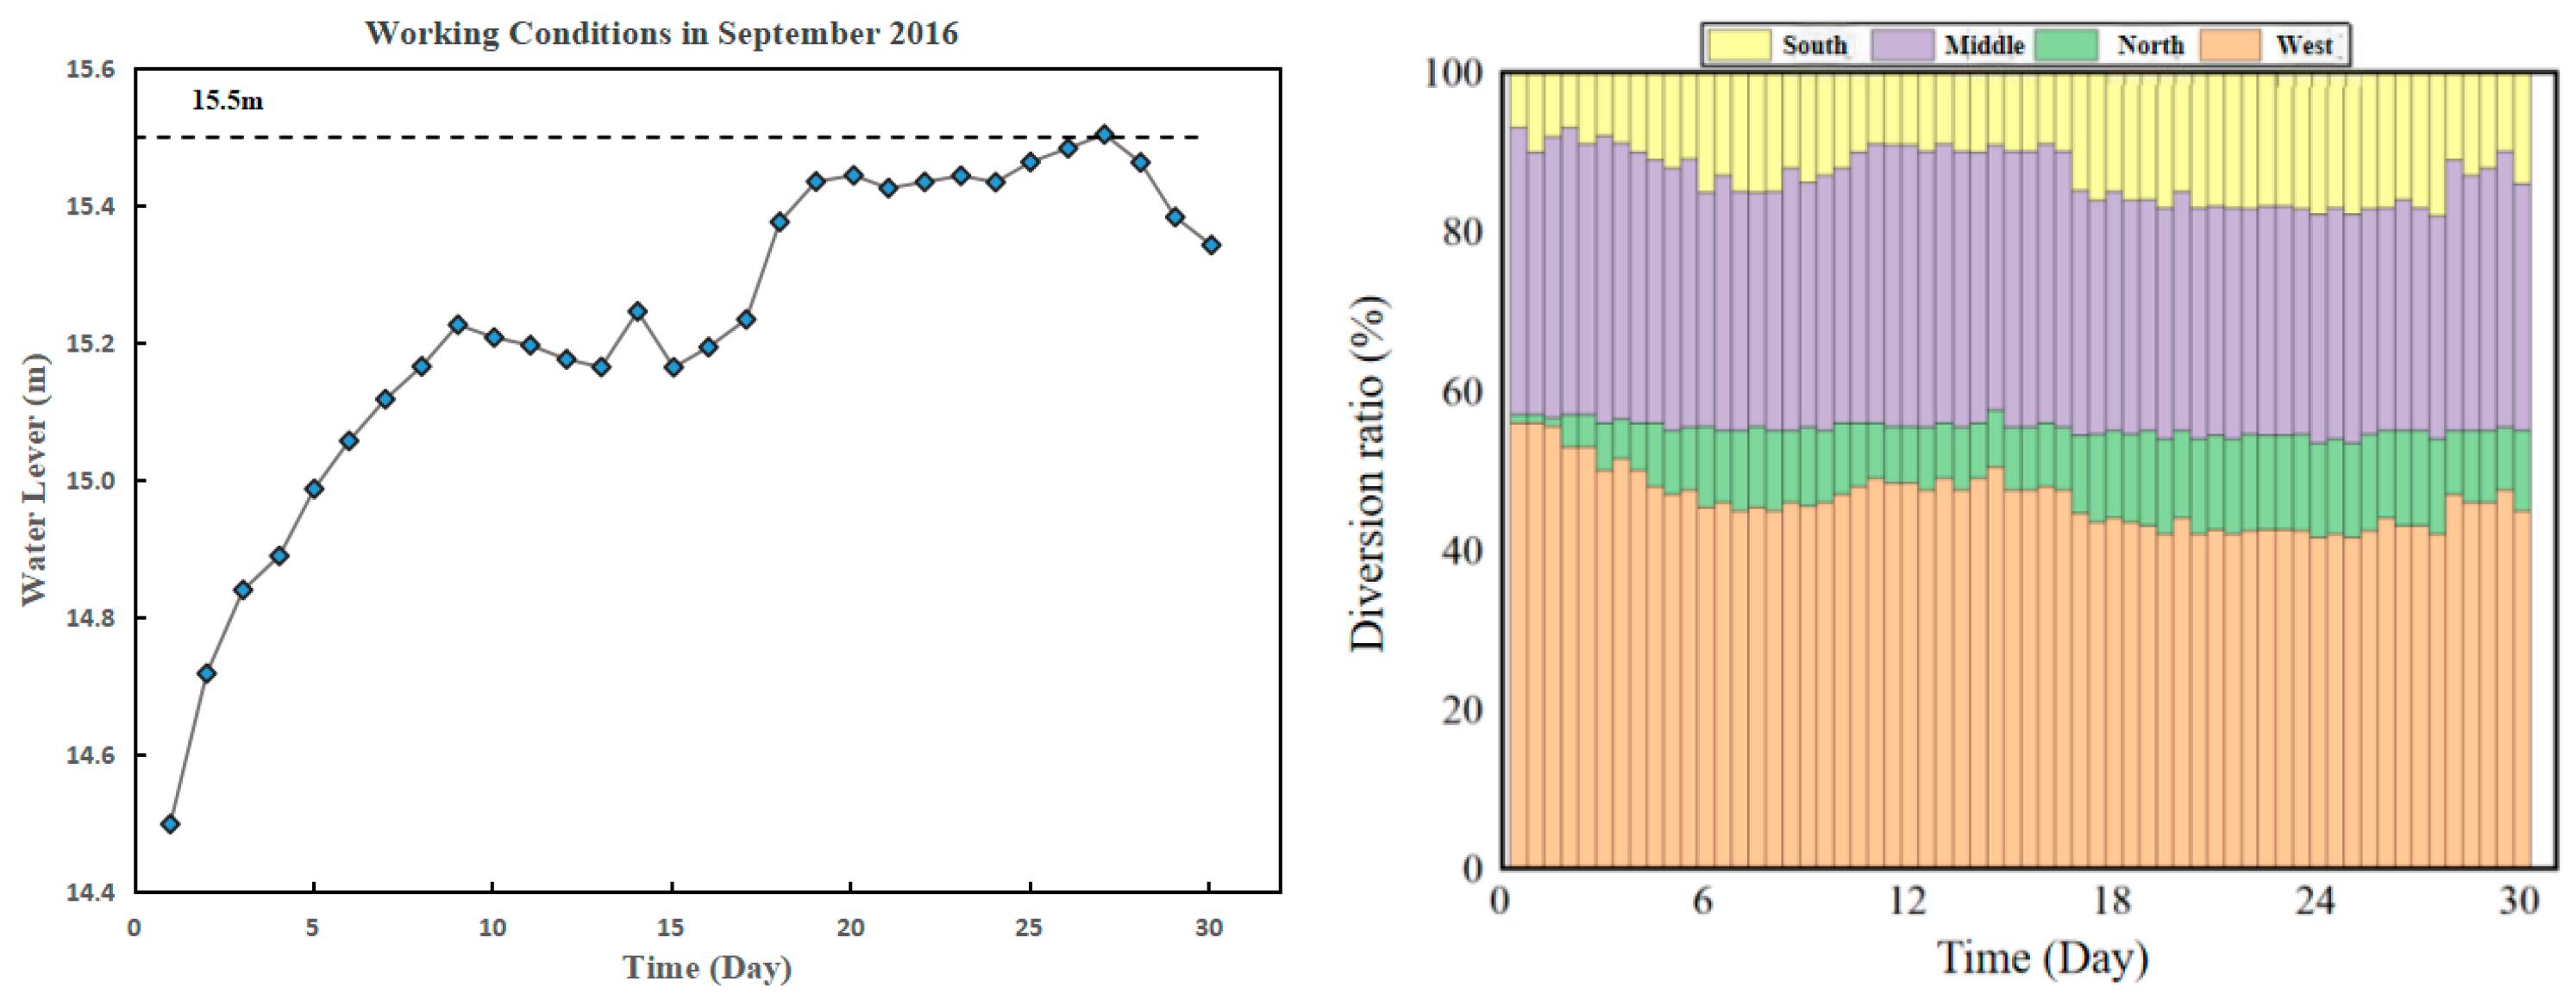
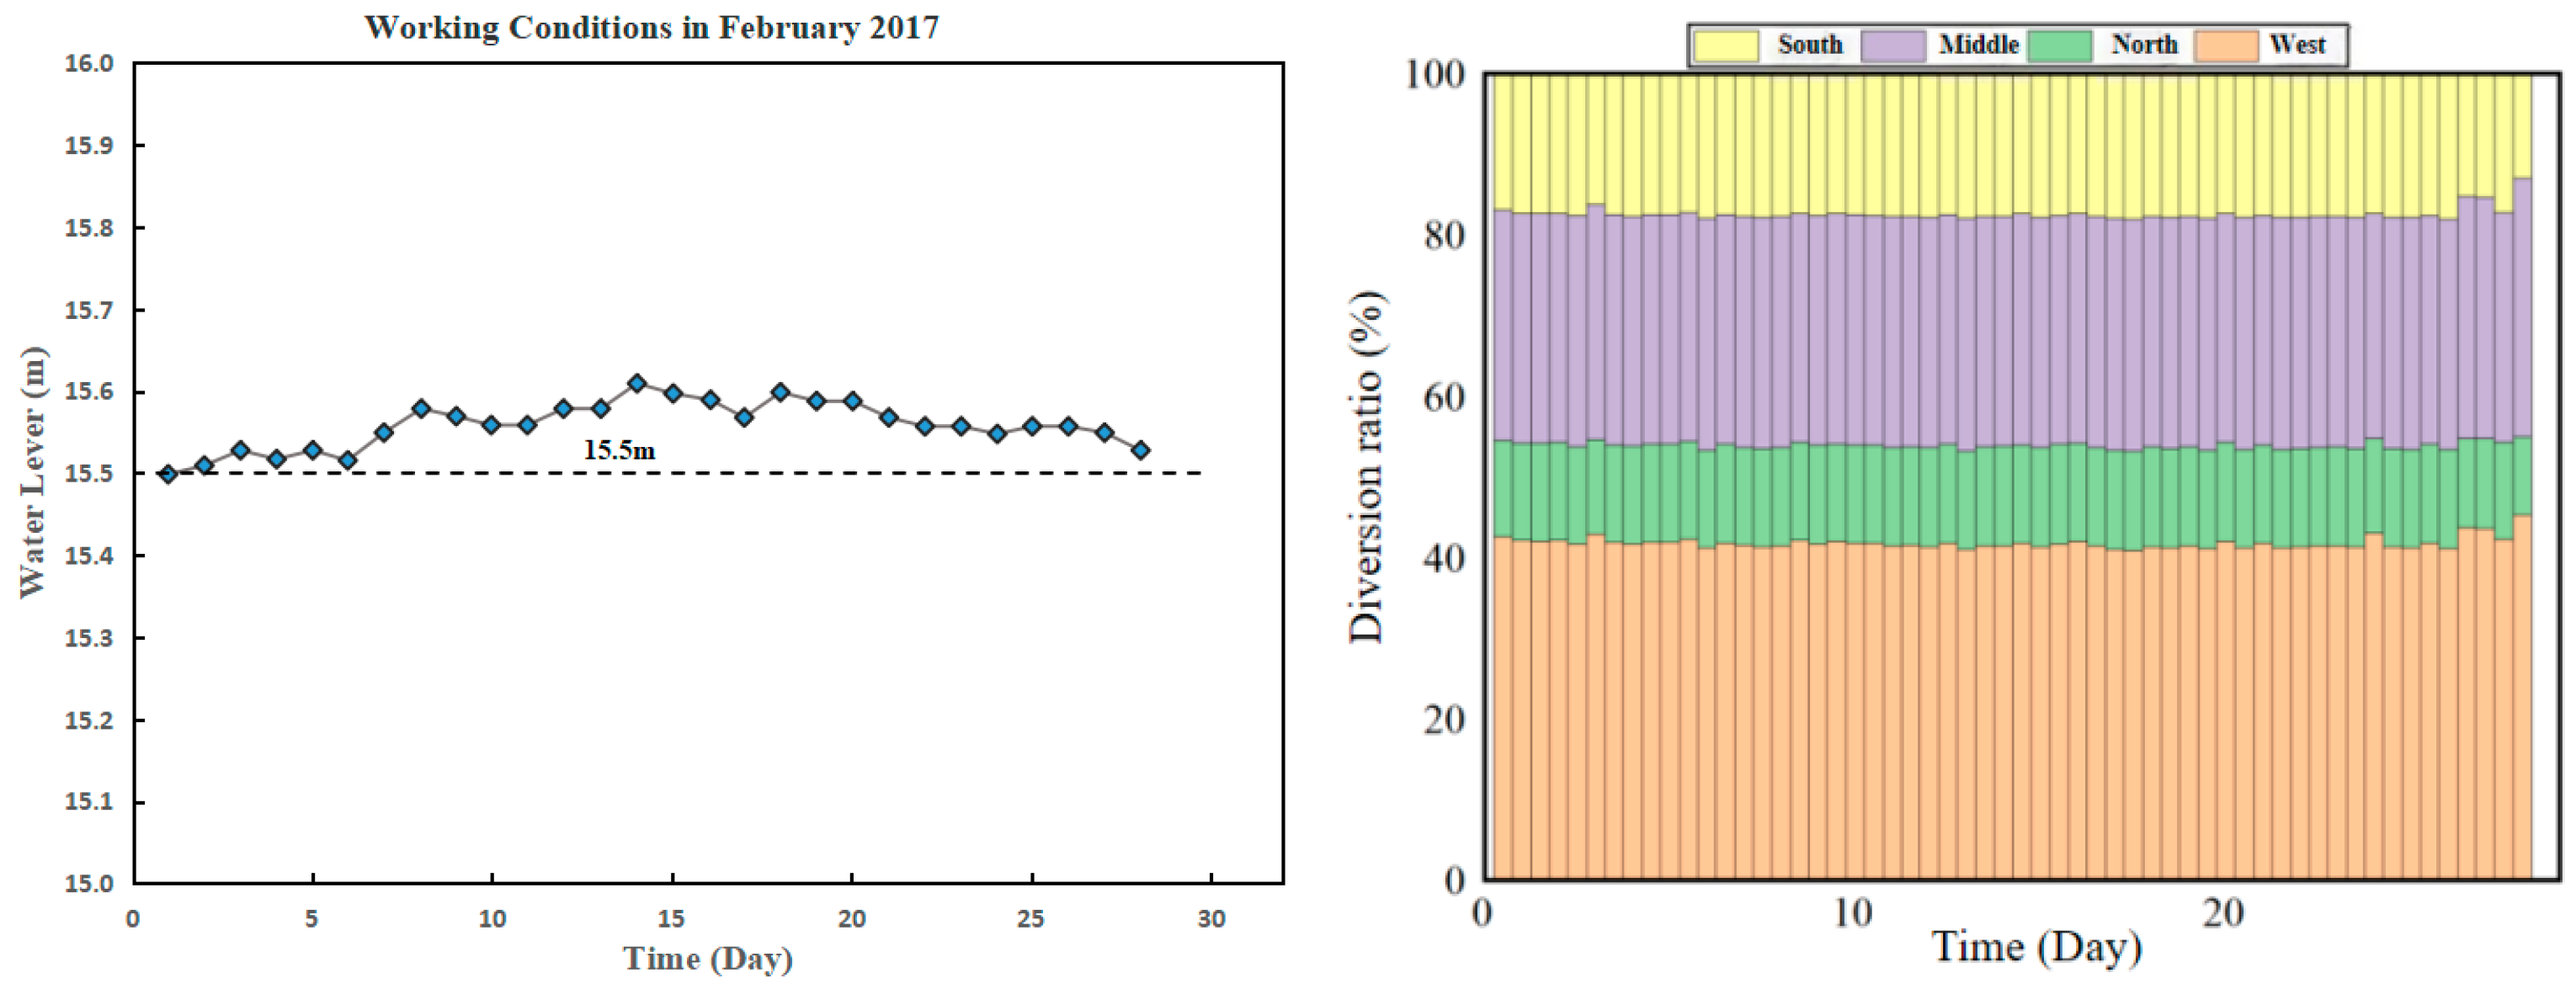
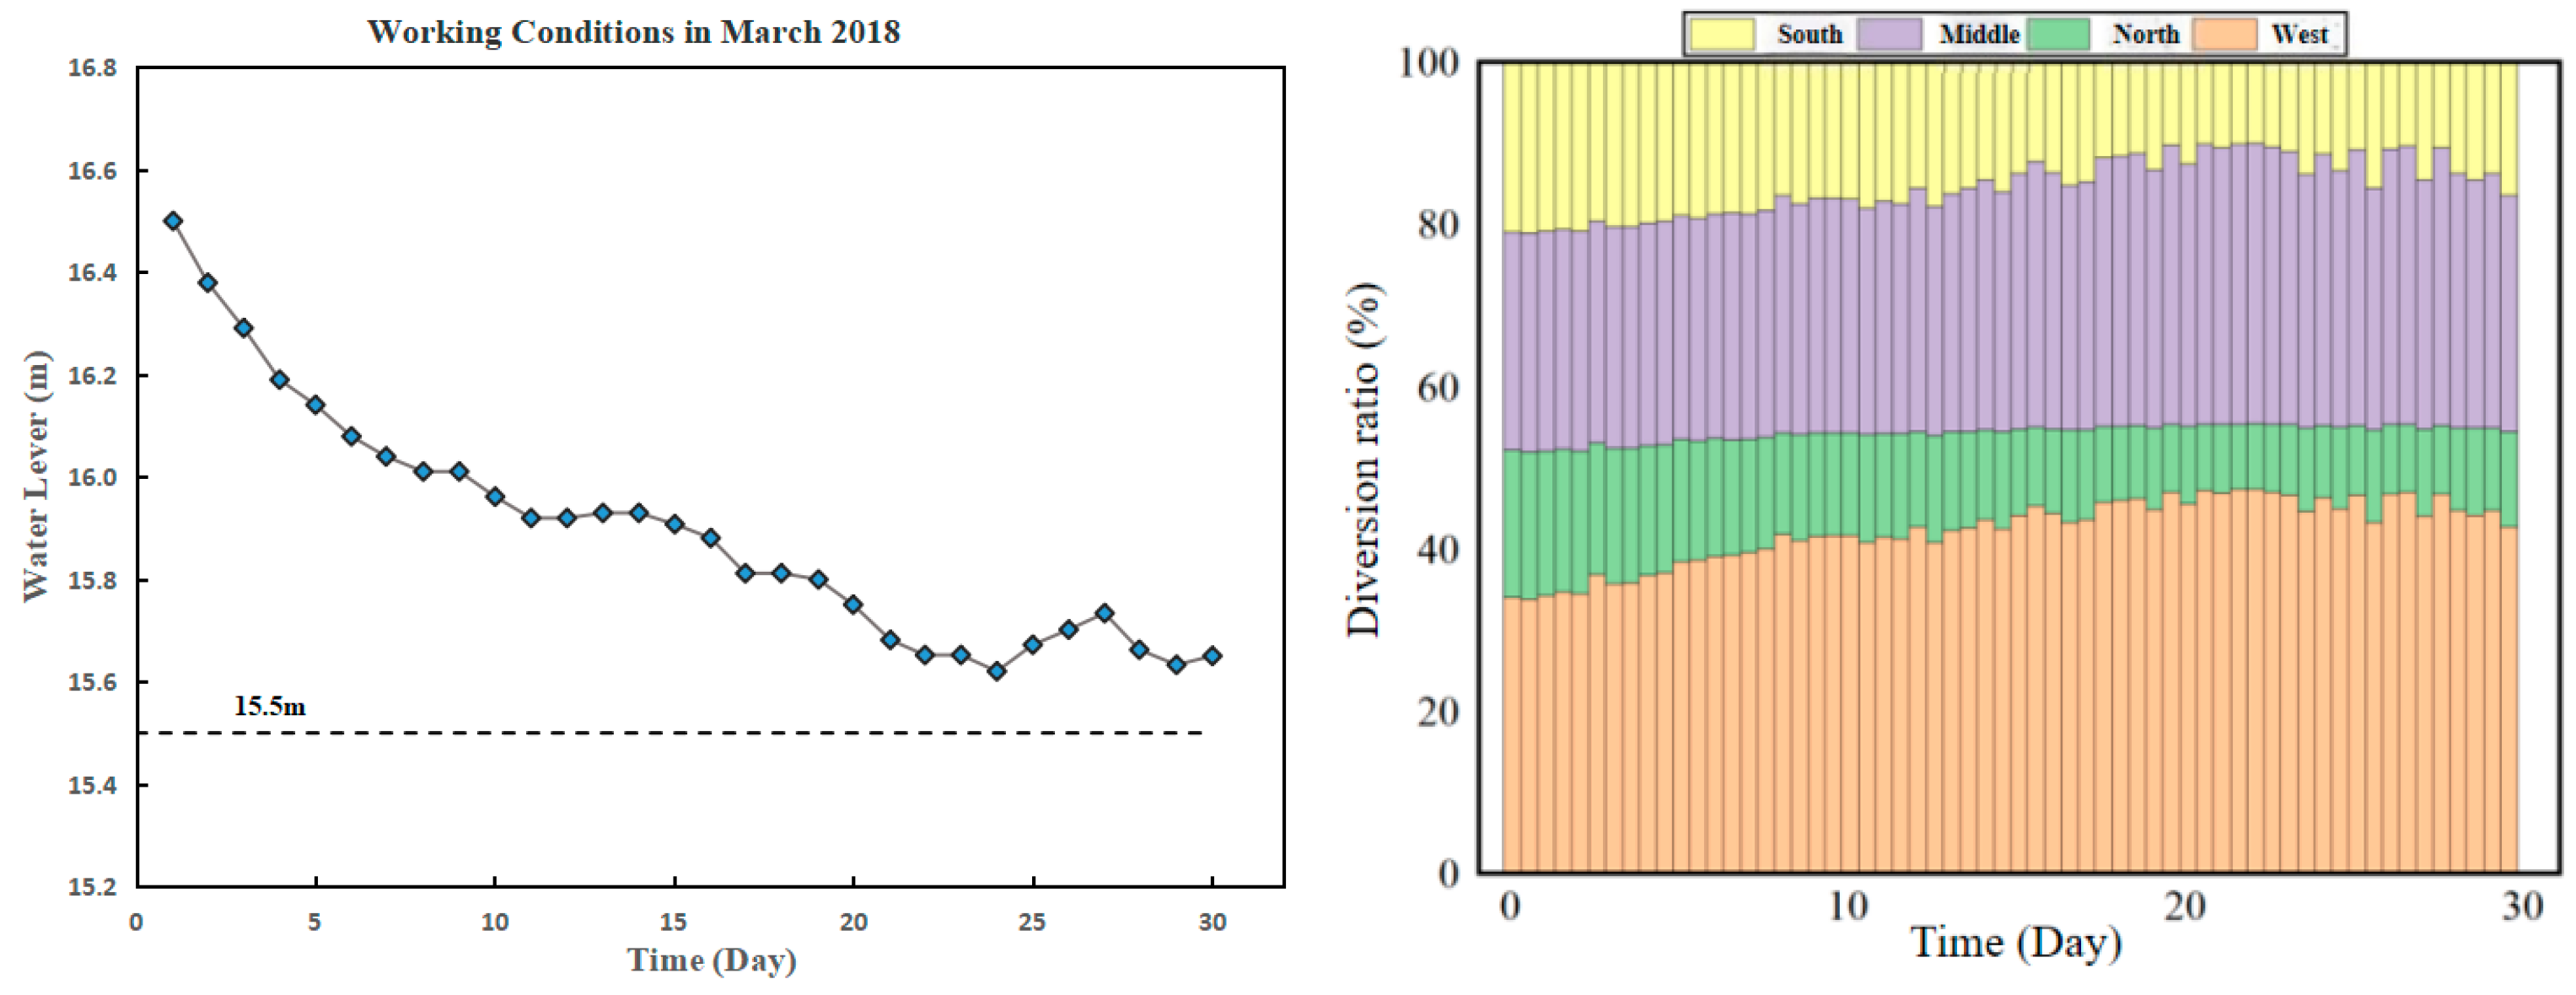
- Under three typical scenarios (water storage, steady water level, and flood discharge), the MPC controller stabilises the Waizhou water level within 15.5 ± 0.2 m while satisfying daily water-level variation ≤0.5 m/d (safety constraint) and diversion ratio deviation ≤5% (optimisation target). These results demonstrate the effectiveness of the offline-optimised sequences.
- (3)
- Through receding horizon optimisation and feedforward prediction based on inflow forecasts, the system adaptively adjusts branch diversion ratios, achieving a spatiotemporally balanced hydrodynamic distribution across the four branches of the Lower Ganjiang River under natural inflow heterogeneity (range 428–3427 m3/s).
- (4)
- Compared qualitatively with the current hysteretic control strategy, the MPC framework proactively compensates for time-delay effects, eliminating water-level overshoot and oscillation (e.g., proactive buffer adjustment in the storage scenario). It ensures ecological diversion ratios while reducing gate operation frequency, providing a promising framework for advanced regulation of complex river networks.
Author Contributions
Funding
Data Availability Statement
Conflicts of Interest
References
- Tang, H.W.; Yuan, S.Y.; Cao, H. Theory and Practice of Hydrodynamic Reconstruction in Plain River Networks. Engineering 2022, 8, 122–132. [Google Scholar]
- Huang, X.F.; Wang, N.; Liu, Z.J.; Fang, G.; Qian, J. Multi-objective optimal operation of cascade reservoirs based on improved NSGA-II algorithm. Adv. Sci. Technol. Water Resour. 2024, 44, 51–58. [Google Scholar]
- Xu, W.; Zang, X.D.; Xia, B.; Zhang, L.; Yang, L. Research on flood storage and scheduling of cascade rubber dam groups based on HMOPSO algorithm. J. Shenyang Agric. Univ. 2025, 56, 73–81. [Google Scholar]
- Deb, K.; Pratap, A.; Agarwal, S.; Meyarivan, T.A.M.T. A fast and elitist multiobjective genetic algorithm: NSGA-II. IEEE Trans. Evol. Comput. 2002, 6, 182–197. [Google Scholar] [CrossRef] [Scilit]
- Zhang, Q.; Li, H. MOEA/D: A multiobjective evolutionary algorithm based on decomposition. IEEE Trans. Evol. Comput. 2007, 11, 712–732. [Google Scholar] [CrossRef] [Scilit]
- Zhang, X.M.; Tang, L.M.; Wan, Y.; You, W.; Wang, Z. Study on hydrodynamic spatial optimization of multi-level branched channels in Ganjiang River estuary. Water Resour. Hydropower Eng. 2025, 56, 131–148. [Google Scholar]
- Van Overloop, P.J.; Clemmens, A.J.; Strand, R.J.; Wagemaker, R.M.J.; Bautista, E. Real-time implementation of model predictive control on Maricopa-Stanfield Irrigation and Drainage District’s WM Canal. J. Irrig. Drain. Eng. 2010, 136, 747–756. [Google Scholar] [CrossRef] [Scilit]
- Xu, M.; Van Overloop, P.J.; Van de Giesen, N.C. Model reduction in model predictive control of combined water quantity and quality in open channels. Environ. Model. Softw. 2013, 42, 72–87. [Google Scholar] [CrossRef] [Scilit]
- Kong, L.Z.; Lei, X.H.; Zhang, Z.; Zhu, J.; Wang, H. Research on multi-target water level predictive control model of multi-stage cascaded open channel water diversion project. J. Hydraul. Eng. 2022, 53, 421–432. [Google Scholar]
- Zhou, S.F.; Huang, Z.W.; Tang, L.M.; Xu, X.F. Analysis on influencing factors of flow diversion ratio and linkage response of multistage bifurcations in the Ganjiang River. J. Hohai Univ. 2019, 47, 163–169. [Google Scholar]
- Wang, Z.C.; Xu, X.F.; Huang, Z.W.; Wu, N.H.; Zhou, S.F. Siltation characteristics of the tail reach of Ganjiang River under the regulation of estuary gates. Water Sci. Technol. Water Supply 2020, 20, 3707–3714. [Google Scholar] [CrossRef] [Scilit]
- Hu, Y.C.; Cheng, L.; Yang, H. Changes in Flood Control Regime for the Tail of Ganjiang River. J. Change River Sci. Res. Inst. 2024, 41, 202–208. [Google Scholar]
- Schuurmans, J.; Bosgra, O.H.; Brouwer, R. Open-channel flow model approximation for controller design. Appl. Math. Model. 1995, 19, 525–530. [Google Scholar] [CrossRef] [Scilit]
- Isapoor, S.; Montazar, A.; Van Overloop, P.J.; Van De Giesen, N. Designing and evaluating control systems of the Dez main canal. Irrig. Drain. 2011, 60, 70–79. [Google Scholar] [CrossRef] [Scilit]
- Perez, R.R.; Batlle, V.F.; Rodriguez, L.S. Robust system identification of an irrigation main canal. Adv. Water Resour. 2007, 30, 1785–1796. [Google Scholar] [CrossRef] [Scilit]
- Andersson, J.; Gillis, J.; Horn, G.; Rawlings, J.; Diehl, M. CasADi: A software framework for nonlinear optimization and optimal control. Math. Program. Comput. 2019, 11, 1–36. [Google Scholar] [CrossRef] [Scilit]
- Wächter, A.; Biegler, L.T. On the implementation of an interior-point filter line-search algorithm for large-scale nonlinear programming. Math. Program. 2006, 106, 25–57. [Google Scholar]



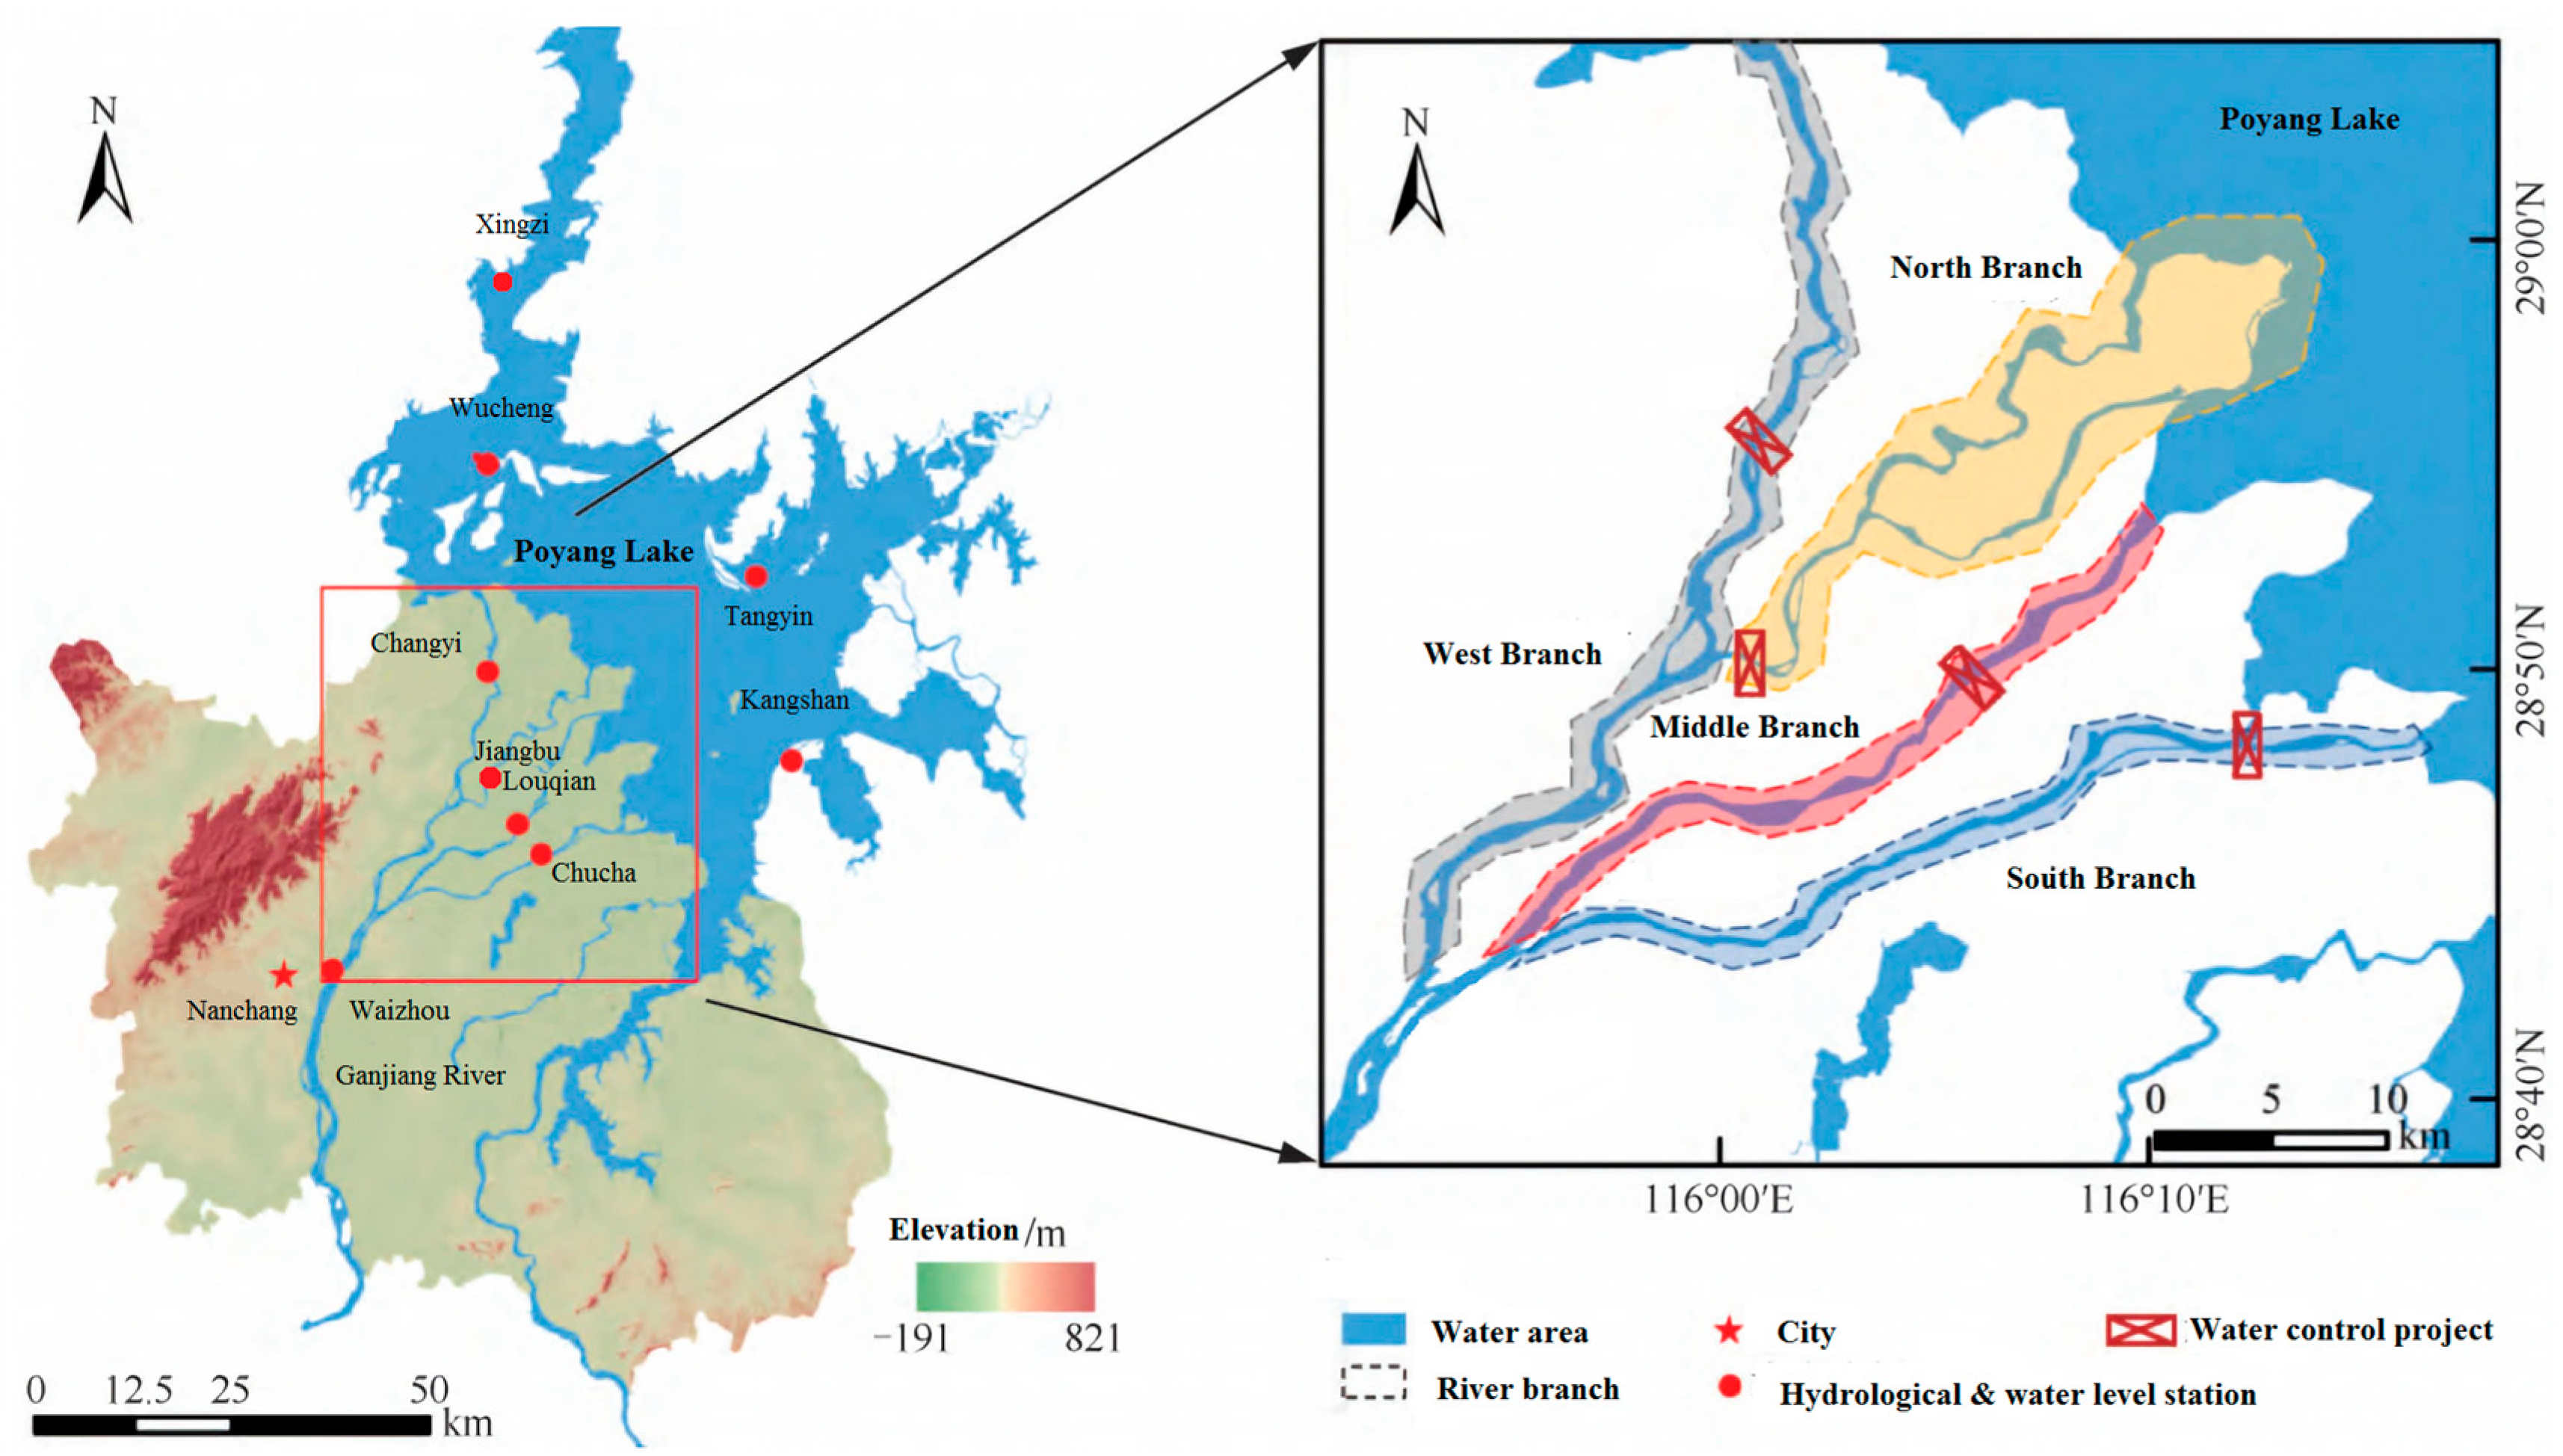
| Branch | Control Hub | Distance from Nanchang City (km) | Maximum Discharge Capacity at 15.5 m (m3/s) | Minimum Ecological/ Navigation Flow (m3/s) |
|---|---|---|---|---|
| West Branch | Xiangshan Hub | 35 | 2700 | 246.5 |
| North Branch | Lianxin Hub | 28 | 300 | 17.4 |
| Middle Branch | Nanxin Hub | 23 | 1400 | 140.6 |
| South Branch | Jili Hub | 35 | 400 | 90.5 |
| Period | Time Range | Primary Objective | Control Logic | Key Constraints |
|---|---|---|---|---|
| Flood season | April–July | Flood safety | All gates fully opened; natural flood discharge is maintained with no active regulation. | None |
| Dry season | August–March of the following year | Water level stabilisation, flow distribution optimisation, and ecological water supplementation | Hierarchical regulation based on the following two criteria: (1) Waizhou water level; (2) Xingzi water level | Daily drawdown ≤0.5 m/d; minimum total release ≥495 m3/s |
| Month | Waizhou Water Level (m) | Waizhou Flow (m3/s) | Propagation Time (Flood/Dry Season, Waizhou Tributary) (h) | |||
|---|---|---|---|---|---|---|
| West Branch (50 km from Waizhou) | North Branch (32 km from Waizhou) | Middle Branch (34 km from Waizhou) | South Branch (34 km from Waizhou) | |||
| 1 | 12.91 | 2270 | 4 | 2 | 2 | 2 |
| 2 | 10.35 | 751 | 15 | 6 | 3 | 3 |
| 3 | 12.90 | 2050 | 4 | 2 | 2 | 2 |
| 4 | 11.23 | 972 | 10 | 5 | 3 | 3 |
| 5 | 13.77 | 2460 | 4 | 2 | 2 | 2 |
| 6 | 17.52 | 9110 | 2 | 1 | 1 | 2 |
| 7 | 16.47 | 6700 | 3 | 2 | 1 | 1 |
| 8 | 14.58 | 1620 | −2 | −1 | 0 | 0 |
| 9 | 11.57 | 1060 | 14 | 6 | 2 | 2 |
| 10 | 11.58 | 1270 | 5 | 3 | 2 | 1 |
| 11 | 14.53 | 3790 | 4 | 2 | 2 | 2 |
| 12 | 12.95 | 2240 | 4 | 2 | 2 | 2 |
| Scenario | Time Period | Maximum Flow (m3/s) | Minimum Flow (m3/s) | Flow Variation (m3/s) |
|---|---|---|---|---|
| Scenario 1 | September 2016 | 4200 | 773 | 3427 |
| Scenario 2 | March 2018 | 2050 | 789 | 1261 |
| Scenario 3 | February 2017 | 1110 | 682 | 428 |
| Scenario | MAE (m) | RMSE (m) | Max Error (m) | NSE |
|---|---|---|---|---|
| September 2016 | 0.26 | 0.34 | 0.90 | 0.92 |
| March 2018 | 0.15 | 0.19 | 0.48 | 0.96 |
| February 2017 | 0.09 | 0.12 | 0.31 | 0.98 |
| Metric | Natural Condition | MPC Regulation | Improvement/Compliance |
|---|---|---|---|
| Mean water level (m) | 12.24 | 15.42 | / |
| Peak-to-peak fluctuation (m) | 1.69 | 1.33 | 21.3% reduction |
| Maximum daily drawdown (m/d) | 1.12 | 0.48 | ≤0.5 (compliant) |
| Max diversion ratio deviation (%) | 38.2 | 4.7 | ≤5% (compliant) |
| Average control increment (m3/s per 12 h) | / | 24.6 | / |
| Gate movements (count) | / | 14 | / |
| Metric | Natural Condition | MPC Regulation | Improvement/Compliance |
|---|---|---|---|
| Mean water level (m) | 12.95 | 15.52 | / |
| Maximum daily drawdown (m/d) | 0.34 | 0.09 | ≤0.5 (compliant) |
| Max diversion ratio deviation (%) | 41.5 | 3.8 | ≤5% (compliant) |
| Average control increment (m3/s per 12 h) | / | 9.7 | / |
| Gate movements (count) | / | 6 | / |
| Metric | Natural Condition | MPC Regulation | Improvement/Compliance |
|---|---|---|---|
| Mean water level (m) | 13.68 | 15.45 | / |
| Maximum daily drawdown (m/d) | 1.58 | 0.49 | ≤0.5 (compliant) |
| Max diversion ratio deviation (%) | 35.2 | 4.9 | ≤5% (compliant) |
| Average control increment (m3/s per 12 h) | / | 51.2 | / |
| Gate movements (count) | / | 22 | / |
Disclaimer/Publisher’s Note: The statements, opinions and data contained in all publications are solely those of the individual author(s) and contributor(s) and not of MDPI and/or the editor(s). MDPI and/or the editor(s) disclaim responsibility for any injury to people or property resulting from any ideas, methods, instructions or products referred to in the content. |
© 2026 by the authors. Licensee MDPI, Basel, Switzerland. This article is an open access article distributed under the terms and conditions of the Creative Commons Attribution (CC BY) license.
Share and Cite
Zhou, S.; Zhang, X.; Huang, Z.; Tang, L. Model Predictive Control-Based Hydrodynamic Regulation Framework for the Lower Ganjiang River. Hydrology 2026, 13, 203. https://doi.org/10.3390/hydrology13080203
Zhou S, Zhang X, Huang Z, Tang L. Model Predictive Control-Based Hydrodynamic Regulation Framework for the Lower Ganjiang River. Hydrology. 2026; 13(8):203. https://doi.org/10.3390/hydrology13080203
Chicago/Turabian StyleZhou, Sufen, Xinming Zhang, Zhiwen Huang, and Limo Tang. 2026. "Model Predictive Control-Based Hydrodynamic Regulation Framework for the Lower Ganjiang River" Hydrology 13, no. 8: 203. https://doi.org/10.3390/hydrology13080203
APA StyleZhou, S., Zhang, X., Huang, Z., & Tang, L. (2026). Model Predictive Control-Based Hydrodynamic Regulation Framework for the Lower Ganjiang River. Hydrology, 13(8), 203. https://doi.org/10.3390/hydrology13080203