


Abstract
Variations in urban surface runoff are often attributed to static infrastructure, neglecting the non-stationary hydrological responses induced by rapid urbanization and intricate micro-topography. This study introduces a Pressure–Trend–Pulse (PTP) framework to examine surface runoff dynamics in Kunming, China. By integrating continuous Soil and Water Assessment Tool (SWAT) simulations (2005–2024), Sen’s slope estimation, the Mann–Kendall test, robust residual analysis, and Self-Organizing Map (SOM) clustering, we quantify these multi-dimensional changes. The findings indicate: (1) runoff displays a structural north–south gradient, with the generation centroid migrating northward at a rate of 2.3 km per decade; (2) non-stationary positive trends (0.16 mm/year) are exclusively concentrated in northern sub-basins, which constitute 26.74% of the total area, thereby exacerbating long-term cumulative pressure; and (3) detrended residual analysis reveals high-frequency pulse volatility predominantly in the southern sink areas. Overlaying 139 historical waterlogging points confirms that trend-driven and pulse-driven risks account for 30.22% and 13.67% of urban disasters, respectively. Furthermore, approximately 22% of waterlogging occurrences fall within non-significant downstream zones, implying a potential upstream-downstream source–sink decoupling. The PTP framework highlights the necessity of differentiated resilience planning: upstream source-control and downstream adaptive buffering.
1. Introduction
In the majority of global hydrological studies, the spatiotemporal heterogeneity of urban surface runoff is primarily interpreted through the conventional lenses of infrastructural functionality and disaster risk mitigation [1,2]. Nevertheless, the evolutionary characteristics of surface runoff rarely conform to static planning frameworks [3]. Constrained by urbanization and complex micro-topography, runoff tends to exhibit unbalanced and unstable hydrological responses [1]. Modeling studies in Hillsborough, USA [4], Valencia, Spain [5], and Busan, South Korea [6] confirm that highly permeable sub-basins are most effective at reducing runoff volume. However, linear relationships may become unstable in rapidly urbanizing areas, calling for time-varying parameter models or phased analyses to capture the evolution of the development–runoff nexus [7,8,9].
The rapid urbanization of China over the past four decades has fundamentally altered urban surface runoff patterns [10]. This transformation is particularly pronounced in plateau and mountainous cities due to the compounded effects of extreme topographic gradients and inherent ecological fragility [11]. Hydrological responses in complex mountainous terrain often manifest higher spatial sensitivity and disaster complexity compared to those in topologically uniform plain cities [12,13]. This makes standard mitigation strategies based on a single spatial factor difficult to apply successfully. As a typical mountainous and plateau lakefront city, Kunming’s spatial strategy of ‘northward expansion,’ actively implemented since 2021, has substantially intensified the developmental density of its northern mountainous peripheries. This has led to large increases in overall urban surface runoff [10]. Current stormwater management still adheres to the plain-based ‘on-site discharge’ approach, failing to adequately account for the unique upstream- downstream gravity-cascading effects in mountainous environments [2]. Beyond the traditional “runoff generation to disaster” framework, some studies efforts have highlighted the importance of spatially coupled hydrological connectivity [2,14], exploring a “generation–confluence–disaster” cascade pattern driven primarily by topographical gravity. While the macro-telecoupling of water resources (such as transboundary water transfers) has been extensively studied to address structural droughts [15], disaster attribution in plateau cities based on micro-level spatially coupled hydrological connectivity models remains significantly underexplored [14].
Generally, research on the effects of urbanization on hydrological processes has undergone an evolution from ‘concentrated total control’ to ‘distributed spatiotemporal attribution’ [16,17]. Early studies were mostly based on empirical models such as a single Soil Conservation Service Curve Number (SCS-CN), focusing on the linear relationship between impervious surface proportion and runoff coefficient, in order to estimate the runoff increment in a single dimension [18,19]. With the development of spatial modeling methods, research has shifted to the spatial heterogeneity of runoff driven by multiple sources. Distributed hydrological models (such as SWAT, SWMM, VIC, and HSPF) have been widely used to quantify the hydrological responses and to identify runoff hotspots of different landscape patterns [18,20].
In the temporal dimension, past studies have largely centered on the long-term coupling influence between macro-precipitation trends and macroscopic urbanization processes [10,21,22]. However, spatial heterogeneity mapping alone is insufficient [23]. When dynamically coupling the continuous development of urban infrastructure with structural shifts in localized land-surface morphologies, urban hydrological systems increasingly manifest nonlinear and non-stationary characteristics [10,22]. Slater et al. pointed out that non-stationarity should be decomposed into two dimensions, the long-term ‘trend’ and the short-term ‘volatility’ [24]. However, in most current studies, when dealing with long-term time series data, they still follow or implicitly assume the stationarity of hydrological processes or periodicity [25]. This implicit assumption presupposes that future hydrological regimes (such as the mean and variance of discharge) will perpetually remain in a steady state, limiting risk assessments to the mere identification of mean drift or a single linear trend [24]. In practical physical processes, hydrological non-stationarity manifests in multiple distinct forms [25,26]. Specifically, first-order non-stationarity refers to a gradual, continuous drift in the mean state [27,28]. Second-order non-stationarity involves severe changes in variability characteristics even when the mean remains ostensibly stable [29]. Structural non-stationarity denotes abrupt regime shifts where underlying hydrological mechanisms undergo fundamental, irreversible transformations [30].
This study focuses on the built-up area of Kunming and proposes an analytical framework under non-stationarity. We define a Pressure–Trend–Pulse (PTP) framework [31,32,33], including three core indicators: (1) pressure—a baseline state indicator representing the current overall runoff-generation potential under a stable land-surface and climate background, conceptually mirroring foundational ecological pressure metrics; (2) trend—the long-term rate of change reflecting cumulative pressure on the drainage system; (3) pulse—a quantitative indicator representing the short-term stochastic fluctuation component isolated after mathematical detrending [34,35,36]. The continuously growing “trend” represents the cumulative pressure of the system, which causes the total runoff volume to gradually exceed the design threshold of the infrastructure, resulting in “normal overload”. The sharp fluctuations represent the pulse-like impact of the system. Such high-frequency and high-intensity oscillations are often the direct causes of system failure and extreme disasters [3,36]. Additionally, crowdsourced data on urban waterlogging points (WLPs) were acquired to empirically validate the spatial simulation results. This allows exploration of disaster-triggering mechanisms such as the source–sink decoupling, and supports proposing resilience regulation strategies from a non-stationary perspective. The study offers new insights for risk attribution and spatial management in high-density mountainous cities facing uncertain urban runoff disasters.
2. Research Area and Materials
2.1. Study Area
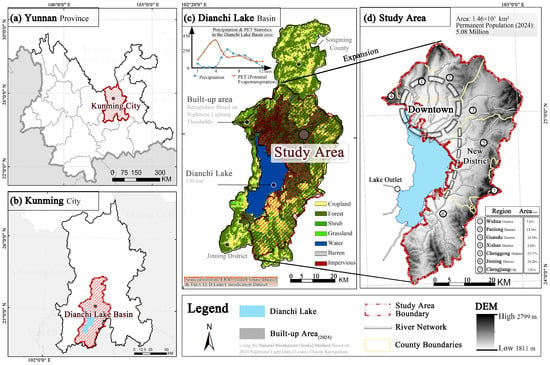
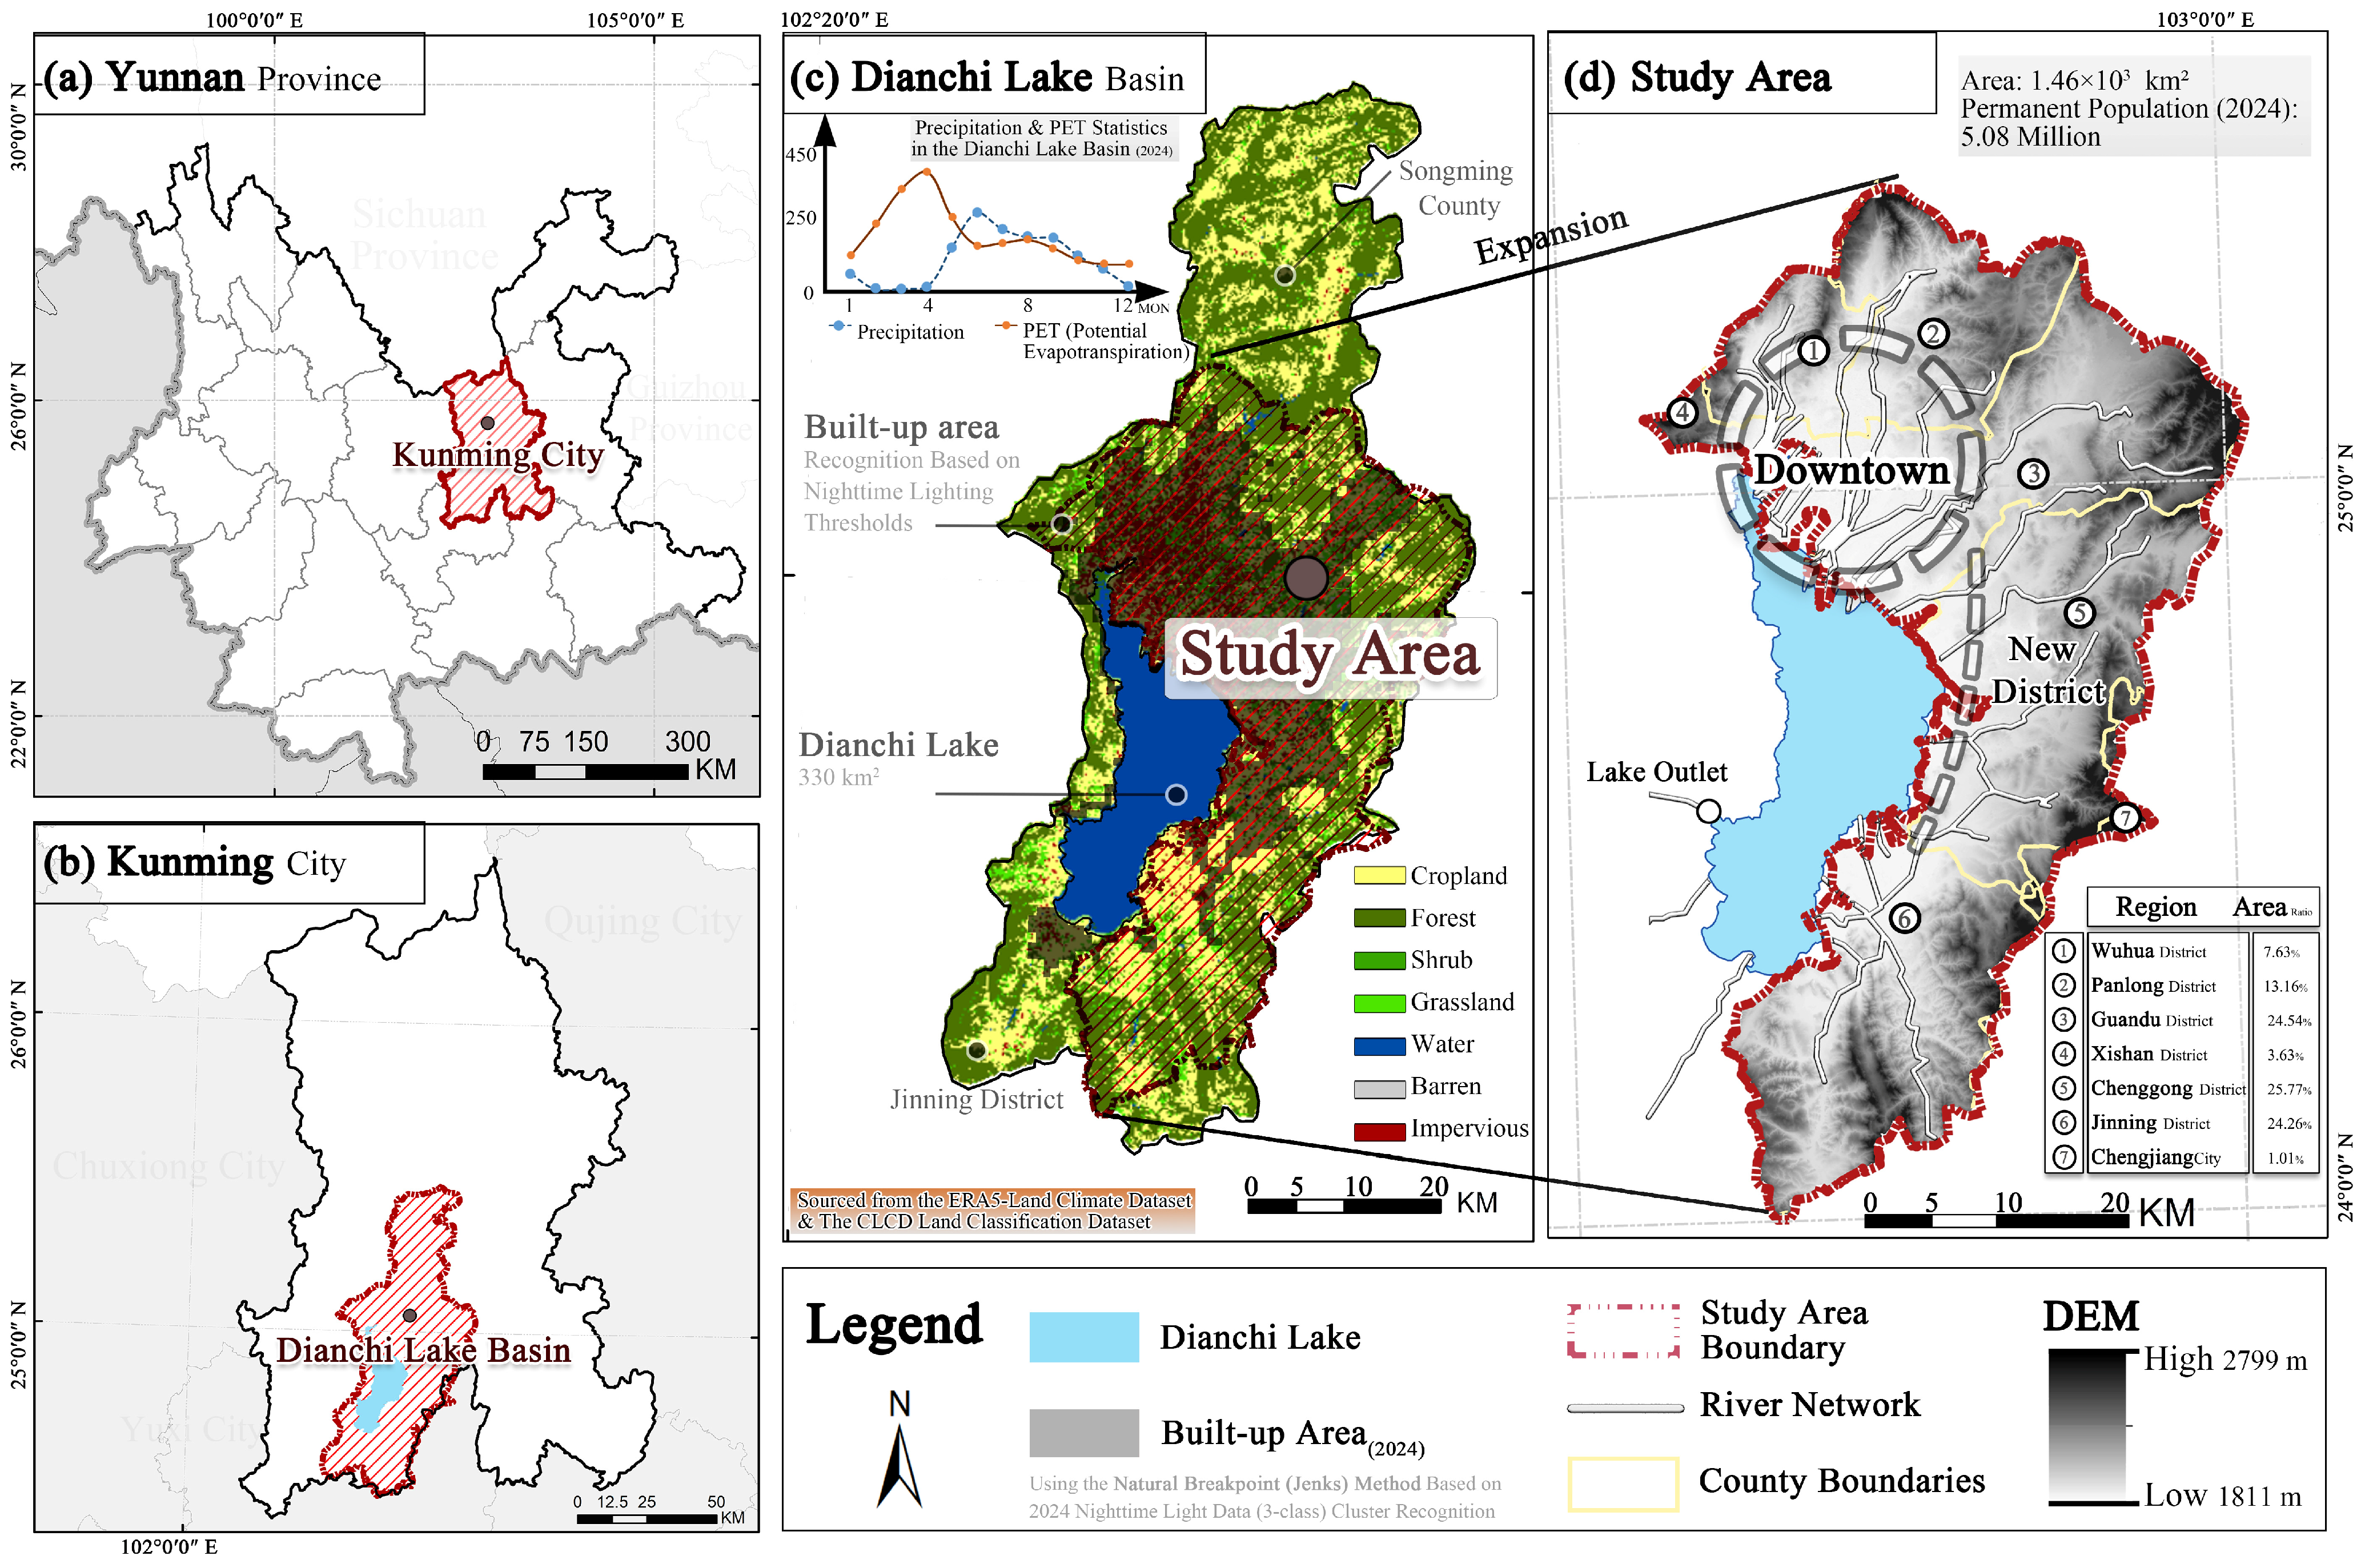
The study area is the built-up region of Kunming, a plateau lake-basin city in Southwest China (102°33′54″–103°0′52″ E, 24°31′19″–25°12′4″ N). Constrained by mountains on three sides and Dianchi Lake to the south [37], it features a subtropical highland monsoon climate (Köppen: Cwb) and a sensitive hydrological environment.
The region exhibits a severe paradoxical water cycle. Based on ERA5-Land, annual potential evapotranspiration (2185.33 mm) significantly exceeds precipitation (1286.82 mm). This imbalance is corroborated by a TerraClimate-based mean annual Palmer Drought Severity Index (PDSI) of −4.80, indicating extreme structural drought. With limited local water resources (540 million m3 annually), Kunming depends on the Niulan River–Dianchi Water Transfer Project (NRDWT). Featuring an 893 million m3 annual capacity, the NRDWT delivered over 6 billion m3 by June 2026 [15] (Figure 1).
Figure 1.
Location map of Kunming research area (GS (2020) 4619).
However, the city remains vulnerable to localized urban waterlogging. Approximately 85% of annual rainfall occurs between June and September. Intense summer rainstorms, combined with steep topographic gradients, exacerbate spatial runoff disparities [37,38]. Consequently, Kunming provides an ideal case study for investigating unsteady runoff dynamics under the dual pressures of structural drought and rapid urbanization.
2.2. Data Sources
The core of the research framework relies on multi-source databases for hydrological simulation and spatial analysis (Table 1). The designated study period spans the rainy seasons (June to September) from 2005 to 2024. Most spatial datasets were retrieved via the Google Earth Engine (GEE, https://code.earthengine.google.com/, accessed on 21 October 2025).
Table 1.
Multi-source databases for hydrological simulation and analysis.
2.3. Preprocessing and Scale Considerations
Prior to constructing the Soil and Water Assessment Tool (SWAT) model, the spatiotemporal resolutions of all multi-source datasets were strictly unified.
Data Preprocessing: The DEM was utilized to delineate sub-basins. The CLCD dataset was reclassified into eight SWAT-compatible categories (cropland, forest, shrub, water, grassland, barren, and impervious). Other soil parameters required for the SWAT simulation were calculated using the Soil Plant Atmosphere Water (SPAW) model based on the HWSD.
Concurrently, historical urban WLPs were compiled from crowdsourced records, retaining only points with unambiguous geographic references—those supported by at least two independent sources or containing clear geographic cues (e.g., road intersections, landmarks, or public facilities).
Scale Mismatch and HRU Heterogeneity: The integration of 30 m DEM/CLCD with coarse-resolution meteorological inputs introduces inherent scale mismatches. While these coarse datasets may smooth localized convective rainfall variability and event-scale runoff responses, the CFSR grid acts primarily as a spatially near-uniform background driver given the specific study area size (1464.92 km2). Consequently, the spatial differentiation of the SWAT-simulated surface runoff (SURQ) predominantly reflects land-surface heterogeneity. This is precisely captured through the Hydrological Response Unit (HRU) discretization, aligning conceptually with the SCS-CN and Deterministic Eight-Node (D8) routing frameworks [43].
Simulation Interpretation: Model evaluation utilizing ERA5-Land data represents a model-to-model comparison rather than calibration against in-situ runoff observations. Accordingly, the SURQ metrics indicate sub-basin-scale runoff-generation pressures and source intensities. They are not direct simulations of localized inundation depths, but rather provide a macro-scale perspective for interpreting the spatial distribution of historical WLPs [44,45].
2.4. Research Process and Content
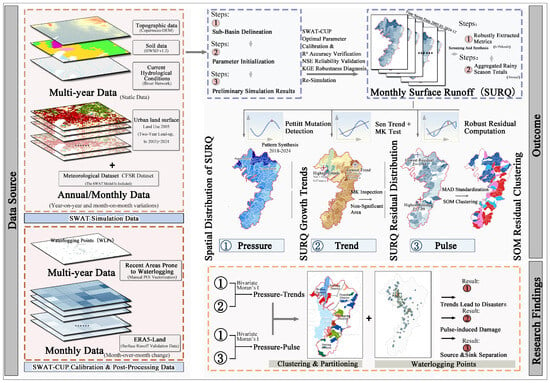
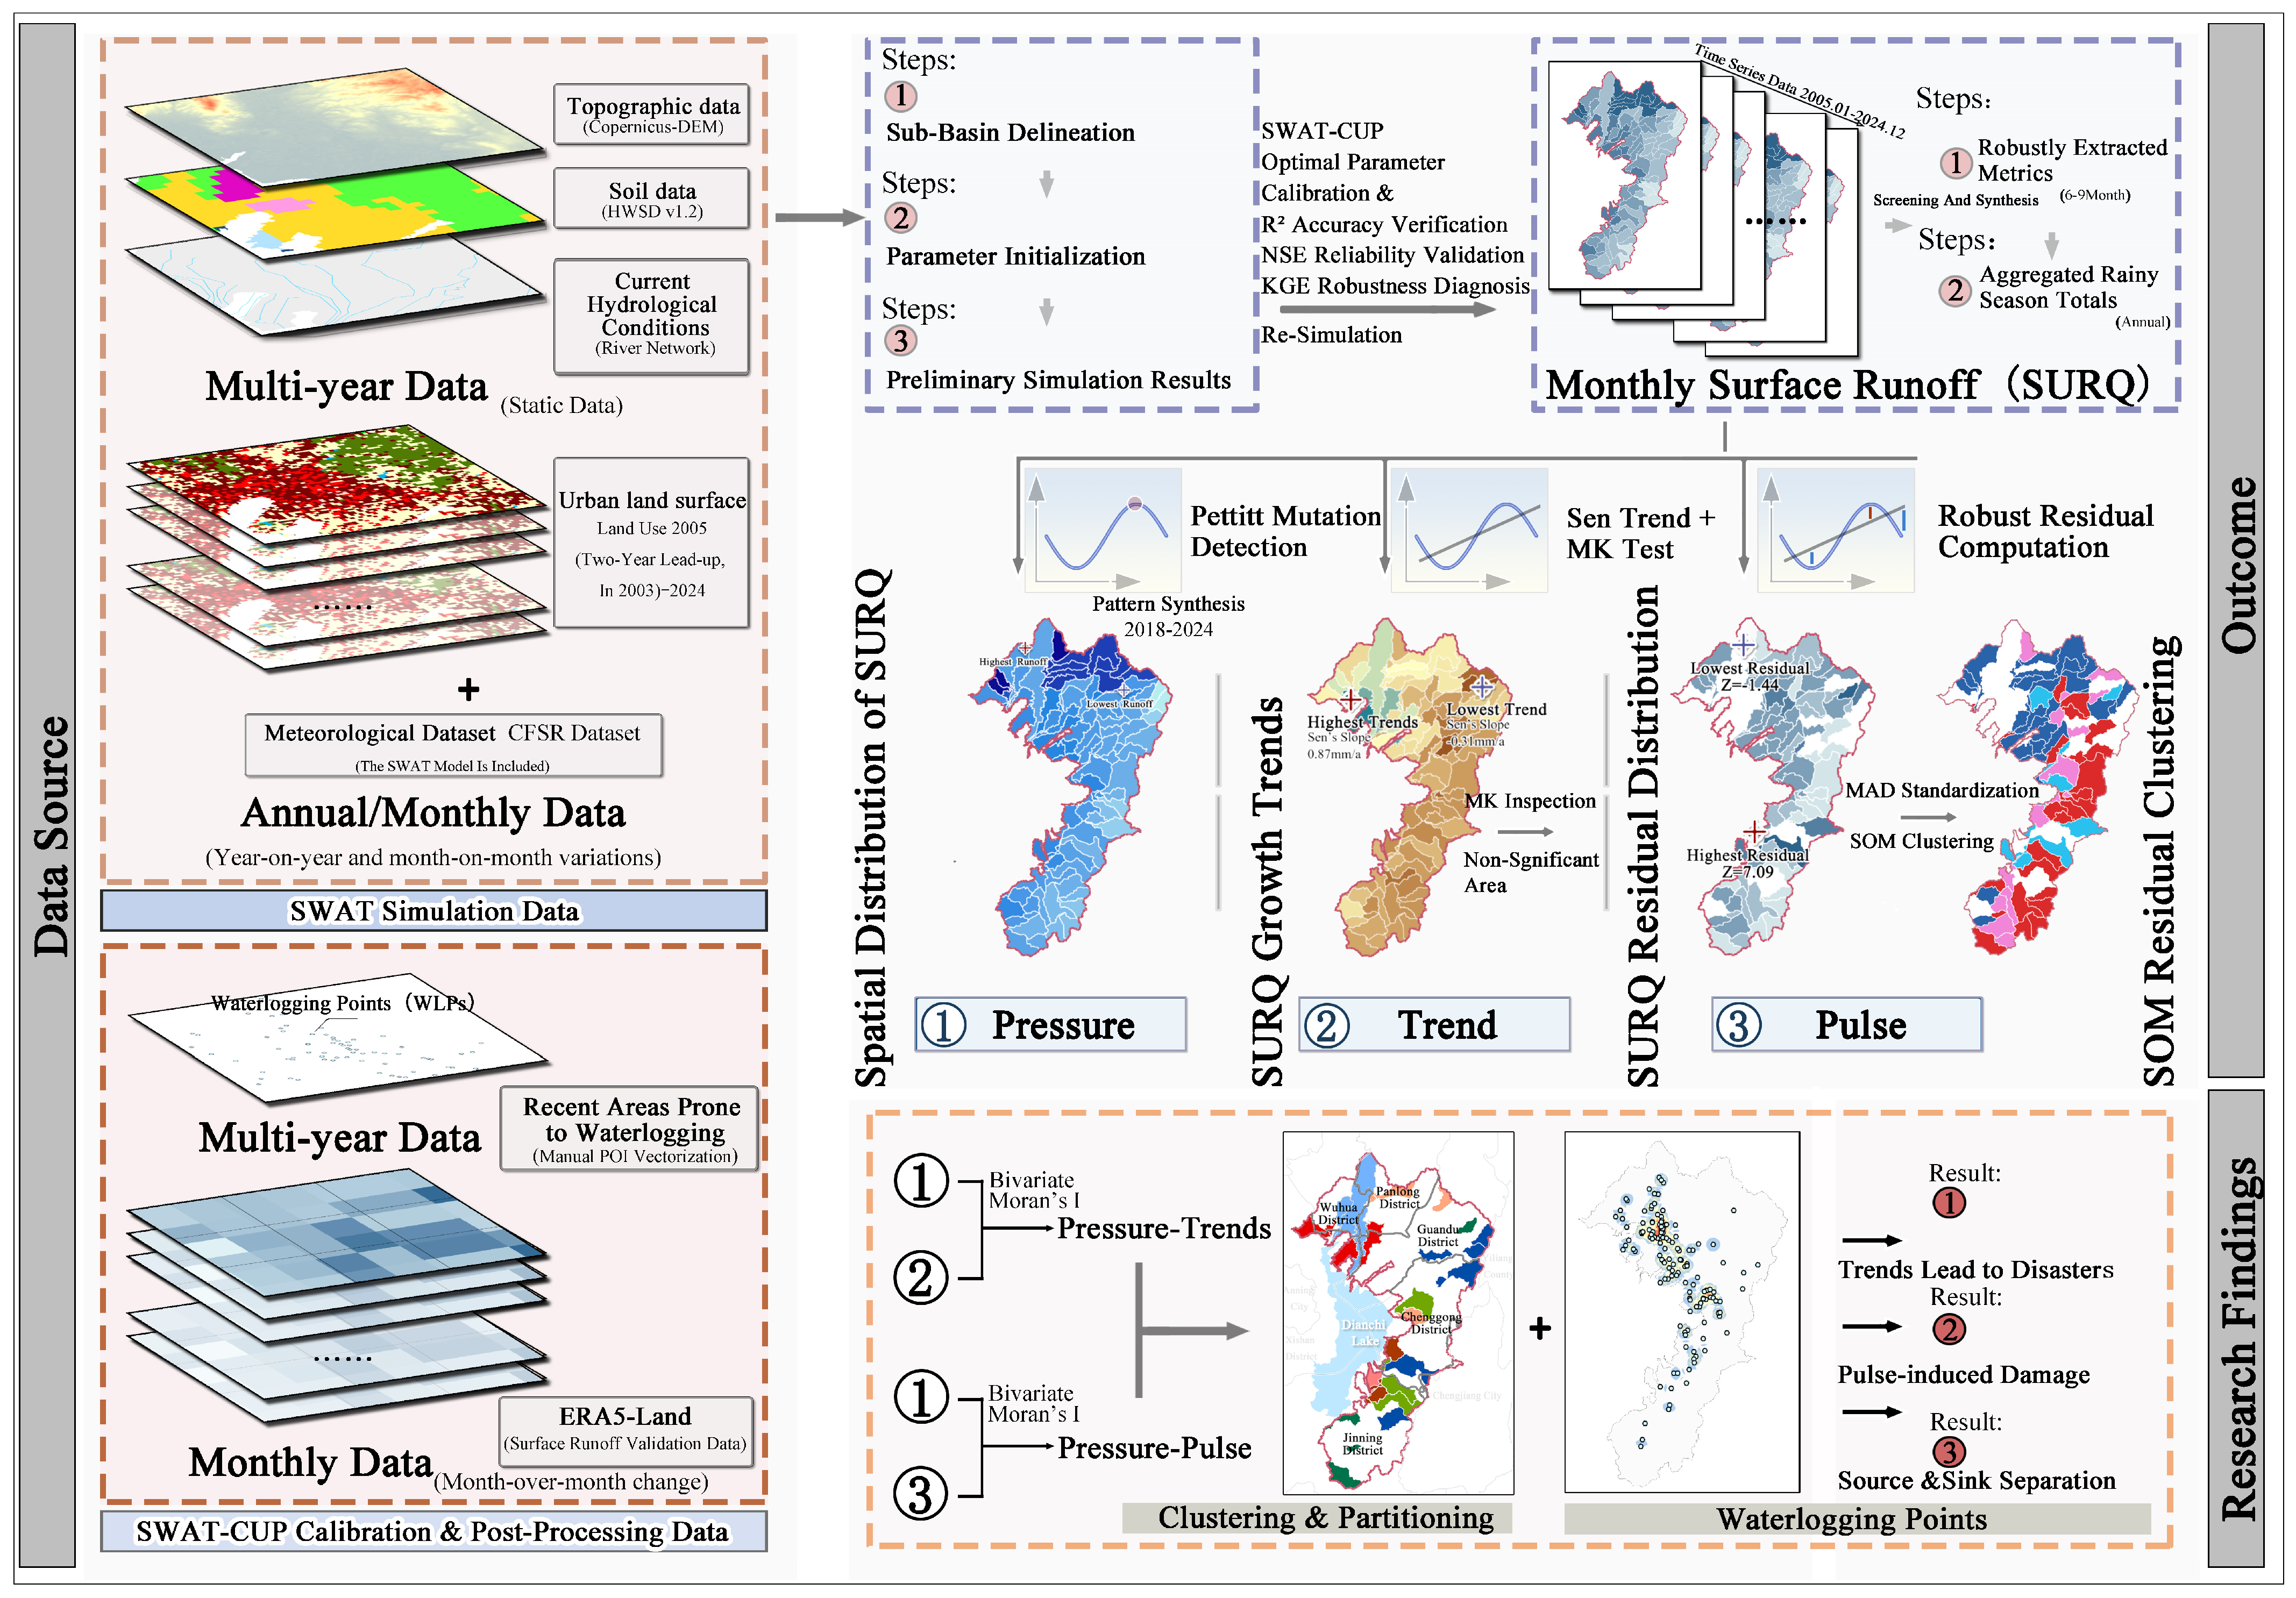
During the research process, we followed the procedure of “Process Simulation—Spatiotemporal Analysis—Non-stationarity Decomposition—Risk Identification”(Figure 2): (1) simulating continuous, long-term sequences of surface runoff; (2) revealing spatial clustering characteristics and long-term trends; (3) quantifying interannual hydrological fluctuations to capture non-stationarity; and (4) identifying critical risk zones to formulate resilience-based spatial control strategies.
Figure 2.
Technical process.
3. Model and Methodology
3.1. SWAT Model Analysis and Verification
We utilized the SWAT model [46] to simulate the nonlinear precipitation–infiltration–runoff response under complex terrain conditions. The model fundamentally operates on the water balance principle, with the core governing equation expressed as:
Equation (1), and represent the final and initial soil moisture content (in mm), and represents the time step. , , , , and are the precipitation amount, surface runoff, evapotranspiration, infiltration, and groundwater runoff on the ith day (in mm). In this study, (SURQ) is selected as the core indicator. The SURQ represents the “runoff-generation potential” of surface runoff from sub-basins flowing to rivers, serving as a measure of the source intensity of runoff-generating drivers [17].
Simulation Settings and Calibration: A mandatory two-year warm-up period was configured to eliminate initialization errors related to antecedent soil moisture. To calibrate the model across ungauged catchments, gridded ERA5-Land runoff data were aggregated to the definitive SWAT sub-basin boundaries using area-weighted zonal statistics, ensuring strict spatial matching. Subsequently, SURQ-related physical parameters were iteratively calibrated using the SUFI-2 algorithm within the SWAT-CUP framework. The annual model performance for the continuous 2005–2024 period was evaluated using the coefficient of determination (R2), Nash–Sutcliffe Efficiency (NSE) and Kling–Gupta Efficiency (KGE). This reanalysis-based indirect calibration provides a peer-validated, robust alternative for hydrological assessment in data-scarce mountainous regions [47].
3.1.1. Calibration Parameters and Sensitivity Analysis
To mathematically optimize the accuracy of the SWAT parameterization, the designated calibration ranges, finalized optimal values, and sensitivity rankings of the primary runoff generation and routing parameters are summarized in Table 2 [20,48].
Table 2.
Calibration ranges, optimal values, and sensitivity rankings of SWAT model parameters.
The calibrated parameters include the SCS runoff curve number (CN2), surface runoff lag coefficient (SURLAG), Manning’s roughness coefficient for overland flow (OV_N), Manning’s roughness coefficient for the main channel (CH_N2), and effective hydraulic conductivity in the main channel alluvium (CH_K2).
The sensitivity results show that CN2 was the most sensitive parameter, indicating that runoff generation in the study area was strongly controlled by land-use composition, soil infiltration conditions, and curve-number-related rainfall–runoff conversion. SURLAG, OV_N, CH_N2, and CH_K2 further regulated the timing and routing of simulated surface runoff.
The effects of urban expansion on SURQ were represented in this study through land-use reclassification, HRU composition, and calibrated runoff generation and routing parameters, rather than through an explicit urban drainage network or impervious–connectivity module.
3.1.2. Model Performance Metrics
Three complementary metrics were adopted to comprehensively evaluate the performance of the SWAT: R2, NSE, and KGE. The R2 quantifies the linear correlation between simulated and observed runoff series:
In Equation (2), and represent the observed and SWAT-simulated surface runoff depth at the ith time step, respectively, both in units of mm; and and correspond to the arithmetic mean values of the observed and simulated runoff series over the entire calibration period.
The NSE measures the overall deviation between simulated and observed runoff series. A value closer to 1 reflects a higher degree of agreement in flow magnitude and temporal dynamics:
In Equation (3), all symbols appearing share the same definitions as those specified in Equation (2).
The KGE decomposes model error into three independent components—correlation, variability, and mean bias—providing a more balanced evaluation of runoff volume error, fluctuation amplitude, and phase consistency:
In Equation (4), r is the Pearson correlation coefficient between the observed and simulated runoff series; α represents the variability ratio (the standard deviation of the simulated series relative to the observed series); and β denotes the mean bias ratio. Model simulation results are generally considered reliable when R2 > 0.5, NSE > 0.5 and KGE > 0.4 [20,48].
3.2. Pressure Dimension
To mathematically identify the stable runoff pattern (i.e., the system pressure state as defined in the PTP framework), it is imperative to isolate and entirely eliminate the interference of seasonal climatic fluctuations, locking onto a relatively stable temporal “reference window.” The non-parametric Pettitt test is definitely deployed to identify mean change points within the hydrological sequence [49]. For the runoff sequence X, its statistic is defined as:
In Equation (5), T represents the sequence length, t represents the splitting point, and is the sign function. If the statistic is significant (p < 0.05), then the mean value of the period after the mutation point is used as the representative data of the “current runoff pattern”.
3.3. Trend Dimension
To decouple the slow, long-term trend factors of surface runoff from the inherent high-frequency noise of the hydrological system, a robust non-parametric analytical framework was computationally constructed leveraging Sen’s slope estimator and the Mann–Kendall (MK) test [50]. The median slope of all data pairs was calculated as the trend term β. This methodology exhibits extraordinarily high robustness against data outliers and is particularly suited for capturing hydrological trends characterized by non-normal distributions [51]:
In Equation (6), and represent the data values at time points and . In the MK significance test, a standardized statistic Z is constructed to determine the significance of the trend.
Autocorrelation Diagnosis and Exploratory Framework: Serial Dependence Handling. Prior to trend evaluation, lag-1 autocorrelation (ACF) was systematically diagnosed across all sub-basins. To prevent the inflation of Type I errors caused by positive serial dependence, the trend-free pre-whitening (TFPW) procedure was applied explicitly to sub-basins exhibiting significant autocorrelation before proceeding with the MK test [52].
Exploratory Spatial Screening: Conducting 106 simultaneous hypothesis tests inherently introduces multiple-comparison issues. However, applying strict False Discovery Rate (FDR) [53] or family-wise error rate corrections to relatively short hydrological series severely degrades statistical power, substantially increasing the risk of Type II errors (omitting genuine spatial trends). Consequently, an exploratory analysis paradigm was deliberately adopted in this study. With a significance level of p ≤ 0.1, the sub-basins are divided into “significant (increasing/decreasing) areas” and “non-significant areas”. This approach prioritizes the identification of candidate sub-basins to capture the broader spatial clustering characteristics of hydrological non-stationarity.
3.4. Pulse Dimension
For spatial units strictly designated as non-significant areas in the MK test, the detrended fluctuation analysis (DFA) theory [8] was applied. We constructed a comprehensive “Robust baseline—Residual extraction—SOM spatiotemporal clustering” framework, aiming to uncover the pulse-like hydrological risks concealed beneath simple long-term mean values.
3.4.1. Stable Baseline and Extraction of Residuals
In this stage, the Sen slope () from the previous step is used as the baseline slope to ensure the resistance of the trend term to extreme values. Then, the robust intercept is further calculated:
In Equation (7), represents the SWAT-simulated runoff value in the year, and t is the time index (0, 1, …, n − 1). Based on the determined slope and intercept, a robust baseline is constructed, and the runoff residuals rts for each year are calculated:
In Equations (8) and (9), the residual term represents the non-stationary fluctuation component after the long-term trend has been eliminated. While these residuals inevitably encapsulate minor systematic uncertainties—such as inherent meteorological forcing biases or land-use classification anomalies—they predominantly capture the authentic, non-stationary dynamic responses of surface runoff driven by complex environmental perturbations [9,24].
3.4.2. Residual Standardization
The Median Absolute Deviation (MAD) is introduced to standardize the residuals [54]. Compared to the standard deviation, MAD is an algorithm based on the median, which eliminates the magnitude differences in runoff volume. The standardized residuals purely reflect the temporal structure of fluctuations:
3.4.3. SOM Based on Bayesian Optimization
The Self-Organizing Map (SOM) is employed to extract spatiotemporal features from the standardized residual matrix , Equation (10) [55]. To reduce the subjectivity of manual parameter tuning, the Tree-structured Parzen Estimator (TPE) Bayesian optimization algorithm (Optuna framework) was employed for systematic SOM hyperparameter search [56]. The TPE algorithm models the objective function through a Gaussian Process surrogate, adaptively balancing exploration and exploitation while avoiding the computational cost and independence assumptions of conventional grid search. The optimization objective was defined as the minimization of the sum of Quantization Error (QE) and Topology Error (TE), where QE measures the mean Euclidean distance from each sample to its Best-Matching Unit (BMU), and TE measures the fraction of samples whose two nearest BMUs are non-adjacent on the SOM grid.
In Equation (11), = {σ, η, X, Y} represents the set of hyperparameters; is the weight coefficient. The hyperparameter search space and optimized results are summarized in Table 3. The optimization was configured with 100 trials (n_trials = 100), a maximum runtime of 1 h, and a fixed random seed of 42 for reproducibility. SOM training employed PCA-based weight initialization and batch training (1000 iterations) with a Gaussian neighborhood function.
Table 3.
Parameter search range, optimized value description.
SOM is fundamentally a topology-preserving dimensionality reduction method whose “fit” is jointly governed by QE/TE. The following strategies were adopted to mitigate overfitting: (1) Bayesian optimization simultaneously minimizes QE/TE, preventing the topological distortion that can result from optimizing QE alone; (2) the grid size (63 neurons) is substantially smaller than the training sample size; (3) the Gaussian neighborhood function (σ = 1.18) enforces weight similarity among adjacent neurons, providing implicit regularization; and (4) the DBI-based K-means selection operates on BMU coordinates—since BMU coordinates are regularized by the SOM”s topological constraints, the effective degrees of freedom for K-means are substantially lower than those of the original 16-dimensional feature space, reducing overfitting risk in the secondary clustering step.
3.4.4. SOM–K-Means Dual-Layer Clustering
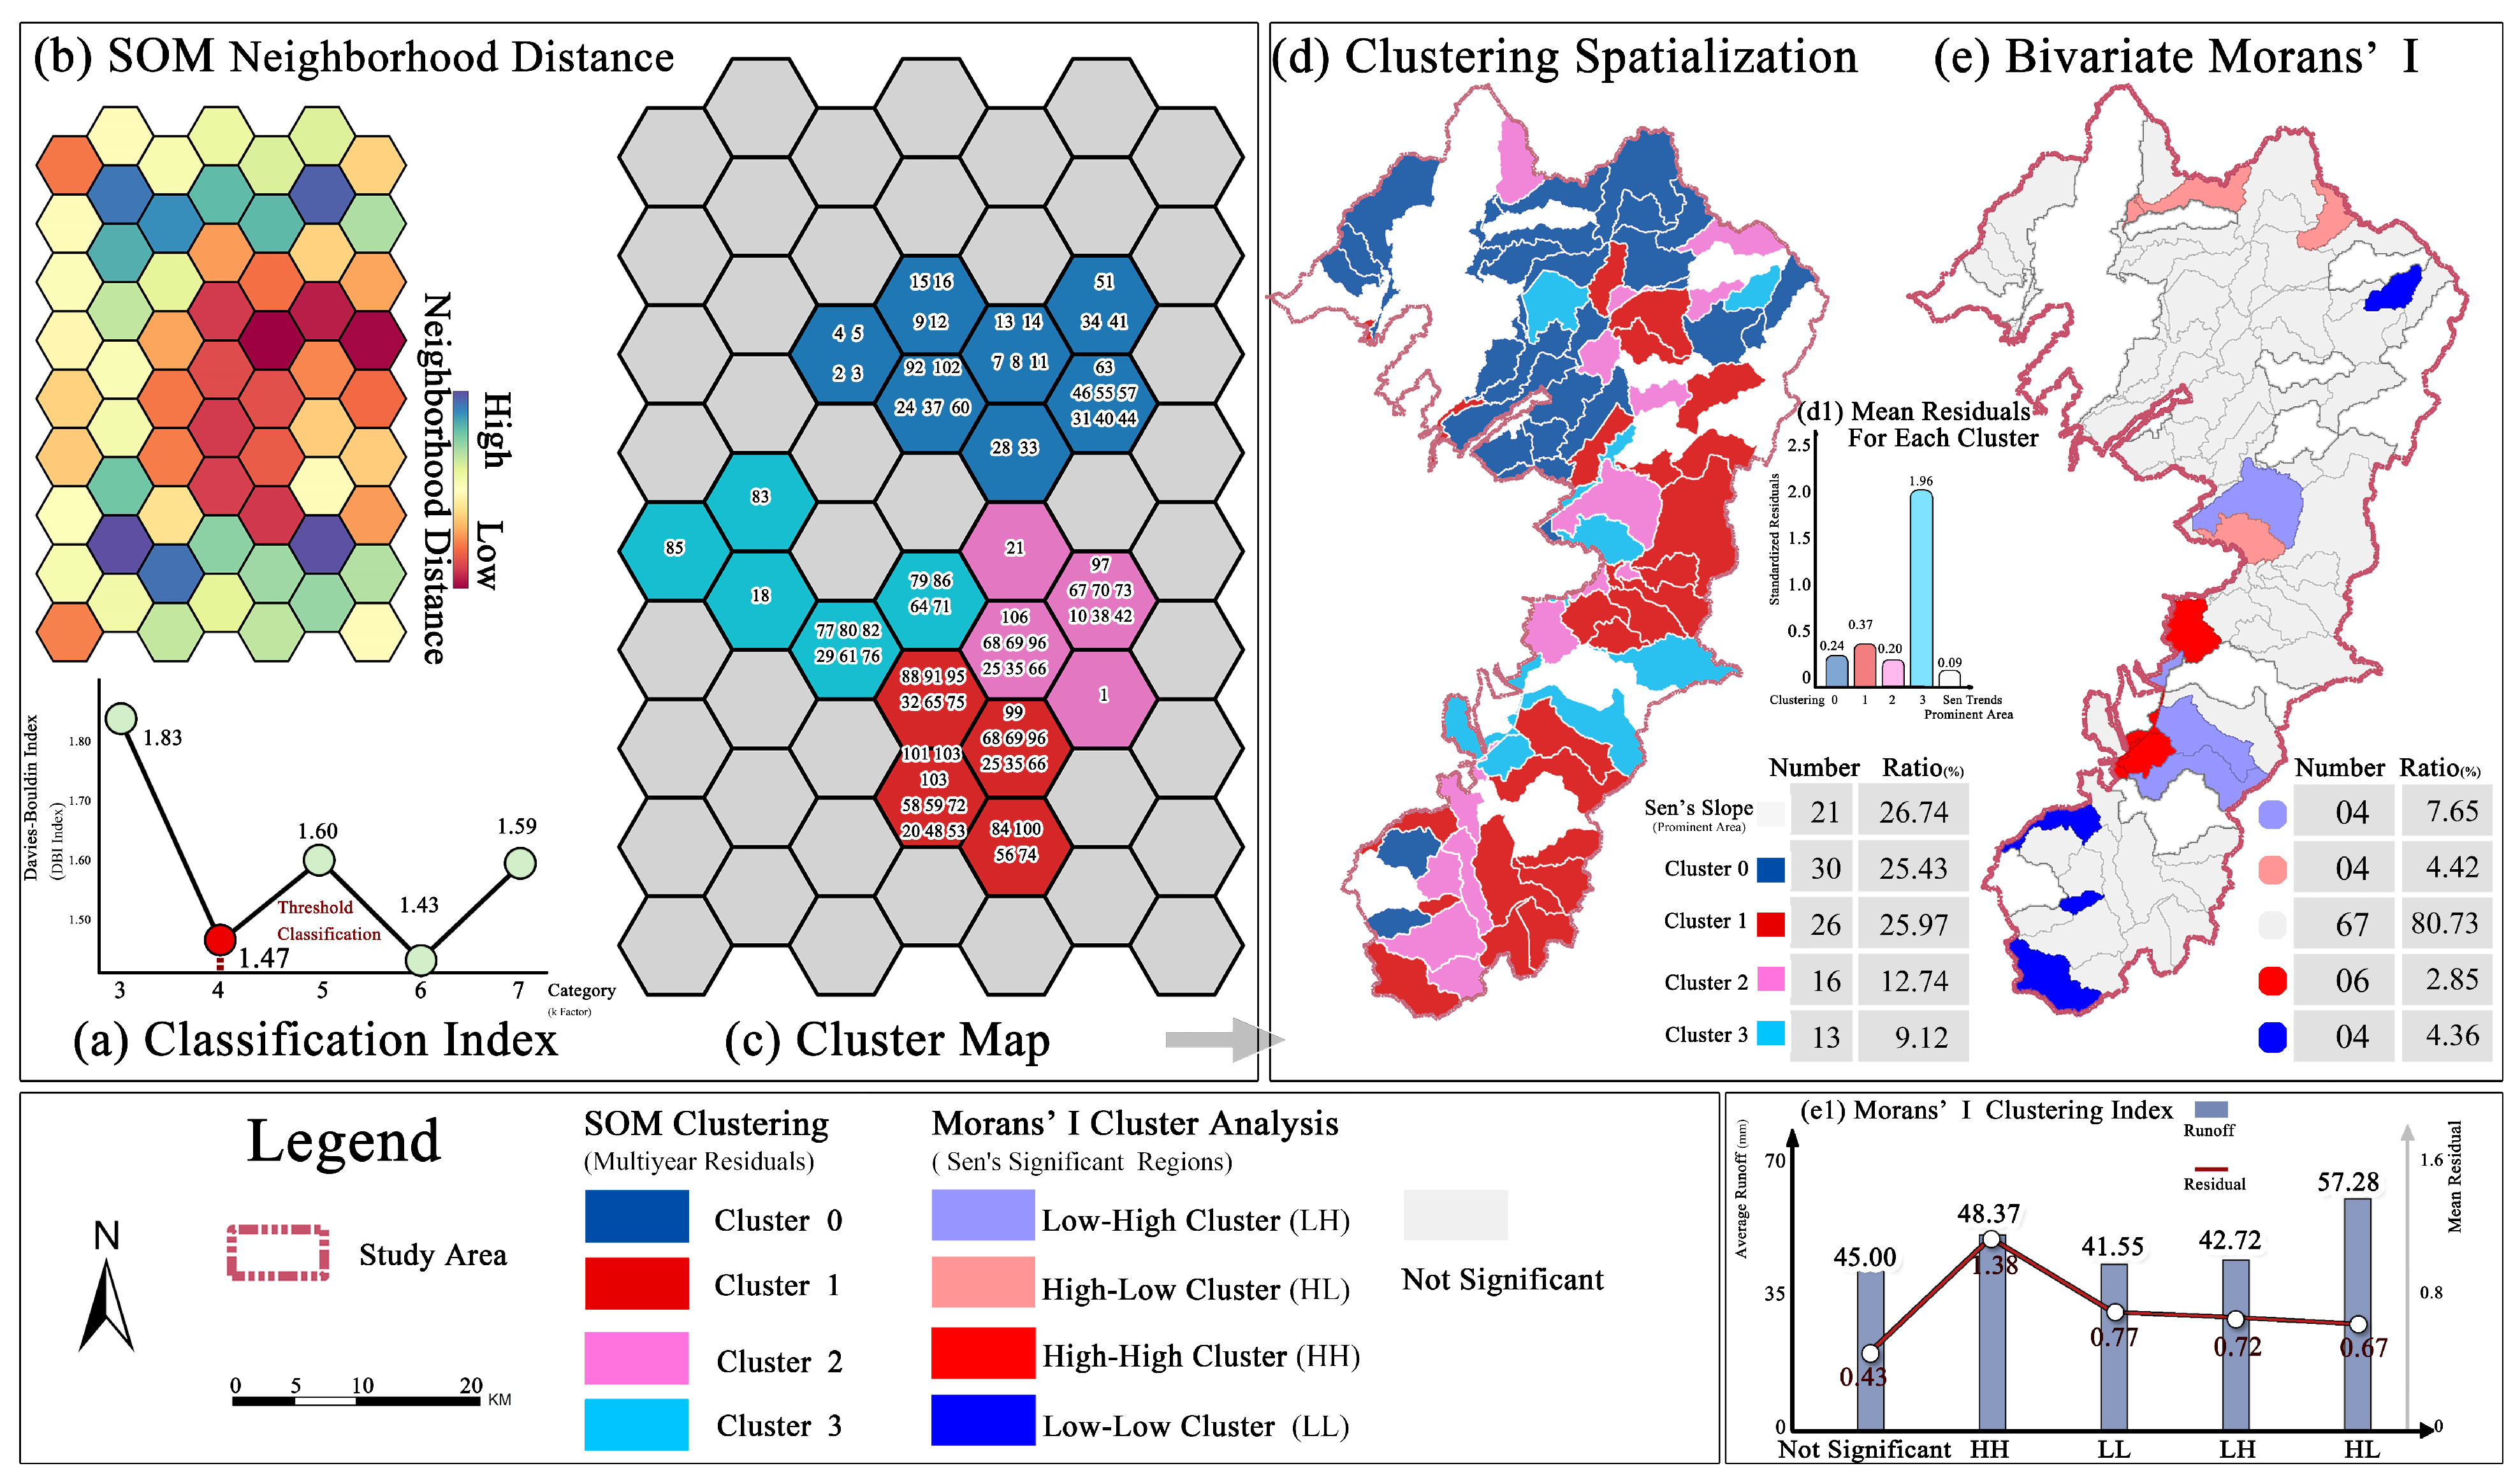
Based on the dimensionality reduction of SOM, K-means clustering is applied to the neuron weight vectors. The Davies–Bouldin Index (DBI) is used to determine the optimal number of clusters (k ∈ [2, 7]), identifying spatial units with similar interannual fluctuation patterns, thereby locating areas with pronounced runoff pulse intensity [57].
In Equation (12), represents the average distance within a class, and d (ci, cj) represents the center distance between classes. The minimum value of DBI is selected to ensure high cohesion within the class and high separation between classes. This method effectively overcomes the limitation of traditional statistical indicators that cannot distinguish the shapes of fluctuating time series, and realizes the refined identification of hidden pulse risks under the background of non-significant trends. Based on the mean residuals of each clustering result, after reassigning values to each category, it is further aggregated and classified with the runoff pattern.
Sensitivity to random initialization was mitigated by PCA-based weight initialization. Furthermore, the top five parameter combinations from TPE optimization all converged to the 9 × 7 topology, with QE + TE differences of less than 20% (top 5: 0.19, 0.20, 0.21, 0.22, 0.23). This indicates a flat objective surface in the optimal parameter region, suggesting that the clustering results are robust to small hyperparameter perturbations.
3.5. Spatial Autocorrelation and Bivariate LISA Analysis
3.5.1. Global Moran’s I Analysis
The global Moran’s I evaluates the overall spatial clustering or dispersion characteristics of runoff features across the study area. Computed utilizing the GeoDa (v1.22.0.20) software, the index value ranges from −1 to 1. A positive value indicates the spatial clustering of similar values, a negative value signifies spatial dispersion, and a value approaching zero implies a random spatial distribution.
3.5.2. Bivariate Moran’s LISA Analysis
While the univariate index captures the spatial structure of a single attribute [58], the bivariate Local Indicators of Spatial Association (LISA, based on Geoda) was employed to reveal the cross-spatial correlation between the current runoff status of a specific unit (attribute k) and the evolutionary characteristics, such as trend or fluctuation, of its neighboring units (attribute l).
Through the LISA clustering diagram (HH, LL, HL, LH), the refined zoning and attribution of hydrological risks in plateau cities are achieved. Based on the three-dimensional spatiotemporal evolution characteristics of PTP, this study identified the cumulative source risks represented by High Pressure–High Trend (HH) and the non-stationary vulnerability risks denoted by Low Pressure–High Pulse (LH).
3.5.3. WLPs Overlay Validation
To independently verify the spatial risk zonation delineated by the PTP analytical framework, measured WLPs were overlaid onto the bivariate LISA classifications and the SOM-derived pulse risk zones. Two complementary statistical tests were applied to evaluate whether WLPs enrichment in specific risk zones exceeded random expectations:
Binomial testing: Under the null hypothesis that WLPs are uniformly distributed across all zones relative to their land area, the enrichment ratio (ER) was calculated [33]. The ER is defined as the ratio of the observed to the expected WLPs proportion:
where Oi is the observed WLPs count in zone i, N is the total WLPs count, Ai is the area of zone i, and A is the total study area. Zones with ER > 1.0 and significant binomial p-values were identified as zones where WLPs concentration exceeded random expectation.
ER = (Oi/N)/(Ai/A)
Spatial randomization (permutation test): To control for potential spatial autocorrelation in the WLPs distribution, a Monte Carlo permutation procedure (N = 1000 iterations) was implemented [59]. In each iteration, WLPs locations were randomly reshuffled across all sub-basins to recalculate the ER, thereby constructing an empirical null distribution. The observed ER was then compared against this null distribution to yield an empirical p-value. This provides a spatially explicit significance assessment that rigorously accounts for the non-independence of spatial data.
4. Results
4.1. Spatiotemporal Evolution Characteristics of Runoff
The SWAT-CUP calibration and ERA5-Land-based performance evaluation results demonstrated acceptable agreement between the simulated SURQ and the reanalysis-based reference runoff across the study period. As shown in Table 4, the overall mean values for the 64 valid samples were 0.67 for R2, 0.54 for NSE, and 0.45 for KGE.
Table 4.
Annual values of SWAT-CUP calibration metrics.
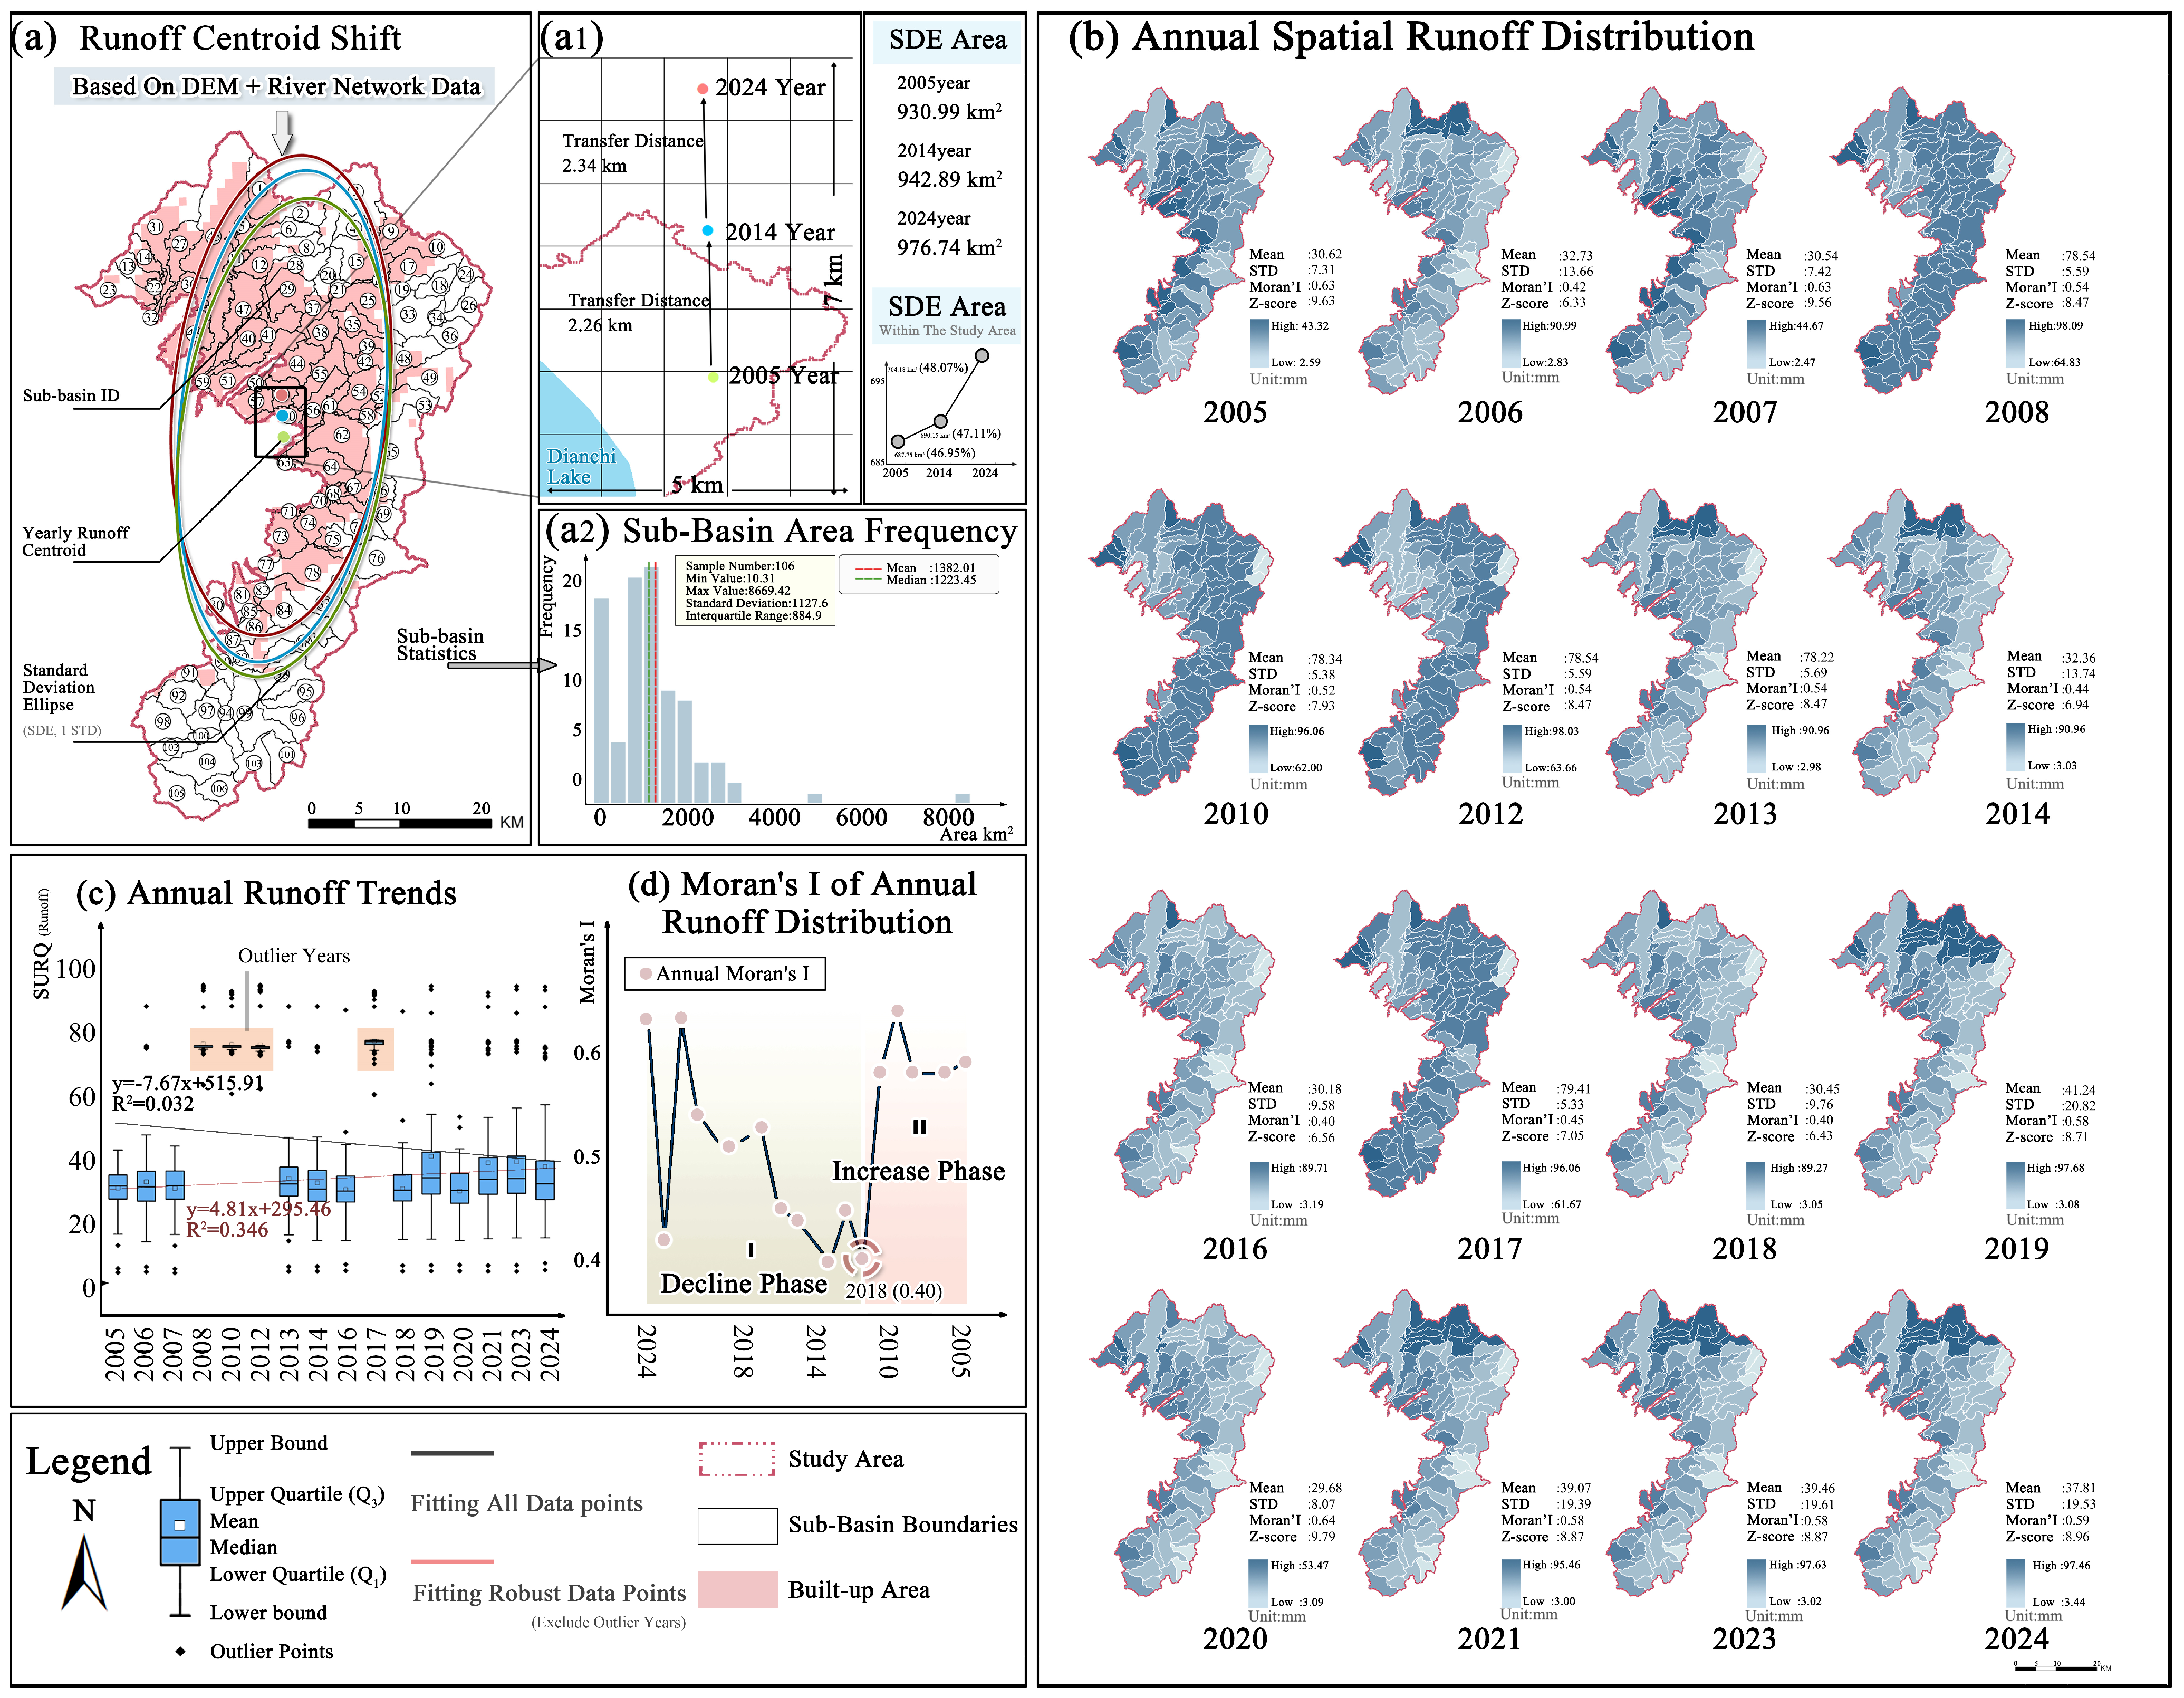
The area-weighted mean SURQ across the entire study area fluctuated and increased from 30.62 mm to 37.81 mm, with a corresponding northward shift in the runoff centroid of approximately 2.30 km per decade (Figure 3(a1,c)). The weight of the northern urban area in the overall runoff-generation pattern continued to increase, gradually evolving into the main hydrological driving factor. In terms of the pattern, the high/low value areas of SURQ were not stable (Figure 3b). The evolution of Moran’s I index presented a significant “dispersed-aggregate” two-stage characteristic: the spatial distribution of SURQ gradually became dispersed from 2005 to 2018, while the high-flow-producing areas began to form a new contiguous aggregation pattern in space from 2018 to 2024 (Figure 3d).
Figure 3.
Interannual variations in surface runoff. (a1) Centroid shift expansion and annual SDE statistics.
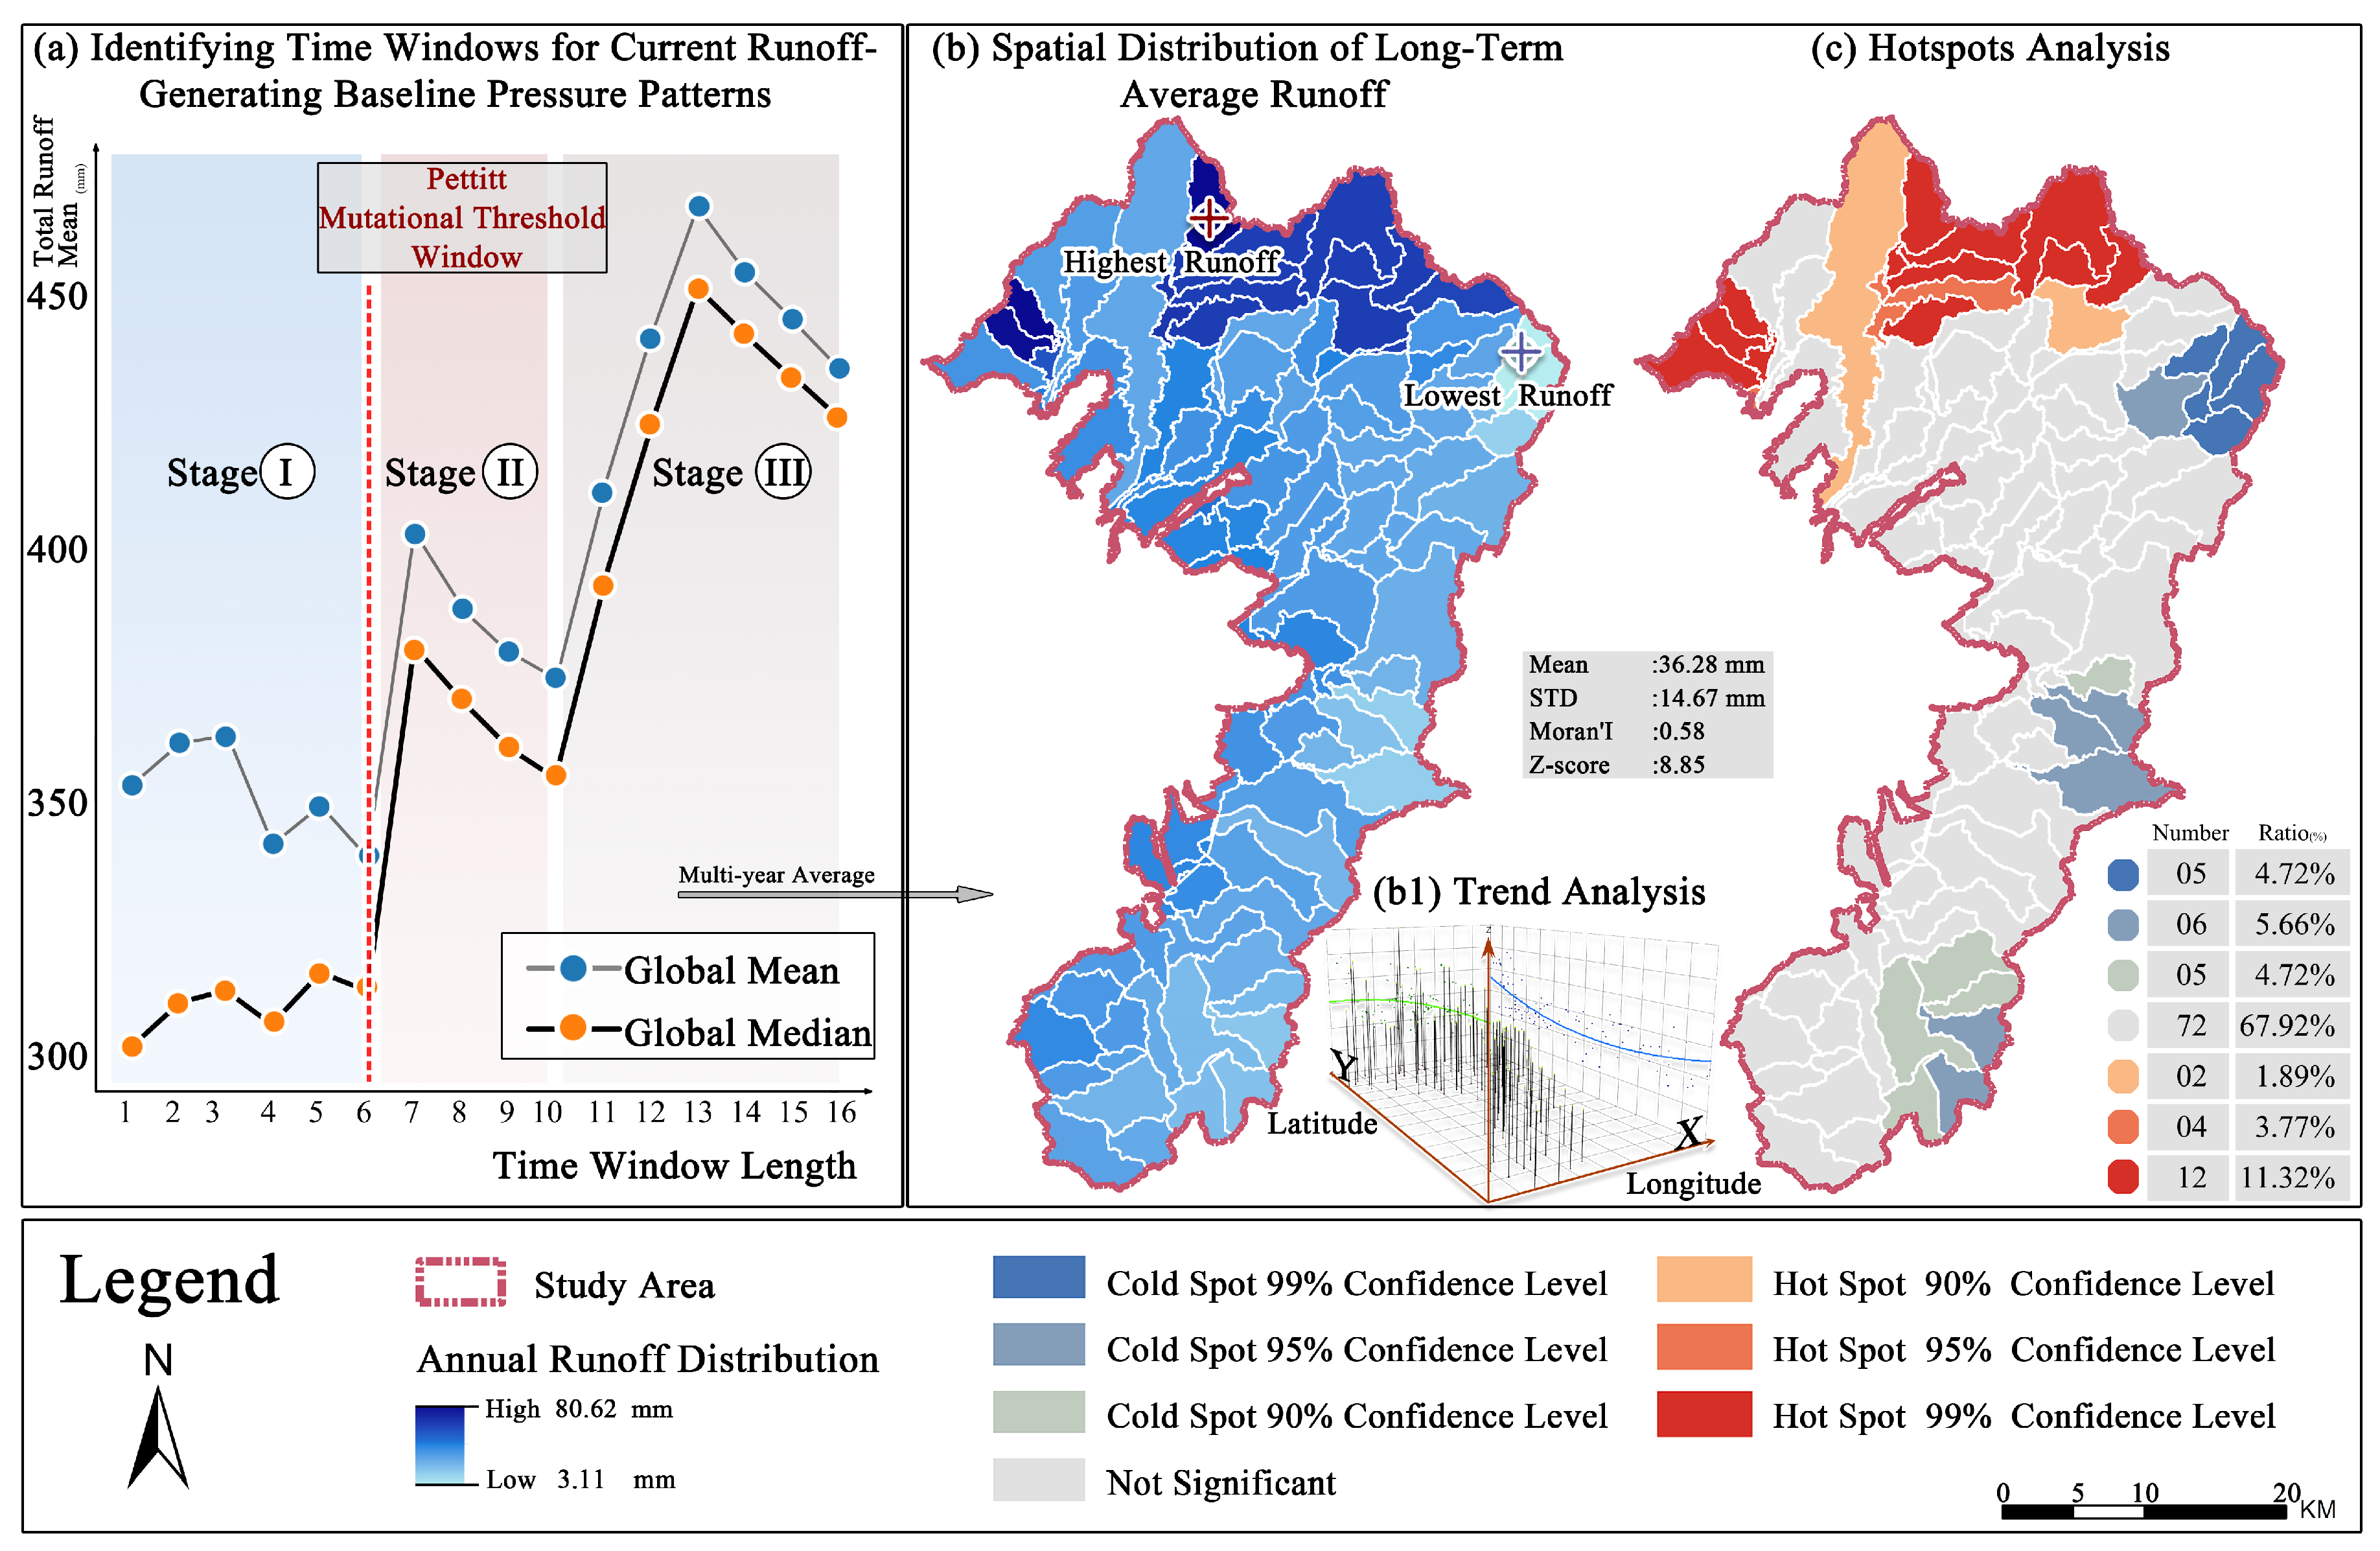
Based on the Pettitt test, the period from 2018 to 2024 was identified as the steady-state window of SURQ (Stage I). The multi-year synthetic mean was defined as the “current runoff benchmark pressure pattern” (Figure 4a). This pattern shows a “north high south low” runoff gradient within the study area and has a strong spatial positive correlation (Moran’s I = 0.58, Figure 4(b1)). The high runoff areas are concentrated in the northern and northwestern foothill regions, with a strong hotspot accounting for 11.32%; the low runoff areas are concentrated in the central and southern old urban areas and along the Dianchi Lake coast, with a strong cold spot accounting for 4.72% (Figure 4c). It is worth noting that there is extremely high hydrological heterogeneity within the northern region, and it also includes the highest and lowest value sub-basins of the entire SURQ.
Figure 4.
SURQ pattern and hotspots analysis.
4.2. Multi-Year Trend of Surface Runoff
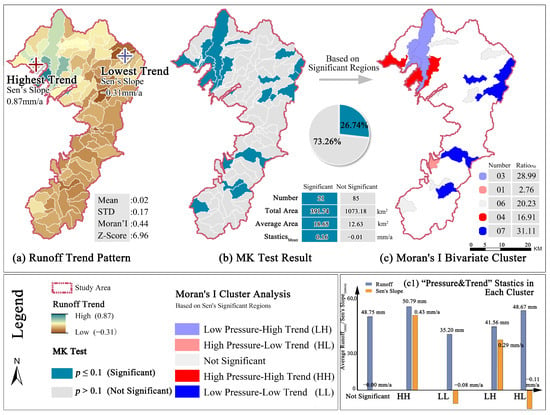
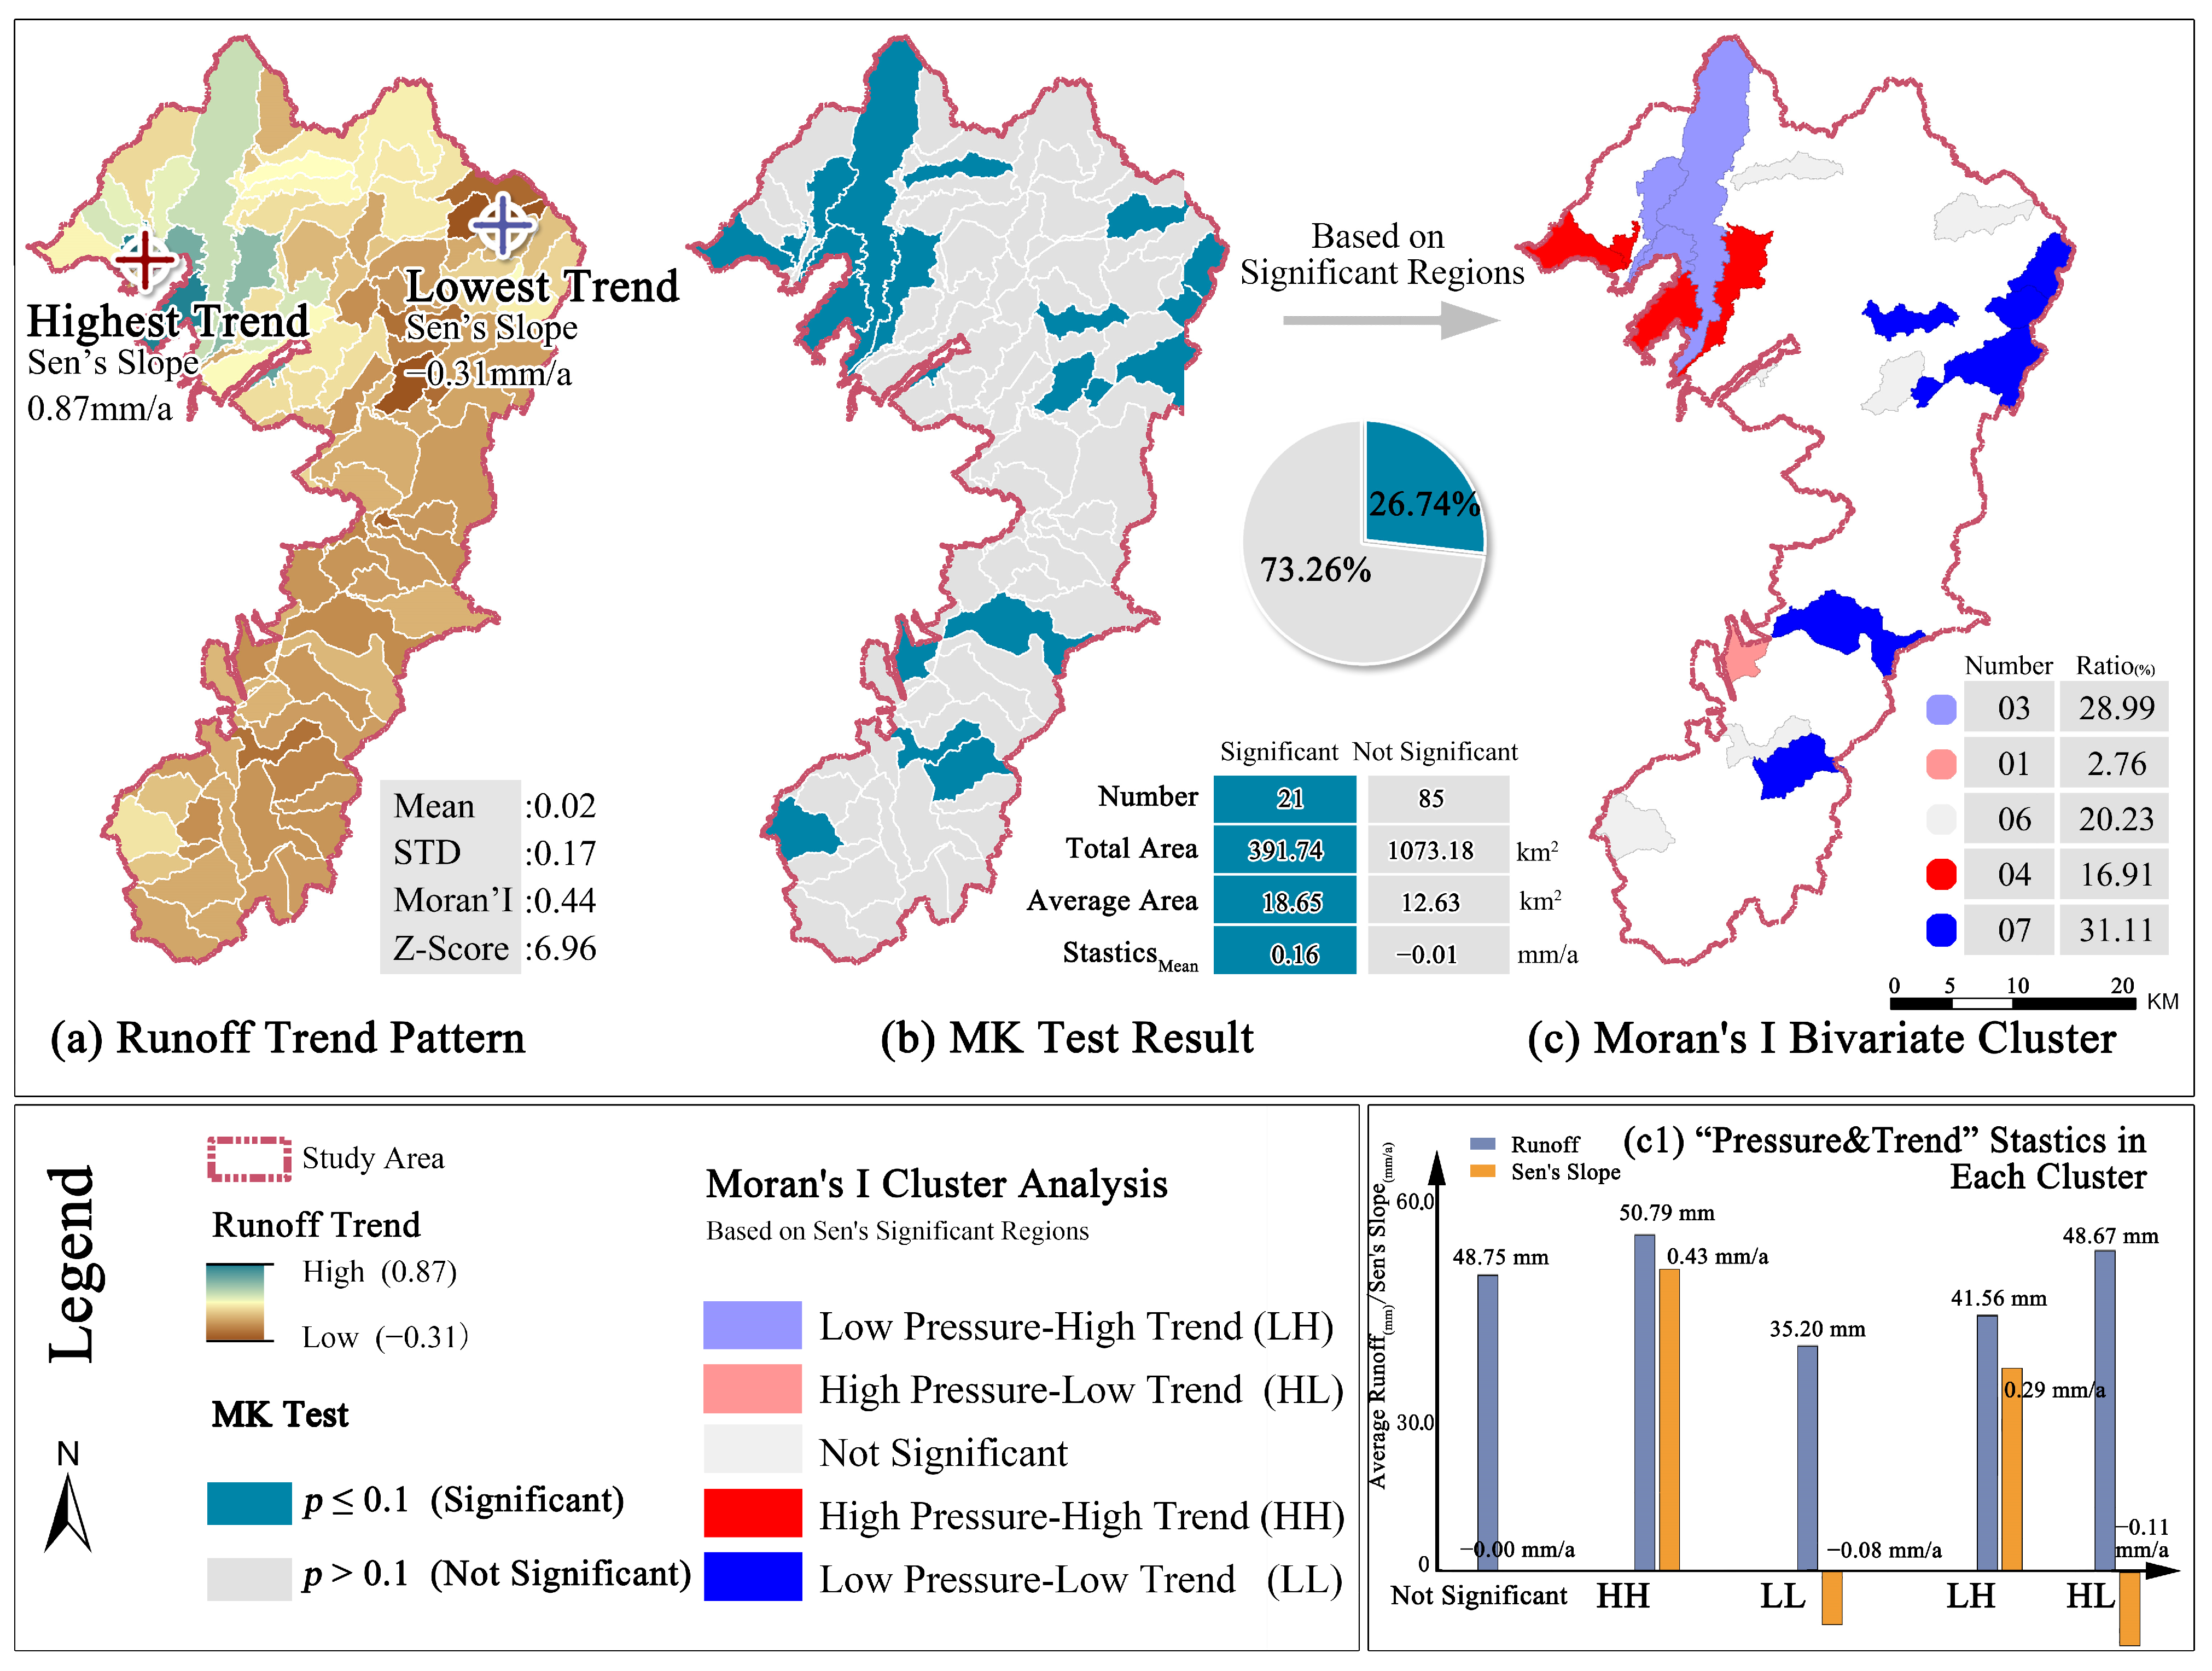
Spatially, the long-term trend of runoff across the study area exhibits pronounced spatial differentiation (Figure 5a). Lag-1 autocorrelation diagnosis revealed that the ACF across all 106 sub-basins was uniformly weak (mean = 0.23, median = 0.29), with only three sub-basins exhibiting significant ACF (p < 0.10). A threshold of 0.1 was adopted as a sensitivity-screening criterion under limited temporal coverage (n = 16 years), serving as an exploratory step to identify candidate sub-basins rather than a confirmatory hypothesis test.
Figure 5.
SURQ trend, significance and bivariate Analysis.
The Sen’s trend intensity fluctuates greatly, with a maximum growth rate of 0.87 mm/a and an overall average of 0.02 mm/a. The MK test revealed that only 26.74% (21 sub-basins) of the study area showed statistically significant trends. These significant positive areas are almost exclusively concentrated in the north, exhibiting a high mean Sen’s slope of 0.16 mm/a. This indicates that the northern area not only maintains a high runoff background but is also experiencing a significant acceleration in runoff, acting as the core source of incremental hydrological load.
4.3. Detrending Multi-Year Fluctuations in Surface Runoff
4.3.1. Robust Residuals Spatial Distribution
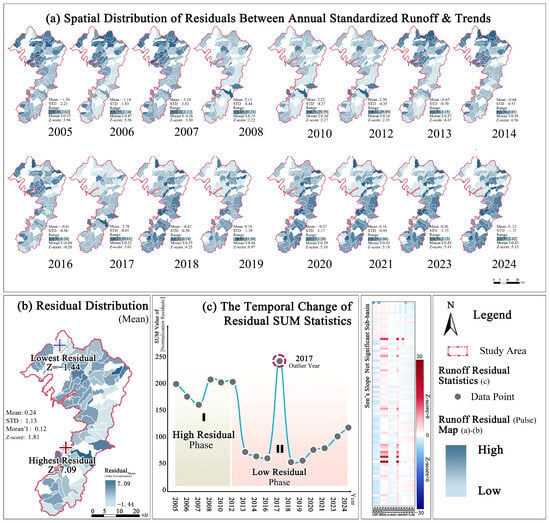
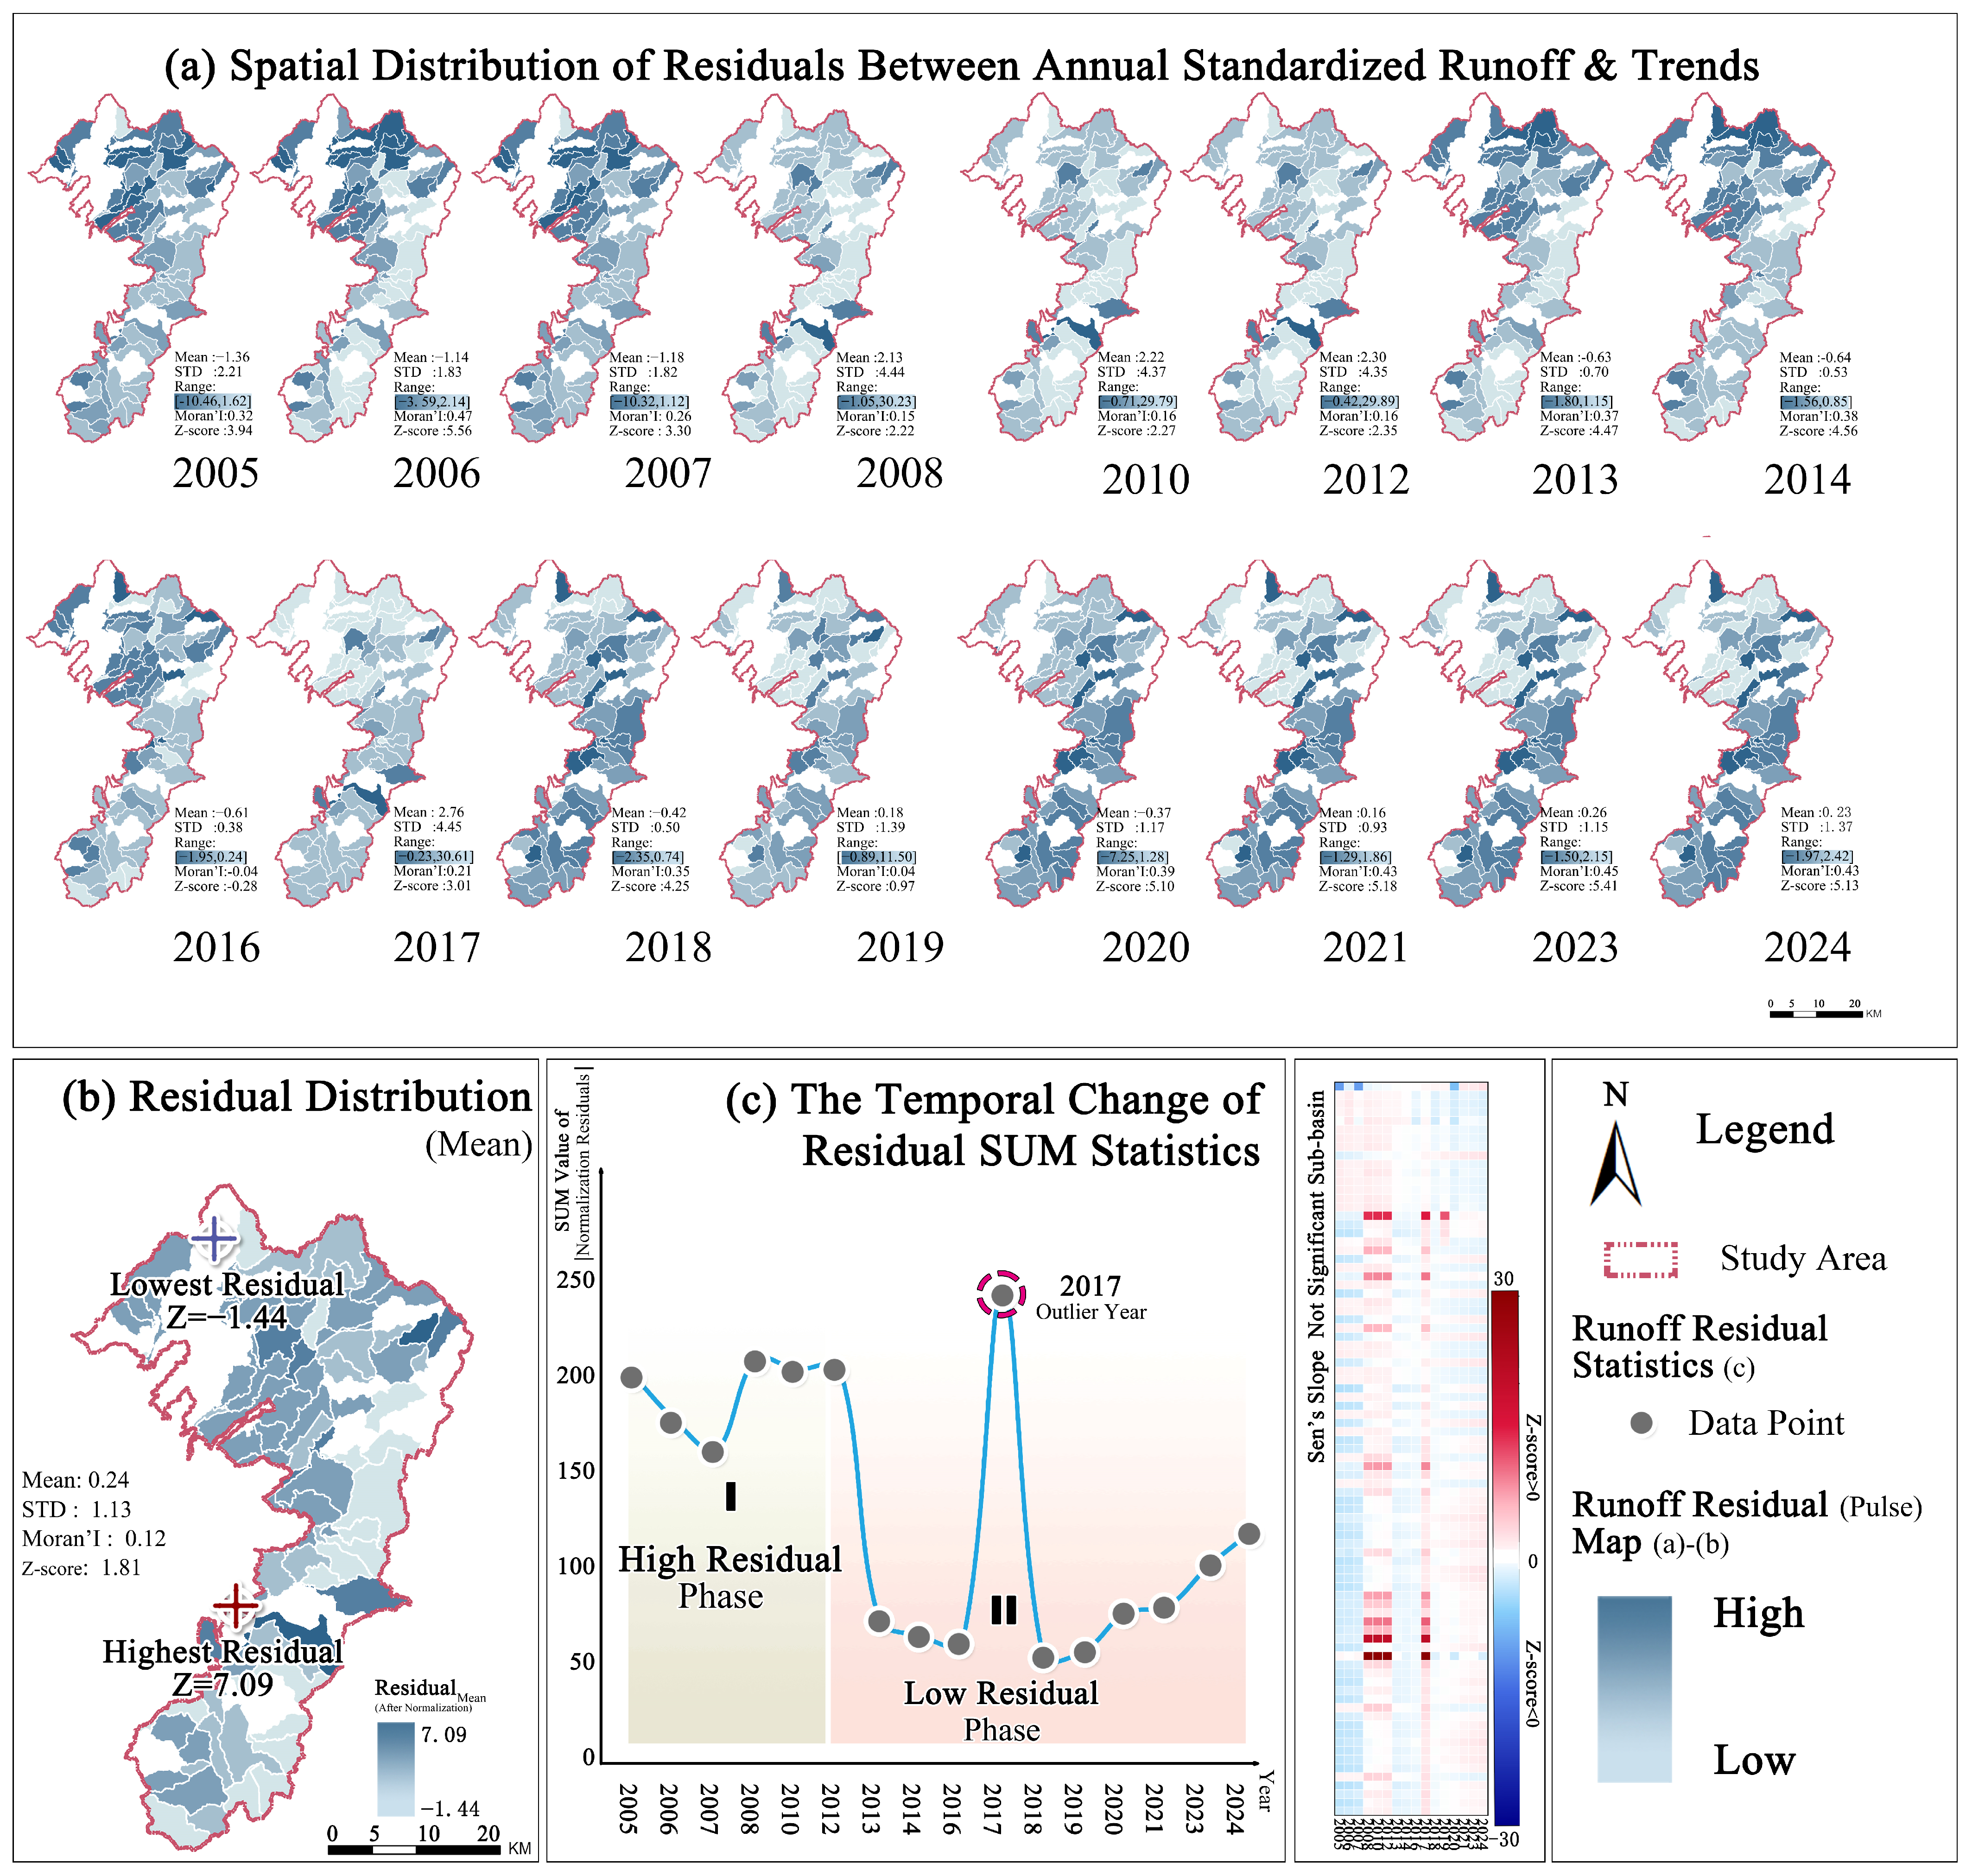
The non-significant trend areas account for 73.26% of the total study area. The spatial distribution of the standardized residuals over the years shows that the spatial distribution is completely opposite to the runoff pattern. The high volatility is mainly concentrated at the intersection of Jinning District and Chenggong District in the central and southern part of Yunnan, as well as the lake shore area of Dianchi Lake (Figure 6b).
Figure 6.
Residual spatial pattern and time stage.
Temporal dimension (Figure 6c), the runoff distribution exhibited a highly fluctuating stage (Phase I, 2005–2012) and then stabilized (Phase II, 2013–2024). Among them, the overall fluctuation intensity underwent an abrupt shift around 2012/2013, and fluctuation magnitude increased again after 2018. Combined with the extreme peak in 2017, it indicates that the system’s sensitivity to extreme rainfall events is increasing.
4.3.2. Spatiotemporal Characteristics Clustering
SOM clustering was performed on the calculated annual residuals of each sub-basin. (Figure 7b). K-means clustering of BMU coordinates identified four distinct fluctuation regimes (k = 4, DBI = 1.47; Figure 7a), each with significantly different interannual variability characteristics (Figure 7(d,d1)). Among these, Cluster 3 exhibited a pronounced “high-fluctuation” pattern, with an interannual amplitude far exceeding those of other clusters, and accurately delineated the spatial extent of high-frequency pulse impacts. The results of the bivariate clustering based on “pressure–pulse” are shown in Figure 7e.
Figure 7.
SOM spatial clustering and bivariate analysis.
4.4. Risk Classification and Verification of WLPs Overlay
The clustering results of the pressure–trend and pressure–pulse bivariate LISA analyses were spatially superimposed and compared with the 139 WLPs in urban Kunming. The proportion of WLPs falling within each LISA-defined zone was calculated, and binomial tests were performed against the null hypothesis of random spatial allocation (expected proportion = area proportion). Statistical significance was further verified through 1000-permutation spatial randomization (binomial test, Table 5).
Table 5.
Distribution of WLPs across bivariate LISA risk zones.
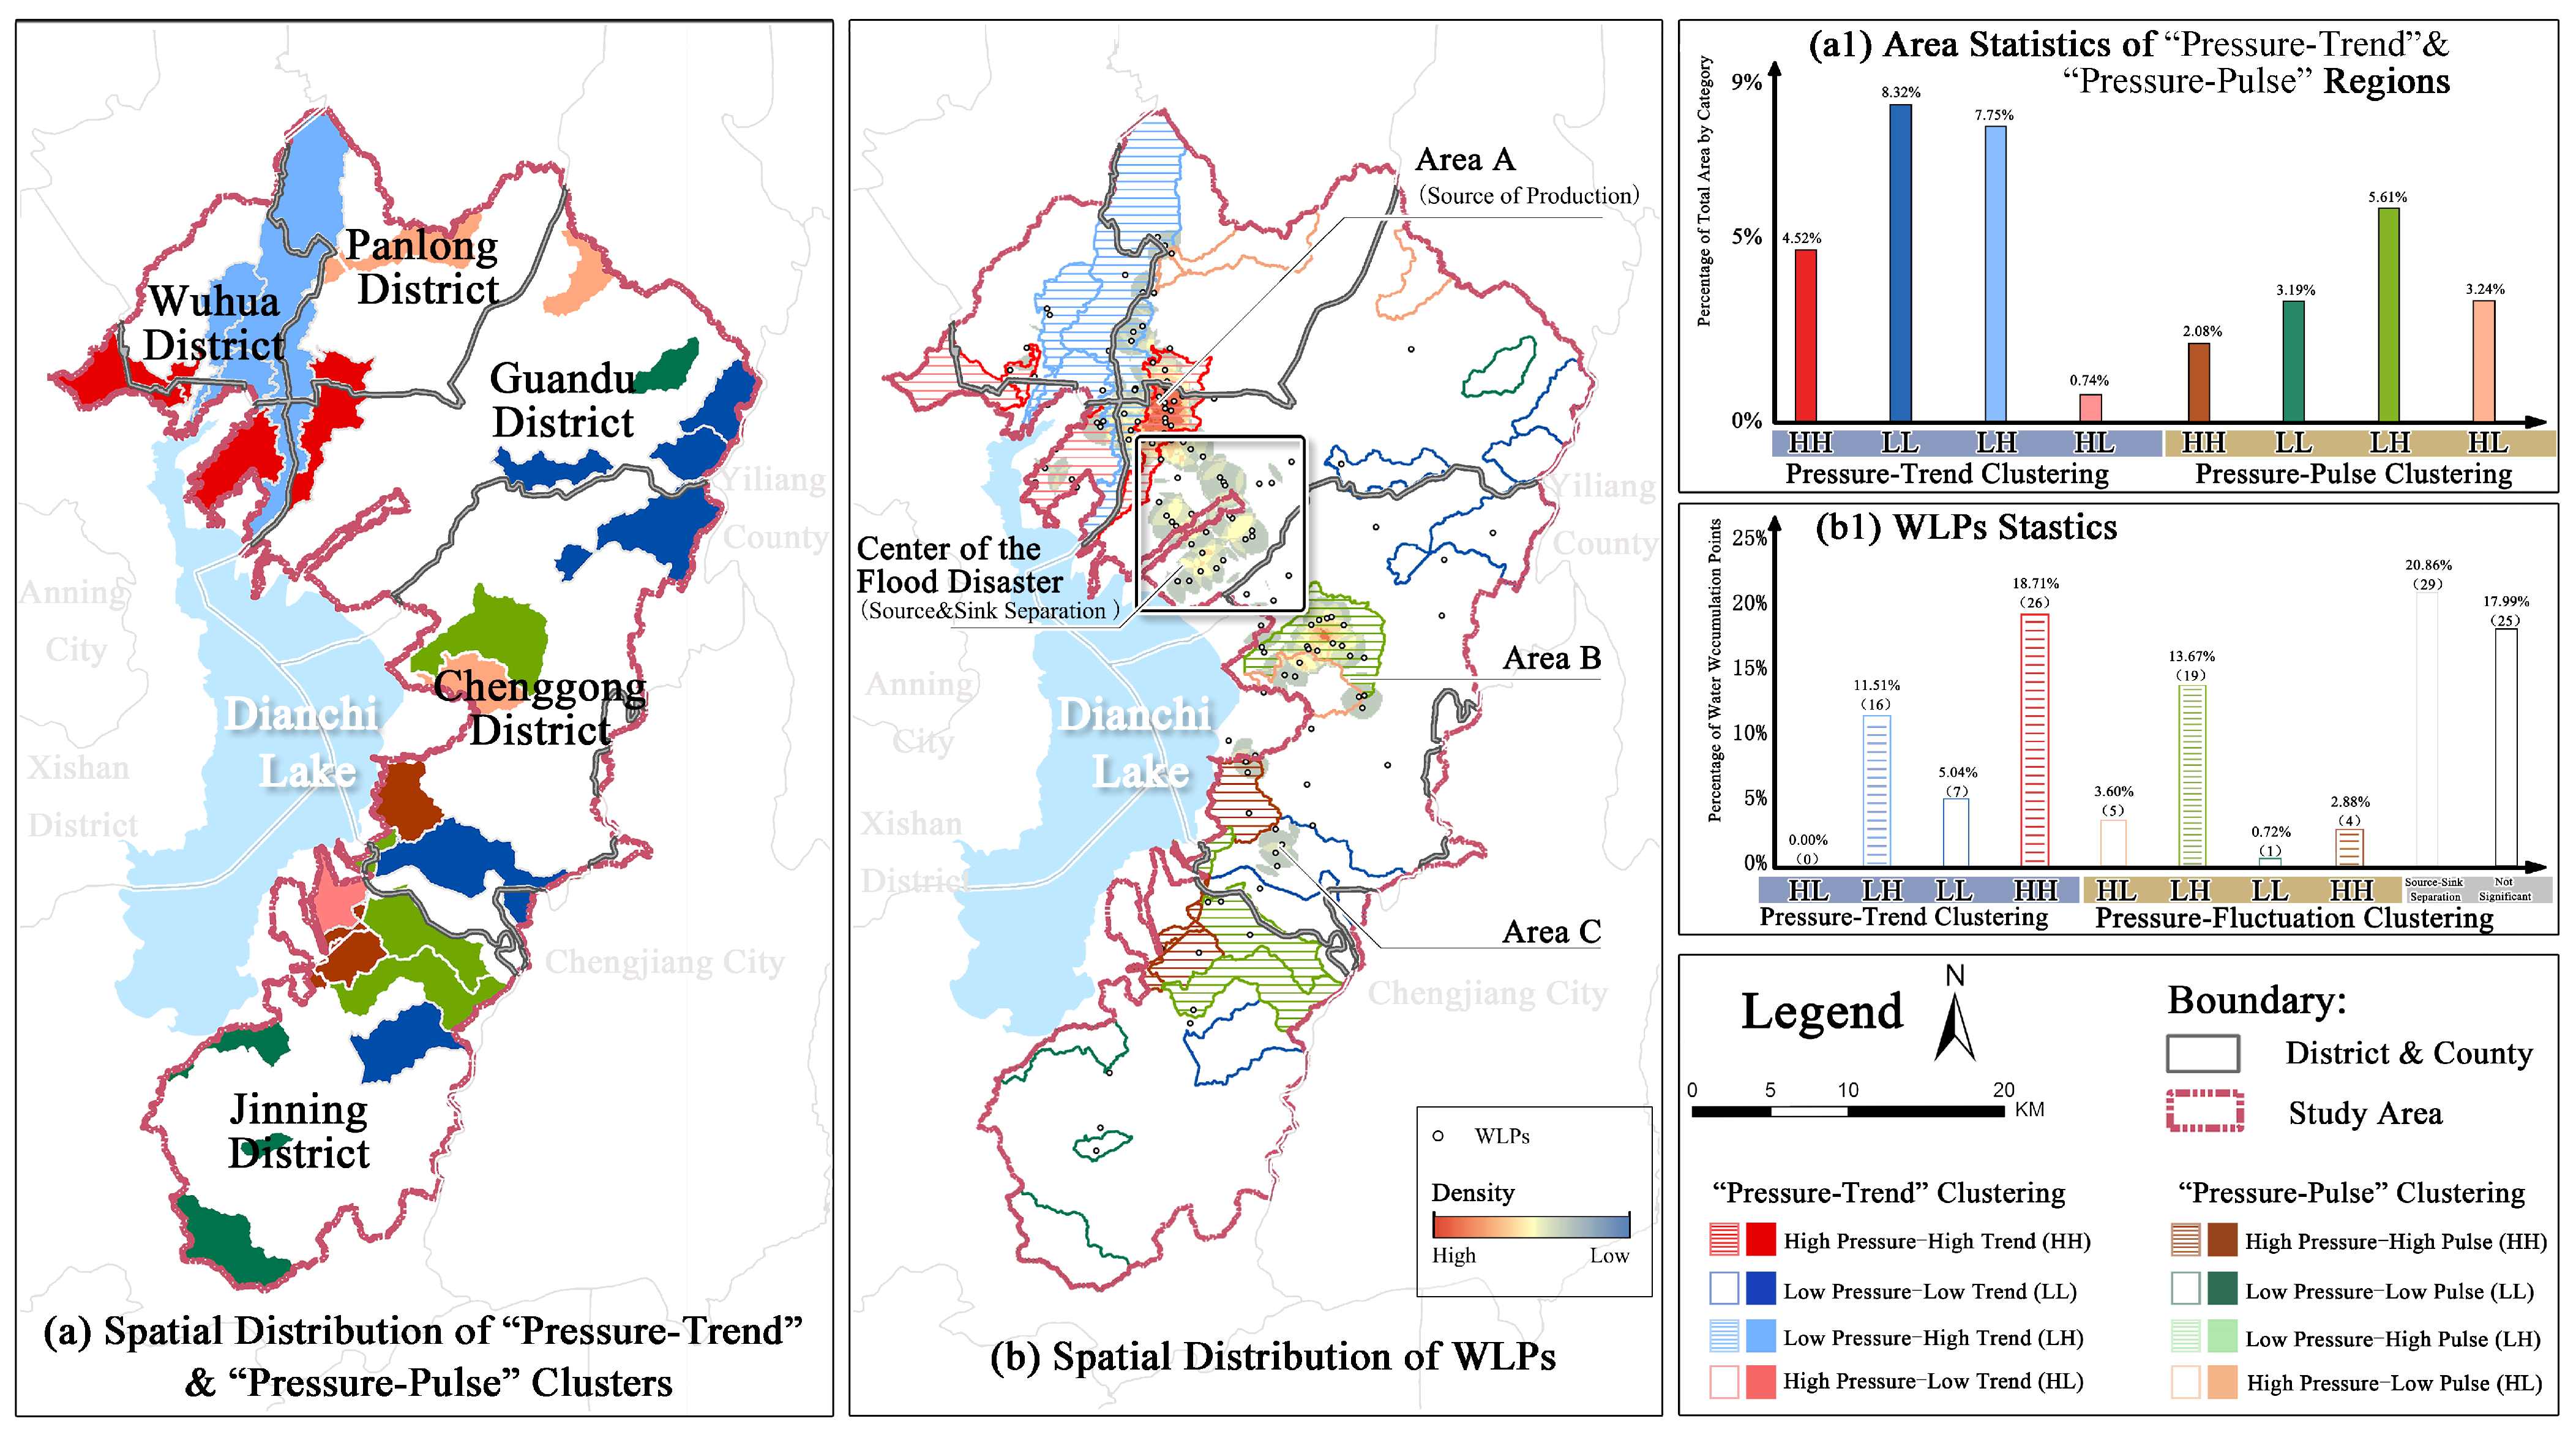
The quantitative overlay analysis revealed three distinct risk-causing mechanisms (Figure 8(b,b1)):
Figure 8.
Regional grouping and WLPs verification, based on bivariate analysis.
(1) High Trend-driven type: Of the 139 WLPs, 42 (30.22%) fell within the “High Pressure–High Trend (HH)” and “Low Pressure–High Trend (LH)” zones, which together occupy only 12.27% of the study area (179.77 km2; enrichment = 2.46, p < 0.001).
Source accumulation type risk: The HH subtype (26 points, 18.71%) represents source accumulation zones where high background runoff compounds with rapid growth, serving as the primary upstream contributor of transiting runoff.
Future accumulation risk area: The LH subtype (16 points, 11.51%), occupying 21.87% of the area, represents zones where currently moderate runoff coexists with significant upward trends, constituting an “incremental adaptive deficit” that resilience planning should prioritize.
(2) High Pulse-driven type: Nineteen WLPs (13.67%) overlapped with the “Low Pressure–High Pulse (LH)” zone, which accounts for only 5.61% of the study area (82.12 km2)—a 2.44-fold enrichment (p < 0.001). These points cluster at the Chenggong–Jinning junction in the southern new-town area, where flat terrain and low mean runoff mask high interannual fluctuation amplitudes (SOM Cluster 3; Figure 7). The average runoff in this zone is not elevated, so drainage infrastructure typically lacks the redundant capacity to absorb significant pulse fluctuations triggered by climate anomalies.
(3) Source–Sink Decoupling: Among the 139 WLPs, 29 (20.86%) fall within statistically non-significant LISA zones (Figure 8(b1)). These points are predominantly located in the southern low-lying sub-basins downstream of the High Trend northern source areas, where water accumulation results primarily from transiting runoff generated upstream rather than from local runoff generation—illustrating a spatial decoupling between “runoff source” (north) and “disaster sink” (south). The remaining non-significant points are scattered across the study area without discernible spatial clustering.
5. Discussion
We constructed the PTP framework based on long-term SURQ, and combined this with crowdsourced measured WLPs, revealing the spatiotemporal heterogeneity and compound risk-causing characteristics of the runoff evolution in the Kunming built-up area.
5.1. Analytical Framework and Methodology
The main goal of the PTP framework is to diagnose and map macro-scale patterns of non-stationary runoff risk, rather than predict exact peak runoff for specific sub-basins. In regions without validation data, this diagnosis relies on the hydrological model’s indicators: spatial heterogeneity of SURQ, long-term trends, and detrended residuals.
The study uses the non-parametric Pettitt change-point test and Sen’s slope estimator to identify trends, showing that despite the limited statistical power due to a sixteen-year simulation window, all statistically significant positive trends are concentrated in the northern high-elevation area. This consistent spatial clustering indicates that this zone not only faces high surface runoff pressure but is also experiencing a significant increase in runoff generation, making it the main contributor to the area’s rising hydrological load.
Amid climate change and human activities, annual residuals now reflect the hydrological system’s instability [35]. Traditionally seen as minor errors, these residuals, under non-stationary conditions, reveal the runoff system’s sensitivity to extreme events. Recently, researchers have used techniques like residual variance and detrended fluctuation analysis to study water cycle volatility and evolving drought/flood patterns on a warming planet [28,35]. We standardized the annual residuals using the MAD to eliminate heteroscedastic interference from runoff magnitude differences. We then used SOM, optimized by Bayesian methods, combined with the K-means algorithm for spatiotemporal clustering. This process reduces dimensions and extracts features, effectively filtering noise and capturing consistent interannual fluctuation patterns [9]. Finally, we validated the results with WLPs for empirical confirmation [44,45].
The overlap between LISA’s risk zones and historical WLPs independently tests the PTP framework’s spatial diagnostic ability. To ensure statistical rigor, the study calculated the enrichment ratio and used a permutation test with 1000 Monte Carlo simulations to control for spatial data dependence.
In trend-driven risk zones (areas with High Pressure–High Trend & Low Pressure–High Trend), 12.27% of the land holds 30.22% of WLPs, with a spatial enrichment ratio of 2.46. In pulse-driven risk zones (areas with Low Pressure–High Pulse), 5.61% of the land contains nearly 14% of WLPs, with an enrichment ratio of 2.44. These results are consistent with related findings from Wuhan [33]. The PTP framework effectively separates these “long-term trend” and “short-term pulse” dimensions, highlighting two significant hydrological risk processes for further analysis.
5.2. Mechanistic Interpretation Through Urbanization and Topography
Building on the validated spatial patterns above, the observed runoff dynamics can be interpreted through three interconnected mechanistic lenses.
Runoff Amplification Driven by Urbanization & Non-stationarity: Significant MK trends are concentrated in the northern region, aligning with the fastest impervious surface growth from 2005 to 2024. Urban areas in mountainous regions, characterized by complex topography and variable climate, demonstrate markedly higher hydrological sensitivity to the expansion of impervious surfaces compared to plains [1]. This is attributed to the association of steep slopes with increased peak flows [11], which can modify both the temporal and spatial pathways of runoff transmission [3,60]. The development of drainage networks frequently adheres to planning standards based on historical rainfall stability, typically using a 5- or 10-year recurrence interval [61,62]. As a result, urban drainage systems often experience an “infrastructure lock-in effect” [63], where their rigid structural nature leads to a significant “adaptive lag” in response to non-stationary runoff growth. As the degree of imperviousness incrementally rises, these static design standards may increasingly exceed the capacities of existing drainage systems [3,64].
Topographic Gradient-Driven Source–Sink Decoupling: Approximately 22% of WLPs are outside any significant LISA zone, mainly in the low-lying old urban core in the south and near Dianchi Lake [65]. According to traditional urban flood control logic, these areas should be safe from waterlogging since local runoff trends aren’t significant. This can be explained by the “Source–Sink Landscape Theory” [13,66]. The area’s strong elevation gradient leads to longitudinal hydrological connectivity. The mountainous north and new impervious areas serve as runoff “sources,” while the central and southern low-lying basins and lakeside areas act as “sinks.” Urbanization has encroached on wetlands and detention spaces in these sink areas, degrading their ecological buffering functions. Consequently, the mechanism underlying waterlogging disasters in the southern region is likely attributable to cross-basin spatial displacement [12,67]. The resultant chain reaction—comprising “off-site source generation, gravity-driven cascade transmission, and disaster occurrence in low-lying sink areas” [12,13]—challenges the traditional, limited perspective of micro-scale pipe network design. This understanding also elucidates why numerous retrofitting projects targeting end-of-pipe networks in low-lying regions have achieved limited success [68]. For effective hydrological management in mountainous urban areas, the spatial relationship between source and sink areas must be prioritized, even surpassing considerations of individual rainfall intensity [11,67,69,70].
System Vulnerability Analysis via Safety-Induced Disaster Theory: Approximately 73% of the study area exhibited no significant trend. However, robust residual analysis using SOM indicated a highly variable pseudo-stationary state [24]. In these zones characterized by low runoff and high fluctuation, reduced background runoff lowers the design threshold for urban infrastructure. In low-lying areas at the terminus of the topographic gradient, drainage systems inherently lack resilience. Any random perturbation from the climate system can lead to systematic failure, creating a cognitive blind spot in conventional risk assessment. The risk arises not only from long-term accumulation but also from short-term oscillations, which explains the increased frequency of flooding in some older urban areas despite minimal increases in runoff [71].
5.3. From Engineering Defense to Resilient Planning
We propose model-informed planning directions based on identified risk patterns, acknowledging that site-specific feasibility and hydraulic effectiveness need validation with detailed urban drainage models. Given the area’s topography and climate, achieving zero waterlogging is unrealistic; we accept infrastructure overload during extreme climate events [64,72]. By incorporating spatial redundancy, functional multi-layering, and nature-based solutions, we aim for controlled, localized system failures and swift recovery post-flooding [31,73].
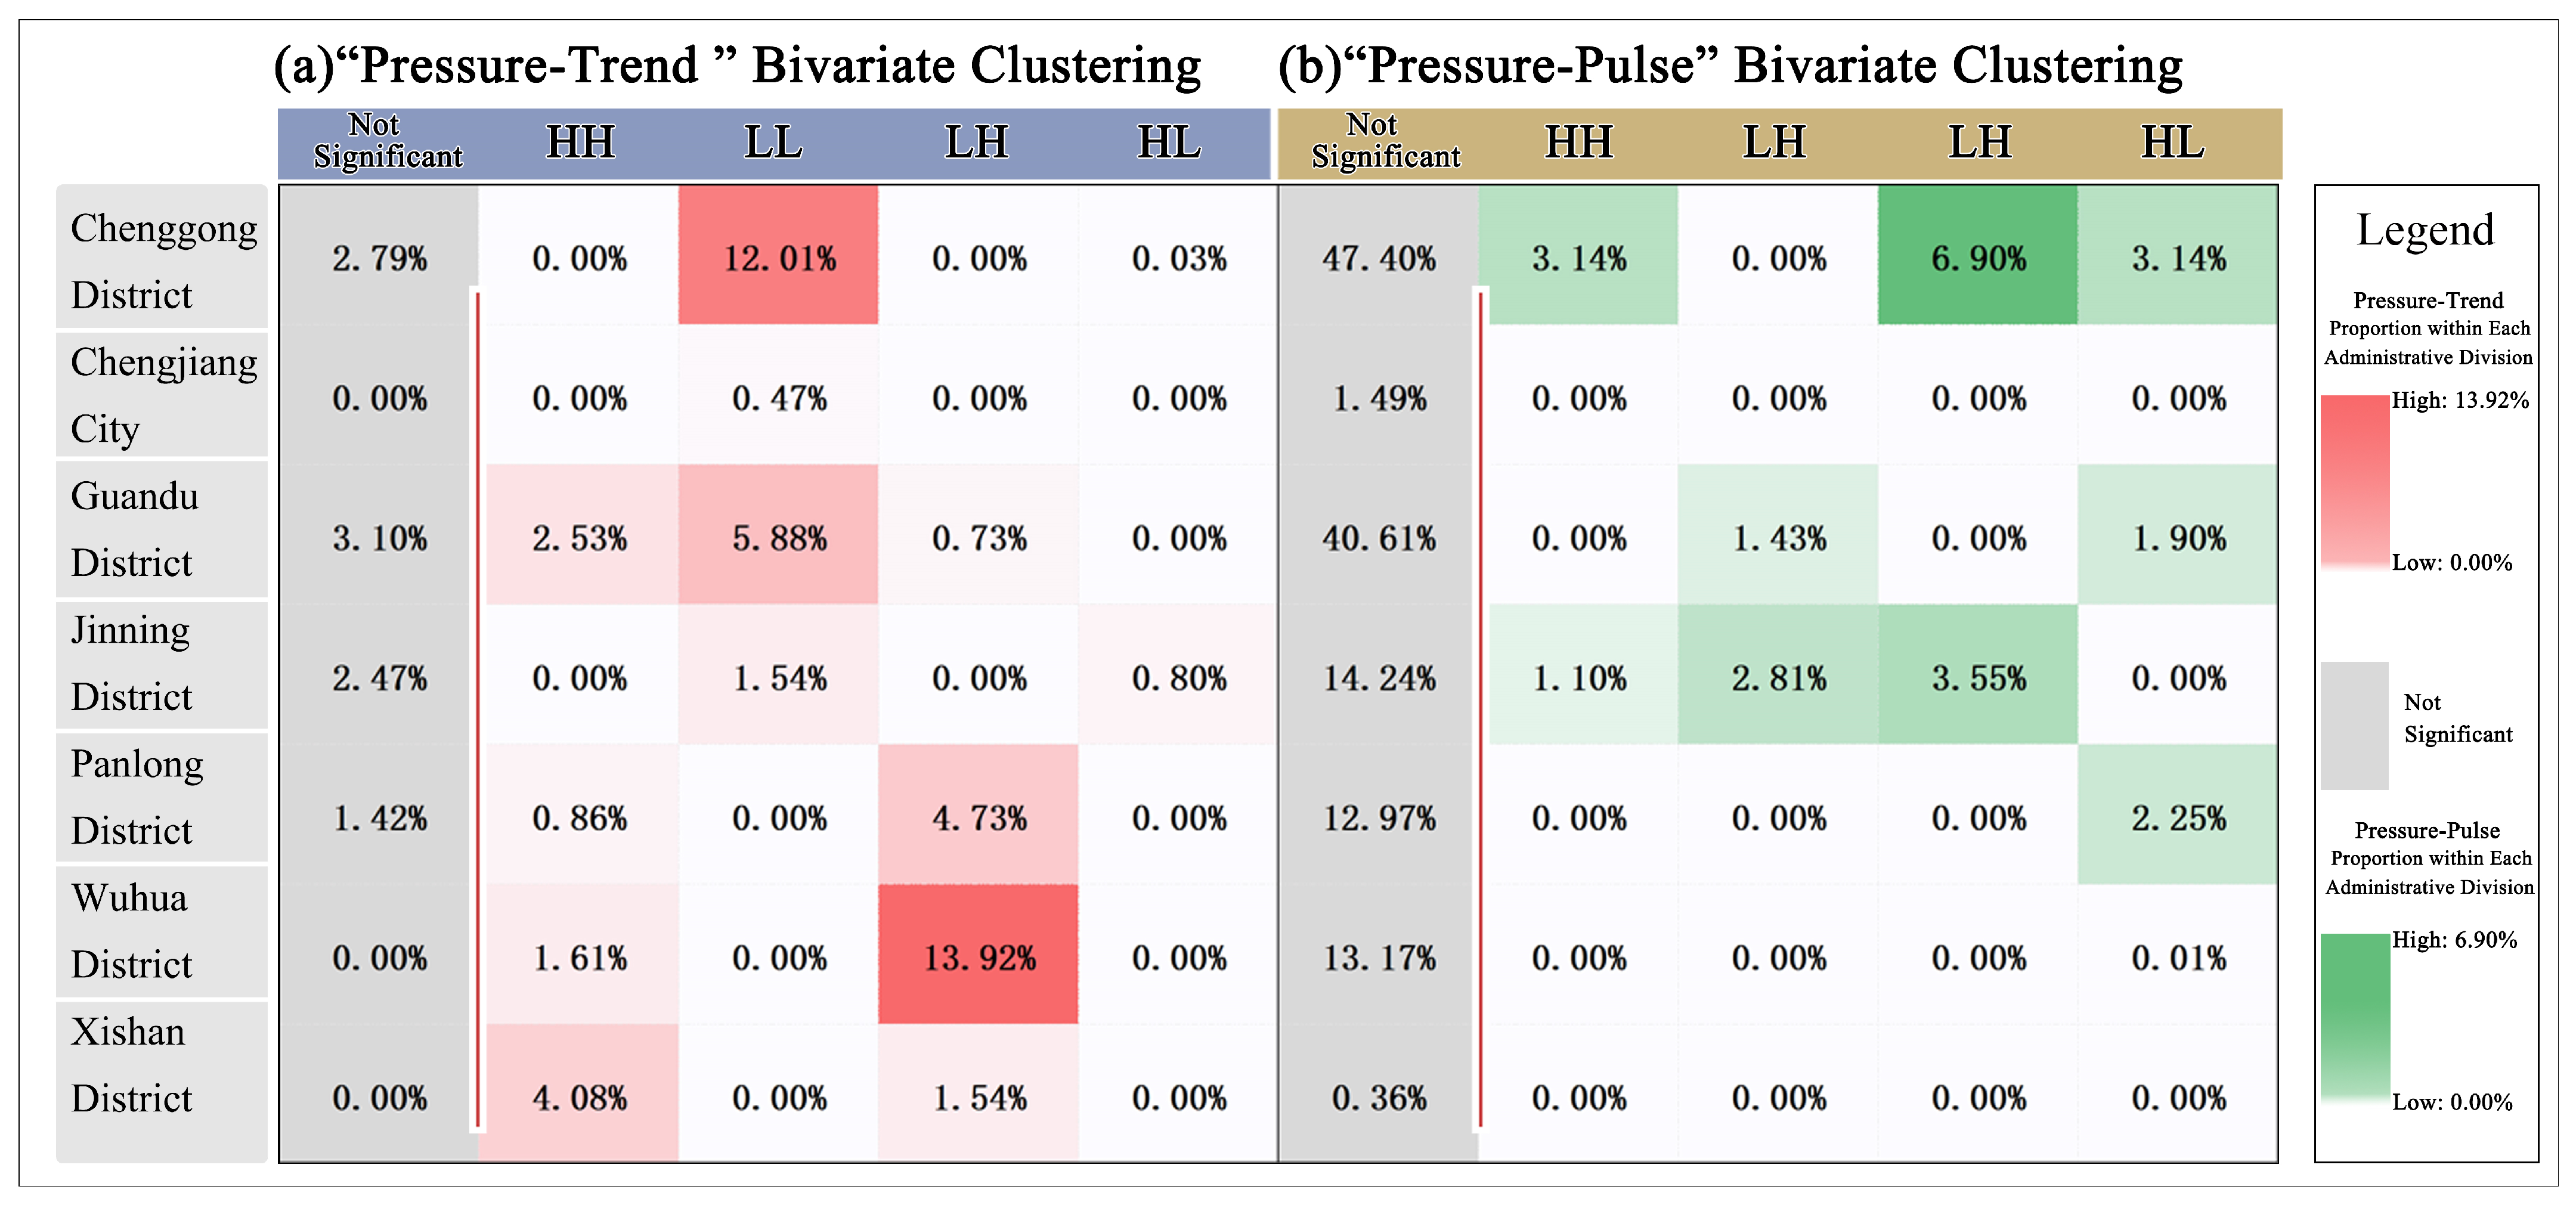
For regions characterized by high growth, such as the northern Wuhua District, which constitutes 15.53% of the study area, the primary focus should be on source reduction [74]. Implementing decentralized source-control measures or low-impact development practices could potentially restore the hydrological response curves to their pre-development state [75]. Additionally, constructing stepped rainwater retention corridors along the northern foothills could diminish the potential for runoff generation at the source and disrupt the longitudinal hydraulic chain that propagates pressure downstream. Enforcing stringent controls on total impervious surfaces in densely developed areas, in conjunction with establishing interception buffer zones along source–sink transmission pathways, could alleviate the compounding effects of upstream and downstream flood peaks, thereby facilitating peak-shifting regulation at the basin scale (Figure 9a).
Figure 9.
The proportion of each cluster in each district-level administrative region.
In regions characterized by high fluctuation and vulnerability, such as the Southern Chenggong District (6.90%) and Jinning District (3.55%), the “safe-to-fail” resilience paradigm [76] reorients planning objectives from achieving absolute runoff control to enhancing the system’s capacity to tolerate occasional overloads and facilitate rapid recovery. Dynamic hydrological buffers, including inundable parks and multifunctional wetlands adjacent to Dianchi Lake, can fulfill recreational roles during dry seasons and provide temporary water retention during extreme rainy seasons, effectively trading spatial resources for temporal flexibility. NbS may offer greater cost-effectiveness than single-purpose gray infrastructure [73] in mitigating the dual impacts of cumulative incremental pressure and episodic pulse fluctuations (Figure 9b). This approach necessitates that planners identify the optimal hybrid strategy among the three resilience approaches: “Resist,” “Delay,” and “Store/reuse.”
In summary, the identified runoff-risk patterns indicate that dynamic risk monitoring and adaptive management could serve as essential elements in future flood-resilience planning. Given the profound uncertainties associated with global climate change, it is imperative that adaptive management integrates climate-resilient margins and proactive structural redundancies into the design of future drainage systems.
5.4. Limitations and Future Perspectives
Limited by data availability, this framework suggests potential refinements: Simplify temporal and structural aspects by using sub-daily intensity–duration–frequency (IDF) curves and detailed pipe layouts for better urban drainage assessments. Overcome data constraints by integrating continuous in-situ records and crowdsourced data for model calibration in ungauged areas. Address hydrodynamics by combining SWAT outputs with 2D models to simulate gravity-driven processes more accurately.
6. Conclusions
This study investigates the spatiotemporal evolution of surface runoff in Kunming’s built-up area utilizing long-term SWAT simulations and the PTP framework. The primary findings reveal dual risk mechanisms that advance the general understanding of non-stationary hydrological behavior in plateau–mountain cities, with the following implications:
Direct Spatiotemporal Findings: Runoff generation demonstrates a persistent north–south baseline gradient. Trend-wise, monotonic runoff acceleration is exclusively localized in the high-elevation northern zone (affecting 26.74% of sub-basins, mean Sen’s slope = 0.16 mm/year). Conversely, the pulse dimension reveals highly volatile interannual fluctuation regimes predominantly isolated in the southern urban junctions.
Risk Mechanisms via Spatial Verification: Bivariate spatial cross-correlation with 139 historical WLPs validates two distinct disaster triggers. Trend-driven risks account for 30.22% of waterlogging occurrences within just 12.27% of the area, whereas pulse-driven risks trigger 13.67% of events within a mere 5.61% of the land. Crucially, approximately 22% of disasters occur within statistically non-significant southern low-lying sinks. This spatial distribution suggests a potential decoupling from local runoff generation, indicating a possible vulnerability to gravity-cascading transiting runoff from northern sources.
Resilience Planning Implications: Traditional stationary assumptions are insufficient for mountainous urban catchments. The proposed framework demands differentiated spatial interventions: prioritizing proactive source-control infrastructures in high-growth upstream sub-basins, while implementing dynamic, safe-to-fail buffering spaces in highly volatile downstream sinks.
Author Contributions
Conceptualization, X.W. and N.K.; methodology, N.K.; validation, N.K., J.Z. and G.C.; formal analysis, Z.Z.; investigation, G.W.; data curation, N.K.; writing—original draft preparation, S.A.C., X.W. and T.B.; writing—review and editing, Y.W.; visualization, T.B., Y.W. and J.Z.; supervision, Y.W. and T.B.; project administration, Y.W. and T.B.; funding acquisition, T.B. All authors have read and agreed to the published version of the manuscript.
Funding
This research was funded by the National Natural Science Foundation of China, 32360416; Yunnan Province Basic Research Fund, 202501AT070146; National Natural Science Foundation of China, 32460417.
Data Availability Statement
The original contributions presented in the study are included in the article; further inquiries can be directed to the corresponding author.
Acknowledgments
We would also like to express our sincere gratitude to the editors and reviewers for their valuable time.
Conflicts of Interest
The authors declare no conflicts of interest.
References
- Zhou, Z.; Liu, S.; Sun, L.; Liu, Y. Unraveling Nonlinear Urban Waterlogging Responses to Rainfall Structure: A Data-Driven Analysis in a Highly Urbanized Megacity. J. Hydrol. 2026, 664, 134349. [Google Scholar] [CrossRef] [Scilit]
- Jiang, Y.; Wang, L.; Xie, T.; Li, R.; Wen, K.; Liu, C.; Hu, C. Study on the Effect of Underlying Surface Changes on Runoff Generation in the Urbanized Watershed. Sci. Rep. 2025, 15, 15056. [Google Scholar] [CrossRef] [Scilit] [PubMed]
- Breen, M.J.; Kebede, A.S.; König, C.S. The Safe Development Paradox in Flood Risk Management: A Critical Review. Sustainability 2022, 14, 16955. [Google Scholar] [CrossRef] [Scilit]
- Kamali, M.; Tansar, H.; Ahmadisharaf, E.; Alamdari, N. Evaluating the Impacts of Green Infrastructure on Urban Runoff Attributes Using Detailed Fine-Scale Hydrologic Modeling. J. Hydrol. Reg. Stud. 2026, 64, 103128. [Google Scholar] [CrossRef] [Scilit]
- Martínez-Biosca, A.; Hernández-Crespo, C.; Asensi, E.; Andrés-Doménech, I.; Rodrigo-Santamalia, M.E.; Benedito-Durá, V.; Martín, M. Hydrodynamic and Water Quality Modelling of a Free Water Surface Constructed Wetland for Urban Runoff Mitigation. Ecol. Model. 2026, 514, 111468. [Google Scholar] [CrossRef] [Scilit]
- Zhao, M.; Lee, D.K.; Hwang, H.; Jin, Z.; Zhai, F.; Jung, H. Urban Land Use Optimization for Improving Carbon Storage and Mitigating Surface Runoff: A Case Study of Busan. Ecol. Process. 2026, 15, 19. [Google Scholar] [CrossRef] [Scilit]
- Milly, P.; Julio, B.; Malin, F.; Robert, M.H.; Ronald, J.S. Stationarity Is Dead. Science 2008, 319, 573–574. [Google Scholar] [CrossRef] [Scilit] [PubMed]
- Lan, T.; Li, T.; Zhang, H.; Wu, J.; Chen, Y.D.; Xu, C.-Y. Exploring the Potential Processes Controlling Changes in Precipitation–Runoff Relationships in Non-Stationary Environments. Hydrol. Earth Syst. Sci. 2025, 29, 903–924. [Google Scholar] [CrossRef] [Scilit]
- Astagneau, P.C.; Peters, J.; Pool, S.; Muñoz-Castro, E.; Brunner, M.I. RESIdual STability (RESIST) Calibration for Improved Hydrological Model Time Generalizability. Water Resour. Res. 2026, 62, e2025WR041435. [Google Scholar] [CrossRef] [Scilit]
- Gong, Y.; Geng, X.; Wang, P.; Hu, S.; Wang, X. Impact of Urbanization-Driven Land Use Changes on Runoff in the Upstream Mountainous Basin of Baiyangdian, China: A Multi-Scenario Simulation Study. Land 2024, 13, 1374. [Google Scholar] [CrossRef] [Scilit]
- Kang, Y.; Liu, J.; Liu, Q.; Zhao, W.; Guo, Y. The Impact of Landscape Patterns on Surface Runoff in the Central Urban Area of Chengdu. Front. Earth Sci. 2025, 13, 1542985. [Google Scholar] [CrossRef] [Scilit]
- Zhu, Z.; Zhang, S.; Zhang, Y.; Lu, H.; Feng, X.; Jin, H.; Gao, Y. Flood Risk Transfer Analysis Based on the “Source-Sink” Theory and Its Impact on Ecological Environment: A Case Study of the Poyang Lake Basin, China. Sci. Total Environ. 2024, 921, 171064. [Google Scholar] [CrossRef] [Scilit] [PubMed]
- Zhang, L.; Jiao, S.; Lu, J. Construction and Control Strategies for Flood Security Pattern from the “Source-Flow-Sink” Landscape Perspective: A Case Study of Changsha, China. Environ. Dev. Sustain. 2025, 27, 28379–28395. [Google Scholar] [CrossRef] [Scilit]
- Harlis, T.A.; Seo, S.B. Land Suitability Analysis for Blue-Green Infrastructure Implementation in an Urban Stormwater Management System in Surabaya, Indonesia. Water Sci. Technol. 2024, 90, 1501–1519. [Google Scholar] [CrossRef] [Scilit]
- Li, J.; Huang, K.; Yu, Y.; Qu, S.; Xu, M. Telecoupling China’s City-Level Water Withdrawal with Distant Consumption. Environ. Sci. Technol. 2023, 57, 4332–4341. [Google Scholar] [CrossRef] [Scilit] [PubMed]
- Fletcher, T.D.; Shuster, W.; Hunt, W.F.; Ashley, R.; Butler, D.; Arthur, S.; Trowsdale, S.; Barraud, S.; Semadeni-Davies, A.; Bertrand-Krajewski, J.-L.; et al. SUDS, LID, BMPs, WSUD and More—The Evolution and Application of Terminology Surrounding Urban Drainage. Urban. Water J. 2015, 12, 525–542. [Google Scholar] [CrossRef] [Scilit]
- Sang, L.; Zhu, G.F.; Qiu, D.; Zhang, Z.; Liu, Y.; Zhao, K.; Wang, L.; Sun, Z. Spatial Variability of Runoff Recharge Sources and Influence Mechanisms in an Arid Mountain Flow-producing Zone. Hydrol. Process. 2022, 36, e14642. [Google Scholar] [CrossRef] [Scilit]
- Meer, M.S. A Review on Enhancing Flood Mitigation Strategies: A Comparative Study of SCS-CN and ANN Model Integration with GIS for Rainfall–Runoff Simulation. Water Conserv. Sci. Eng. 2025, 10, 51. [Google Scholar] [CrossRef] [Scilit]
- Shrestha, S.; Cui, S.; Xu, L.; Wang, L.; Manandhar, B.; Ding, S. Impact of Land Use Change Due to Urbanisation on Surface Runoff Using GIS-Based SCS–CN Method: A Case Study of Xiamen City, China. Land 2021, 10, 839. [Google Scholar] [CrossRef] [Scilit]
- Janjić, J.; Tadić, L. Fields of Application of SWAT Hydrological Model—A Review. Earth 2023, 4, 331–344. [Google Scholar] [CrossRef] [Scilit]
- Mishra, V.; Ganguly, A.R.; Nijssen, B.; Lettenmaier, D.P. Changes in Observed Climate Extremes in Global Urban Areas. Environ. Res. Lett. 2015, 10, 024005. [Google Scholar] [CrossRef] [Scilit]
- Aryal, S.K.; Silberstein, R.P.; Fu, G.; Hodgson, G.; Charles, S.P.; McFarlane, D. Understanding Spatio-temporal Rainfall-runoff Changes in a Semi-arid Region. Hydrol. Process. 2020, 34, 2510–2530. [Google Scholar] [CrossRef] [Scilit]
- Rinat, Y.; Armon, M.; Morin, E. The Complex Effect of Climate Change and Urbanization on Streamflow in Small–Medium Mediterranean Catchments. EGUsphere 2026, 2026, 1–35. [Google Scholar] [CrossRef] [Scilit]
- Slater, L.J.; Anderson, B.; Buechel, M.; Dadson, S.; Han, S.; Harrigan, S.; Kelder, T.; Kowal, K.; Lees, T.; Matthews, T.; et al. Nonstationary Weather and Water Extremes: A Review of Methods Fortheir Detection, Attribution, and Management. Hydrol. Earth Syst. Sci. 2020, 25, 3897–3935. [Google Scholar]
- Twinomuhangi, M.B.; Bamutaze, Y.; Kabenge, I.; Wanyama, J.; Kizza, M.; Gabiri, G.; Egli, P.E. Analysis of Stationary and Non-Stationary Hydrological Extremes under a Changing Environment: A Systematic Review. HydroResearch 2025, 8, 332–350. [Google Scholar] [CrossRef] [Scilit]
- Lan, T.; Du, X.; Xie, X.; Lin, K.; Zhang, H.; Gong, X.; Chen, Y.D.; Xu, C.-Y. Exploring Controls on Precipitation-Runoff Dependencies: Implications for Non-Stationary and Spatially Heterogeneous Analyses. J. Hydrol. 2025, 659, 133333. [Google Scholar] [CrossRef] [Scilit]
- Singh, J.; Vittal, H.; Singh, T.; Karmakar, S.; Ghosh, S. A Framework for Investigating the Diagnostic Trend in Stationary and Nonstationary Flood Frequency Analyses Under Changing Climate. J. Clim. Change 2015, 1, 47–65. [Google Scholar] [CrossRef] [Scilit]
- Nie, W.; Kumar, S.V.; Getirana, A.; Zhao, L.; Wrzesien, M.L.; Konapala, G.; Ahmad, S.K.; Locke, K.A.; Holmes, T.R.; Loomis, B.D.; et al. Nonstationarity in the Global Terrestrial Water Cycle and Its Interlinkages in the Anthropocene. Proc. Natl. Acad. Sci. USA 2024, 121, e2403707121. [Google Scholar] [CrossRef] [Scilit] [PubMed]
- Gu, H.; Cheng, W.; Chen, H.; Liu, L.; Xie, J.; Xu, Y.-P. A Unified Probability Distribution of Second Order Difference of Global Streamflow. Sci. Rep. 2025, 15, 14305. [Google Scholar] [CrossRef] [Scilit] [PubMed]
- Le Roux, E.; Wendling, V.; Panthou, G.; Dubas, O.; Vandervaere, J.-P.; Hector, B.; Favreau, G.; Cohard, J.-M.; Pierre, C.; Descroix, L.; et al. Hydrological Regime Shifts in Sahelian Watersheds: An Investigation with a Simple Dynamical Model Driven by Annual Precipitation. Hydrol. Earth Syst. Sci. 2026, 30, 929–944. [Google Scholar] [CrossRef] [Scilit]
- Ma, Y.; Zhang, J.; Liu, C.; He, R.; Jin, J.; Wu, J.; Shu, Z. New Characteristics of Extreme Rainstorm and Flood in Chinese Cities and Suggestions for Enhancing Resilience. Strateg. Study Chin. Acad. Eng. 2026, 28, 260. (In Chinese) [Google Scholar] [CrossRef]
- Jaggi, H.; Tuljapurkar, S.; Zuo, W.; Gascoigne, S.J.L.; Kajin, M.; Salguero-Gómez, R. Transient Dynamics and Nonlinear Fitness: A Matrix Approach to Pulse and Press Perturbation. Ecology 2026, 107, e70433. [Google Scholar] [CrossRef] [Scilit] [PubMed]
- Xiao, S.; Zou, L.; Xia, J.; Dong, Y.; Yang, Z.; Yao, T. Assessment of the Urban Waterlogging Resilience and Identification of Its Driving Factors: A Case Study of Wuhan City, China. Sci. Total Environ. 2023, 866, 161321. [Google Scholar] [CrossRef] [Scilit] [PubMed]
- Swain, D.L.; Prein, A.F.; Abatzoglou, J.T.; Albano, C.M.; Brunner, M.; Diffenbaugh, N.S.; Singh, D.; Skinner, C.B.; Touma, D. Hydroclimate Volatility on a Warming Earth. Nat. Rev. Earth Environ. 2025, 6, 35–50. [Google Scholar] [CrossRef] [Scilit]
- Jha, S.; Barker, L.J.; Hannaford, J.; Tanguy, M. Evolution of Nonstationary Hydrological Drought Characteristics in the UK under Warming. EGUsphere 2025, 2025, 1–23. [Google Scholar] [CrossRef] [Scilit]
- Bao, Z.; Wu, Y.; He, W.; She, N.; Li, Z. Intensified Rainfall, Growing Floods: Projecting Urban Drainage Challenges in South-Central China under Climate Change Scenarios. Appl. Sci. 2025, 15, 11577. [Google Scholar] [CrossRef] [Scilit]
- Wang, J.; Li, M.; Yang, M.; Tang, B.-H. Deformation Detection and Attribution Analysis of Urban Areas near Dianchi Lake in Kunming Using the Time-Series InSAR Technique. Appl. Sci. 2022, 12, 10004. [Google Scholar] [CrossRef] [Scilit]
- Xu, T.; Xie, Z.; Jiang, F.; Yang, S.; Deng, Z.; Zhao, L.; Wen, G.; Du, Q. Urban Flooding Resilience Evaluation with Coupled Rainfall and Flooding Models: A Small Area in Kunming City, China as an Example. Water Sci. Technol. 2023, 87, 2820–2839. [Google Scholar] [CrossRef] [Scilit] [PubMed]
- Yang, J.; Huang, X. The 30 m Annual Land Cover Dataset and Its Dynamics in China from 1990 to 2019. Earth Syst. Sci. Data 2021, 13, 3907–3925. [Google Scholar] [CrossRef] [Scilit]
- Nachtergaele, F.O.; van Velthuizen, H.; Verelst, L.; Wiberg, D.; Batjes, N.H.; Dijkshoorn, J.A.; van Engelen, V.W.P.; Fischer, G.; Jones, A.; Montanarella, L.; et al. Harmonized World Soil Database (Version 1.2). In Proceedings of the 19th World Congress of Soil Science, Soil Solutions for a Changing World; International Union of Soil Sciences: Rome, Italy, 2012. [Google Scholar]
- Saha, S.; Moorthi, S.; Pan, H.-L.; Wu, X.; Wang, J.; Nadiga, S.; Tripp, P.; Kistler, R.; Woollen, J.; Behringer, D.; et al. The NCEP Climate Forecast System Reanalysis. Bull. Amer. Meteor. Soc. 2010, 91, 1015–1058. [Google Scholar] [CrossRef] [Scilit]
- Saha, S.; Moorthi, S.; Wu, X.; Wang, J.; Nadiga, S.; Tripp, P.; Behringer, D.; Hou, Y.-T.; Chuang, H.; Iredell, M.; et al. The NCEP Climate Forecast System Version 2. J. Clim. 2014, 27, 2185–2208. [Google Scholar] [CrossRef] [Scilit]
- Cronshey, R. Urban Hydrology for Small Watersheds; U.S. Department of Agriculture, Soil Conservation Service, Engineering Division: Washington, DC, USA, 1986.
- Chen, Y.; Hu, M.; Chen, X.; Wang, F.; Liu, B.; Huo, Z. An Approach of Using Social Media Data to Detect the Real Time Spatio-Temporal Variations of Urban Waterlogging. J. Hydrol. 2023, 625, 130128. [Google Scholar] [CrossRef] [Scilit]
- Song, J.; Shao, Z.; Zhan, Z.; Chen, L. State-of-the-Art Techniques for Real-Time Monitoring of Urban Flooding: A Review. Water 2024, 16, 2476. [Google Scholar] [CrossRef] [Scilit]
- Arnold, J.G.; Srinivasan, R.; Muttiah, R.S.; Williams, J.R. LARGE AREA HYDROLOGIC MODELING AND ASSESSMENT PART I: MODEL DEVELOPMENT1. J. Am. Water Resour. Assoc. 1998, 34, 73–89. [Google Scholar] [CrossRef] [Scilit]
- Senent-Aparicio, J.; Blanco-Gómez, P.; López-Ballesteros, A.; Jimeno-Sáez, P.; Pérez-Sánchez, J. Evaluating the Potential of GloFAS-ERA5 River Discharge Reanalysis Data for Calibrating the SWAT Model in the Grande San Miguel River Basin (El Salvador). Remote Sens. 2021, 13, 3299. [Google Scholar] [CrossRef] [Scilit]
- Chen, S.; Huang, J.; Huang, J.-C. Improving Daily Streamflow Simulations for Data-Scarce Watersheds Using the Coupled SWAT-LSTM Approach. J. Hydrol. 2023, 622, 129734. [Google Scholar] [CrossRef] [Scilit]
- Deng, W.; Song, J.; Sun, H.; Cheng, D.; Zhang, X.; Liu, J.; Kong, F.; Wang, H.; Khan, A.J. Isolating of Climate and Land Surface Contribution to Basin Runoff Variability: A Case Study from the Weihe River Basin, China. Ecol. Eng. 2020, 153, 105904. [Google Scholar] [CrossRef] [Scilit]
- Muia, V.; Opere, A.; Ndunda, E.; Amwata, D. Rainfall and Temperature Trend Analysis Using Mann-Kendall and Sen’s Slope Estimator Test in Makueni County, Kenya. J. Mater. Environ. Sci. 2024, 15, 349, 367. [Google Scholar]
- Tan Kesgin, R.İ. Revisiting Trend Stability Using Mann-Kendall and Wilcoxon Signed-Rank Tests Through Innovative Method Comparisons. Sustainability 2025, 17, 10454. [Google Scholar] [CrossRef] [Scilit]
- Liu, S.; Xie, Y.; Fang, H.; Du, H.; Xu, P. Trend Test for Hydrological and Climatic Time Series Considering the Interaction of Trend and Autocorrelations. Water 2022, 14, 3006. [Google Scholar] [CrossRef] [Scilit]
- Benjamini, Y.; Hochberg, Y. Controlling the False Discovery Rate: A Practical and Powerful Approach to Multiple Testing. J. R. Stat. Soc. Ser. B (Methodol.) 1995, 57, 289–300. [Google Scholar] [CrossRef] [Scilit]
- Rousseeuw, P.J.; Hubert, M. Anomaly Detection by Robust Statistics. WIREs Data Min. Knowl. Discov. 2018, 8, e1236. [Google Scholar] [CrossRef] [Scilit]
- Ley, R.; Casper, M.C.; Hellebrand, H.; Merz, R. Catchment Classification by Runoff Behaviour with Self-Organizing Maps (SOM). Hydrol. Earth Syst. Sci. 2011, 15, 2947–2962. [Google Scholar] [CrossRef] [Scilit]
- Akiba, T.; Sano, S.; Yanase, T.; Ohta, T.; Koyama, M. Optuna: A Next-Generation Hyperparameter Optimization Framework. In Proceedings of the 25th ACM SIGKDD International Conference on Knowledge Discovery & Data Mining; Association for Computing Machinery: New York, NY, USA, 2019; pp. 2623–2631. [Google Scholar]
- Hu, H.; Fu, Q.; Chang, S.; Zhu, Y.; Shamseldin, A.Y.; Zhang, F.; Yang, G.; Ye, C.; Fan, Y.; Wang, E. Leverage-Based Nutrient Governance for Drinking Water Sources Using Hydro-Ecological Zoning and Source Apportionment in the Yangtze River Basin. J. Environ. Chem. Eng. 2026, 14, 123084. [Google Scholar] [CrossRef] [Scilit]
- Yang, H.; Ning, W.; Wang, Z.; Sun, X. Determination and Sensitivity Analysis of Urban Waterlogging Driving Factors Based on Spatial Analysis Method. Sustainability 2025, 17, 2785. [Google Scholar] [CrossRef] [Scilit]
- Anselin, L. A Local Indicator of Multivariate Spatial Association: Extending Geary’s c. Geogr. Anal. 2019, 51, 133–150. [Google Scholar] [CrossRef] [Scilit]
- Chen, X.; Van Der Werf, J.A.; Droste, A.; Coenders-Gerrits, M.; Uijlenhoet, R. Barriers to Urban Hydrometeorological Simulation: A Review. Hydrol. Earth Syst. Sci. 2025, 29, 3447–3480. [Google Scholar] [CrossRef] [Scilit]
- Fu, H.; Gaüzère, P.; García Molinos, J.; Zhang, P.; Zhang, H.; Zhang, M.; Niu, Y.; Yu, H.; Brown, L.E.; Xu, J. Mitigation of Urbanization Effects on Aquatic Ecosystems by Synchronous Ecological Restoration. Water Res. 2021, 204, 117587. [Google Scholar] [CrossRef] [Scilit] [PubMed]
- Dell’Aira, F.; Meier, C.I. Beyond Total Impervious Area: A New Lumped Descriptor of Basin-Wide Hydrologic Connectivity for Characterizing Urban Watersheds. Hydrol. Earth Syst. Sci. 2024, 29, 1001–1032. [Google Scholar]
- Seto, K.C.; Davis, S.J.; Mitchell, R.B.; Stokes, E.C.; Unruh, G.; Ürge-Vorsatz, D. Carbon Lock-in: Types, Causes, and Policy Implications. Annu. Rev. Environ. Resour. 2016, 41, 425–452. [Google Scholar] [CrossRef] [Scilit]
- Mesta, C.; Cremen, G.; Galasso, C. Quantifying the Potential Benefits of Risk-Mitigation Strategies on Future Flood Losses in Kathmandu Valley, Nepal. Nat. Hazards Earth Syst. Sci. 2023, 23, 711–731. [Google Scholar] [CrossRef] [Scilit]
- Polenghi-Gross, I.; Sabol, S.A.; Ritchie, S.R.; Norton, M.R. Water Storage and Gravity for Urban Sustainability and Climate Readiness. J. AWWA 2014, 106, E539–E549. [Google Scholar] [CrossRef] [Scilit]
- Shang, Y.; Liu, J.; Wu, H.; Chen, L. Spatial Layout Strategy for Stormwater Management Measures in Mountainous Cities Based on the “Source-Sink” Theory. Water 2025, 17, 1591. [Google Scholar] [CrossRef] [Scilit]
- Stoffel, M.; Wyżga, B.; Marston, R.A. Floods in Mountain Environments: A Synthesis. Geomorphology 2016, 272, 1–9. [Google Scholar] [CrossRef] [Scilit]
- Guo, K.; Guan, M.; Yu, D. Urban Surface Water Flood Modelling—A Comprehensive Review of Current Models and Future Challenges. Hydrol. Earth Syst. Sci. 2021, 25, 2843–2860. [Google Scholar] [CrossRef] [Scilit]
- O’Driscoll, M.; Clinton, S.; Jefferson, A.; Manda, A.; McMillan, S. Urbanization Effects on Watershed Hydrology and In-Stream Processes in the Southern United States. Water 2010, 2, 605–648. [Google Scholar] [CrossRef] [Scilit]
- Zech, A.; Dietrich, P.; Attinger, S.; Teutsch, G. A Field Evidence Model: How to Predict Transport in Heterogeneous Aquifers at Low Investigation Level. Hydrol. Earth Syst. Sci. 2021, 25, 1–15. [Google Scholar] [CrossRef] [Scilit]
- Serinaldi, F.; Kilsby, C.G. Stationarity Is Undead: Uncertainty Dominates the Distribution of Extremes. Adv. Water Resour. 2015, 77, 17–36. [Google Scholar] [CrossRef] [Scilit]
- Frantzeskaki, N.; Broto, V.C.; Coenen, L.; Loorbach, D. Urban Sustainability Transitions; Routledge: New York, NY, USA, 2017; Volume 5. [Google Scholar]
- Matsler, A.M.; Meerow, S.; Mell, I.C.; Pavao-Zuckerman, M.A. A ‘Green’ Chameleon: Exploring the Many Disciplinary Definitions, Goals, and Forms of “Green Infrastructure”. Landsc. Urban Plan. 2021, 214, 104145. [Google Scholar] [CrossRef] [Scilit]
- Walsh, C.J.; Booth, D.B.; Burns, M.J.; Fletcher, T.D.; Hale, R.L.; Hoang, L.N.; Livingston, G.; Rippy, M.A.; Roy, A.H.; Scoggins, M.; et al. Principles for Urban Stormwater Management to Protect Stream Ecosystems. Freshw. Sci. 2016, 35, 398–411. [Google Scholar] [CrossRef] [Scilit]
- Burns, M.J.; Fletcher, T.D.; Walsh, C.J.; Ladson, A.R.; Hatt, B.E. Hydrologic Shortcomings of Conventional Urban Stormwater Management and Opportunities for Reform. Landsc. Urban Plan. 2012, 105, 230–240. [Google Scholar] [CrossRef] [Scilit]
- Ahern, J. From Fail-Safe to Safe-to-Fail: Sustainability and Resilience in the New Urban World. Landsc. Urban Plan. 2011, 100, 341–343. [Google Scholar] [CrossRef] [Scilit]

Disclaimer/Publisher’s Note: The statements, opinions and data contained in all publications are solely those of the individual author(s) and contributor(s) and not of MDPI and/or the editor(s). MDPI and/or the editor(s) disclaim responsibility for any injury to people or property resulting from any ideas, methods, instructions or products referred to in the content. |
© 2026 by the authors. Licensee MDPI, Basel, Switzerland. This article is an open access article distributed under the terms and conditions of the Creative Commons Attribution (CC BY) license.