


Abstract
Under the influence of climate change and human activities, hydrologic regime and runoff in the upper Yangtze River basin (UYRB) have exhibited significant alterations. This study aims to address the primary drivers of runoff change and the destination of runoff reduction. Based on hydro-meteorological data from 1980 to 2022 and other related datasets, the temporal trend in hydro-meteorological variables was analyzed, and the impacts of climate change and human activities on runoff were quantified using the SWAT model. The destination of runoff reduction was also addressed based on the water balance equation. The SWAT model was calibrated using a top-down sequential strategy at five hydrological stations. The results show that despite a slight increase in precipitation and a pronounced rise in potential evapotranspiration, the annual average runoff at Yichang station is decreased by 22.3 billion m3. The SWAT model can simulate the monthly runoff hydrograph well with the NSE exceeding 0.85 during calibration and validation periods in the UYRB. Attribution analysis reveals that the contribution rate of climate change and human activities on runoff are 36.21% and 63.79% at the Yichang station, respectively. The annual average runoff change can be attributed to four pathways: (1) actual evapotranspiration increases due to land use and land cover (LULC) change and basin greening (−12.85 billion m3); (2) water intake and consumption increase (−2.94 billion m3); (3) reservoir dead storage impoundment (−3.34 billion m3); and (4) ground water storage variations (−3.21 billion m3). These findings highlight the impact of human water abstraction and land use change on runoff, providing a scientific basis for water resource management in the UYRB.
1. Introduction
Global warming is an unequivocally established phenomenon, projected to intensify the hydrological cycle by elevating precipitation and potential evapotranspiration [1]. Such intensification exacerbates spatial heterogeneity in water availability, consistent with the widely recognized “wet-get-wetter, dry-get-drier” paradigm [2]. Rapid population growth and urban expansion have driven significant land use changes, including urban expansion, forest degradation, and wetland loss. These transformations alter watershed characteristics and directly affect infiltration and evapotranspiration [3,4]. Human interventions in the hydrological cycle are most directly manifested through water diversion projects and reservoir construction, which redistribute natural streamflow across temporal and spatial scales [5]. As a critical component of regional water resources, surface runoff is increasingly modified by the combined effects of climate change and human activities, with significant implications for ecological, social, and economic systems. Studies suggest that runoff variability may further intensify in the future. To address these challenges and develop effective water management strategies, it is essential to quantify the impacts of both climatic and anthropogenic factors on runoff [6].
Commonly used methods in attribution analysis of runoff change can be divided into three types: statistical methods, Budyko equations, and hydrological models. The statistical methods, such as the regression analysis method, establish mathematical relationships between runoff change with a hydroclimate dataset, which are simple but often overlook the physical meaning [7]. Budyko equations incorporate both water and energy balances, linking precipitation, potential evapotranspiration, and actual evapotranspiration with parameters reflecting integrated watershed characteristics [8,9]. Budyko equations have been applied and improved across the world. For example, Clemenzi et al. [10] assessed the contribution of climate drivers to runoff changes under future European conditions using the Budyko framework and revealed that precipitation mainly drives Europe’s runoff changes under low-to-medium emissions. Lv et al. [11] integrated the Budyko hypothesis with the Penman–Monteith (PET) model to explicitly incorporate vegetation and LUCC in U.S. watersheds and evaluated the contributions of climate and human factors on runoff. The results found that the precipitation contributed to 60% runoff variation. However, the Budyko framework does not explicitly account for spatial heterogeneity in climatic and hydrological factors. Hydrological models are capable of simulating the temporal dynamics and spatial variability of hydrological variables [12,13]. By comparing simulations across different scenarios, the impacts of individual driving factors can be isolated, which has led to hydrologic models being widely applied in attribution analysis [14,15]. For example, Yu et al. [16] adapted the distributed geomorphological hydrological model (GBHM) to simulate natural runoff in the Balkhash Lake basin in the period of 1955–2020 and observed that human activities were the dominant driver of runoff reduction during 1970–2002, whereas both human activities and climate change contributed nearly equally to runoff changes from 2003 to 2020. Senbeta and Romanowicz [17] evaluated the influence of climatic factors and human interventions on runoff changes in the Kamienna watershed using the SWAT model and found that climatic factors and human interventions contributed 40% and 60% of runoff reduction, respectively. In China, Zhao et al. [18] integrated statistical analysis and the SWAT model to quantify the respective contributions of land use/land cover (LULC) and climatic factors to runoff variations in the source region of an alpine river in the northeastern Qinghai–Tibetan Plateau. Their results indicate that climate change and LULC accounted for approximately 125% and −25% of the observed runoff increase, respectively. Wang et al. [19] conducted an attribution analysis of the inflow runoff in the Danjiangkou Reservoir using the Budyko equation and the ABCD hydrological model and showed that the climate factors accounted for 61.01% of the runoff reduction, while underlying land surface contributed 38.99%. The dominant factors identified for runoff variation are different across regions due to the influence of regional hydrometeorological characteristics, hydrological models, the data period and spatial resolution.
Stretching across the eastern, central, and western economic zones of China, the upper Yangtze River basin (UYRB) supports the national population and economic output, serving as a vital economic corridor in China. It has been acknowledged that climate factors have changed in the UYRB [20]. In terms of LULC, with the nationwide implementation of the “Grain for Green” program, vegetation restoration has enhanced the soil infiltration capacity, leading to a consequent reduction in surface runoff [21]. On the other hand, rapid urban expansion has significantly increased impervious surfaces, drastically limiting rainwater infiltration and resulting in a sharp rise in both the volume and velocity of surface runoff [22,23]. Additionally, numerous large-scale reservoirs have been constructed in recent decades in the UYRB. The functions of these reservoirs attenuate peak discharges during flood season and increase outflow discharges during the dry season, influencing the annual distribution of runoff [24,25]. Given these changes in climate and anthropogenic factors, the hydrological regime in the upper Yangtze River has been noticeably altered [26]. Runoff attribution analysis has also been carried out. Wang et al. [27] employed the rainfall–runoff relationship method, the slope variation method, and the Budyko hypothesis to quantify the contributions of human and climatic impacts to runoff reduction from 1961 to 2020 in the UYRB. Their results indicate that human disturbance was the dominant driver of runoff change, accounting for 53.0~82.0% of the observed reduction, while climatic factors contributed 17.0~47.0%. Han et al. [28] applied the SWAT+ model to quantify the impacts of climate change and LULC on runoff reduction in the UYRB from 1961 to 2023. Their results indicate that climate change was the dominant factor driving annual runoff change, accounting for 77.69% of the variation, while reservoir operation also played a significant role at seasonal scales. Although the studies above have identified the impact of climate change and human activities on runoff, the destination of runoff reduction remains unclear. The runoff generation process mainly includes actual evapotranspiration (AET), surface interception and infiltration. Hence, the destinations of runoff reduction can be analyzed through the water balance equation.
Based on this background, the specific objectives of this study are as follows: (1) to systematically examine the temporal trends of key hydrometeorological variables, the leaf area index, water intake quantity and GWSA in the UYRB; (2) to compare the meteorological factors (precipitation and potential evapotranspiration) and runoff before and after 2000 and preliminarily assess the impact of meteorological changes on runoff; (3) to establish a SWAT model for runoff simulation and estimate the contribution rate of climate change and human activities on runoff; and (4) to identify the dominant factor in driving runoff variations and to trace the possible sources and pathways of runoff reduction. The paper is organized into the following sections: Section 2 describes the study area and data sources; Section 3 outlines the methodology; Section 4 presents the results; Section 5 provides a comprehensive discussion of the main findings; and Section 5 summarizes the key conclusions.
2. Materials and Methods
2.1. Study Area
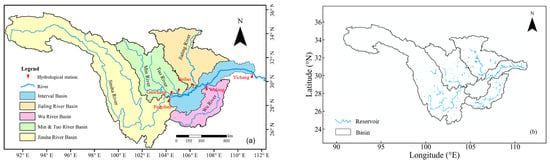
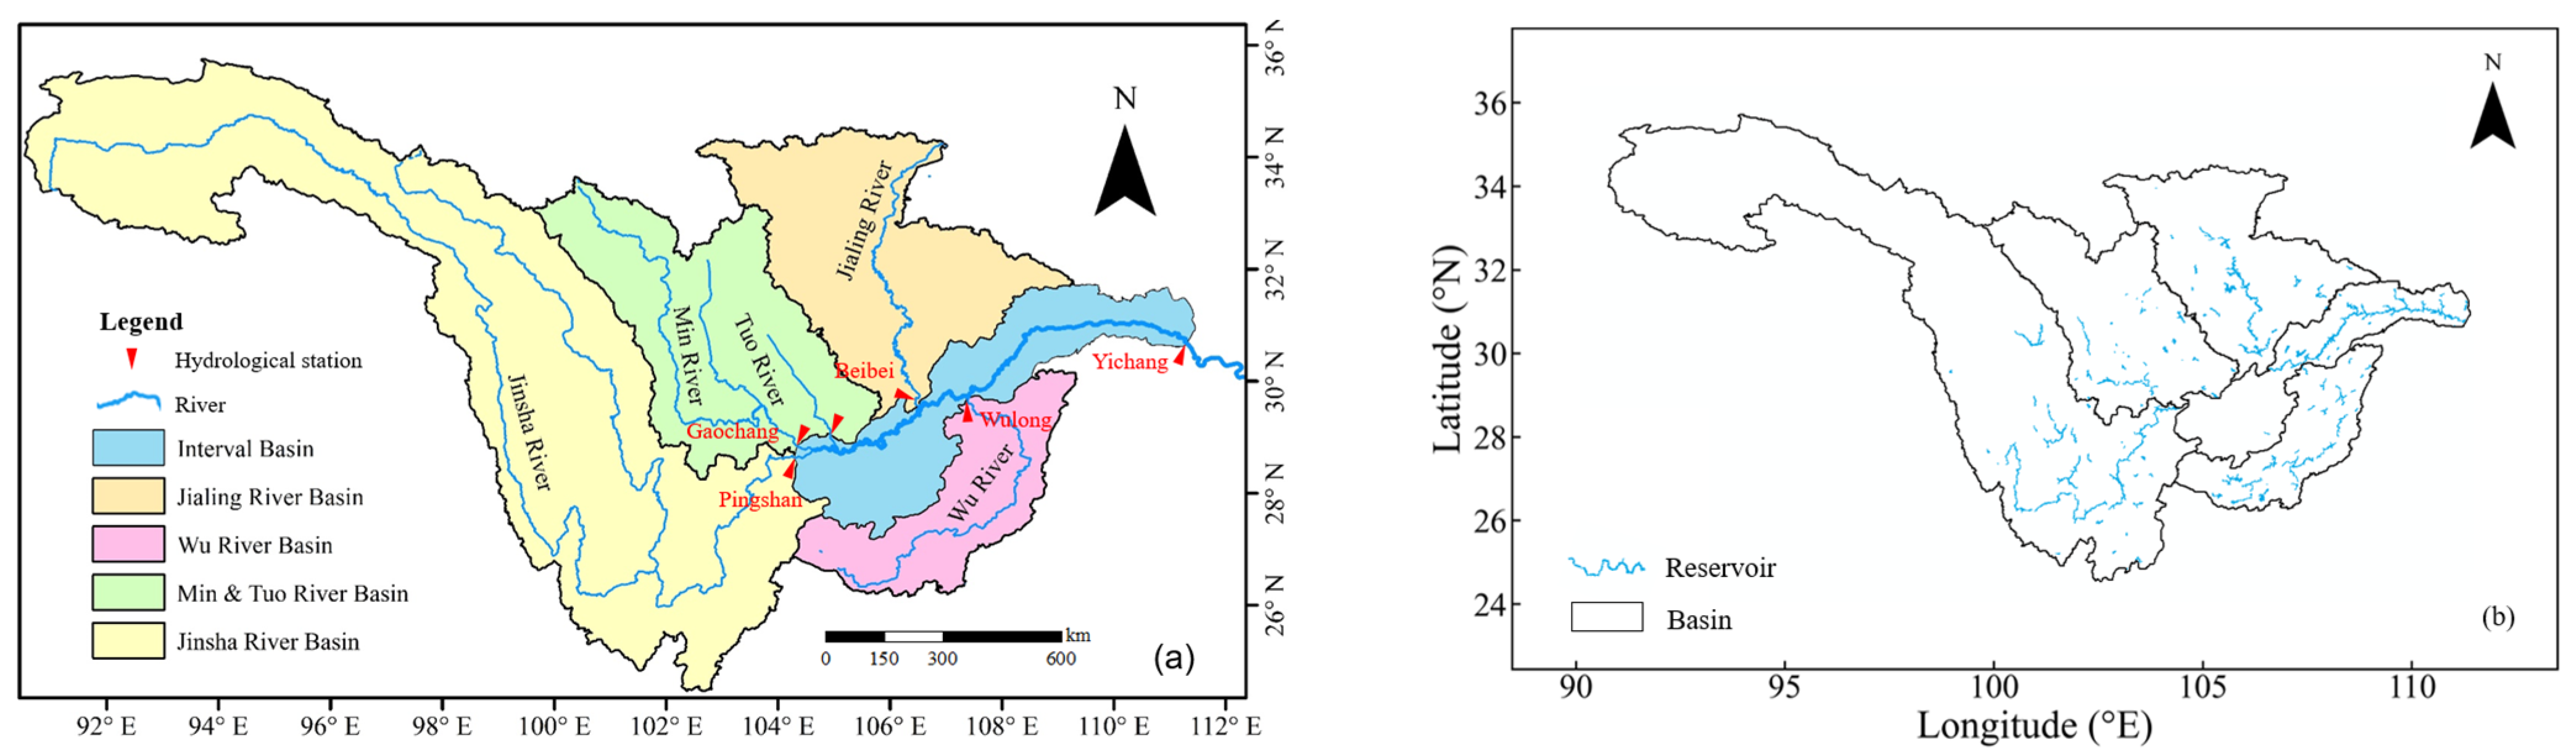
The upper Yangtze River, spanning from its headwaters at Gela Dandong Peak in Qinghai Province to Yichang City in Hubei Province, forms a critical segment of the Yangtze River system. Its main stem stretches approximately 4504 km and drains an area of around 1 million km2. The region exhibits pronounced topographic complexity, with marked elevation variations, clear vertical zonation, and strong spatial heterogeneity in environmental conditions. The basin receives 800~1200 mm of precipitation on annual average, with 70~90% falling between May and October. Spatially, precipitation decreases progressively from the southeast toward the northwest. Figure 1 illustrates the schematic map of the UYRB. The UYBR can be divided into five main sub-basins: the Jinsha River basin (JSRB), Ming and Tuo River basin (MTRB), Wu River basin (WRB), Jialing River basin (JLRB) and the interval basin (INRB). Characterized by abundant water resources and steep topographic gradients, the UYRB is full of potential for hydropower development. In the last few decades, numerous large-scale reservoirs and hydropower plants, including the Three Gorges Reservoir (TGR), have been constructed [29]. Using the reservoir dataset provided by Song et al. [30], the distribution of reservoirs in the upper Yangtze River is shown in Figure 1b. The construction and operation of these reservoirs have profoundly altered the hydrological regime and spatiotemporally distribution of runoff in the UYRB.
Figure 1.
Schematic map of (a) the upper Yangtze River basin and (b) the distribution of constructed reservoirs.
2.2. Data Resources
The observed daily runoff data of the Pingshan, Gaochang, Wulong, Beibei, and Yichang hydrologic stations from 1980 to 2022 were sourced from the Hydrological Bureau of the Yangtze River Commission. Meteorological data from 1980 to 2022, including precipitation and maximum and minimum air temperature, were obtained from the China Meteorological Data Center (https://data.cma.cn/ (accessed on 1 June 2022)). The LULC data of 1980, 2000 and 2020 were sourced from the Chinese Academy of Sciences Resource and Environment Data Center (https://www.resdc.cn/ (accessed on 3 July 2025)) with a resolution of 1km. The soil texture information was from the World Soil Database (https://gaez.fao.org/pages/hwsd (accessed on 1 June 2022)). The Digital Elevation Model (DEM) data was obtained from the SRTM DEM dataset, provided by the Geospatial Data Cloud of the Chinese Academy of Sciences (https://www.gscloud.cn/ (accessed on 23 May 2025)) with a resolution of 90 m. The potential evapotranspiration (PET) data were derived from GLEAM v3.7a (https://www.gleam.eu/ (accessed on 23 May 2025)), calculated by the Penman–Monteith equation, with a spatial resolution of 0.25° [31,32]. The leaf area index (LAI) was collected from GLOBMAP LAI (https://zenodo.org/records/4700264 (accessed on 5 March 2026)), spanning from 1981 to 2020, with a resolution of 0.072° [33]. Since the LAI data for 1981 only covers half a year, the data from 1982 to 2020 were used for analysis. The water intake quantity data from 2006 to 2024 were obtained from the Water Resources Bulletin of the Yangtze River basin (http://www.cjw.gov.cn/zwzc/zjgb/ (accessed on 20 May 2025)). The groundwater storage anomaly (GWSA) data were obtained from the National Tibetan Plateau Data Center (https://data.tpdc.ac.cn/home (accessed on 7 February 2026)). This dataset employed a Bayesian-based Three-Cornered Hat method to integrate GRACE products from multiple institutions, producing a product with minimized uncertainty, with a resolution of 0.5°. Additionally, a machine learning downscaling framework based on a physically constrained sliding window was applied to spatially and temporally fill the continuous missing monthly data (from July 2017 to May 2018) in the corresponding product [34]. The reservoir inventory data were sourced from the provincial water resources departments, comprising 153 reservoirs with recorded dead storage capacity and construction dates. Detailed information is listed in Appendix A.
2.3. Methods
2.3.1. SWAT Model Construction
The SWAT (Soil and Water Assessment Tool) model is a semi-distributed hydrological model developed by the Agricultural Research Service (ARS) of the United States Department of Agriculture (USDA) [35]. The SWAT model divides hydrological processes into two components: land surface processes and channel processes. Land surface processes primarily simulate precipitation–infiltration–runoff mechanisms and estimate material inputs at the channel inlet cross-section. The channel process primarily simulates channel runoff processes by solving the one-dimensional Saint-Venant equations, describing the transport patterns of substances within the channel.
The model uses DEM data to delineate sub-basins, which are further subdivided into Hydrological Response Units (HRUs) based on land use, soil type, and slope data [36]. The introduction of HRUs enables the integration of a broader range of spatial physical characteristics, thereby allowing for a more precise representation of hydrological processes, such as runoff generation, flow concentration, evapotranspiration and infiltration, under varying land use and soil type conditions [37]. The water balance equation is as follows:
where and represent the final and initial soil water content (mm), respectively; Pt is the total amount of precipitation during period t (mm); indicates the runoff depth during period t (mm); is the amount of actual evapotranspiration during period t (mm); represents the percolation from the bottom layer of the soil profile and the lateral during period t (mm); and denotes the return flow depth during period t (mm).
- (1)
- SWAT Model set up
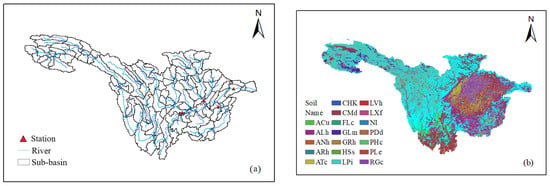
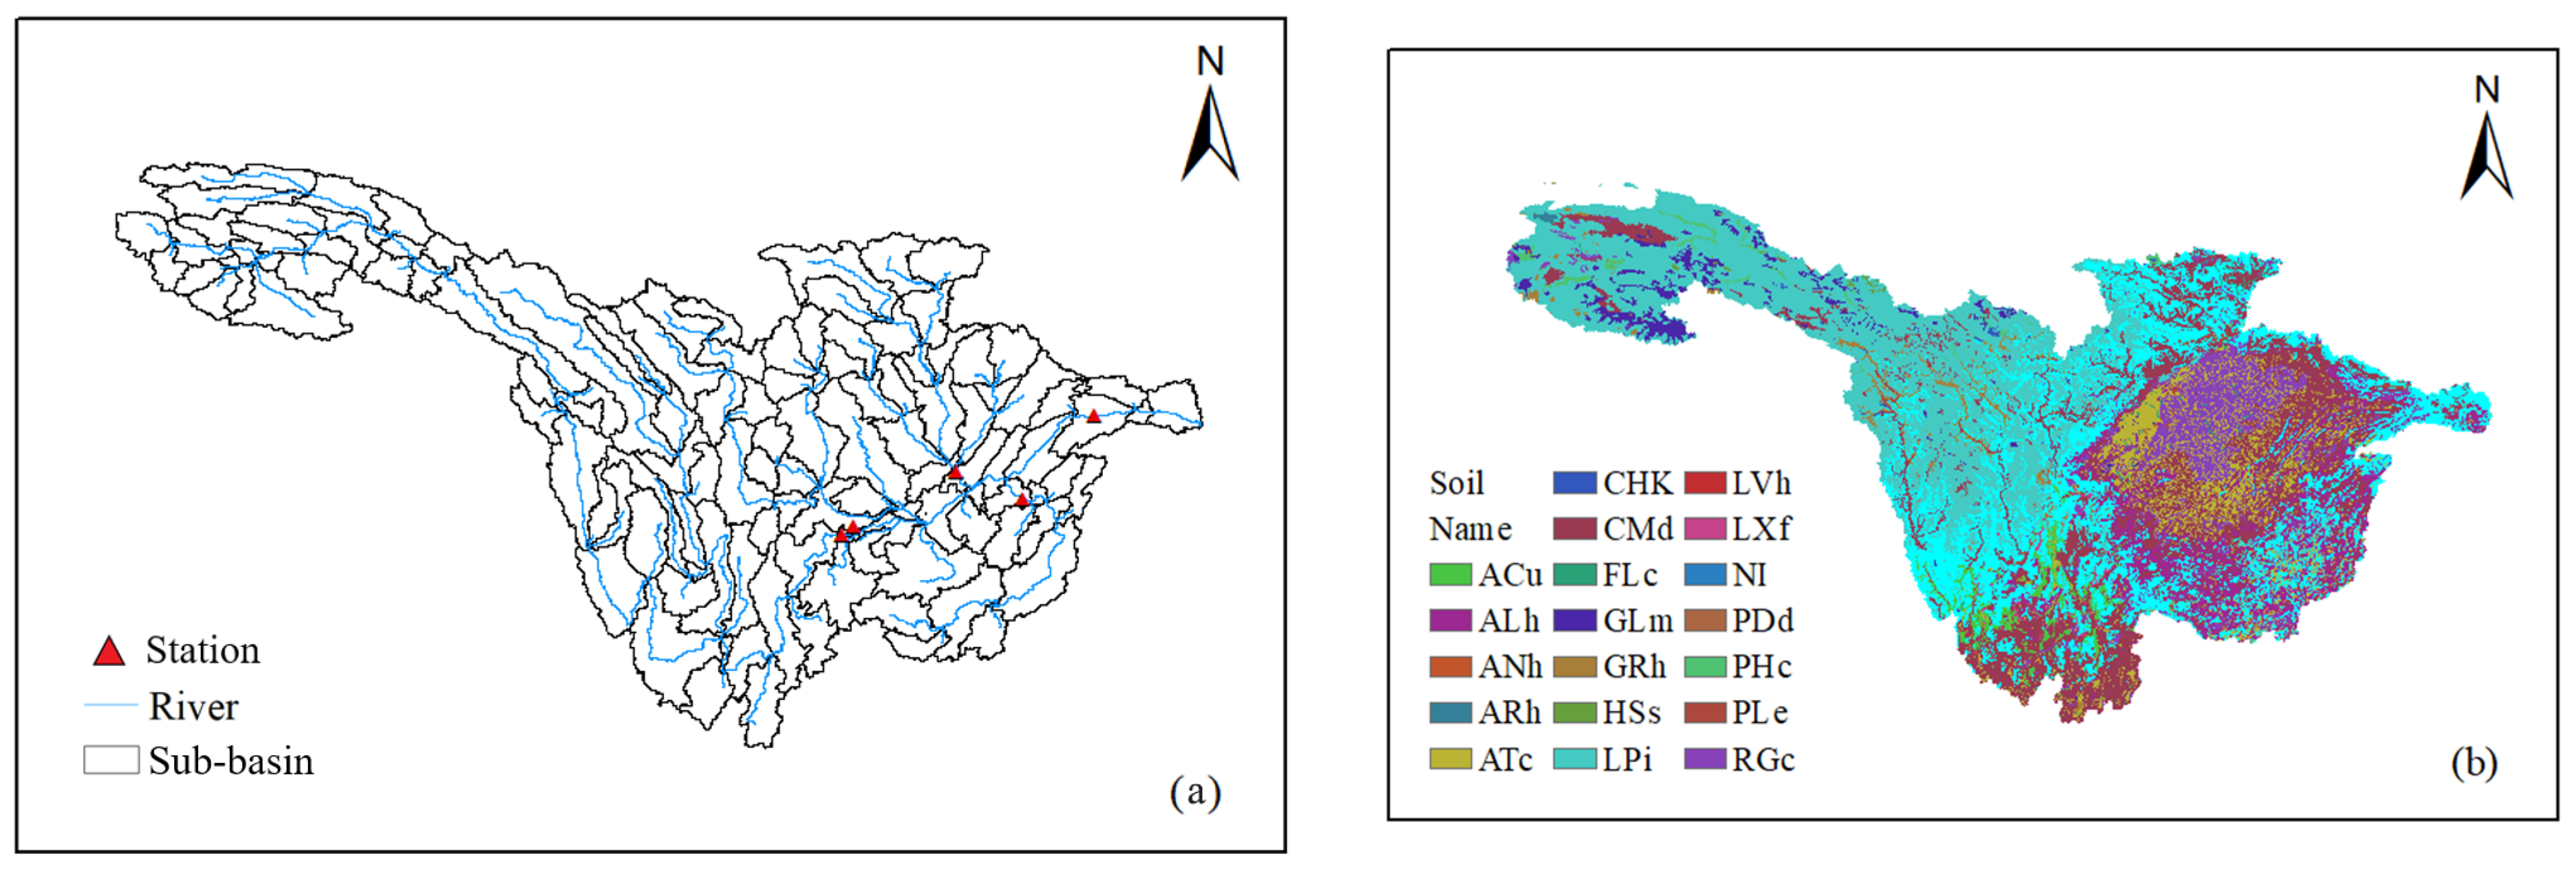
This study employed a 90 m DEM as the foundational input to delineate the main watershed into sub-basins. The DEM was imported into the QSAWT3 1.6.7 plugin within QGIS 3 software to initiate the SWAT model setup. Watershed boundaries and river networks were then extracted to identify secondary sub-basins. Using the Yichang station as the basin outlet, the process delineated a total of 128 secondary sub-basins (Figure 2a). Subsequently, to account for spatial heterogeneity in land surface characteristics, land use maps and soil type maps were integrated. By incorporating 19 soil classes (Figure 2b) and 6 land use types from a land use map of 1980, the model further subdivided each sub-basin into HRUs. The HRUs determine the evapotranspiration, interception, and runoff generation process in the watershed. The delineation applied area thresholds of 3% for soil and 4% for land use, which resulted in a total of 1324 HRUs. A level of spatial disaggregation better represents basin heterogeneity in soil and land cover, thereby improving the accuracy of hydrological simulations.
Figure 2.
The schematic diagrams of (a) the 128 delineated sub-basins and (b) the distribution of classified soil types in the UYRB.
There are 281 meteorological stations in the UYRB, and the nearest neighbor method was applied to assign meteorological data to each sub-basin based on the closest station to its centroid. The collected precipitation and temperature data were converted into model format and fed into the meteorological station module of the SWAT model. Because there were few large reservoirs in the basin prior to 2000 and the Grain-for-Green Program was initiated in 1999, the period from 1980 to 2000 was chosen as the baseline period. The period from 2001 to 2022 was defined as the impacted period, influenced by multiple human activities, including urban expansion, reservoir construction, and the Grain-for-Green Program. This program converted farmland into forest or grassland. Compared to crops, forest trees generally have deep roots and larger canopies. This land use change or greening trend impacts the rainfall interception and soil moisture, thereby increasing actual evapotranspiration and reduce surface runoff.
- (2)
- Parameter calibration
The SWAT-CUP 2012 software was used for parameter optimization. The UYRB exhibits considerable topographic and climatic heterogeneity, leading to distinct regional differences in hydrological responses. Therefore, the application of a zoned calibration approach is necessary for accurate runoff simulation. Hydrological processes such as evapotranspiration, surface runoff, groundwater, soil moisture, flow pathways, etc., were referenced from previous studies [38,39]. The following 22 parameters of the SWAT model listed in Table 1 were selected for calibration.
Table 1.
Selected 22 parameters of SWAT model for calibration.
An “upstream to downstream” calibration strategy was applied, and the model parameters were first calibrated using the observed runoff data at the Pingshan, Gaochang, Wulong, and Beibei hydrologic stations. Following the parameter optimization of these sub-basins, the measured runoff at the Yichang station was used to calibrate the parameters for the remaining sub-basins. The year of 1980 was used as the model warm-up phase, while the periods of 1981–1995 and 1996–2000 were used for the model calibration and validation, respectively.
- (3)
- Model evaluation
The model performance was evaluated using the Nash–Sutcliffe efficiency (NSE) coefficient, correlation coefficient (r), relative error (RE), and Root Mean Square Error (RMSE). The evaluation metrics formulas are as follows [40,41]:
where and are the simulated and observed runoff, respectively. is the mean of simulated runoff. and are the variance of simulated and observed runoff series.
The P-factor is defined as the proportion of observations falling within the 95% predicted uncertainty range, while the R-factor is defined as the average width of the 95% predicted uncertainty range divided by the standard deviation of observations. These two factors are also calculated during the calibration and validation periods for uncertainty analysis of model performance. The higher the P-factor and the lower the R-factor are, the smaller the model uncertainty is.
2.3.2. Separating the Contributions of Meteorological Factors and Human Activities to Runoff Changes
The “simulation and comparison” method was used to separate the impacted runoff due to individual factors. The baseline simulation was conducted using climate data from 1980–2000 and land use data from 1980. The hydrological model was first calibrated against the baseline data series. The calibrated parameters were then applied to simulate runoff during the impacted period, using altered hydroclimatic inputs while keeping the land use map unchanged. The difference in the simulated runoff between the baseline and impacted periods is attributed to climate change, whereas the difference between the observed runoff and the simulated runoff during the impacted period is attributed to human activities. The runoff variations due to climate change and human activities are calculated by the following formulas:
where is simulated runoff in the baseline period, , are the observed and simulated runoff in the impacted period, and and are runoff variations due to climate change and human activities, respectively.
Therefore, the contribution rate of climate change () and human activities () are calculated by following equations:
The sign of the contribution rate indicates the direction of the influence: positive or negative values represent an enhancing or reducing effect. The absolute value serves as a measure of the impact intensity.
2.3.3. Land Use Transfer Matrix
The land use transfer matrix quantitatively characterizes of land use type from T1 to T2 [42], and the expression is given by the following:
where Li,j represents the area converted from land type i in T1 to land type j in T2; n refers to the number of land use types that have undergone conversion.
2.3.4. Destination of Runoff Reduction
Since the Western Route of the South–North Water Transfer Project has not yet been completed, currently there are no large-scale inter-basin water transfer projects in the UYRB. Based on the principle of the water balance equation, runoff can be expressed as the difference between precipitation and evapotranspiration, minus water storage variation in a close basin, i.e.,
where P, ATE and R represent precipitation, actual evapotranspiration and runoff, respectively; is water storage variation in a closed basin.
As for UYRB in Equation (10), the precipitation and runoff are observed from meteorological and hydrologic stations, while the actual evapotranspiration and water storage are estimated. The actual evapotranspiration is a function of potential evapotranspiration and available water in the land surface. Forest and cropland generally have relatively high AET values, while bare land has a low AET value [43,44]. Vegetation canopy coverage also directly influences the process of actual evapotranspiration [45]. Additionally, the water consumed by human daily life and agriculture and industry production is a critical factor for water resource management. Reservoir construction and impoundment will raise the surface water level and increase the water head to promote infiltration and groundwater recharge [46]. The initial impoundment of dead storage has rarely been considered in previous studies. Hence, the quantity of actual evapotranspiration, water abstraction and use, reservoir dead storage and GWSA variations are estimated to provide insights in possible pathways of runoff reduction.
Shifts in land use composition and vegetation cover within the basin have altered evapotranspiration processes [47]. The total actual evapotranspiration () change is estimated by the following:
where and are the potential evapotranspiration and area of land use type i in the impacted period; and are the potential evapotranspiration and area of land use type i in the baseline period; and represents the ratio of actual evapotranspiration to potential evapotranspiration for land use type i. The crop coefficient in agriculture is a key parameter that indicates the ratio of actual crop water requirement to reference evapotranspiration, exhibiting dynamic changes throughout the crop growth cycle. This study focuses on the impact of land use changes on evapotranspiration and adopts a similar concept to estimate actual evapotranspiration.
A portion of the abstracted water is consumed in production and daily life through evaporation, while another portion of water returns to the river. Therefore, the actual water consumption is estimated by the following equation:
where j represents a specific sector, such as agriculture, industry, domestic use, etc.; denotes the increase of water intake quantity for sector j; and Kj is the coefficients of return water for sector j.
The dead storage capacity and GWSA variations are estimated directedly from reservoir storage data and remote sensing data, respectively.
3. Results
3.1. Trend Analysis of Hydroclimate Variables
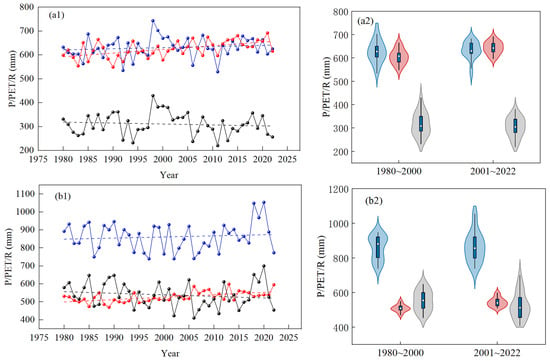
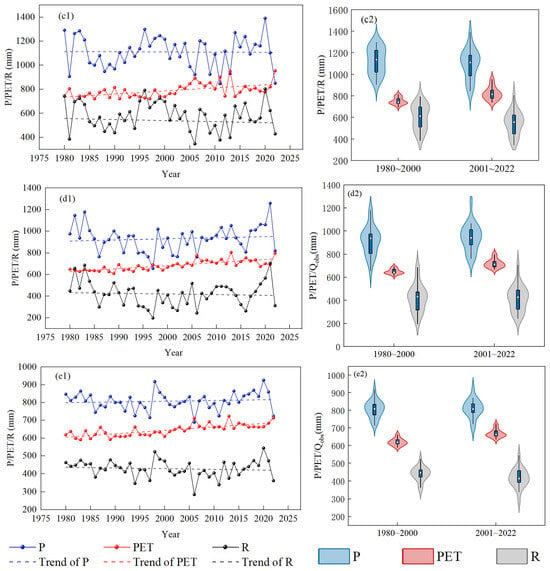
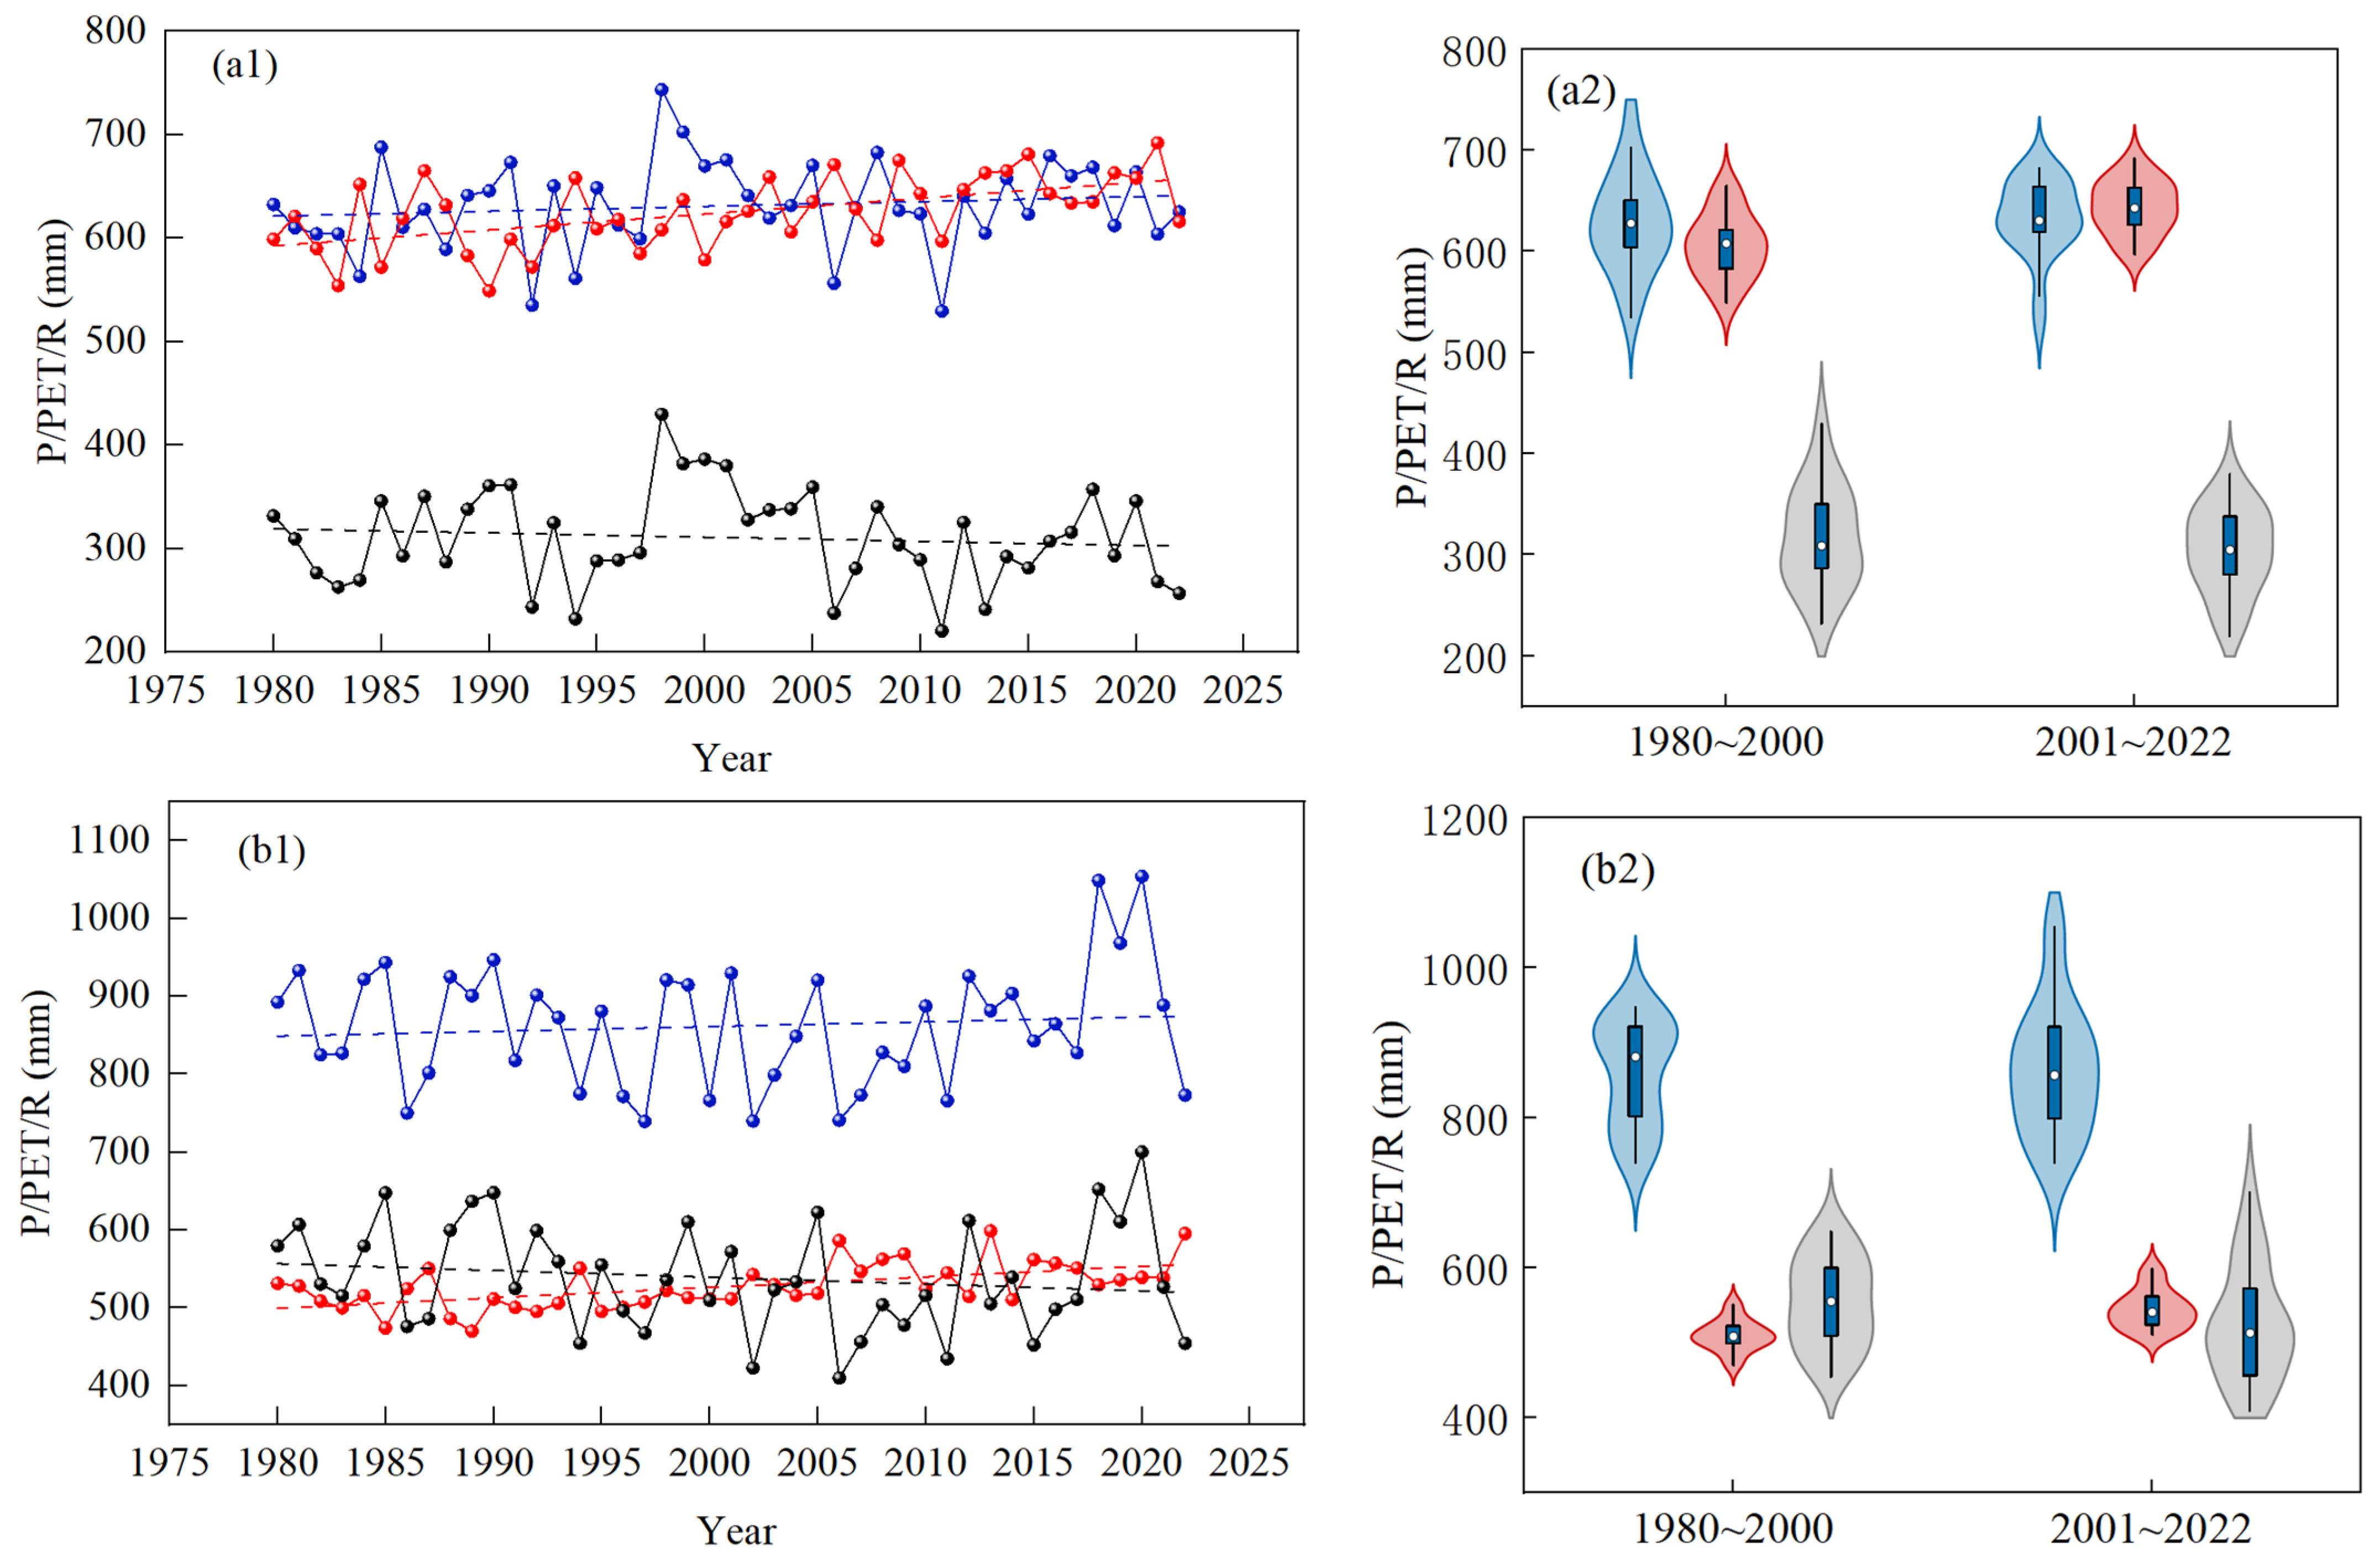
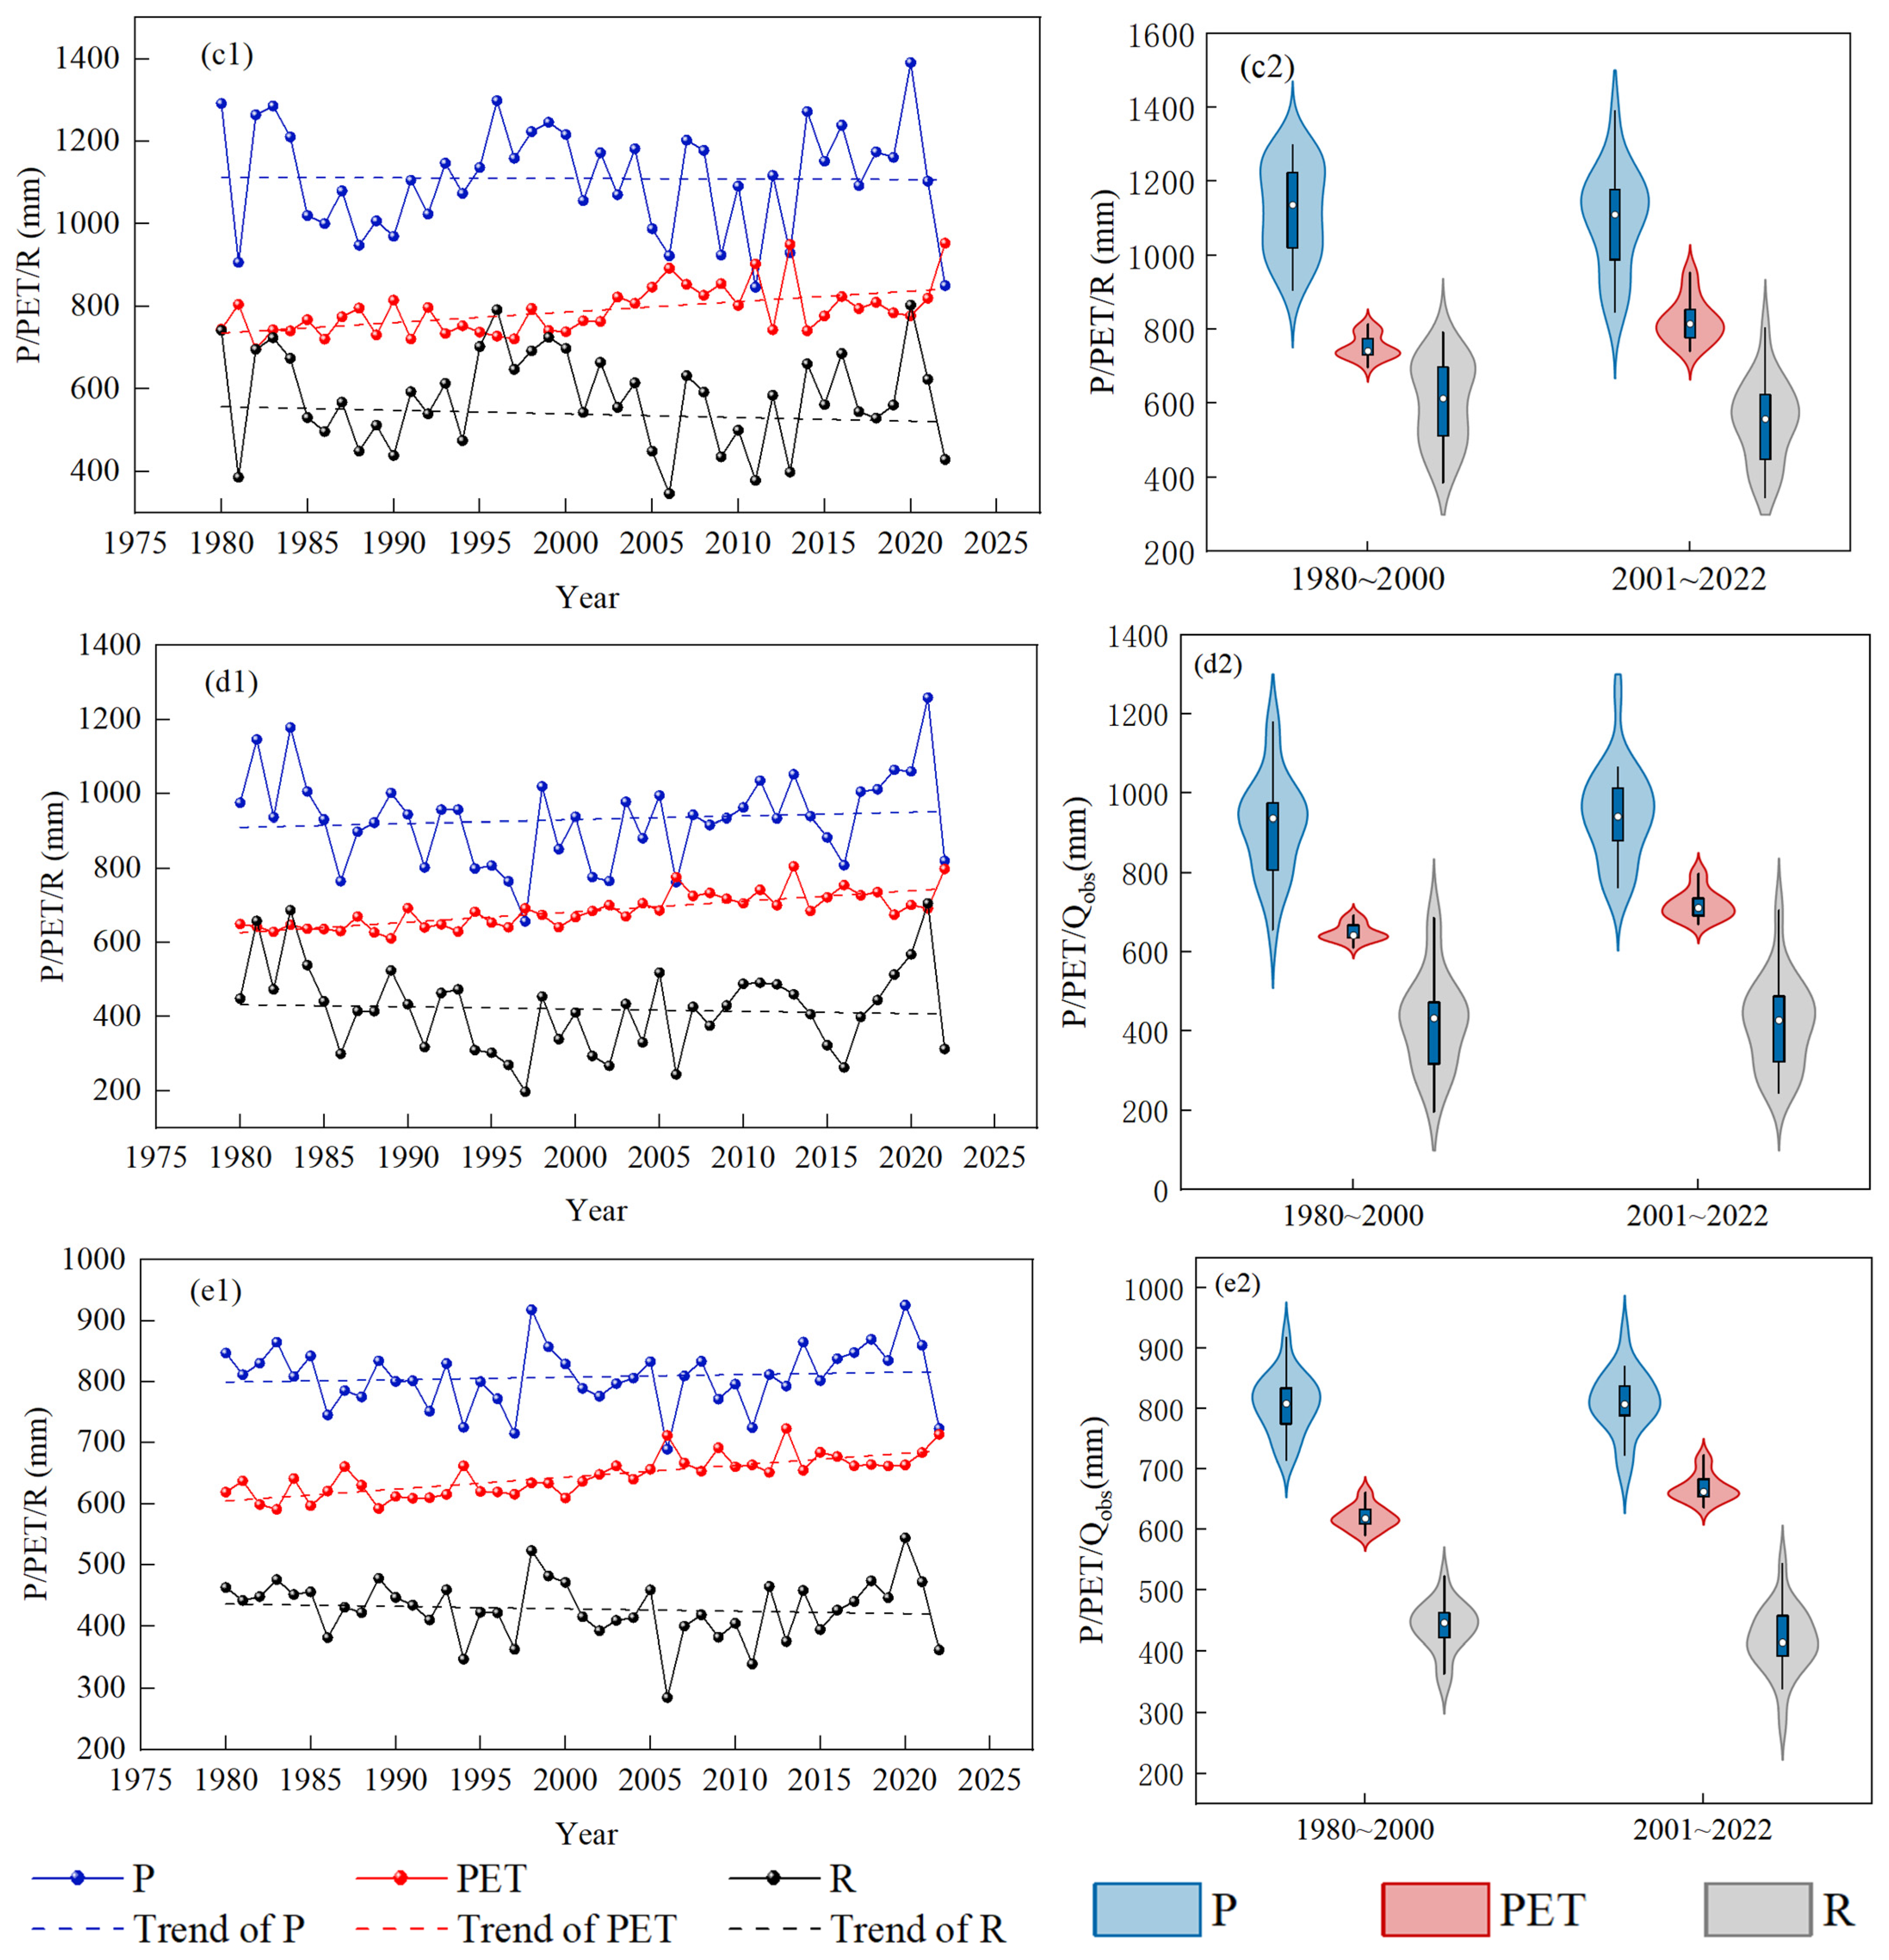
Linear regression was used to identify trends in the variables. Figure 3 shows the temporal trends of precipitation (P), potential evapotranspiration (PET), and observed runoff depth (R), along with violin plots of their distributions at five stations (a–e) from 1980 to 2022. A clear declining trend in runoff is observed across all the stations. Interestingly, the annual precipitation shows a slight increasing trend, likely associated with an intensified East Asian monsoon circulation and a northward shift of the rain belt under global warming. Concurrently, PET also exhibits a significant upward trend, driven primarily by rising temperatures due to climate warming. Figure 3(a2–e2) show the violin map of corresponding distributions of P, PET and R before and after 2000. A violin plot efficiently communicates data distribution through several key visual components. The central dot within the plot represents the median (50th percentile). The thicker box surrounding the median corresponds to the interquartile range (IQR), bounded by the first quartile (Q1) and the third quartile (Q3). The width of the violin shape at any given point reflects the density of the data—broader sections indicate a higher concentration of values, while narrower sections correspond to sparser regions. Further analysis comparing the pre- and post-2000 periods indicates that the median precipitation and PET increased after 2000, whereas the median runoff depth decreased. In addition to these shifts in median value, the distributional characteristics of precipitation and PET are also changed markedly, showing broader ranges and greater dispersion, which point to enhanced hydrological variability. With the exception of Pingshan station, the annual runoff also displayed a wider distribution after 2000. Additionally, the distribution of precipitation and PET exhibited a pronounced rightward skew after 2000, indicating a higher frequency of years with above-average values. In contrast, the runoff distribution showed a leftward shift at most stations, suggesting more frequent low-flow conditions. The occurrence of extreme values also intensified after 2000. The annual maxima of precipitation and PET increased, while their minima decreased, further reinforcing the pattern of enhanced hydrological extremes. These patterns reflect growing uncertainties in extreme hydrological behavior, attributable to the combined influence of climate warming and human activities.
Figure 3.
Temporal trends (left column, suffix “1”) and violin distribution plots (right column, suffix “2”) of precipitation (P), potential evapotranspiration (PET), and observed runoff depth (R) at five hydrological stations from 1980 to 2022: (a1,a2) Pingshan, (b1,b2) Gaochang, (c1,c2) Wulong, (d1,d2) Beibei, (e1,e2) Yichang. For each station, suffix “1” indicates temporal trends of P, PET, and R, while suffix “2” indicates the corresponding violin distribution plots.
Table 2 lists the changes in annual average precipitation (P), potential evapotranspiration (PET), and observed runoff depth (R) or runoff volume (Qobs) at the Yichang station before and after the year 2000. The annual average precipitation from 1980 to 2000 was 807.1 mm, while from 2001 to 2022, it was 809.0 mm, an increase of 1.9 mm. The annual average PET before 2000 was 620.5 mm and increased to 669.7 mm after 2000, an increase of 49.2 mm. The annual average runoff depth decreased from 440.3 mm (before 2000) to 420.8 mm (after 2000), a reduction of 22.5 mm. The annual average runoff volume at the Yichang station decreased by 22.3 billion m3, with a decrease rate of 5.07%. In terms of extreme values, the annual maxima of precipitation, runoff depth, and runoff volume after 2000 increased by 7.6 mm, 21 mm, and 20.97 billion m3, respectively. The annual minima after 2000 decreased by 26.3 mm, 62.6 mm, and 62.61 billion m3, respectively. Both the annual maximum and minimum of potential evapotranspiration increased by 61.14 mm and 45.90 mm, respectively.
Table 2.
Characteristic values of annual hydrometeorological variable before and after 2000 in the UYRB.
3.2. The LULC Evolutions and LAI Variations
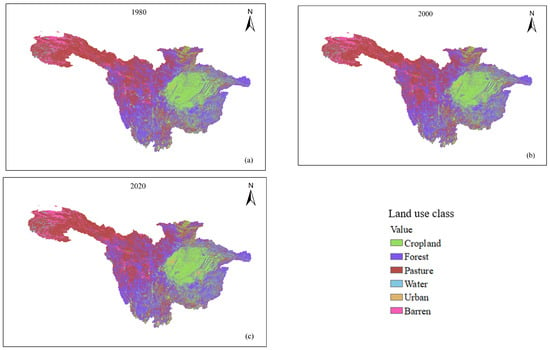
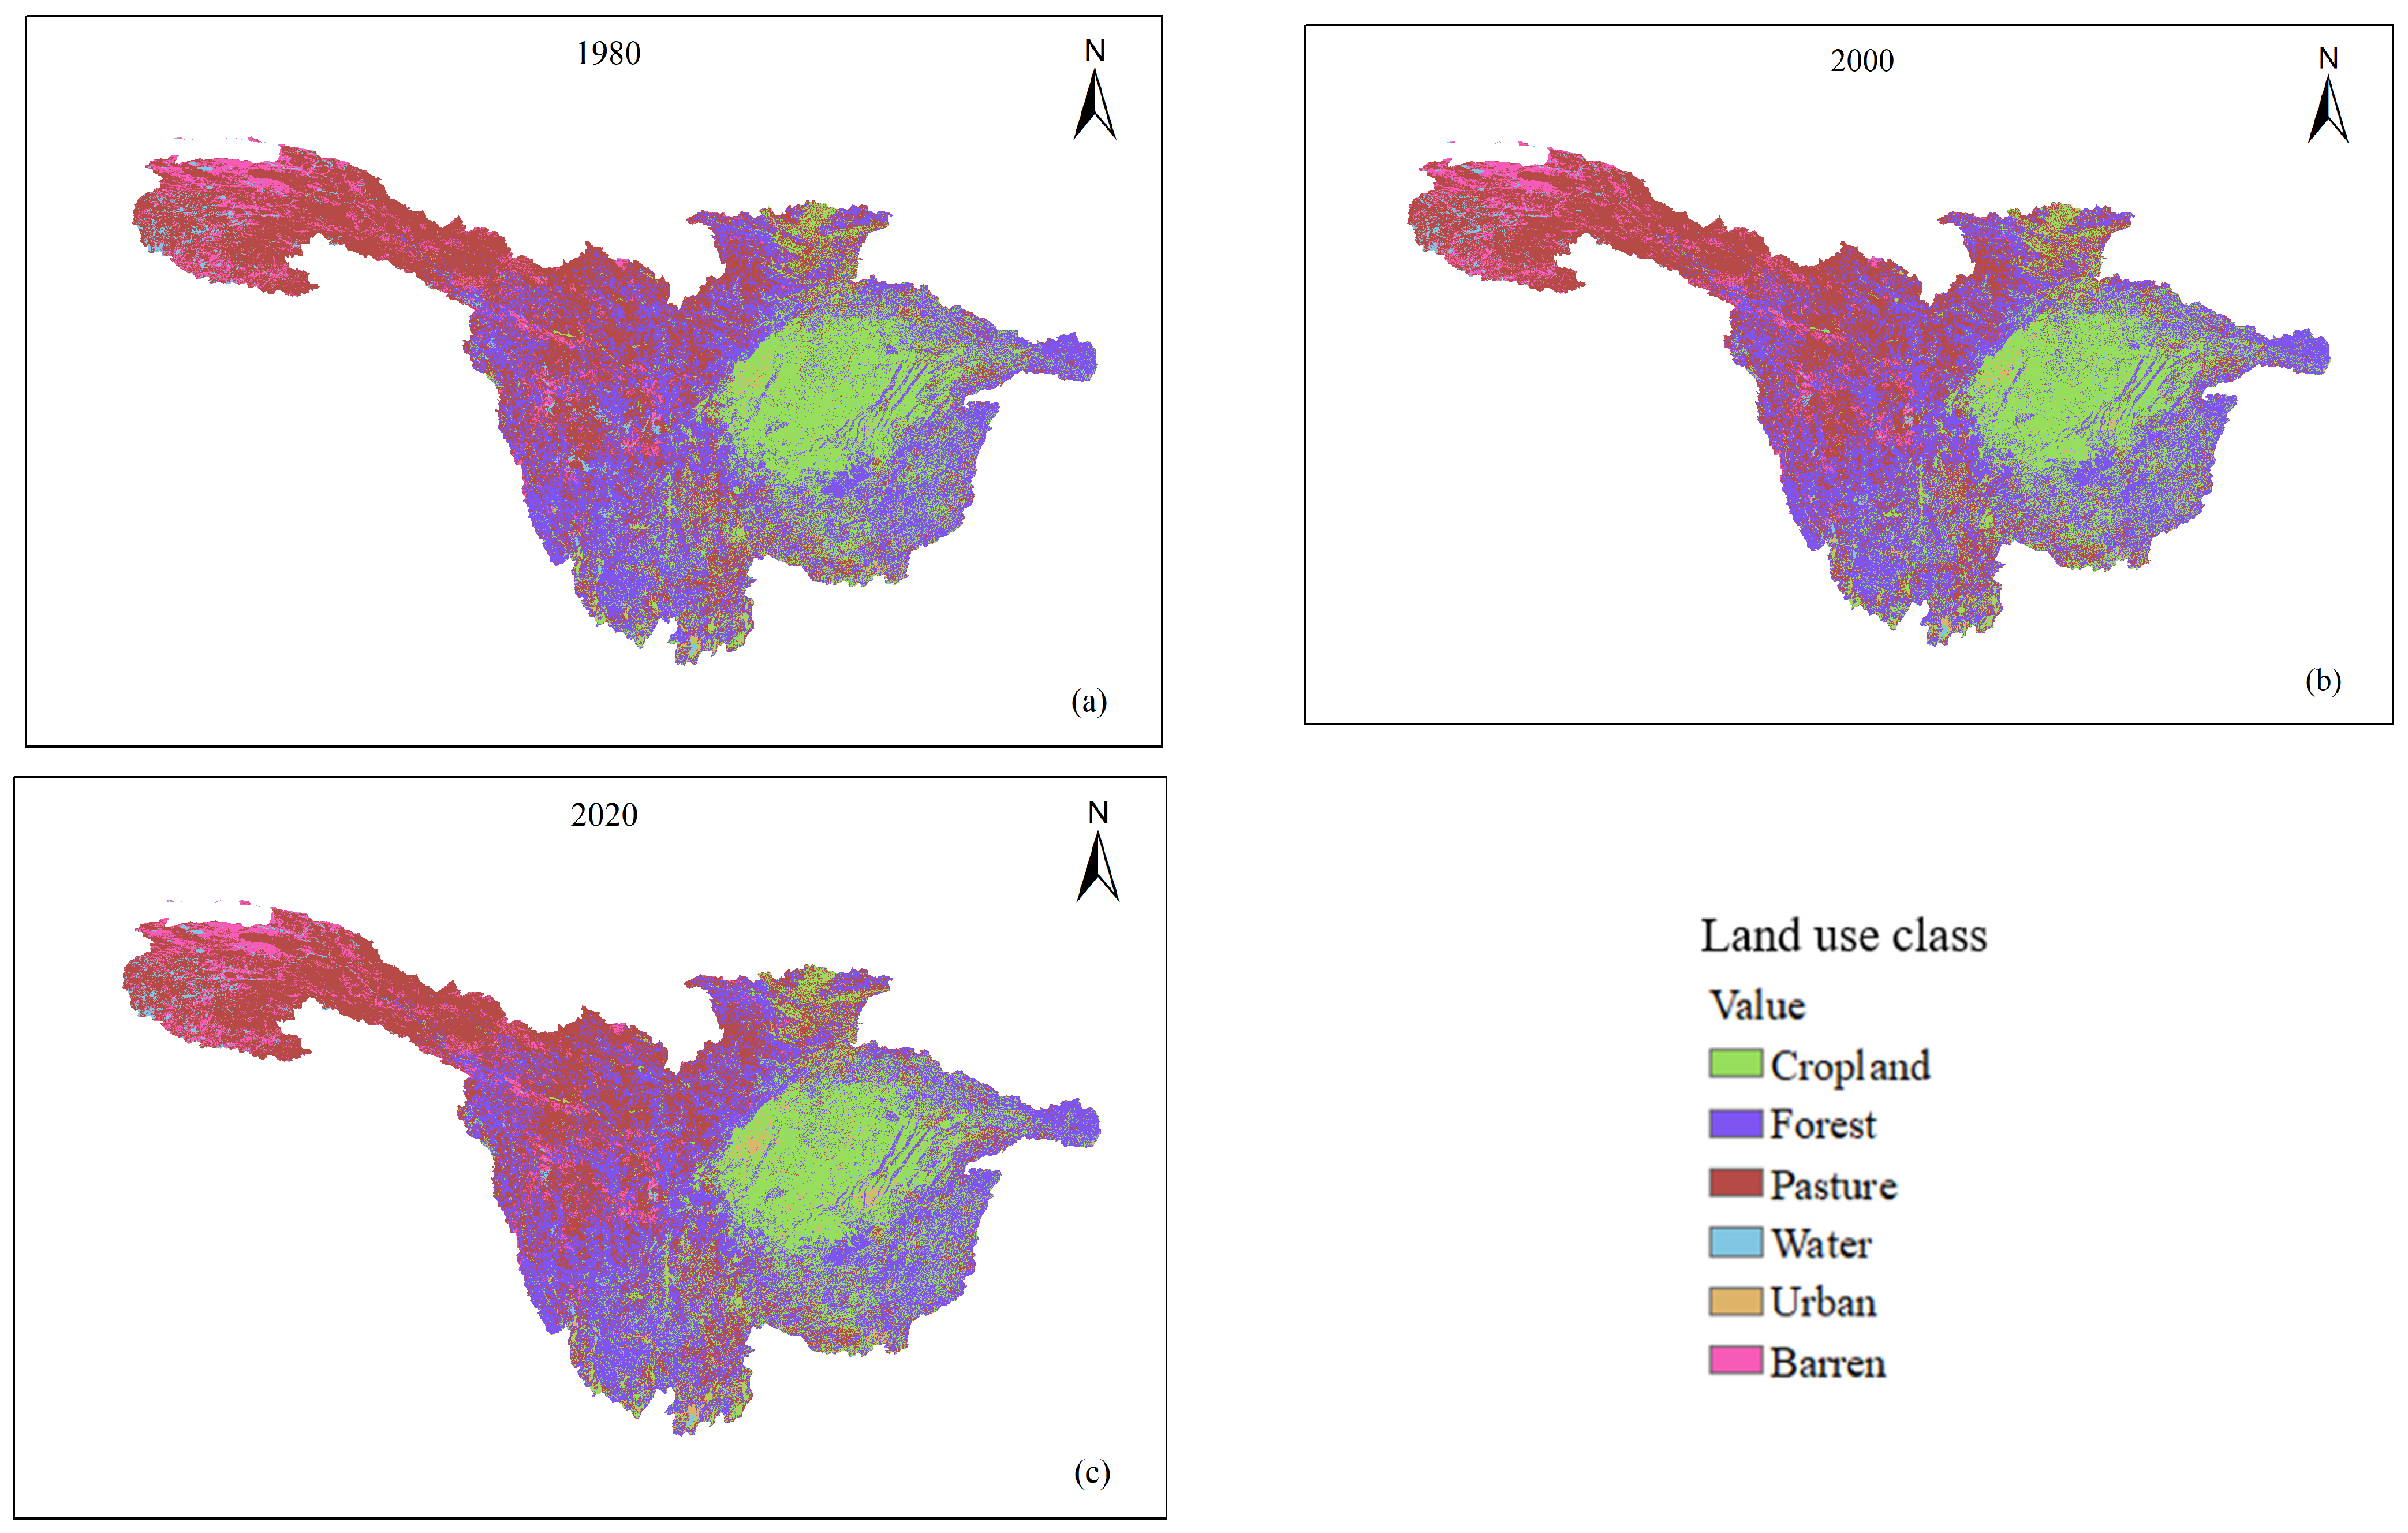
The land use map is reclassified into six categories: cropland, forest land, pasture land, water body, urban area, and barren land. The spatial distribution of LULC in 1980, 2000 and 2020 is shown in Figure 4. Cropland, forest, and pasture land constituted the dominant land use types within the UYRB. It is clear that some cropland areas have changed into urban areas, especially in the central and eastern parts of the basin from 1980 to 2020. Table 3 and Table 4 summarize the land use transition matrix between 1980 and 2000 and 2000 and 2020, respectively. The total area of cropland decreased from 221,078 km2 in 1980 to 22,061 km2 in 2000, a net reduction of 1017 km2. The primary conversions were from cropland to urban (1126 km2), with an increase of 17.56%. The forest land area also decreased from 348,534 km2 to 347,315 km2, mainly converted into pasture and cropland areas. In the baseline period, urbanization and grassland expansion are the primary LULC development trends. From 2000 to 2020 (Table 4), the cropland area shrank significantly from 220,061 km2 in 2000 to 214,280 km2 in 2020, mainly converted into forest and urban land, which demonstrates the effectiveness of Chinese ecological conservation policies. The area of forest increased from 347,315 km2 to 348,127 km2, primarily due to conversions from cropland land (2008 km2) and water pasture (2050 km2). Urban areas exhibited the most rapid expansion, growing from 8073 km2 to 13,004 km2, with an increase of 2389 km2 or 61.08%. This indicates the accelerated pace of urbanization in the UYRB after entering the 21st century. This urbanization was largely driven by the conversion of cropland (1126 km2), demonstrating the ongoing encroachment of urbanization on surrounding farmland. The area of barren land increased slightly, mainly sourced from water bodies (1273 km2) and pasture (201 km2), suggesting potential land degradation or aridification trends.
Figure 4.
The spatial distribution of LULC in (a) 1980, (b) 2000 and (c) 2020 in the UYRB.
Table 3.
Land use transition matrix between 1980 and 2000 in the UYRB (km2).
Table 4.
Land use transition matrix between 2000 and 2000 in the UYRB (km2).
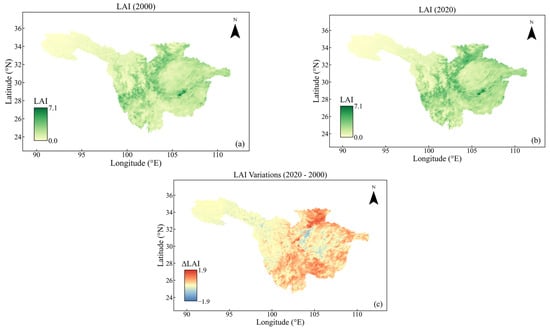
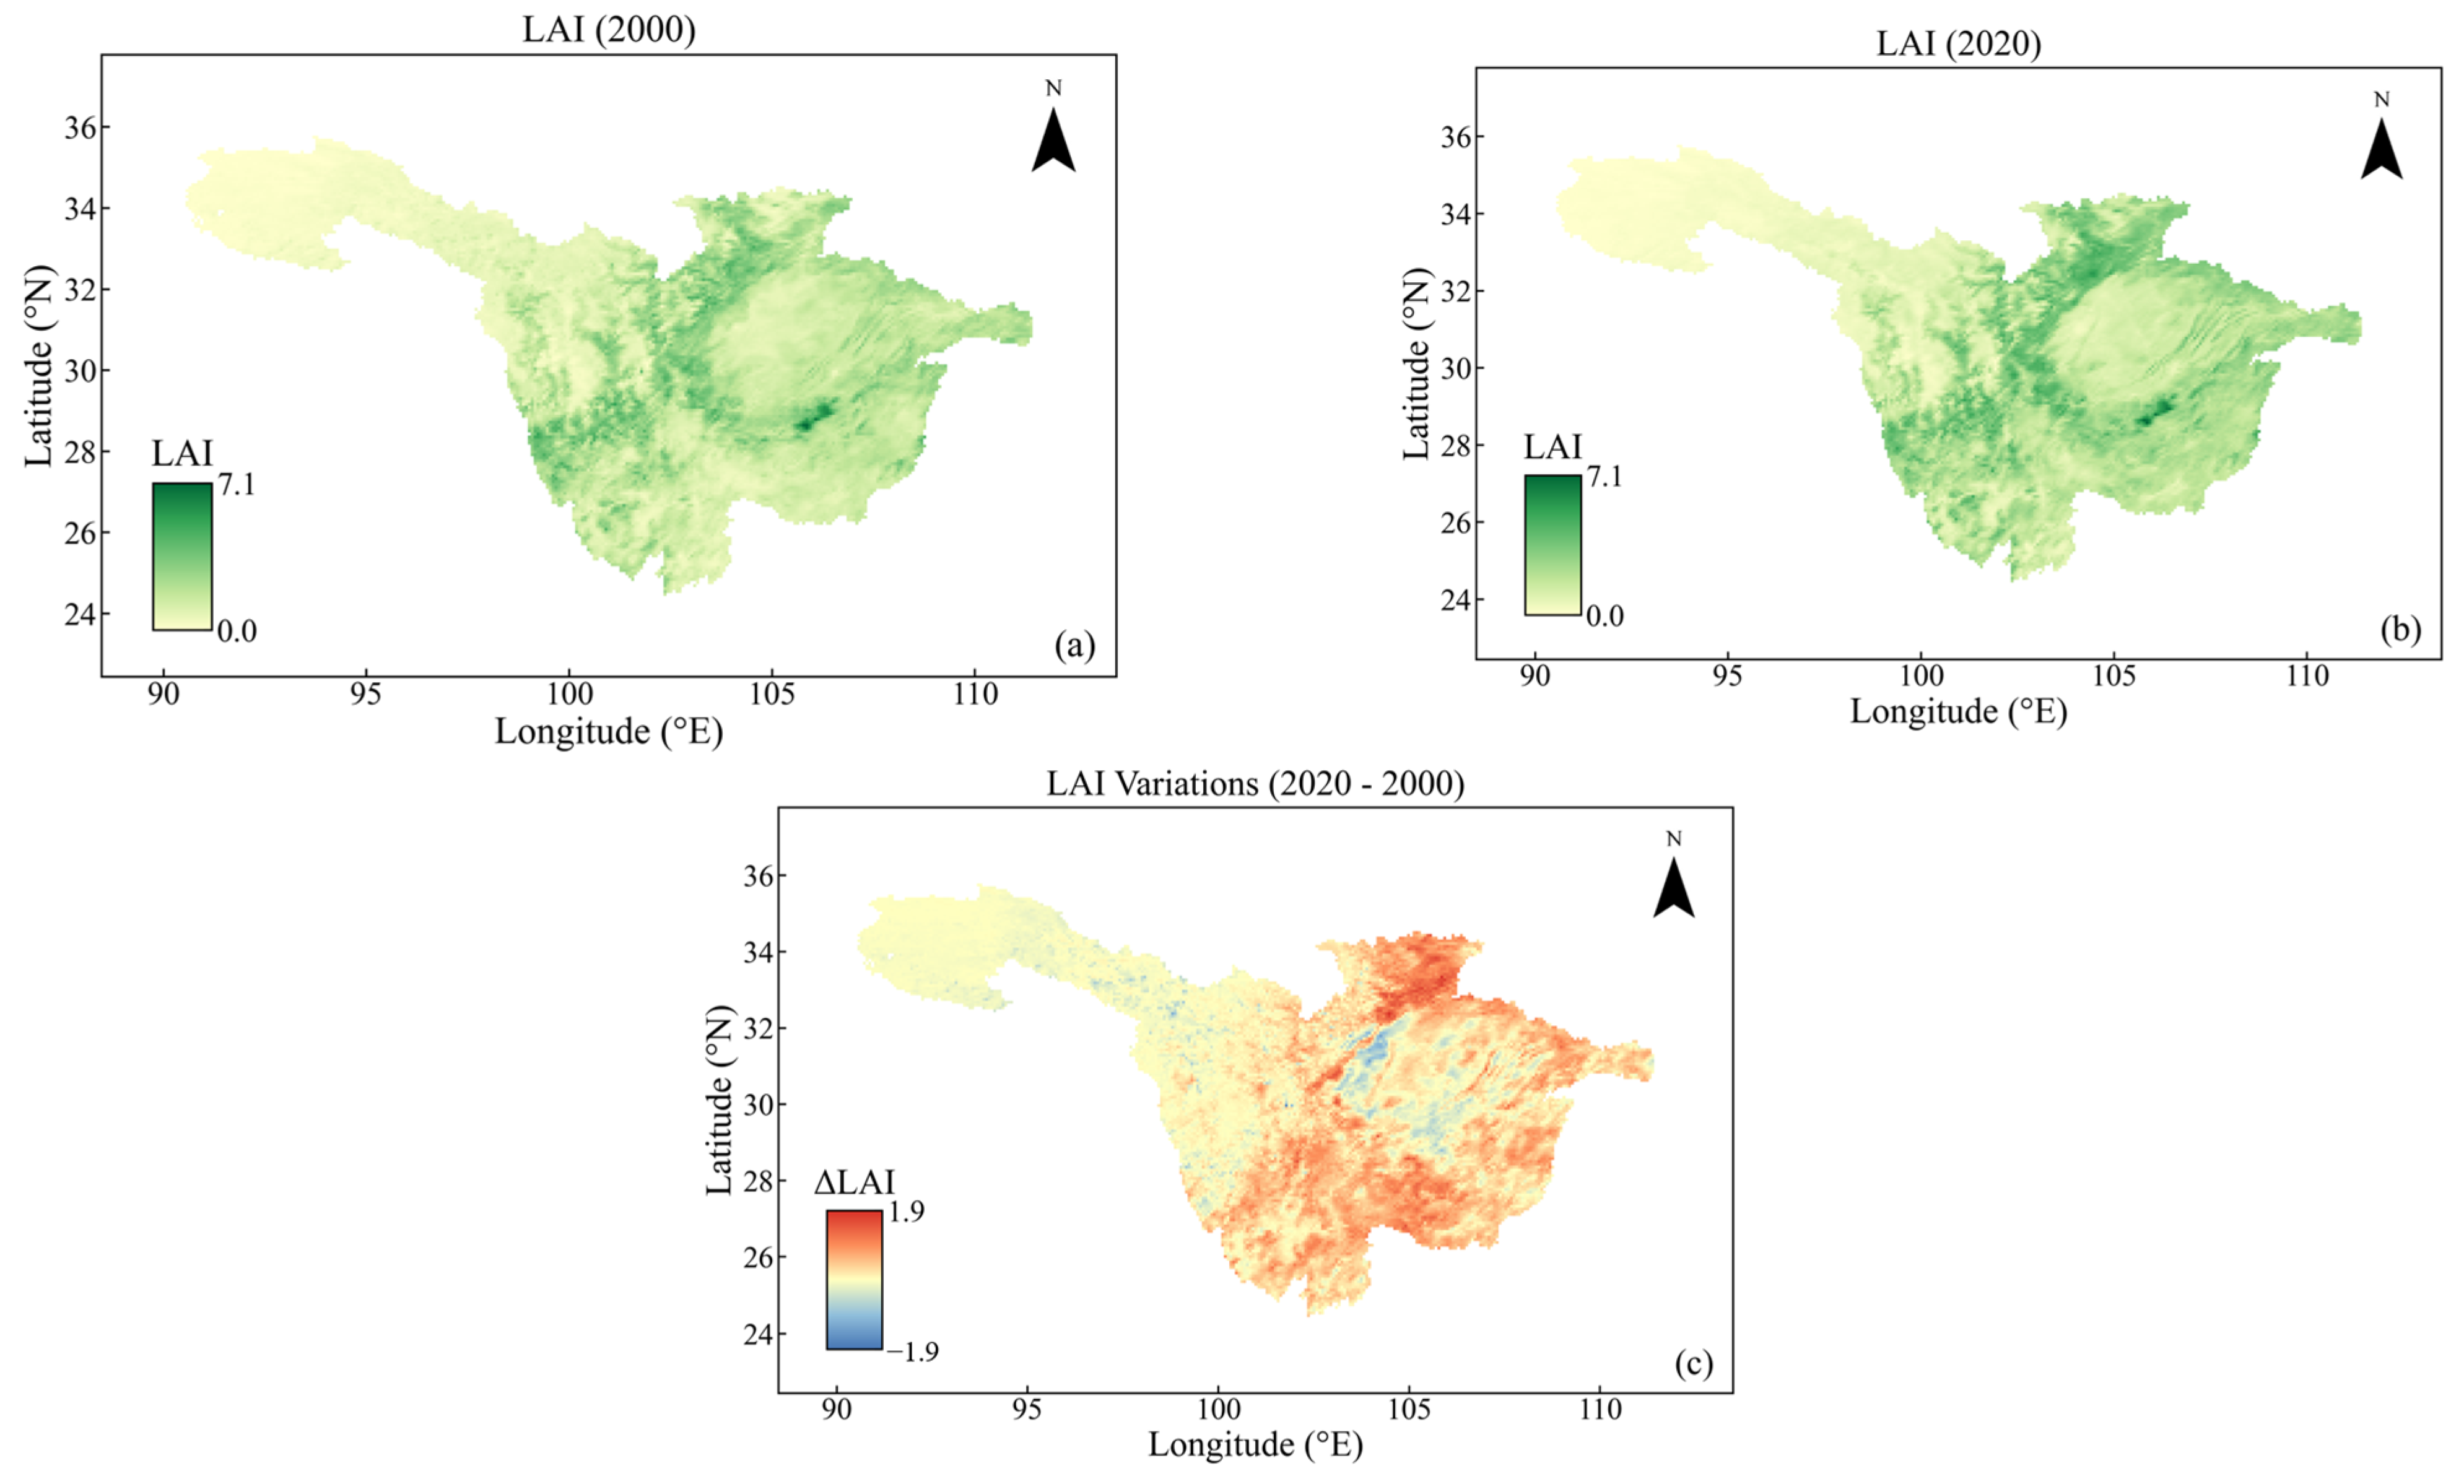
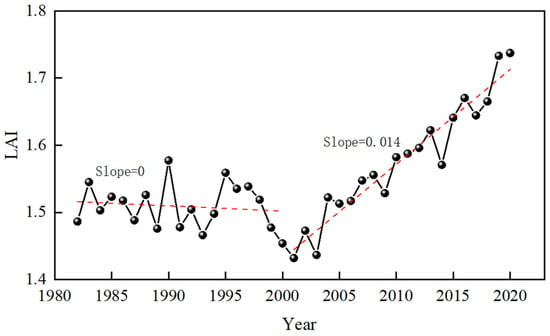
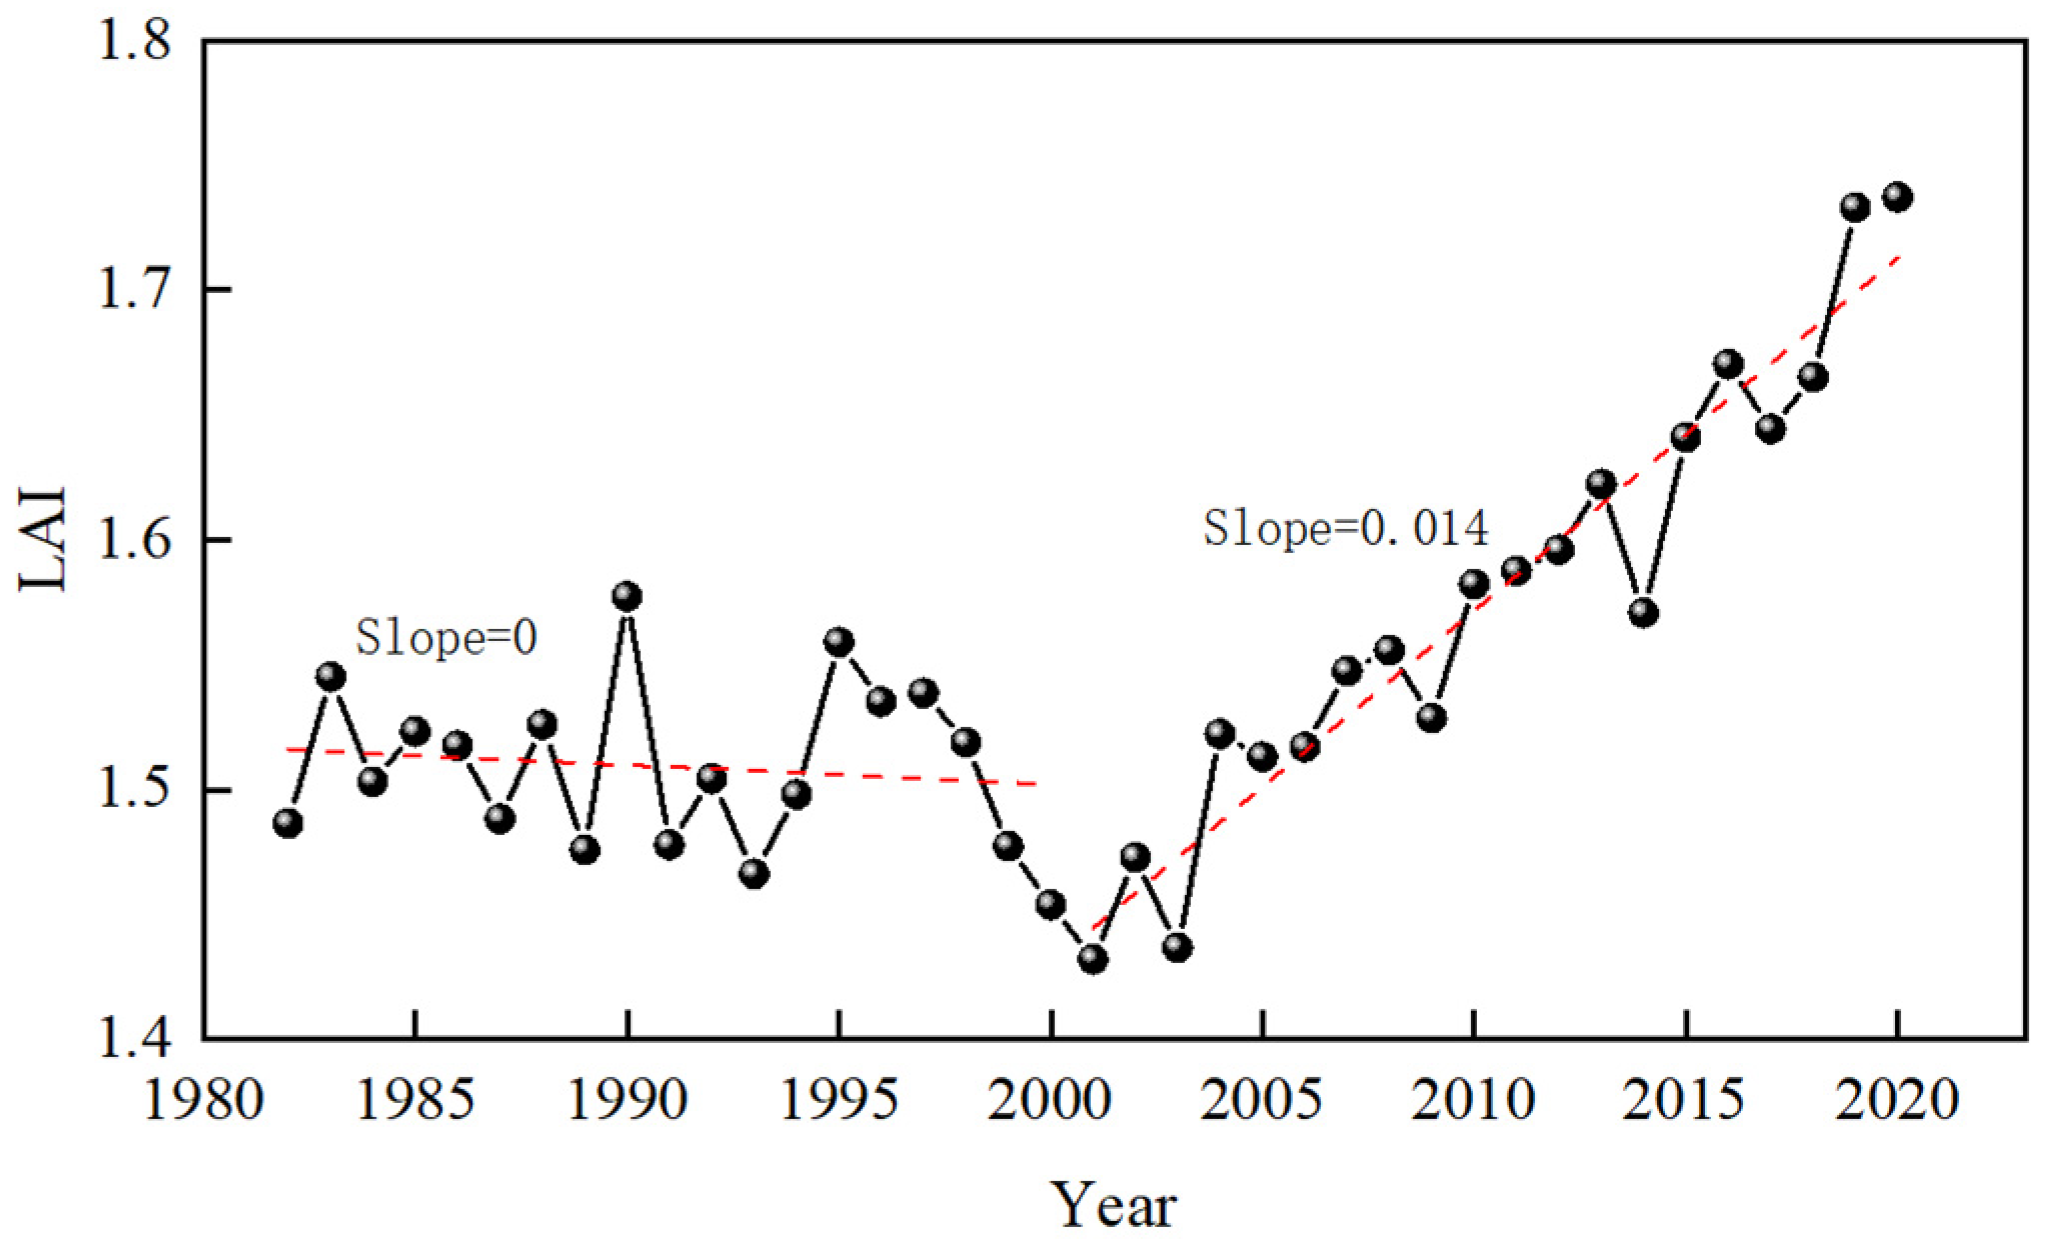
Figure 5 displays the distribution maps of LAI in 2000 and 2020 in the UYRB, which obviously show that the LAI increased across the basin, except for the headwaters of the Yangtze River basin. Figure 6 illustrates the temporal trend of basin-averaged LAI values from 1982 to 2020. The LAI exhibited no trend from 1982 to 2000 (slope = 0), followed by a fluctuating upward trend from 2001 to 2020 (slope = 0.014), indicating an overall greening trend across the basin. This phenomenon arises from the combined influences of climate warming and anthropogenic interventions. From an anthropogenic perspective, large-scale ecological restoration initiatives, such as the Grain-for-Green Program and afforestation projects, have directly promoted forest expansion and vegetation recovery. Additionally, changes in agricultural practices, including cropland management and irrigation, further modulate vegetation dynamics and contribute to the observed LAI increases. This may be attributable to climatic factors. Rising global atmospheric CO2 concentrations exert a pronounced “fertilization effect” that enhances photosynthetic efficiency, thereby stimulating vegetation growth [48]. Concurrently, elevated temperatures and altered precipitation regimes further create favorable conditions for plant development and canopy expansion.
Figure 5.
The distribution maps of leaf area index (LAI) in (a) 2000 and (b) 2020 and (c) the variations in the UYRB.
Figure 6.
Temporal trend of average LAI from 1982 to 2020 in the UYRB. Solid line with dots: annual LAI values. Red dashed line: linear trend.
3.3. SWAT Model Calibration and Evaluation
- (1)
- Model Evaluation
As mentioned in Section 3.1, there are 22 parameters of the SWAT model chosen for calibration [49,50]. Table 5 lists the calibrated parameters of the SWAT model in the baseline period (1980–2000). These parameters exhibit distinct regional heterogeneity; for instance, the maximum canopy storage capacity (CAMNX) is larger at the Pingshan and Gaochang stations, whereas the threshold water depth in the shallow aquifer (GWQMN) is largest at the Wulong hydrologic station. The curve number (CN2) is a key parameter in the SCS curve number method, which reflects the underlying surface runoff yield capacity of the watershed [51]. The larger the CN2 value is, the larger the runoff yield capacity, and vice versa. Additionally, other parameters, such as GWQMN, soil evaporation compensation factor (ESCO) and soil bulk density (SOL_BD), are also important in runoff simulations, as they reflect the combined effect of soil properties on hydrological processes [52,53].
Table 5.
Calibrated parameters of SWAT model in the baseline period (1981–2000).
Table 6 lists the evaluation metrics of monthly runoff simulation in the calibration and validation periods. The results indicate that the SWAT model can effectively capture the runoff dynamics during the baseline period, achieving NSE values above 0.85 and r values greater than 0.90 for both calibration and validation phases, demonstrating a satisfactory performance. The uncertainty indices of the SWAT model indicate reasonable coverage for both the calibrated and validated periods (p-factor > 0.85, r-factor < 1.2).
Table 6.
Evaluation metrics of monthly runoff simulation performance.
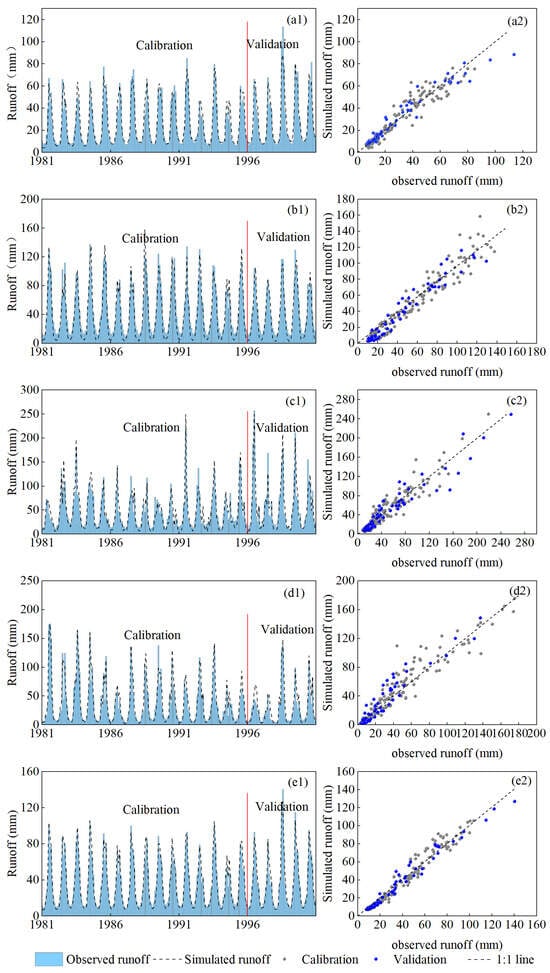
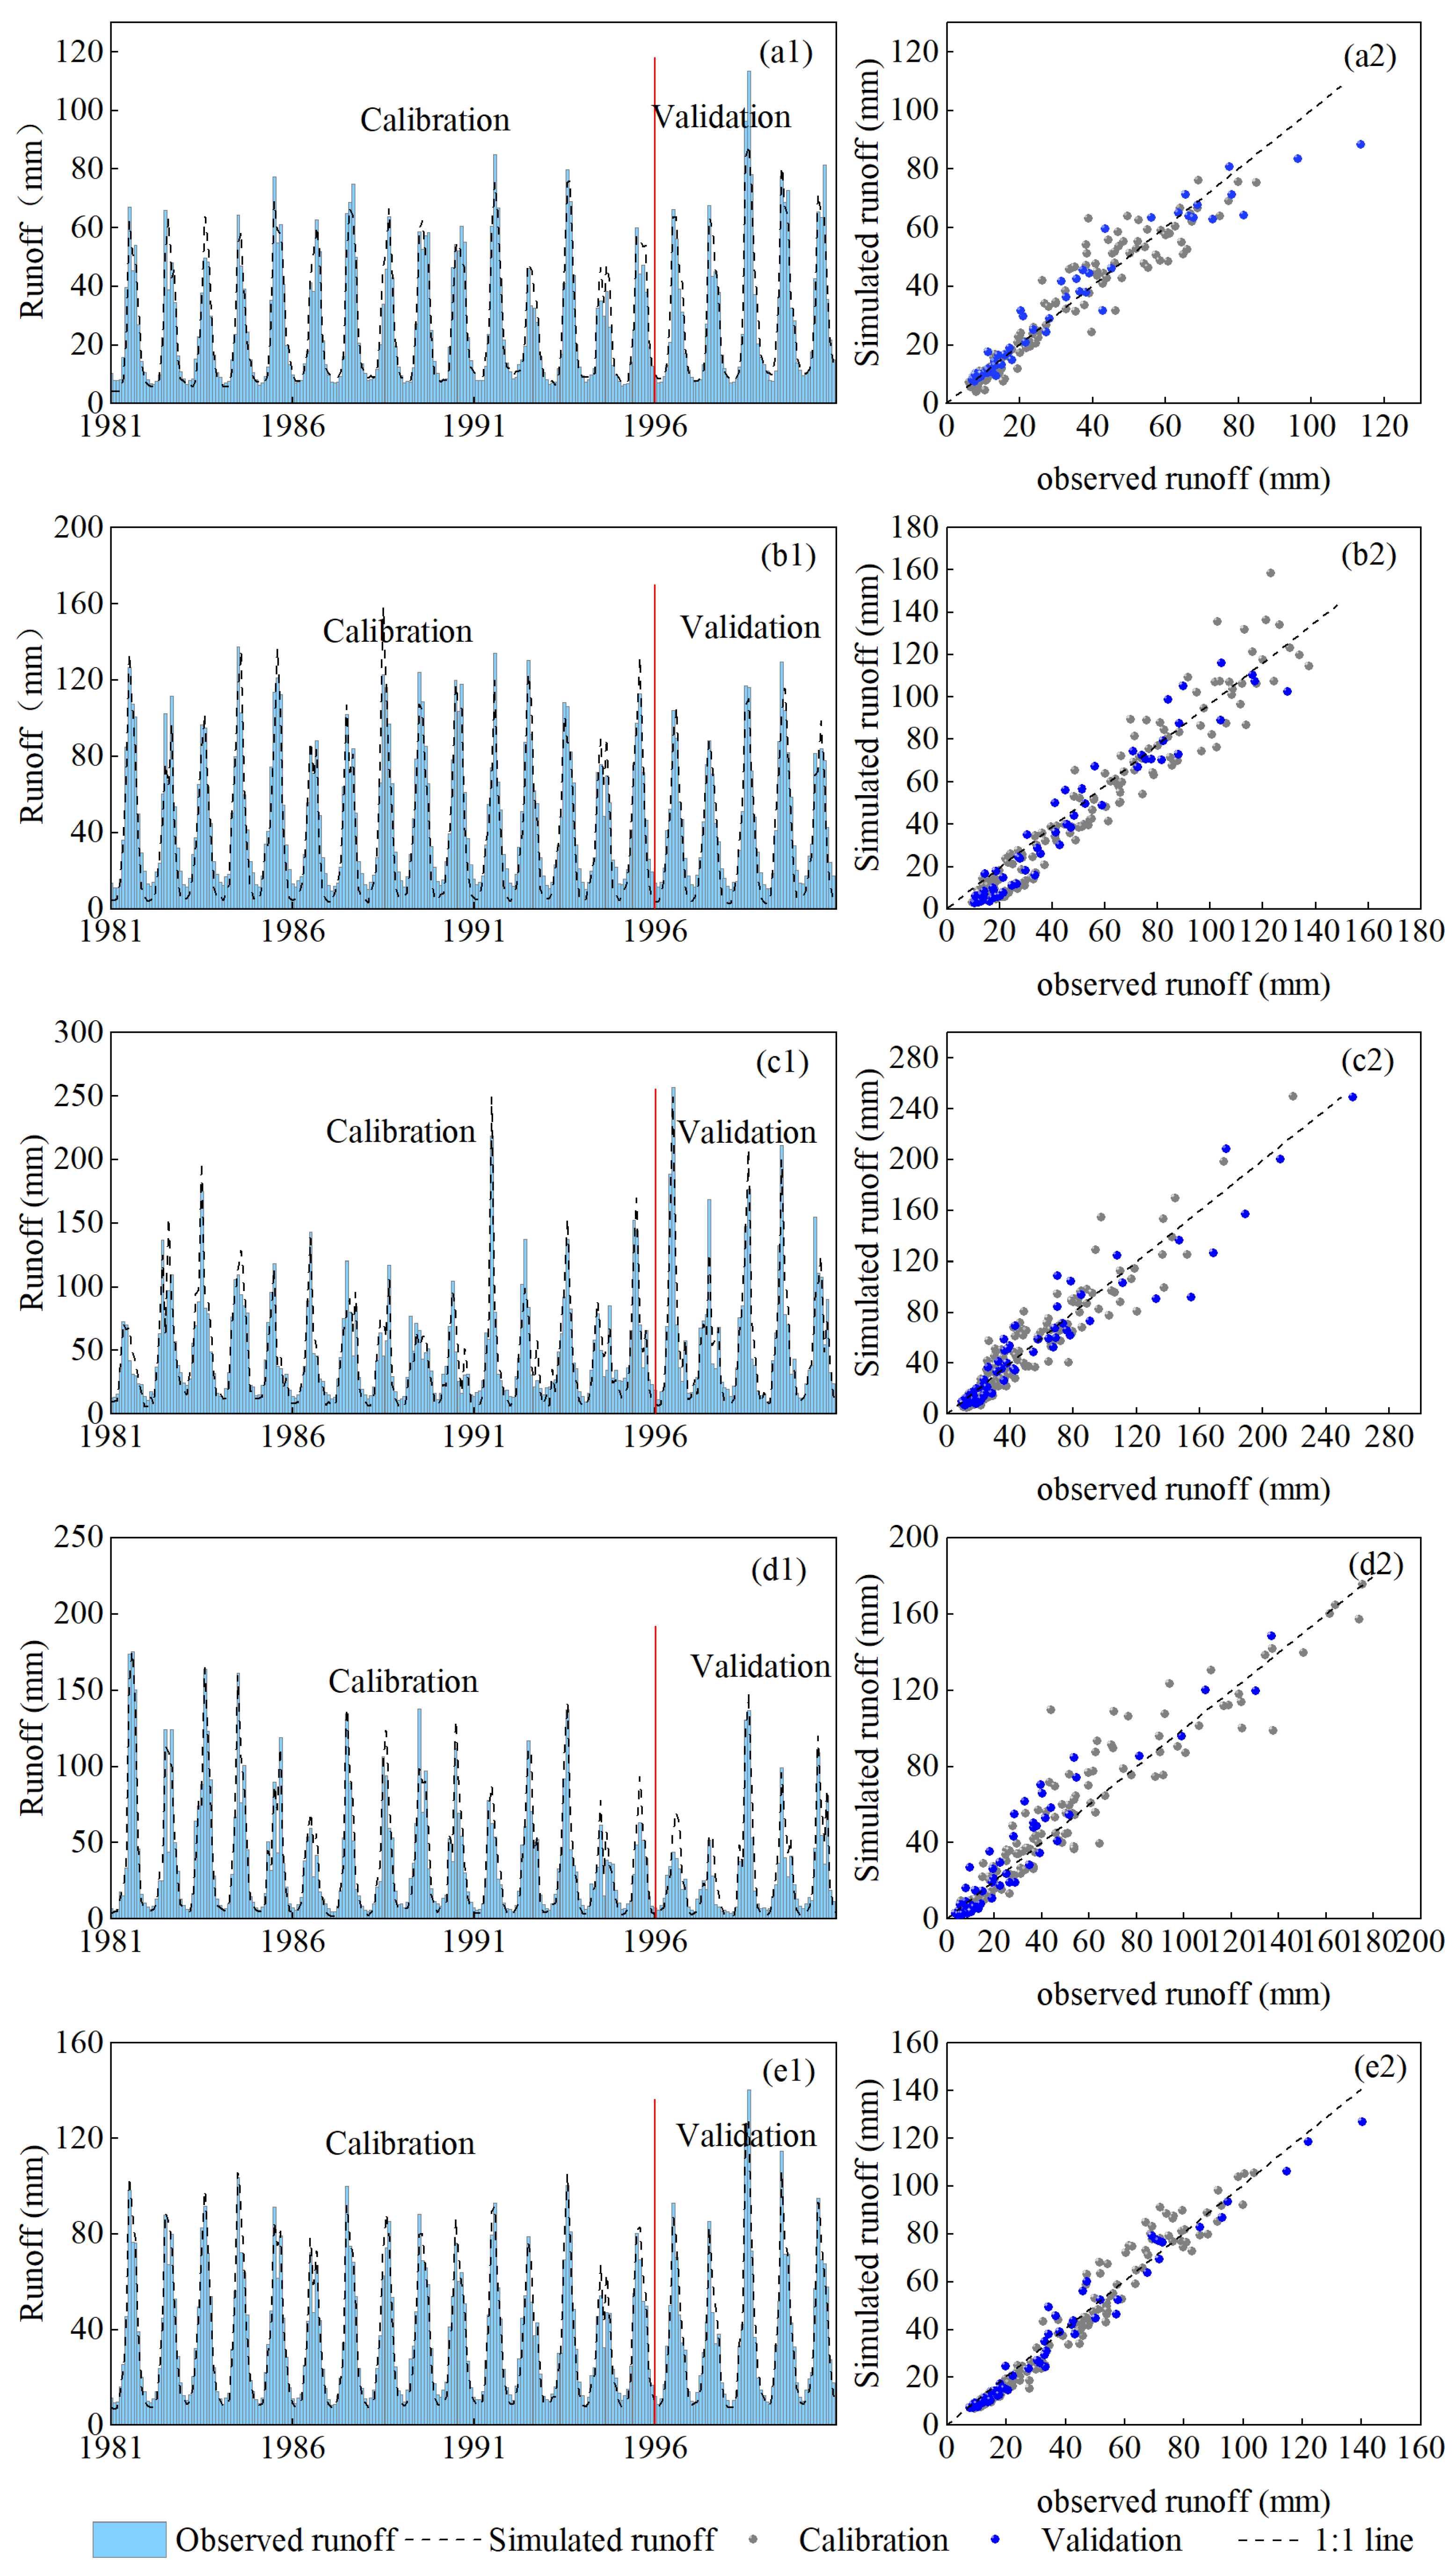
Figure 7 displays the simulated and observed monthly runoff hydrographs, as well as the corresponding scatter plots of runoff depth for the Pingshan, Gaochang, Wulong, Beibei and Yichang hydrologic stations, respectively. It is shown that the SWAT model performs well in simulating low-flow values, while systematic biases exist in peak flow simulations: the peak discharges are underestimated at Pingshan station and overestimated at the Gaochang and Beibei stations.
Figure 7.
Simulated and observed monthly runoff hydrographs (left column, suffix “1”) and corresponding scatter plots of runoff depth (right column, suffix “2”) at five hydrological stations: (a1,a2) Pingshan, (b1,b2) Gaochang, (c1,c2) Wulong, (d1,d2) Beibei, (e1,e2) Yichang. For each station, suffix “1” shows monthly hydrographs (simulated vs. observed), and suffix “2” shows scatter plots of runoff depth.
3.4. Contribution Rates of Climate Change and Human Activities
To quantify the respective impacts of climatic and anthropogenic factors on runoff, a two-phase simulation was conducted. The evaluation metrics of the runoff simulation performance at baseline and in the impacted periods are listed in Table 7. Due to human activities, particularly reservoir construction and regulation, the discrepancies between the observed and simulated monthly runoffs are increased, resulting in the NSE values in the impacted period being relatively lower than those in the baseline period.
Table 7.
Evaluation metrics of monthly runoff simulation and contribution rates.
The difference in simulated runoff between the baseline period (1981–2000) and the impacted period (2001–2022) is attributed to climatic influences. Subsequently, the impact of human activities is isolated by subtracting the climatically induced runoff change from the total observed runoff change. The contribution rates of climate change and human activities on runoff variation at five stations are calculated by Equations (7) and (8), and the results are also listed in Table 7. Both meteorological factors and human activities have contributed to the observed runoff reduction. Human activities, however, emerged as the dominant driver across all the stations, accounting for −70.71%, −76.38%, −60.18%, −54.48%, and −63.79% of the reduction at the Pingshan, Gaochang, Wulong, Beibei, and Yichang hydrologic stations, respectively. In comparison, the contributions from meteorological factors were −29.29%, −23.62%, −39.82%, −45.52%, and −36.21% at the corresponding stations.
3.5. Quantifying Runoff Reduction
As shown in Table 2, the annual average runoff value at Yichang station in the UYRB reduced by 22.3 billion m3 after 2000. This section will estimate the runoff reduction on the four paths, including water intake and consumption, reservoir dead storage impoundment, actual evapotranspiration increases and ground water storage variations.
- (1)
- Estimation of evapotranspiration increase
The LULC and the PET data of 1980, 2000 and 2020 were resampled to a uniform spatial resolution. Based on grid-to-grid correspondence, the PET capacity for each LULC category was determined separately. The average PET capacity for the baseline period was calculated using the means from 1980 and 2000, while the average for the impacted period was derived from the means of 2000 and 2020. Land use maps from 2000 and 2020 were adopted to represent LULC changes during the past two decades. The crop coefficient (Kc) values were initially selected following the ranges recommended by FAO56 [54] and were adjusted in conjunction with estimates from other pathways to jointly ensure the accuracy of runoff partitioning, which is lower than the mid-season peak Kc values recommended by FAO56. Corbari et al. [55] used micro-meteorological station evapotranspiration data to derive crop coefficient functions for natural vegetation and found that the Kc values for pasture, deciduous forest, and evergreen forest were lower than those recommended by FAO. Table 8 summarizes the estimated actual evapotranspiration variations after 2000 resulting from land surface changes. Across all LULC types, the PET capacity increased from the natural to the impacted period, with increments ranging from approximately 19.41 mm to 47.15 mm, which is linked to land surface change in this study. Existing studies indicate that forests generally contribute more to runoff reduction compared to grasslands and croplands [56]. The expansion of forested areas in the basin has led to an increase in actual evapotranspiration of approximately 5.48 billion m3. Concurrently, some cropland was transformed into urban land, which is characterized by extensive impervious surfaces and sparse vegetation. Additionally, global warming and rising temperatures have elevated atmospheric saturated vapor pressure, leading to a pronounced increase in the PET. Therefore, the total increase in the AET is 12.85 billion m3, reflecting the integrated influence of both climatic and biophysical drivers.
Table 8.
Estimated actual evapotranspiration variations after 2000.
- (2)
- Estimation of water abstraction and consumption
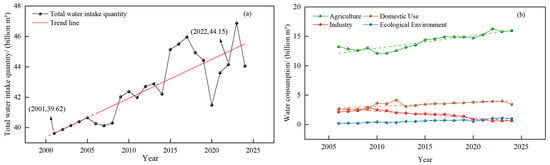
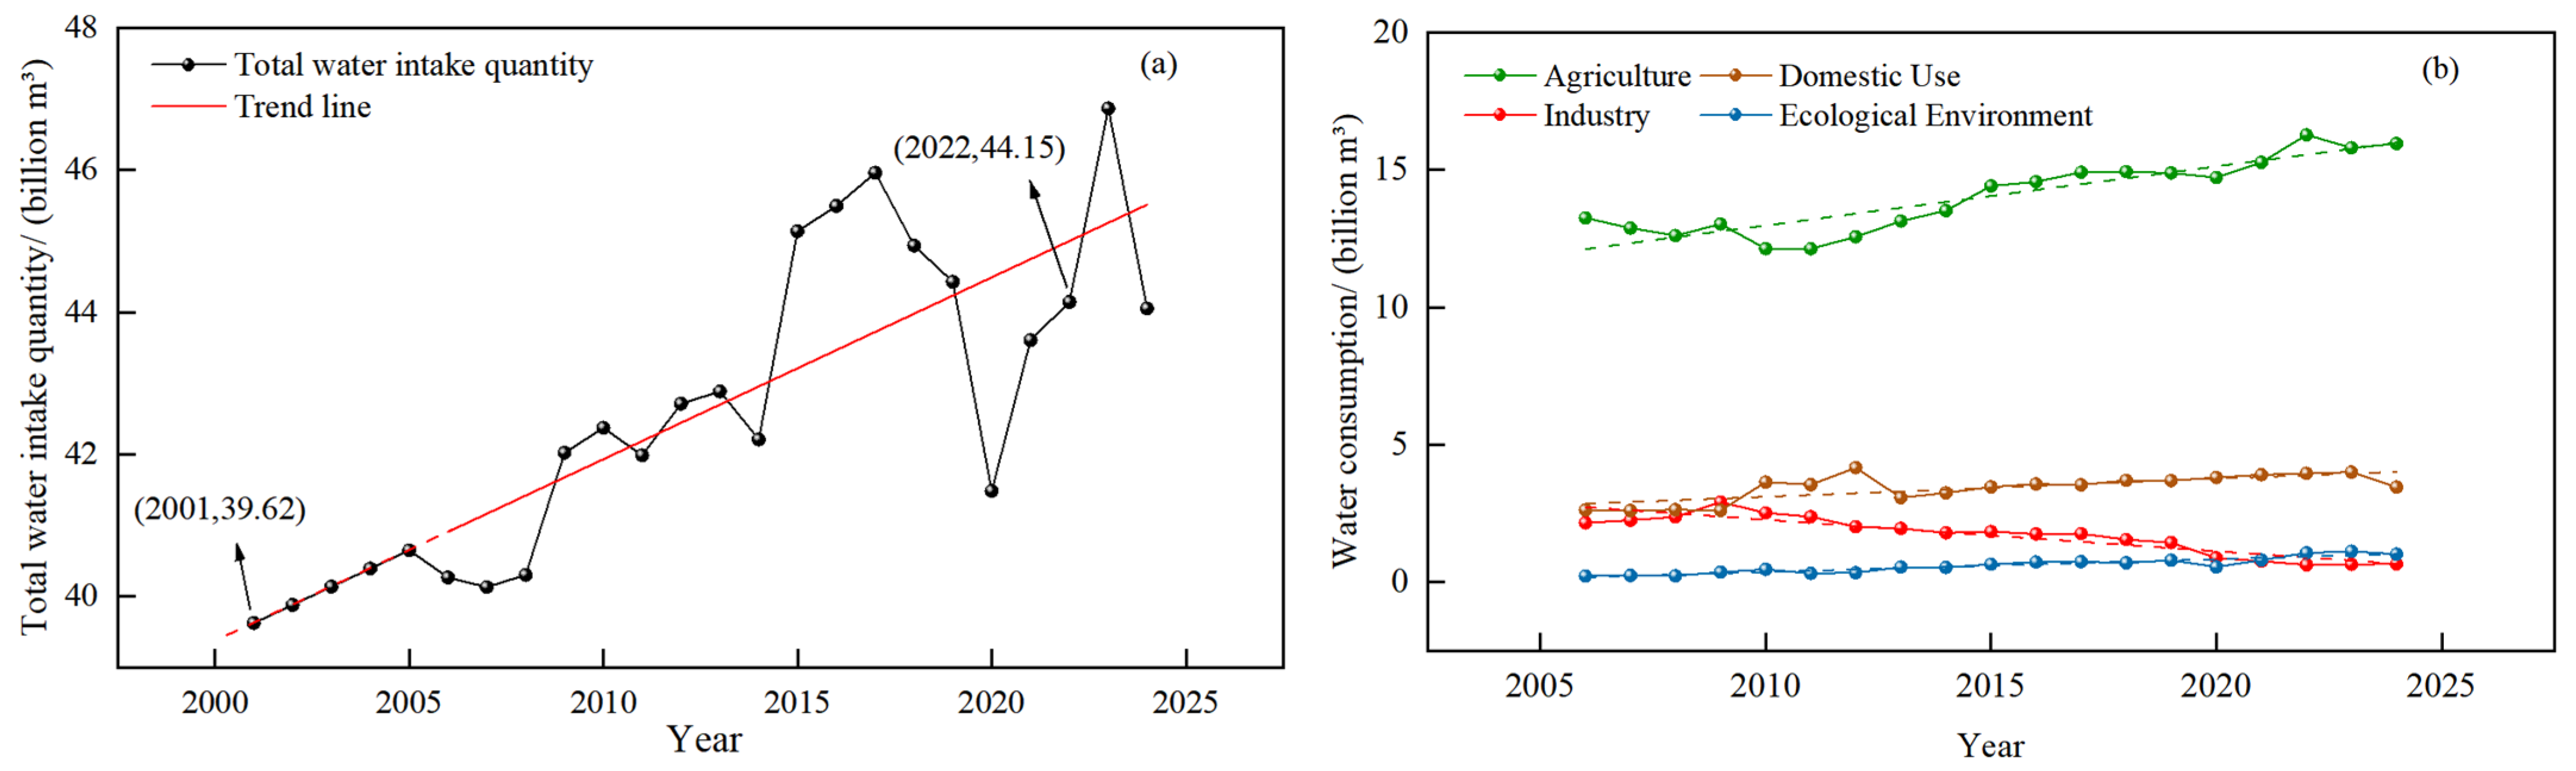
Changes in total water usage and sectoral water consumption in the UYRB from 2006 to 2024 are shown in Figure 8. Figure 8a indicates that the total intake quantity in the basin fluctuated with an overall upward trend, peaking in 2023 at 46.87 billion m3. Based on the intake quantity trend line, the intake quantity in 2001 is estimated to be approximately 39.62 billion m3. Compared to the 2022 intake quantity of 44.15 billion m3, this represents an increase of about 4.53 billion m3. Figure 8b illustrates water consumption in agriculture, industry, residential life, and ecological sectors. Agricultural water consumption accounts for over 70% of total consumption. Industrial water consumption has slowly declined, while residential and ecological environmental water consumption continue to grow.
Figure 8.
(a) Total water intake quantity and (b) water consumption variations of four sectors in the UYRB. Solid line with dots: actual values. Dashed line: linear trend.
According to Equation (10), when the return water coefficients for agricultural irrigation, industrial use, and domestic water use are estimated at 0.2, 0.7 and 0.7, respectively, the average annual consumptive water use is approximately 2.94 billion m3.
- (3)
- Estimation of reservoir dead storage
Table 9 compiles and summarizes the dead storage and the total storage capacity of 153 medium and large reservoirs, which were built from 1980 to 2022. After 2000, the total dead storage in the UYRB increased by 66.82 billion m3, while the total storage capacity increased 57.77 billion m3. The direct interception effect of reservoir dead storage capacity results in an annual average runoff reduction of 3.34 billion m3 at the Yichang station. Among these, the reservoir dead storage in the JSRB and the INRB increased 34.82 billion m3 and 17.17 billion m3, respectively, contributing the most to runoff reduction in the UYRB. This is followed by the WRB (8.32 billion m3), while the increase at MRB and JLRB are relatively small, each amounting to about 3 billion m3.
Table 9.
Reservoir storage capacity before and after 2000 in the UYRB (billion m3).
- (4)
- Estimation of groundwater storage variation
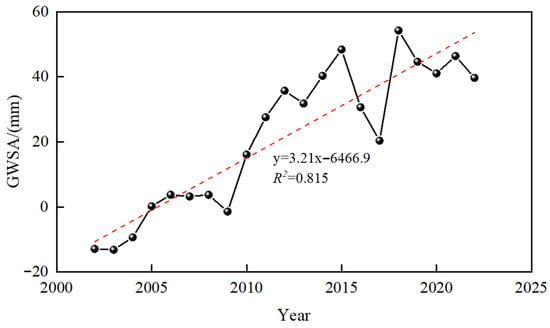
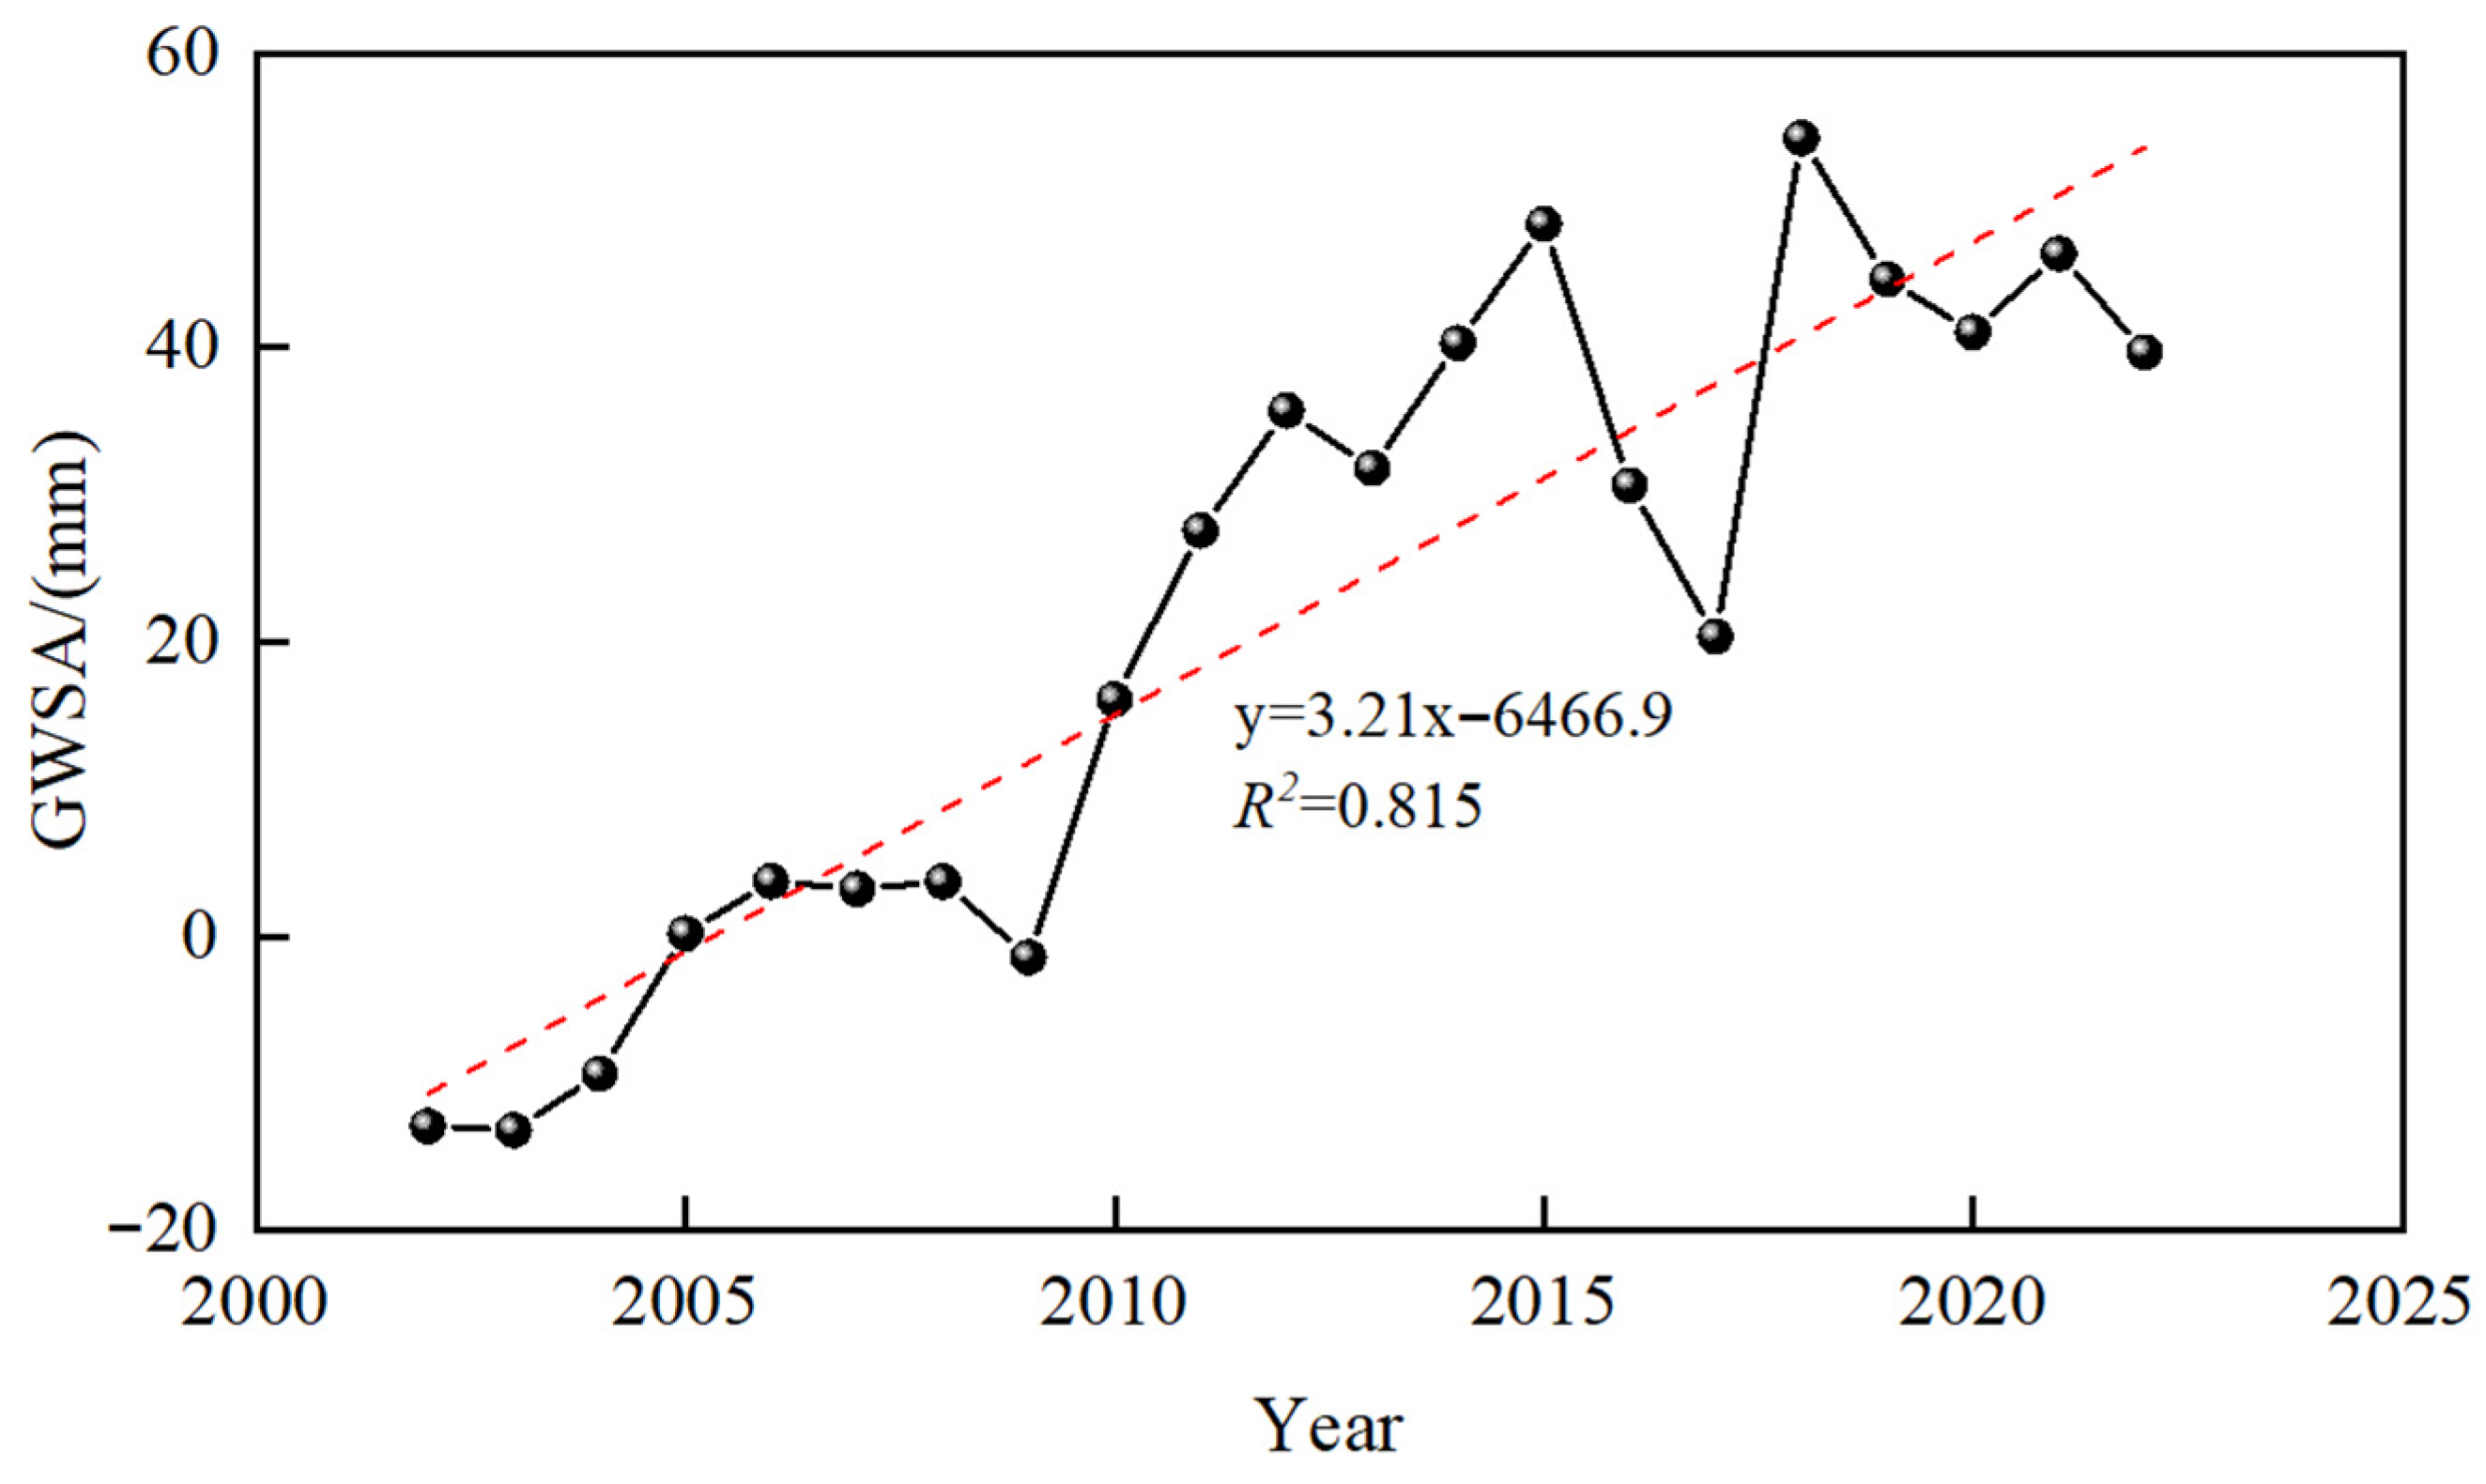
The variation in groundwater storage in the basin from 2002 to 2022 is shown in Figure 9. It can be observed that GWSA was negative during 2002–2004, indicating that groundwater levels were below the long-term average. Since 2005, the GWSA generally shifted to positive values, reflecting a gradual recovery of the groundwater system. This is likely due to reservoir impoundment, which increases the water surface area, raises the water level and replenishes groundwater storage. On the other hand, the humid climate in the UYRB promotes vegetation growth. The root systems of vegetation improve soil structure, enhance soil permeability, and further facilitate groundwater recharge [57,58]. This study indicates that the GWSA increased at a rate of 3.21 mm/y, equivalent to an average annual increase in groundwater storage of approximately 3.21 billion m3.
Figure 9.
Temporal trend of GWSA from 2002 to 2022 in the UYRB. Solid line with dots: actual values. Dashed line: linear trend.
Table 10 gives the estimated runoff changes caused by different factors. A negative value indicates runoff reduction, while a positive value indicates runoff increase. The total estimated runoff changes are −22.34 billion m3, which is almost identical to the observed value (−22.30 billion m3) at Yichang hydrologic station, as shown in Table 2.
Table 10.
Estimated runoff changes caused by different factors.
4. Discussion
4.1. Spatial Heterogeneity
The UYRB features complex topography and diverse climatic conditions, resulting in significant spatial heterogeneity in hydrological response. This study has taken full account of such heterogeneity in both model parameter calibration and attribution analysis. First, in terms of parameter calibration, a zonal calibration approach was adopted for the model, where differences in calibrated parameters reflect regional variations in hydrological response processes. The curve number (CN2) is key parameter governing runoff processes in the SWAT model, as it directly reflects the runoff generation capacity of the underlying surface; a higher value indicates greater surface runoff under the same precipitation conditions [59,60]. The MRB and WRB exhibit a relatively strong surface runoff generation capacity, whereas the JSRB demonstrates the weakest capacity for surface runoff formation.
Table 11 presents the composition of LULC types in each sub-basin (based on the averages for 1980, 2000, and 2020). It can be seen from Table 11 that the forest and pasture together account for more than 80% of the area in the JSRB. The forest and pasture provide strong canopy interception, litter-layer water retention, and soil infiltration capacity, which promote rainfall storage and infiltration, which is negative to runoff generation. Therefore, they are generally associated with a lower CN2 value. Topographically, the JSRB is dominated by high mountains and deep valleys, with fragmented terrain and well-developed gullies. The widespread natural depressions further enhance rainfall interception and storage-infiltration capacity, making it difficult for continuous overland flow to form. Moreover, the basin has been intensively regulated by the construction of giant reservoirs, such as the Wudongde–Baihetan–Xiluodu–Xiangjiaba cascade reservoirs in the lower Jinsha River, whose strong runoff-regulating effects further suppress the natural formation of surface runoff. Manning’s coefficient (OV_N), representing the frictional resistance to overland flow, results in increased flow transmission losses at higher values [61,62]. Accordingly, the highest values in the JSRB and MRB indicate the greatest surface roughness and flow resistance. These parameters collectively shape the unique rainfall–runoff response relationship in each sub-basin.
Table 11.
Composition of LULC types of sub-basins and UYRB.
The attribution results further elucidate regional disparities in runoff responses to these drivers. Specifically, the runoff at Beibei Station is most influenced by meteorological factors, while at the Gaochang hydrologic station, it is the least. Among various climatic factors, precipitation is considered a key meteorological factor determining the wetness or dryness of basins [63,64], highlighting the importance of enhancing basin resilience to extreme precipitation scenarios. On the other hand, the findings highlight that human activities played a dominant role in runoff reduction at all the stations, with the JSRB and MRB experiencing the most pronounced impacts. Zhang et al. [65] found that human activities have had a particularly significant impact on runoff in the middle and lower reaches of the Jinsha River. Huang and Yang [66] pointed out that downstream regions are becoming increasingly dependent on water sources from the Qinghai–Tibet Plateau. It is particularly noteworthy that the JSRB contributes approximately one-third of the total water yield to the UYRB. Runoff changes in the JSRB deeply affect the overall quantity and spatiotemporal distribution of water resources across the entire basin. Thus, it is recommended to adopt an integrated water resource management approach, including enhancing coordinated operation of cascade reservoirs, optimizing water allocation strategies, and strengthening LULC management to support sustainable water resource utilization.
4.2. The Causes of Runoff Reduction
This study first analyzed the trends in hydroclimatic factors and found that precipitation showed little change before and after 2000, whereas PET increased and runoff decreased. This phenomenon has also been documented in the study by Han et al. [28]. Their study concluded that meteorological factors are the primary drivers of runoff decline in the UYRB (1960–2023), citing a significant decrease in precipitation and an increase in evapotranspiration during 1960–2023. From 1960 to 2020, there was a significant decrease in precipitation coupled with an increase in evapotranspiration. Zhang et al. [67] employed the climatic elasticity method and found that the runoff decline during 1961–1990 was primarily attributed to rapid population growth and economic development. For the period of 1991–2010, both climate change and human activities jointly contributed to the reduction in runoff, with human activities remaining the dominant factor. Zeng et al. [68] analyzed hydro-meteorological changes in the upper Yangtze River basin over the period of 1956–2017 and found that runoff and precipitation decreased at rates of −0.41 mm yr−1 and −0.08 mm yr−1, respectively, while PET increased at a rate of 0.15 mm yr−1. Using the Budyko framework, they estimated that climatic factors and human activities accounted for 51.2% and 48.8% of the runoff changes, respectively. Traditional runoff attribution analysis typically seeks to isolate the independent impacts of individual drivers, such as climatic factors, LULC, reservoir regulation, and water abstraction. However, hydrological systems exhibit high complexity and strong interactions among these drivers. For example, LULC conversion directly alters basin evapotranspiration processes [69]; reservoir construction not only regulates runoff but can also promote riparian vegetation growth by raising groundwater levels and improving local microclimates, thereby indirectly influencing the hydrological cycle [70]. Meanwhile, climate warming (e.g., increased precipitation and rising temperatures) can also indirectly drive changes in the underlying surface. These intertwined feedback mechanisms pose theoretical and methodological challenges to completely disentangling the contribution of any single factor. This study focuses on four key causes of reduced runoff: increased evapotranspiration, water abstraction consumption, impoundment in reservoir dead storage, and changes in groundwater storage. Although influenced by multiple factors, understanding these pathways provides critical direction for water resource management. For instance, water abstraction constitutes a direct and growing subtraction from runoff due to economic development. Meanwhile, the initial filling of reservoirs leads to irreversible runoff interception, an accumulated loss that scales with expanding reservoir capacity. Wang et al. [71] constructed a flow and sediment transport model, revealing that most reservoirs in the UYRB are unlikely to reach sedimentation equilibrium by 2080. Reservoir impoundment and siltation affect sediment transport dynamics and hydrologic process. The sustainable operation of reservoirs is both crucial and indispensable. Importantly, changes in the underlying surface are identified as the dominant factor driving runoff reduction, accounting for approximately 57% of the total decrease. The average LAI across all the LULC types exhibited an upward trend, indicating that even where land cover type remained unchanged, the physiological state and community structure of vegetation underwent significant transformation. This is called basin greening. Most studies have reported water production reduction along with vegetation increase [72,73]. Bi et al. [74] identified LAI variations, rising CO2 concentration, and LULC as the key drivers of potential evapotranspiration changes in more than 16% of the global land. Bai et al. [75] reconstructed the long-term evapotranspiration series in the Yangtze River basin using the water balance equation and subsequently evaluated its driving factors using ridge regression. Their analysis revealed a sustained upward trend in evapotranspiration over recent decades, primarily driven by changes in surface vegetation cover and precipitation. These results highlight the important role of vegetation dynamics in the hydrological cycle. In summary, sustainable water resource management in the UYRB under future environmental change requires an integrated understanding of both engineered (reservoir sedimentation) and ecological (vegetation greening) feedback, processes that have historically been examined separately but must be jointly considered in next-generation hydrological projections.
4.3. Uncertainties and Limitations
This study elucidates the hydrological and climatic factors of evolution patterns in the UYRB, quantifies the impacts of climate warming and human activities on runoff, and estimates potential pathways for runoff reduction. However, the research still has certain limitations and uncertainties that warrant further improvement. In conducting attribution analysis using the SWAT model, this study assumes that climate factors and human activities are independent of each other, which may introduce biases into the estimated results. For example, large-scale vegetation restoration (basin greening) not only increases evapotranspiration but may also further influence local precipitation and air temperature. Furthermore, reservoir impoundment and irrigation expansion not only modify runoff processes but may also affect regional water vapor circulation through increased evaporation. This two-way feedback between climate and human activities is not adequately accounted for in the traditional “separate attribution” framework, potentially leading to an underestimation of climate change impacts.
Regarding uncertainty due to constraints of data availability, the water intake data for 2002–2005 were extrapolated from trends observed during 2006–2022, which may introduce errors in estimated human water use for the earlier period. While estimating the PET of each LULC type, the LULC data were resampled to match the spatial resolution of the PET data. The dominant LULC type within each grid cell was taken as representative. While this approach improves computational efficiency, it also introduces uncertainties due to reduced spatial resolution and simplified information representation.
A uniform conversion ratio coefficient (Kc) was adopted to quantify evapotranspiration, which may not fully reflect the spatiotemporal heterogeneity induced by variations in vegetation types, vegetation growth and soil moisture conditions. Similar issues exist in the selection of return water coefficients. In the estimation of reservoir dead storage, the sediment accumulation was neglected. A sensitivity analysis was performed to assess the reliability of the results obtained in this study and to identify the attributions of these four components to the total uncertainty. The coefficients of Kc and return water were assumed with ±20% relative errors, then the lower and upper bounds of evapotranspiration and water abstraction variations were estimated.
According to existing studies on the Yangtze River basin, the highest annual sedimentation rate occurs in small reservoirs (0.41%), while the basin-wide average rate is 0.25% [76]. The intercepted water volume was thus calculated by deducting the storage loss caused by sedimentation from the dead storage capacity. The minimum and most likely values were determined using sedimentation rates of 0.41% and 0.25%, respectively, while the maximum value (3.34 billion m3) corresponds to the scenario without sedimentation.
The range of groundwater storage change was determined using GRACE-derived GWSA data from 2002 to 2022. The groundwater increment was derived from the long-term trend, without considering the influence of recession. To estimate the influence, the difference between the maximum and minimum GWSA values over this period was defined as the maximum possible change (3.34 billion m3). An estimate of 3.21 billion m3 was adopted as the most likely value, and a symmetric distribution was assumed to de-rive the corresponding lower and upper bounds.
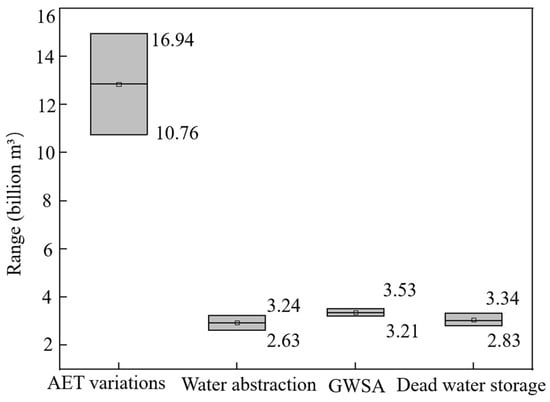
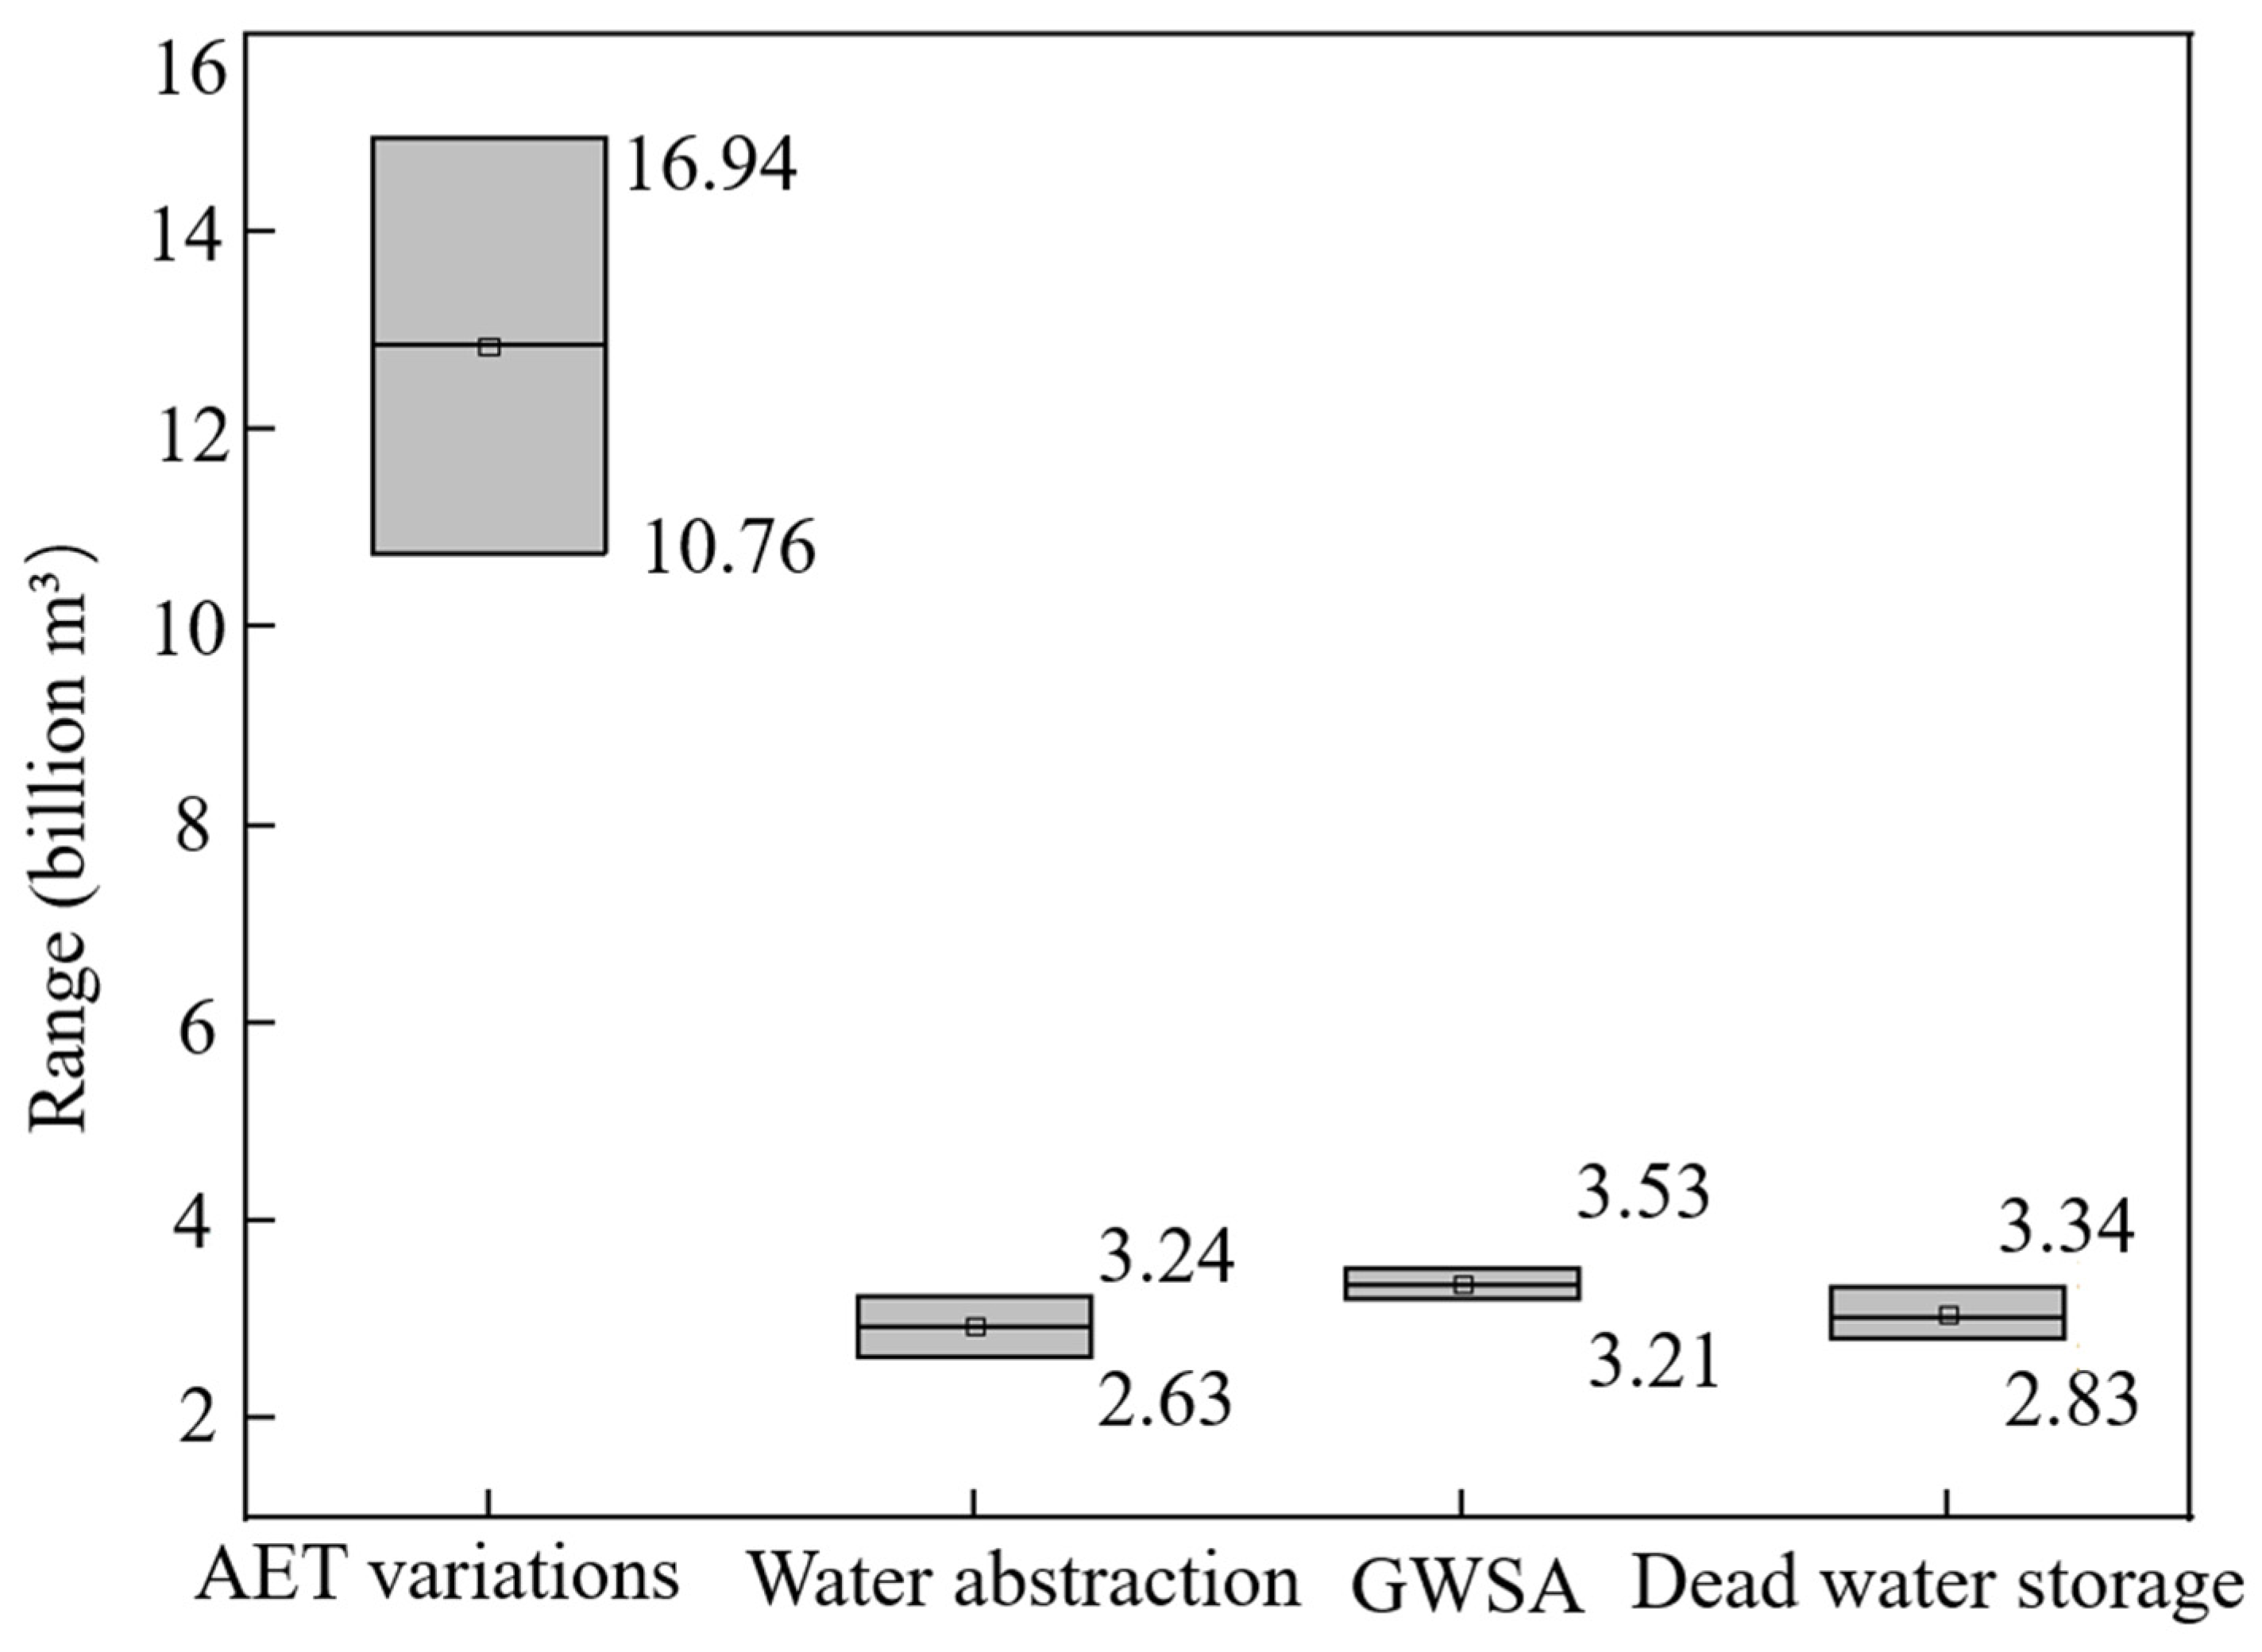
The ranges for the four components are summarized in Figure 10. Actual evapotranspiration (AET) has the widest variation range from 10.76 to 14.94 billion m3, while the ranges of GWSA, water withdrawal, and reservoir dead storage are from 3.21 to 3.53, from 2.63 to 3.24 and from 2.83 to 3.34 billion m3, respectively. Evapotranspiration estimation contributes the most to the uncertainty of the total estimate, accounting for approximately 74.38%, followed by water withdrawal with 10.85%. GWSA contributes 9.08% to the total uncertainty. Sediment deposition impact has the smallest contribution to the total uncertainty at only 5.69%.
Figure 10.
Ranges of the estimated runoff reduction due to the variations of AET, water abstraction, dead water storage and GWSA.
5. Conclusions
The evolving patterns of hydrometeorological variables and LULC were first investigated in the UYRB. Then, the SWAT model was developed to quantify the contribution rates of climate change and human activities to runoff variations. The cause of runoff reduction was analyzed and quantitively estimated by the water balance equation. The main findings are summarized as follows:
- (1)
- The runoff in the UYRB showed an overall decreasing trend, while the PET significantly increased from 1980 to 2022. After 2000, the distributions of annual precipitation, PET and runoff widened with greater dispersion, reflecting the increase in uncertainty in hydrological and meteorological variables under changing environment.
- (2)
- Human activities are the dominant factors that caused runoff reduction across five stations, contributing −54.48%~−76.38%, while climate change contributes −23.62%~−45.52% to runoff reduction.
- (3)
- At the Yichang hydrological station, the annual average runoff decreased by 22.30 billion m3. The contributions of four attribution pathways were as follows: actual evapotranspiration accounted for 12.85 billion m3, water intake for 2.94 billion m3, dead storage impoundment for 3.34 billion m3, and groundwater storage for 3.21 billion m3.
This study provides a robust theoretical analysis of runoff evolution in the UYRB in the past two decades. It clarifies the significant role of human activities in basin runoff variations and highlights the critical importance of LULC in water resource management. These actionable insights lay a scientific foundation for adaptive and high-efficient utilization of water resources in the Yangtze River Basin.
Author Contributions
X.W., methodology, software, investigation, validation, original draft preparation; B.S. and X.X., formal analysis, investigation, data curation; S.G. and H.C., conceptualization, supervision, project administration, funding acquisition, revised manuscript. All authors have read and agreed to the published version of the manuscript.
Funding
This research was funded by the National Natural Science Foundation of China (grant number U2340205).
Data Availability Statement
Data will be made available on request.
Acknowledgments
The authors would like to thank the editor and anonymous reviewers whose comments and suggestions help to improve the manuscript.
Conflicts of Interest
The authors declare no conflicts of interest.
Abbreviations
The following abbreviations are used in this manuscript:
| UYRB | Upper Yangtze River basin |
| JSRB | Jinsha River basin |
| MTRB | Ming and Tuo River basin |
| WRB | Wu River basin |
| JLRB | Jialing River basin |
| INRB | Interval basin |
| PET | Potential evapotranspiration |
| AET | Actual evapotranspiration |
| LULC | Land use/land cover change |
| SWAT | Soil and Water Assessment Tool |
| HRUs | Hydrological Response Units |
| DEM | Digital Elevation Model |
| ARS | Agricultural Research Service |
| USDA | United States Department of Agriculture |
| LAI | Leaf area index |
| GWSA | Groundwater storage anomaly |
Appendix A
Table A1.
Basic information of constructed reservoirs (billion m3).
References
- Huntington, T.G. Evidence for Intensification of the Global Water Cycle: Review and Synthesis. J. Hydrol. 2006, 319, 83–95. [Google Scholar] [CrossRef] [Scilit]
- Gu, B.; Zhou, S.; Yu, B.; Findell, K.L.; Lintner, B.R. Multifaceted Changes in Water Availability with a Warmer Climate. Npj Clim. Atmos. Sci. 2025, 8, 31. [Google Scholar] [CrossRef] [Scilit]
- Sajikumar, N.; Remya, R.S. Impact of Land Cover and Land Use Change on Runoff Characteristics. J. Environ. Manag. 2015, 161, 460–468. [Google Scholar] [CrossRef] [Scilit]
- Wang, A.; Wang, J.; Luan, B.; Zhang, M.; Wang, X.; Yu, P. Quantifying the Impact of Land Use Changes on Surface Runoff in the Loess Plateau Area of Northwest China by SWAT. J. Environ. Manag. 2025, 377, 124641. [Google Scholar] [CrossRef] [Scilit] [PubMed]
- Zeng, L.; Charoensuk, T.; Connor, C.; Druce, D.; Toettrup, C.; Nielsen, K.; Bauer-Gottwein, P. Exploitation of Satellite Earth Observation Datasets for Hydrologic Analysis of Large Reservoirs in Thailand. J. Hydrol. 2025, 659, 133085. [Google Scholar] [CrossRef] [Scilit]
- Dwarakish, G.S.; Ganasri, B.P. Impact of Land Use Change on Hydrological Systems: A Review of Current Modeling Approaches. Cogent Geosci. 2015, 1, 1115691. [Google Scholar] [CrossRef] [Scilit]
- Zuo, G.; Lian, Y.; Wang, N.; Xie, J. Estimating Natural Streamflow Using a Combined Extension and Routing Approach. Environ. Model. Softw. 2025, 193, 106650. [Google Scholar] [CrossRef] [Scilit]
- Huo, D.; Wu, J.; Zhao, C.; Yan, Y.; Zhu, W.; Jin, R.; Zhou, J. Identification of Attribution of Runoff Variations in the Tumen River Basin Based on Budyko’s Hypothesis. Hydrology 2025, 12, 122. [Google Scholar] [CrossRef] [Scilit]
- Mo, L.; Yu, X.; Feng, Y.; Jiang, T. Runoff Variations and Quantitative Analysis in the Qinghai Lake Basin Under Changing Environments. Hydrology 2025, 12, 94. [Google Scholar] [CrossRef] [Scilit]
- Clemenzi, I.; Du, Y.; Pechlivanidis, I. Attributing European Runoff Changes to Climatic Drivers under Future Conditions. J. Hydrol. 2026, 668, 134794. [Google Scholar] [CrossRef] [Scilit]
- Lv, R.; Sun, S.; Bi, Z.; Liu, Y.; Ma, Q.; Ren, Y.; Wei, L.; Zhou, Y.; Zhou, B. Attributing Changes in Evapotranspiration and Runoff across the Continental U.S. Using the Budyko Hypothesis Combined with the Shuttleworth-Wallace Model. J. Hydrol. 2026, 666, 134831. [Google Scholar] [CrossRef] [Scilit]
- Mei, J.; Yong, B.; Lyu, Y.; Qi, W.; Wen, Y.; Wang, G.; Zhang, J. Runoff Evolution Responses to Climate Change: A Case Study in the Headwater Area of Yellow River, China. J. Environ. Manag. 2025, 384, 125512. [Google Scholar] [CrossRef] [Scilit]
- Zhou, G.; Zhao, Q.; Ma, S.; Zhang, S. Hybrid Runoff Model Improves Daily Peak Flow Simulation in Arid and Semi-Arid Basins. J. Hydrol. 2025, 660, 133366. [Google Scholar] [CrossRef] [Scilit]
- Zhang, F.; Lai, W.; Zhang, S.; Liu, W.; Hou, S.; Zhang, J. Quantifying the Contribution of Climate Changes and Human Activities on Runoff Changes in the Changhua River Basin of Hainan Island. J. Hydrol. Reg. Stud. 2025, 60, 102474. [Google Scholar] [CrossRef] [Scilit]
- Yang, Z.-L.; Bai, P. Response of Runoff and Its Components to Climate Change in the Manas River of the Tian Shan Mountains. Adv. Clim. Change Res. 2024, 15, 62–74. [Google Scholar] [CrossRef] [Scilit]
- Yu, J.; Gao, B.; Li, M.; Xiao, P. Improving Runoff Modelling through Strengthened Snowmelt and Glacier Module Enhances Runoff Attribution in a Large Watershed in Central Asia. J. Hydrol. 2025, 660, 133528. [Google Scholar] [CrossRef] [Scilit]
- Senbeta, T.B.; Romanowicz, R.J. The Role of Climate Change and Human Interventions in Affecting Watershed Runoff Responses. Hydrol. Process. 2021, 35, e14448. [Google Scholar] [CrossRef] [Scilit]
- Zhao, M.; Cao, G.; Cao, S.; Zhao, Q.; Han, G.; Yan, X. Quantifying Impact of Climatic and Anthropogenic Factors on Runoff in the Source Region of Alpine River in Northeast Qinghai-Tibetan Plateau. J. Hydrol. Reg. Stud. 2023, 47, 101423. [Google Scholar] [CrossRef] [Scilit]
- Wang, X.; Guo, S.; Wang, M.; He, X.; Wang, W. Attribution Analysis on Runoff Reduction in the Upper Han River Basin Based on Hydro-Meteorologic and Land Use/Cover Changedata Series. Water 2025, 17, 2067. [Google Scholar] [CrossRef] [Scilit]
- Liu, W.; Xu, Z.; Li, F.; Zhang, L.; Zhao, J.; Yang, H. Impacts of Climate Change on Hydrological Processes in the Tibetan Plateau: A Case Study in the Lhasa River Basin. Stoch. Environ. Res. Risk Assess. 2015, 29, 1809–1822. [Google Scholar] [CrossRef] [Scilit]
- Xu, H.; Wang, H.; Liang, D.; Wu, X.; Zeng, Y.; Yan, Y. Four-Decade Response of Ecological Risk to Land Use Changes in the Yangtze River Basin. Environ. Dev. Sustain. 2025, 1–16. [Google Scholar] [CrossRef] [Scilit]
- Wu, J.; Hobbs, R. Key Issues and Research Priorities in Landscape Ecology: An Idiosyncratic Synthesis. Landsc. Ecol. 2002, 17, 355–365. [Google Scholar] [CrossRef] [Scilit]
- Peng, M.; Yang, Y.; Deng, Y.; Jize, D.; Chen, H.; Hai, Y.; Liu, G.; Wang, H.; Xie, T.; Li, H.; et al. The Impact of the Grain-for-Green Programme on Carbon Storage in the Upper Yangtze River Basin Based on the PLUS-InVEST Model. Carbon Balance Manag. 2025, 20, 24. [Google Scholar] [CrossRef] [Scilit]
- Zhang, Q.; Xu, C.; Wang, H.; Wang, Q.; Li, L.; Luo, Y. Simulation and Prediction of Hydrological Processes in Kaidu River Basin Based on DHSVM Model. J. Hydrol. Reg. Stud. 2025, 60, 102537. [Google Scholar] [CrossRef] [Scilit]
- Wang, Y.; Guo, S.; Xiang, X.; Li, C.; Li, N. Impact of Three Gorges Reservoir Operation on Water Level at Jiujiang Station and Poyang Lake in the Yangtze River. Hydrology 2025, 12, 52. [Google Scholar] [CrossRef] [Scilit]
- Lv, H.; Wang, Y.; Yan, D.; Peng, S.; Zheng, X. Quantifying the Impacts of Climate Change and Human Activities on Hydrological Regime in Jinsha River, China. J. Hydrol. 2025, 662, 134008. [Google Scholar] [CrossRef] [Scilit]
- Wang, X.; Zhang, S.; Tian, Y. Assessment of Runoff Changes in the Sub-Basin of the Upper Reaches of the Yangtze River Basin, China Based on Multiple Methods. J. Arid Land 2024, 16, 461–482. [Google Scholar] [CrossRef] [Scilit]
- Han, Y.; Zhong, P.; Zhu, F.; Zhang, Y.; Song, Z.; Wang, Y.; Wang, B.; Xu, C.; Ben, M.; Li, M. Spatiotemporal Attribution of Runoff Changes in the Upper Yangtze River Basin Using the SWAT+ Model. J. Hydrol. Reg. Stud. 2025, 61, 102753. [Google Scholar] [CrossRef] [Scilit]
- Jing, Y.; Xu, Q. Sediment trapping effect by reservoirs in the Jinsha River basin. Adv. Water Sci. 2018, 29, 482–491. [Google Scholar] [CrossRef]
- Song, C.; Fan, C.; Zhu, J.; Wang, J.; Sheng, Y.; Liu, K.; Chen, T.; Zhan, P.; Luo, S.; Yuan, C.; et al. A Comprehensive Geospatial Database of Nearly 100 000 Reservoirs in China. Earth Syst. Sci. Data 2022, 14, 4017–4034. [Google Scholar] [CrossRef] [Scilit]
- Miralles, D.G.; Holmes, T.R.H.; De Jeu, R.A.M.; Gash, J.H.; Meesters, A.G.C.A.; Dolman, A.J. Global Land-Surface Evaporation Estimated from Satellite-Based Observations. Hydrol. Earth Syst. Sci. 2011, 15, 453–469. [Google Scholar] [CrossRef] [Scilit]
- Martens, B.; Miralles, D.G.; Lievens, H.; van der Schalie, R.; de Jeu, R.A.M.; Fernández-Prieto, D.; Beck, H.E.; Dorigo, W.A.; Verhoest, N.E.C. GLEAM v3: Satellite-Based Land Evaporation and Root-Zone Soil Moisture. Geosci. Model Dev. 2017, 10, 1903–1925. [Google Scholar] [CrossRef] [Scilit]
- Liu, Y.; Liu, R.; Chen, J.M. Retrospective Retrieval of Long-Term Consistent Global Leaf Area Index (1981–2011) from Combined AVHRR and MODIS Data. J. Geophys. Res. Biogeosci. 2012, 117, G04003. [Google Scholar] [CrossRef] [Scilit]
- Zhang, G.; Xu, T.; Yin, W.; Bateni, S.M.; Jun, C.; Kim, D.; Liu, S.; Xu, Z.; Ming, W.; Wang, J. A Machine Learning Downscaling Framework Based on a Physically Constrained Sliding Window Technique for Improving Resolution of Global Water Storage Anomaly. Remote Sens. Environ. 2024, 313, 114359. [Google Scholar] [CrossRef] [Scilit]
- Arnold, J.G.; Moriasi, D.N.; Gassman, P.W.; Abbaspour, K.C.; White, M.J.; Srinivasan, R.; Santhi, C.; Harmel, R.D.; Van Griensven, A.; Van Liew, M.W.; et al. SWAT: Model Use, Calibration, and Validation. Trans. ASABE 2012, 55, 1491–1508. [Google Scholar] [CrossRef] [Scilit]
- Zhang, L.; Deng, C.; Wei, J.; Zou, J. Assessing the Impacts of Climate Change and Land Use/Land Cover Data Characteristics on Streamflow Using the SWAT Model in the Upper Han River Basin. J. Hydrol. Reg. Stud. 2025, 61, 102764. [Google Scholar] [CrossRef] [Scilit]
- Zhang, Q.; Wu, J.; Wang, T.; Tang, C.; Liu, W. Coupling SWAT and Interpretable Deep Learning to Improve Streamflow Simulation in Arid Regions. Water Resour. Manag. 2026, 40, 56. [Google Scholar] [CrossRef] [Scilit]
- Chen, J.; Zheng, M.; Lin, F.; Chen, X.; Yao, H. Spatiotemporal Variation of Forest Water Conservation Based on Dual-Variable Calibration of Runoff and Evapotranspiration with SWAT Model. Agric. For. Meteorol. 2025, 373, 110755. [Google Scholar] [CrossRef] [Scilit]
- Yu, L.; Chen, X.; Ruan, W.; Yao, H.; Chen, J.; Deng, H.; Chen, Y.; Liu, M. Time-Scale Effects on Runoff Simulation and Parameters Sensitivity Using SWAT Model. J. Hydrol. Reg. Stud. 2025, 60, 102604. [Google Scholar] [CrossRef] [Scilit]
- Liu, J.; Chang, K.; Zhu, X.; Wang, X.; Lin, B.; Cai, W. Simulation and Attribution Analysis of Runoff–Sediment in the Upper Basin of Fenhe River, China. J. Water Clim. Change 2024, 15, 2961–2977. [Google Scholar] [CrossRef] [Scilit]
- Javan Salehi, M.; Shourian, M. A Coupled Agent-Based and Hydrological Modelling Approach Using Value-Belief-Norm Theory to Simulate Anthropogenic Impacts on Water Resources. J. Hydrol. 2025, 662, 134056. [Google Scholar] [CrossRef] [Scilit]
- Wu, Y.; Qin, F.; Dong, X.; Li, L. Investigating the Spatio-Temporal Evolution of Land Cover and Ecosystem Service Value in the Kuye River Basin. Water 2024, 16, 2456. [Google Scholar] [CrossRef] [Scilit]
- Liu, X.; Ren, L.; Yuan, F.; Singh, V.P.; Fang, X.; Yu, Z.; Zhang, W. Quantifying the Effect of Land Use and Land Cover Changes on Green Water and Blue Water in Northern Part of China. Hydrol. Earth Syst. Sci. 2009, 13, 735–747. [Google Scholar] [CrossRef] [Scilit]
- Jin, X.; Guo, R.; Xia, W. Distribution of Actual Evapotranspiration over Qaidam Basin, an Arid Area in China. Remote Sens. 2013, 5, 6976–6996. [Google Scholar] [CrossRef] [Scilit]
- Isaacson, B.N.; Yang, Y.; Anderson, M.C.; Clark, K.L.; Grabosky, J.C. The Effects of Forest Composition and Management on Evapotranspiration in the New Jersey Pinelands. Agric. For. Meteorol. 2023, 339, 109588. [Google Scholar] [CrossRef] [Scilit]
- Huang, Y.; Miao, K.; Liu, X.; Jiang, Y. The Hysteresis Response of Groundwater to Reservoir Water Level Changes in a Plain Reservoir Area. Water Resour. Manag. 2022, 36, 4739–4763. [Google Scholar] [CrossRef] [Scilit]
- Xie, J.; Liu, L.; Wang, Y.; Xu, Y.-P.; Chen, H. Changes in Actual Evapotranspiration and Its Dominant Drivers across the Three-River Source Region of China during 1982–2014. Hydrol. Res. 2022, 53, 297–313. [Google Scholar] [CrossRef] [Scilit]
- Yang, Y.; Roderick, M.L.; Zhang, S.; McVicar, T.R.; Donohue, R.J. Hydrologic Implications of Vegetation Response to Elevated CO2 in Climate Projections. Nat. Clim. Change 2019, 9, 44–48. [Google Scholar] [CrossRef] [Scilit]
- Dai, X.; Wang, L.; Cao, Q.; Niu, Z.; Luo, Z.; Luo, Y. Assessing the Hydrological and Social Effects of Three Gorges Reservoir Using a Modified SWAT Model. J. Earth Sci. 2025, 36, 1793–1807. [Google Scholar] [CrossRef] [Scilit]
- Liu, Z.; Rong, L.; Wei, W. Impacts of Land Use/Cover Change on Water Balance by Using the SWAT Model in a Typical Loess Hilly Watershed of China. Geogr. Sustain. 2023, 4, 19–28. [Google Scholar] [CrossRef] [Scilit]
- Pathan, S.A.; Sil, B.S. Integrated SWAT-MLP Modeling for Discharge and Sediment Concentration Assessment in the Barak River Basin, India. J. Irrig. Drain. Eng. 2026, 152, 04026001. [Google Scholar] [CrossRef] [Scilit]
- Wang, Y.; Li, Z.; Li, Z.; Zhang, B.; Li, G.; Si, L. Runoff Simulation and Analysis of Water Source in the High-Altitude and Cold Region of the Shaliu River Basin. J. Hydrol. Reg. Stud. 2025, 59, 102294. [Google Scholar] [CrossRef] [Scilit]
- Beroho, M.; Aboumaria, K.; El Hamdouni, Y.; Ouallali, A.; Jaufer, L.; Kader, S.; Hughes, P.D.; Spalevic, V.; Kuriqi, A.; Mrabet, R.; et al. A Novel SWAT-Based Framework to Integrate Climate and LULC Scenarios for Predicting Hydrology and Sediment Dynamics in the Watersheds of Mediterranean Ecosystems. J. Environ. Manag. 2025, 388, 125446. [Google Scholar] [CrossRef] [Scilit]
- Allen, R.; Pereira, L.; Raes, D.; Smith, M.; Allen, R.G.; Pereira, L.S.; Martin, S. Crop Evapotranspiration: Guidelines for Computing Crop Water Requirements; FAO Irrigation and Drainage Paper 56; FAO: Rome, Italy, 1998; Volume 56. [Google Scholar]
- Corbari, C.; Ravazzani, G.; Galvagno, M.; Cremonese, E.; Mancini, M. Assessing Crop Coefficients for Natural Vegetated Areas Using Satellite Data and Eddy Covariance Stations. Sensors 2017, 17, 2664. [Google Scholar] [CrossRef] [Scilit]
- Liang, X.; Wang, D.; Ye, Q.; Zhang, J.; Liu, M.; Liu, H.; Yu, K.; Wang, Y.; Hou, E.; Zhong, B.; et al. Stomatal Responses of Terrestrial Plants to Global Change. Nat. Commun. 2023, 14, 2188. [Google Scholar] [CrossRef] [Scilit] [PubMed]
- Wang, H.; Zhu, X.; Zakari, S.; Chen, C.; Liu, W.; Jiang, X.-J. Assessing the Effects of Plant Roots on Soil Water Infiltration Using Dyes and Hydrus-1D. Forests 2022, 13, 1095. [Google Scholar] [CrossRef] [Scilit]
- Wen, Y.; Li, M.; Gao, P.; Zhou, J.; Ai, X.; Zhang, Y.; Mu, X. Soil Physicochemical Properties and Roots Promoted Preferential Flow Development after Vegetation Restoration. J. Hydrol. 2025, 659, 133349. [Google Scholar] [CrossRef] [Scilit]
- Jafari, T.; Kiem, A.S.; Javadi, S.; Nakamura, T.; Nishida, K. Fully Integrated Numerical Simulation of Surface Water-Groundwater Interactions Using SWAT-MODFLOW with an Improved Calibration Tool. J. Hydrol. Reg. Stud. 2021, 35, 100822. [Google Scholar] [CrossRef] [Scilit]
- Demeke, G.G.; Huang, J.-C.; Chen, Y.-Y. Runoff Generation Signaled by Deviations from the Budyko Framework. Water Resour. Manag. 2025, 39, 2133–2148. [Google Scholar] [CrossRef] [Scilit]
- Hernández-Marín, M.A.; Ortiz-Gómez, R.; Zavala, M.; Rodríguez-Rodríguez, J.A.; Alvarado Medellin, P.; Ortiz-Robles, F.A. Hydrological Simulation Using the SWAT Model in a Semi-Arid Region in the Southern Part of Zacatecas, Mexico. Environ. Earth Sci. 2024, 83, 540. [Google Scholar] [CrossRef] [Scilit]
- Laaboudi, M.; Mezrhab, A.; Alioua, Z.E.; Achebour, A.; Snaibi, W.; Elyagoubi, S. Correction: Assessment of Water Balance Based on SWAT Hydrological Model: A Case Study of Oued Cherraa Basin (Northeastern Morocco). Environ. Geochem. Health 2025, 47, 233. [Google Scholar] [CrossRef] [Scilit]
- Wang, J.; Ji, G.; Hu, Y. Effect of Vegetation Growth, Agricultural Irrigation and Climatic Variability on Streamflow in Wujiang, China. Forests 2024, 15, 1928. [Google Scholar] [CrossRef] [Scilit]
- Gan, B.; Liu, M.; Cui, H.; Chen, X.; Chen, Y.; Gao, L.; Deng, H. Spatiotemporal Patterns and Propagation of Meteorological and Hydrological Drought in a Humid Basin of Southeast China. Sci. Rep. 2025, 15, 31720. [Google Scholar] [CrossRef] [Scilit] [PubMed]
- Zhang, D.; Wang, W.; Yu, S.; Liang, S.; Hu, Q. Assessment of the Contributions of Climate Change and Human Activities to Runoff Variation: Case Study in Four Subregions of the Jinsha River Basin, China. J. Hydrol. Eng. 2021, 26, 05021024. [Google Scholar] [CrossRef] [Scilit]
- Huang, Y.; Yang, Y. Upstream–Downstream Hydrological Responses to Climate and Cryospheric Changes in Three River Basins Originating from the Southeastern Tibetan Plateau. J. Hydrol. 2026, 664, 134337. [Google Scholar] [CrossRef] [Scilit]
- Zhang, D.; Hong, H.; Zhang, Q.; Li, X. Attribution of the Changes in Annual Streamflow in the Yangtze River Basin over the Past 146 Years. Theor. Appl. Climatol. 2015, 119, 323–332. [Google Scholar] [CrossRef] [Scilit]
- Zeng, F.; He, Q.; Li, Y.; Shi, W.; Yang, R.; Ma, M.; Huang, G.; Xiao, J.; Yang, X.; Di, D. Reduced Runoff in the Upper Yangtze River Due to Comparable Contribution of Anthropogenic and Climate Changes. Earth’s Future 2024, 12, e2023EF004028. [Google Scholar] [CrossRef] [Scilit]
- Li, X.; Xu, X.; Sonnenborg, T.O.; Andreasen, M.; He, C. Effect of Ecological Restoration on Evapotranspiration and Water Yield in the Agro-Pastoral Ecotone in Northern China during 2000–2018. J. Hydrol. 2024, 638, 131531. [Google Scholar] [CrossRef] [Scilit]
- Ma, P.; Chen, L.; Huang, Q.; Cheng, Y.; Li, Z.; Jin, Z.; Li, C.; Han, N.; Jiao, Q.; Li, Z.; et al. The Impact of the Densest and Highest-Capacity Reservoirs on the Ecological Environment in the Upper Yellow River Basin of China: From 2000 to 2020. Remote Sens. 2025, 17, 1535. [Google Scholar] [CrossRef] [Scilit]
- Wang, K.; Huang, L.; He, G.; Fang, H.; Chen, M.; Wang, D.; Wu, X. Spatial-Temporal Evolution of Sediment Transport in the Upper Yangtze River Basin Considering the Cumulative Impacts of Mega Reservoirs. Catena 2023, 232, 107370. [Google Scholar] [CrossRef] [Scilit]
- Gan, G.; Liu, Y.; Sun, G. Understanding Interactions among Climate, Water, and Vegetation with the Budyko Framework. Earth Sci. Rev. 2021, 212, 103451. [Google Scholar] [CrossRef] [Scilit]
- Gao, H.; Li, Q.; Xiong, G.; Li, B.; Zhang, J.; Meng, Q. Quantitative Assessment of Hydrological Response to Vegetation Change in the Upper Reaches of Luanhe River with the Modified Budyko Framework. Front. Ecol. Evol. 2023, 11, 1178231. [Google Scholar] [CrossRef] [Scilit]
- Bi, Z.; Sun, S.; Liu, Y.; Sun, G.; Mu, M.; Li, X.; Li, J.; Liu, Y.; Zhou, Y.; Zhou, B.; et al. Global Changes in Potential Evapotranspiration (1992–2020) and Associated Drivers: Shuttleworth-Wallace Model-Based Analysis. J. Hydrol. 2025, 660, 133435. [Google Scholar] [CrossRef] [Scilit]
- Bai, H.; Zhong, Y.; Ma, N.; Kong, D.; Mao, Y.; Feng, W.; Wu, Y.; Zhong, M. Changes and Drivers of Long-Term Land Evapotranspiration in the Yangtze River Basin: A Water Balance Perspective. J. Hydrol. 2025, 653, 132763. [Google Scholar] [CrossRef] [Scilit]
- Deng, A.; Chen, J.; Hu, H.; Zhang, G. Analysis of reservoir siltation in China. Shuili Xuebao 2022, 53, 325–332. [Google Scholar] [CrossRef]

Disclaimer/Publisher’s Note: The statements, opinions and data contained in all publications are solely those of the individual author(s) and contributor(s) and not of MDPI and/or the editor(s). MDPI and/or the editor(s) disclaim responsibility for any injury to people or property resulting from any ideas, methods, instructions or products referred to in the content. |
© 2026 by the authors. Licensee MDPI, Basel, Switzerland. This article is an open access article distributed under the terms and conditions of the Creative Commons Attribution (CC BY) license.